How Has the Gender Earnings Gap in Ireland Changed in Thirty Years?
Abstract
1. Introduction
2. Data and Methods
2.1. Data
2.2. Estimating the Gender Wage Gap
3. Results
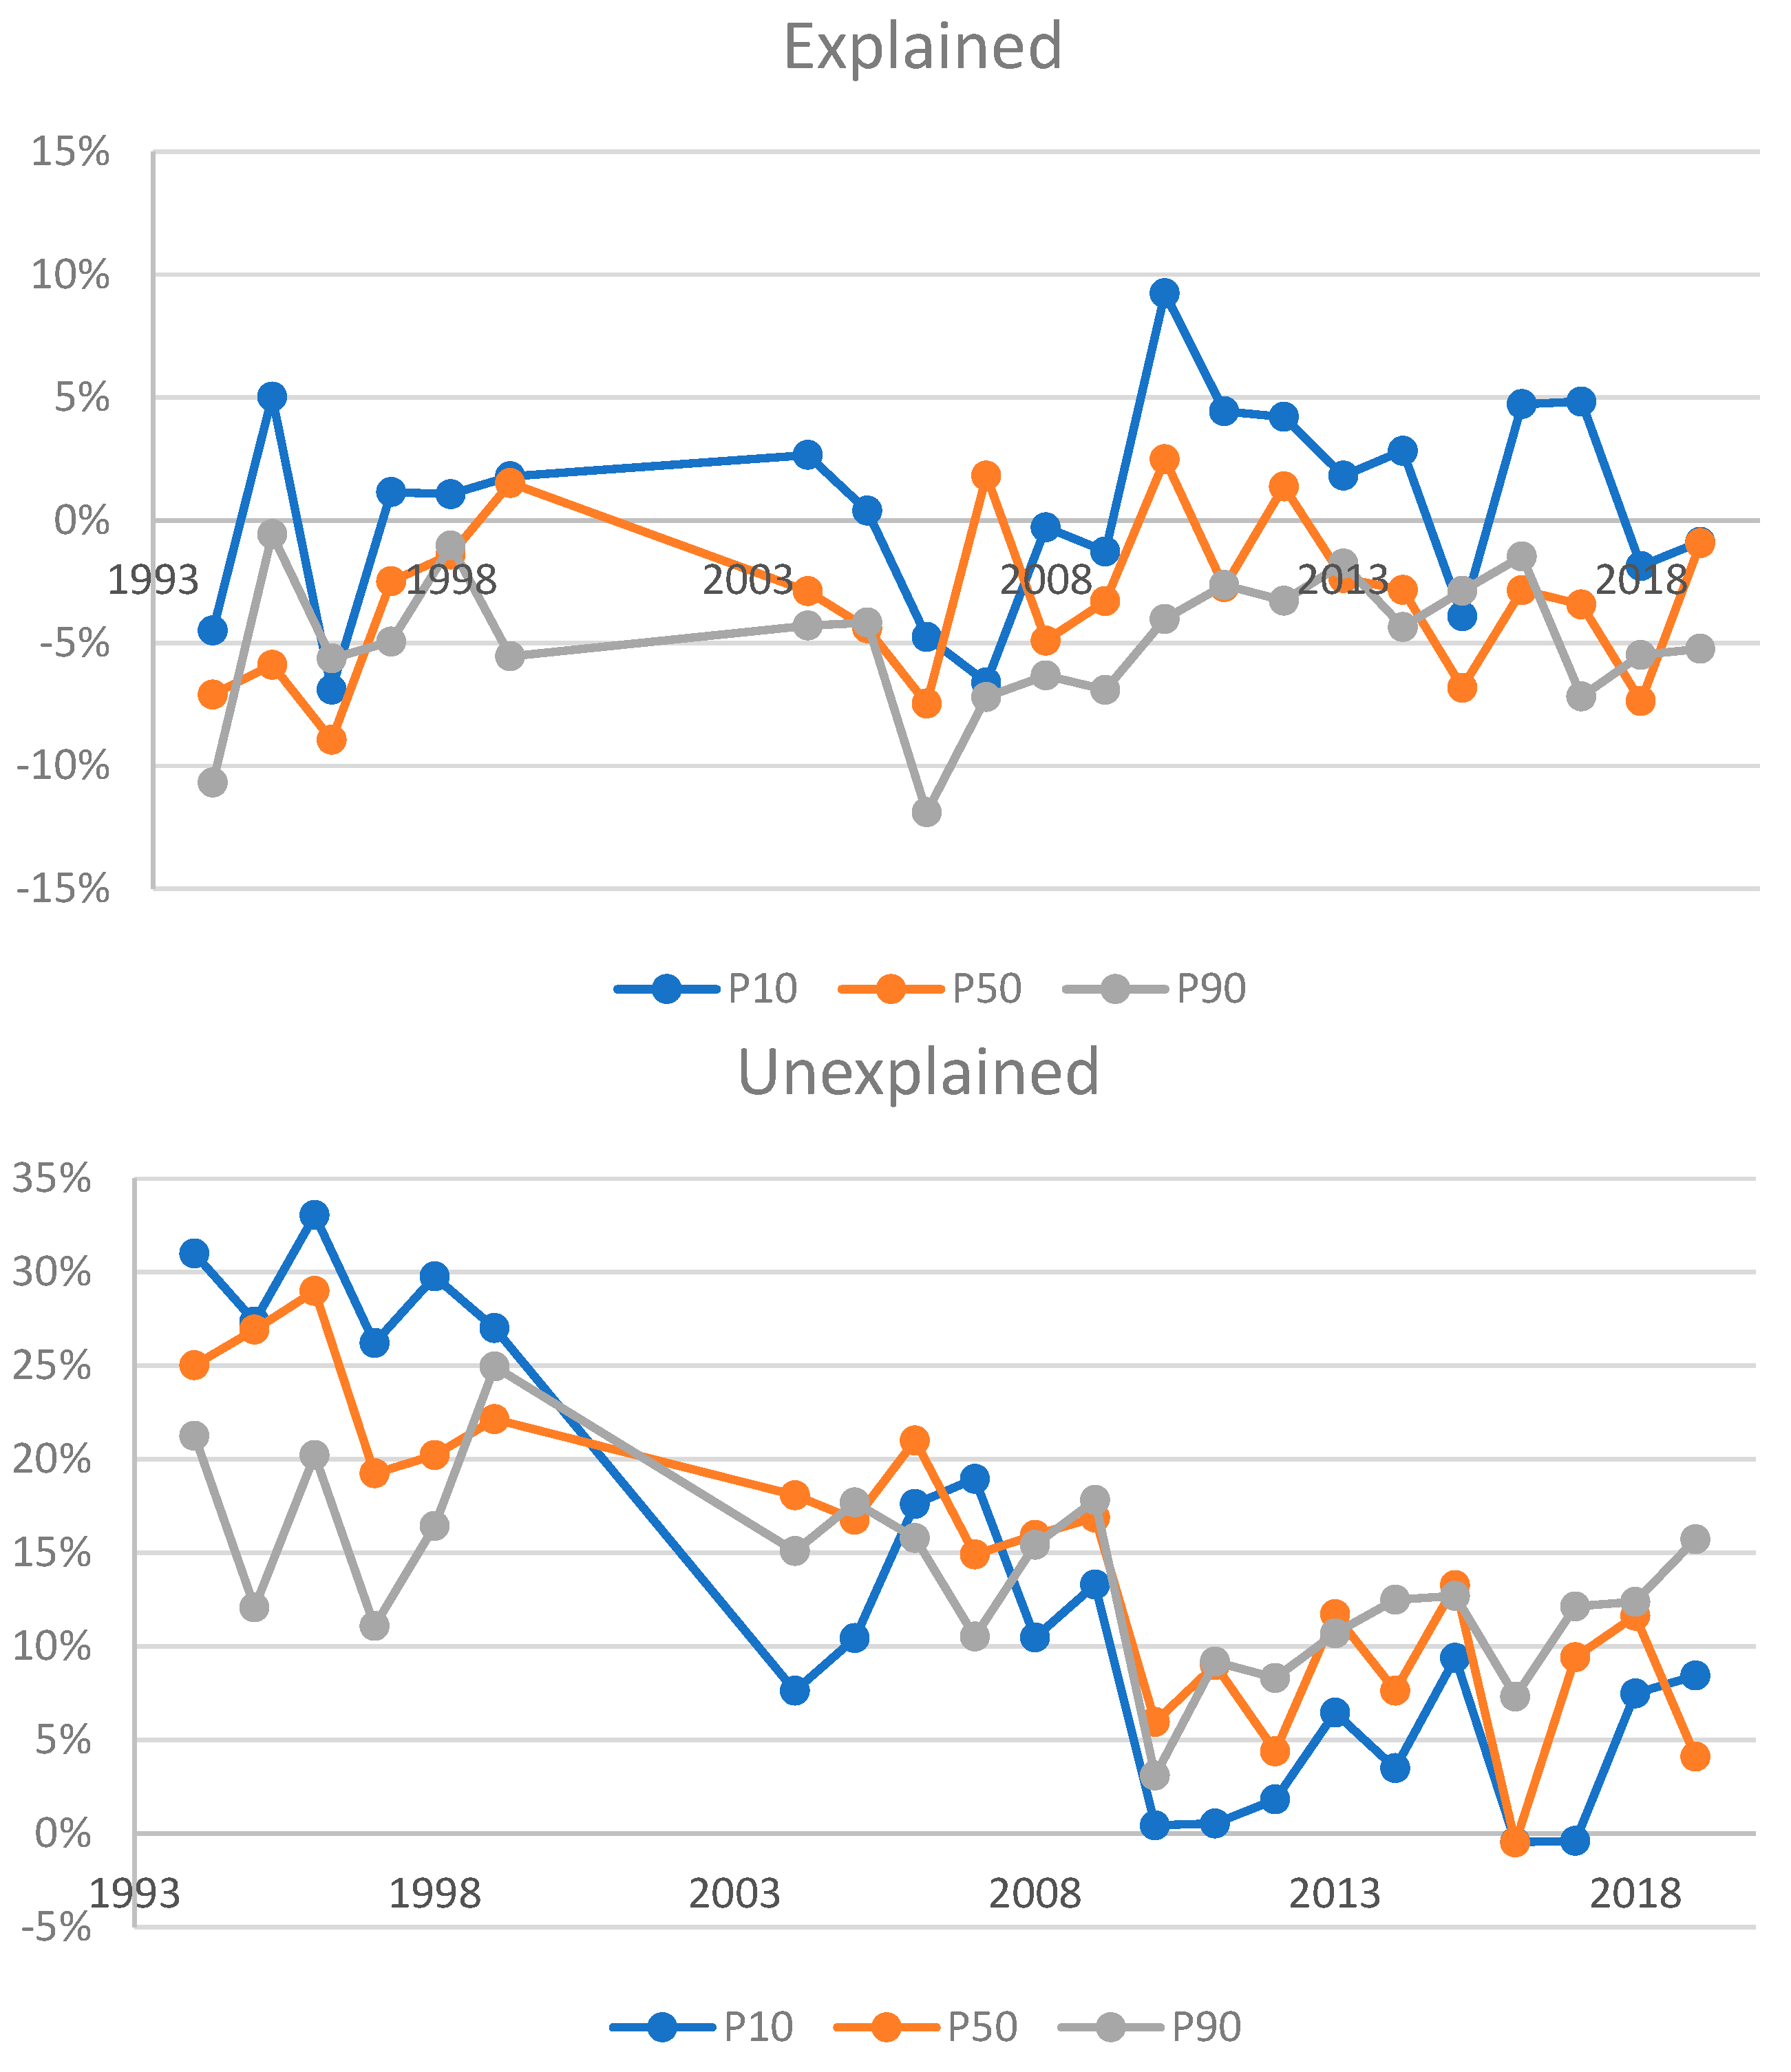
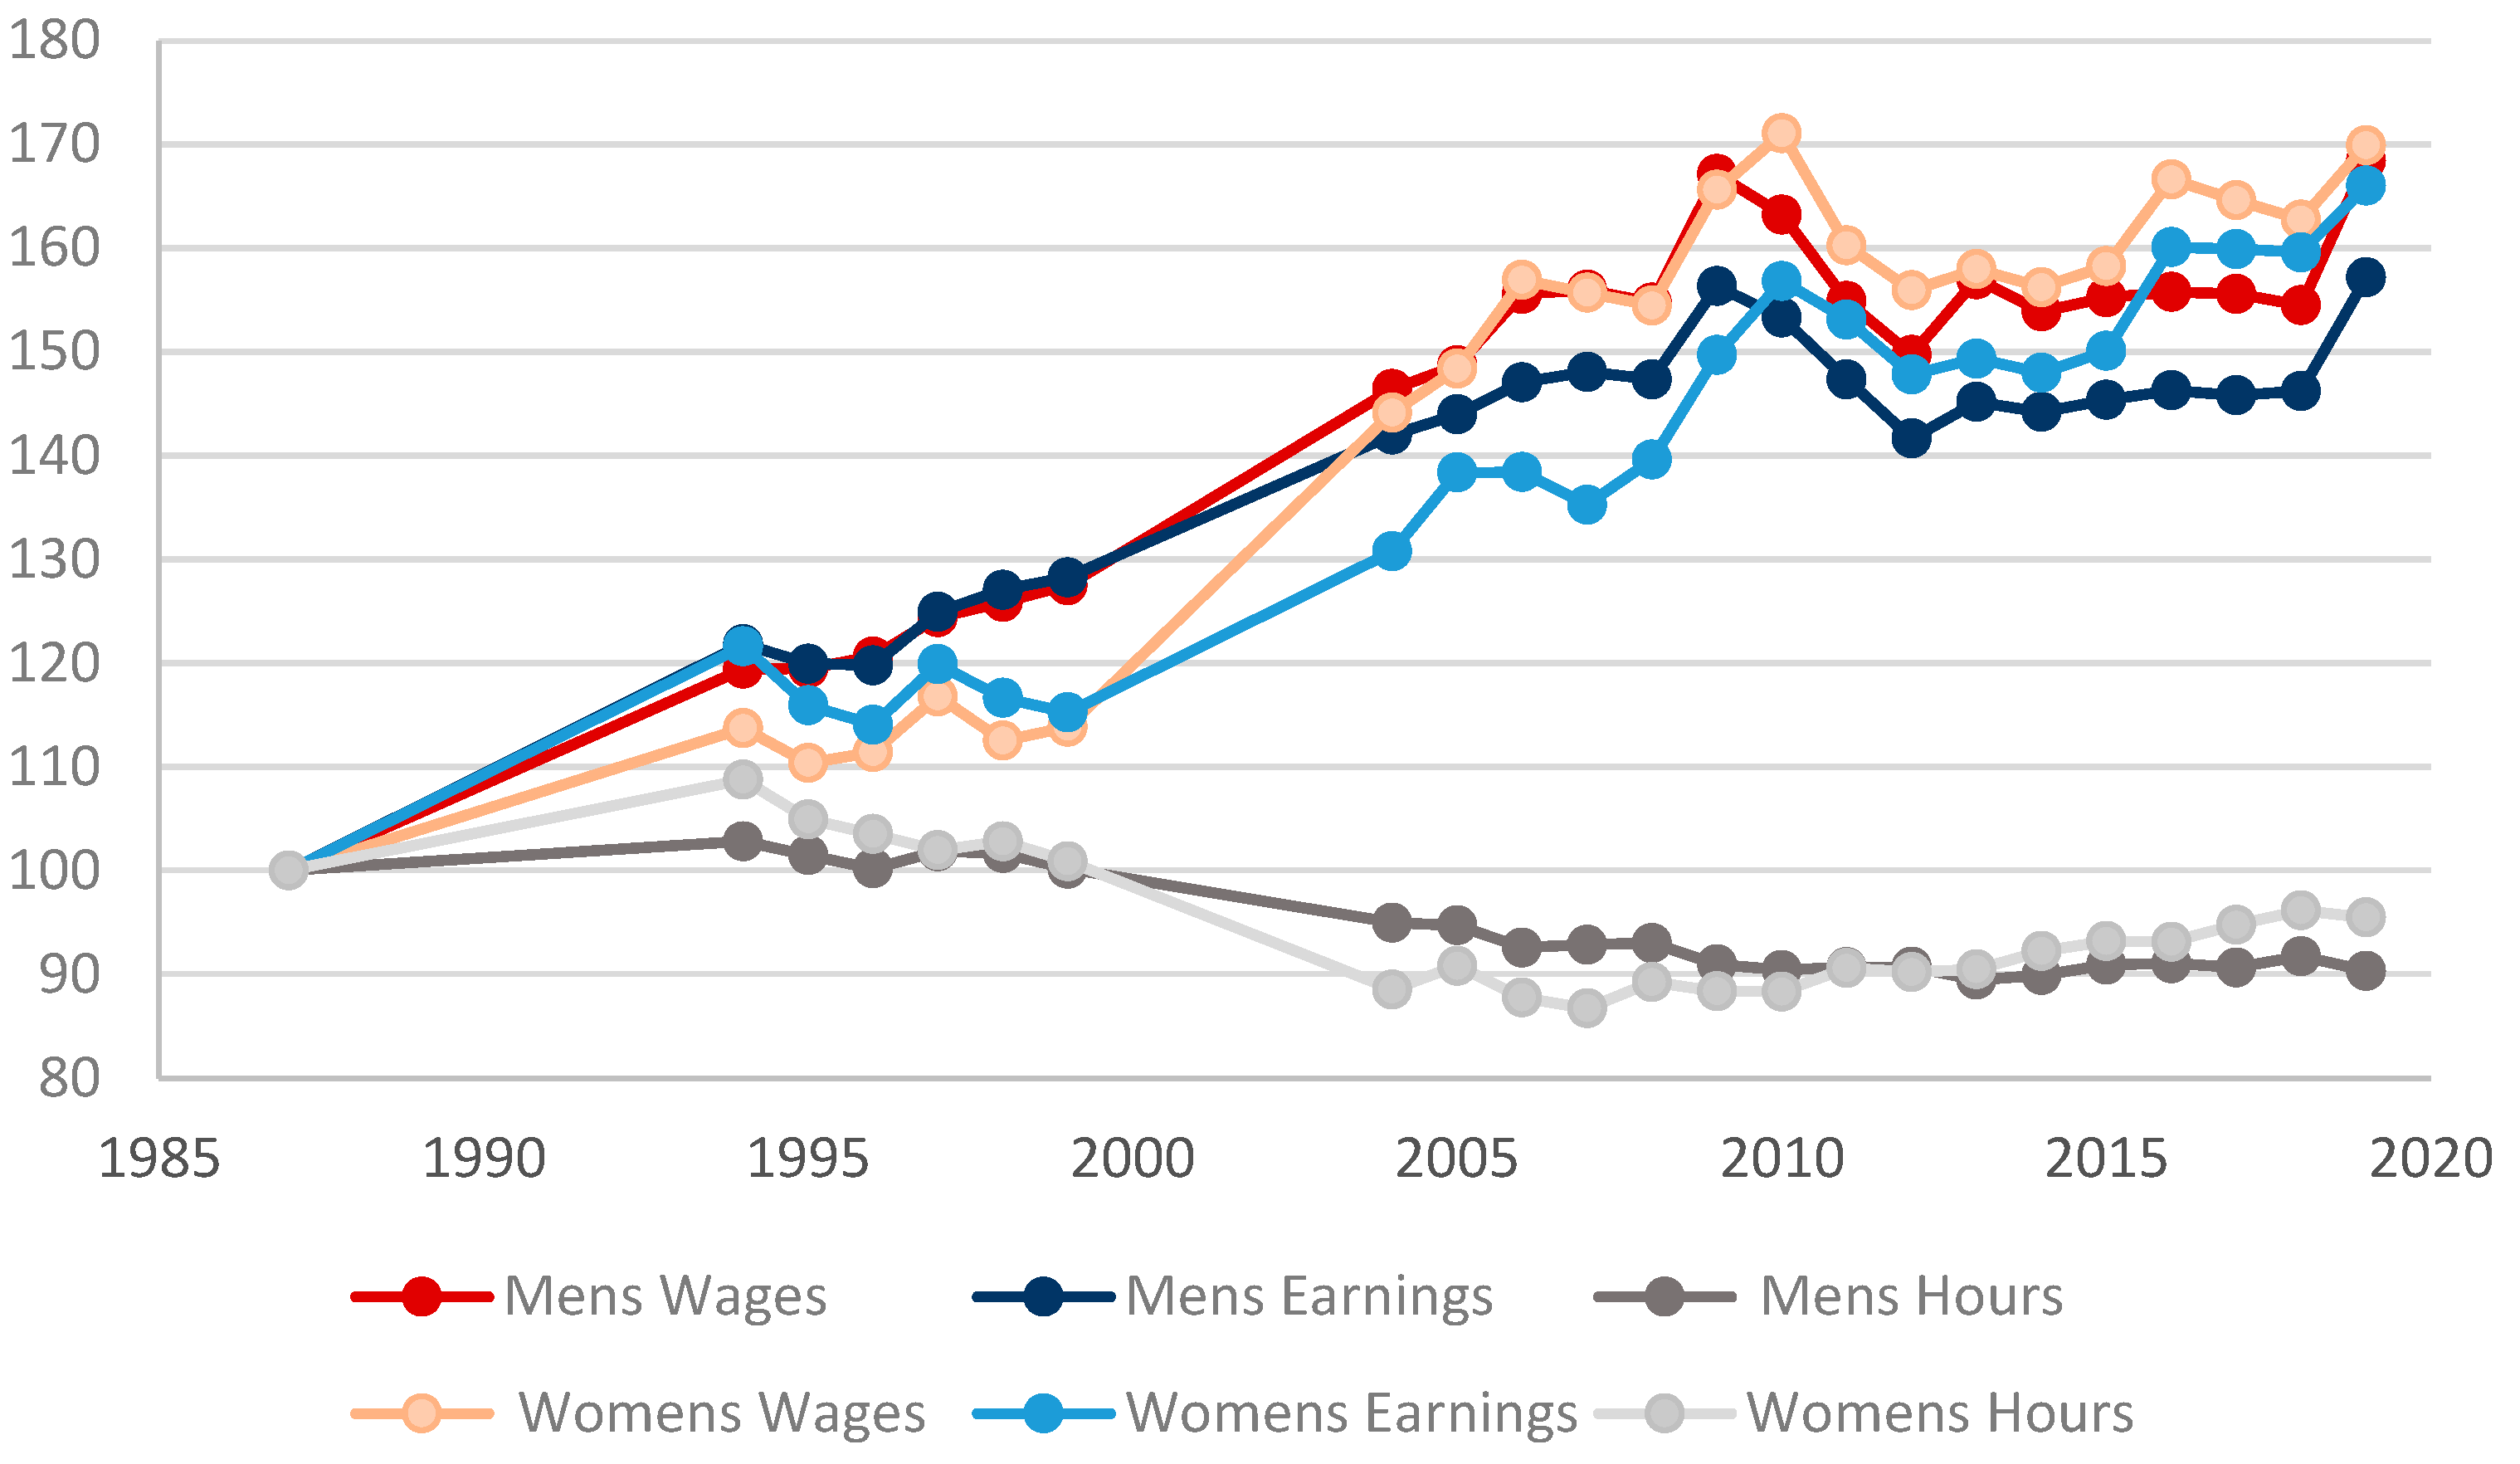
3.1. Drivers of the Gender Gap in Earnings
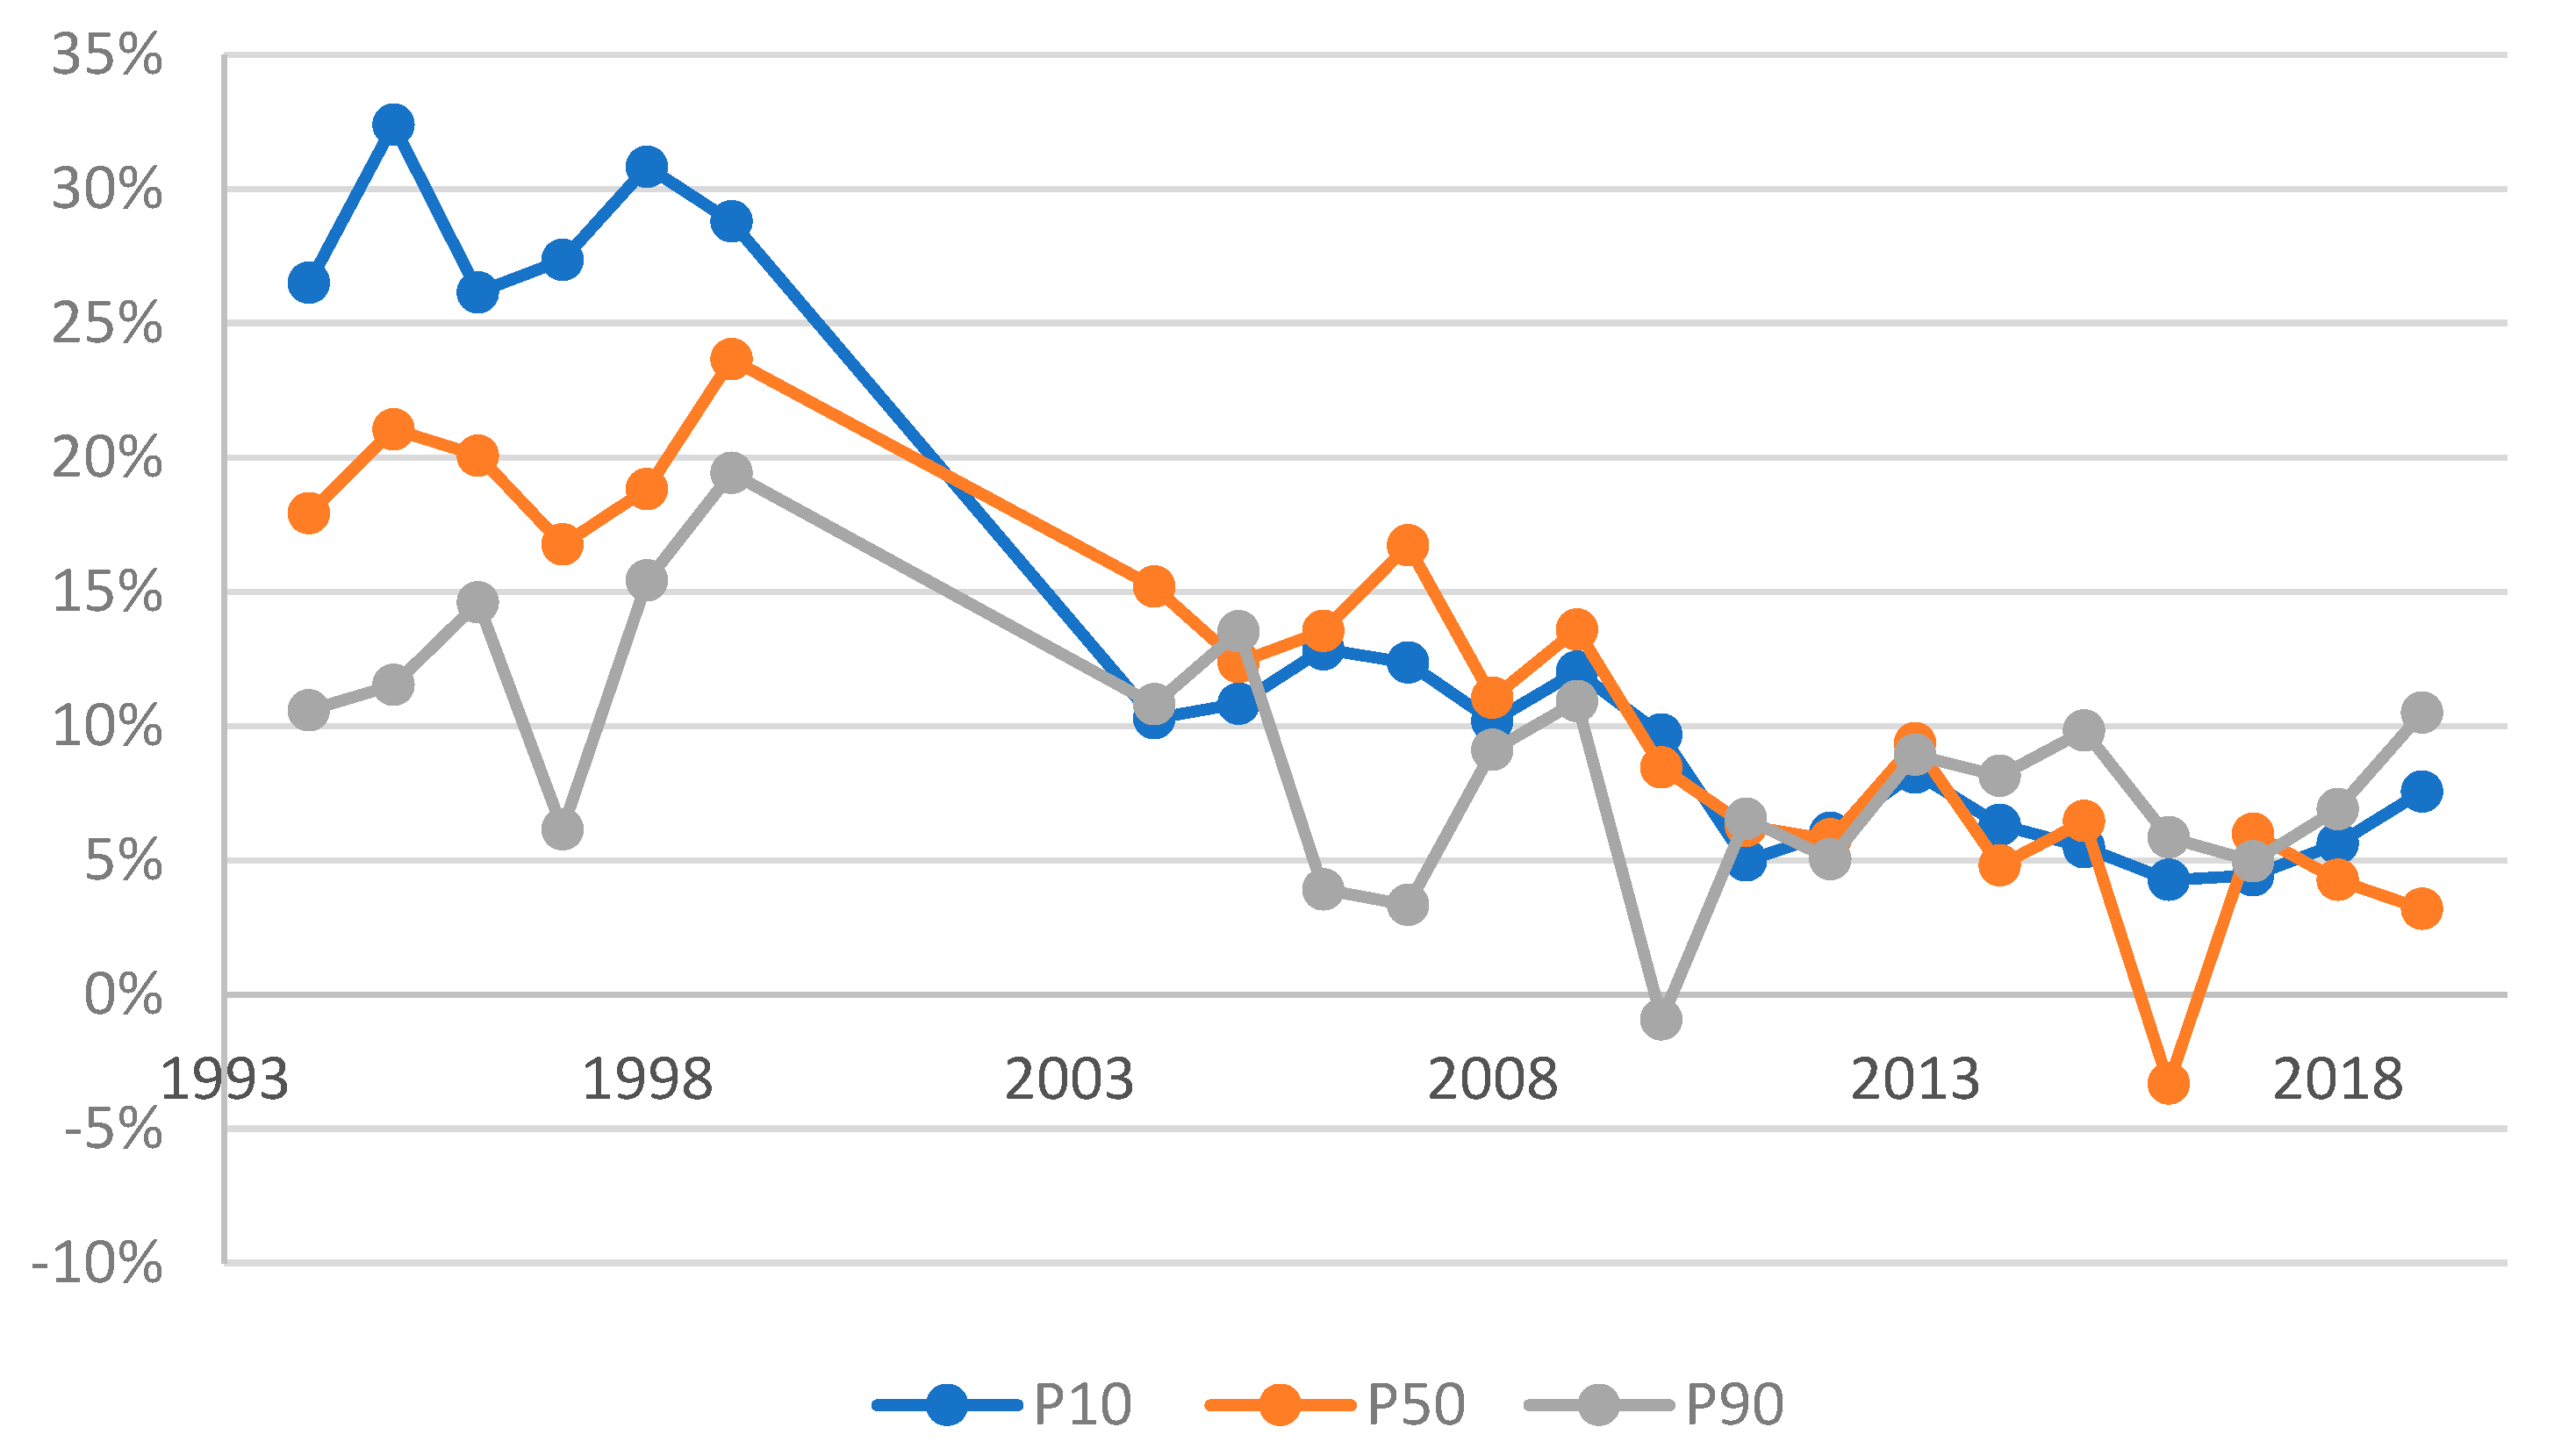
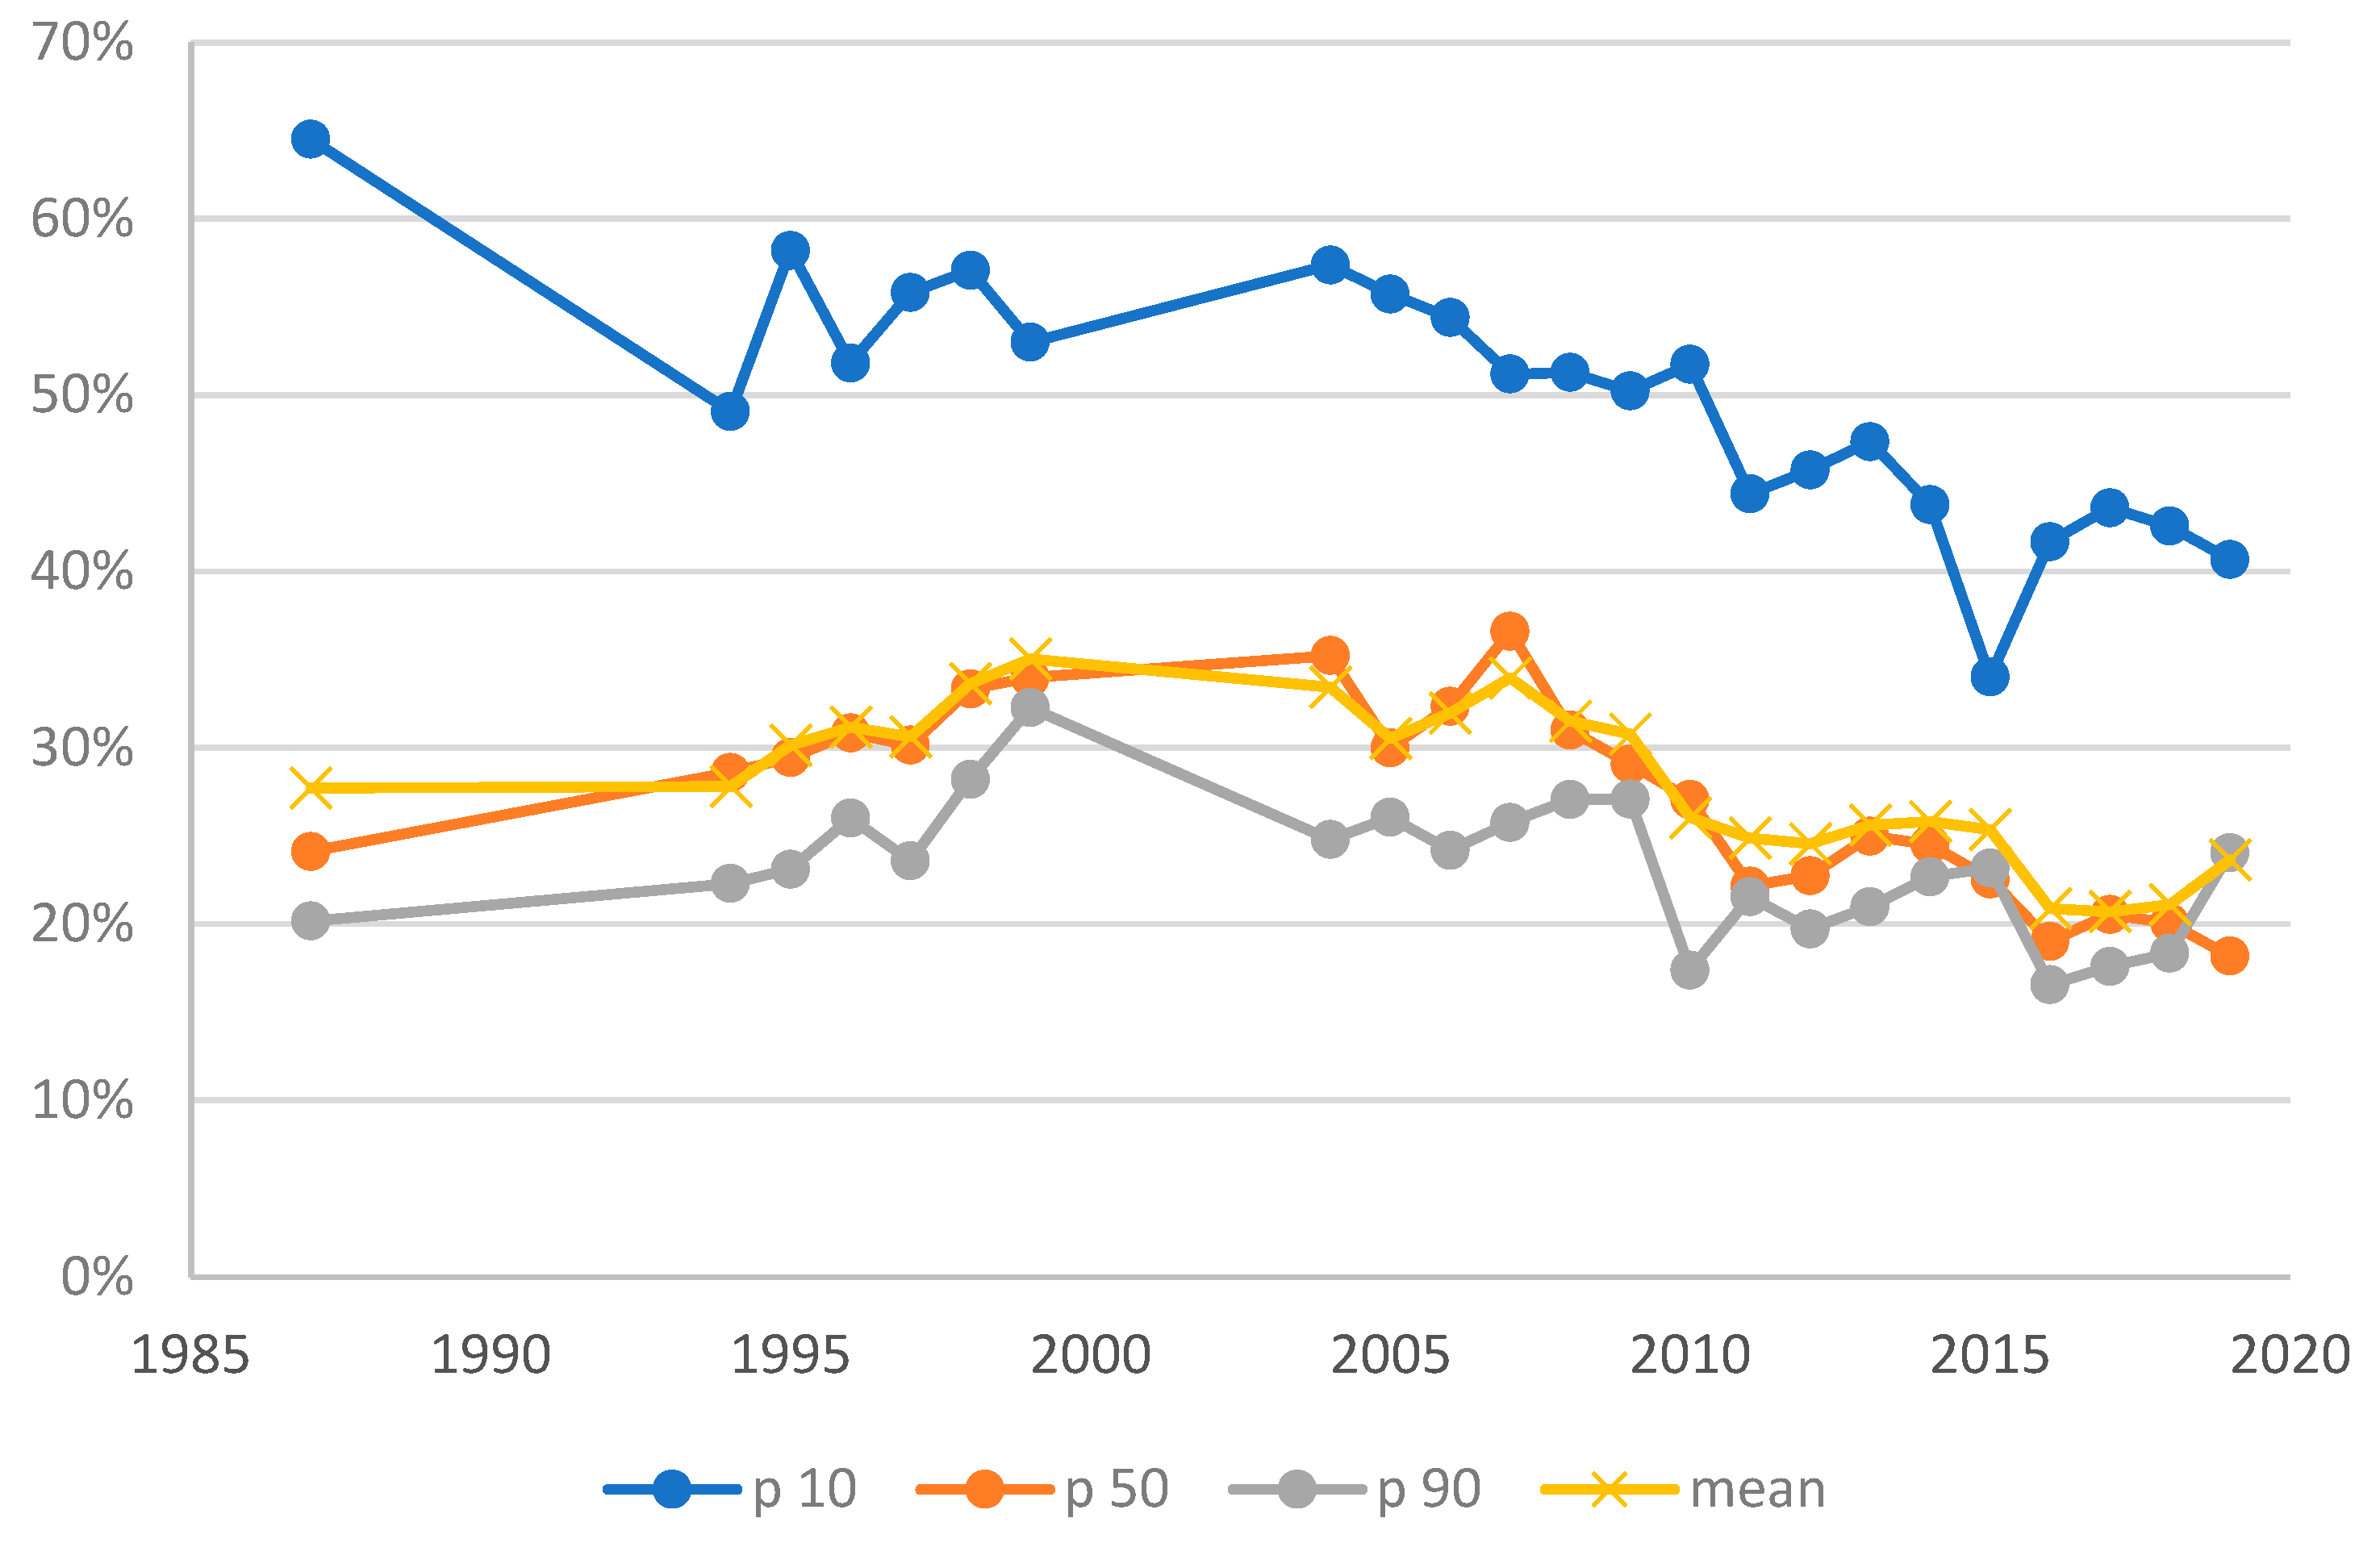
3.2. Evolution of the Gender Wage Gap
4. Discussion
Author Contributions
Funding
Institutional Review Board Statement
Informed Consent Statement
Data Availability Statement
Conflicts of Interest
Appendix A. Descriptive Data for Missing Observations
| Of Which, Missing | ||||
|---|---|---|---|---|
| Year | N in Paid Work of Working Age | Hours | Earnings | Either |
| 1987 | 1911 | 9.4% | 9.4% | 11.5% |
| 1994 | 2348 | 0.1% | 3.2% | 3.2% |
| 1995 | 2152 | 0.0% | 3.9% | 3.9% |
| 1996 | 1949 | 0.1% | 4.0% | 4.0% |
| 1997 | 1911 | 0.0% | 4.0% | 4.0% |
| 1998 | 1835 | 0.0% | 4.7% | 4.7% |
| 1999 | 1613 | 0.0% | 4.0% | 4.0% |
| 2004 | 3224 | 2.0% | 0.6% | 2.6% |
| 2005 | 3429 | 1.0% | 0.4% | 1.3% |
| 2006 | 3159 | 0.9% | 0.5% | 1.3% |
| 2007 | 2939 | 0.6% | 0.4% | 1.0% |
| 2008 | 2580 | 0.3% | 0.6% | 0.9% |
| 2009 | 2587 | 0.3% | 0.3% | 0.6% |
| 2010 | 2315 | 0.7% | 0.3% | 1.1% |
| 2011 | 2299 | 1.2% | 0.9% | 1.8% |
| 2012 | 2623 | 1.4% | 1.5% | 2.5% |
| 2013 | 2837 | 1.1% | 1.7% | 2.4% |
| 2014 | 3189 | 1.1% | 1.6% | 2.4% |
| 2015 | 3150 | 0.9% | 0.6% | 1.4% |
| 2016 | 2971 | 1.4% | 1.1% | 2.1% |
| 2017 | 2904 | 0.6% | 0.9% | 1.2% |
| 2018 | 2738 | 0.6% | 0.7% | 1.1% |
| 2019 | 2630 | 0.6% | 0.4% | 0.9% |
| Missing Hours/Earnings | Not Missing Hours/Earnings | |||||
|---|---|---|---|---|---|---|
| Age | Married | >Primary Education | Age | Married | >Primary Education | |
| 1987 | 38.7 | 71.4% | 26.5% | 36.5 | 75.7% | 44.8% |
| 1994 | 39.3 | 58.5% | 29.5% | 37.5 | 70.1% | 63.0% |
| 1995 | 40.3 | 68.1% | 27.0% | 37.5 | 68.9% | 62.8% |
| 1996 | 41.8 | 66.3% | 31.4% | 37.6 | 68.2% | 63.7% |
| 1997 | 42.4 | 55.4% | 26.8% | 37.8 | 66.9% | 65.8% |
| 1998 | 39.3 | 53.7% | 21.8% | 37.6 | 63.7% | 64.0% |
| 1999 | 43.3 | 66.4% | 32.6% | 37.6 | 62.6% | 64.0% |
| 2004 | 40.8 | 68.0% | 70.7% | 40.1 | 66.7% | 71.1% |
| 2005 | 38.3 | 60.7% | 69.0% | 39.5 | 61.5% | 71.8% |
| 2006 | 41.6 | 54.8% | 67.2% | 39.6 | 61.6% | 76.2% |
| 2007 | 41.1 | 75.2% | 72.5% | 39.3 | 59.7% | 76.1% |
| 2008 | 43.4 | 86.2% | 71.6% | 39.2 | 59.5% | 77.5% |
| 2009 | 46.5 | 95.3% | 94.7% | 39.3 | 61.7% | 80.8% |
| 2010 | 39.0 | 46.7% | 67.3% | 38.8 | 61.4% | 83.3% |
| 2011 | 43.3 | 59.5% | 63.6% | 39.2 | 62.2% | 84.7% |
| 2012 | 40.6 | 60.8% | 69.2% | 39.4 | 62.3% | 86.3% |
| 2013 | 40.2 | 51.6% | 88.2% | 39.7 | 62.3% | 87.8% |
| 2014 | 39.5 | 55.1% | 84.9% | 39.5 | 63.0% | 86.9% |
| 2015 | 41.8 | 73.5% | 94.0% | 39.8 | 64.5% | 89.6% |
| 2016 | 40.5 | 48.8% | 79.3% | 40.1 | 63.4% | 90.7% |
| 2017 | 41.4 | 74.5% | 70.4% | 40.1 | 62.7% | 91.1% |
| 2018 | 41.3 | 48.7% | 92.0% | 40.5 | 63.3% | 92.0% |
| 2019 | 39.8 | 67.3% | 92.7% | 40.1 | 60.8% | 91.6% |
Appendix B. Decomposition Results at Selected Percentiles
| 1987 | 1995 | 2004 | 2011 | 2019 | |
|---|---|---|---|---|---|
| Gap | 29.6% | 32.8% | 10.8% | 5.0% | 7.7% |
| Explained | 0.1% | −4.1% | 2.6% | 4.5% | −2.5% |
| Unexplained | 29.6% | 36.9% | 8.2% | 0.5% | 10.2% |
| Explained | |||||
| Age | 0.2% | −0.1% | −0.2% | −0.7% | 0.2% |
| Marital Status | 0.1% | −0.5% | 0.1% | −0.3% | 0.1% |
| Working Part-Time | 4.8% | 4.2% | 5.1% | 6.5% | 0.9% |
| Education | −5.0% | −7.7% | −2.4% | −1.0% | −3.7% |
| Total | 0.1% | −4.1% | 2.6% | 4.5% | −2.4% |
| Unexplained | |||||
| Age | 37.8% | 150.4% | −67.8% | −63.2% | 48.8% |
| Marital Status | 17.6% | 23.9% | 3.6% | 8.9% | 9.5% |
| Working Part-Time | 0.1% | −1.4% | −2.1% | −0.5% | −4.4% |
| Education | 2.1% | 2.0% | −0.1% | −0.1% | −8.8% |
| Constant | −28.0% | −138.0% | 74.7% | 55.3% | −35.0% |
| Total | 29.5% | 36.9% | 8.2% | 0.5% | 10.2% |
| N (women) | 446 | 816 | 1506 | 1152 | 1319 |
| N (men) | 882 | 1211 | 1549 | 1016 | 1236 |
| 1987 | 1995 | 2004 | 2011 | 2019 | |
|---|---|---|---|---|---|
| Gap | 13.7% | 20.0% | 15.4% | 6.3% | 3.2% |
| Explained | −2.8% | −3.4% | 0.4% | 5.7% | −0.5% |
| Unexplained | 16.5% | 23.5% | 15.0% | 0.6% | 3.7% |
| Explained | |||||
| Age | 2.5% | 1.7% | −0.3% | −1.0% | 0.9% |
| Marital Status | 0.1% | −0.3% | 0.3% | 0.4% | 0.4% |
| Working Part-Time | 4.7% | 2.8% | 3.0% | 8.0% | 3.2% |
| Education | −10.1% | −7.6% | −2.6% | −1.7% | −5.0% |
| Total | −2.8% | −3.4% | 0.4% | 5.7% | −0.5% |
| Unexplained | |||||
| Age | −49.6% | −110.0% | 10.1% | −41.8% | 62.3% |
| Marital Status | 16.9% | 17.5% | 4.9% | 5.2% | −1.8% |
| Working Part-Time | 0.3% | 0.4% | −0.3% | 0.6% | −0.8% |
| Education | 3.4% | 0.2% | −0.1% | −2.1% | −0.5% |
| Constant | 45.4% | 115.3% | 0.5% | 38.7% | −55.5% |
| Total | 16.5% | 23.5% | 15.0% | 0.6% | 3.7% |
| N (women) | 535 | 816 | 1506 | 1152 | 1319 |
| N (men) | 1213 | 1211 | 1549 | 1016 | 1236 |
| 1987 | 1995 | 2004 | 2011 | 2019 | |
|---|---|---|---|---|---|
| Gap | −8.4% | 10.5% | 10.6% | 6.5% | 10.0% |
| Explained | −23.2% | −7.4% | −2.9% | −1.3% | −4.5% |
| Unexplained | 14.7% | 17.9% | 13.6% | 7.8% | 14.5% |
| Explained | |||||
| Age | 0.8% | 3.0% | −0.5% | −0.8% | 0.8% |
| Marital Status | 2.1% | −0.2% | 0.2% | 0.0% | 0.3% |
| Working Part-Time | −13.2% | −5.6% | −0.5% | 0.2% | −2.0% |
| Education | −12.8% | −4.6% | −2.2% | −0.7% | −3.5% |
| Total | −23.2% | −7.4% | −2.9% | −1.3% | −4.5% |
| Unexplained | |||||
| Age | 81.4% | −88.1% | −18.2% | −37.4% | −239.4% |
| Marital Status | −21.0% | 9.1% | −1.1% | 2.7% | 5.3% |
| Working Part-Time | 0.3% | 1.2% | 0.9% | 0.0% | −0.4% |
| Education | 2.8% | 1.2% | 0.1% | 0.3% | 1.7% |
| Constant | −48.7% | 94.4% | 31.9% | 42.2% | 247.4% |
| Total | 14.7% | 17.9% | 13.6% | 7.9% | 14.5% |
| N (women) | 535 | 816 | 1506 | 1152 | 1319 |
| N (men) | 1213 | 1211 | 1546 | 1016 | 1236 |
| 1987 | 1995 | 2004 | 2011 | 2019 | |
|---|---|---|---|---|---|
| Overall | |||||
| Women | 10.667 | 11.879 | 15.373 | 17.531 | 19.066 |
| (33.35) *** | (40.61) *** | (62.31) *** | (46.84) *** | (53.13) *** | |
| Men | 12.361 | 14.852 | 18.162 | 18.706 | 19.696 |
| (63.93) *** | (55.96) *** | (66.83) *** | (46.68) *** | (51.26) *** | |
| Difference | −1.694 | −2.972 | −2.789 | −1.176 | −0.629 |
| (−4.53) *** | (−7.53) *** | (−7.60) *** | (−2.14) * | (−1.20) | |
| Explained | 0.34 | 0.51 | −0.065 | −1.071 | 0.101 |
| (1.08) | (1.83) | (−0.26) | (−3.07) ** | (0.36) | |
| Unexplained | −2.034 | −3.483 | −2.724 | −0.105 | −0.731 |
| (−4.95) *** | (−8.70) *** | (−7.43) *** | (−0.21) | (−1.45) | |
| Explained | |||||
| Age | −1.941 | −2.686 | 0.184 | 1.257 | −0.478 |
| (−2.25) * | (−3.34) *** | (0.57) | (1.56) | (−1.32) | |
| Age-squared | 1.627 | 2.437 | −0.125 | −1.074 | 0.307 |
| (2.04) * | (3.18) ** | (−0.45) | (−1.51) | (0.98) | |
| Married | −0.01 | 0.046 | −0.056 | −0.072 | −0.08 |
| (−0.11) | (0.74) | (−1.76) | (−1.54) | (−1.71) | |
| Working Part-Time | −0.58 | −0.421 | −0.544 | −1.5 | −0.64 |
| (−3.56) *** | (−3.64) *** | (−3.41) *** | (−7.57) *** | (−4.62) *** | |
| Lower Secondary | 0.843 | 1.063 | 0.449 | 0.395 | 0.301 |
| (6.20) *** | (7.77) *** | (5.03) *** | (4.15) *** | (3.70) *** | |
| Upper Secondary | −0.051 | 0.007 | −0.087 | −0.136 | 0.06 |
| (−1.18) | (0.1) | (−2.92) ** | (−2.64) ** | (1.47) | |
| Third Level | 0.452 | 0.064 | 0.114 | 0.059 | 0.632 |
| (3.97) *** | (0.61) | (1.02) | (0.4) | (4.33) *** | |
| Unexplained | |||||
| Age | 14.528 | 36.379 | 1.17 | 21.014 | −21.263 |
| (1.02) | (2.25) * | (0.07) | (0.91) | (−0.90) | |
| Age-Squared | −8.398 | −20.036 | −2.996 | −13.191 | 8.995 |
| (−1.16) | (−2.43) * | (−0.37) | (−1.13) | (0.73) | |
| Married | −2.083 | −2.605 | −0.892 | −0.971 | 0.35 |
| (−3.41) *** | (−4.39) *** | (−1.62) | (−1.39) | (0.53) | |
| Working Part-Time | −0.04 | −0.065 | 0.063 | −0.103 | 0.159 |
| (−1.31) | (−1.21) | (1.14) | (−0.65) | (1.18) | |
| Lower Secondary | −0.458 | −0.066 | −0.028 | 0.024 | −0.128 |
| (−1.63) | (−0.28) | (−0.17) | (0.13) | (−0.91) | |
| Upper Secondary | −0.287 | −0.132 | −0.212 | −0.313 | 0.342 |
| (−2.49) * | (−0.98) | (−1.47) | (−1.72) | (1.5) | |
| Third Level | 0.321 | 0.17 | 0.266 | 0.683 | −0.119 |
| (3.65) *** | (1.2) | (1.64) | (1.72) | (−0.23) | |
| Constant | −5.617 | −17.128 | −0.096 | −7.247 | 10.934 |
| (−0.80) | (−2.18) * | (−0.01) | (−0.63) | (0.97) | |
| N (women) | 446 | 816 | 1506 | 1152 | 1319 |
| N (men) | 882 | 1211 | 1549 | 1016 | 1236 |
Appendix C. Decomposition Results at the 10th, 50th, and 90th Percentiles, Including Occupation and Citizenship
| 1995 | 2004 | 2011 | 2019 | |
|---|---|---|---|---|
| Gap | 32.4% | 10.3% | 5.0% | 7.6% |
| Explained | 5.0% | 2.7% | 4.4% | −0.9% |
| Unexplained | 27.4% | 7.6% | 0.5% | 8.4% |
| Explained | ||||
| Age | −0.6% | −0.1% | −0.5% | 0.0% |
| Marital Status | −0.3% | 0.2% | −0.3% | 0.1% |
| Working Part-Time | 2.8% | 3.6% | 5.0% | 0.2% |
| Education | −3.4% | −1.3% | −0.3% | −2.9% |
| Irish Citizen | 0.0% | 0.0% | −0.4% | −0.5% |
| Occupation | 6.5% | 0.3% | 1.0% | 2.1% |
| Total | 5.0% | 2.7% | 4.4% | −0.9% |
| Unexplained | ||||
| Age | 185.4% | −66.1% | −87.1% | 59.5% |
| Marital Status | 27.4% | 2.7% | 10.0% | 10.0% |
| Working Part-Time | −1.8% | −2.1% | −0.4% | −4.7% |
| Education | −0.6% | −0.1% | −1.2% | −9.3% |
| Irish Citizen | 17.6% | 8.7% | 3.6% | −1.1% |
| Occupation | −1.7% | 0.6% | 2.7% | −0.1% |
| Constant | −199.0% | 64.0% | 72.7% | −45.8% |
| Total | 27.3% | 7.6% | 0.5% | 8.4% |
| N (women) | 814 | 1466 | 1152 | 1311 |
| N(men) | 1172 | 1509 | 1016 | 1223 |
| 1995 | 2004 | 2011 | 2019 | |
|---|---|---|---|---|
| Gap | 21.0% | 15.2% | 6.3% | 3.2% |
| Explained | −5.9% | −2.9% | −2.7% | −0.9% |
| Unexplained | 26.9% | 18.1% | 9.0% | 4.1% |
| Explained | ||||
| Age | 1.2% | −0.2% | −0.7% | 0.7% |
| Marital Status | −0.4% | 0.3% | 0.4% | 0.2% |
| Working Part-Time | 2.2% | 1.7% | 6.5% | 1.5% |
| Education | −2.7% | −1.4% | −0.8% | −3.2% |
| Irish Citizen | 0.2% | 0.0% | −0.5% | −0.7% |
| Occupation | −6.4% | −3.2% | −7.6% | 0.5% |
| Total | −5.9% | −2.9% | −2.7% | −0.9% |
| Unexplained | ||||
| Age | −38.7% | 2.6% | −45.4% | 72.8% |
| Marital Status | 14.0% | 6.9% | 4.6% | 0.9% |
| Working Part-Time | 0.3% | −0.4% | 1.6% | −1.5% |
| Education | −0.3% | 0.0% | −2.3% | −3.3% |
| Irish Citizen | −67.5% | −0.3% | −4.1% | 3.5% |
| Occupation | 0.5% | 1.1% | 2.0% | 0.6% |
| Constant | 118.6% | 8.3% | 52.7% | −69.0% |
| Total | 26.9% | 18.1% | 9.0% | 4.1% |
| N (women) | 814 | 1466 | 1152 | 1311 |
| N(men) | 1172 | 1509 | 1016 | 1223 |
| 1995 | 2004 | 2011 | 2019 | |
|---|---|---|---|---|
| Gap | 11.5% | 10.8% | 6.5% | 10.5% |
| Explained | −0.6% | −4.3% | −2.6% | −5.2% |
| Unexplained | 12.1% | 15.1% | 9.2% | 15.7% |
| Explained | ||||
| Age | 2.7% | −0.4% | −0.6% | 0.7% |
| Marital Status | −0.1% | 0.2% | 0.0% | 0.2% |
| Working Part-Time | −4.8% | −1.7% | −0.5% | −3.1% |
| Education | −1.3% | −1.5% | −0.4% | −2.1% |
| Irish Citizen | 0.1% | 0.0% | −0.2% | −0.3% |
| Occupation | 2.8% | −0.9% | −0.9% | −0.6% |
| Total | −0.6% | −4.3% | −2.6% | −5.2% |
| Unexplained | ||||
| Age | −19.7% | −10.1% | −14.9% | −216.8% |
| Marital Status | 7.7% | 2.1% | 1.7% | 5.7% |
| Working Part-Time | 1.2% | 0.9% | 0.4% | −1.2% |
| Education | 0.6% | 0.3% | 2.3% | 0.3% |
| Irish Citizen | −56.8% | 2.2% | −1.9% | −8.4% |
| Occupation | −0.4% | −1.3% | −2.6% | −0.6% |
| Constant | 79.4% | 21.0% | 24.1% | 236.7% |
| Total | 12.1% | 15.1% | 9.2% | 15.7% |
| N (women) | 814 | 1466 | 1152 | 1311 |
| N(men) | 1172 | 1509 | 1016 | 1223 |
| 1 | See Russell et al. (2017) for discussion of how gender equality in the Irish labour market has changed over the last 50 years. |
| 2 | |
| 3 | Statistics|Eurostat (europa.eu) (accessed on 25 July 2022). |
| 4 | Women’s hours and, hence, earnings, can also fluctuate across the earning’s distribution due to assortative mating, in which highly paid women tend to marry highly paid men and labour-supply decisions are made based on intrahousehold specialization (see, e.g., Bredemeier and Juessen 2013). |
| 5 | The description of data here is based on that in Roantree et al. (2021). Barrett et al. (1999a, 1999b, 2002) use the earlier years of data covering the period 1987–1997 to examine earnings inequality and returns to education. |
| 6 | A small number of households are included in a panel element: see CSO (2017, pp. 7–9). |
| 7 | We exclude these groups due to concerns about the reliability of their reported usual hours of work and earnings, which give rise to many implausible values for constructed hourly wages. |
| 8 | We use CSO series CPM01, available at https://data.cso.ie/table/CPM01 (accessed on 31 May 2022). |
| 9 | Influence functions, in general, are used to analyse the robustness of distributional statistics (i.e., quantiles or means) to small changes to the underlying data. See Rios-Avila (2020) for a technical, yet intuitive, explanation of IFs and RIFs and their associated uses. |
| 10 | Note that one could use standard quantile regressions. However, the estimates from standard quantile regressions show the effect of a change in the explanatory variable on the conditional quantile. For a more detailed discussion of conditional versus unconditional quantile regression and the RIF transformation, see Firpo et al. (2009). To implement the RIF regressions and decompositions, we use the Stata package created by Rios-Avila (2020). |
| 11 | Note that X refers to the vector of characteristics used in Equation (2), and the βs refer to the estimates from Equation (2). |
| 12 | Detailed decomposition results are presented for selected years in Appendix B. |
| 13 | This is in line with the U-shaped GWG estimated by Doorley et al. (2021) for Ireland between 2011 and 2018. |
| 14 | Specifically, we include dummies for occupation at the one-digit ISCO level (combining “skilled agricultural/fishery workers” and “skilled craft/trades workers” for reasons of small sample sizes). We also include a dummy for Irish citizenship, which is only available from 1994 onwards. |
| 15 | We omit these characteristics from our preferred specification, as they are not available for the entire period we examine. |
References
- Arulampalam, Wiji, Alison L. Booth, and Mark L. Bryan. 2007. Is there a glass ceiling over Europe? Exploring the gender pay gap across the wage distribution. ILR Review 60: 163–86. [Google Scholar] [CrossRef]
- Baker, Michael, Yosh Halberstam, Kory Kroft, Alexandre Mas, and Derek Messacar. Forthcoming. Pay Transparency and the Gender Gap. American Economic Journal: Applied Economics.
- Bargain, Oliver, Karina Doorley, and Philippe Van Kerm. 2018. Minimum Wages and the Gender Gap in Pay. New Evidence from the UK and Ireland. Review of Income and Wealth 65: 514–39. [Google Scholar] [CrossRef]
- Barrett, Alan, John FitzGerald, and Brian Nolan. 2002. Earnings inequality, returns to education and immigration into Ireland. Labour Economics 9: 665–80. [Google Scholar] [CrossRef]
- Barrett, A, Tim Callan, and Brian Nolan. 1999a. Returns to education in the Irish youth labour market. Journal of Population Economics 12: 313–26. [Google Scholar] [CrossRef]
- Barrett, Alan, Tim Callan, and Brian Nolan. 1999b. Rising Wage Inequality, Returns to Education and Labour Market Institutions: Evidence from Ireland. British Journal of Industrial Relations 37: 77–100. [Google Scholar] [CrossRef]
- Bercholz, Maxime, and John FitzGerald. 2016. Recent Trends in Female Labour Force Participation in Ireland. Dublin: The Economic and Social Research Institute. [Google Scholar]
- Bergin, Adele, and Elish Kelly. 2012. The Labor Market in Ireland, 2000–2016. IZA World of Labor. Bonn: Institute of Labor Economics. [Google Scholar]
- Bick, Alexander, and Nicola Fuchs-Schuendeln. 2017. Quantifying the Disincentive Effects of Joint Taxation on Married Women’s Labor Supply. American Economic Review 107: 100–4. [Google Scholar] [CrossRef]
- Blau, Francine D, and Lawrence M. Kahn. 2017. The Gender Wage Gap: Extent, Trends, and Explanations. Journal of Economic Literature 55: 789–865. [Google Scholar] [CrossRef]
- Borella, Margherita, Mariacristina De Nardi, and Fand Yang. 2021. Are Marriage-Related Taxes and Social Security Benefits Holding Back Female Labor Supply. NBER Working Paper No. 26097. Cambridge: National Bureau of Economic Research. [Google Scholar]
- Bredemeier, Christian, and Falko Juessen. 2013. Assortative Mating and Female Labor Supply. Journal of Labor Economics 31: 603–31. [Google Scholar] [CrossRef]
- Brewer, Mike, Sarah Cattan, Claire Crawford, and Rabe Birgitta. 2022. Does more free childcare help parents work more? Labour Economics 74: 1–24. [Google Scholar] [CrossRef]
- Callan, Tim, Damian Hannan, Brian Nolan, and Brendan Whelan. 1988. Poverty and the Social Welfare System in Ireland. Dublin: Combating Poverty Agency. [Google Scholar]
- Chung, Heejung. 2018. Dualization and the access to occupational family-friendly working-time arrangements across Europe. Social Policy & Administration 52: 419–507. [Google Scholar]
- Cortés, Patricia, and Jessica Pan. 2020. Children and the Remaining Gender Gaps in the Labor Market. NBER Working Paper No. 27980. Cambridge: National Bureau of Economic Research. [Google Scholar]
- Central Statistics Office. 2017. Standard Report on Methods and Quality for the Survey on Income and Living Conditions (EU-SILC) 2017; Cork: CSO.
- Delaney, Judith M, and Paul J. Devereux. 2019. Understanding gender differences in STEM: Evidence from college applications. Economics of Education Review 72: 219–38. [Google Scholar] [CrossRef]
- Doorley, Karina. 2018. Taxation, work and gender equality in Ireland. Journal of the Statistical and Social Inquiry Society of Ireland 47: 71–87. [Google Scholar] [CrossRef]
- Doorley, Karina, and Claire Keane. 2020. Tax-Benefit Systems and the Gender Gap in Income. IZA Discussion Paper No. 13786. Bonn: Institute of Labor Economics. [Google Scholar]
- Doorley, Karina, Ivan Privalko, Helen Russell, and Dora Tuda. 2021. The Gender Pay Gap in Ireland from Austerity through Recovery. IZA Discussion Paper No. 14441. Bonn: Institute of Labor Economics. [Google Scholar]
- Doorley, Karina, Cathal O’Donoghue, and Denisa M. Sologon. 2022. The Gender Gap in Income and the COVID-19 Pandemic. Social Sciences 11: 311. [Google Scholar] [CrossRef]
- Doris, Aédin. 2019. Ireland’s Gender Wage Gap, Past and Present. The Economic and Social Review 50: 667–81. [Google Scholar]
- Doris, Aédin, Donal O’Neill, and Olive Sweetman. 2015. Wage flexibility and the great recession: The response of the Irish labour market. IZA Journal of European Labor Studies 4: 1–24. [Google Scholar] [CrossRef][Green Version]
- Doris, Aédin, Donal O’Neill, and Olive Sweetman. 2022. The Dynamics of the Gender Earnings Gap for College Educated Workers: The Child Earnings Penalty, Job Mobility, and Field of Study. Working Paper N315-22. Maynooth: Maynooth University. [Google Scholar]
- Firpo, Sergio, Nicole Fortin, and Thomas Lemieux. 2009. Unconditional quantile regressions. Econometrica 77: 953–73. [Google Scholar]
- Goldin, Claudia. 2014. A Grand Gender Convergence: Its Last Chapter. American Economic Review 104: 1091–119. [Google Scholar] [CrossRef]
- Kunez, Astrid. 2018. The gender wage gap in developed countries. In The Oxford Handbook of Women and the Economy. Oxford: Oxford University Press, pp. 369–94. [Google Scholar]
- McGuinness, Seamus, Elish Kelly, Tim Callan, and Philip J. O’Connell. 2009. The Gender Wage Gap in Ireland: Evidence from the National Employment Survey 2003. Dublin: The Economic and Social Research Institute and Equality Authority. [Google Scholar]
- Mosca, Irene, and Robert E. Wright. 2020. The Long-term Consequences of the Irish Marriage Bar. The Economic and Social Review 51: 1–34. [Google Scholar] [CrossRef]
- Redmond, Paul, and Seamus McGuinness. 2019. The Gender Wage Gap in Europe: Job Preferences, Gender Convergence and Distributional Effects. Oxford Bulletin of Economics and Statistics 81: 564–87. [Google Scholar] [CrossRef]
- Rios-Avila, Fernando. 2020. Recentered influence functions (RIFs) in Stata. The Stata Journal 20: 51–94. [Google Scholar] [CrossRef]
- Roantree, Barra. 2019. Income tax and the careers of women. In EEA Annual Congress. Manchester: European Economic Association. [Google Scholar]
- Roantree, Barra, Bertrand Maître, Alyvia McTague, and Ivan Privalko. 2021. Poverty, Income Inequality and Living Standards in Ireland. Dublin: ESRI and the Community Foundation for Ireland. [Google Scholar]
- Russell, Helen, Emer Smyth, and Philip J. O’Connell. 2010. Gender differences in pay among recent graduates: Private sector employees in Ireland. Journal of Youth Studies 13: 213–23. [Google Scholar] [CrossRef]
- Russell, Helen, Frances McGinnity, and Philip J. O’Connell. 2017. Gender equality in the Irish Labour Market 1966-2016: Unfinished business? The Economic and Social Review 48: 393–418. [Google Scholar]
- Weichselbaumer, Doris, and Rudolf Winter-Ebmer. 2005. A Meta-Analysis of the International Gender Wage Gap. Journal of Economic Surveys 19: 479–511. [Google Scholar] [CrossRef]

Publisher’s Note: MDPI stays neutral with regard to jurisdictional claims in published maps and institutional affiliations. |
© 2022 by the authors. Licensee MDPI, Basel, Switzerland. This article is an open access article distributed under the terms and conditions of the Creative Commons Attribution (CC BY) license (https://creativecommons.org/licenses/by/4.0/).
Share and Cite
Barrett, M.; Doorley, K.; Redmond, P.; Roantree, B. How Has the Gender Earnings Gap in Ireland Changed in Thirty Years? Soc. Sci. 2022, 11, 367. https://doi.org/10.3390/socsci11080367
Barrett M, Doorley K, Redmond P, Roantree B. How Has the Gender Earnings Gap in Ireland Changed in Thirty Years? Social Sciences. 2022; 11(8):367. https://doi.org/10.3390/socsci11080367
Chicago/Turabian StyleBarrett, Michelle, Karina Doorley, Paul Redmond, and Barra Roantree. 2022. "How Has the Gender Earnings Gap in Ireland Changed in Thirty Years?" Social Sciences 11, no. 8: 367. https://doi.org/10.3390/socsci11080367
APA StyleBarrett, M., Doorley, K., Redmond, P., & Roantree, B. (2022). How Has the Gender Earnings Gap in Ireland Changed in Thirty Years? Social Sciences, 11(8), 367. https://doi.org/10.3390/socsci11080367


