

The Lock-in Effect of Marriage: Work Incentives after Saying “I Do”


Abstract
:1. Introduction
2. Data and Methods
3. Empirical Results
3.1. Labour Market Characteristics of Married and Cohabiting Couples of Working Age
3.2. Incentives to Work on the Intensive Margin
3.3. Incentives to Work on the Extensive Margin
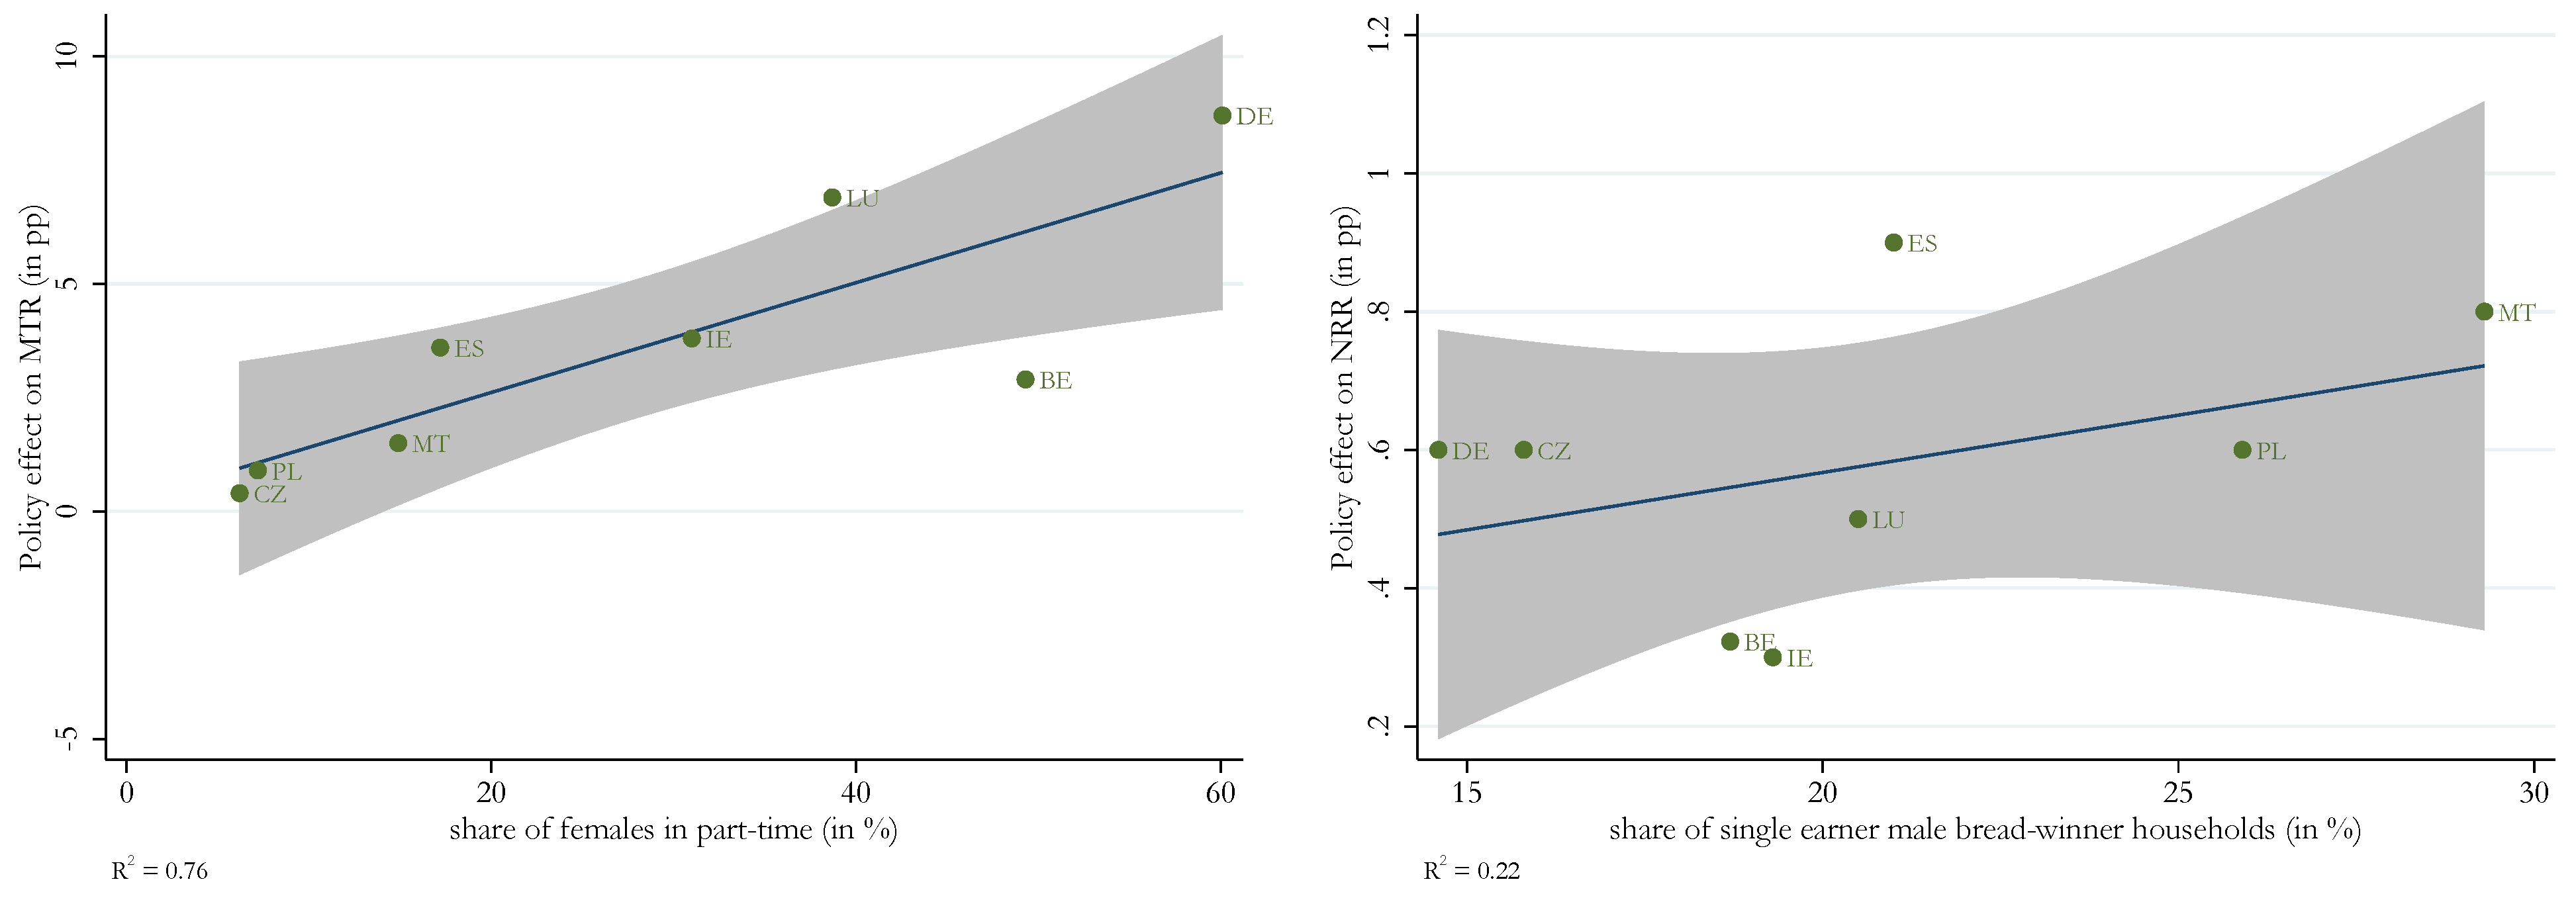
3.4. Tax-Benefit Systems, Incentives to Work and Labour Market Outcomes
4. Conclusions
Author Contributions
Funding
Data Availability Statement
Acknowledgments
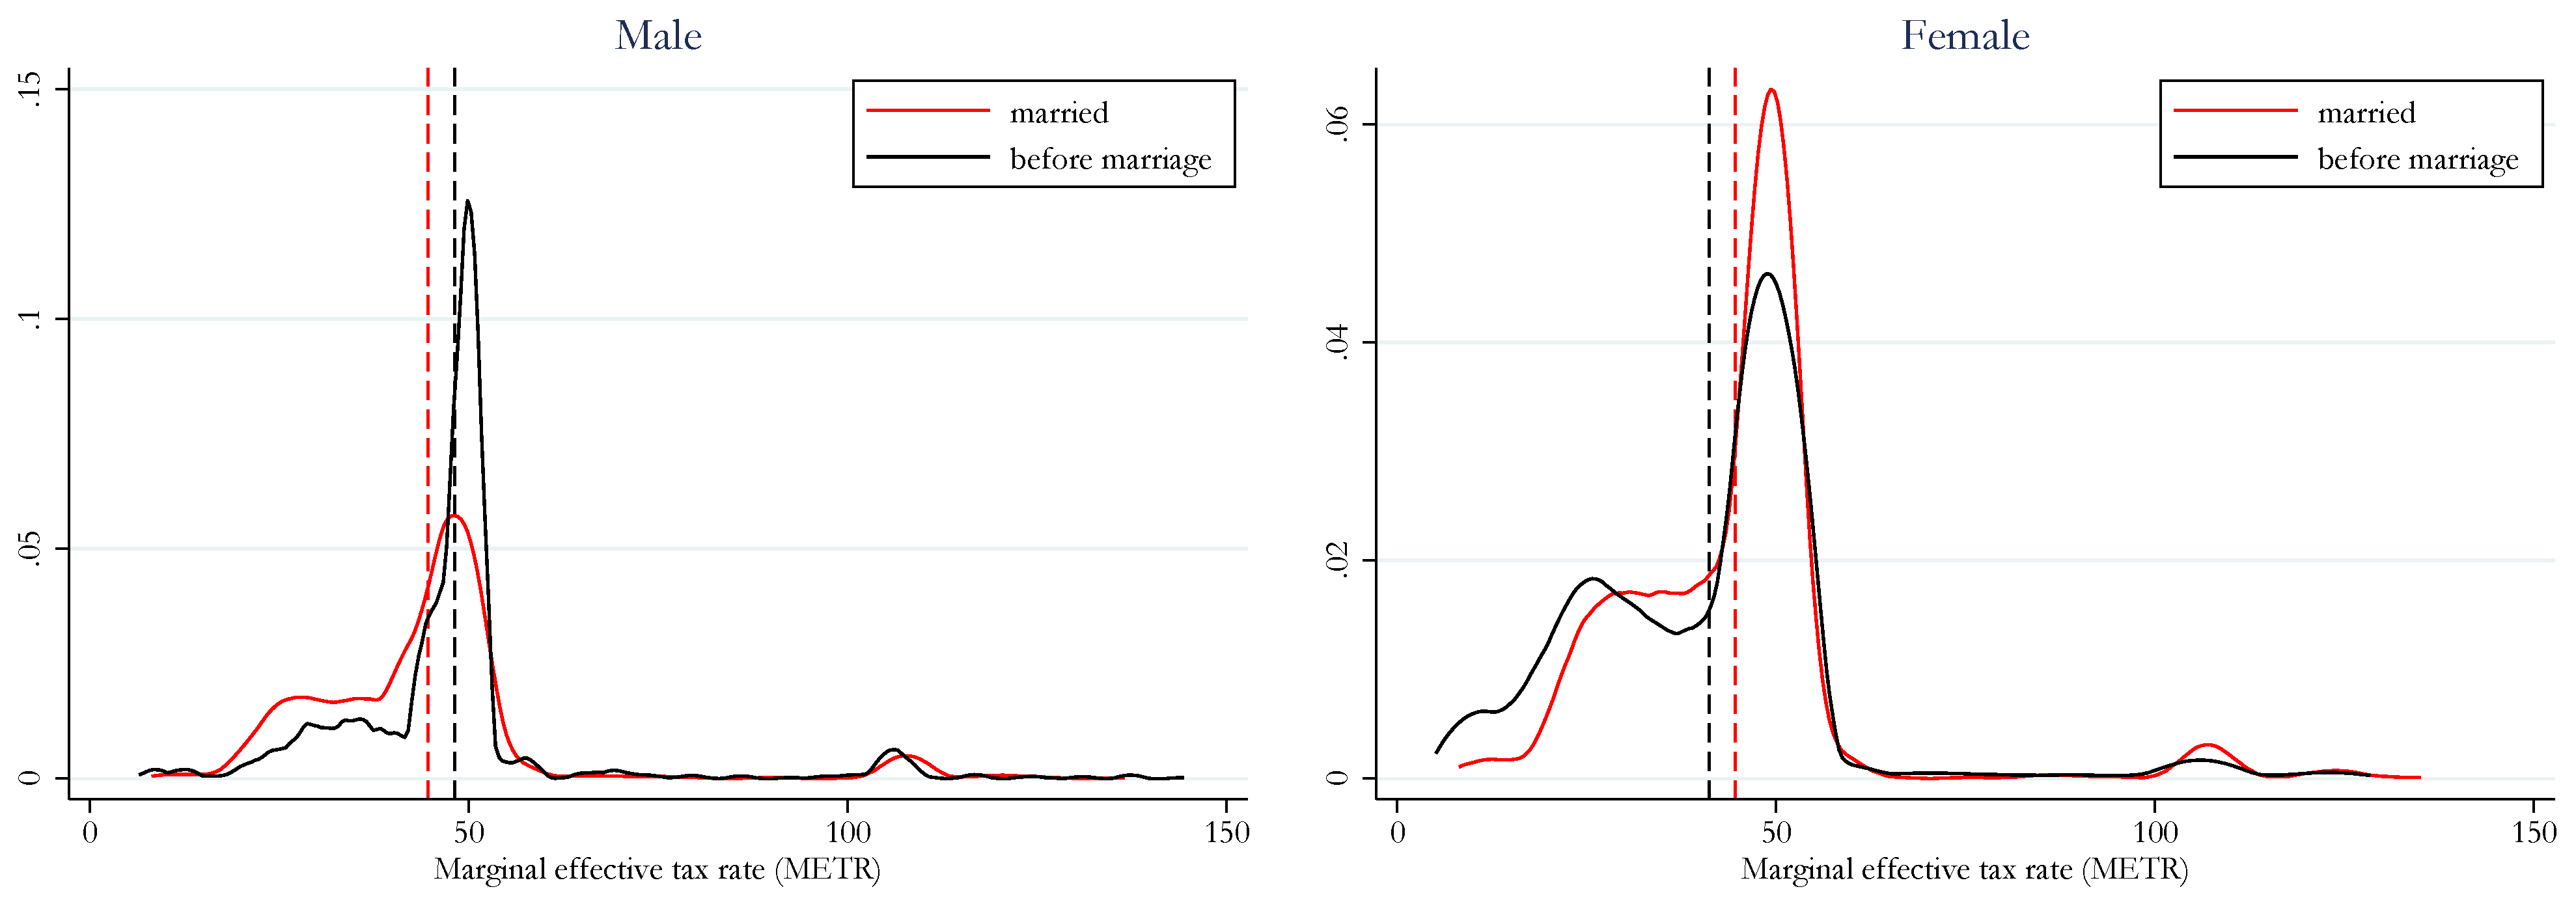
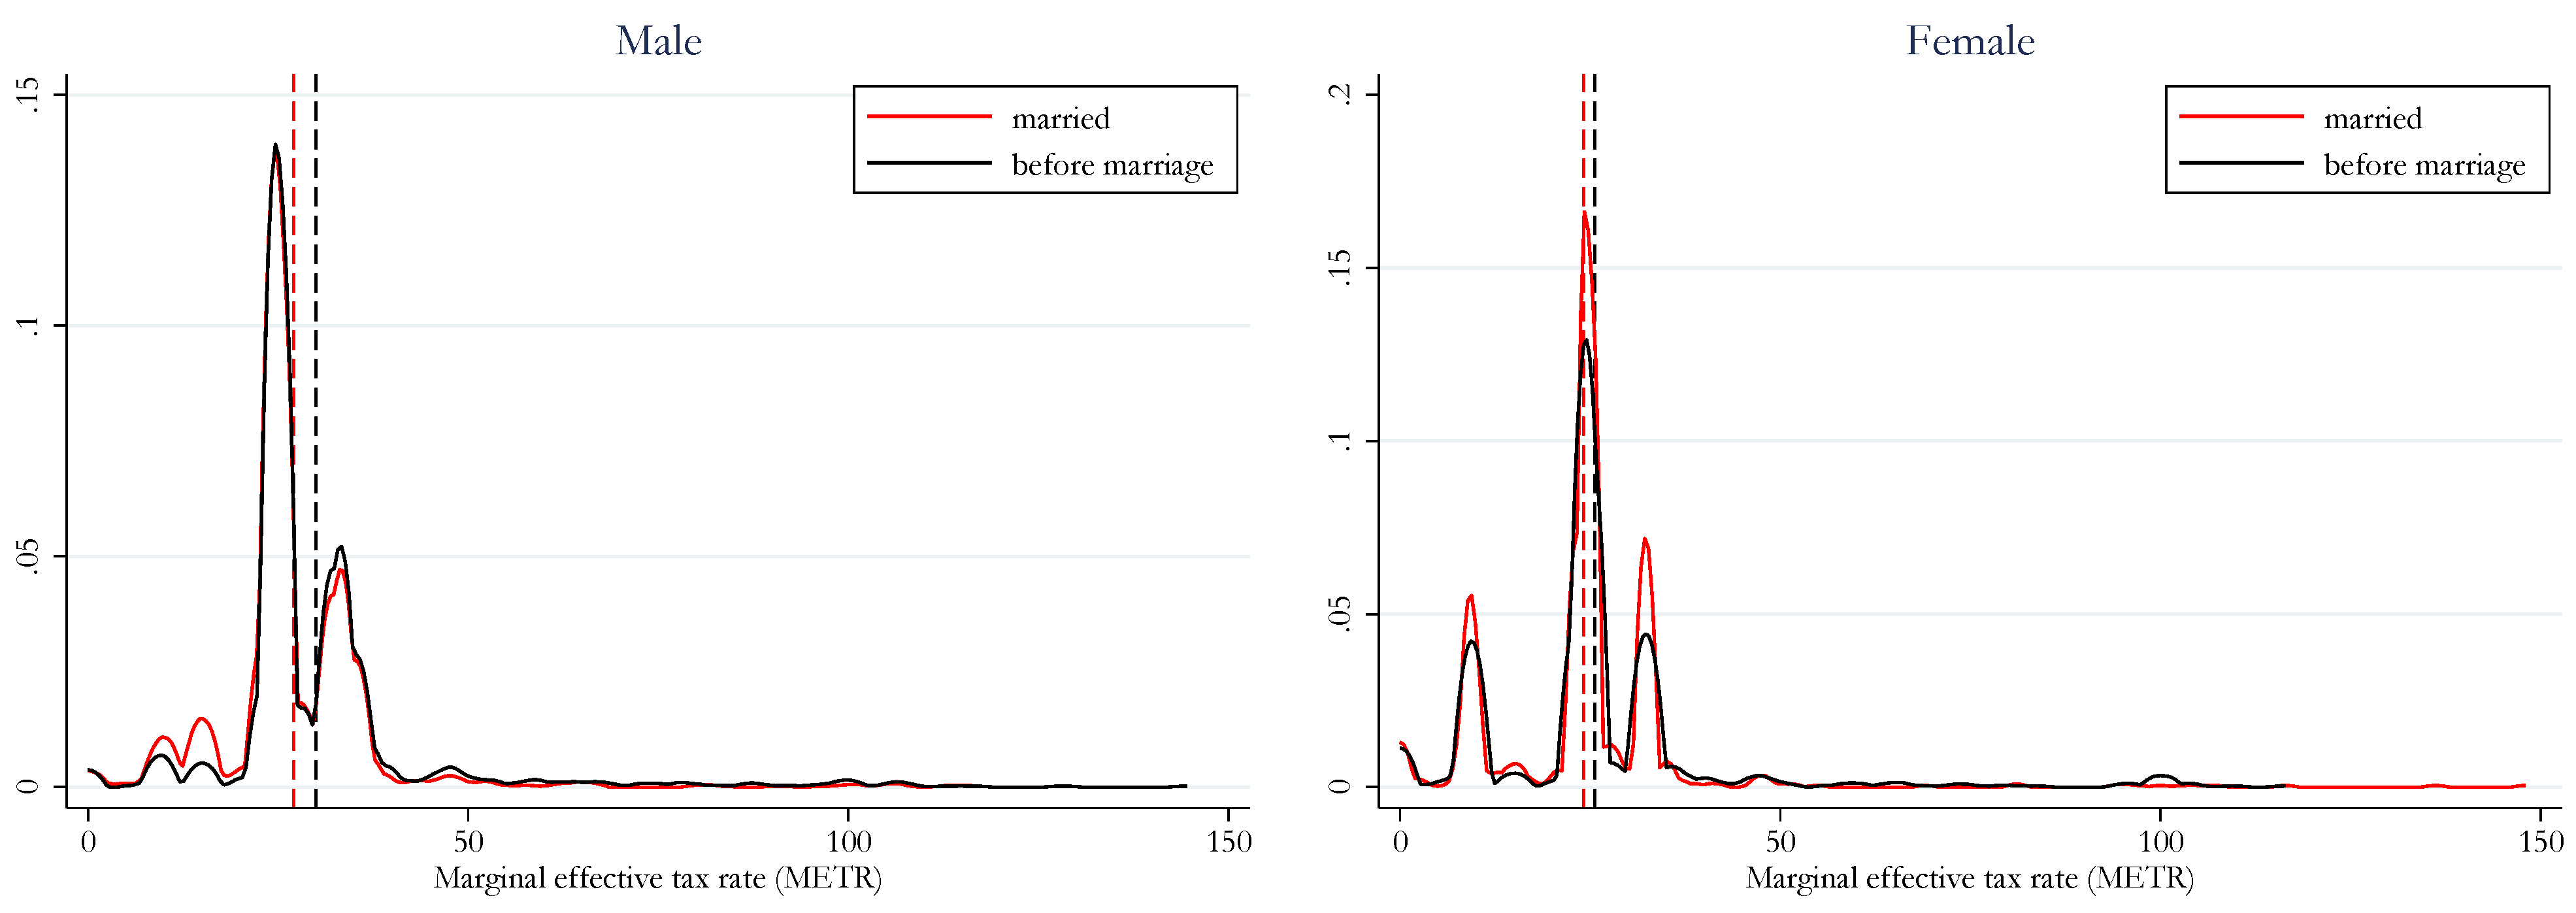
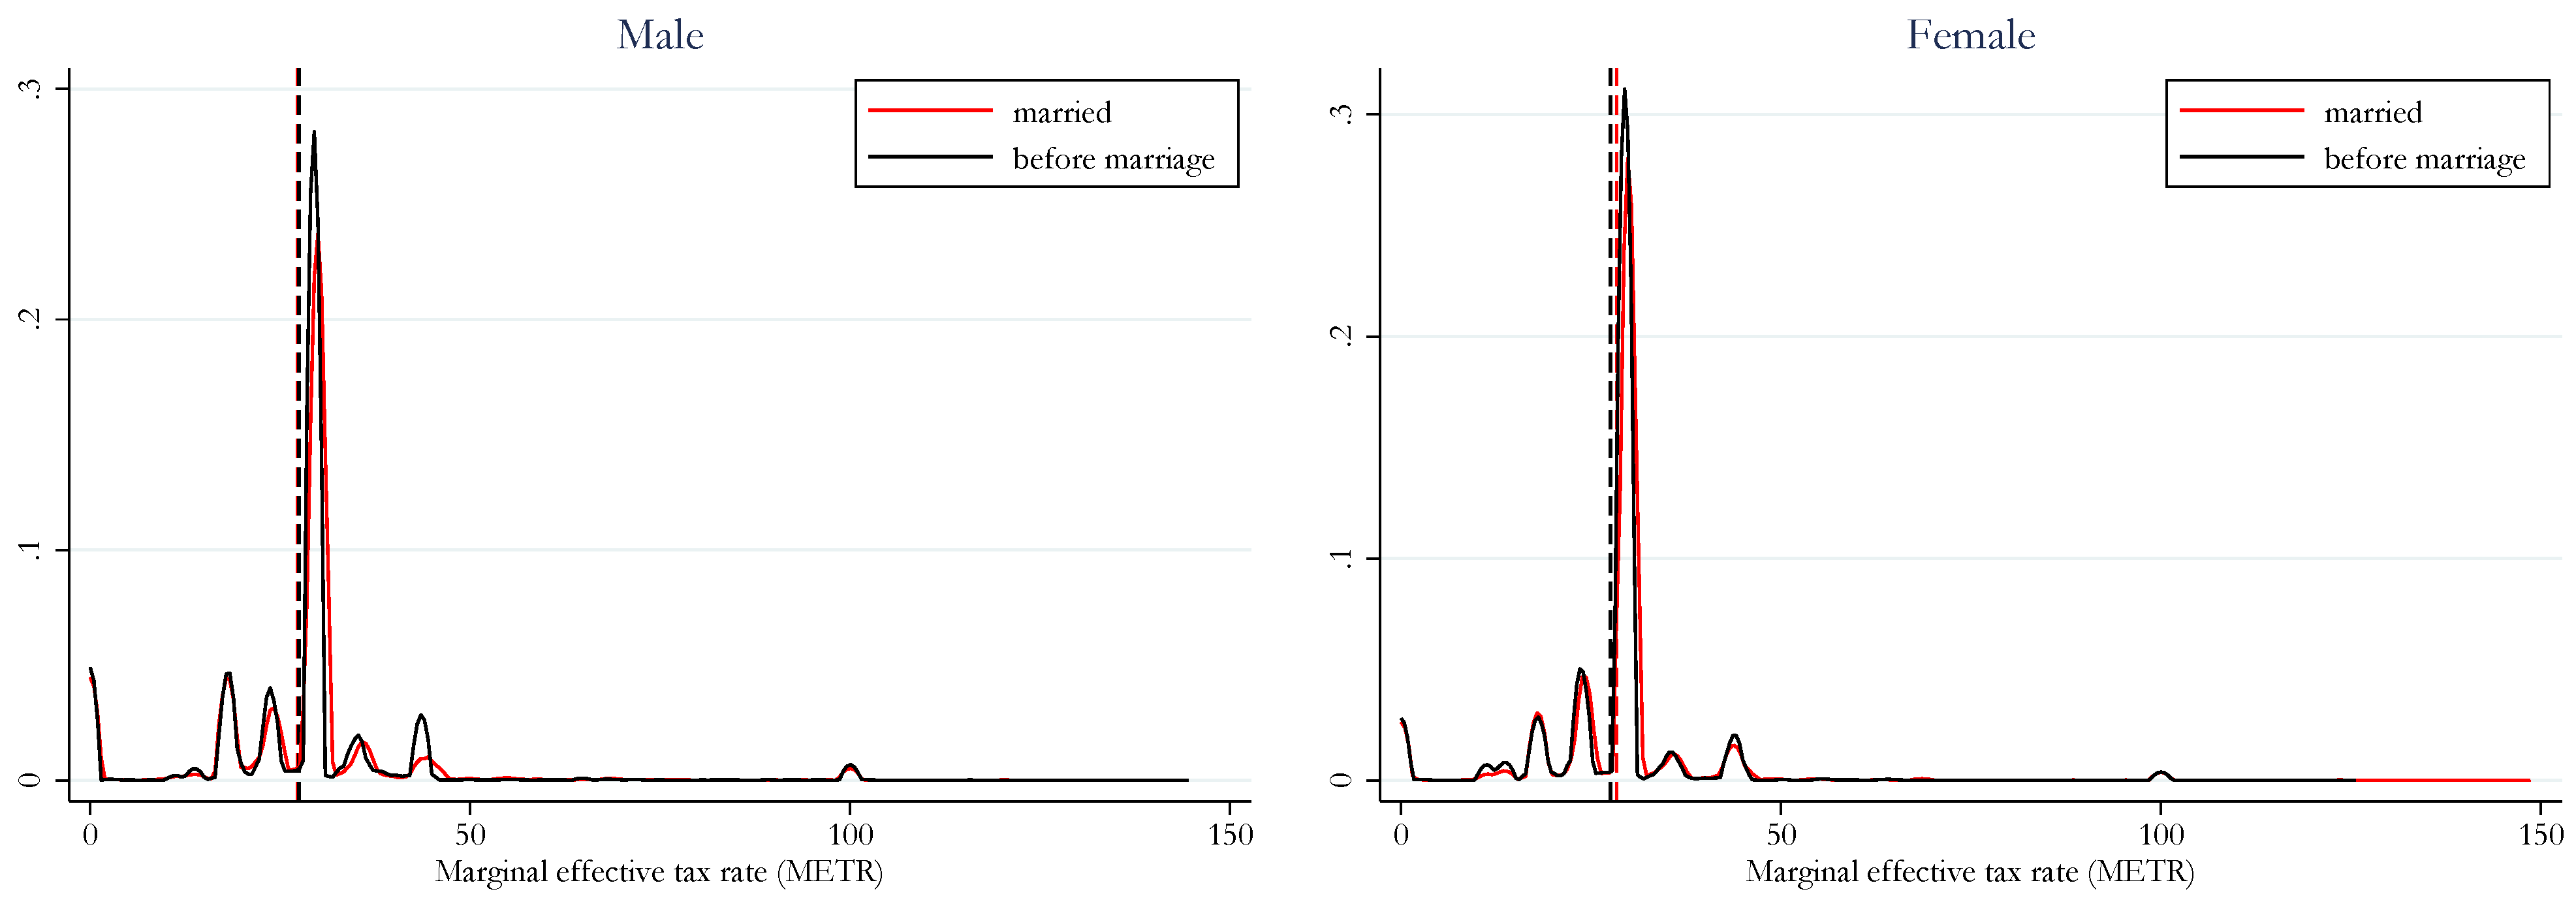
Conflicts of Interest
Abbreviations
| EU | European Union |
| METR | Marginal effective tax rate |
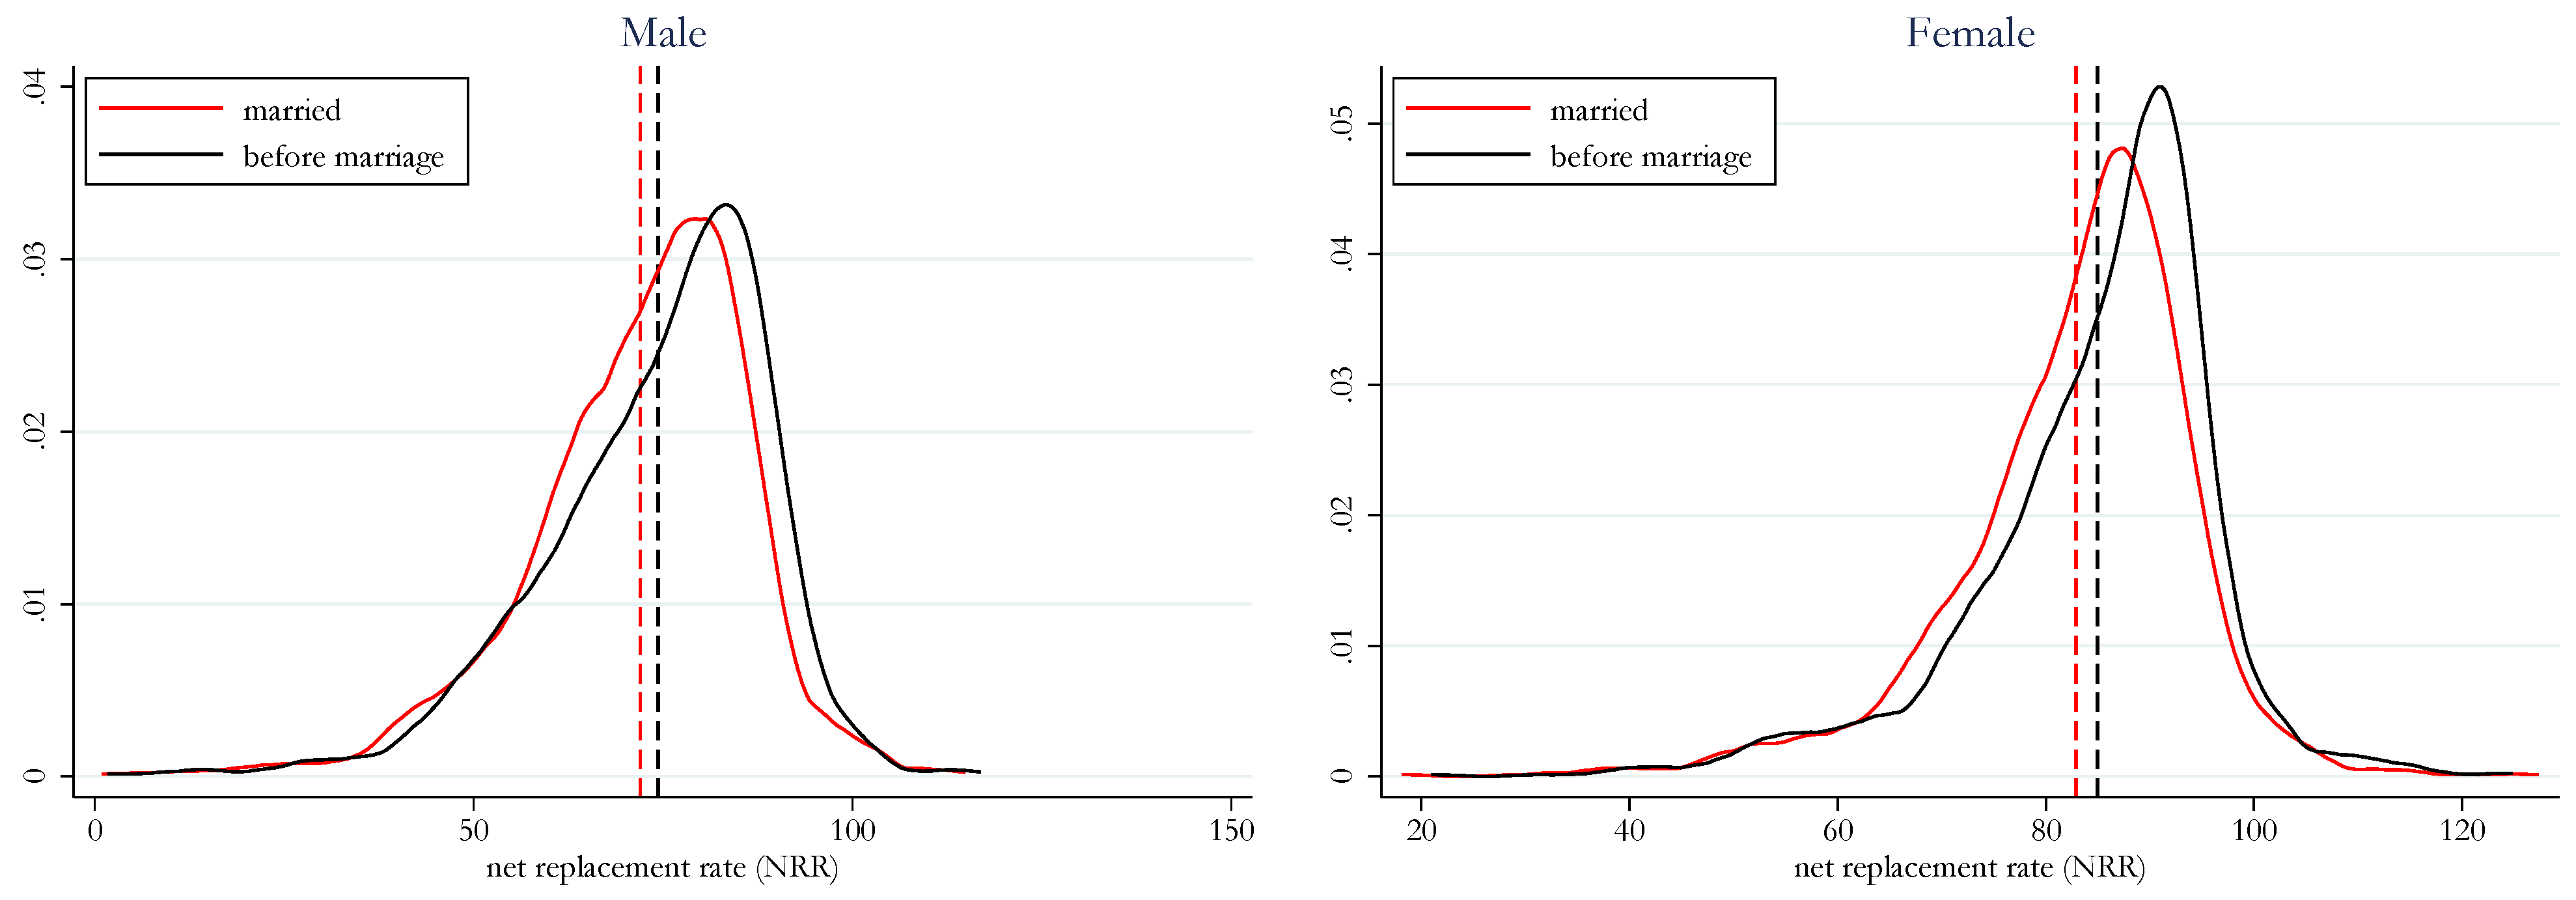
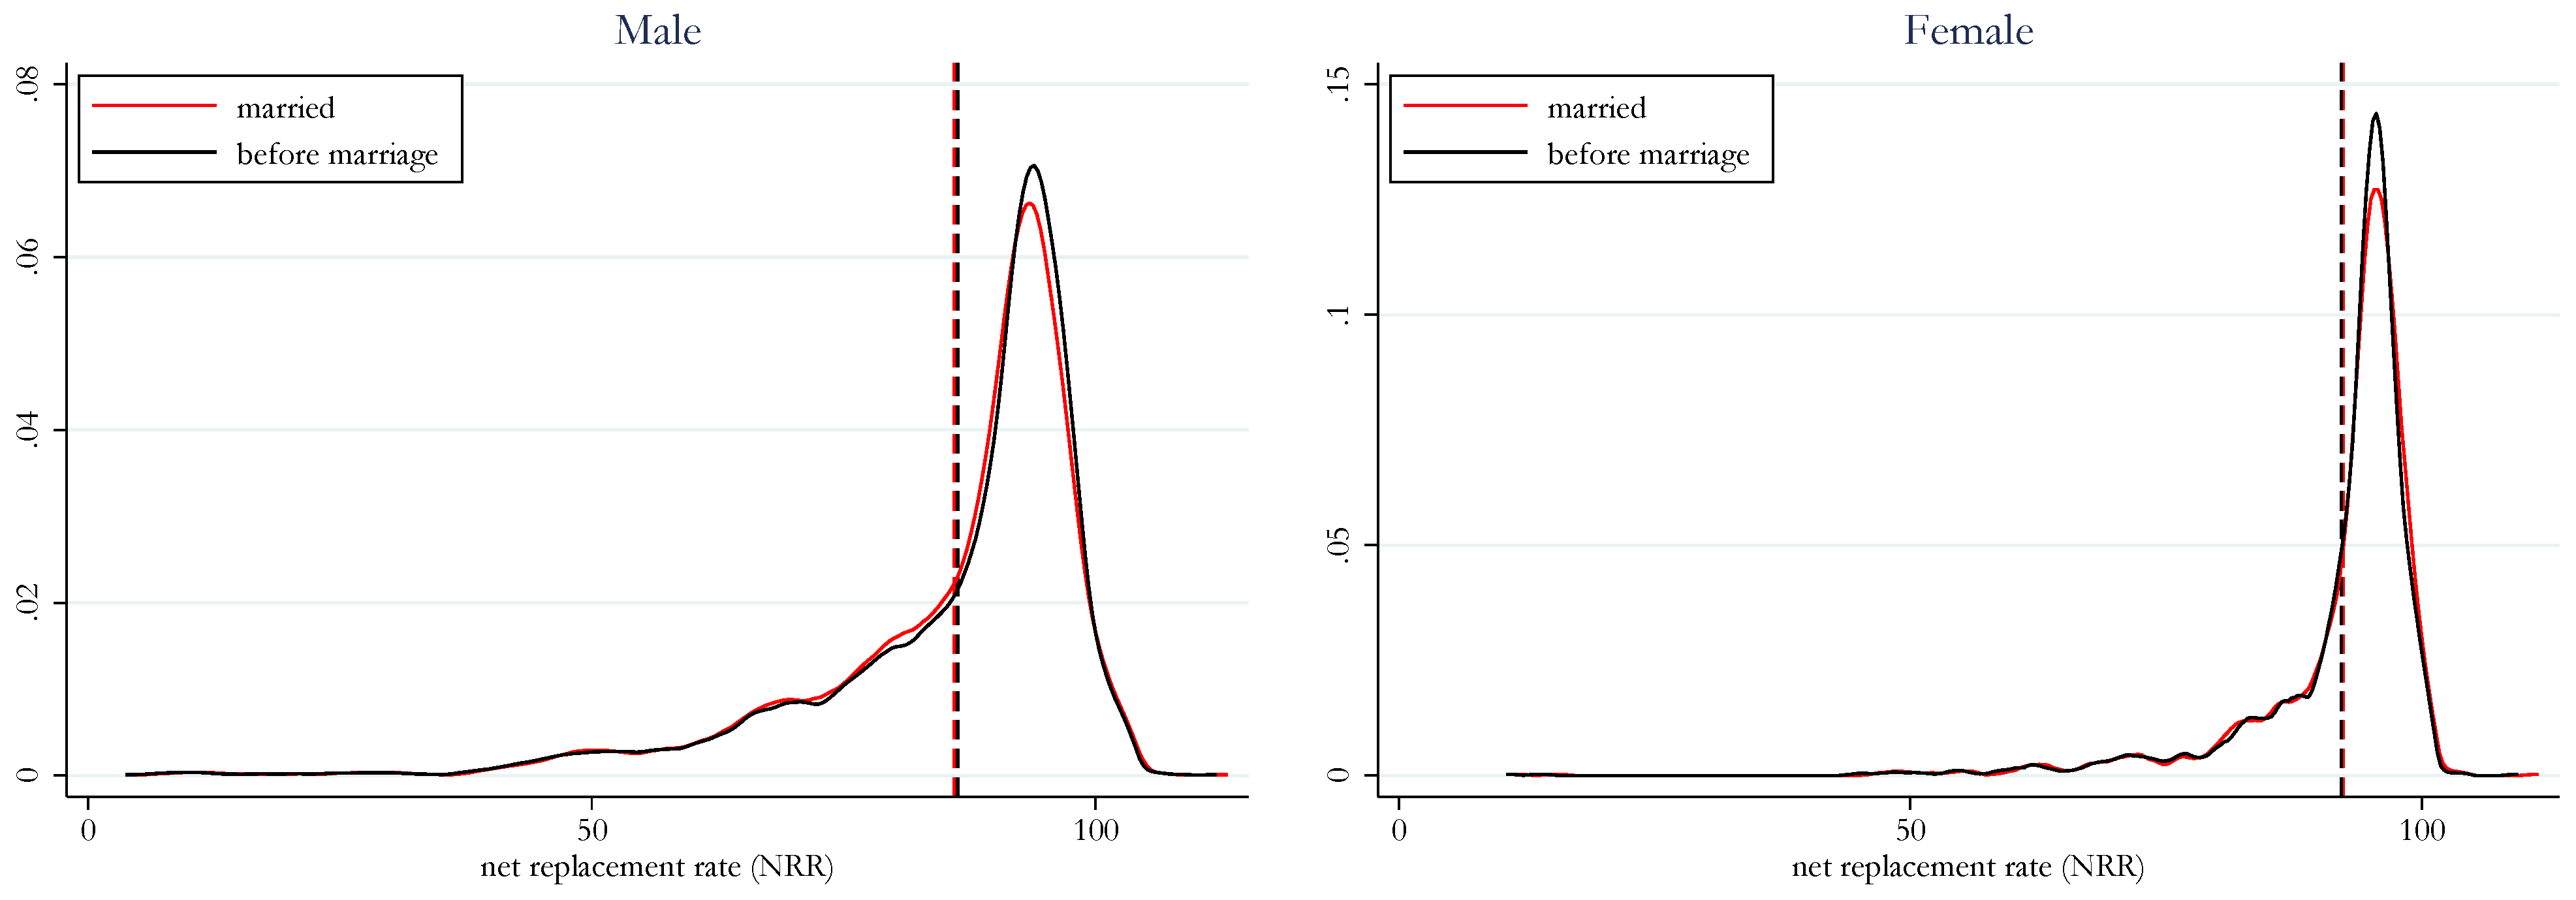
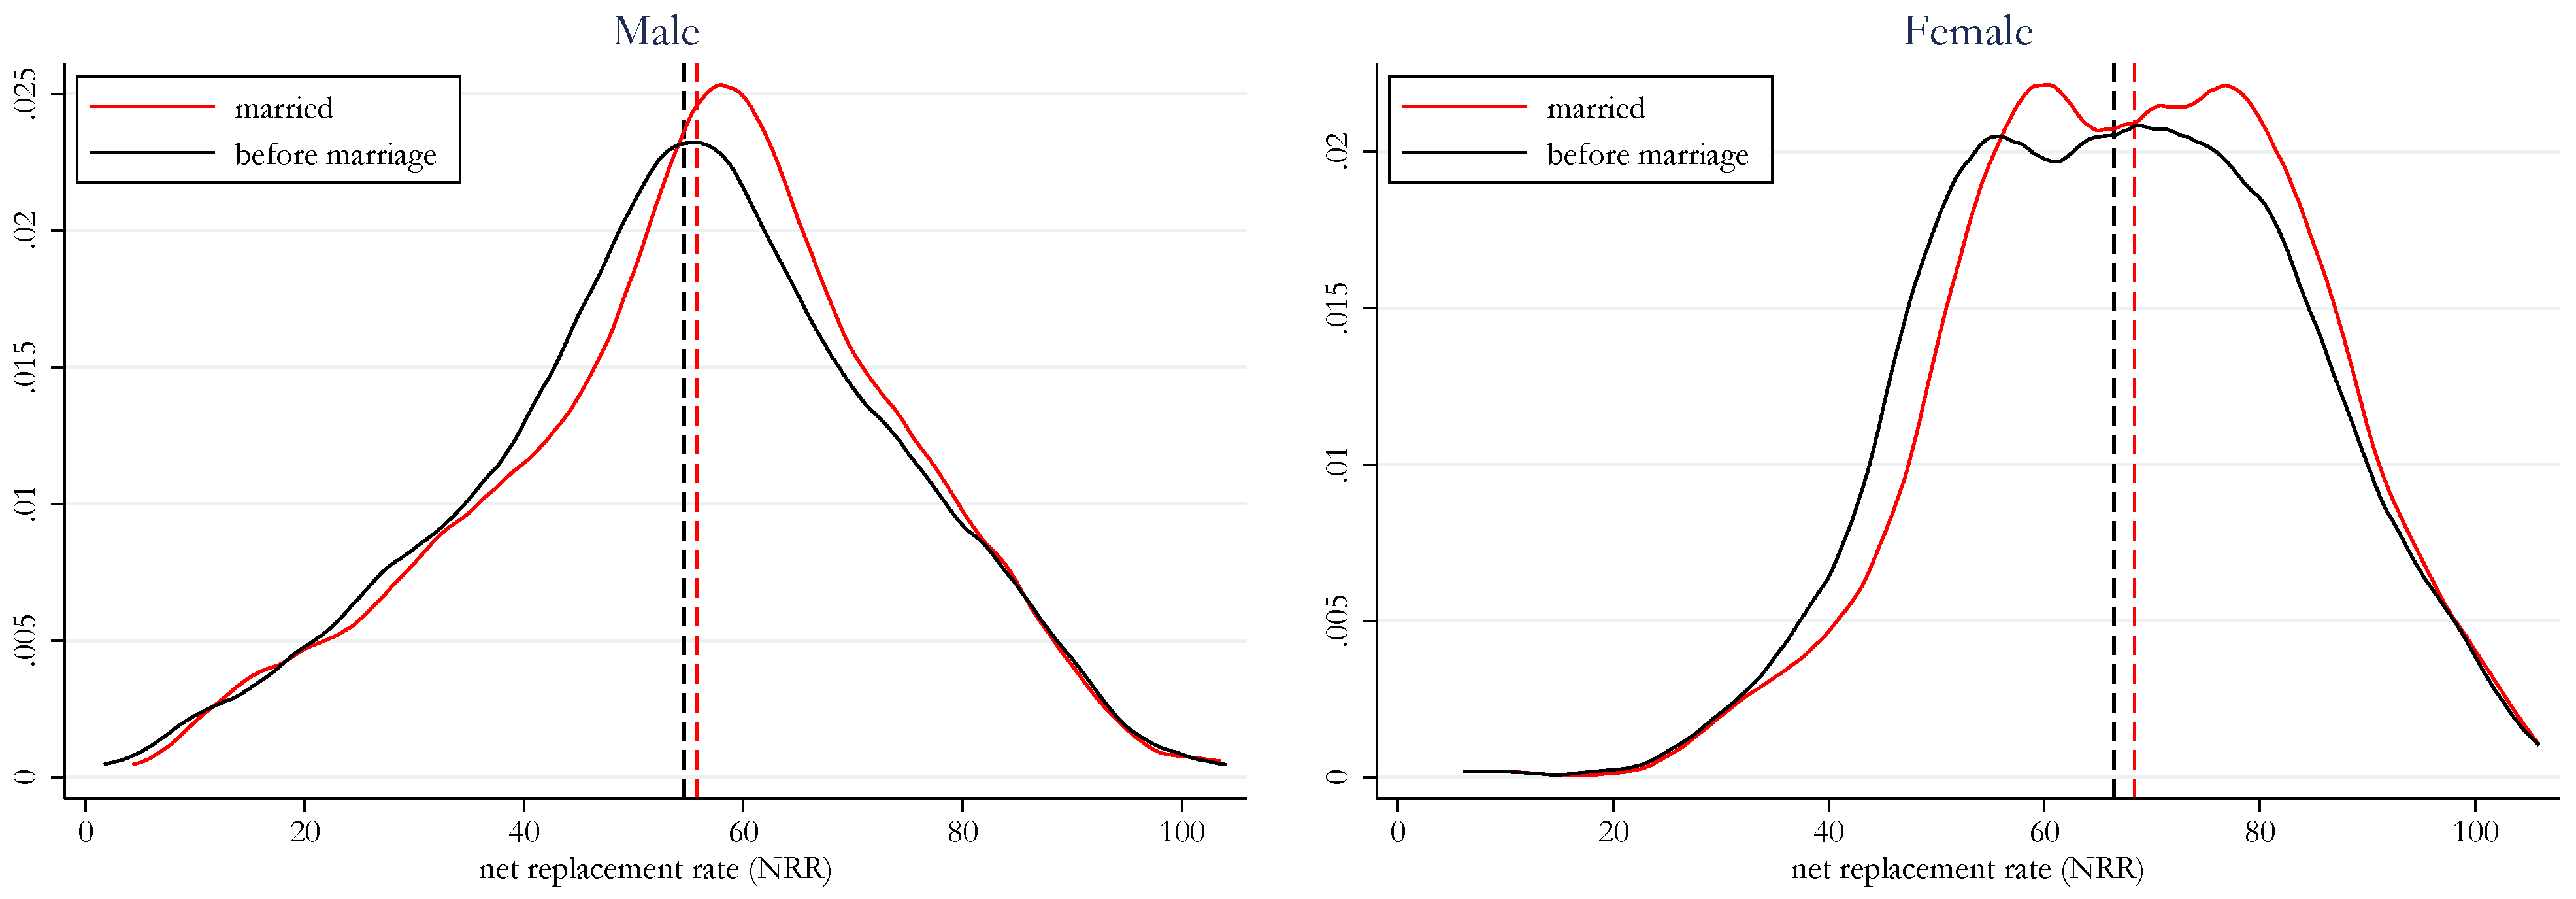
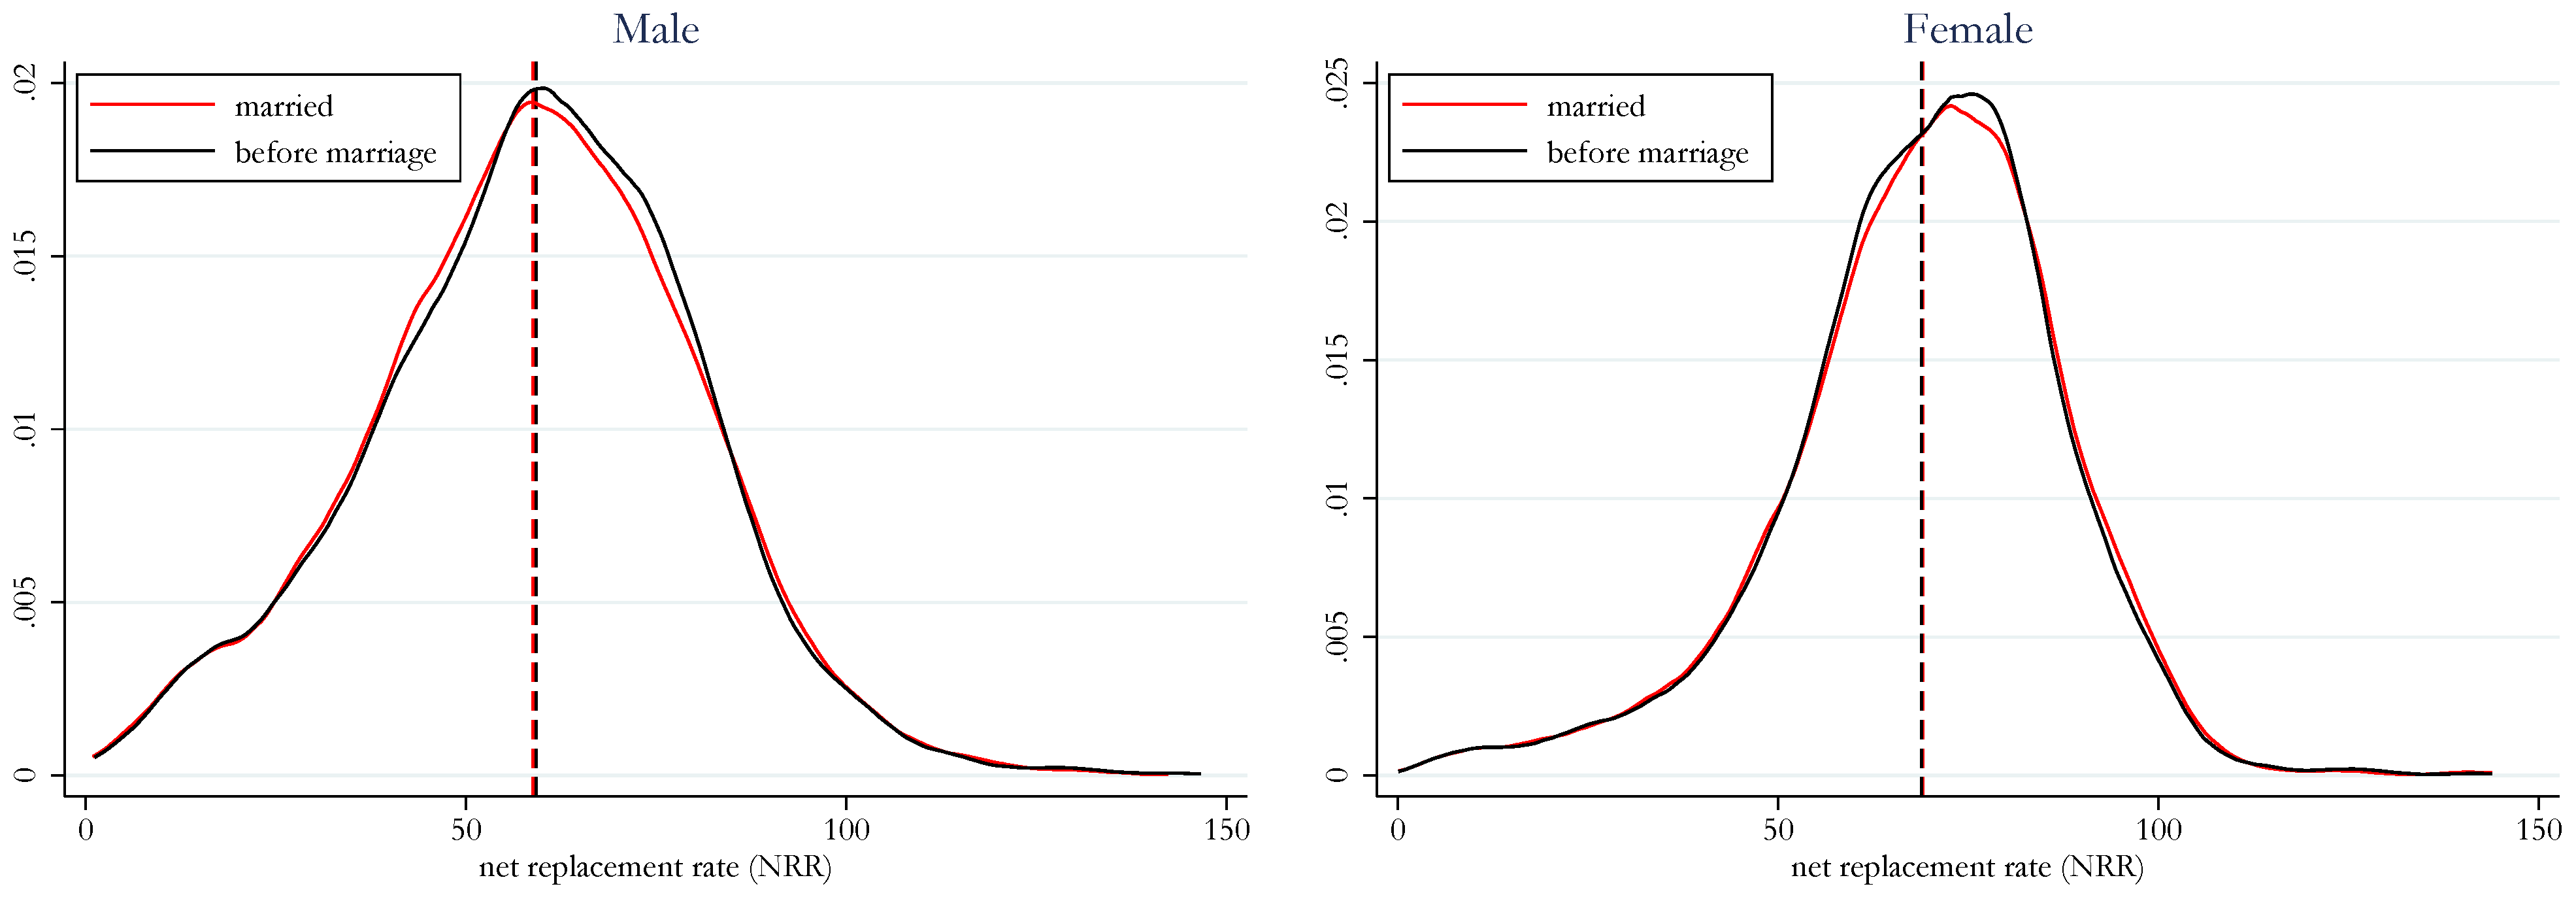
| NRR | Net replacement rate |
| PE | Policy effect |
Appendix A. Additional Tables

| Country | Income Taxation | If Individual, Tax Allowance/Credit for Spouse? | If Individual + No Tax Allowance/Credit for Spouse, Deductions Shared Together |
|---|---|---|---|
| AT | individual | No (single earners’ tax credit) * | No |
| BE | individual (marital quotient applies **) | - | - |
| BG | individual | No | No |
| HR | individual | Yes (supported spouse allowance) | - |
| CY | individual | No | Yes (life insurance) |
| CZ | individual | Yes (spouse tax credit) | - |
| DK | individual | No | Yes (tax allowance can be shared; net capital income) |
| EE | individual | Yes (tax allowance for spouse) | - |
| FI | individual | No | Yes (unused deficit tax credit can be transferred) |
| FR | joint | - | - |
| DE | joint (can opt for individual) | - | - |
| EL | individual | No | Yes (tax allowances can be shared) |
| HU | individual | No *** | No |
| IE | partly joint (can opt for individual) | - | - |
| IT | individual | Yes (dependent) | - |
| LV | individual | Yes (dependent) **** | - |
| LT | individual | No | Yes (deductible expenses can be transferred) |
| LU | joint (can opt for individual) | - | - |
| MT | joint or individual | - | - |
| NL | individual | Yes (low/zero income), also for fiscal partners | - |
| PL | joint or individual | - | - |
| PT | joint (also for cohabiting couples, under conditions) | - | - |
| RO | individual | Yes (dependant) | - |
| SK | individual | Yes (dependant) ***** | - |
| SI | individual | Yes (dependant) | - |
| ES | Individual, but can file tax returns jointly | Yes (couples can file individual or joint tax return that affects the additional tax allowance) | - |
| SE | individual | No | No |
| UK | individual | No | Yes |
| Country | Cohabiting | After Marriage | Difference | Policy Effect | |||
|---|---|---|---|---|---|---|---|
| Women | Men | Women | Men | Women | Men | ||
| BE | 56.4 | 57.5 | 56.6 | 56.5 | 0.3 | −1.1 | 1.3 |
| CZ | 26.9 | 31.5 | 27.0 | 30.5 | 0.1 | −1.0 | 1.1 |
| DE | 39.8 | 45.5 | 40.8 | 42.4 | 1.0 | −3.2 | 4.2 |
| ES | 23.2 | 28.4 | 24.3 | 27.6 | 1.1 | −0.8 | 2.0 |
| IE | 38.4 | 45.8 | 40.4 | 44.3 | 2.0 | −1.5 | 3.5 |
| LU | 42.8 | 44.7 | 44.1 | 43.6 | 1.3 | −1.2 | 2.5 |
| MT | 26.7 | 27.7 | 26.7 | 27.3 | 0.0 | −0.3 | 0.3 |
| PL | 27.2 | 28.6 | 27.7 | 29.0 | 0.4 | 0.4 | 0.0 |
| Country | Married | Before Marriage | Difference | |||
|---|---|---|---|---|---|---|
| Women | Men | Women | Men | Women | Men | |
| AT | 35.9 | 43.8 | 35.9 | 43.8 | 0.0 | 0.0 |
| BE | 55.2 | 55.4 | 54.7 | 57.7 | 0.6 | −2.3 |
| BG | 21.8 | 21.6 | 21.8 | 21.6 | 0.0 | 0.0 |
| CY | 21.3 | 22.0 | 25.4 | 23.4 | −4.1 | −1.4 |
| CZ | 27.5 | 29.1 | 27.5 | 29.6 | 0.0 | −0.4 |
| DE | 42.1 | 41.7 | 37.0 | 45.3 | 5.1 | −3.6 |
| DK | 44.7 | 48.2 | 44.6 | 47.9 | 0.2 | 0.3 |
| EE | 24.0 | 25.0 | 23.8 | 25.0 | 0.2 | 0.1 |
| EL | 30.8 | 37.8 | 31.1 | 37.7 | −0.3 | 0.1 |
| ES | 24.7 | 30.0 | 22.6 | 31.5 | 2.1 | −1.5 |
| FI | 39.9 | 43.6 | 39.9 | 43.6 | 0.0 | 0.0 |
| FR | 33.5 | 34.6 | 32.6 | 36.3 | 0.9 | −1.7 |
| HR | 24.1 | 24.1 | 24.5 | 24.2 | −0.4 | −0.1 |
| HU | 30.1 | 31.7 | 30.1 | 31.7 | 0.0 | 0.0 |
| IE | 40.7 | 43.3 | 38.6 | 45.0 | 2.2 | −1.7 |
| IT | 38.9 | 45.9 | 39.5 | 46.6 | −0.6 | −0.7 |
| LT | 39.1 | 39.1 | 39.1 | 39.1 | 0.0 | 0.0 |
| LU | 44.6 | 44.6 | 41.1 | 48.1 | 3.4 | −3.5 |
| LV | 29.1 | 29.6 | 29.2 | 29.7 | 0.0 | −0.1 |
| MT | 24.1 | 27.1 | 25.6 | 30.0 | −1.5 | −2.9 |
| NL | 32.3 | 47.1 | 32.3 | 47.1 | 0.0 | 0.0 |
| PL | 28.3 | 27.3 | 27.5 | 27.5 | 0.8 | −0.2 |
| PT | 31.6 | 31.9 | 31.6 | 31.9 | 0.0 | 0.0 |
| RO | 38.2 | 37.5 | 38.2 | 37.4 | 0.0 | 0.1 |
| SE | 34.8 | 40.6 | 34.8 | 40.6 | 0.0 | 0.0 |
| SI | 37.9 | 38.1 | 37.9 | 38.1 | 0.0 | 0.0 |
| SK | 32.0 | 34.3 | 32.1 | 34.3 | −0.1 | −0.1 |
| Country | Married | Before Marriage | Difference | |||
|---|---|---|---|---|---|---|
| Women | Men | Women | Men | Women | Men | |
| AT | 85.0 | 69.9 | 85.0 | 69.9 | 0.0 | 0.0 |
| BE | 83.9 | 72.5 | 86.0 | 74.9 | −2.2 | −2.5 |
| BG | 81.3 | 78.0 | 81.5 | 78.2 | −0.2 | −0.2 |
| CY | 75.2 | 62.9 | 78.8 | 67.7 | −3.5 | −4.9 |
| CZ | 75.0 | 63.0 | 71.8 | 60.4 | 3.1 | 2.6 |
| DE | 86.3 | 76.4 | 84.7 | 75.4 | 1.6 | 1.0 |
| DK | 84.2 | 76.0 | 84.5 | 76.1 | −0.3 | −0.1 |
| EE | 79.6 | 74.6 | 79.5 | 74.5 | 0.0 | 0.0 |
| EL | 75.3 | 62.7 | 76.9 | 63.2 | −1.6 | −0.5 |
| ES | 76.1 | 62.4 | 75.2 | 62.4 | 0.9 | 0.0 |
| FI | 82.3 | 74.9 | 82.3 | 74.9 | 0.0 | 0.0 |
| FR | 87.9 | 80.9 | 88.0 | 81.0 | −0.1 | −0.1 |
| HR | 76.1 | 65.9 | 76.2 | 66.1 | −0.1 | −0.2 |
| HU | 69.9 | 60.3 | 69.9 | 60.3 | 0.0 | 0.0 |
| IE | 73.8 | 62.5 | 73.2 | 62.2 | 0.6 | 0.3 |
| IT | 78.2 | 64.8 | 77.4 | 64.4 | 0.8 | 0.4 |
| LT | 81.6 | 74.1 | 81.6 | 74.1 | 0.0 | 0.0 |
| LU | 92.3 | 86.0 | 92.1 | 86.3 | 0.1 | −0.3 |
| LV | 76.7 | 68.5 | 76.7 | 68.6 | 0.0 | 0.0 |
| MT | 68.4 | 55.8 | 66.5 | 54.6 | 1.9 | 1.1 |
| NL | 84.9 | 74.3 | 84.9 | 74.3 | 0.0 | 0.0 |
| PL | 69.0 | 58.9 | 68.9 | 59.2 | 0.2 | −0.4 |
| PT | 87.8 | 81.4 | 87.8 | 81.4 | 0.0 | 0.0 |
| RO | 72.2 | 61.8 | 72.6 | 61.7 | −0.3 | 0.1 |
| SE | 78.2 | 71.9 | 78.2 | 71.9 | 0.0 | 0.0 |
| SI | 77.5 | 72.9 | 77.5 | 72.9 | 0.0 | 0.0 |
| SK | 75.0 | 68.0 | 74.0 | 67.4 | 1.0 | 0.6 |
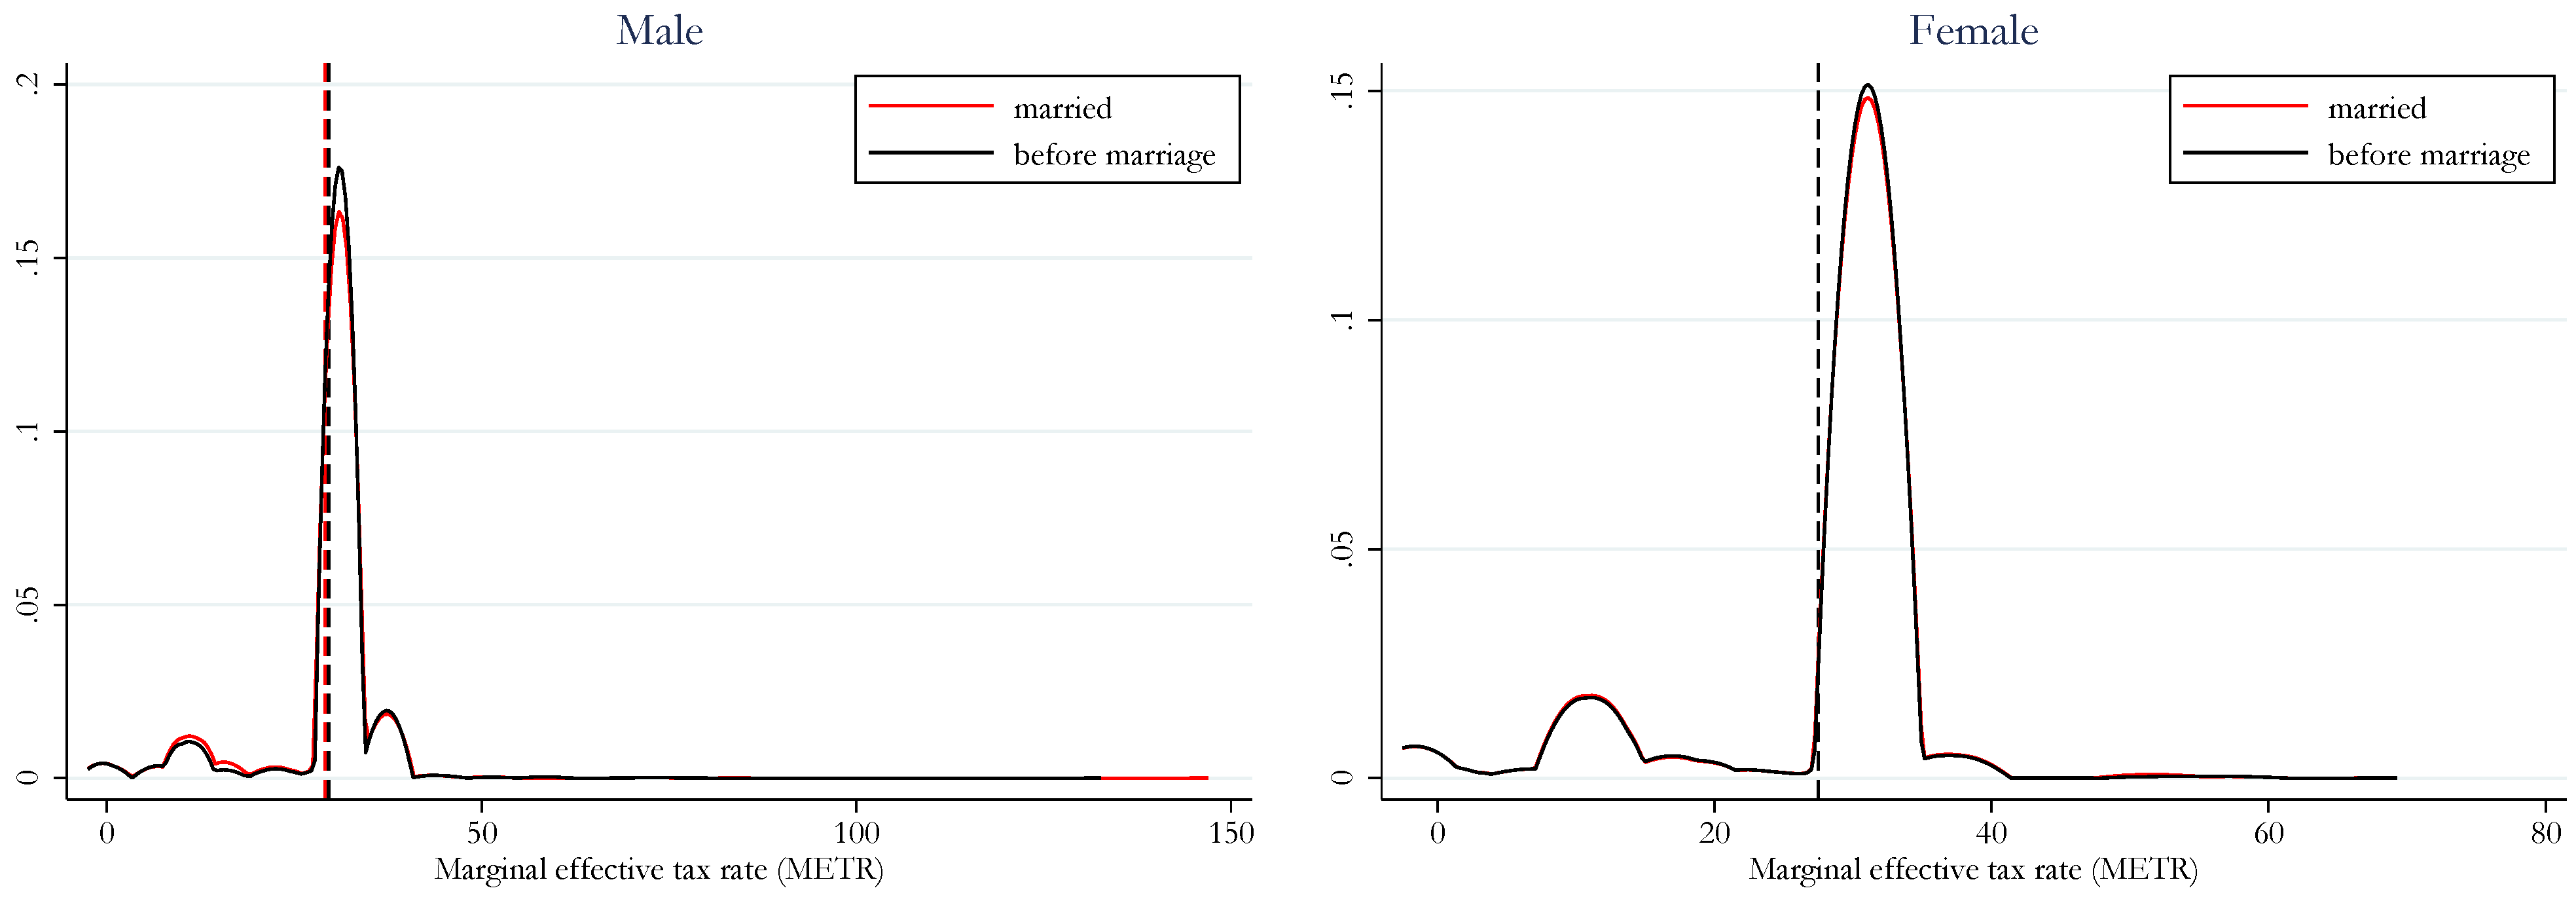
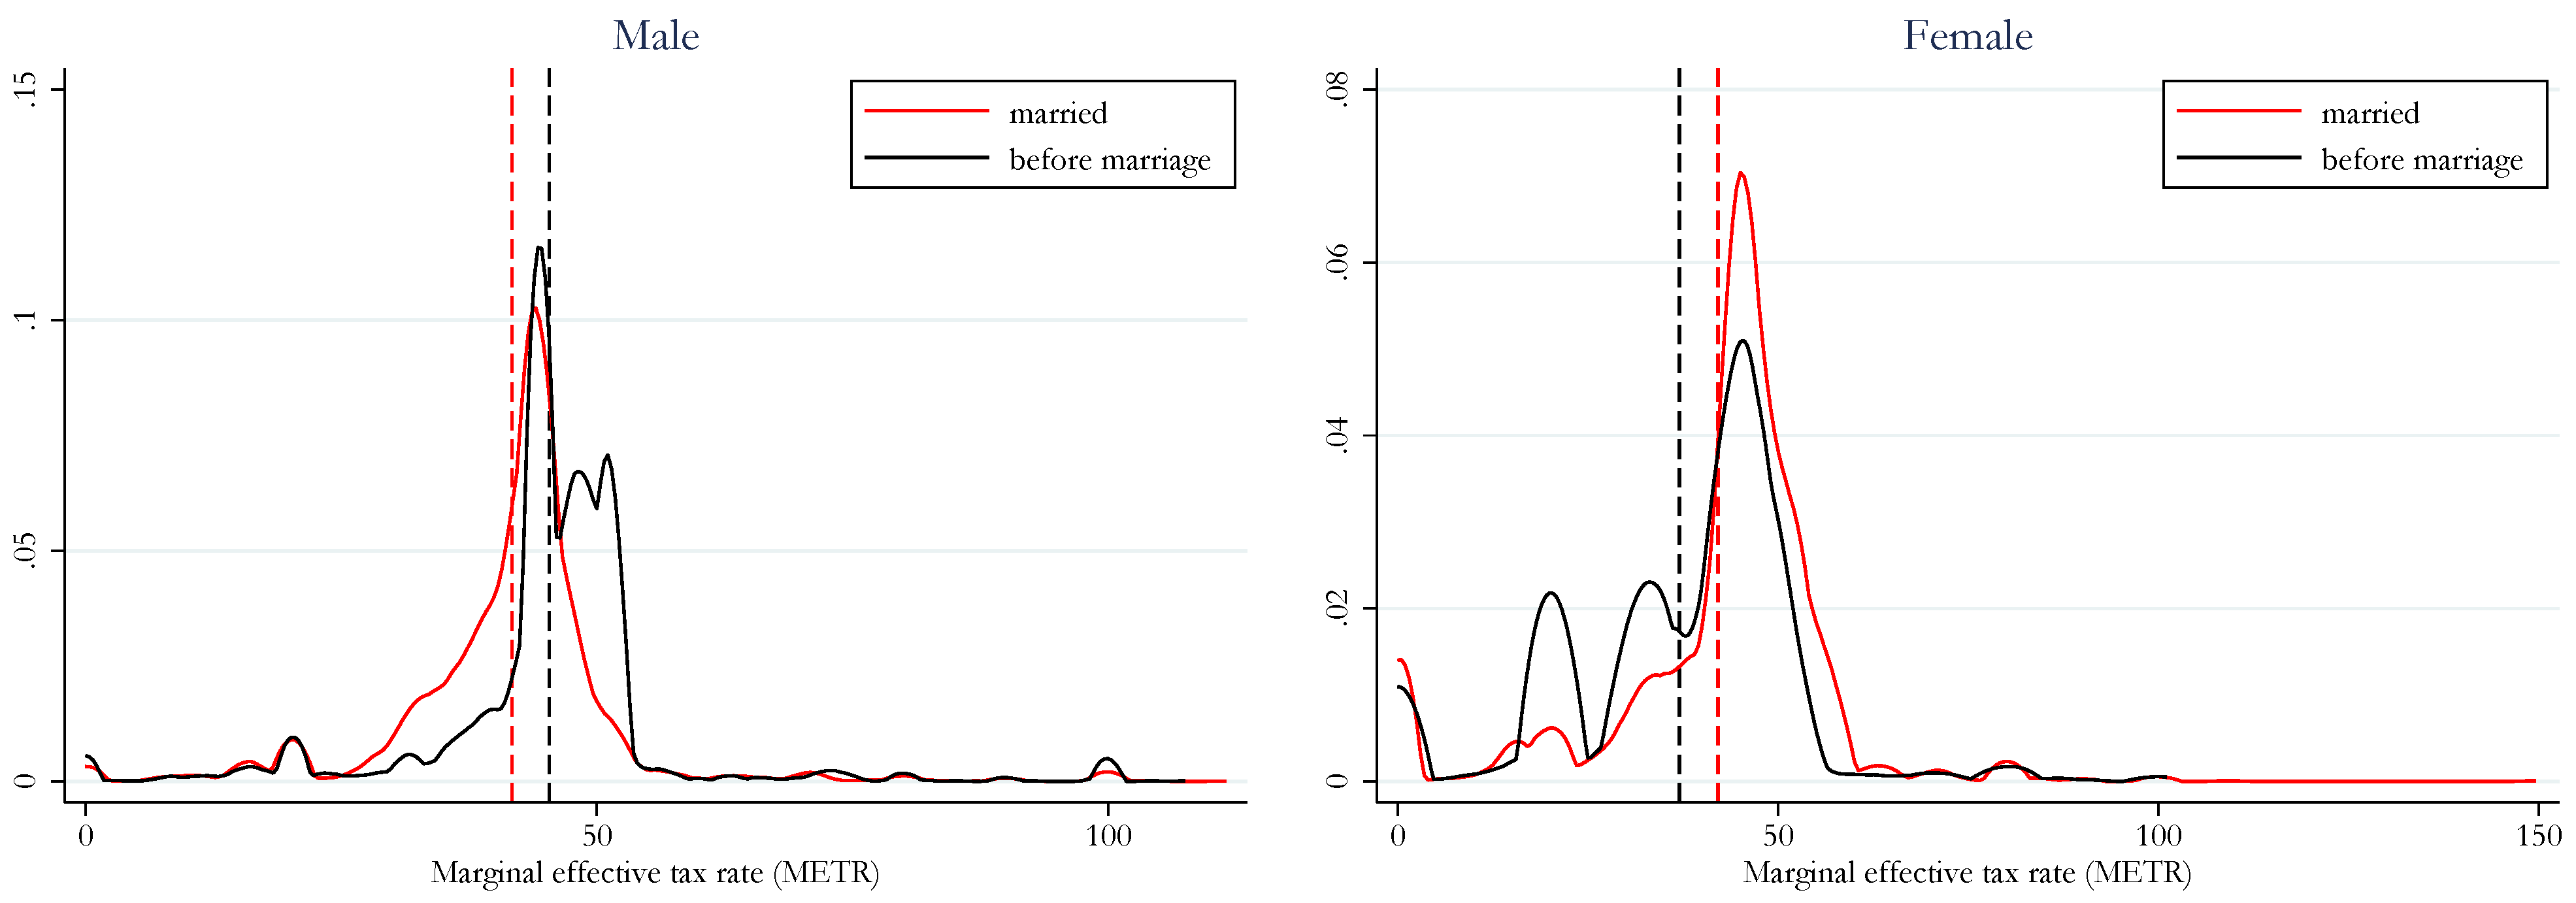
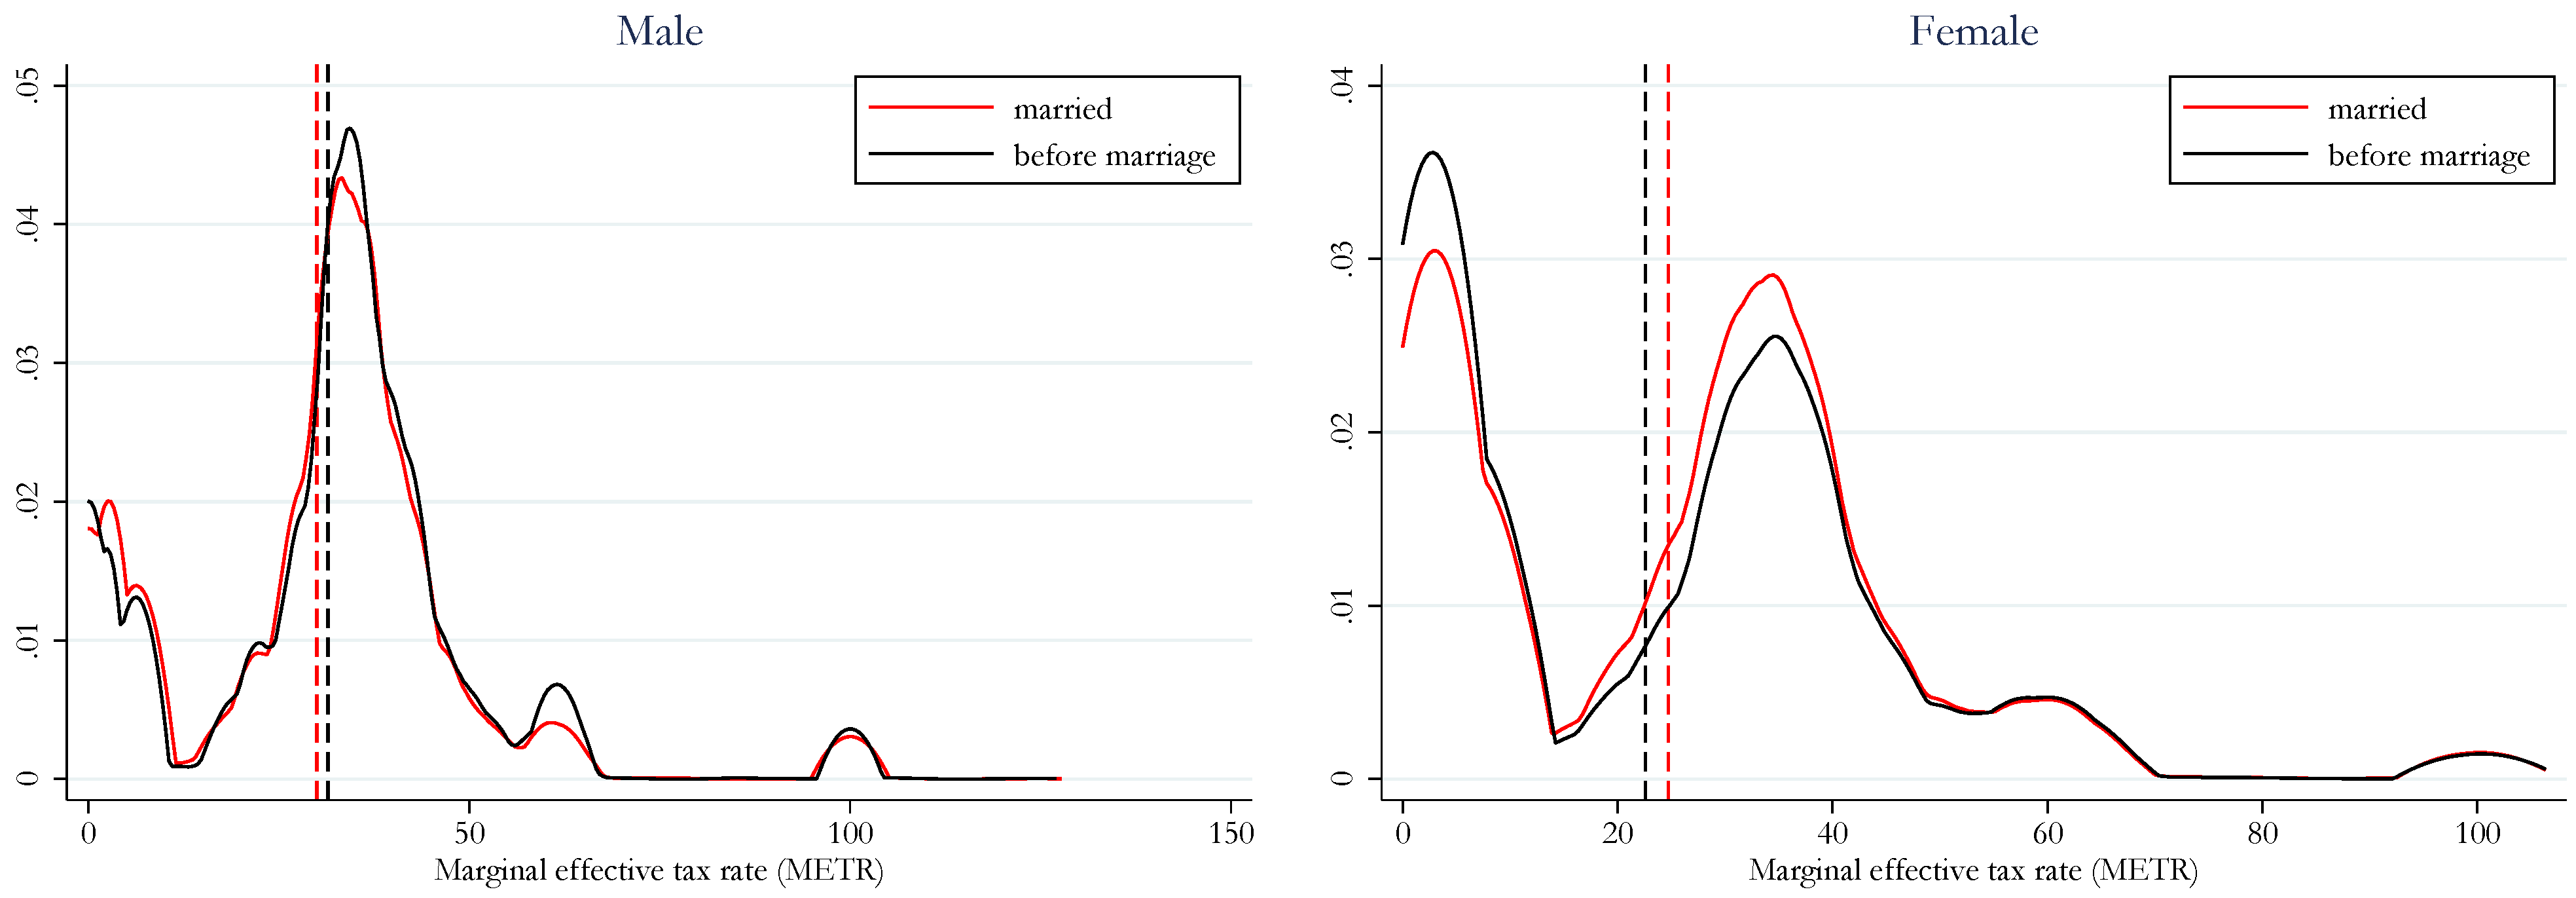
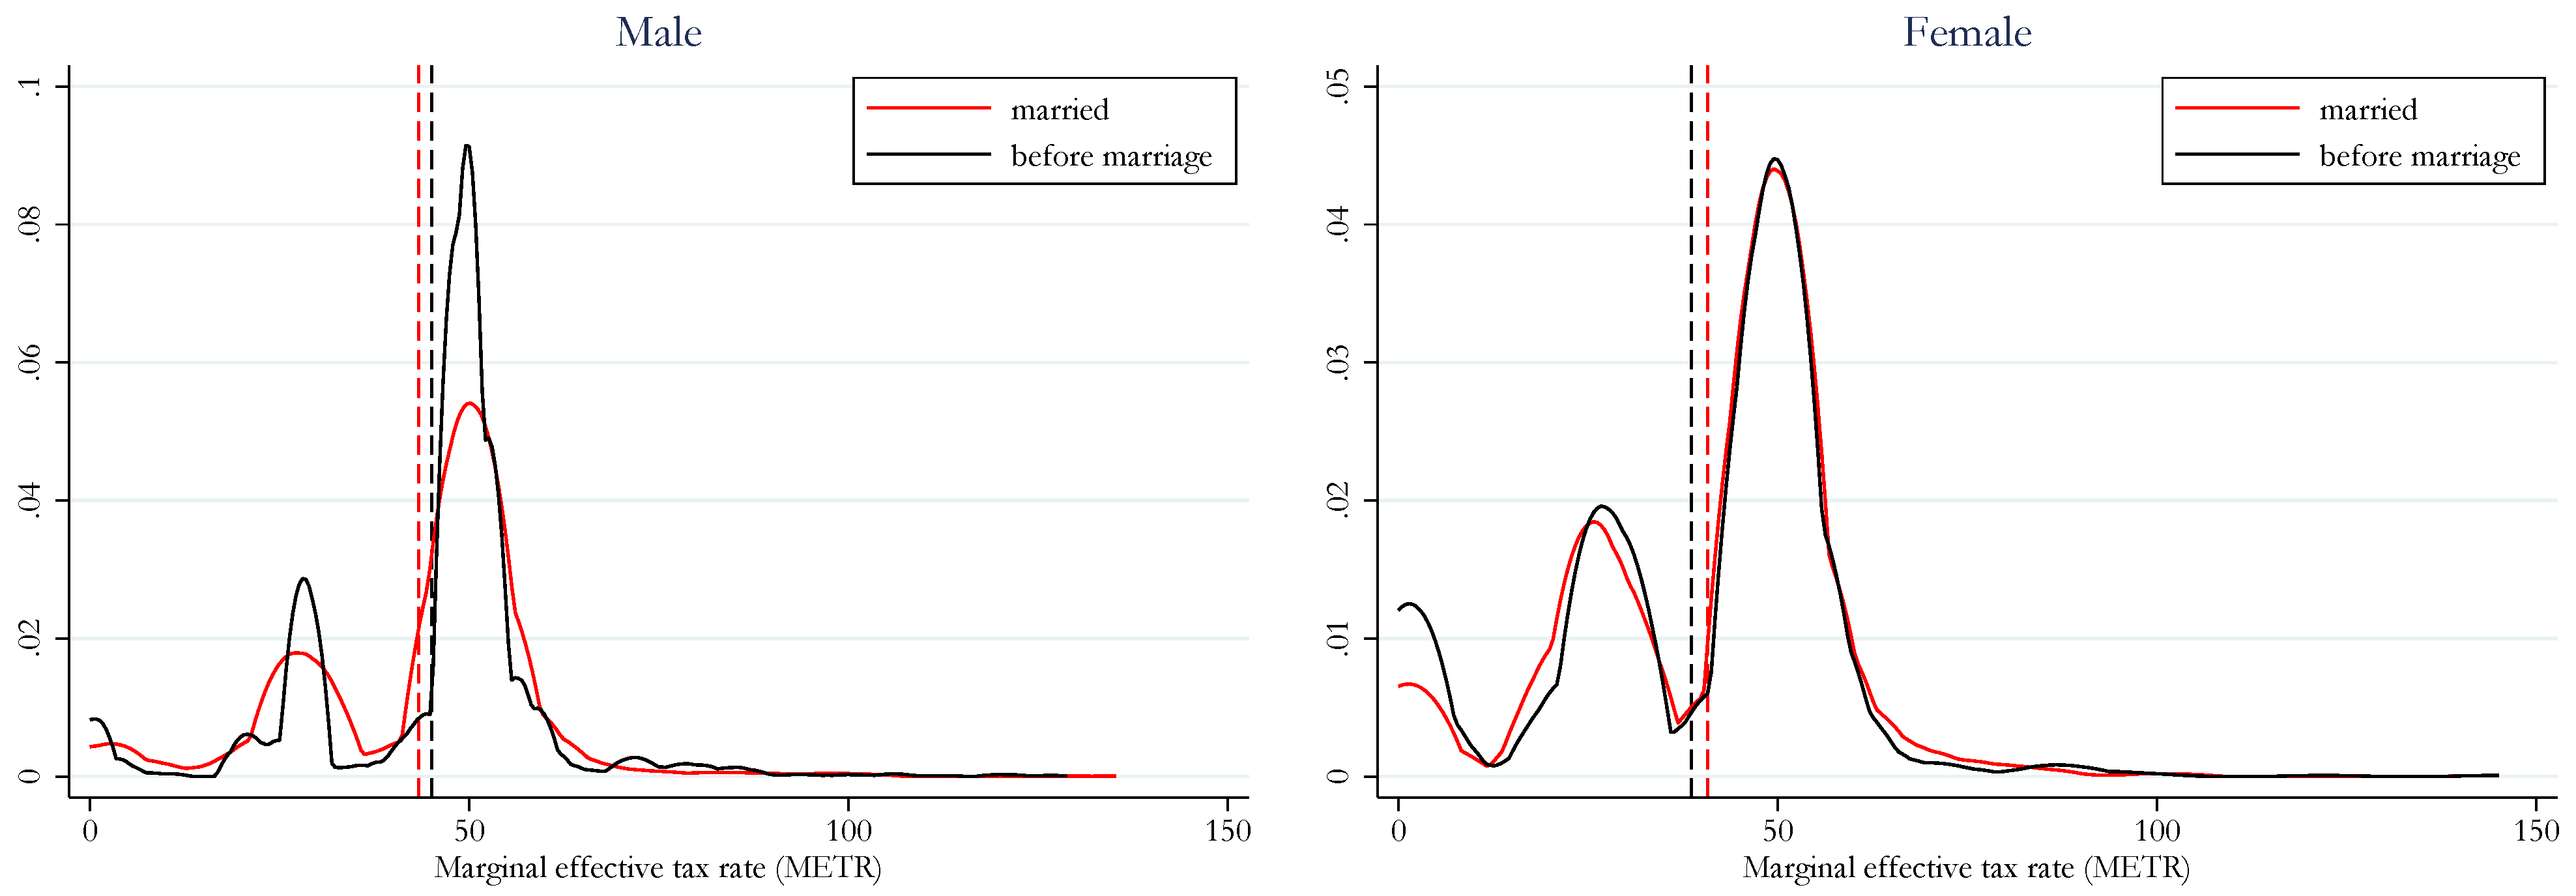
Appendix B. The Distribution of METRs and NRRs


| 1 | At the global level, the estimations tend to be much higher. i.e., Madgavkar et al. (2016) estimate that if women were to participate in the economy identically to men, they could add as much as 26% to the annual global GDP in 2025. |
| 2 | Explicitly, for example, until 1993, in the UK there was a “married man’s allowance”; Greece gave a husband an extra allowance irrespective of wife’s income; until 1984, in the Netherlands married men were granted a higher tax-free allowance compared to married women. When filing a joint tax return, for instance, in France (until 1983), UK (until 1990), Ireland (1993), Greece (until 2018) it used to be a husband who had to submit the tax declaration (Coelho et al. 2022; McCaffery 2009; Stotsky 1996). |
| 3 | Nowadays globally there are less examples (an less so in Europe) of explicit different treatment of women and men and this treatment seems to have shifted from favouring men to being more equally balanced across countries, but not within countries (Coelho et al. 2022). |
| 4 | The OECD report notes that more than half of 23 countries surveyed in 2021 indicated that there was a risk of implicit bias in their tax systems, although only 16 countries reported having assessed this. |
| 5 | In addition, it was viewed that a traditional family has an intrinsic and extrinsic value both to individuals and the society, therefore it should be encouraged and supported also by the tax system. |
| 6 | Separate taxation was in three out of ten Member States: Denmark, Greece and Italy. However all three countries had allowances or reductions for spouses (in Denmark only if one spouse had no income; in Italy if a spouse had income below a certain threshold and in Greece irrespective of spouse’s income). |
| 7 | |
| 8 | In Ireland, married couples were automatically jointly assessed before 2000 but could elect for single assessment. Some reforms were enacted between 2000–2002 to transition to individual taxation, however the transition was halted before it finished, leaving with a hybrid partly-joint system. A married couple can share a portion of their standard rate band but not all of it (Doorley 2018). In Luxembourg before 2018, married taxpayers were compulsorily taxed collectively with their spouses, but now married taxpayers can choose between either a pure individual taxation, an individual taxation with reallocation of income, or a collective taxation. In Estonia before 2017, a married couple had an option to file a joint tax report, which was beneficial if one had unused tax allowances. Since 2017, joint declarations were abolished, although a few tax allowances can still be shared between spouses. In the Netherlands, partners with low or no taxable income may be entitled to tax credits depending on the income of a higher earning partner. Starting in 2009, the payment of the general tax credit to a spouse with a low or no income is being reduced to zero within 15 years. In 2020, the general tax credit to a spouse was reduced by 80 percent compared to 2009. Until 2013 in Slovakia, the only condition to get a spouse allowance was income below the basic tax allowance. Currently, it is also conditioned on taking care of small children, having a disability or the obligation to register at Labour office (Christl et al. 2021). |
| 9 | |
| 10 | Following the methodology of Christl et al. (2021). |
| 11 | Since fiscal year 2018, married taxpayers can opt either for joint or individual taxation. In EUROMOD it is assumed that married taxpayers opt for joint income taxation because it is more beneficial. |
| 12 | The only exception is Belgium, where we used EU-SILC data from 2018. The monetary values of market incomes are uprated to 2019 using specific uprating factors. |
| 13 | It should be noticed that the “before marriage” scenario does not reflect the real situation before marriage, because it is built based on all the individual characteristics (e.g., labour market status, number of working hours) observed after marriage. Hence, it already includes potential adjustments to the labour supply due to change in work incentives after marriage. |
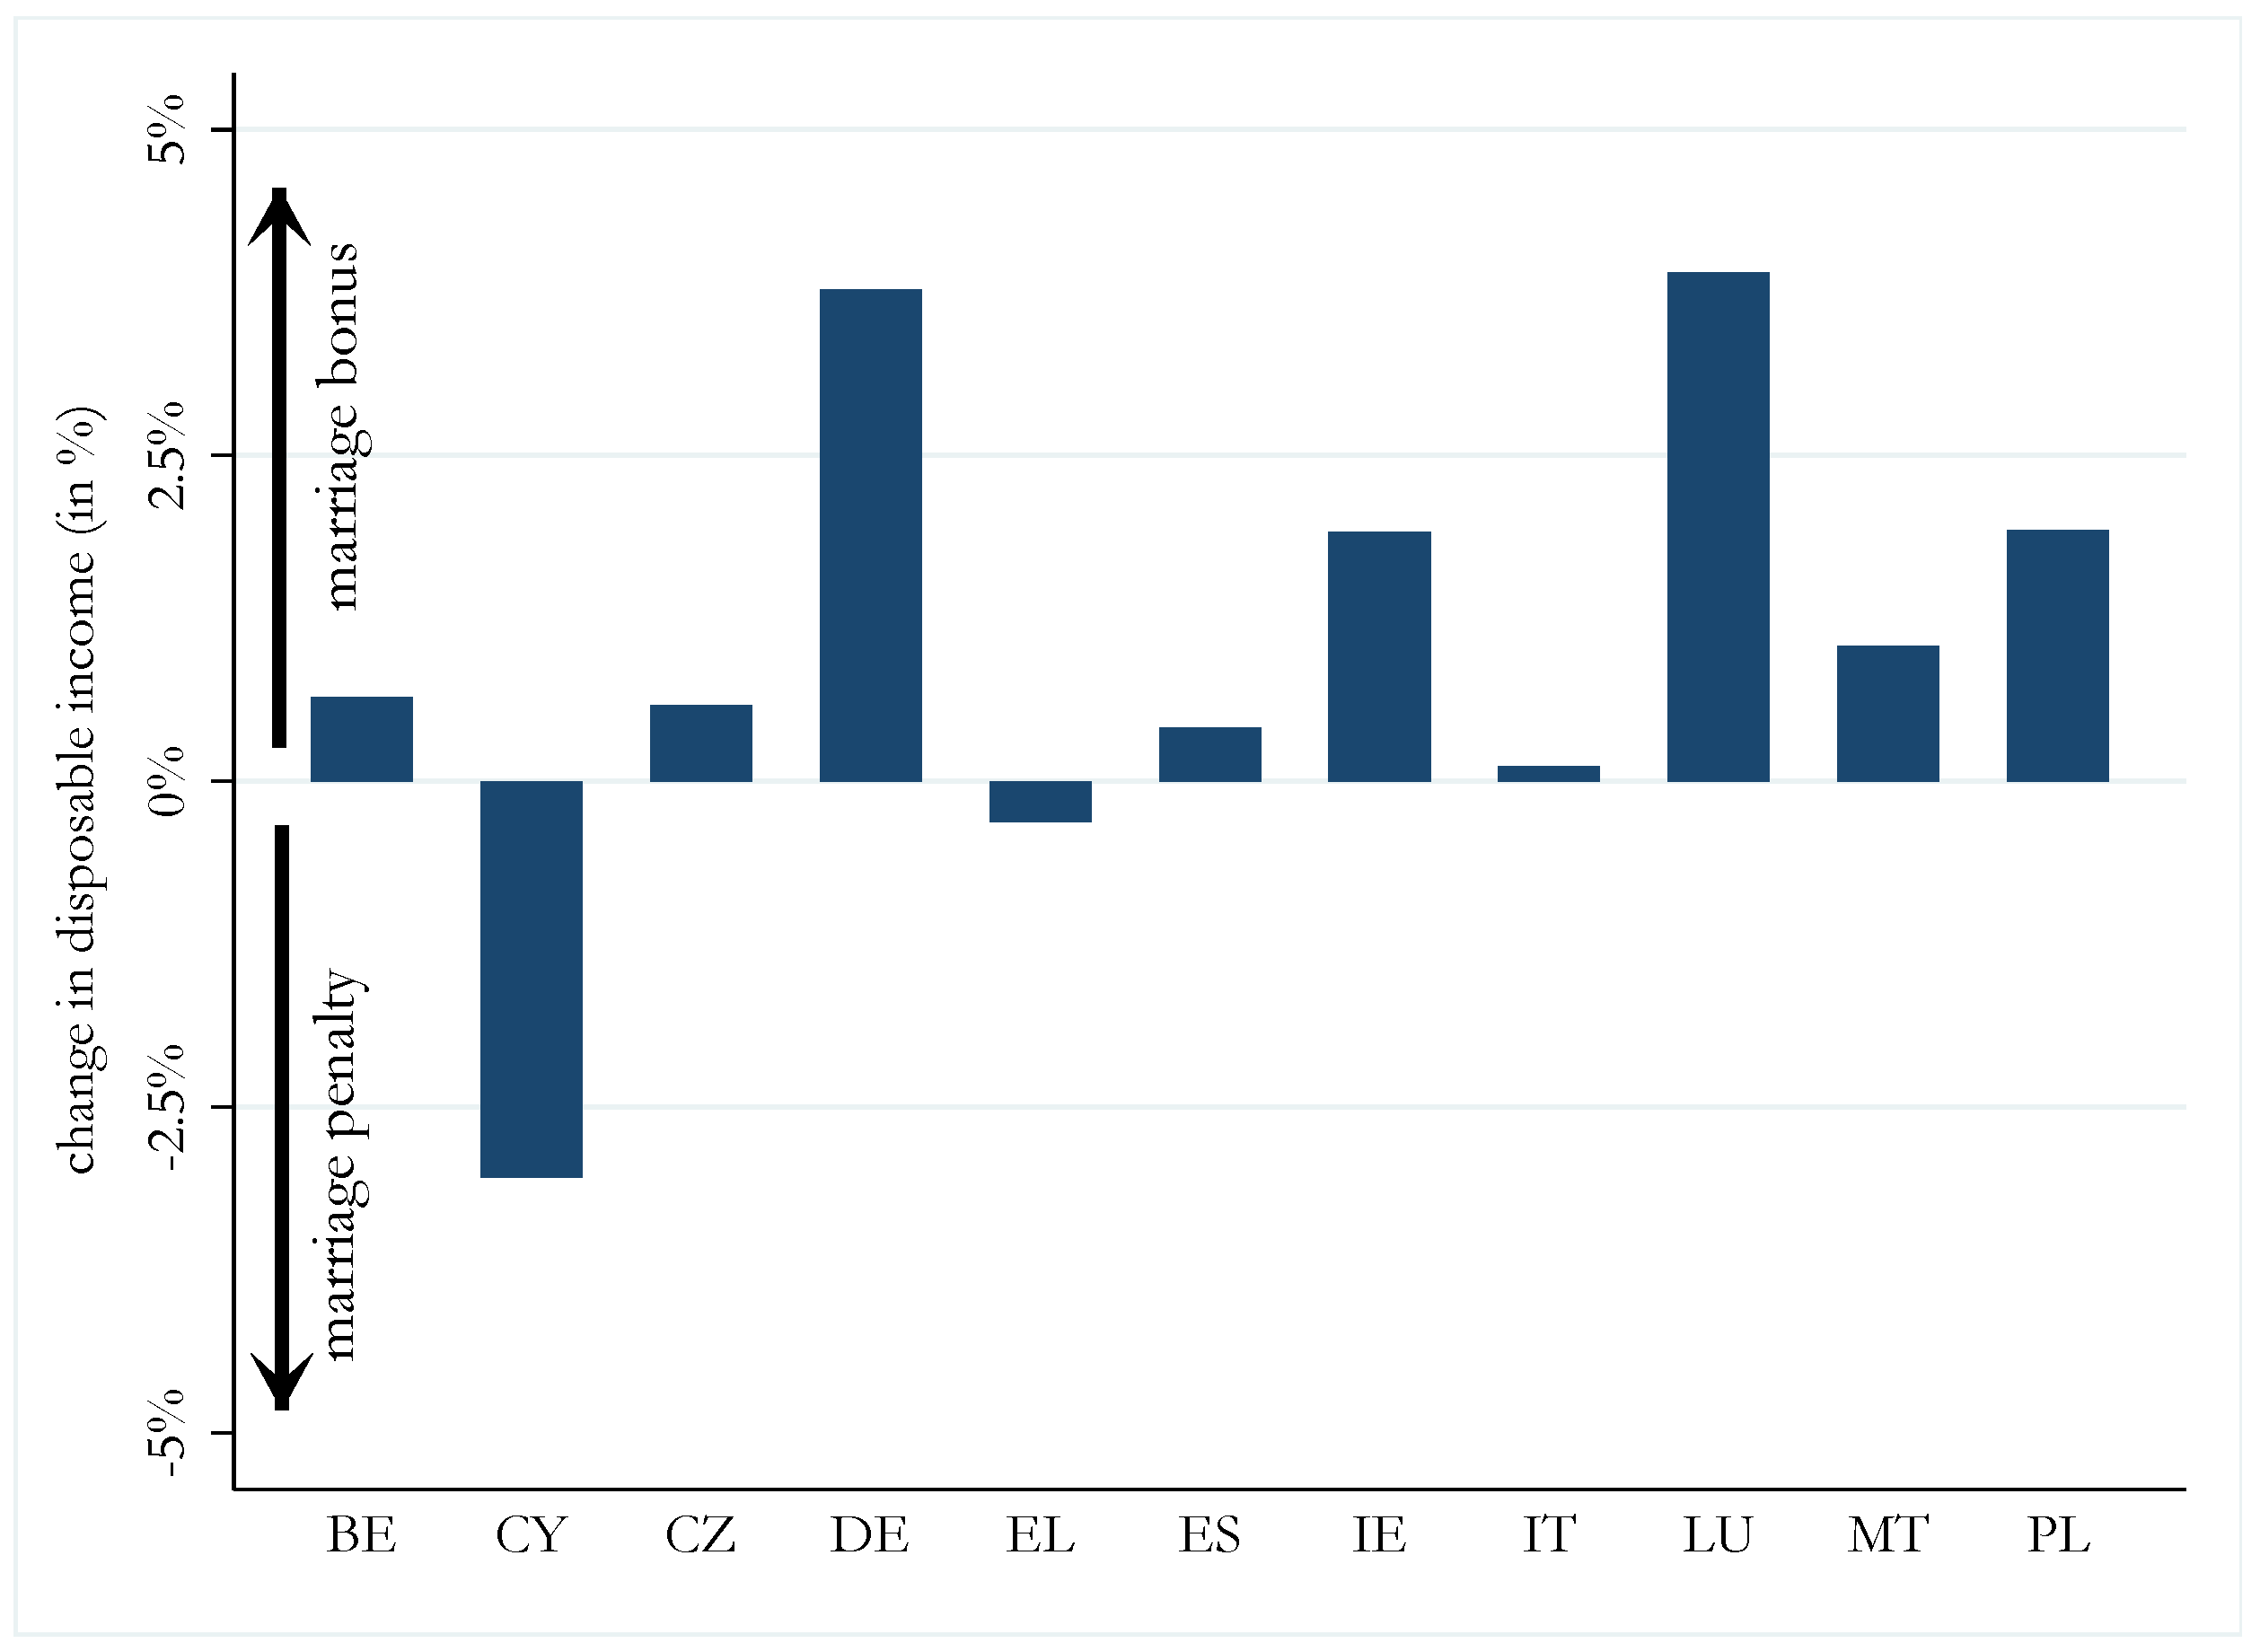
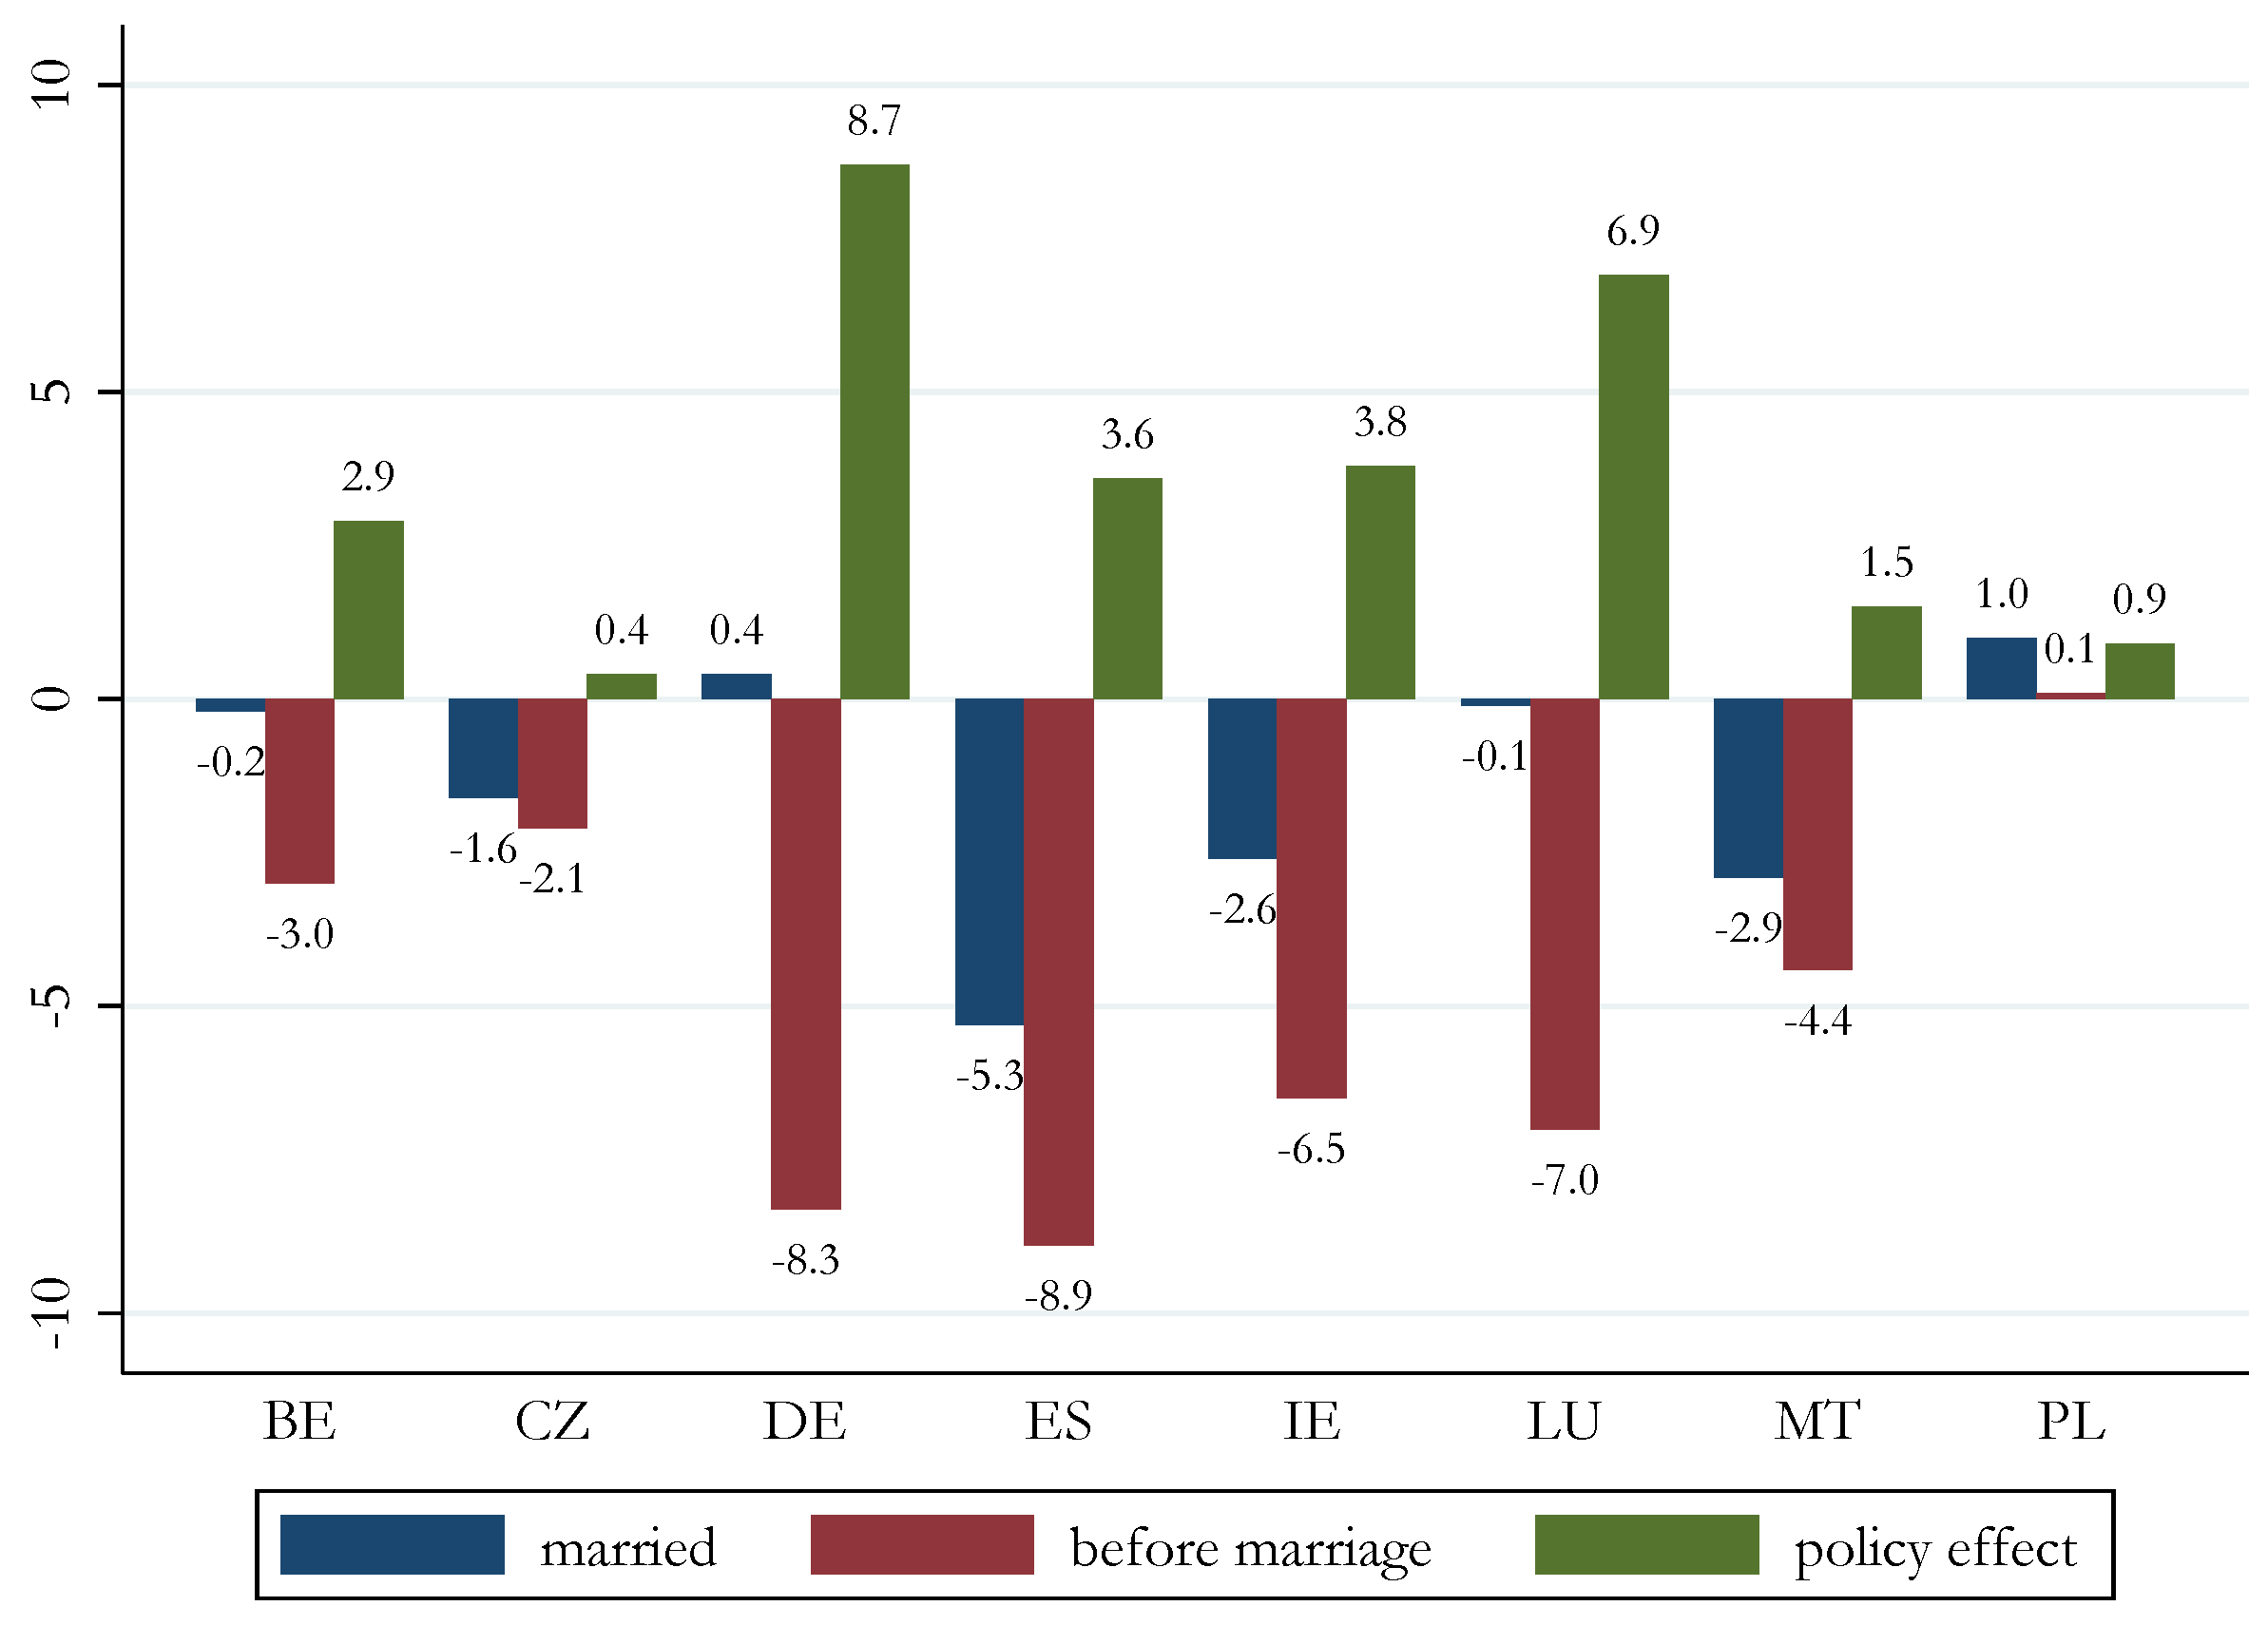
| 14 | Table A3 shows the average METR for all countries. In countries with very minor differences related to the tax-benefit system between married and cohabiting couples, the difference in the average METR before and after marriage is close to 0. In Cyprus, where marriage leads to a reduction in means-tested benefits Christl et al. (2021), we observe a quite large reduction in the average METR both for men and women. |
| 15 | |
| 16 | The only exception is Malta, where the average METR is higher before the marriage. This is due to the means-tested social assistance, which is more generous for cohabiting couples with children than married couples with children (see Christl et al. (2021)). |
| 17 | The METR calculated by the MTR Add-on in EUROMOD assumes an increase of 3% of gross earnings. |
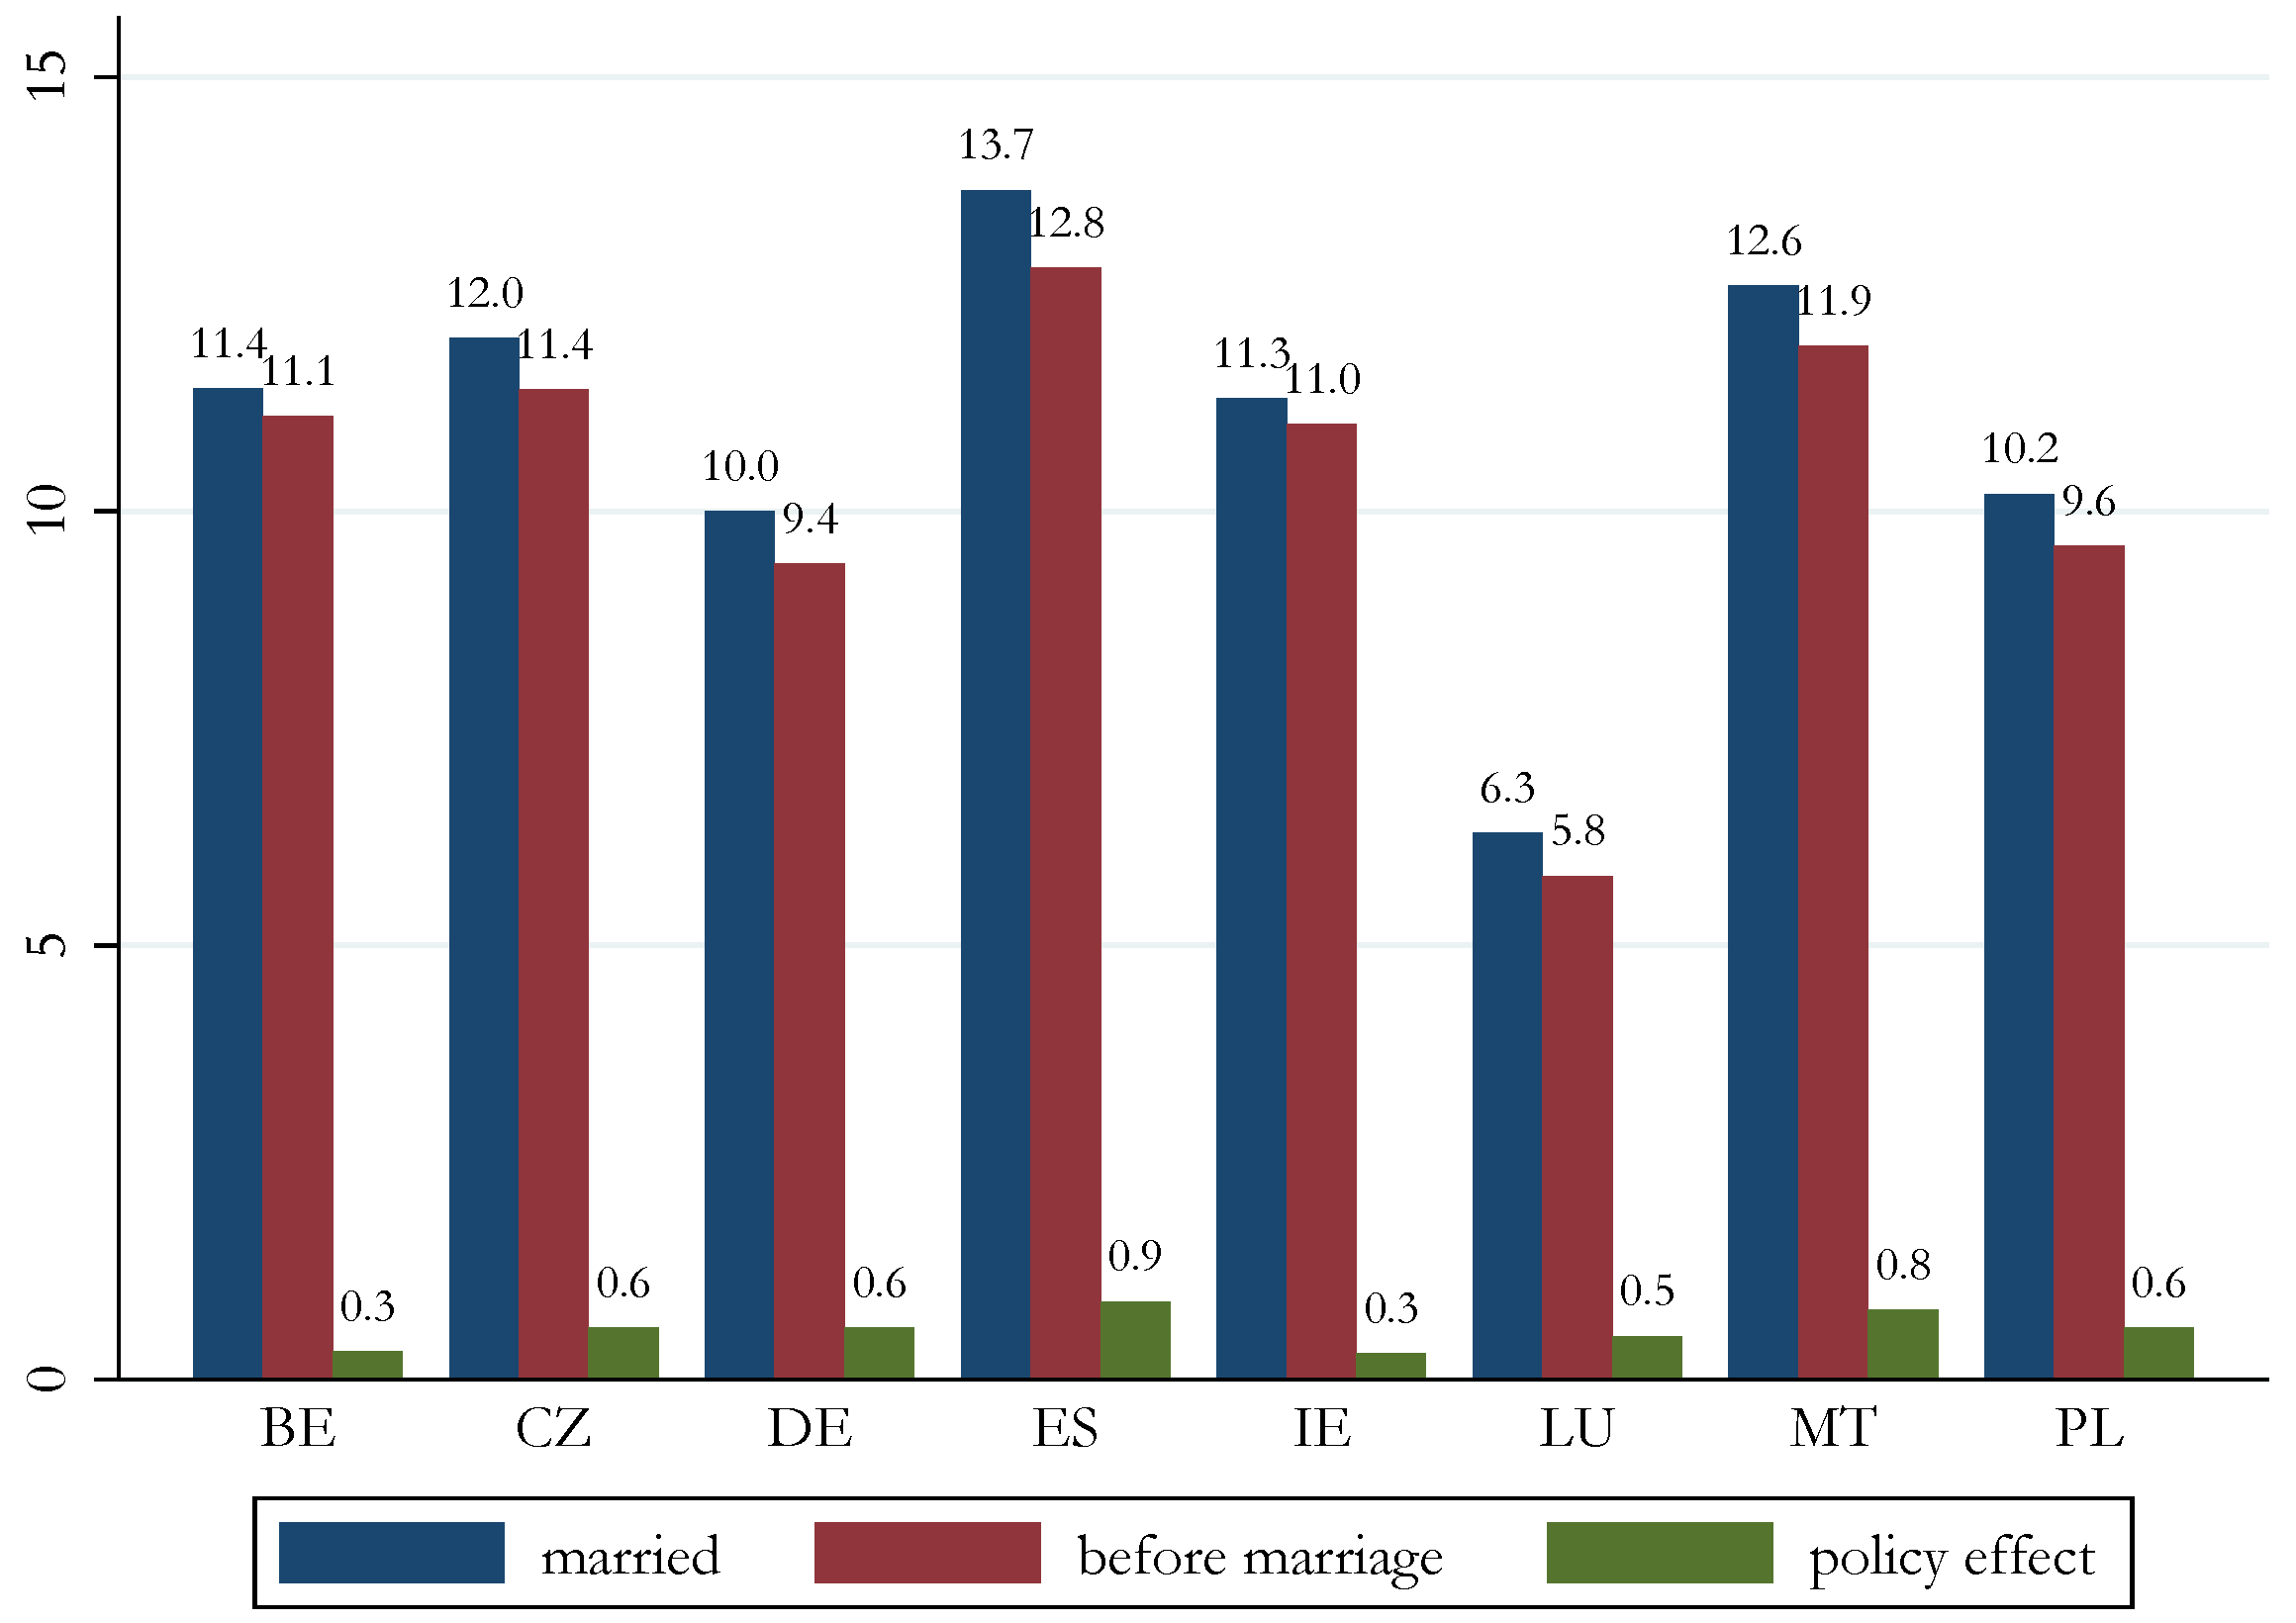
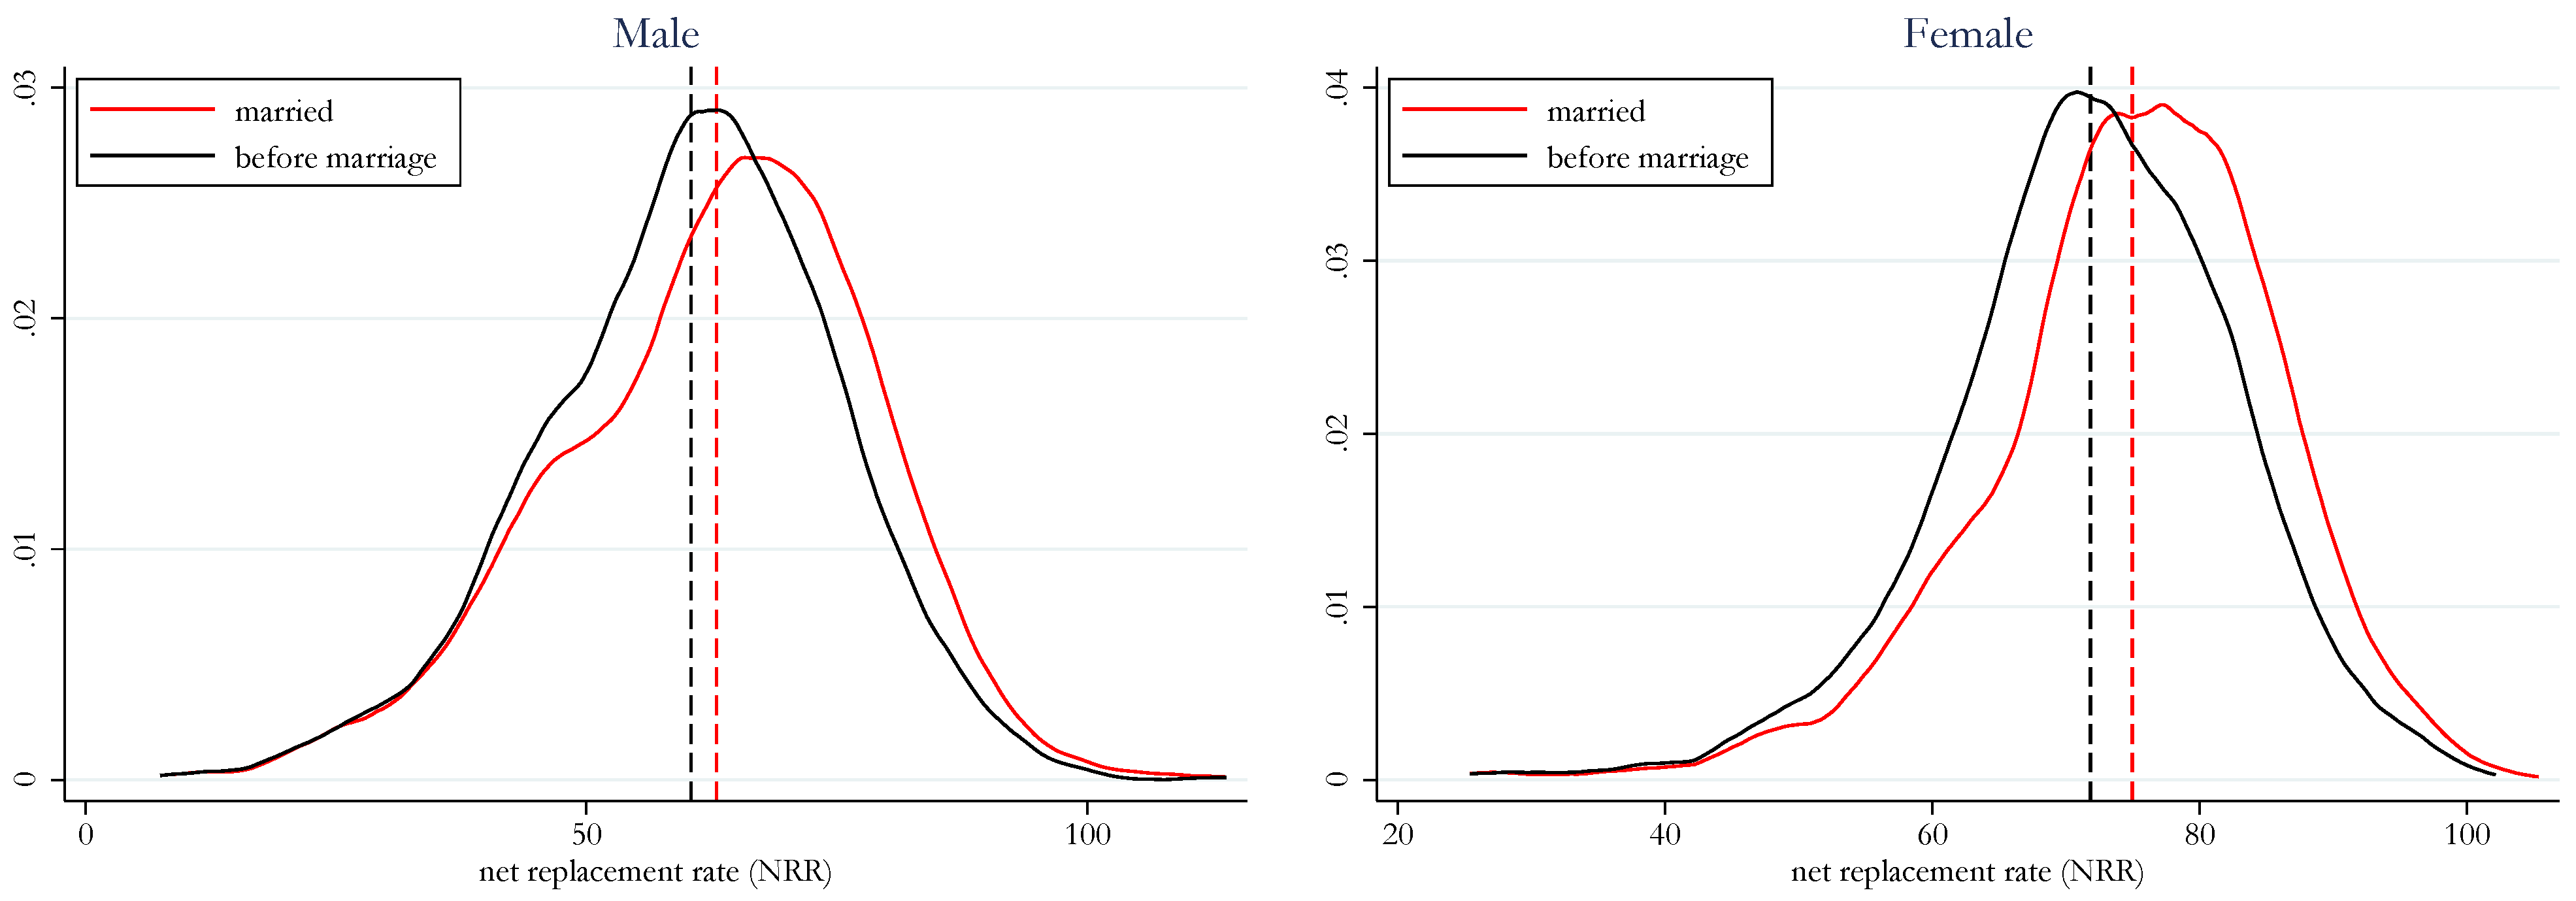
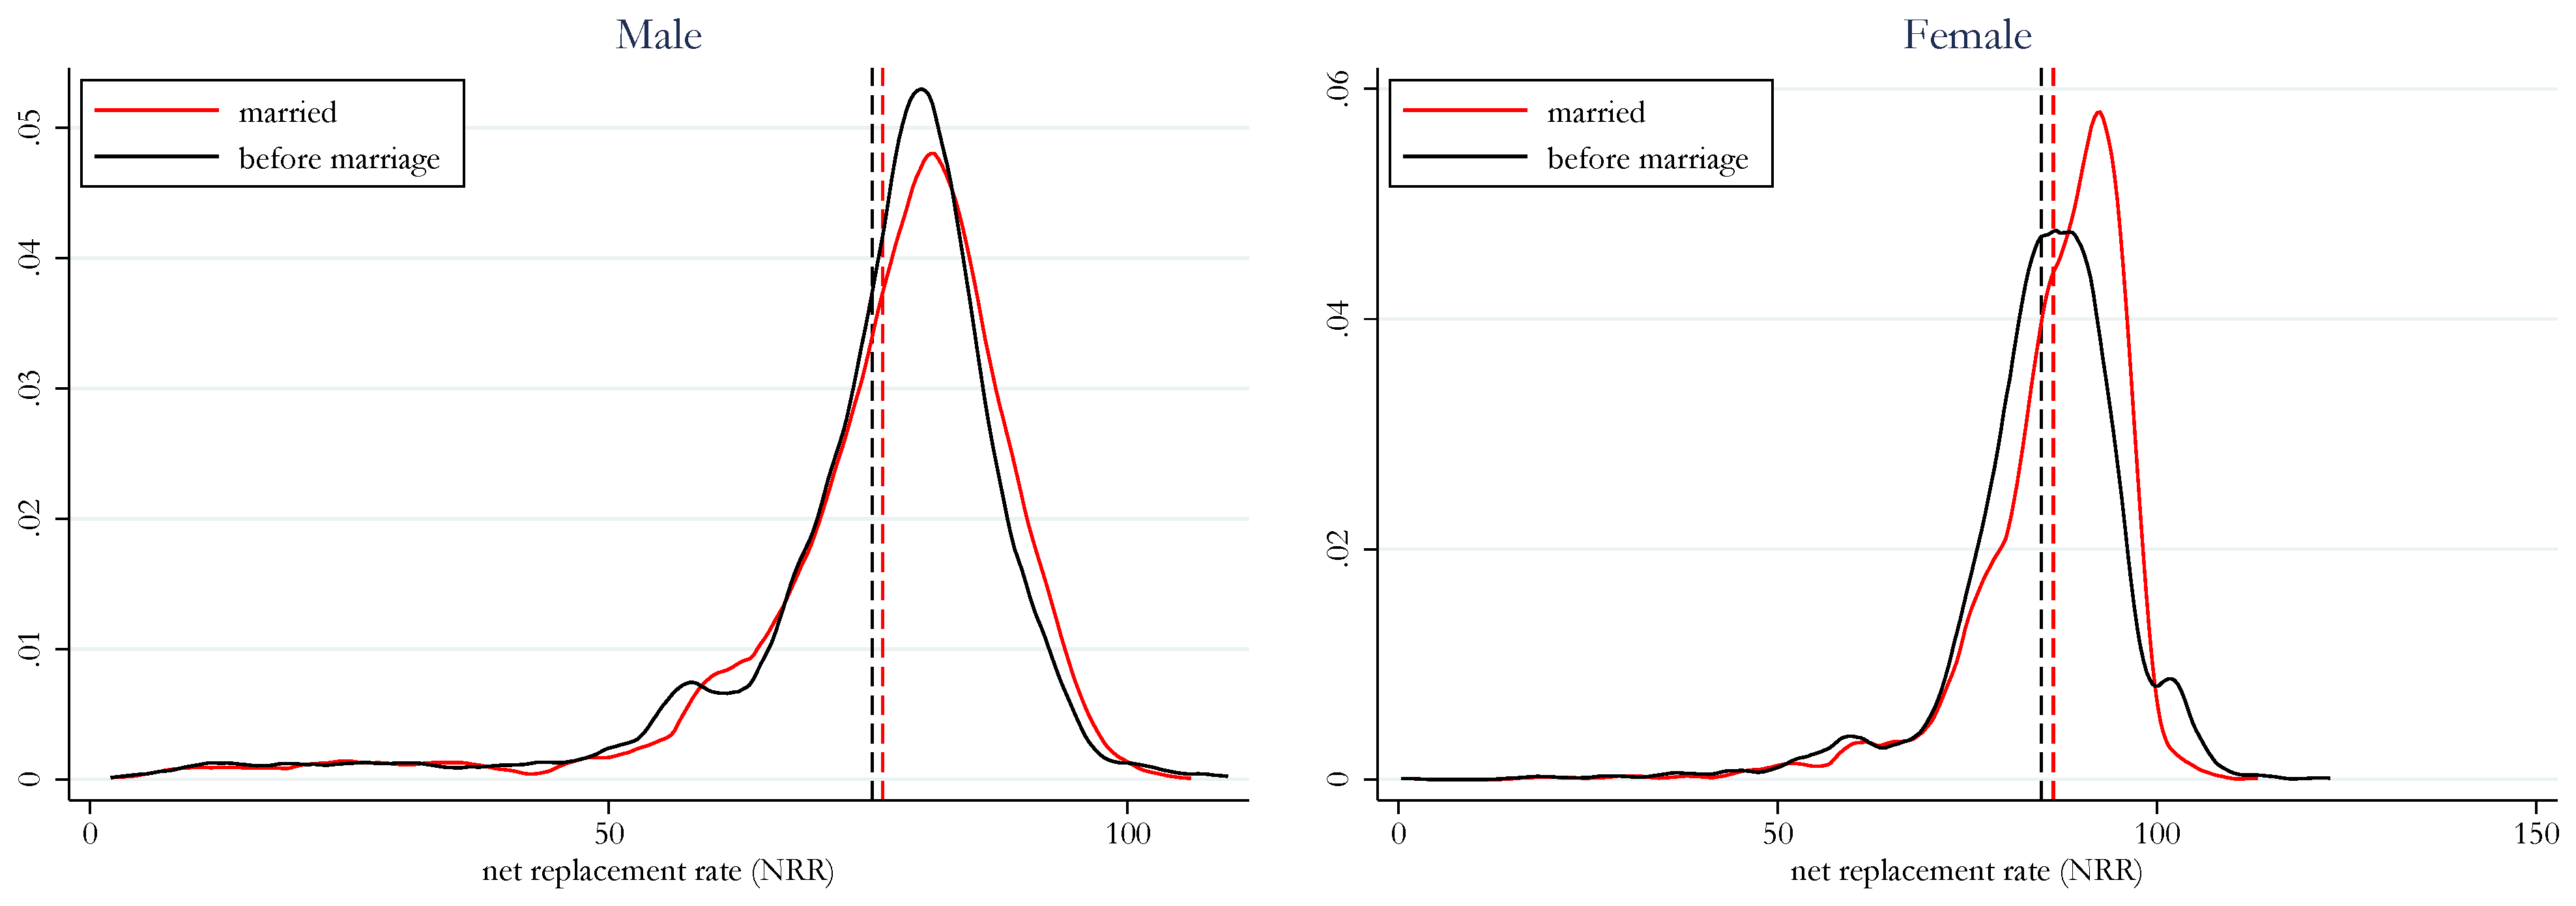
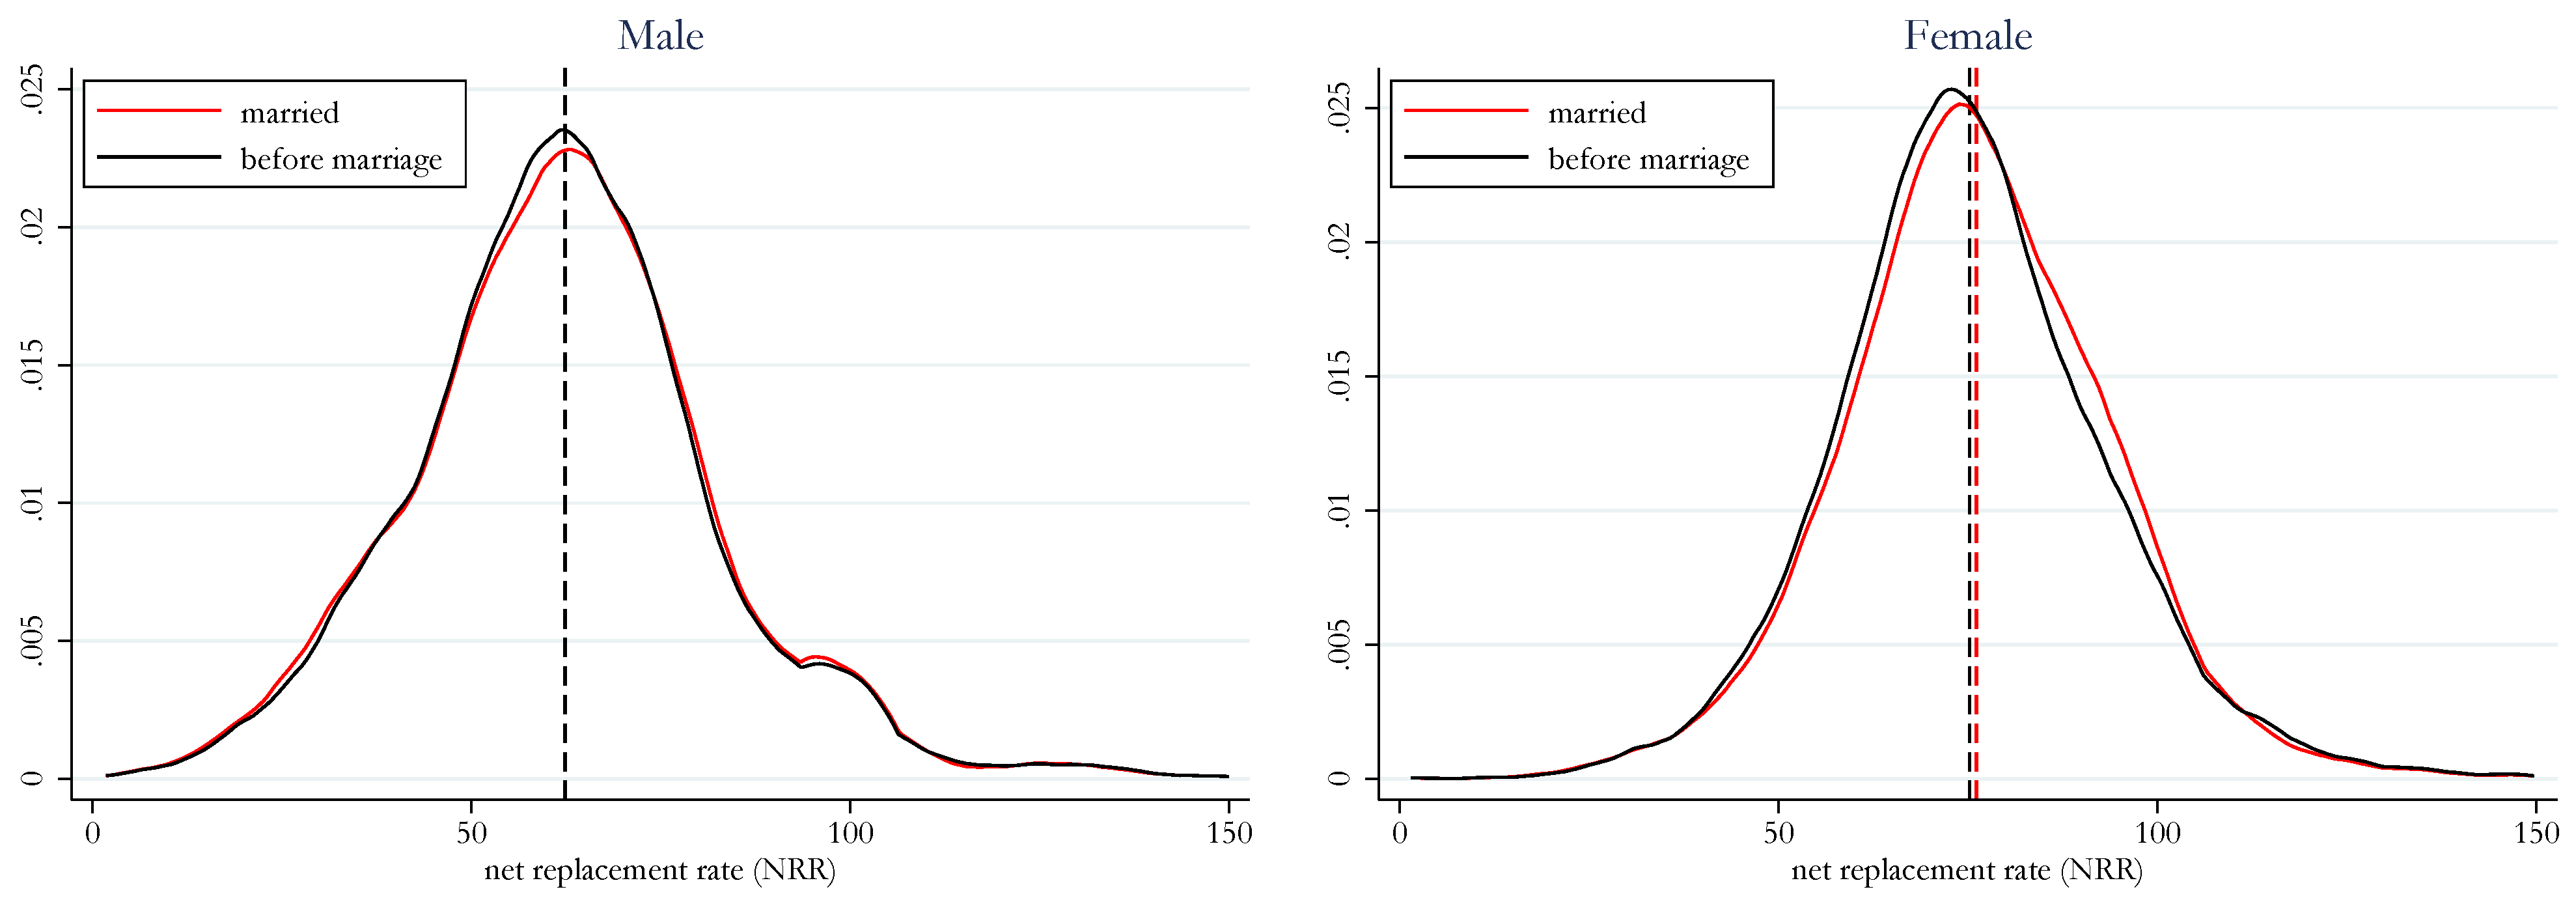
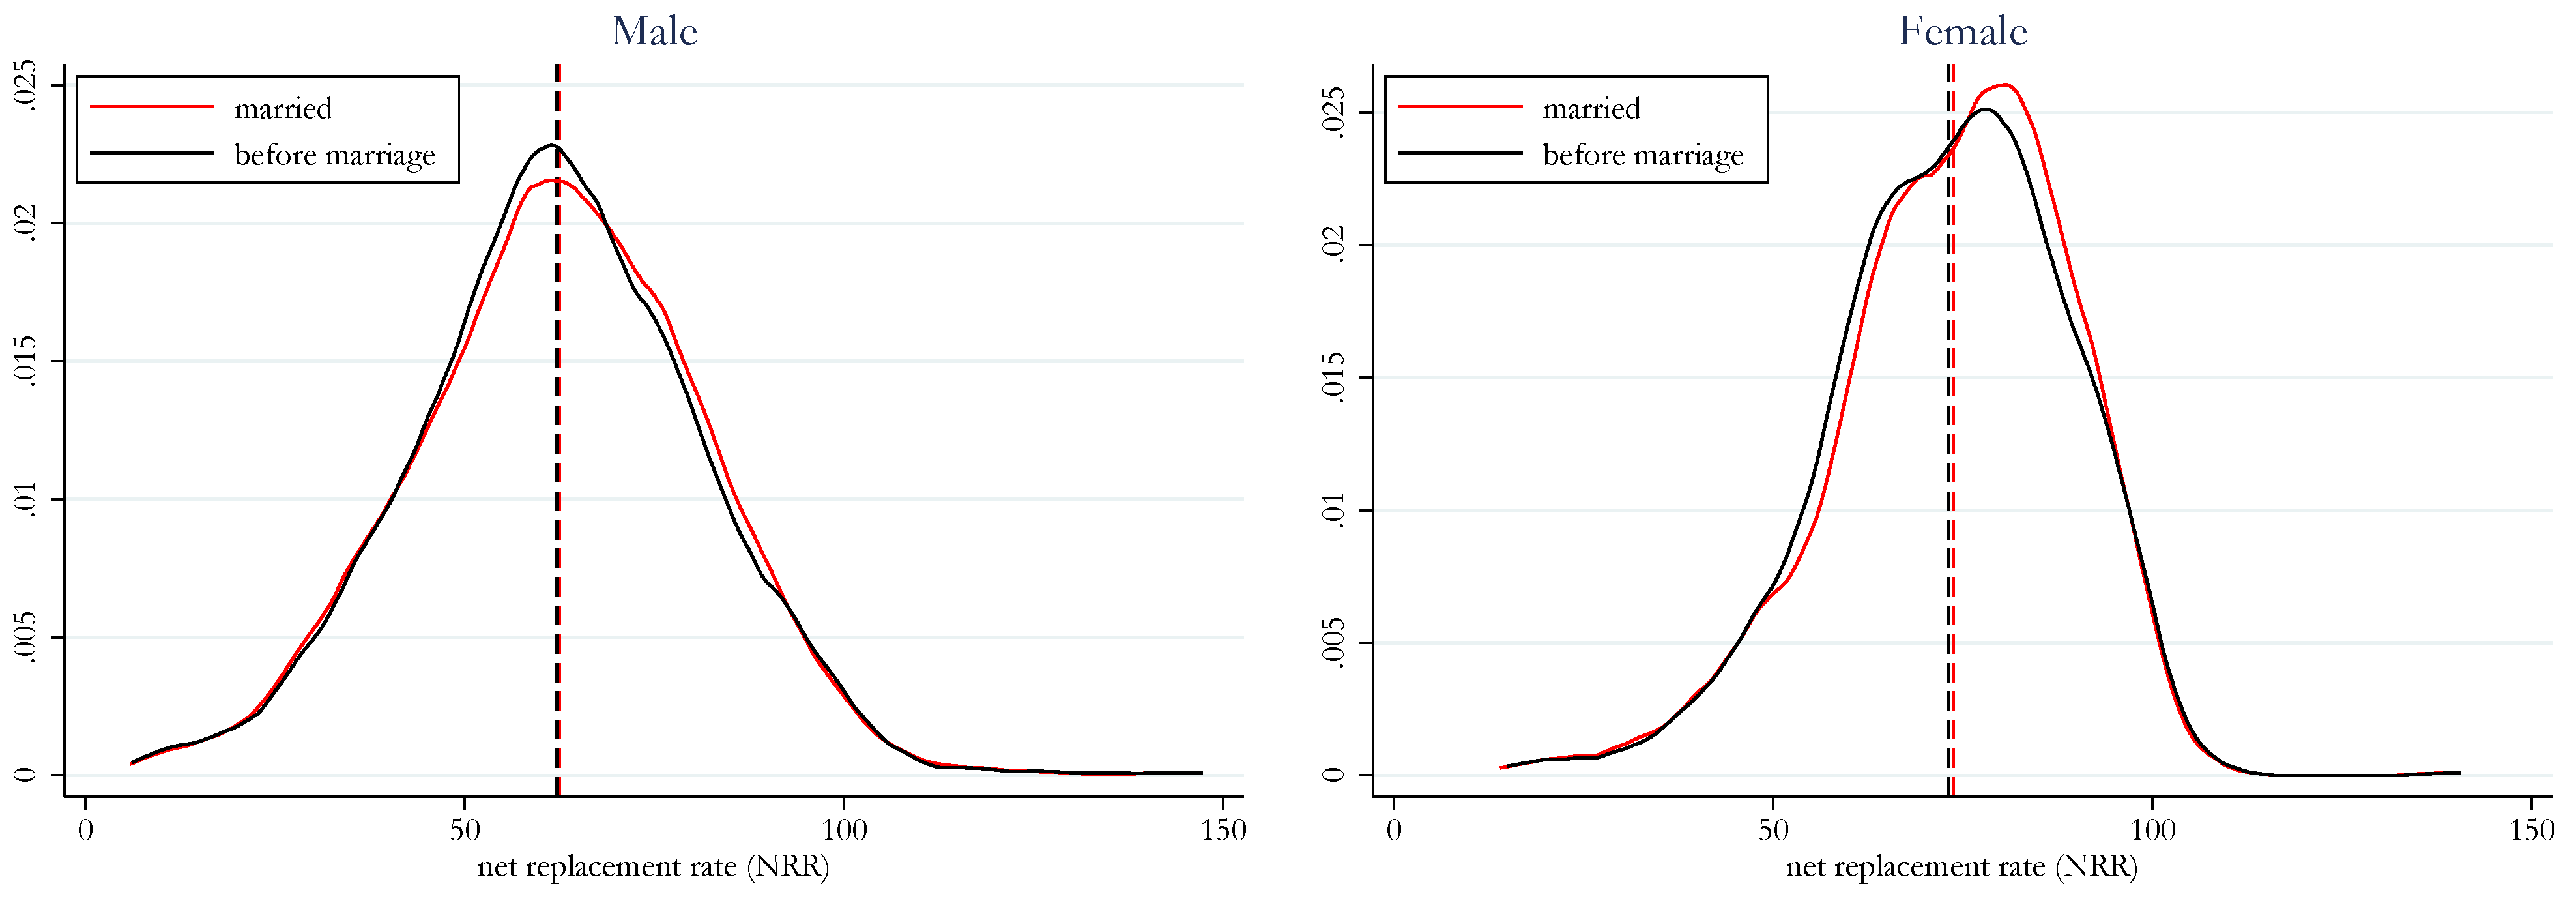
| 18 | Table A4 shows the average NRR for all EU countries. Similarly to the METR, in countries with a minor differences in the tax-benefit system between married and cohabiting couples, we do not find a large change in the NRR in case of marriage. In Cyprus and Greece, which are countries characterized by a marriage penalty (see Figure 1), we find that marriage would reduce NRR both for men and women. |
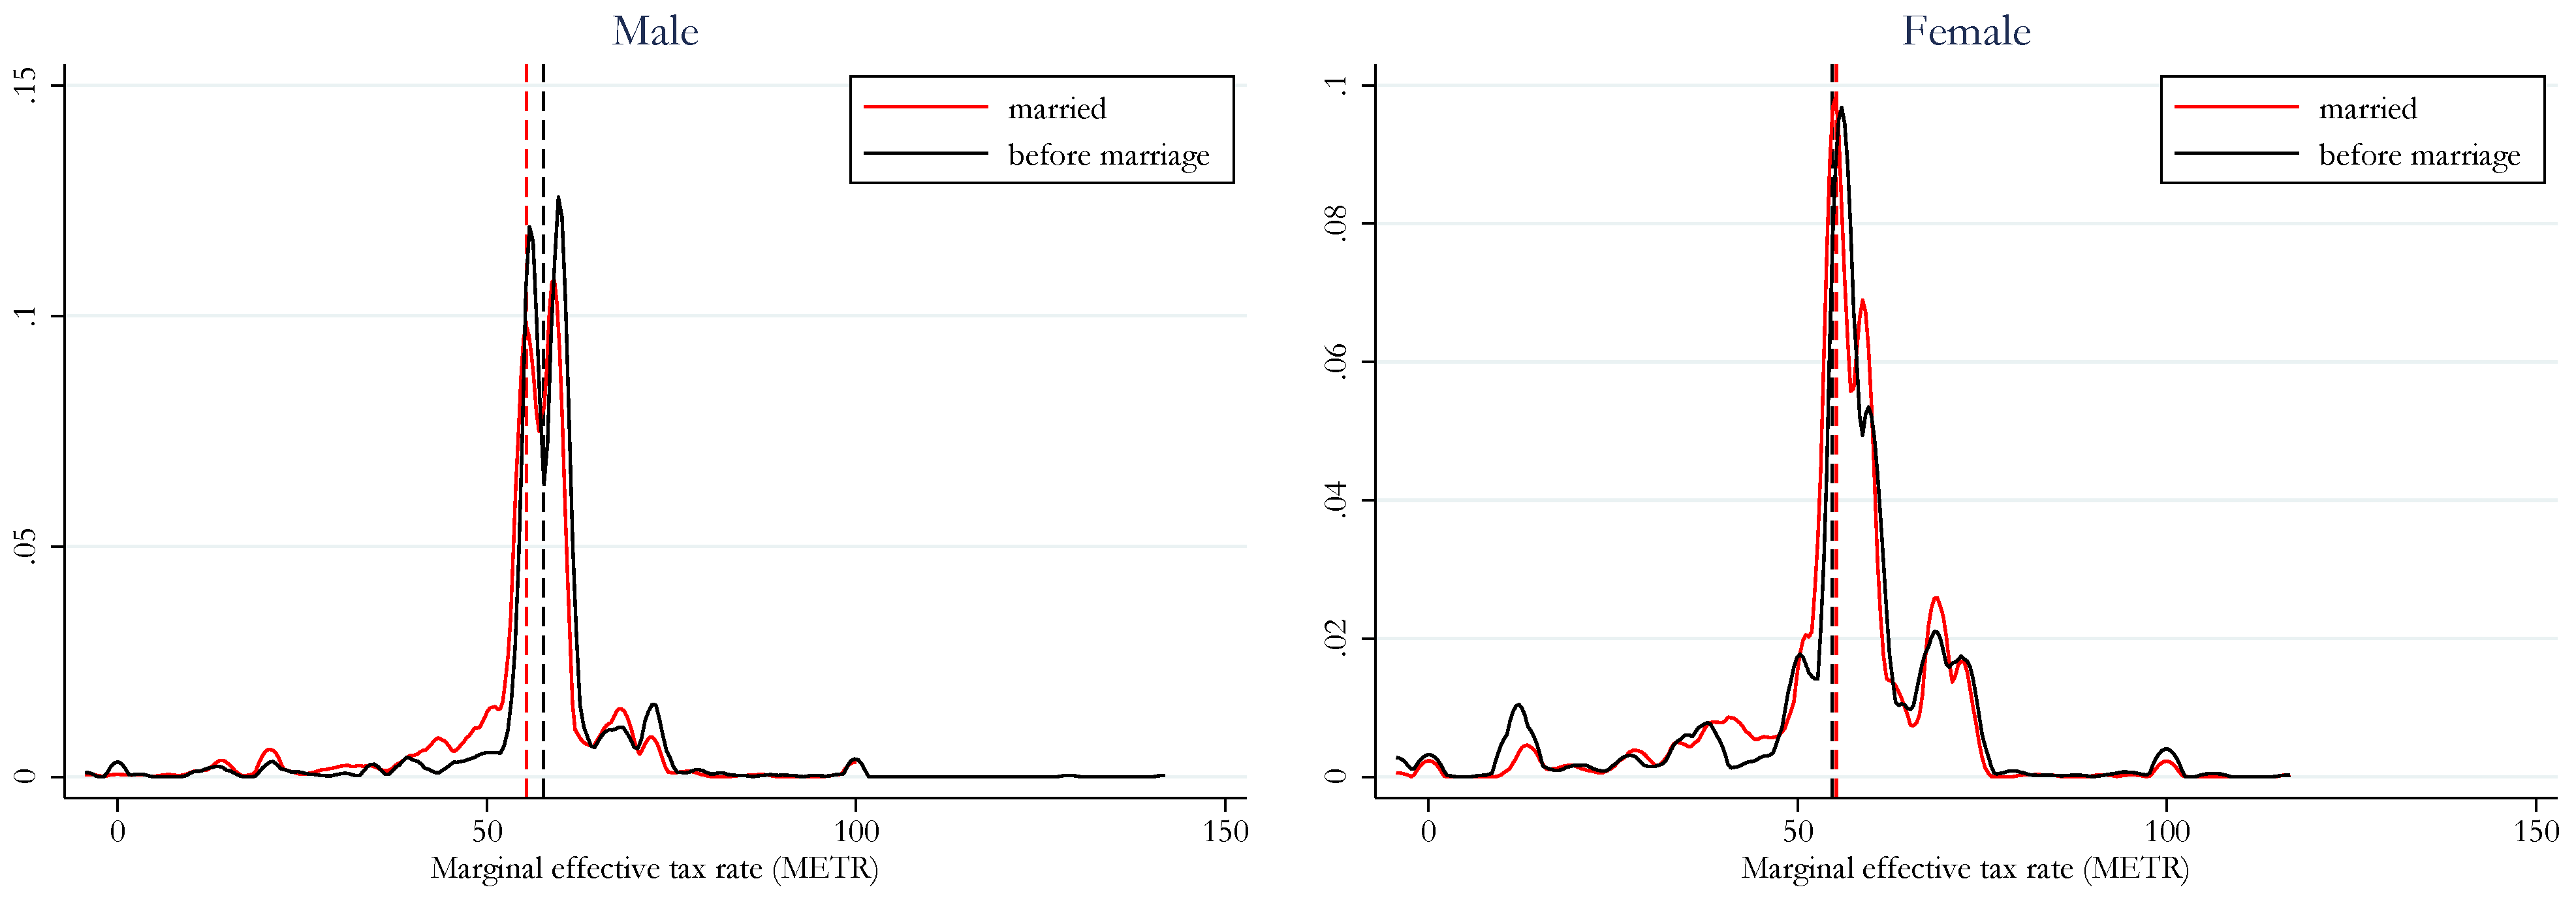
| 19 | For more details on the NRR distribution in the two scenarios by gender, please see Figure A9, Figure A10, Figure A11, Figure A12, Figure A13, Figure A14, Figure A15 and Figure A16 in Appendix B. |
| 20 | This result is in line with Christl et al. (2021), who show that the marriage bonus is higher in couples with only one earner or couples with two earners and a very different amount of income between the two partners. In the presence of a two-earners couple, the NRR shows the replacement rate in case one partner is still employed, while the other partner is unemployed and so will receive unemployment benefits if eligible. Hence, in the couple there will be only one earner, while the partner will have either a lower income level or no income. This effect is particularly strong in Czechia, where taxation is at individual level, but there is a tax credit in case the spouse have a low income level (see Table 1). |
| 21 | If remain unemployed for longer, lower contributory periods to social security schemes may leave women with reduced entitlements to pension rights and increased risk of poverty in older age. In addition, in case of a divorce, women may find themselves in a precarious situation since their position in the labour market can be strongly limited by the decisions that were taken while married. |
| 22 | See European Parliament resolution of 15 January 2019 on gender equality and taxation policies in the EU and the analysis from the Committee on Women’s right and Gender Equality (Gunnarsson et al. 2017) |
| 23 | In this strategy, the European Commission pledges to develop guidance for the Member States on how national tax and benefit systems can incentivise or disincentivise second earners. See A Union of Equality: Gender Equality Strategy 2020–2025. |
| 24 | In most Western societies, household formation has changed rapidly over the past centuries. The traditional form of marriage that has been the dominant form of family households for decades, is losing it’s importance and cohabitation is on the rise in many countries (Perelli-Harris and Gassen 2012). The crude marriage rate has declined by close to 50% since 1964, while the crude divorce rate more than doubled in the same time (ESTAT Marriage Indicators). |
References
- Bettio, Francesca, Alina Verashchagina, and Frances Camilleri-Cassar. 2009. Fiscal Systems and Female Employment in Europe. Brussels: European Commission. [Google Scholar]
- Bick, Alexander, and Nicola Fuchs-Schündeln. 2017. Quantifying the disincentive effects of joint taxation on married women’s labor supply. American Economic Review 107: 100–4. [Google Scholar] [CrossRef] [Green Version]
- Blundell, Richard W. 1995. The impact of taxation on labour force participation and labour supply. In OECD Jobs Study Working Papers. Paris: OECD. [Google Scholar] [CrossRef]
- Bogenschneider, Bret, and Karen Bogenschneider. 2015. An evidence-based approach to family in tax policy. Gonzaga Law Review 51: 283. [Google Scholar]
- Bonke, Jens. 2015. Pooling of income and sharing of consumption within households. Review of Economics of the Household 13: 73–93. [Google Scholar] [CrossRef]
- Cai, Lixin, Guyonne Kalb, Yi-Ping Tseng, and Ha Vu. 2008. The effect of financial incentives on labour supply: Evidence for lone parents from microsimulation and quasi-experimental evaluation. Fiscal Studies 29: 285–325. [Google Scholar] [CrossRef]
- Chapman, Douglas K. 1984. Marriage neutrality: An old idea comes of age. West Virginia Law Review 87: 335. [Google Scholar]
- Christl, Michael, Silvia De Poli, and Viginta Ivaškaitė-Tamošiūnė. 2021. Does It Pay to Say “I Do”? Marriage Bonuses and Penalties across the EU. JRC Working Papers on Taxation and Structural Reforms 2021-7. Seville: European Commission, Joint Research Centre. [Google Scholar]
- Coelho, Maria Delgado, Aieshwarya Davis, Alexander D. Klemm, and Carolina Osorio Buitron. 2022. Gendered Taxes: The Interaction of Tax Policy with Gender Equality. Washington, DC: International Monetary Fund. [Google Scholar]
- Crossley, Thomas F., and Sung-Hee Jeon. 2007. Joint taxation and the labour supply of married women: Evidence from the canadian tax reform of 1988. Fiscal Studies 28: 343–65. [Google Scholar] [CrossRef] [Green Version]
- de Quinto, Alicia, Laura Hospido, and Carlos Sanz. 2021. The child penalty: Evidence from spain. SERIEs 12: 585–606. [Google Scholar] [CrossRef]
- Decoster, André, and Peter Haan. 2011. A Switch from Joint to Individual Taxation is Welfare Improving. Berlin: DIW Berlin Discussion Paper. [Google Scholar]
- Doorley, Karina. 2016. Making the switch. the employment and fiscal effects of introducing individual income taxation in Luxembourg. In Imposition Individuelle et Emploi. Luxembourg: Editions d’Lëtzebuerger Land, pp. 81–100. [Google Scholar]
- Doorley, Karina. 2018. Taxation, Work and Gender Equality in Ireland. IZA Discussion Paper No. 11495. Bonn: IZA Institute of Labour Economics. [Google Scholar]
- Dulude, Louise B. 1979. Joint taxation of spouses-a feminist view. Can. Tax’n 1: 8. [Google Scholar]
- Elson, Diane. 2006. Budgeting for Women’s Rights: Monitoring Governance Budgets for Compliance with Cedaw. New York: United Nations UNIFEM. [Google Scholar]
- Eurofound. 2018. Striking a Balance: Reconciling Work and Life in the EU. Luxembourg: Publications Office of the European Union. [Google Scholar]
- Eurostat. 2021. Higher Employment Rate for Men with Children. Available online: https://ec.europa.eu/eurostat/web/products-eurostat-news/-/ddn-20210809-1 (accessed on 10 October 2022).
- Eurostat. 2022. Persons at Risk of Poverty or Social Exclusion by Age and Sex. Available online: https://ec.europa.eu/eurostat/databrowser/view/ilc_peps01n/default/table?lang=en (accessed on 10 October 2022).
- Figari, Francesco, Herwig Immervoll, Horacio Levy, and Holly Sutherland. 2011. Inequalities within couples in europe: Market incomes and the role of taxes and benefits. Eastern Economic Journal 37: 344–66. [Google Scholar] [CrossRef]
- Fisher, Hayley. 2013. The effect of marriage tax penalties and subsidies on marital status. Fiscal Studies 34: 437–65. [Google Scholar] [CrossRef]
- Fortin, Bernard, and Guy Lacroix. 1997. A test of the unitary and collective models of household labour supply. The Economic Journal 107: 933–55. [Google Scholar] [CrossRef]
- Gubbels, N.C.G. 2021. Married, unmarried cohabitants,(multiple) parents and (step) children in tax law in the netherlands and europe. Intertax 49: 408–23. [Google Scholar] [CrossRef]
- Gunnarsson, Åsa, Margit Schratzenstaller, and Ulrike Spangenberg. 2017. Gender Equality and Taxation in the European Union: Study for the FEMM Committee. Brussels: European Parliament. [Google Scholar]
- Gustafsson, Siv. 1992. Separate taxation and married women’s labor supply. Journal of Population Economics 5: 61–85. [Google Scholar] [CrossRef] [PubMed]
- Himmelweit, Susan. 2002. Making visible the hidden economy: The case for gender-impact analysis of economic policy. Feminist Economics 8: 49–70. [Google Scholar] [CrossRef]
- Jara, H. Xavier, and Alberto Tumino. 2013. Tax-benefit systems, income distribution and work incentives in the european union. The International Journal of Microsimulation 6: 27–62. [Google Scholar] [CrossRef]
- Kabatek, Jan, Arthur Van Soest, and Elena Stancanelli. 2014. Income taxation, labour supply and housework: A discrete choice model for french couples. Labour Economics 27: 30–43. [Google Scholar] [CrossRef] [Green Version]
- Kan, Man Yee, and Heather Laurie. 2014. Changing patterns in the allocation of savings, investments and debts within couple relationships. The Sociological Review 62: 335–58. [Google Scholar] [CrossRef]
- Kleven, Henrik, Camille Landais, and Jakob Egholt Søgaard. 2019. Children and gender inequality: Evidence from denmark. American Economic Journal: Applied Economics 11: 181–209. [Google Scholar] [CrossRef] [Green Version]
- LaLumia, Sara. 2008. The effects of joint taxation of married couples on labor supply and non-wage income. Journal of Public Economics 92: 1698–719. [Google Scholar] [CrossRef] [Green Version]
- Leroy, Marc. 2008. Tax sociology. sociopolitical issues for a dialogue with economists. Socio-Logos. Revue de L’association Française de Sociologie 3. [Google Scholar] [CrossRef]
- Madgavkar, Anu, Kweilin Ellingrud, and Mekala Krishnan. 2016. The Economic Benefits of Gender Parity. Atlanta: McKinsey & Company. [Google Scholar]
- Mascherini, Massimiliano, Martina Bisello, and Irene Rioboo Leston. 2016. The Gender Employment Gap: Challenges and Solutions. Dublin: Eurofound. [Google Scholar]
- McCaffery, Edward. 2009. 13 where’s the sex in fiscal sociology?: Taxation and gender in comparative perspective. In The New Fiscal Sociology: Taxation in Comparative and Historical Perspective. Cambridge: Cambridge University Press, p. 216. [Google Scholar]
- Morais Maceira, Helena. 2017. Economic benefits of gender equality in the eu. Intereconomics 52: 178–83. [Google Scholar] [CrossRef] [Green Version]
- OECD. 2021. Taxing Wages 2021. Available online: https://doi.org/10.1787/83a87978-en (accessed on 15 June 2022).
- OECD. 2022. Tax Policy and Gender Equality: A Stocktake of Country Approaches. Paris: OECD. [Google Scholar]
- Perelli-Harris, Brienna, and Nora Sánchez Gassen. 2012. How similar are cohabitation and marriage? legal approaches to cohabitation across western europe. Population and Development Review 38: 435–67. [Google Scholar] [CrossRef]
- Ponthieux, Sophie. 2013. Income pooling and equal sharing within the household—What can we learn from the 2010 eu-silc module. In Eurostat Population and Social Conditions: Methodologies and Working Papers. Luxembourg: European Commission. [Google Scholar]
- Puckett, James M. 2009. Rethinking tax priorities: Marriage neutrality, children, and contemporary families. University of Cincinnati Law Review 78: 1409. [Google Scholar]
- Sainsbury, Diane. 1999. Taxation, family responsibilities, and employment. In Gender and Welfare State Regimes. Oxford: Oxford University Press, pp. 185–209. [Google Scholar]
- Stotsky, Janet Gale. 1996. Gender Bias in Tax Systems. Washington, DC: International Monetary Fund. [Google Scholar]
- Sutherland, Holly, and Francesco Figari. 2013. Euromod: The european union tax-benefit microsimulation model. International Journal of Microsimulation 6: 4–26. [Google Scholar] [CrossRef]
- Vogler, Carolyn, and Jan Pahl. 1994. Money, power and inequality within marriage. The Sociological Review 42: 263–88. [Google Scholar] [CrossRef]


| Country | Income Taxation | If Individual, Tax Allowance/Credit for Spouse? |
|---|---|---|
| BE | individual (marital quotient applies) | - |
| CZ | individual | Yes (spouse tax credit) |
| DE | joint (can opt for individual) | - |
| IE | partly joint (can opt for individual) | - |
| LU | joint (can opt for individual) | - |
| MT | joint or individual | - |
| PL | joint or individual | - |
| ES | individual, but can file tax returns jointly | Yes (couples can file individual or joint tax return that affects the additional tax allowance) |
| Country | Two Earners | One Earner | No Earners | Part-Time | Parents | N Couples | |||
|---|---|---|---|---|---|---|---|---|---|
| BW Men | BW Women | Men | Women | Men | Women | Observed | |||
| BE | 52.8 | 19.6 | 18.7 | 4.8 | 5.4 | 10.0 | 49.3 | 65.8 | 1278 |
| CZ | 63.6 | 19.6 | 15.8 | 1.9 | 0.8 | 1.0 | 6.2 | 70.2 | 2044 |
| DE | 66.4 | 14.7 | 14.6 | 3.0 | 1.3 | 5.3 | 60.1 | 65.2 | 2422 |
| ES | 50.7 | 21.6 | 21.0 | 4.4 | 3.4 | 2.4 | 17.2 | 69.4 | 4822 |
| IE | 49.6 | 22.0 | 19.3 | 4.1 | 5.0 | 6.2 | 31.0 | 76.0 | 1206 |
| LU | 49.6 | 21.7 | 20.5 | 6.1 | 2.5 | 3.9 | 38.7 | 65.2 | 1682 |
| MT | 46.3 | 22.1 | 29.3 | 1.2 | 1.9 | 1.0 | 14.9 | 63.4 | 1101 |
| PL | 44.4 | 21.7 | 25.9 | 6.6 | 2.8 | 2.1 | 7.2 | 62.4 | 6697 |
| Country | Two Earners | One Earner | No Earners | Part-Time | Parents | N Couples | |||
|---|---|---|---|---|---|---|---|---|---|
| BW Men | BW Women | Men | Women | Men | Women | Observed | |||
| BE | 60.6 | 24.5 | 8.7 | 2.9 | 4.1 | 9.9 | 35.3 | 57.2 | 608 |
| CZ | 62.1 | 15.5 | 20.4 | 2.0 | 1.3 | 1.1 | 6.0 | 59.3 | 620 |
| DE | 61.5 | 23.6 | 9.1 | 3.9 | 2.2 | 7.7 | 28.7 | 33.3 | 456 |
| ES | 53.0 | 28.6 | 10.5 | 6.1 | 1.9 | 2.8 | 16.5 | 44.6 | 829 |
| IE | 50.3 | 24.2 | 14.2 | 4.5 | 6.7 | 5.8 | 22.1 | 55.6 | 167 |
| LU | 57.2 | 27.2 | 7.6 | 7.3 | 2.2 | 5.7 | 21.5 | 47.4 | 197 |
| MT | 54.9 | 29.2 | 14.2 | 2.9 | 1.1 | 2.7 | 6.3 | 51.6 | 67 |
| PL | 49.5 | 26.4 | 17.4 | 4.6 | 3.0 | 1.4 | 6.1 | 49.0 | 853 |
| Country | Married | Before Marriage | Difference | |||
|---|---|---|---|---|---|---|
| Women | Men | Women | Men | Women | Men | |
| BE | 55.2 | 55.4 | 54.7 | 57.7 | 0.6 | −2.3 |
| CZ | 27.5 | 29.1 | 27.5 | 29.6 | 0.0 | −0.4 |
| DE | 42.1 | 41.7 | 37.0 | 45.3 | 5.1 | −3.6 |
| ES | 24.7 | 30.0 | 22.6 | 31.5 | 2.1 | −1.5 |
| IE | 40.7 | 43.3 | 38.6 | 45.0 | 2.2 | −1.7 |
| LU | 44.6 | 44.6 | 41.1 | 48.1 | 3.4 | −3.5 |
| MT | 24.1 | 27.1 | 25.6 | 30.0 | −1.5 | −2.9 |
| PL | 28.3 | 27.3 | 27.5 | 27.5 | 0.8 | −0.2 |
| Country | Married | Before Marriage | Difference | |||
|---|---|---|---|---|---|---|
| Women | Men | Women | Men | Women | Men | |
| BE | 83.9 | 72.5 | 86.0 | 74.9 | −2.2 | −2.5 |
| CZ | 75.0 | 63.0 | 71.8 | 60.4 | 3.1 | 2.6 |
| DE | 86.3 | 76.4 | 84.7 | 75.4 | 1.6 | 1.0 |
| ES | 76.1 | 62.4 | 75.2 | 62.4 | 0.9 | 0.0 |
| IE | 73.8 | 62.5 | 73.2 | 62.2 | 0.6 | 0.3 |
| LU | 92.3 | 86.0 | 92.1 | 86.3 | 0.1 | −0.3 |
| MT | 68.4 | 55.8 | 66.5 | 54.6 | 1.9 | 1.1 |
| PL | 69.0 | 58.9 | 68.9 | 59.2 | 0.2 | −0.4 |
Publisher’s Note: MDPI stays neutral with regard to jurisdictional claims in published maps and institutional affiliations. |
© 2022 by the authors. Licensee MDPI, Basel, Switzerland. This article is an open access article distributed under the terms and conditions of the Creative Commons Attribution (CC BY) license (https://creativecommons.org/licenses/by/4.0/).
Share and Cite
Christl, M.; De Poli, S.; Ivaškaitė-Tamošiūnė, V. The Lock-in Effect of Marriage: Work Incentives after Saying “I Do”. Soc. Sci. 2022, 11, 493. https://doi.org/10.3390/socsci11110493
Christl M, De Poli S, Ivaškaitė-Tamošiūnė V. The Lock-in Effect of Marriage: Work Incentives after Saying “I Do”. Social Sciences. 2022; 11(11):493. https://doi.org/10.3390/socsci11110493
Chicago/Turabian StyleChristl, Michael, Silvia De Poli, and Viginta Ivaškaitė-Tamošiūnė. 2022. "The Lock-in Effect of Marriage: Work Incentives after Saying “I Do”" Social Sciences 11, no. 11: 493. https://doi.org/10.3390/socsci11110493
APA StyleChristl, M., De Poli, S., & Ivaškaitė-Tamošiūnė, V. (2022). The Lock-in Effect of Marriage: Work Incentives after Saying “I Do”. Social Sciences, 11(11), 493. https://doi.org/10.3390/socsci11110493