Article

Urban Boundary Demarcation—An iCN Model Approach

by
Amila Jayasinghe
*,
Lindamullage Don Charls Hasintha Nawod Kalpana
,
Charithmali Chethika Abenayake
and
Pelpola Kankanamge Seneviratne Mahanama
Urban Simulation Lab, Department of Town & Country Planning, University of Moratuwa, Moratuwa 10400, Sri Lanka
*
Author to whom correspondence should be addressed.
Soc. Sci. 2021, 10(12), 448; https://doi.org/10.3390/socsci10120448
Submission received: 10 July 2021 / Revised: 20 September 2021 / Accepted: 21 September 2021 / Published: 23 November 2021
(This article belongs to the Section Community and Urban Sociology)

Abstract

:
During the last two decades, determining the urban boundaries of cities has become one of the major concerns in the urban and regional planning subject domains. Many scholars have tried to model the change of urban boundaries as it helps with sustainable development, population projections and social policy making, but such efforts have been futile, owing to the complex nature of urbanization and the theoretical and technical limitations of the proposed applications. Hence, many countries continue to rely on the administrative boundary demarcation, which rarely represent the actual urbanizing pattern. In such context, this study utilized the “Intersection-Based Clustered Network Model—(iCN Model)” to determine the urban boundaries of cities and selected Sri Lanka as the study area and considered few cities to test the model empirically, with satellite imagery classified urban boundaries. The findings of the study depict that the iCN Model is capable of capturing the complex and dynamic socioeconomic interdependencies of cities via the transportation network configurations. Therefore, the proposed approach is an excellent proxy to derive the urban boundaries of cities, which correspond with the same, derived by the satellite imageries. The proposed model is entirely based on open-source GIS applications and is free to implement and modify using the methods described in this paper.

1. Introduction

1.1. Theoretical Background of the Urban Boundary Demarcation

Cities are the outcome of the historical evolution of space, clustered and stacked according to the communities and resource agglomeration over many decades (Lee 2021). This integrated nature of city clusters form different city scales according to their degree of urban agglomeration, which have caused dramatic changes in the urban boundaries of cities. In such a context, understanding of the urban boundaries of cities provides significant insights into recognizing the dynamic nature of the urbanization process of the cities and mapping out specific development policies to avoid, minimize, or solve the social and environmental problems along with the urbanization process of the cities (Peng et al. 2018). It also distinguishes urban development trends and patterns, urban sprawling effects and the distribution of resources in cities, which helps to address the socio-economic-ecological causes and consequences of these cities (Xiaofang et al. 2020). In such a context, demarcating the urban boundaries of cities provides significant insights for the urban planners, transport engineers and geographers in many dimensions.
However, lesser attention has been paid from the research community to delineate the urban boundaries in a systematic manner, as most of the countries continue to remain on the minimum population size threshold with fixed administrative classifications to delineate the urban boundaries of cities by considering the diversity of natural and physical attributes. (Dijkstra et al. 2021), (Henriques et al. 2020). For instance, in Sri Lanka, Municipalities and Urban Council areas are distinguished as urbanized areas by considering the population density and natural and physical characteristics of the land in these areas—regardless of its urban functionality. Thus, applying these thresholds and classifications as spatial units to classify the urban boundaries of cities has resulted in a significant mismatch of the cities’ actual scale, size, and shape of the urban boundaries and reduced the international comparability of the urban scales of cities (Dijkstra et al. 2021), (Song et al. 2018). This contradiction of urban area classification is discussed in depth by (Henriques et al. 2020), and it distinguishes the different approaches applied to classify the different territories as urban, depending on the different official institutions and the purposes that initiate these classifications. In such a context, this dilemma hindered the implementation of sustainable development measures and the social policy making of cities because such efforts were not affected to the actual city area (Dijkstra et al. 2021). For instance, municipality services (i.e., garbage collection, sewerage and drainage cleaning, infrastructure, and community development projects, etc.) and municipality policies, (i.e., taxation, public funding, and social security regulations, etc.) are significantly underestimated from the actual urban area of the city and limited to the administratively or arbitrarily defined city area. Hence, apart from the administrative boundary definition, it has been proposed to include multiple urban boundary definitions which are mainly focused on the geographic features, urban form, economic composition, and commuter distribution, (i.e., trip generation and distribution), etc. (Mortoja et al. 2020), (Chakraborti et al. 2018). In order to solve this complexity, for the purpose of study, this article defines ‘urban boundary’ as the maximum functional extent, (i.e., urban fringe) of the urban cluster, which is derived by the maximum self-similarity distribution of Fractal Dimension of percolation clusters by the iCN Model. Here, self-similarity denotes the similarity of individual parts to the whole structure when it is scaled down or magnified to each individual part. Thus, Fractal Dimension depicts the statistical ratio of complexity of structure by comparing how self-similarity changes with scale (Jiang and Brandt 2016), (Zhang et al. 2014).

1.2. Existing Applications, Limitations and Failures

Taking into consideration the aforesaid research domain, multiple techniques and approaches have been employed to demarcate the urban boundaries of cities. Among them, satellite imagery and remotely sensed approach methods are highly utilized, considering their spatial nature of the data and flexibility—to capture the corresponding city area by the percentage of impervious surface or developed land (Chen et al. 2019), (Peng et al. 2018). However, during recent years the applicability of visible (i.e., RGB) satellite imagery to demarcate urban areas has been exceedingly criticized, as these methods are solely capable of distinguishing the visual interpretation of the urban areas of cities, which may misinterpret the actual urban area (Liu and Yang 2015), (Mundhe and Jaybhaye 2014). On the other hand, the impervious-surface-based urban boundary classifications contain significant theoretical and technical limitations. For instance, Peng and his colleagues (Peng et al. 2018) utilized the spatial continuous data of impervious surface area (ISA) and the method of spatial continuous wavelet transform to demarcate the urban boundaries. In this method, the impervious surface was mainly composed with the construction lands, buildings, and other buildup areas, excluding the water and green infrastructure lands which are considered as important elements in the urban environment (Xiaofang et al. 2020). Therefore, the urban boundary classification under the ISA method overestimated the urban boundaries in large scale cities, (i.e., due to larger impervious surface) and underestimated the urban boundaries of small-scale cities, (i.e., due to limited impervious surface).
In such a context, Xiaofang and his colleagues (Xiaofang et al. 2020) proposed a novel approach to map the urban areas of Chinese cities, by utilizing the nighttime light data. The study assumed that the emission of light, (i.e., streetlamps, automobiles, residential and commercial areas, etc.) and their intensities distinguished the urban lifestyle of Chinese cities. Thus, each city’s corresponding urban area was captured by the emission of light and scaled according to the light emission intensities. The study distinguished that the proposed method is well-applicable for large scale urban cluster boundary demarcation, as those urban clusters’ light emissions are significantly high during nighttime (Xiaofang et al. 2020), (Briggs et al. 2007). However, this method is comprised with several significant limitations (Tian et al. 2005). I. The proposed model is not applicable for urban boundary delineation in small cities, since it is unable to collect nighttime light emissions due to low light emission intensities (Tian et al. 2005), (Sutton et al. 1997). II. The light emission of cities does not distinguish the exact urban boundary of cities, as it only captures the nighttime functions and activities of cities (Briggs et al. 2007). III. The proposed method is more applicable for the developed countries due to the availability of high and accurate satellite imagery data and their financial capability to purchase the data. In such context, the applicability of remotely sensed approaches to derive the urban boundaries of cities is highly questionable.
Apart from the above-mentioned satellite-imagery-based urban boundary classification technics, density (i.e., either population or building) has been a frequently utilized approach to demarcate the urban boundaries of cities (Montero et al. 2021). In such a context, Arcaute and her colleagues (Arcaute et al. 2015) utilized population density distribution of “wards” to capture the urban boundaries of cities in the UK. Thus, the population density of each ward is calculated and merged with adjacent wards, which are above the given threshold limit, to generate city clusters. However, in this method, the density threshold limit and the appropriate density cutoff to delineate the urban boundaries of cities depend on the scholar’s preference and ground knowledge. This significantly questions the model accuracy, since the utilized threshold limits are not uniquely defined (Dong et al. 2015). When calculating the population density of a wider administrative area, this method causes an underestimation of the urban boundaries of cities, resulting in a lower population density for the particular administrative unit, regardless of its urban functionality (Dijkstra et al. 2021). Additionally, at present, it is well established that the administrative demarcations hardly represent the actual picture of the cities’ urbanization process and their urban boundary, as it is purposefully utilized for administrative purposes (Montero et al. 2021), (Dong et al. 2015).
As a solution for this, Song and his colleagues (Song et al. 2018) have presented an alternative density approach to delineate the city boundaries by utilizing the Kernel Density estimation on the points of interest of population density distribution and activities. The study was well distinguished and proved that the urban boundaries derived by the proposed approach does significantly vary with administrative boundaries of these cities, as it clearly misleads on the actual urban boundaries of cities. Although this method proposed a unique and successful approach to demarcate the urban boundaries of cities, it is still comprised with several minor limitations. I. This method utilized raster population layers to initiate the Kernel Density, hence the accuracy of the derived urban boundaries is limited to the cell size of the utilized population raster later (Montero et al. 2021), (Tian et al. 2005). II. This method was inadequate to capture the dynamic and complex morphological changes of cities and their urban boundaries by utilizing a rigid proxy, such as population density. This mainly caused the population census to be carried out every decade according to the administrative zones and then to downscale the population according to the ancillary information (Nicolau et al. 2019), (Mennis 2003). Hence, it does not incorporate the complex and dynamic spatial changes of cities to the population distribution (Montero et al. 2021), (Eicher and Brewer 2001). As a result, the applicability of the density approach to defining the city boundaries resulted in substantial model constraints.
Considering the above-mentioned theoretical and technical limitations of the existing urban boundary delineating methods, this study attempts to make a significant contribution to the four key limitations noted in the emerging research in the domain of the urban boundary demarcating studies. I. The existing urban boundary demarcating methods are scale dependent and only applicable to the specific scaling limit of the cities’ urban boundary demarcation (i.e., nighttime light emission method applicable for regional scale). Therefore, this study is focusing on elaborating a scale-free method to demarcate the urban boundary of cities by utilizing the road intersection points which are considered as the primary indicators of interaction and agglomeration. II. It is identified that the existing studies still rely on the arbitrarily defined threshold limits to demarcate urban boundaries; hence, this study proposed a rational approach to demarcate the urban boundary of cities by utilizing fractal geometry self-similarity distribution of the urban cluster. III. It denotes that the existing models are unable to capture the complex and dynamic spatial changes of the cities when demarcating their urban boundaries. Hence, this study utilized transportation network as the proxy to demarcate the urban boundaries, as it captures dynamic and complex morphological changes of cities IV. Finally, instead of the commercialized urban boundary demarcating methods, this study proposed a universal and open-source approach to demarcate the urban boundary of cities, which can be equally applicable to any geographical region.
In such a context, this study utilized the iCN Model to derive the urban boundaries of cities. The iCN Model is a multi-functional urban simulation tool developed by (Kalpana et al. 2021), which is capable of modeling the urban agglomeration and urban development pattern of cities. Thus, in this study, the same analytical framework was used to determine urban boundaries of cities. In such context, this study hypothesized that since the iCN Model depicts the urban development degree of each city cluster, their perimeter should represent the urban boundary of those cities. The study selected Sri Lanka as its study area and chose few Sri Lankan cities to test the hypothesis and assess the model validity empirically and spatially with real ground scenarios and the satellite-imagery-classified urban spaces, respectively.
The findings of the study will help geographers and urban and transport planners to have a better understanding of how to determine the urban boundaries of cities while taking into account the dynamic and complex nature of modern cities. It will further distinguish the urban development pattern and the scaling nature of cities based on transportation infrastructure development. In this context, the proposed model would be a useful tool for delineating each city’s urban boundaries and distinguishing its urban development patterns. As a result, the proposed model can be used as a decision-making tool by transportation and urban planning practitioners, policymakers, and real estate developers to develop strategies based on the urban development patterns of each city. In other words, the proposed method provides excellent insight into how each transportation development influenced city urban development patterns and, ultimately, how it influenced city urban boundary changes. Finally, the proposed model would be useful for transportation planners to study how the development of transportation infrastructure affects the behavior and functionality of cities. Therefore, the findings of this study would be beneficial to the sustainable development of cities and their social and transport policy formulation.
The rest of the paper is organized as follows: The methodology and data description are described in Section 2. Section 3 depicts the analysis and results. The discussion and conclusion are presented in Section 4. The recommendations and model availability for future studies presents in Section 5. Section 6 concludes the paper with a Limitations and future work.

1.3. Application of the iCN Model to Identify Urban Boundaries

The iCN Model is a multi-functional urban simulation tool developed by (Kalpana et al. 2021), which is capable of modeling the urban agglomeration and urban development patterns of cities. It has been developed under three fundamental concepts of the network science, identified as Road Network Configuration, Percolation Theory and Fractal Geometry. In the current urban and transportation studies, network science is considered the well-established approach to understand the diverse human interactions with space (Hillier and Vaughan 2007), (Jayasinghe et al. 2015). It has been identified that the topology of the road network is a perfect proxy to distinguish the traffic flow, human activities, and urban movement of the cities (Jiang and Liu 2009), (Ma et al. 2019), (Hillier and Iida 2005), (Jayasinghe et al. 2021). On the other hand, (de Rijke et al. 2020), (Jiang and Slocum 2020), (Levin 2019) distinguished that the living structure and natural boundary of cities can be well distinguished by the morphological characteristics of the transportation network. Therefore, the application of network science to capture the urban boundaries of cities is obvious. On the other hand, road network configurations (i.e., more specifically road intersection points) are considered as the primary indicators of interactions and agglomerations (Masucci et al. 2014). Therefore, it can precisely identify the cities and their corresponding urban boundaries by the iCN Model approach. The model applied the percolation theory (i.e., bond percolation) on the road intersection points to determine the urban agglomeration pattern of cities by utilizing the accessibility and locational proximity of the transportation network (Lee 2021). Then, it utilized Fractal Geometry to compute the maximum self-similarity distribution of percolation clusters, which calibrate the estimated urban agglomeration pattern with the current urban scale. It is distinct that Fractal Geometry can precisely quantify the morphological difference between urban and rural transportation network patterns (Batty and Longley 1994).

2. Materials and Methods
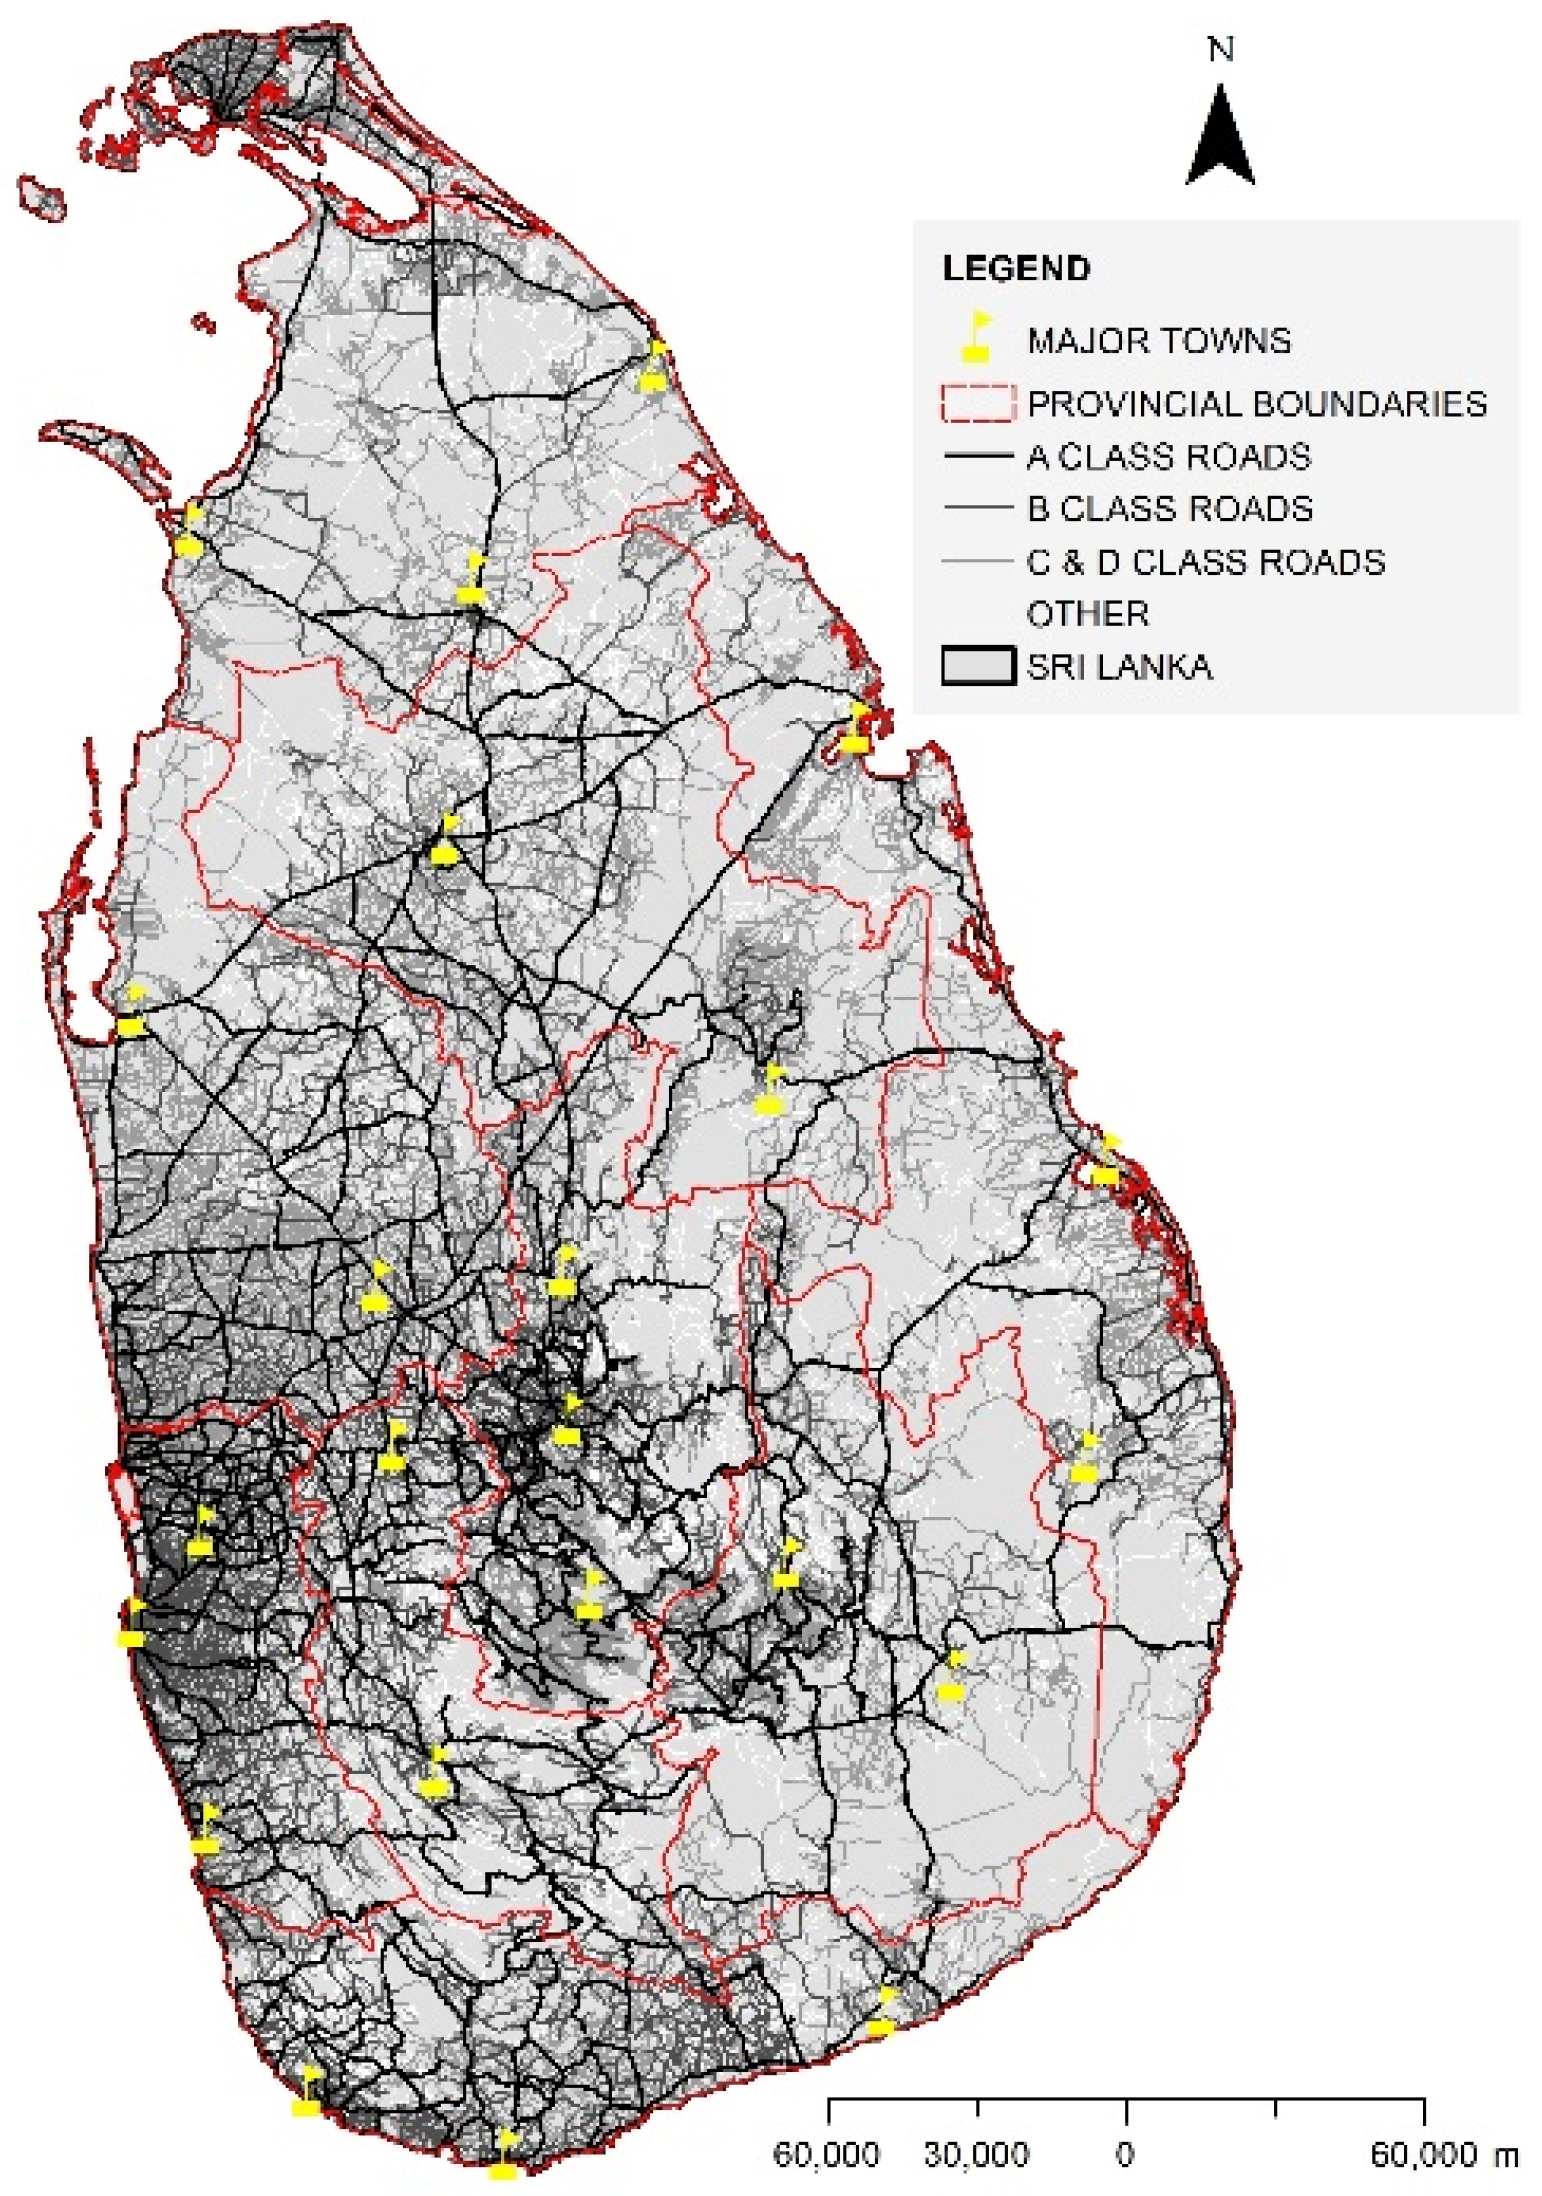
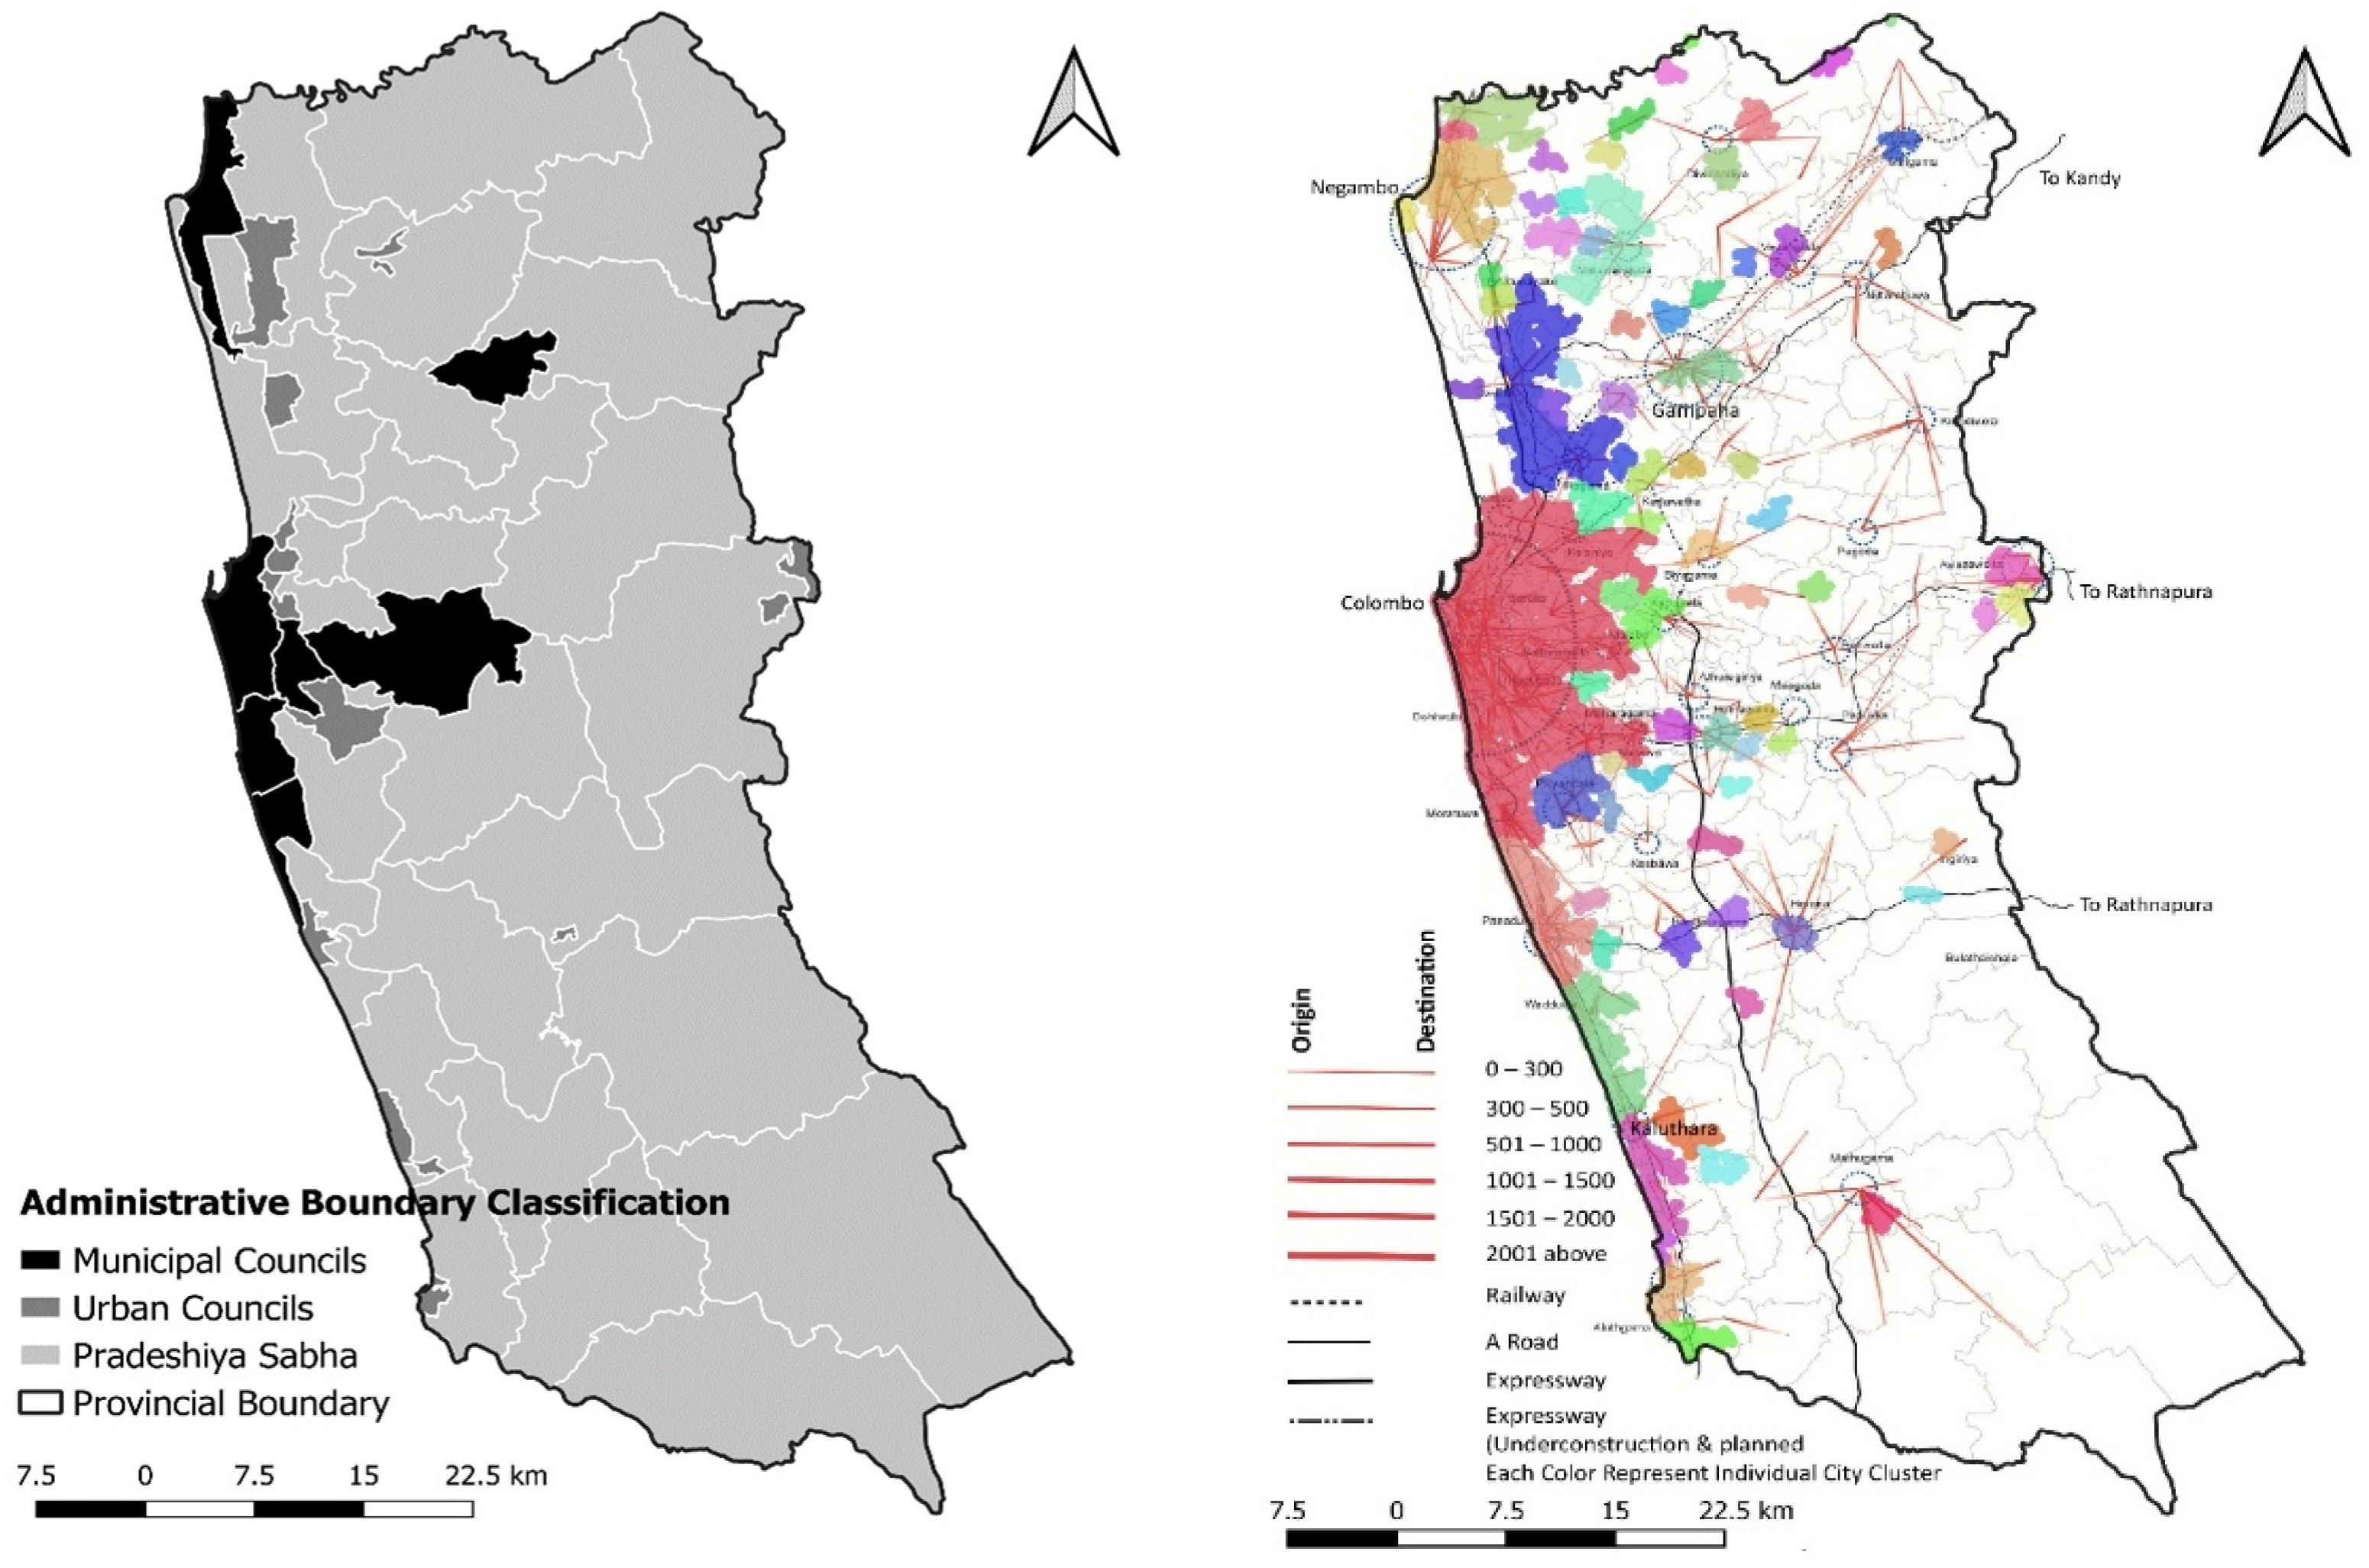
2.1. Study Area

The entire country of Sri Lanka was selected as the study area (refer Figure 1), mainly due to the clear spatial representation and non-existence of external linkages, due to being an island. Hence, the study can precisely run the model without any disruptions and derive the cities and their corresponding urban boundaries. The basic characteristics of Sri Lanka is depicted in Table 1.

2.2. Data Description and Sources

Table 2 depicts the study utilized data and their sources.

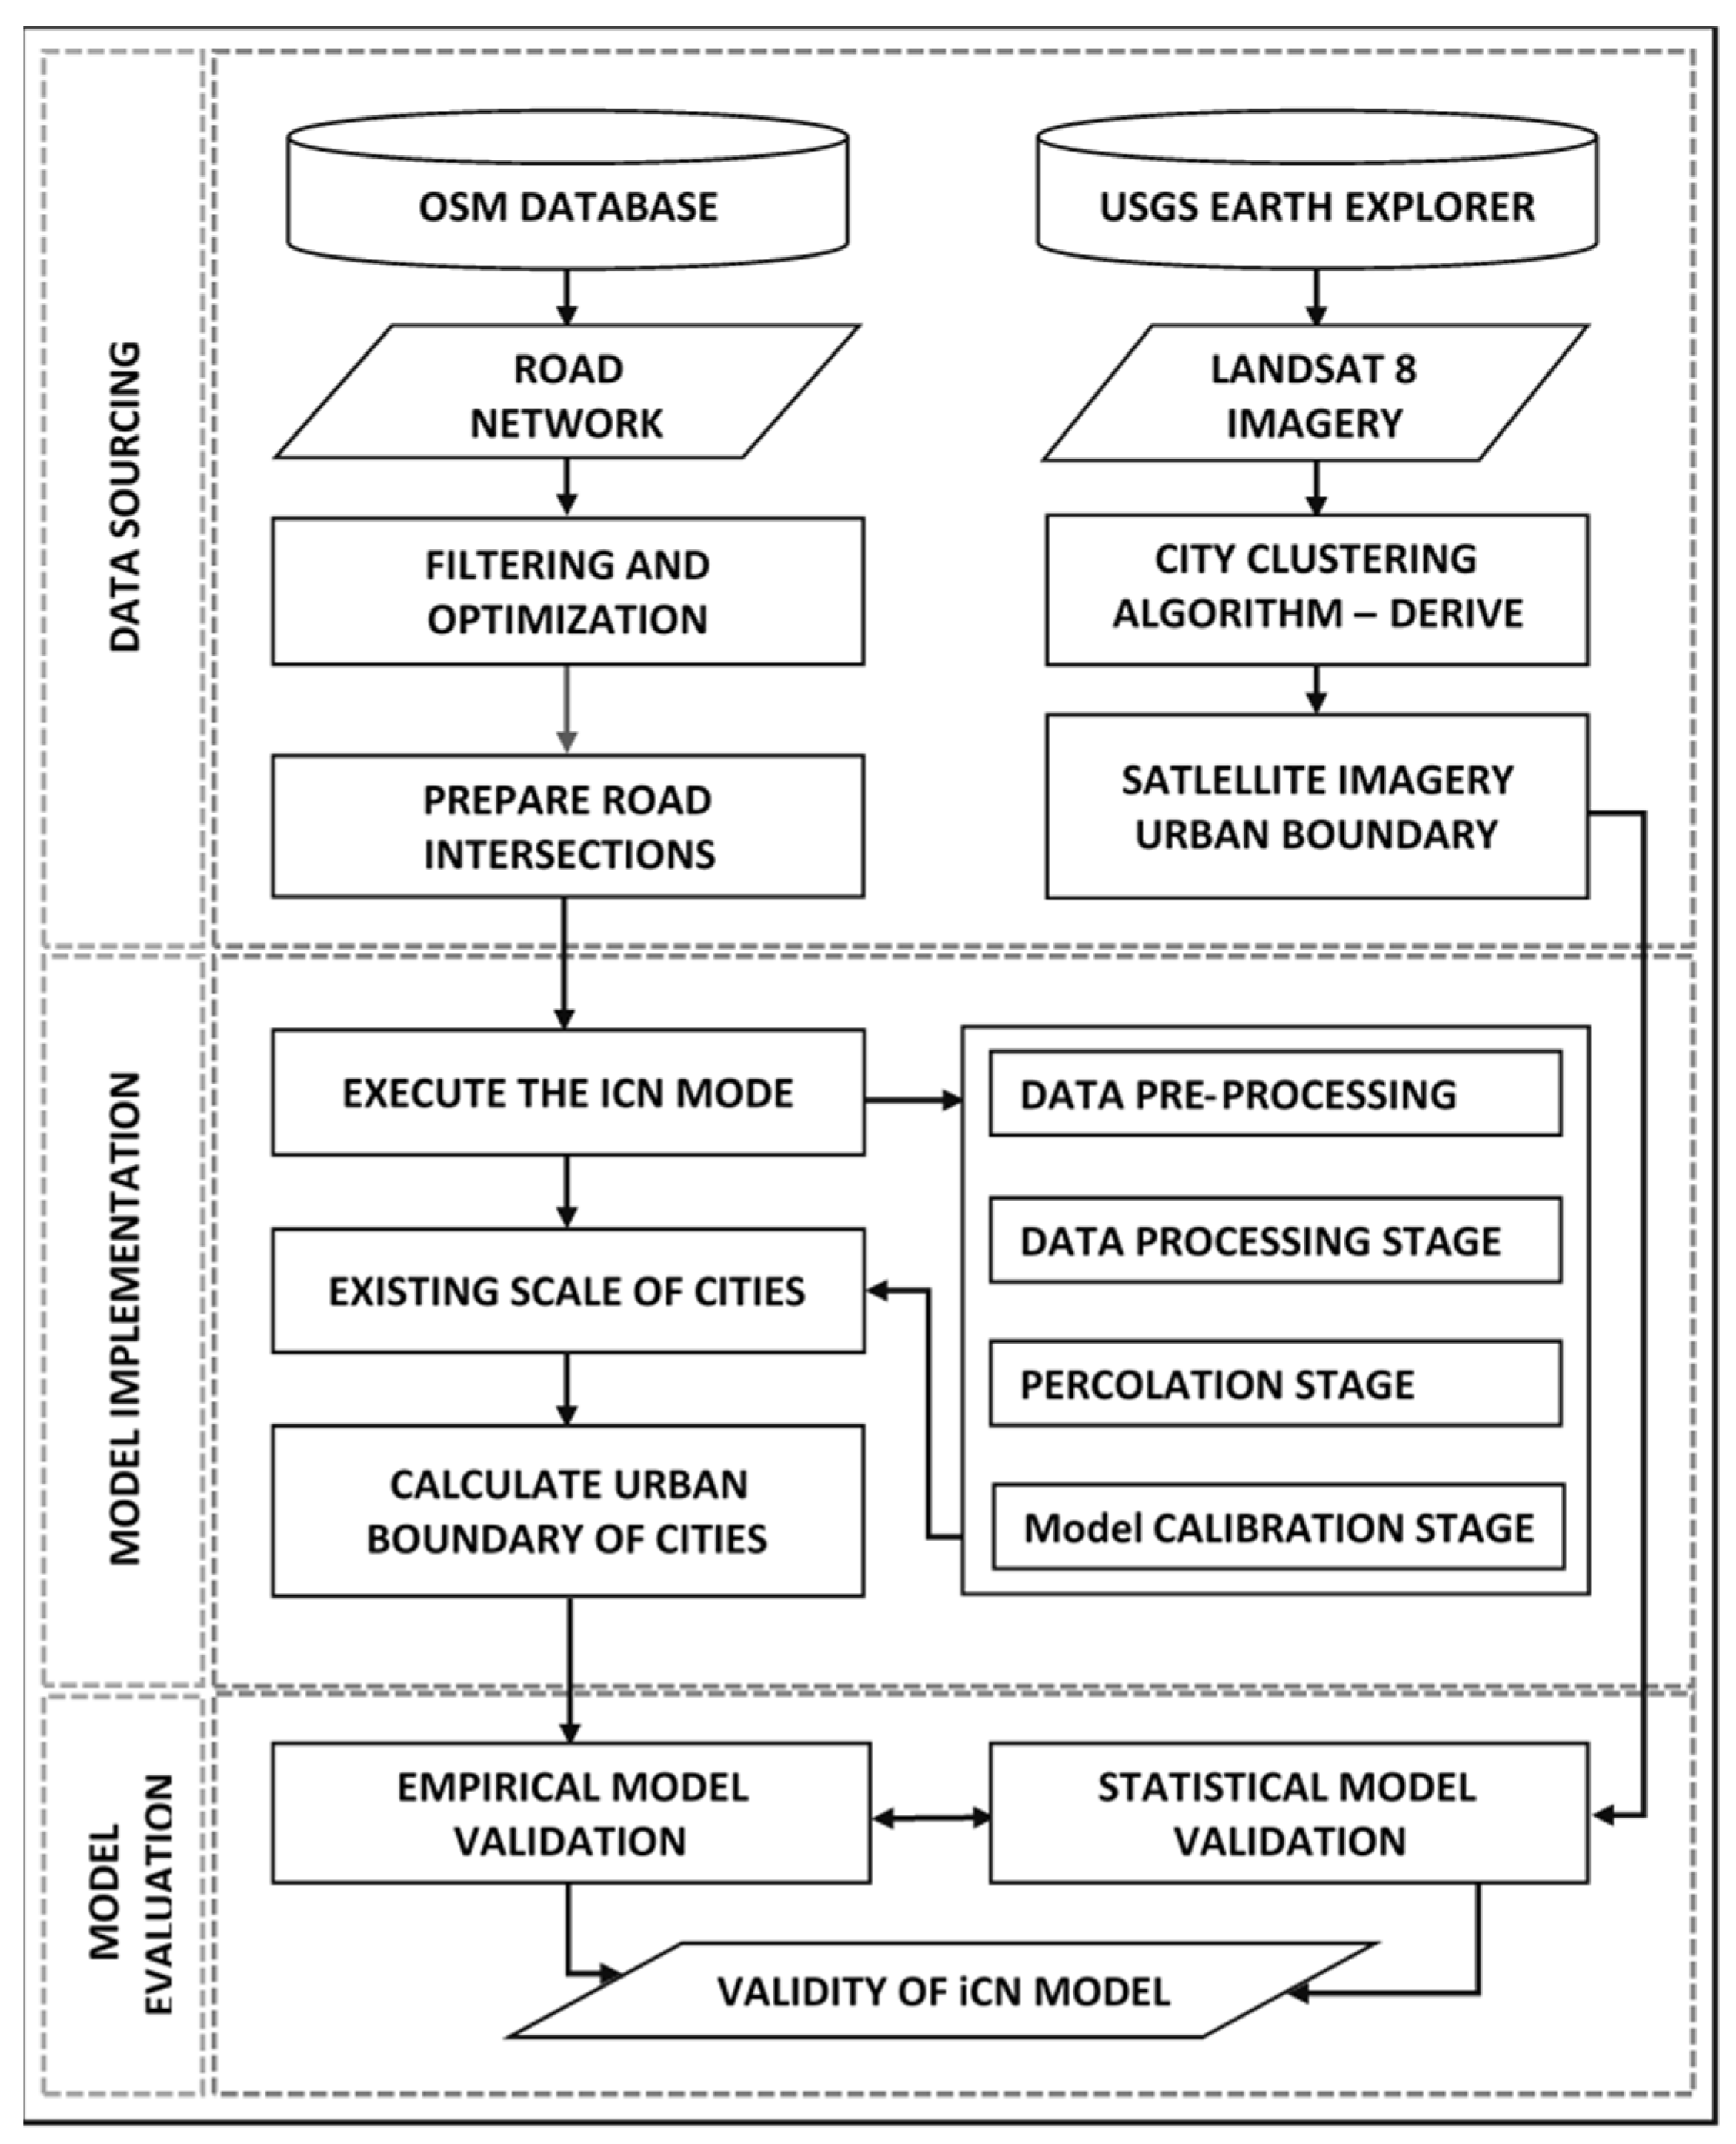
2.3. Method of Study

Figure 2 depicts the detailed analytical framework of the study, which can be divided into three major sections: I. Data sourcing stage; II iCN Model implementation stage; III. Model evaluation and validation stage. The study utilized OSM Repository and USGS Earth Explorer to extract the road network and satellite imageries (i.e., Landsat 8) of Sri Lanka, respectively, and utilized open-source GIS application for the initial data handling and pre-processing tasks.
The detailed steps of iCN Model implementation is presented in the following section.

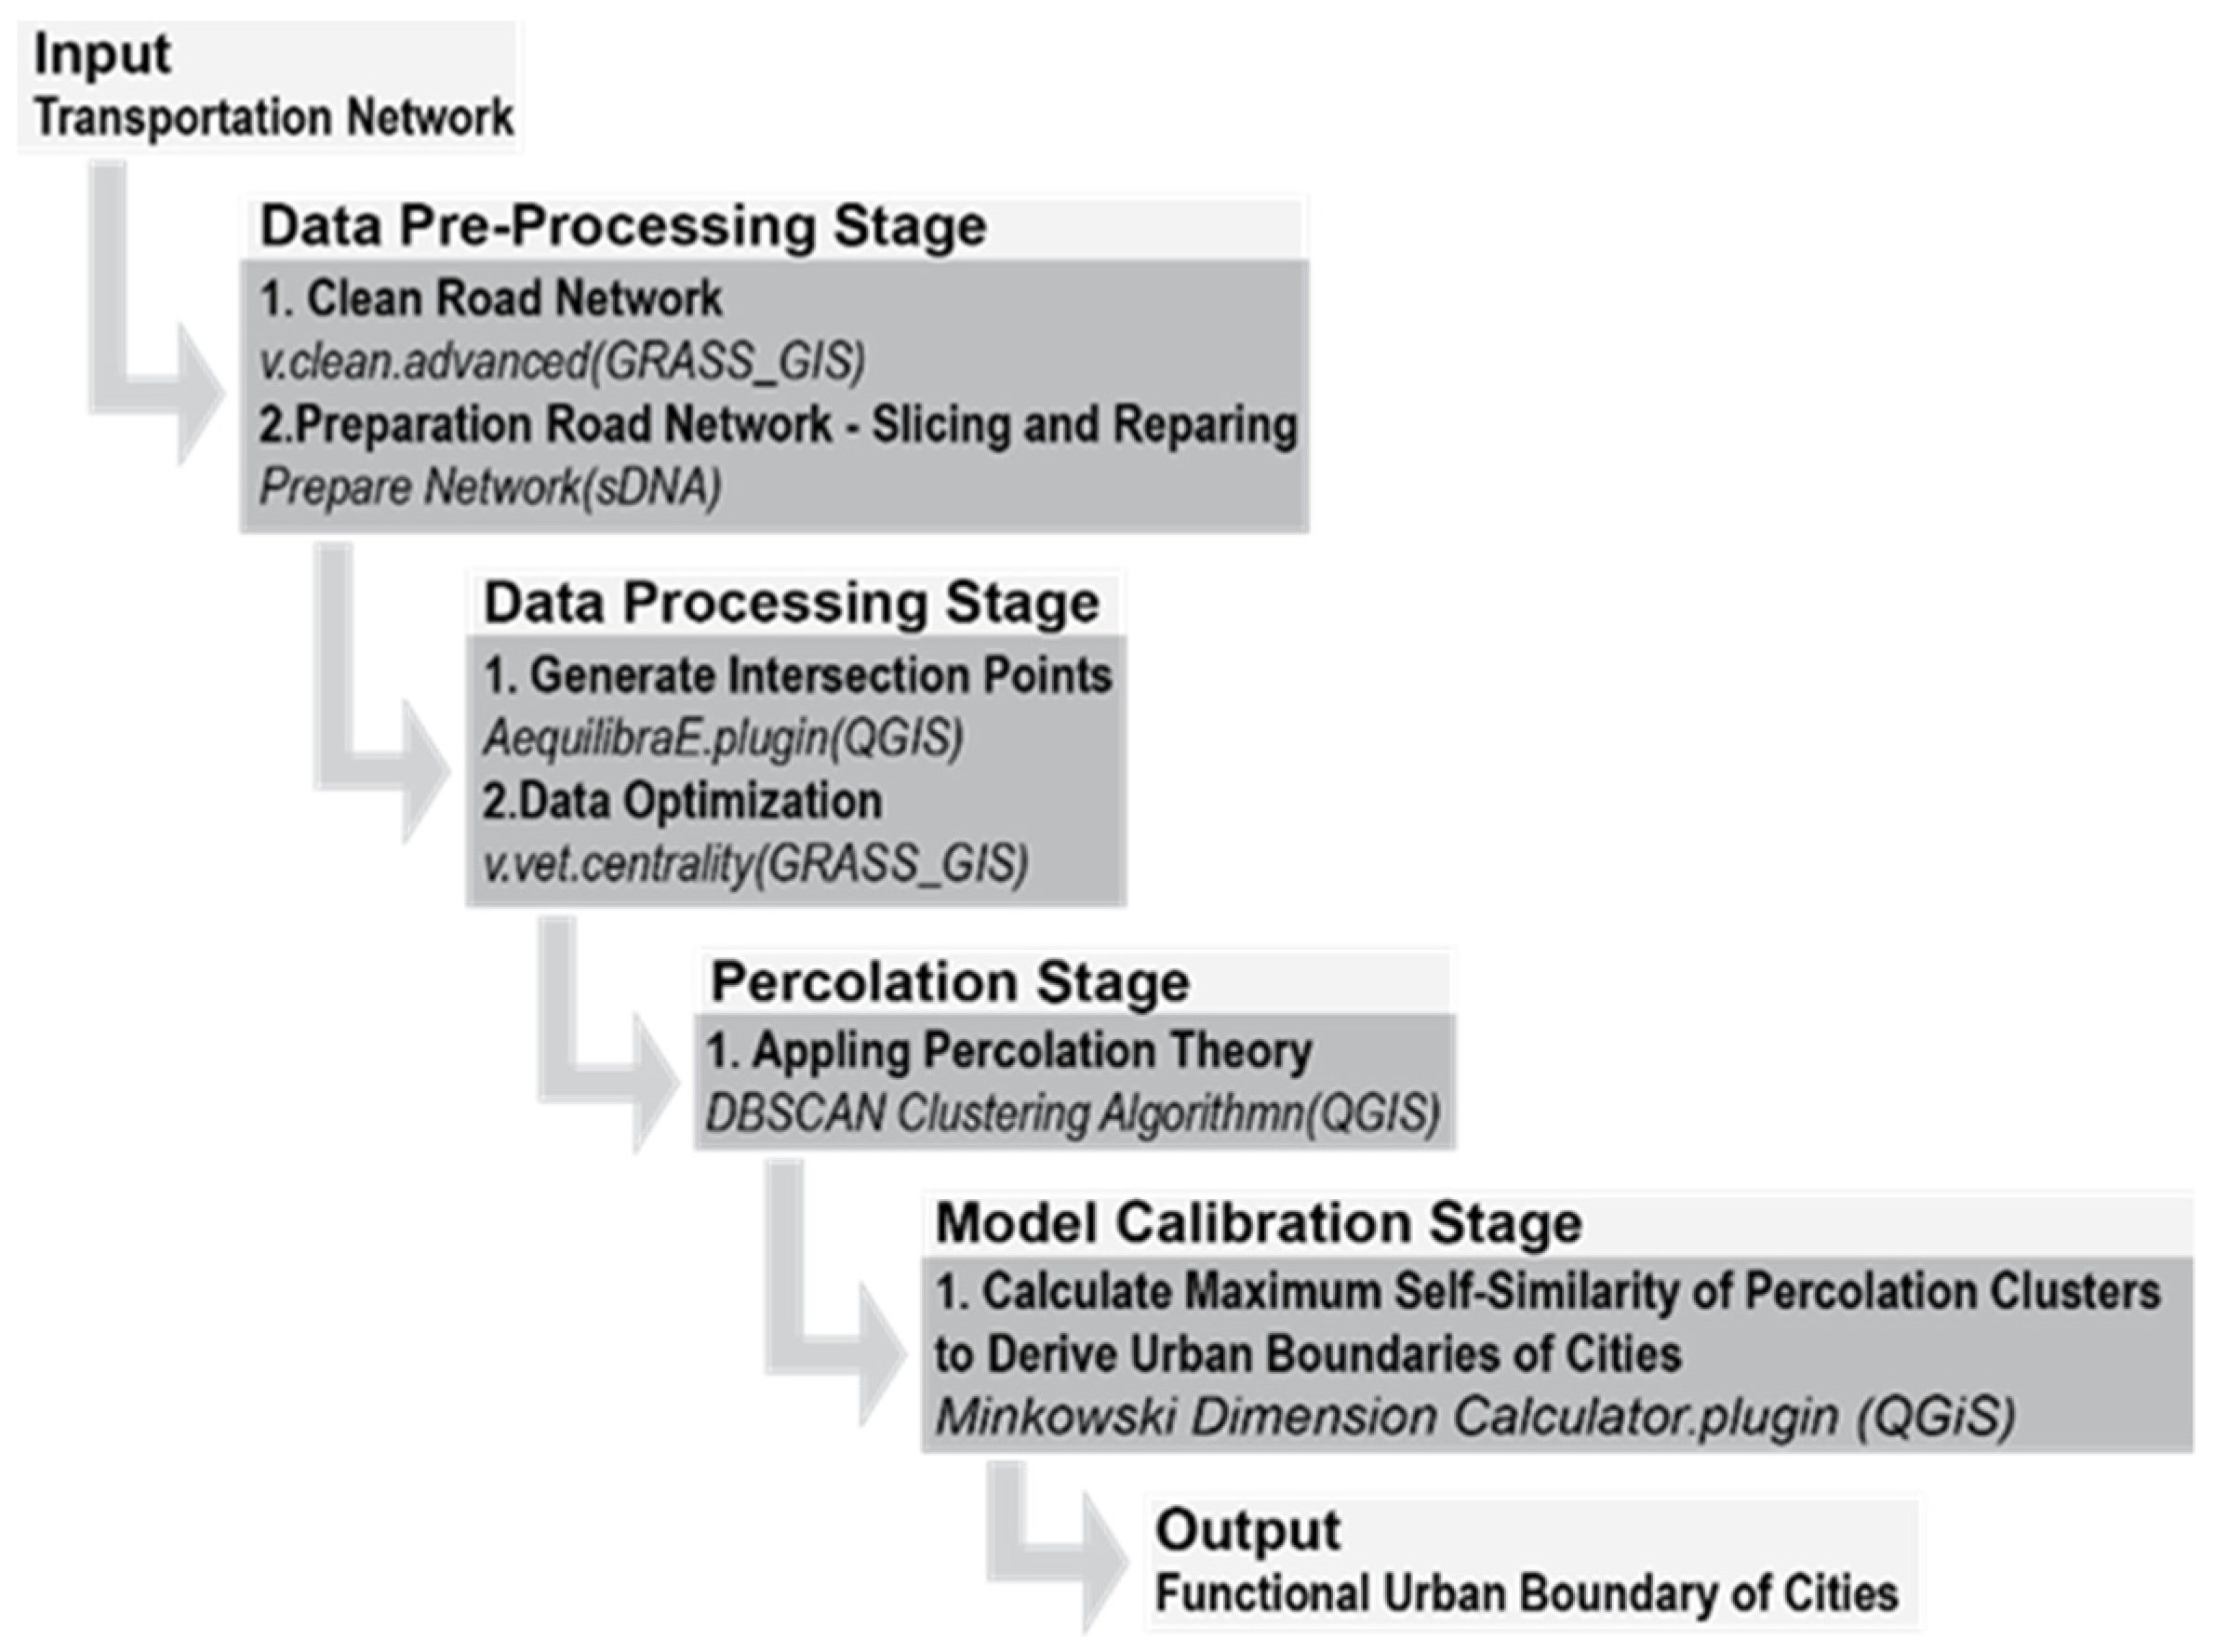
2.4. iCN Model Implementation

The implementation of the iCN Model can be divided into four major steps (refer Figure 3): I. Data Pre-processing Stage, which includes the initial data preparations; II. Data Processing Stage, which contains the intersection points generating and data optimization steps; III. Clustering Stage, which consists of the application of the percolation process; and IV. Calibrating stage, which consists of the calculating of the fractal geometry to derive the existing urban boundaries of cities. The open-source GIS applications were utilized to initiate each and every modeling step. The detailed information of the iCN model implementation is discussed in depth in (Kalpana et al. 2021).

2.5. Model Validation

The study utilized two model validation techniques in this study. First, the study empirically assessed the model validity of the iCN Model which derived urban boundaries of cities with satellite-imagery-recovered urban boundaries. This technique provides excellent visual interpretation about the model validity. Second, it statistically evaluates the model validity by calculating the KAPPA Coefficient of the iCN Model result and the satellite imagery recovered urban boundaries of cities. KAPPA estimation, in a nutshell, measures the percentage of inter- and intrareliability of two raster cells in categorical items (Hagen-Zanker 2009). The study occupied MOLUSCE plugin (QGIS) in order to calculate the KAPPA Coefficient, as the plugin provides excellent flexibility with the Raster Data calculation (Gismondi et al. 2013).
The application of the iCN Model and evaluating urban boundaries of cities is depicted in following section.

3. Analysis and Results

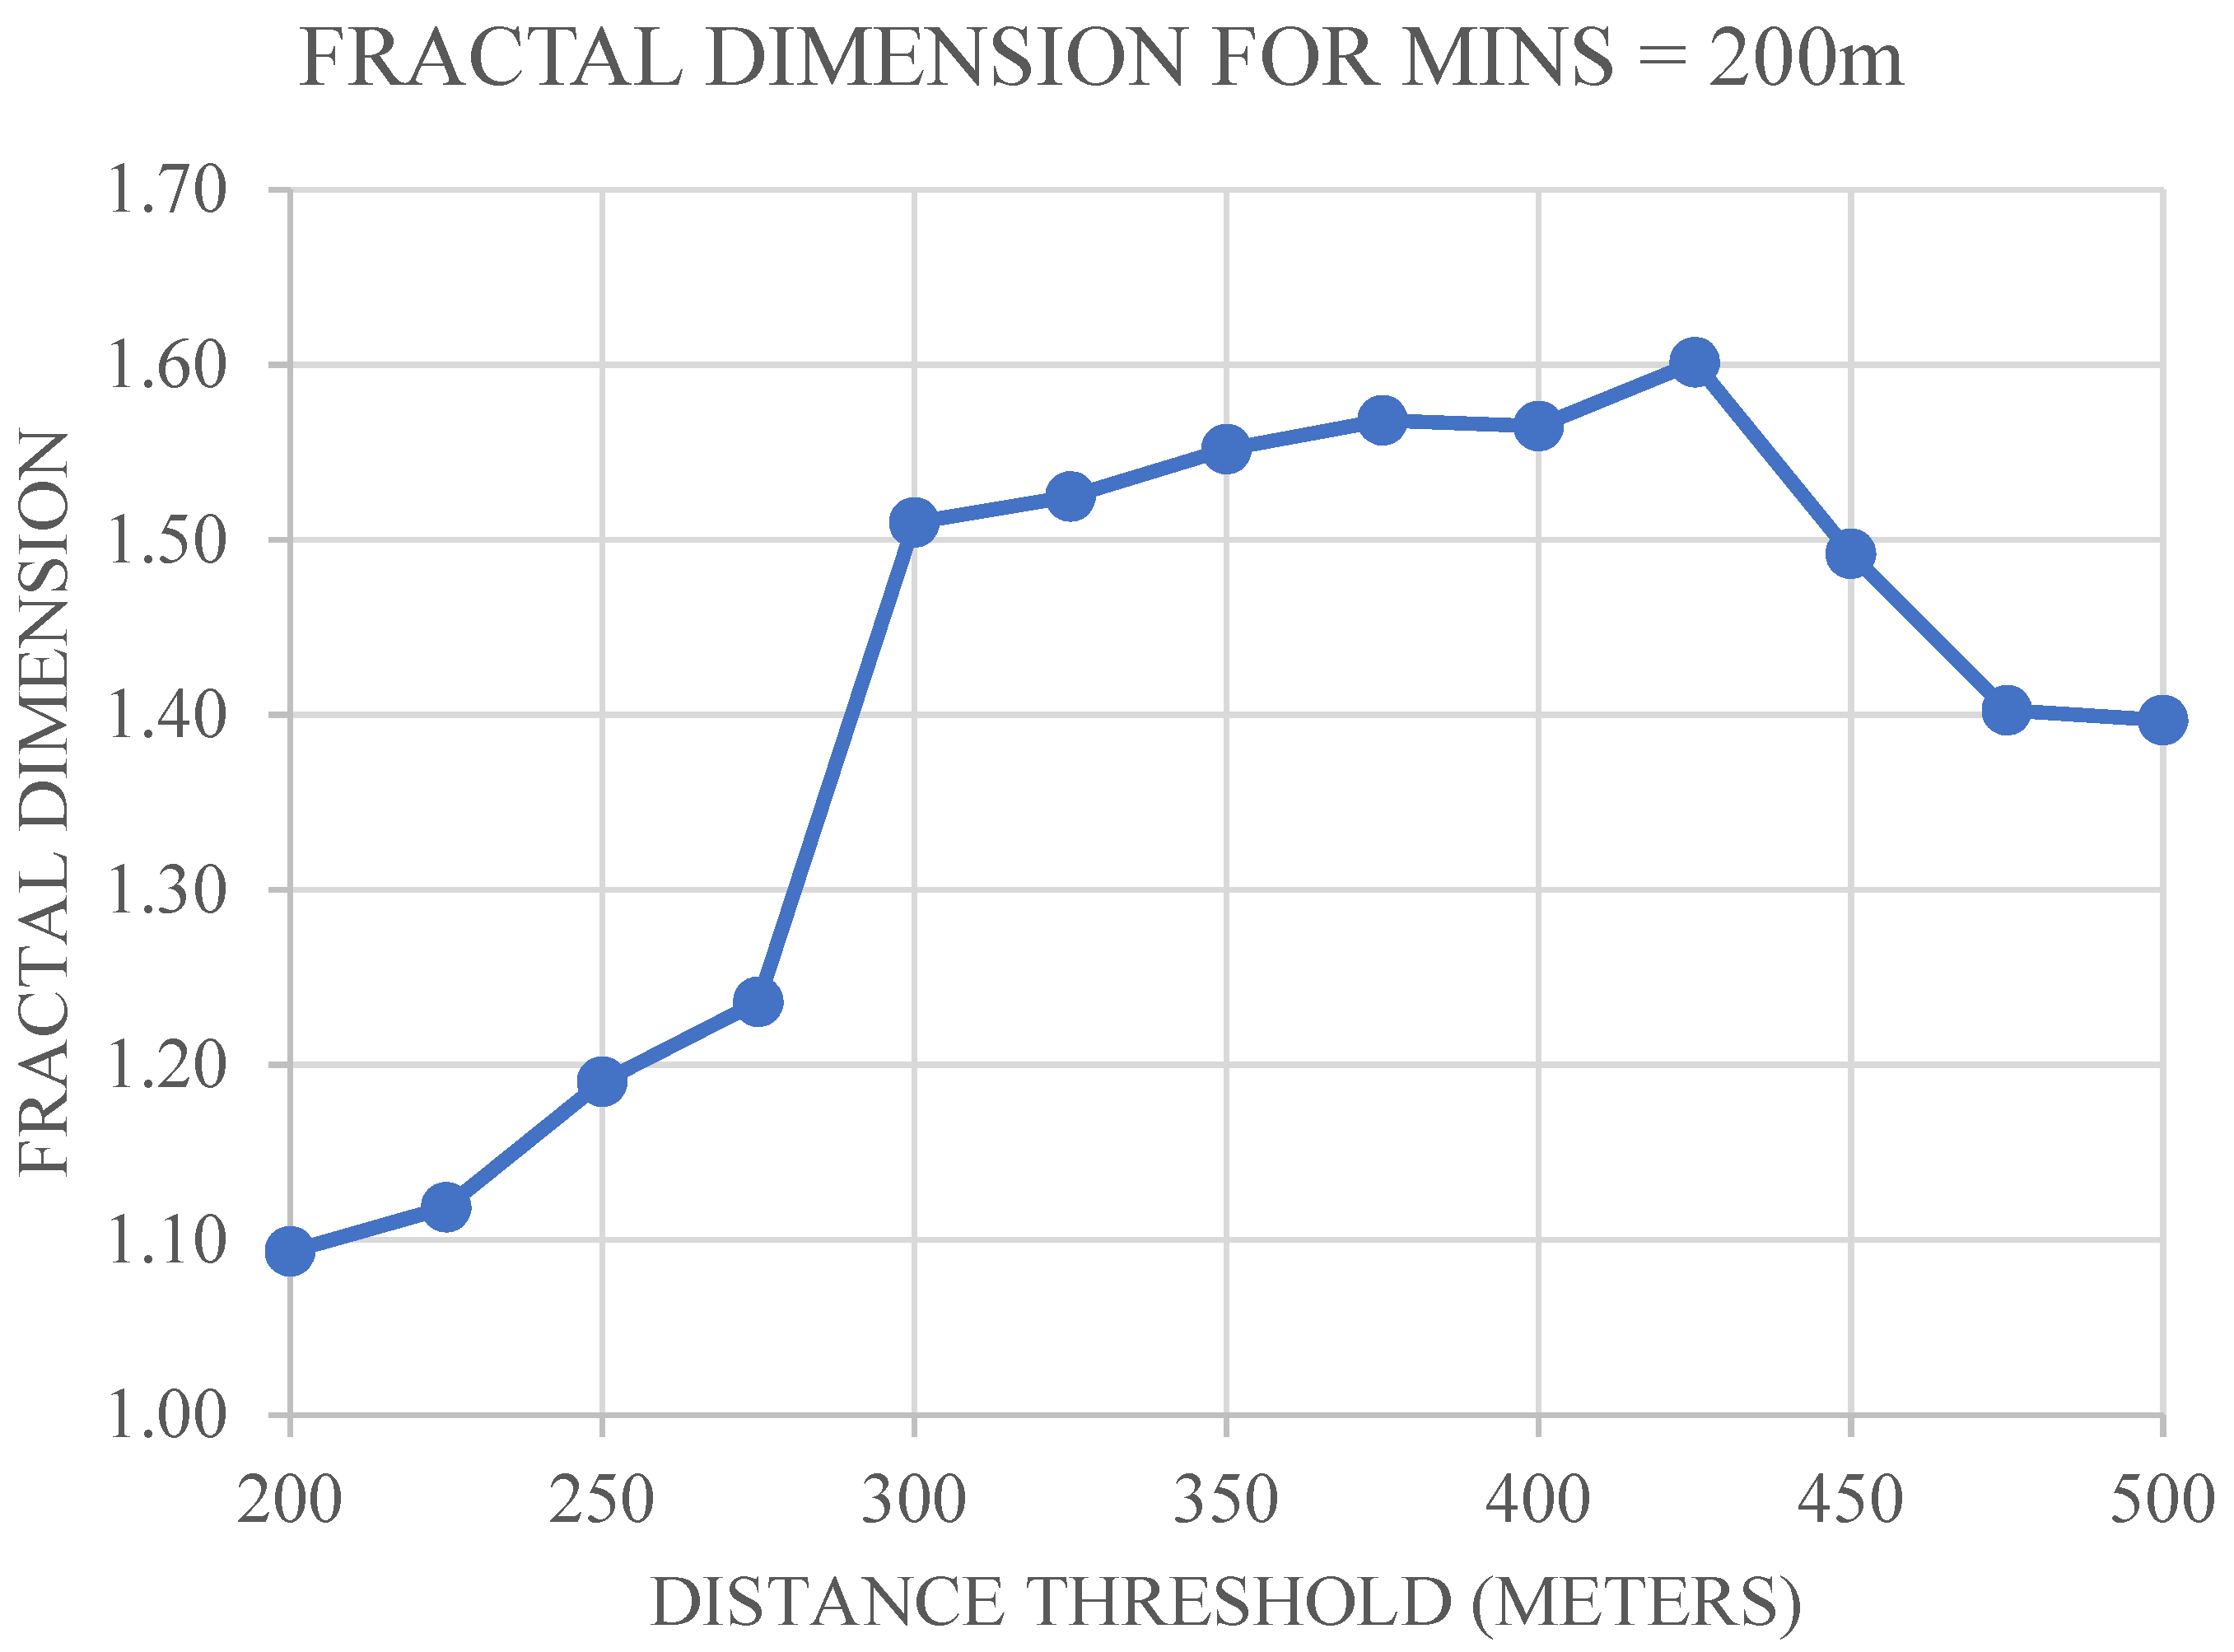
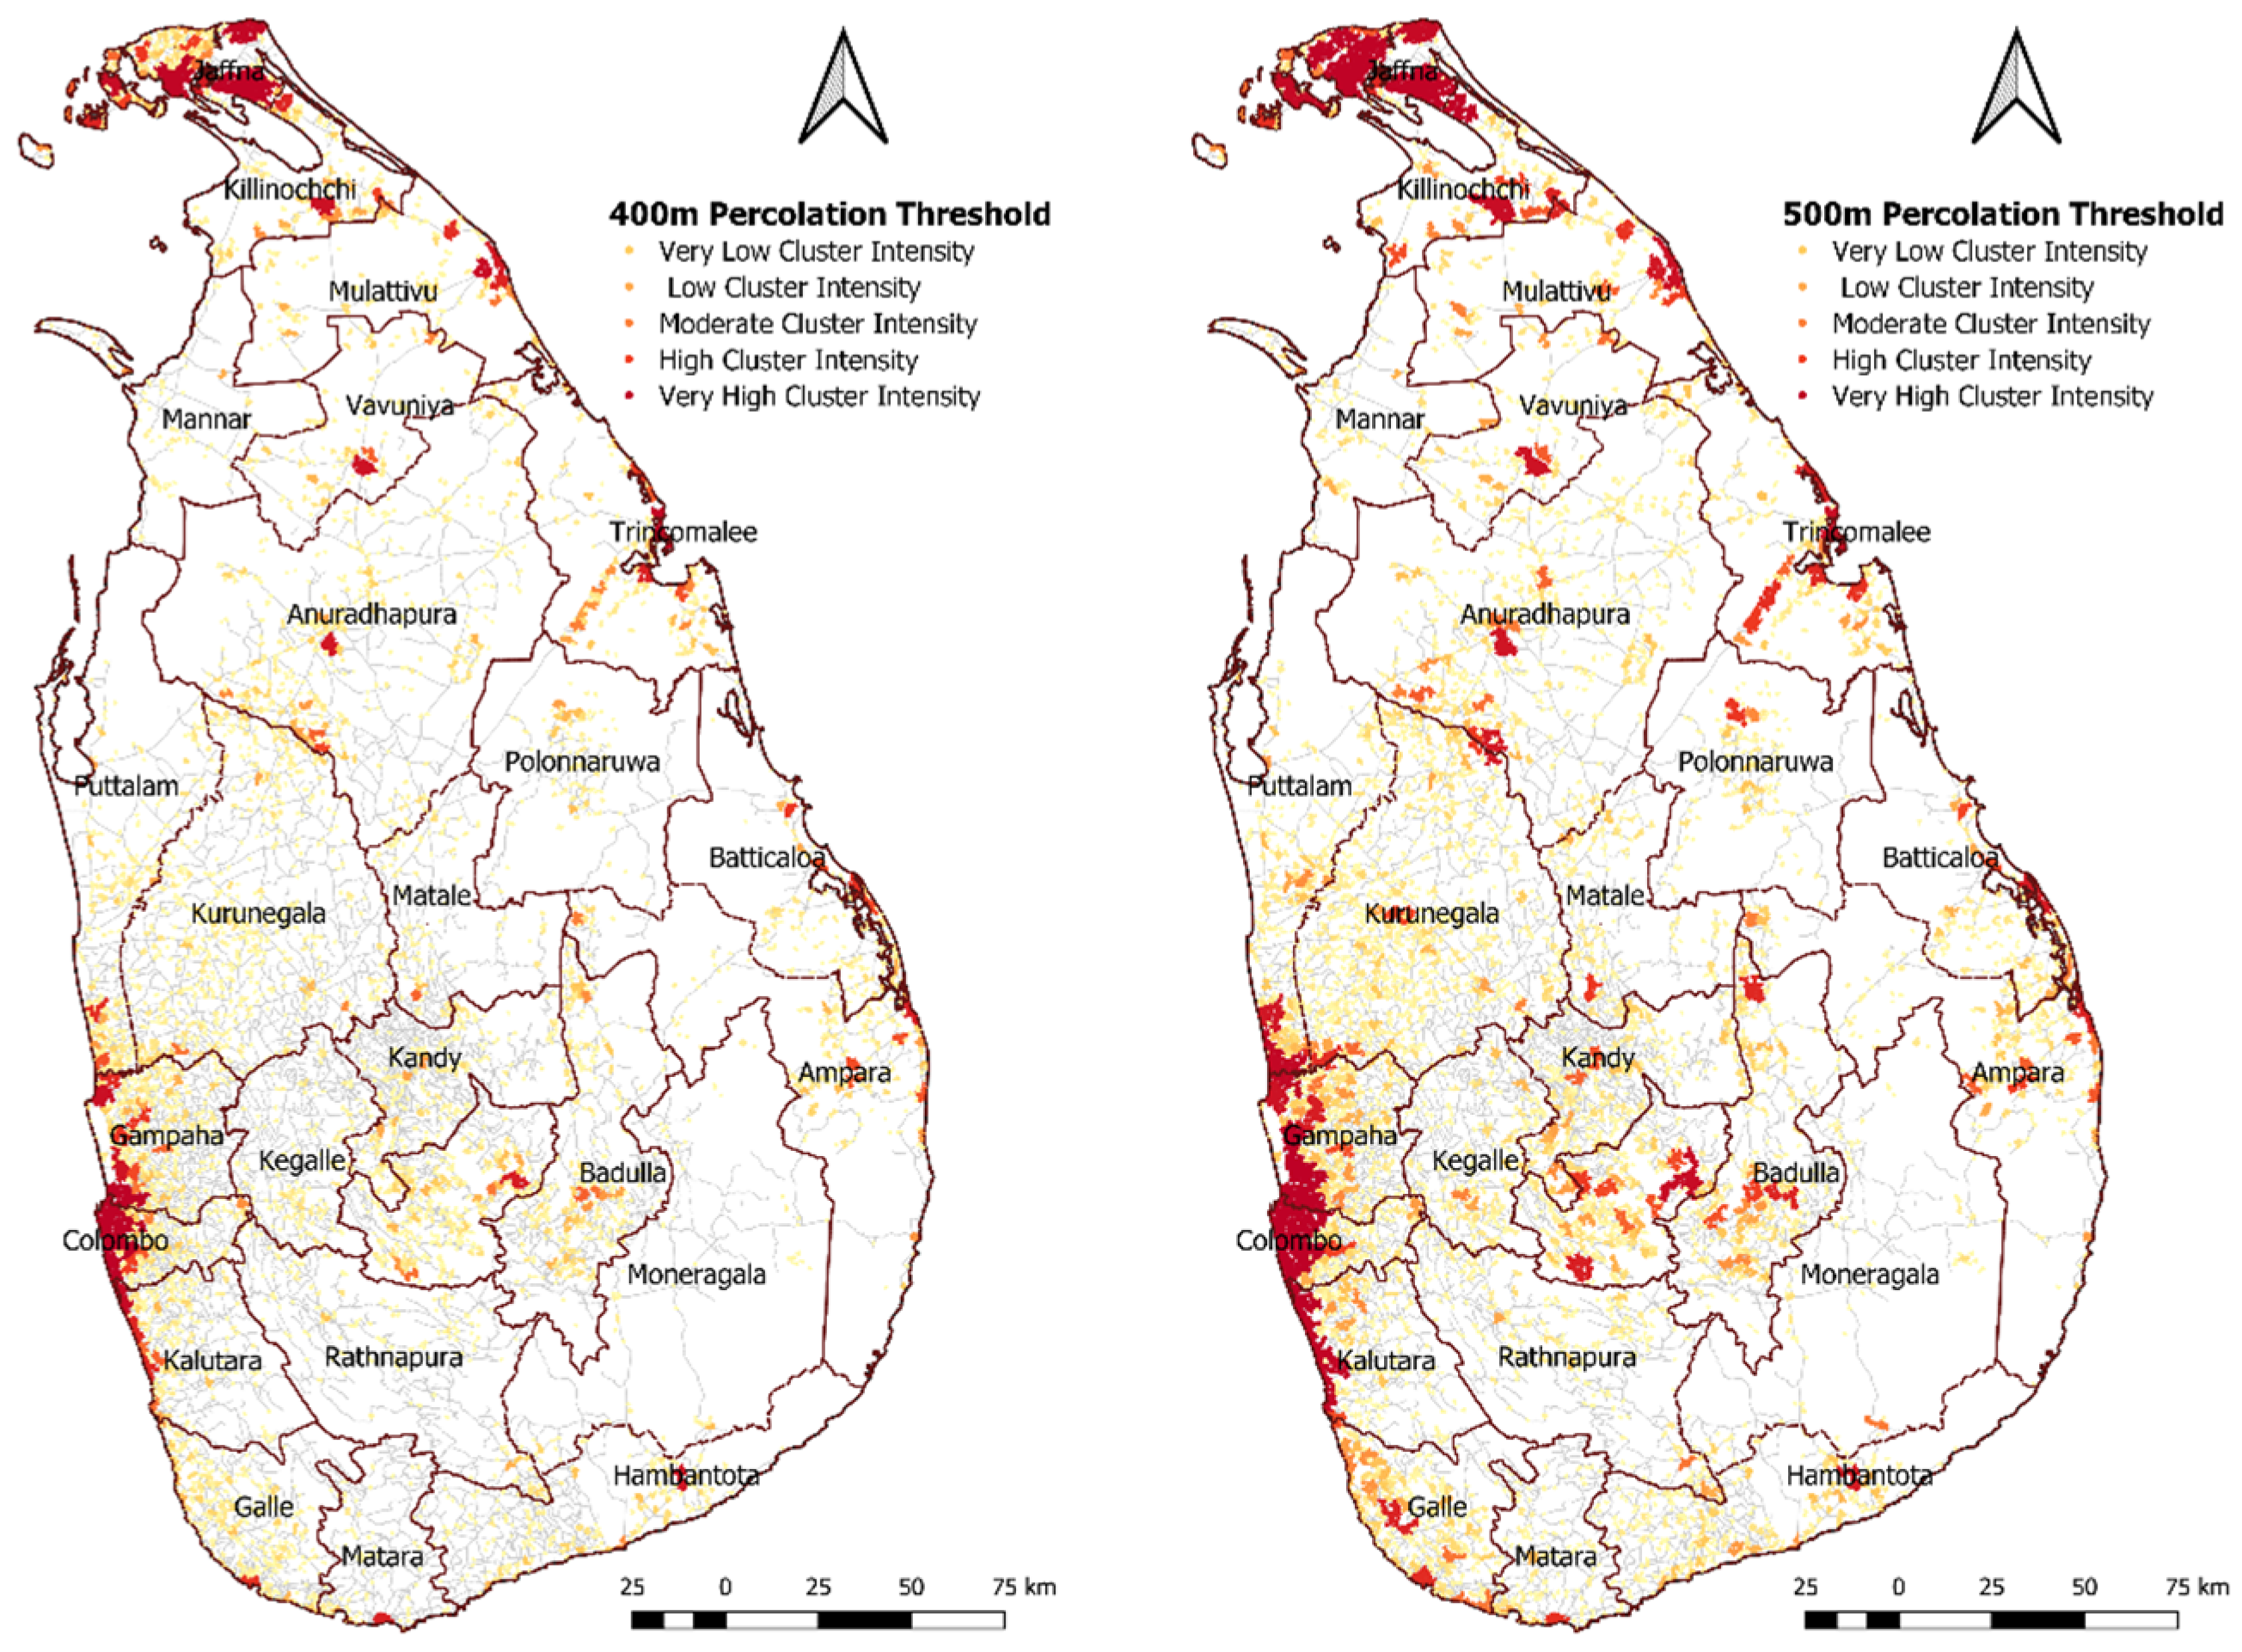
3.1. Application of the iCN Model

Before obtaining the urban boundaries of cities, it was necessary to identify each city cluster separately with its existing urban scale. Therefore, the study applied model assigned Data Preprocessing and Data Processing steps accordingly for the Sri Lankan Road Network, and then initiated the Clustering Process to derive the potential urban clusters. Afterwards, it applied Model Calibration steps to identify their existing urban scale. Finally, the perimeters of these urban clusters were able to distinguish the urban boundary of each city.
In the initial stage, the Sri Lankan road network consisted of 131,473 road intersection points. However, for the computational comfortability, it optimized the dataset by calculating the Degree Centrality. Intersection points below the 3.40 Degree were removed from the dataset, which predominately contain dead ends, overlapping nodes, unconnected road segments and traffic islands. A total of 89,367 of road intersection points were left after the data optimization process. Afterwards, the percolation steps from the lower threshold distance to the higher threshold distances were initiated to identify the most appropriate threshold distance—as it represents the cities at their existing scale. Figure 4 presents the model results of emerging urban clusters under the 400- and 500-m threshold distances.
Figure 4 clearly depicts the origin and evolution of the urban clusters when increasing the model’s assigned threshold distance. At the 400-m threshold distance, it distinguished the early stages of the Sri Lankan Big Cities (i.e., Colombo, Jaffna, Kandy, and Galle, etc.). Thus, it distinguished the rapid growth of these urban clusters when it increased the model’s assigned threshold distance (i.e., 500 m). This clearly represents the spatial evolution of these large urban clusters by absorbing the surrounding potential and small cities into these urban clusters. For instance, the Colombo urban cluster is growing steadily by absorbing the surrounding potential into one giant metropolitan cluster. In other ways, the study identified some urban clusters that do not have the potential to grow when increasing the threshold distance. These urban clusters distinguish themselves from the segregated or isolated urban clusters due to the lack of transportation accessibility. In such a context, the proposed model delivers very important insights about the evolution of urban clusters, their urban development patterns, and spatial segregation, which are extremely important for urban development policy formulation.
Afterwards, the study initiated Calibrating steps, which help to identify the existing scale of the cities. Thus, the study calculates the self-similarity distribution of each derived city cluster, and the maximum Self-Similarity distribution value corresponding threshold distance identified as the existing urban scale of the cities. Figure 5 depicts the Self-Similarity value distribution of the Fractal Dimension at each distance threshold.
As depicted in Figure 5, the self-similarity of urban clusters gradually increased until the threshold distance reached the 425-m threshold distance, where it reached the maximum self-similarity of the Fractal Dimension. Thus, the 425-m distance threshold illustrates the maximum functional distribution of the city, and its perimeter distinguishes the functional urban boundary of each derived city. This clearly reflects the relationship between the transportation accessibility and the existing urban scale of the cities, as the study utilized the accessibility of the transportation network to derive the urban clusters. After the 425-m distance threshold, the Fractal Dimension tends to decrease as the urban cluster evolves beyond the exact urban territory. This caused a decline in transportation accessibility because, compared to urban areas, suburban and rural areas’ transportation accessibility is significantly lower. This spatial transition is cleverly identified by the model, which incorporates the Fractal Dimension. On the other hand, it could be attributed to the existing socioeconomic development pattern of the Sri Lankan cities, as the transportation network captures the socioeconomic characteristics since the road intersections are considered the primary points of interactions and urban agglomerations (Arcaute et al. 2016). Figure 6 presents the existing urban scale of the emerged city clusters and their spatial distribution all over the country of Sri Lanka.
Afterwards, the study derived each emerged city cluster’s urban boundary as the overarching aim of the study.

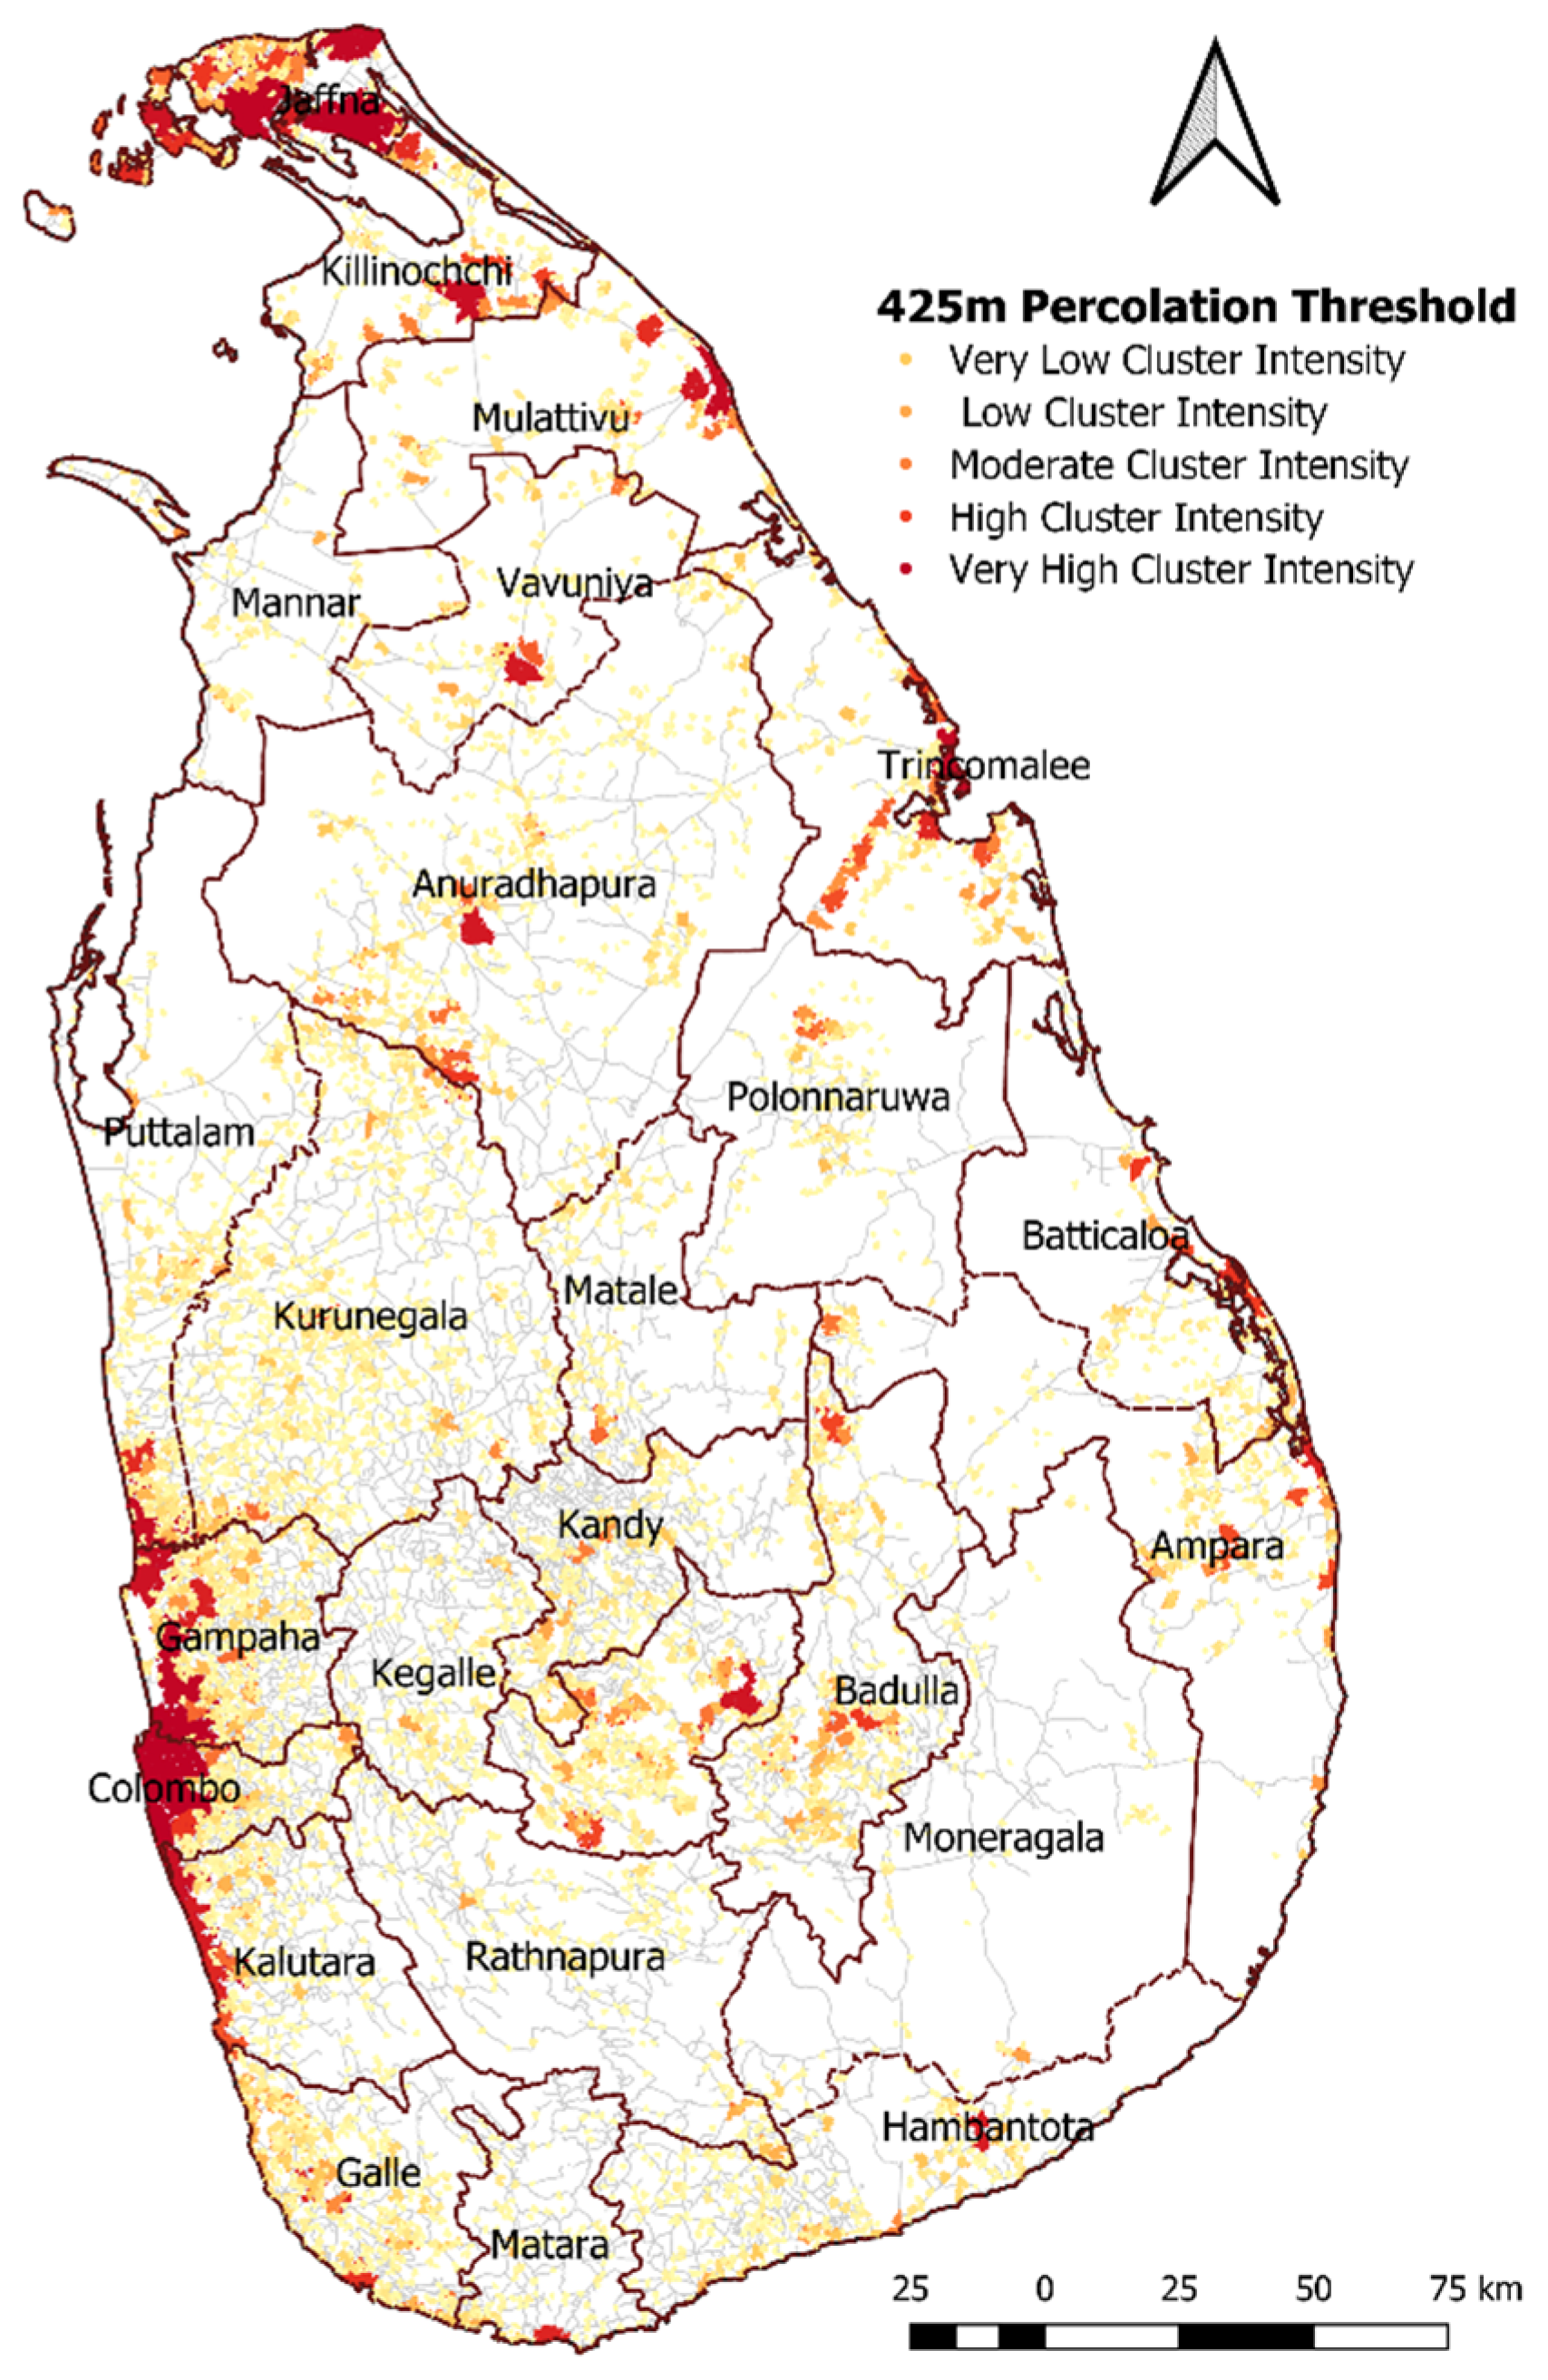
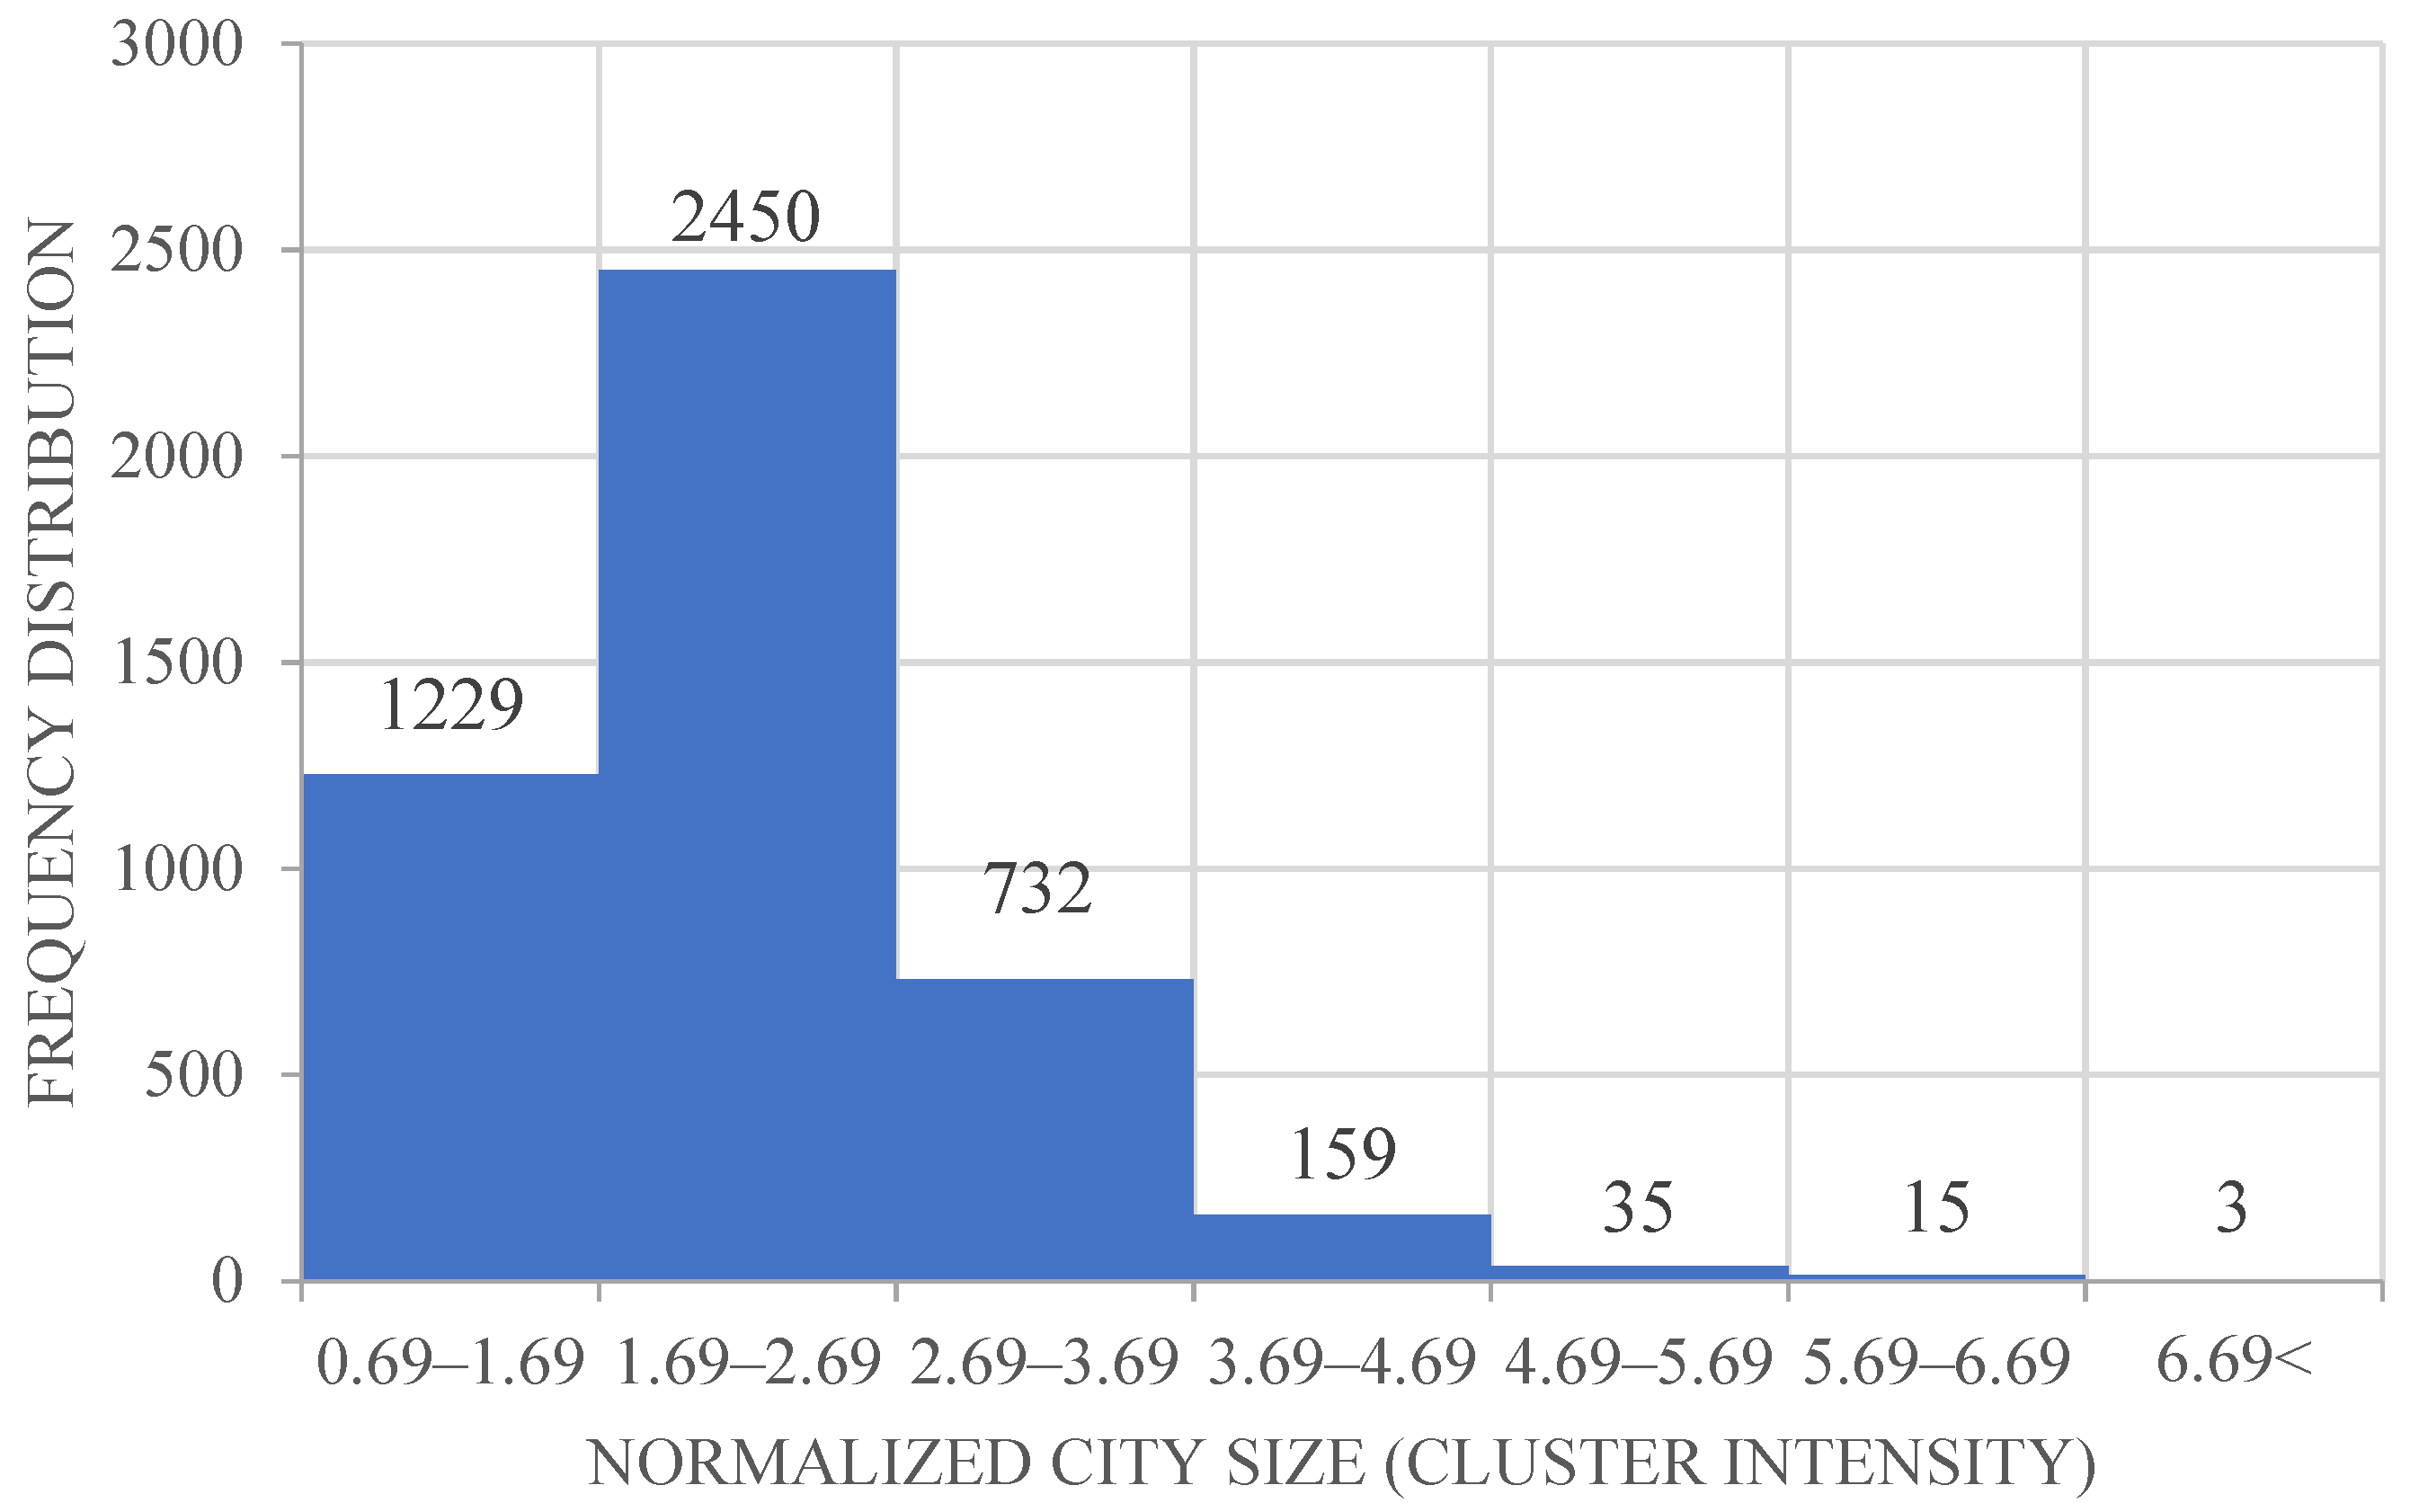
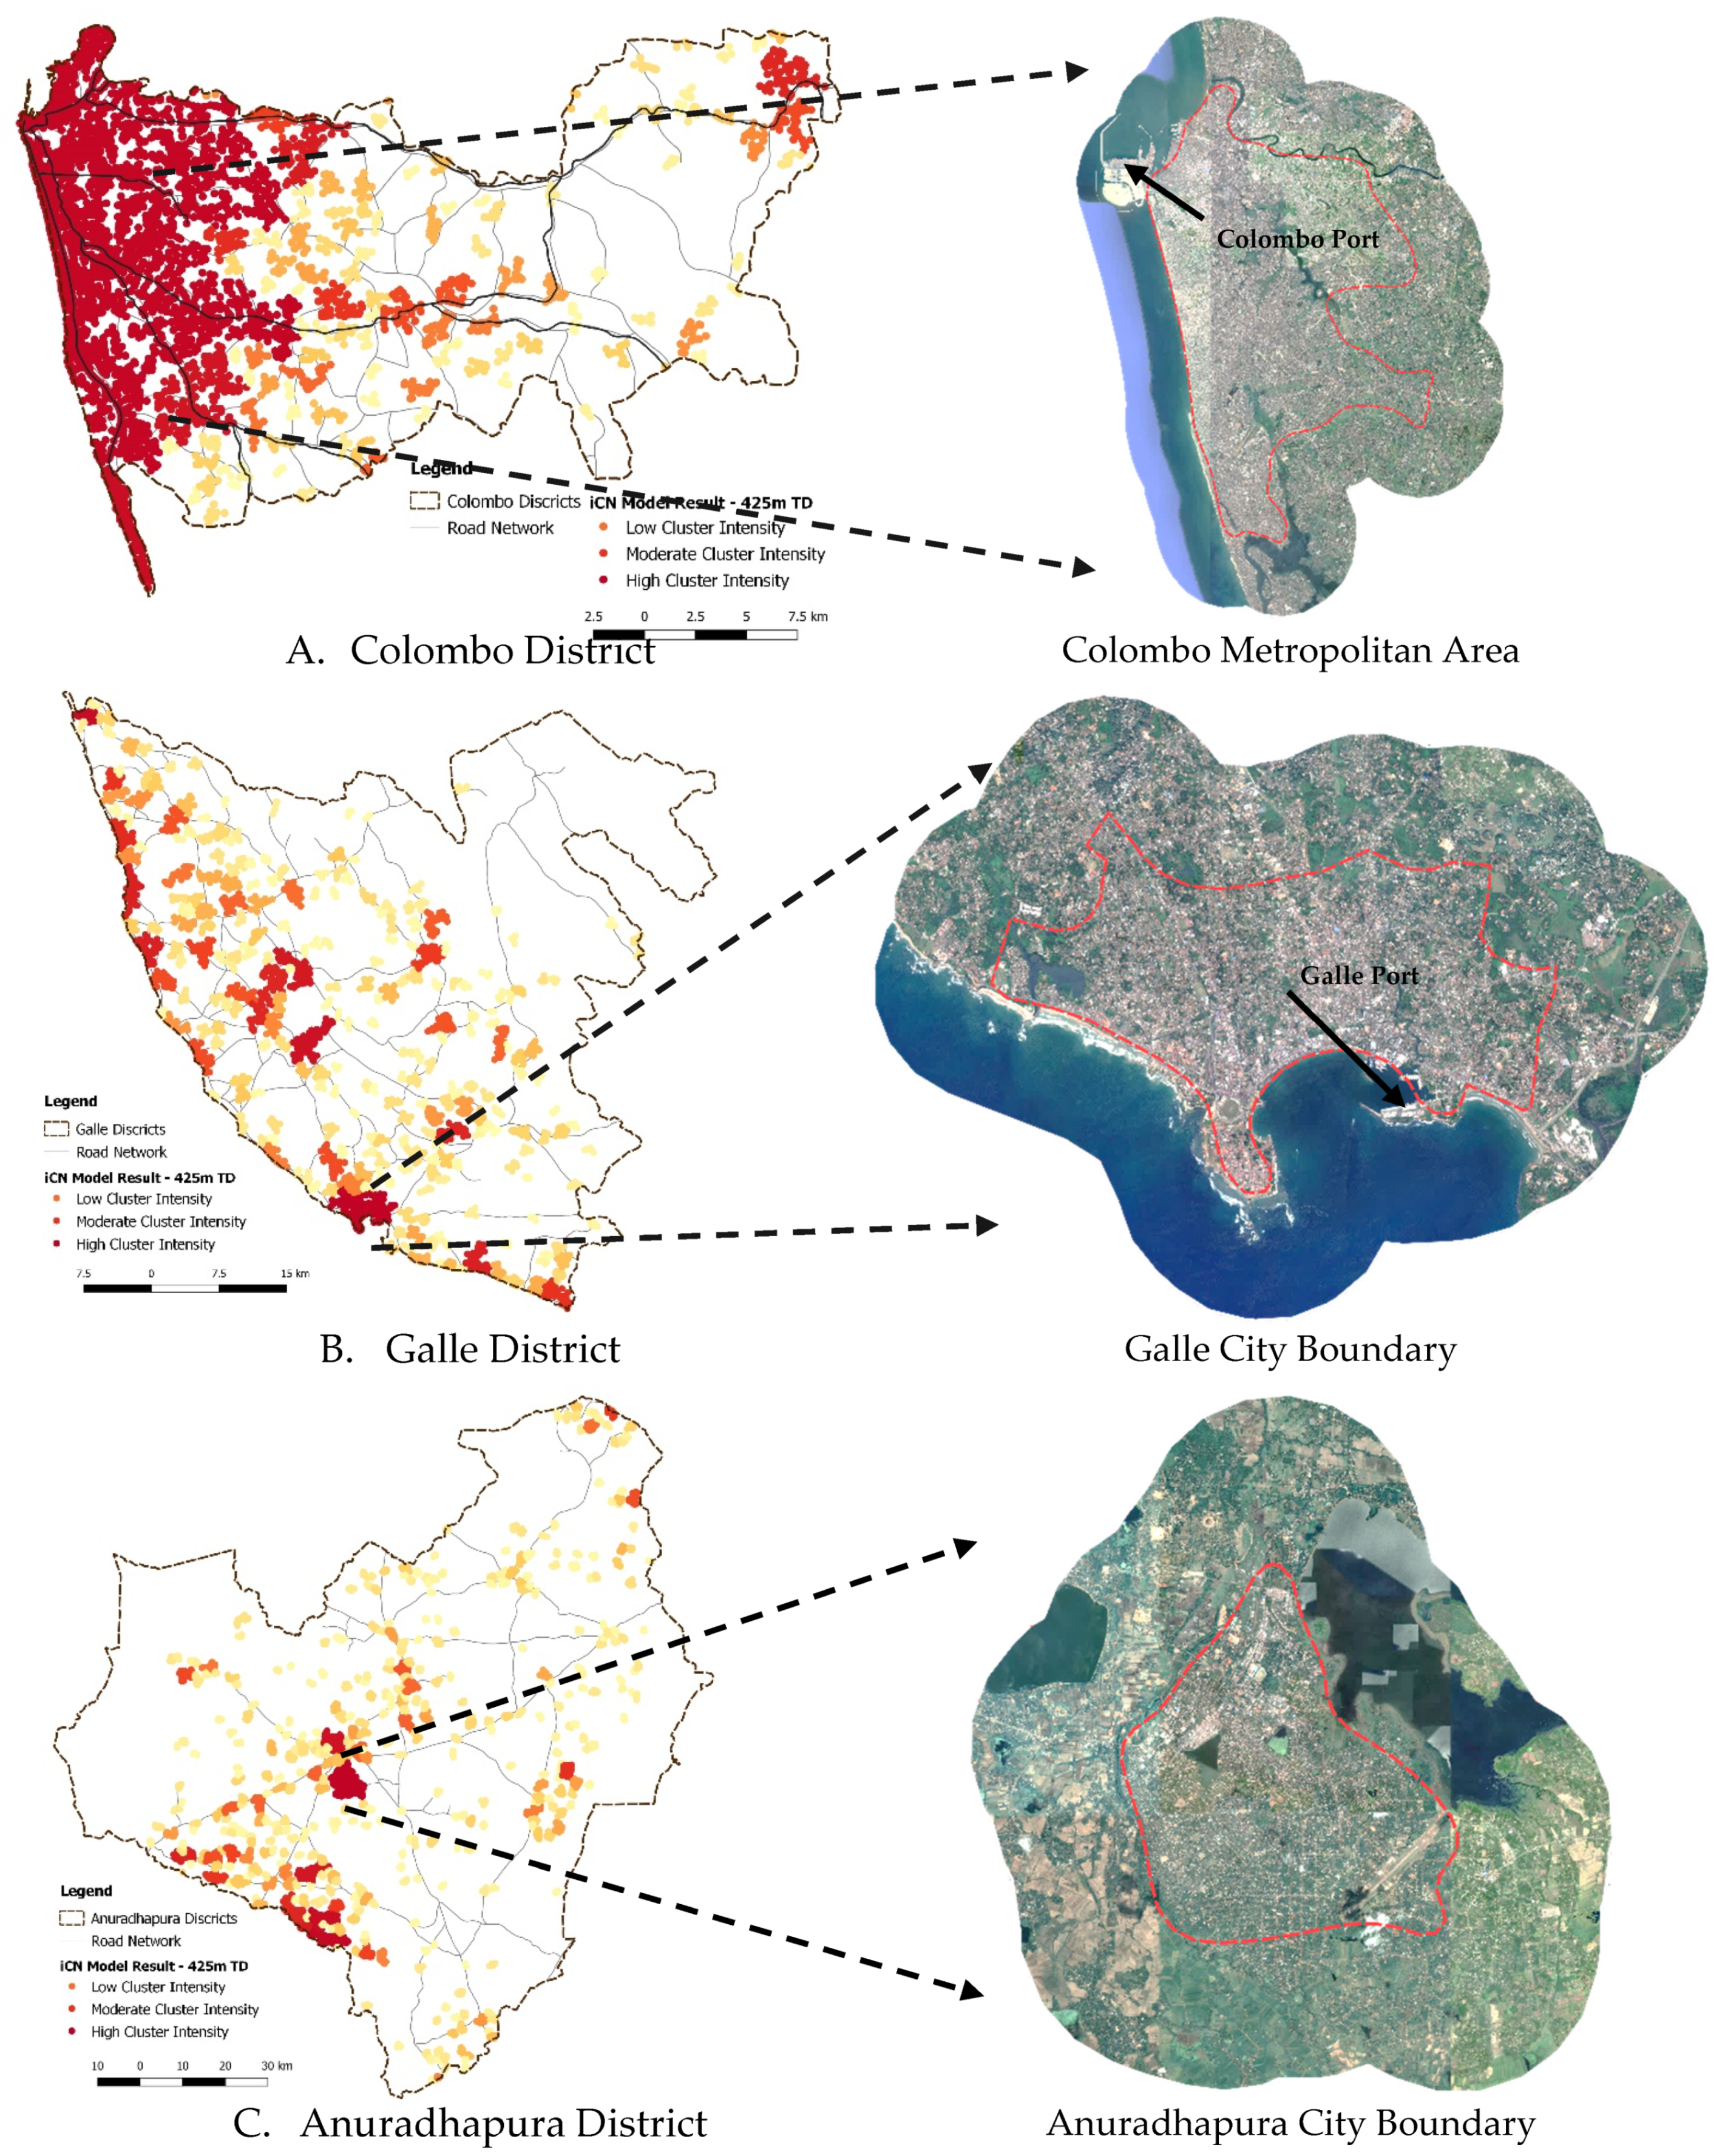
3.2. Urban Boundaries Derived from City Clusters

Since the model identified each individual city cluster with its existing urban scale, their perimeters distinguished the urban boundary of each city. Figure 7 presents the iCN model-calculated urban boundaries of cities for the three selected districts in the country. The most important advantage of the model is that—unlike other urban simulation models—it can shift between different scales instantly (i.e., from the national/regional scale to the smallest neighbourhood scale) as it is built upon the primary indicator of urban agglomeration, which is the road intersection. Therefore, the model is capable of identifying any urban scale and denoting their urban extent. This knowledge provides deep insights to the scaling behavior of cities and is essential for the city hierarchy assessments.
According to the model findings of Figure 7, most districts are distinguished by their minor scale city boundaries (1000 < Cluster Intensity) which are disaggregated by poor transportation accessibility, inadequate urban agglomeration, and spatial interactions. As mentioned above, the model captured the urban boundary of the city corresponding to the accessibility and locational proximity of two adjacent road intersection points in the transportation network, which are (i.e., intersection points) considered as the primary indicators of spatial interaction and urban agglomeration. Therefore, it can be distinguished that most Sri Lankan cities, which lack road accessibility and locational proximity, do not perform as larger-scale city clusters, which is the cause of its decreased potential to increase the spatial interaction and urban agglomeration and to emerge as large-scale city clusters. However, it is distinguished that the Colombo city cluster (Figure 7A) emerged as a giant urban cluster (3298 ≥ Cluster Intensity). Colombo is considered as the commercial capital of Sri Lanka, and it is enriched with an excellent transportation network, with proper transportation accessibility and locational proximity. Thus, it has enhanced the spatial interaction and urban agglomeration of the road intersection points and emerged as a giant urban cluster—compared to the other regions of Sri Lanka. This phenomenon is clearly distinguished by the tightly embedded urban development pattern and transportation network of the Colombo District (refer to Figure 7A).
As discussed above, a majority of city clusters have been distributed around the 1.69–2.69 Cluster Intensity (Normalized), which represents the minor scale cities (Figure 8). These clusters represent the local townships which are disaggregated by poor transportation accessibility, inadequate infrastructure enhancements, and backward economic agglomeration when compared to the mega scale city clusters, i.e., metropolitans.
Afterwards, the study examined the empirical and statistical validity of the proposed method.

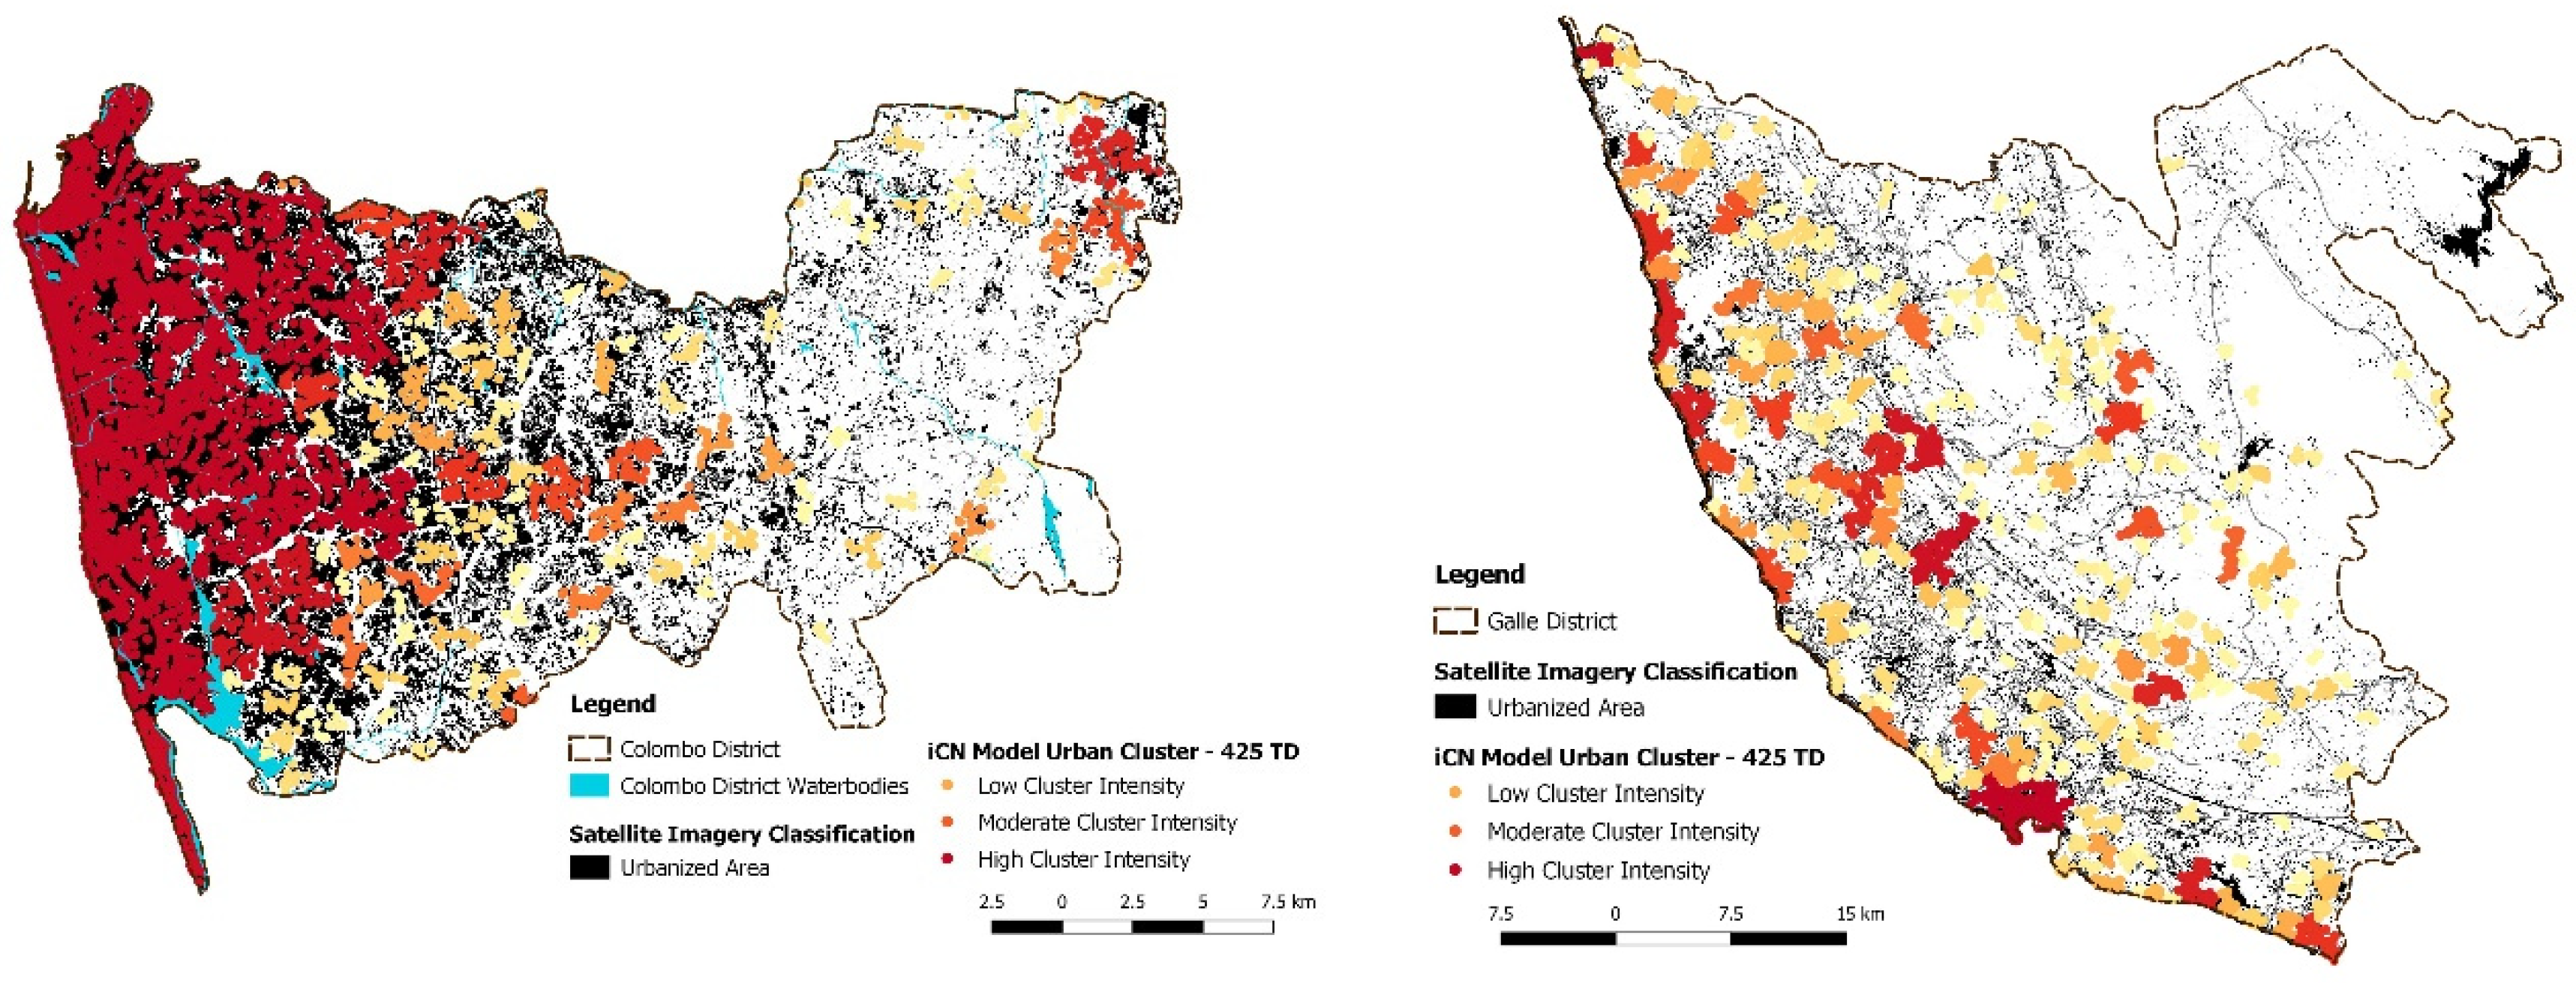
3.3. Empirical Test of the Model Result

Subsequently, the study assesses the validity of the iCN-model-derived urban boundaries of cities empirically with satellite-imagery-recovered urban boundaries. Hence, it has utilized the Landsat 8 imagery from the USGS Earth Explorer Repository, due to the unavailability of high resolution open-source satellite imageries for Sri Lanka. The Supervised Classification Technique was utilized for image classification and recovered urban boundaries with the maximum spatial accuracy of 15 m Cell Size, after Pan-Sharpening the satellite imageries. The comparison of both approaches is depicted in Figure 9.
As depicted in Figure 9, the urban boundaries recovered from both methods are significantly identical. However, several unequal urban boundaries can also be identified, which might be caused by the classification limitations of the satellite imageries (i.e., image distortions, cloud cover, and noise) caused by over estimations. On the other hand, the iCN Model is considered accessible with locational proximity to derive the urban boundaries and provide more satisfactory results for the urban boundary classification. Another significant benefit of the model is that it can separately identify the urban boundaries of each individual city. This is a very important feature when observing the spatial development pattern of cities and calculating the urban boundary of the corresponding city. In addition, the proposed urban boundary demarcation framework provides a significant insight to the urban and transport planning practitioners to manage urban and transport development and evaluate their applicability in future scenarios. For instance, the study identified that transportation accessibility significantly impacts on the urban development of cities. Other areas with poor transportation accessibility may cause inadequate urban development. These findings provide a deep insight to the policy makers and planning practitioners to improve these fragile areas, by enhancing the infrastructure facilities. Thus, these findings are essential to take policy level interventions in their early stages, preserve these areas, and achieve the desired sustainable development goals.

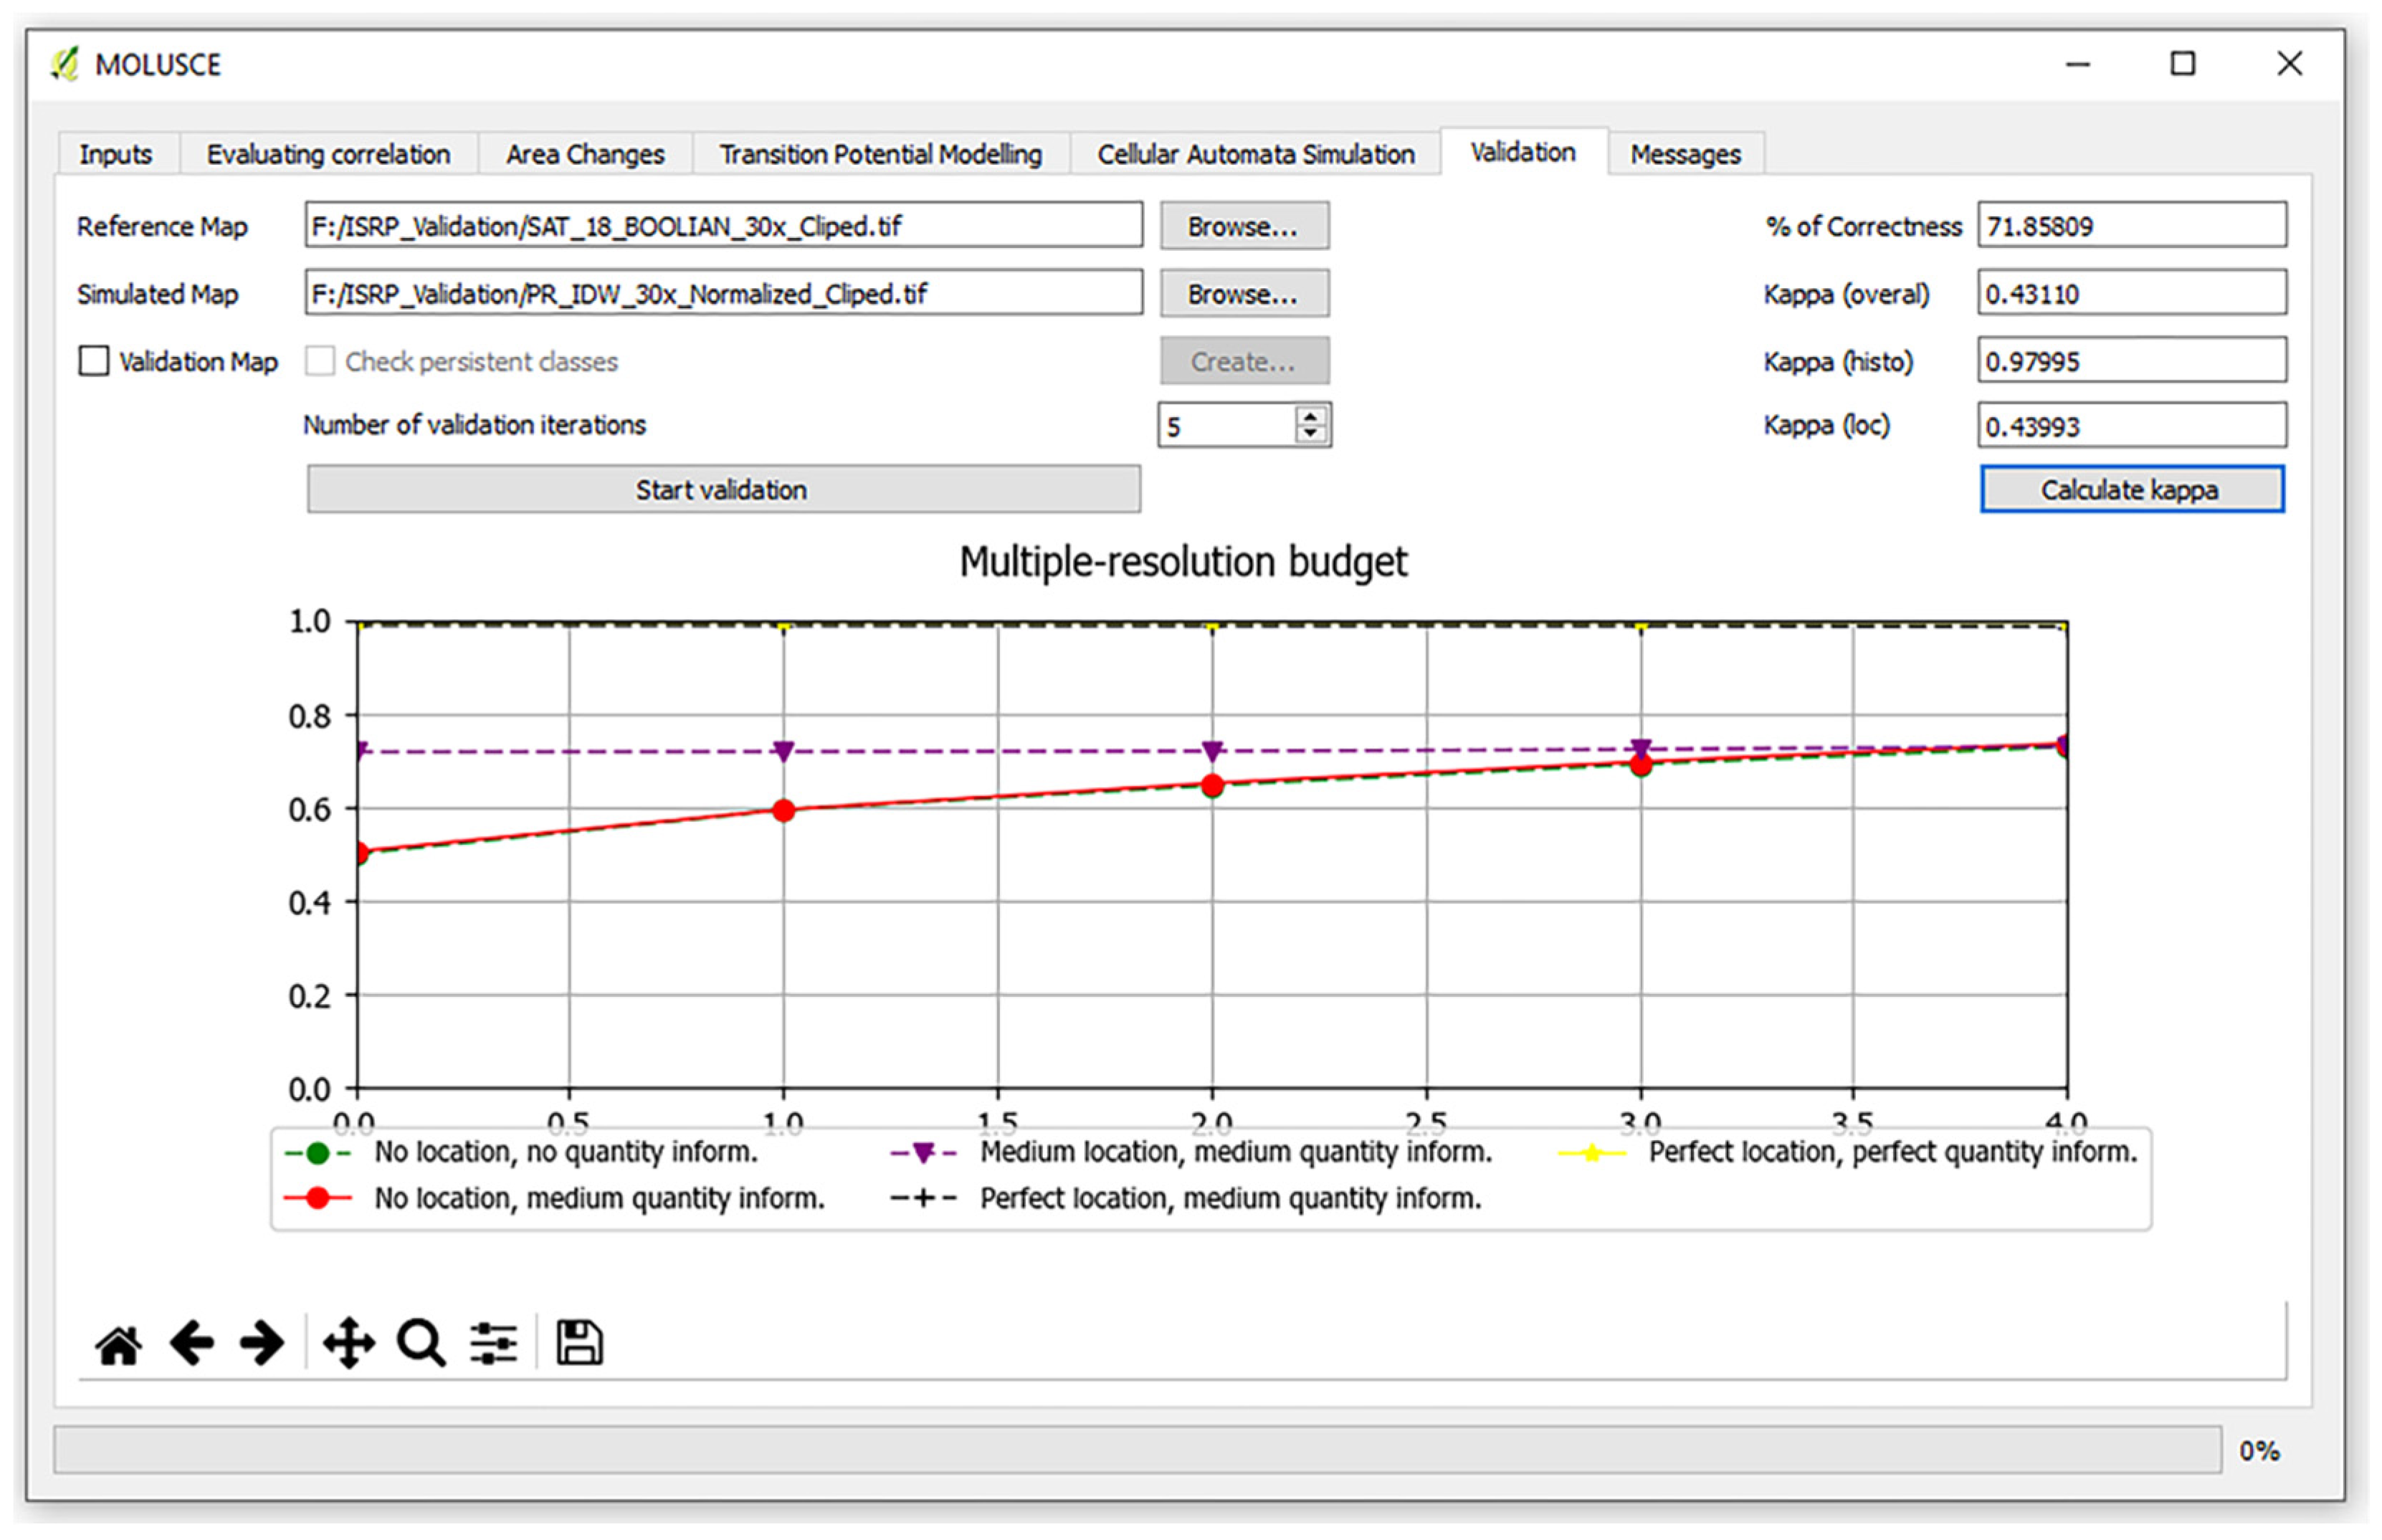
3.4. Model Validation

Figure 10 presents the KAPPA Coefficient result of the model validation. The validation results of the model depict 71% of KAPPA Accuracy. Hence, the proposed approach would be satisfactory to measure the urban boundaries of cities. However, this accuracy overly depends on the quality of the satellite imagery classified urban boundaries of cities. In addition, the study utilized percolation threshold distances and fractal geometry values that are not universal or uniquely characterized, as they vary according to the occupied Road Network and the nature of the area. Therefore, the 425-m Fractal Dimension may not be applicable for the same area with a different dataset or different area with the same dataset.

4. Discussion and Conclusions

The study utilized the iCN Model framework to derive the urban boundaries of cities; and proved that the road intersection point is the perfect proxy to model the functional urban boundaries of cities by utilizing the accessibility and locational proximity of the transportation network. It utilized the percolation theory to identify the corresponding city clusters. As a result, the present city scales were determined by measuring the clusters’ maximum Fractal Dimension distribution. In recent studies, the percolation theory and fractal geometry has been predominantly utilized to study the urban hierarchy and scaling nature of cities. Thus, this study is more advanced as both measures are applied to distinguish the urban boundaries of cities.
Considering the method and modeling performance, the study identified that the same methodology, which the iCN Model proposed to derive the urban agglomeration, can be easily applied to obtain the urban boundaries of cities. Thus, it proves the hypothesis made by this study. The urban boundaries are derived by measuring the Fractal Dimension of each urban cluster. The model clearly distinguished that at some stage, the Fractal Dimension tends to decrease as the transportation accessibility of the city drastically changes when moving towards the suburban and rural areas. On the other hand, the model introduced data optimization methods to help easily filter the unconnected road segments and traffic islands from the road network. This technique is essential for large datasets as it can easily optimize the dataset according to the level of connectivity of the road intersection points. Moreover, the proposed method is completely based on the opensource GIS applications by utilizing open source data. Therefore, it would be beneficial for the developing and under-developed countries for their research and decision-making practices. In addition, the proposed method is capable of accessing multiple scales (i.e., neighbourhood, local, and regional scales) simultaneously and distinguishing urban clusters at different scales. Therefore, the iCN model is equally applicable to study the urban allometry and spatial interaction of cities. Furthermore, the proposed model denotes excellent accuracy as it is capable of predicting the city clusters and their urban boundaries with more than 72% precision.
The findings of the model prove that the modern urban development pattern is clearly reflected through the transportation network configurations in the areas where higher transportation accessibility is available, with potential for rapid urban development. This is clearly distinguished by the urban cluster of the Colombo district as it evolves on the major transportation arteries. The model also implies that the evolution of cities’ urban boundaries from their origin to the giant urban cluster can distinguished by increasing the threshold distance inbetween the two adjecent intersection points. This is very important feature of the model to understand the evolution of each cities and their spatial interactions. For instance, the study implies that most of the coastal cities starts to developed from the potentials of ports and then development trickle down towards the suburban areas by the transportation accessibility (i.e., Figure 7A,B). In addition, the study proves that the alleged administrative boundary demarcations understandably misinterprets the actual urban boundaries of cities. This is clearly illustrated in Figure 11. It denotes that none of the administrative boundary classifications (i.e., Municipal Council or Urban Council) can precisely represent the urban boundary of each individual city which the iCN model can precisely distinguish. In addition, the iCN model is capable of identifying small-scale urban clusters due to the scale-free nature of the model, but administrative classification is capable of representing solely one specific scale. Hence, it is unable to represent the actual urban boundaries of cities which comprise diverse scaling levels. Nevertheless, it clearly depicts that model-derived urban clusters are decidedly in accordance with the urban centres which are derived by the CoMTrans Home Visit Survey 2014 (JICA 2014). It has derived the urban area by calculating the average trip distance from each urban centre to the other (i.e., home to other trips). It is well distinguished that most of these urban areas tally with the iCN-model-derived urban boundaries of cities. However, it is noted that a few clusters are not well recognized by the model due to the considered spatial accuracy.
In such a context, the proposed approach can be utilized as a strategic planning tool for both urban planning and transport engineering subject domains. It helps to distinguish the impact of ongoing and proposed development projects on the urban morphology of cities. Therefore, the findings of this study are beneficial to the sustainable development of cities and their social and transport policy formulation.

5. Recommendations and Model Availability

The existing urban boundary demarcation methods, which can neither distinguish the complex and dynamic nature of cities, nor capture their spatial and development patterns, has caused a significant mismatch between the actual urban scale of cities and the arbitrarily defined urban units, which distract the sustainable development measures and the social and transportation policy formulation of cities. Therefore, the proposed method provides a rational approach to demarcate the urban boundary of each city by utilizing the transportation accessibility. Nevertheless, the proposed iCN model approach completely refrains from country specific attributes (i.e., census records, demographic data, and land use data). Thus, it is universally applicable for any region by incorporating open data (i.e., open street map Data) to demarcate the urban boundaries of cities. The model follows the transportation accessibility concept to distinguish the urban clusters and their boundaries. Since the majority of countries follow the same development principle, this model can be equally applicable to any geographical region to study the urban development pattern. In addition, the proposed model distinguished the trends and directions of each city’s urban development pattern, which is essential for urban planners, transport planners, policy makers, and real estate developers to arrange their development strategies. Apart from these target groups, the proposed model would be equally important to the urban and transport planning academia as the study elaborates new discourse to delineate the urban boundaries of cities by utilizing the transportation network characteristics. In addition, the findings of the study will also attract geographers, demographers, and archeologists as the model clearly distinguishes the merging and spatial evolution of cities and their dynamic spatial interactions. In such a context, the findings of this study would be beneficial for wide variety of interest groups and contribute as an influential study to promote future research developments.
Furthermore, since the proposed modeling approach is completely based on open-source GIS applications and plugins, any interested group can easily implement the proposed iCN model by following the model implementation steps, which are described in this paper to demarcate the urban boundaries of any geographical region. In order to encourage open source applications, the proposed model is available for modifications and further improvements without specific acknowledgement to the corresponding authors.

6. Limitations and Future Work

In terms of limitations, although the entirety of Sri Lanka was considered as the study area, the model validation only considered the Colombo district due to a lack of high-quality, open-source satellite imagery data to cover the entire country. However, in future developments of the study, it is intended to validate the model with the entirety Sri Lanka. In addition, the model distinguished some minor classification limitations due to the poor quality of the transportation data available in the country. This caused overestimations as well as underestimations in certain areas, according to their distribution of road intersection points. This error can be significantly reduced with an accurate transportation dataset. In addition, at the current stage, the iCN model used the monofractal dimension to determine the existing urban scale of the cities, but several studies have identified the multifactorial nature of street network (Murcio et al. 2015).
For further studies, more sophisticated methods may be required to scrutinize the self-organizing behavior of cities and their hierarchical nature. In terms of model validation, the proposed approach needs to be applied into different development scenarios and model applicability evaluated under different transportation network patterns and different development scales of cities.

Author Contributions

A.J. conceived the idea of this study, conceptualization, formal analysis and acquired the funding for this research. L.D.C.H.N.K. performed the literature review, data collection, data preparation, analysis, validation visualization and writing of the original paper, under the supervision of A.J., P.K.S.M. and C.C.A. developed the theoretical framework and reviewed and edited the paper. P.K.S.M. contributed for the organization of the study and signifying the application in planning practice. All authors have read and agreed to the published version of the manuscript.

Funding

Funded by the University of Moratuwa (UOM), Sri Lanka, Senate Research Committee Grant (No. SRC/LT/2019/28) and UoM, Senate Research Committee Conference & Publishing Support Grant 2021.

Institutional Review Board Statement

Not applicable.

Informed Consent Statement

Not applicable.

Data Availability Statement

Not applicable.

Acknowledgments

The authors gratefully acknowledge the financial support given by University of Moratuwa (UOM), Sri Lanka, Senate Research Committee Grant (No. SRC/LT/2019/28) and UoM, Senate Research Committee Conference & Publishing Support Grant 2021.

Conflicts of Interest

Regarding this paper and the research, the authors state that they have no conflict of interest.

References

  1. Arcaute, Elsa, Erez Hatna, Peter Ferguson, Hyejin Youn, Anders Johansson, and Michael Batty. 2015. Constructing cities, deconstructing scaling laws. Journal of the Royal Society Interface 12: 20140745. [Google Scholar] [CrossRef] [PubMed]
  2. Arcaute, Elsa, Carlos Molinero, Erez Hatna, Roberto Murcio, Camilo Vargas-Ruiz, A. Paolo Masucci, and Michael Batty. 2016. Cities and regions in Britain through hierarchical percolation. Royal Society Open Science 3: 150691. [Google Scholar] [CrossRef] [Green Version]
  3. Batty, Michael, and Paul A. Longley. 1994. Fractal Cities: A Geometry of Form and Function. Cambridge: Academic Press. [Google Scholar]
  4. Briggs, David J., John Gulliver, Daniela Fecht, and Danielle M. Vienneau. 2007. Dasymetric modelling of small-area population distribution using land cover and light emissions data. Remote Sensing of Environment 108: 451–66. [Google Scholar] [CrossRef]
  5. Chakraborti, Suman, Dipendra Nath Das, Biswajit Mondal, Hossein Shafizadeh-Moghadam, and Yongjiu Feng. 2018. A neural network and landscape metrics to propose a flexible urban growth boundary: A case study. Ecological Indicators 93: 952–65. [Google Scholar] [CrossRef]
  6. Chen, Jiandong, Wei Fan, Ke Li, Xin Liu, and Malin Song. 2019. Fitting Chinese cities’ population distributions using remote sensing satellite data. Ecological Indicators 98: 327–33. [Google Scholar] [CrossRef]
  7. de Rijke, Chris A., Gloria Macassa, Mats Sandberg, and Bin Jiang. 2020. Living Structure as an Empirical Measurement of City Morphology. ISPRS International Journal of Geo-Information 9: 677. [Google Scholar] [CrossRef]
  8. Dijkstra, Lewis, Teodora Brandmüller, Thomas Kemper, Arbab Asfandiyar, and Paolo Veneri. 2021. Applying the Degree of Urbanisation—n—A Methodological Manual to Define Cities, Towns and Rural Areas for International. Luxembourg: Publications Office of the European Union. [Google Scholar]
  9. Dong, Nan, Xiaohuan Yang, Hongyan Cai, and Liming Wang. 2015. A novel method for simulating urban population potential based on urban patches: A case study in Jiangsu Province, China. Sustainability 7: 3984–4003. [Google Scholar] [CrossRef] [Green Version]
  10. Eicher, Cory L., and Cynthia A. Brewer. 2001. Dasymetric mapping and areal interpolation: Implementation and evaluation. Cartography and Geographic Information Science 28: 125–38. [Google Scholar] [CrossRef]
  11. Gismondi, M., C. Kamusoko, T. Furuya, S. Tomimura, and M. Maya. 2013. MOLUSCE—An an open source land use change analyst. In FOSS4G OSGeo’s Global Conference for Open Source Geospatial Software. Nottingham: Birleşik Krallık. [Google Scholar]
  12. Hagen-Zanker, Alex. 2009. An improved Fuzzy Kappa statistic that accounts for spatial autocorrelation. International Journal of Geographical Information Science 23: 61–73. [Google Scholar] [CrossRef] [Green Version]
  13. Henriques, Cristina, Alexandre Domingues, and Margarida Pereira. 2020. What Is Urban after All? A Critical Review of Measuring and Mapping Urban Typologies in Portugal. ISPRS International Journal of Geo-Information 9: 630. [Google Scholar] [CrossRef]
  14. Hillier, Bill, and Laura Vaughan. 2007. The city as one thing. Progress in Planning 67: 205–30. [Google Scholar]
  15. Hillier, Bill, and Shinichi Iida. 2005. Network effects and psychological effects: A theory of urban movement. In 5th International Symposium on Space Syntax. Delft: TU Delft, pp. 553–64. [Google Scholar]
  16. Jayasinghe, Amila, Kazushi Sano, and Hiroaki Nishiuchi. 2015. Explaining traffic flow patterns using centrality measures. International Journal for Traffic and Transport Engineering 5: 134–49. [Google Scholar] [CrossRef] [Green Version]
  17. Jayasinghe, Amila, N. B. S. Madusanka, Chethika Abenayake, and P. K. S. Mahanama. 2021. A Modeling Framework: To Analyze the Relationship between Accessibility, Land Use and Densities in Urban Areas. Sustainability 13: 467. [Google Scholar] [CrossRef]
  18. Jiang, Bin, and Chengke Liu. 2009. Street-based topological representations and analyses for predicting traffic flow in GIS. International Journal of Geographical Information Science 23: 1119–37. [Google Scholar] [CrossRef] [Green Version]
  19. Jiang, Bin, and S. Anders Brandt. 2016. A fractal perspective on scale in geography. SPRS International Journal of Geo-Information 5: 95. [Google Scholar] [CrossRef] [Green Version]
  20. Jiang, Bin, and Terry Slocum. 2020. A map is a living structure with the recurring notion of far more smalls than larges. ISPRS International Journal of Geo-Information 9: 388. [Google Scholar] [CrossRef]
  21. Japan International Cooperation Agency. 2014. Urban Transport System Development Project for Colombo Metropolitan Region and Suburbs; Colombo: Japan International Cooperation Agency.
  22. Lindamullage Don Charls Hasintha Nawod Kalpana, Chethika Abenayake, Amila Jayasinghe, Pelpola KS Mahanama, and Niroshan Sanjaya. 2021. A novel approach to measure the pattern of urban agglomeration based on the road network. International Journal of Sustainable Development and Planning 16: 251–62. [Google Scholar] [CrossRef]
  23. Lee, Kyung-Young. 2021. Factors Influencing Urban Livability in Seoul, Korea: Urban Environmental Satisfaction and Neighborhood Relations. Social Sciences 10: 138. [Google Scholar] [CrossRef]
  24. Levin, Lena. 2019. How may public transport influence the practice of everyday life among younger and older people and how may their practices influence public transport? Social Sciences 8: 96. [Google Scholar] [CrossRef] [Green Version]
  25. Liu, Ting, and Xiaojun Yang. 2015. Monitoring land changes in an urban area using satellite imagery, GIS and landscape metrics. Applied Geography 56: 42–54. [Google Scholar] [CrossRef]
  26. Ma, Ding, Itzhak Omer, Toshihiro Osaragi, Mats Sandberg, and Bin Jiang. 2019. Why topology matters in predicting human activities. Environment and Planning B: Urban Analytics and City Science 46: 1297–313. [Google Scholar] [CrossRef]
  27. Masucci, A. Paolo, Elsa Arcaute, Jiaqiu Wang, Erez Hatna, and Michael Batty. 2014. Universal Properties for Urban Street Networks. Paper presented at 2014 Tenth International Conference on Signal-Image Technology and Internet-Based Systems, Marrakech, Morocco, November 23–27. [Google Scholar]
  28. Mennis, Jeremy. 2003. Generating surface models of population using dasymetric mapping. The Professional Geographer 55: 31–42. [Google Scholar]
  29. Montero, Gaëtan, Cécile Tannier, and Isabelle Thomas. 2021. Delineation of cities based on scaling properties of urban patterns: A comparison of three methods. International Journal of Geographical Information Science 35: 919–47. [Google Scholar] [CrossRef]
  30. Mortoja, Md Golam, Tan Yigitcanlar, and Severine Mayere. 2020. What is the most suitable methodological approach to demarcate peri-urban areas? A systematic review of the literature. Land Use Policy 95: 104601. [Google Scholar] [CrossRef]
  31. Mundhe, Nitin N., and Ravindra G. Jaybhaye. 2014. Impact of urbanization on land use/land covers change using Geo-spatial techniques. International Journal of Geomatics and Geosciences 5: 50–60. [Google Scholar]
  32. Murcio, Roberto, A. Paolo Masucci, Elsa Arcaute, and Michael Batty. 2015. Multifractal to monofractal. Physical Review E. [Google Scholar] [CrossRef] [Green Version]
  33. Nicolau, Rita, João David, Mário Caetano, and José Pereira. 2019. Ratio of land consumption rate to population growth rate—Analysis of different formulations applied to mainland Portugal. ISPRS International Journal of Geo-Information 8: 10. [Google Scholar] [CrossRef] [Green Version]
  34. Peng, Jian, Yi’na Hu, Yanxu Liu, Jing Ma, and Shiquan Zhao. 2018. A new approach for urban-rural fringe identification: Integrating impervious surface area and spatial continuous wavelet transform. Landscape and Urban Planning 175: 72–79. [Google Scholar] [CrossRef]
  35. Song, Yongze, Ying Long, Peng Wu, and Xiangyu Wang. 2018. Are all cities with similar urban form or not? Redefining cities with ubiquitous points of interest and evaluating them with indicators at city and block levels in China. International Journal of Geographical Information Science 32: 2447–76. [Google Scholar] [CrossRef]
  36. Sutton, Paul, Dar Roberts, Chris Elvidge, and Henk Meij. 1997. A comparison of nighttime satellite imagery and population density for the continental United States. Photogrammetric Engineering and Remote Sensing 63: 1303–13. [Google Scholar]
  37. Tian, Yongzhong, Tianxiang Yue, Lifen Zhu, and Nicholas Clinton. 2005. Modeling population density using land cover data. Ecological Modelling 189: 72–88. [Google Scholar] [CrossRef]
  38. Hu, Xiaofang, Yuguo Qian, Steward TA Pickett, and Weiqi Zhou. 2020. Urban mapping needs up-to-date approaches to provide diverse perspectives of current urbanization: A novel attempt to map urban areas with nighttime light data. Landscape and Urban Planning 195: 103709. [Google Scholar] [CrossRef]
  39. Zhang, Jingxiong, Peter Atkinson, and Michael F. Goodchild. 2014. Scale in Spatial Information and Analysis. Boca Raton: CRC Press. [Google Scholar]
Figure 1. The study area.
Socsci 10 00448 g001
Figure 2. Analytical framework of the study.
Socsci 10 00448 g002
Figure 3. The model implementation steps.
Socsci 10 00448 g003
Figure 4. iCN model results under the 400- and 500-m threshold distances.
Socsci 10 00448 g004
Figure 5. Self-Similarity distribution of Fractal Dimension at each distance threshold.
Socsci 10 00448 g005
Figure 6. iCN-model-derived city clusters and their spatial distribution at the 425-m threshold distance.
Socsci 10 00448 g006
Figure 7. Model-derived city clusters and their urban boundaries; color gradient represents the cluster intensity, (i.e., amount of nodes incorporated to a particular cluster).
Socsci 10 00448 g007
Figure 8. Frequency distribution of city clusters under the normalized cluster intensity.
Socsci 10 00448 g008
Figure 9. Visual interpretation of the iCN Model—obtained urban boundary and satellite imagery recovered urban boundary.
Socsci 10 00448 g009
Figure 10. Kappa coefficient result of iCN model validity.
Socsci 10 00448 g010
Figure 11. Administrative classification of urban area (Left side map) and CoMTrans study derived urban centers (Right side Map).
Socsci 10 00448 g011
Table 1. The basic characteristics of Sri Lanka.
The Basic Characteristics of Sri Lanka
Total Population20,359,439
Total Land Extent65,610 Km2
Table 2. Study utilized data and their sources.
Data TypeExtentYearSourceData Format
Road NetworkSri Lanka2012Open Street Map GIS data: Vector Format. Dissolved to Individual Polyline
Administrative BoundariesSri Lanka2012Survey Department of Sri Lanka GIS data: Vector Format. Dissolved to Individual Polygon
Satellite ImagerySri Lanka2012USGS Earth ExplorerGIS data: Raster Format. Landsat 8. 12 Bands.
Publisher’s Note: MDPI stays neutral with regard to jurisdictional claims in published maps and institutional affiliations.

