1. Introduction
Long-term studies are important for understanding the ecological functions of ecosystems [
1]. This is true for the natural system, but also important for manmade urban ecosystems. In times of growing cities throughout the world, it is necessary to quantify how intensive vegetation-based solutions can contribute to mitigating the urban heat island effect (UHI); green roofs can make a contribution, but, in most cases, the real numbers are based on short-term studies or simulation. In addition to their positive effect on the climate, green roofs provide a number of further social and emotional values for the local population [
2]. The more we know about such qualities, the easier it will become to extend green roofs in both numbers and quality.
The author was inspired by Reinhard Bornkamm’s early green roof surveys in Goettingen [
3] that were ecological long-term studies of these kinds of manmade urban habitats on buildings.
In Germany, gravel roofs are synonymous to roofs known as “bare roofs” in other countries. “Flat roofs in Germany are normally covered by a gravel layer, these are usually stones with diameters of 16–32 mm. Their function is to protect against the sun and expand the life expectancy of the underlying roof materials. Layers of bitumen, asphalt or tar, as widely distributed in North America are generally only used in Germany for garages or sheds. The success stories of extensive green roofs in Germany are connected to the idea of substituting the typically heavy gravel layer of about 5 cm with a growing media of more or less the same weight that has the additional functional effect of being a vegetation layer and retains rainwater as an extra benefit for the buildings.”
In the 1970s, (West) Berlin was a cradle for many studies into urban ecosystems [
4]. The first author of this chapter has been involved in these activities since the early 1980s and focuses on green façades and green roofs. It was a chance to learn from Berlin’s old so-called Tar-Paper-Roofs and compare the vegetation on them with the modern extensive green roofs EGR [
5]. As a result, the modern, engineered growing media deliver more opportunities for biodiversity.
The early experimental green roofs on the building in the “Englische Straße” were equipped with climate and rainwater retention systems that were surveyed between 1986 and 1999. Different media, from recycling to commercial, different slopes and various urban-born seeds were tested and documented. Earlier investigations of own measurements [
6] on extensive green roofs showed an annual runoff of roughly 90% on both typical tar paper roofs and the widely used gravel roofs in comparison to an average of only approximately 50% runoff on extensive green roofs. If cooling down the urban heat island is the pressing issue, typical EGR-layers such as those tested here should receive more irrigation to capitalize on the evapotranspiration cooling-effect caused by the energetic aspect of phase change [
7]. Whether EGRs are irrigated or not, they contribute to the small water cycle, capture local rain events and the water evaporates during the following days [
8]. This was important for explaining the importance of the local water cycle, in which green roofs can play a key role.
The green roof measurements have continued in Berlin, on real roof installations that have existed on the Paul-Lincke Ufer and the ufafabric since 1994 [
9,
10]. The results of the survey being presented here, started on the new buildings of the University of Applied Sciences, Neubrandenburg (hereinafter UAS Neubrandenburg) in 1998. The EGRs are located in northeast Germany, around 120 km north of Berlin. These buildings were originally planned with typical gravel roofs. Due to the building code and environmental protection regulations, it was possible to demand green roofs. This made it easy to install a large-scale, typical extensive green roof with around 3000 m
2 for experiments and teaching students. The typical gravel layer was installed in some smaller sections of the roof to allow for comparisons of the environmental effects. It became a fully equipped and continuously updated research site on three buildings. This paper focuses on the 20 years of weather research activities that have been performed on these roofs. It will show real measurements for assessing the effect of EGR on surface temperature performance. One reason for presenting the results now is the fundamental enhancement of the equipment by installing a couple of new sensors funded by EFRE-state funds. Every change may have an influence on the results and the measurements now cover two-thirds of the length of a standard climate diagram of 30 years.
2. Aim of this Study
Green roofs are multi-beneficiary systems for enhancing the urban environmental quality. In the last ten years, green roof research has been initiated all over the world [
11,
12]. What is fascinating is that green roofs can be easily installed on nearly all types of buildings, in nearly all of the world’s climates.
The goal of this study is to quantify the climate mitigation effect of an EGR. Firstly, the deviations of standard temperature values are taken as an indicator of this effect. Secondly, the study investigates whether an EGR is able to reduce the increasing Urban Heat Island effect of recent years. There is a number of publications to model such effects, e.g., with the program package ENVIMET [
13], but is such an effect also measurable for real situations over a longer period with various weather conditions?
To understand the ecological functions of EGR, local measurements on real buildings function as a basis for all further interpretation, e.g., by modeling or developing strategical demands for urban planning. Real measurements require high quality sensors to count the date without too much disturbance or too many errors. Most scientific measurements receive funding which is limited to 2 or 3 years [
14,
15,
16]. Research into green roofs is too young to produce long-term measurements, which form the foundation for all further modeling activities. Some earlier EGR studies, e.g., in Berlin, ended abruptly due to new use of the property or the selling of the property. The buildings used for measurements at UAS Neubrandenburg received their EGRs with fixed mounted installations during construction between 1998 and 2001 and received substantial support from the administration.
The weather station’s equipment is described in detail in the following chapter. A full climate diagram should include a complete 30-year data set. This has not been achieved yet; we are a little more than two-thirds of the way through. In summer 2018, the weather station received a massive update. This provides a great opportunity for a first interpretation of the existing data set that aims to produce the first trends in accordance with the guidelines of typical meteorological climate data interpretation. The EGR is located on two main commercial green roof installations and a few test sites for modifications that are compared to typical gravel roof solutions. The growing media thickness is 10 cm; some other plots have 40 cm. The vegetation was seeded, planted, or equipped with pre-fabricated turf mats, and some space was left for self-greening plots.
The basic work was done by the first author of this chapter, in cooperation with the other authors, who helped with the measurement equipment. Other working groups occasionally investigated further research questions. This work was also meant to support collaboration with further related research stations and promote activities for the installation of more green roofs. The results of these surveys shall become part of the ongoing FLL-Green roof guideline procedure [
17].
The measurements are meant to describe and understand how and if buildings with an EGR modify climate parameters, and if so, how big the mitigation effect is for the UHI. These own measurements were compared to the hourly DWD (acronym for: German Weather Service) data sets from two official weather stations. The first station is located at an inner-city location; the Airport Berlin-Tempelhof (ID 433), providing a long-term data set from 1951–2017; the second station being the DWD station about 5 km from the university building, located at the airport Neubrandenburg-Trollenhagen (ID 5109), which provided an hourly data set for analysis that covered the years 2002–2017 [
18].
3. Research Methodology
3.1. Data Logging and Sensors
Experiments using measuring equipment started in the 1980s with the use of a writing printer that was used, for example, for measuring temperature and the relative humidity. This was followed by a 4-canal digital logger, used for the projects on the Paul-Lincke Ufer and the Englische Straße. Today’s data sampling systems are web-based solutions. The most important factor for the collection of data is the careful selection of suitable sensors. If they are to perform well all year round, it is best to follow the WMO “First Class” Standard and ISO 9060 [
19]. There are many other instruments on the market that provide lower accuracy or will not produce reliable results for accurate measurements over a span of several years.
Some of the details of the equipment in use are listed in
Table 1, including a rating for their purpose. The principal positions of the sensors can be seen in
Figure 1.
The criteria for rating the sensors (1–3) are accuracy, handling, durability, and price. Over the course of the years, a huge number of further sensors have been tested. The use differs from typical weather stations, because the sensors are located nearer to the vegetation level. Lots of instruments are well-suited for short measurement periods, such as the Log-32 logger on decentralized locations. Some tests, e.g., for measuring soil moisture, were started using several sensors, but were never as successful as expected on these dry and course media. Furthermore, a further radiation balance system was not exact enough. The new heat flux sensors, which have been installed since 2008, are a promising solution for measuring the energetic balance in the future. The lysimetric equipment is at the center of interest in the follow-up article by Kaiser and Koehler in the same journal.
The challenge for the measurements was the aim to obtain data all year round. Some winters had extremely large amounts of snow, which hindered accurate data collection. Under windy winter conditions, windblown dispersal produced snow drifts similar to sand dunes.
The changes between the frost/melt-phase gave some critically heavy extra loads in late winter periods. Some of the ground sensors were embedded in ice and this is the reason that some of the obtained values were invalid. This resulted in the deletion of some of the daily data sets.
Table 2 shows the number of valid measurements. Difficulties in collecting data were caused by heavy winter conditions, and various technical reasons that occurred sporadically. The missing values are spread across all the years.
The town of Neubrandenburg is located about 120 km north of Berlin, in the Cfb climate region according to the Köppen-classification. The climate diagram (1960–1990) shows that there was an average temperature of 8 °C and 571 mm of annual precipitation (Neubrandenburg/Trollenhagen [
20]).
The EGR near the weather station on the roof is sedum-dominated and has a high percentage of lichens of the genus Cladonia sp. that is typical for the region. The most successful spontaneous plant on this EGR is Allium schoenoprasum (chive). The cover value is about 90%. The comparative area consists of a 5 cm layer of gravel with stones with an average diameter of 50 mm.
3.2. Statistics
All data is collected by a data logger from FundC [
21], with all values being collected every 10 s, aggregated in 1999 to 1-hour values, from 2000 onwards as 15-minute values. These were stored as Excel files and aggregated and prepared for analysis using MS-Excel and SPSS™, i.e., statistics, trends, and the Pearson–Correlation as a test of similarities.
The statistics are analyzed by creating a trend line in Excel that enables a final summary of the own 10-second values, which was aggregated in the first years to hour-values, in the following years to 15-minute values. The general goal of evaluating the measured parameters on this trial roof is to document the growth of the EGR’s plants according to location factors. There are two reasons why SPSS has been used to achieve this since own measurements commenced in 1999: At the beginning, Excel was unable to handle the large amount of “cases”, i.e., the respective data sets for all of the required information. At the same time, investigations into the causes of varying plant growth as a result of climatic and location parameters can only be analyzed using multivariate statistics. However, as this study focuses on the clearly verifiable mitigation effect on UHI, simple correlation calculations and simple linear regression were used, which can now be visualized more appealingly using Excel. This study places its emphasis on the presentation of the long-term effect of establishing vegetation in comparison to a standard gravel roof without vegetation. The correlation analysis of varying locations was chosen to demonstrate these results. The temperature deviation is an overall value, provided, for example, by standard weather stations.
Theory 1: The hourly aggregated cumulative values should show the Urban Heat Island effect and the influence of the green roof. If no effect can be recognized, the values must be close to 1 (no deviation). The order of the measurements was as follows: Standard weather stations in Berlin, Neubrandenburg-Trollenhagen, Airport, and Neubrandenburg UAS, own weather, see
Figure 1, including 1 m above the substrate for roof surface (gravel); roof surface within the gravel substrate; and within the green roof substrate.
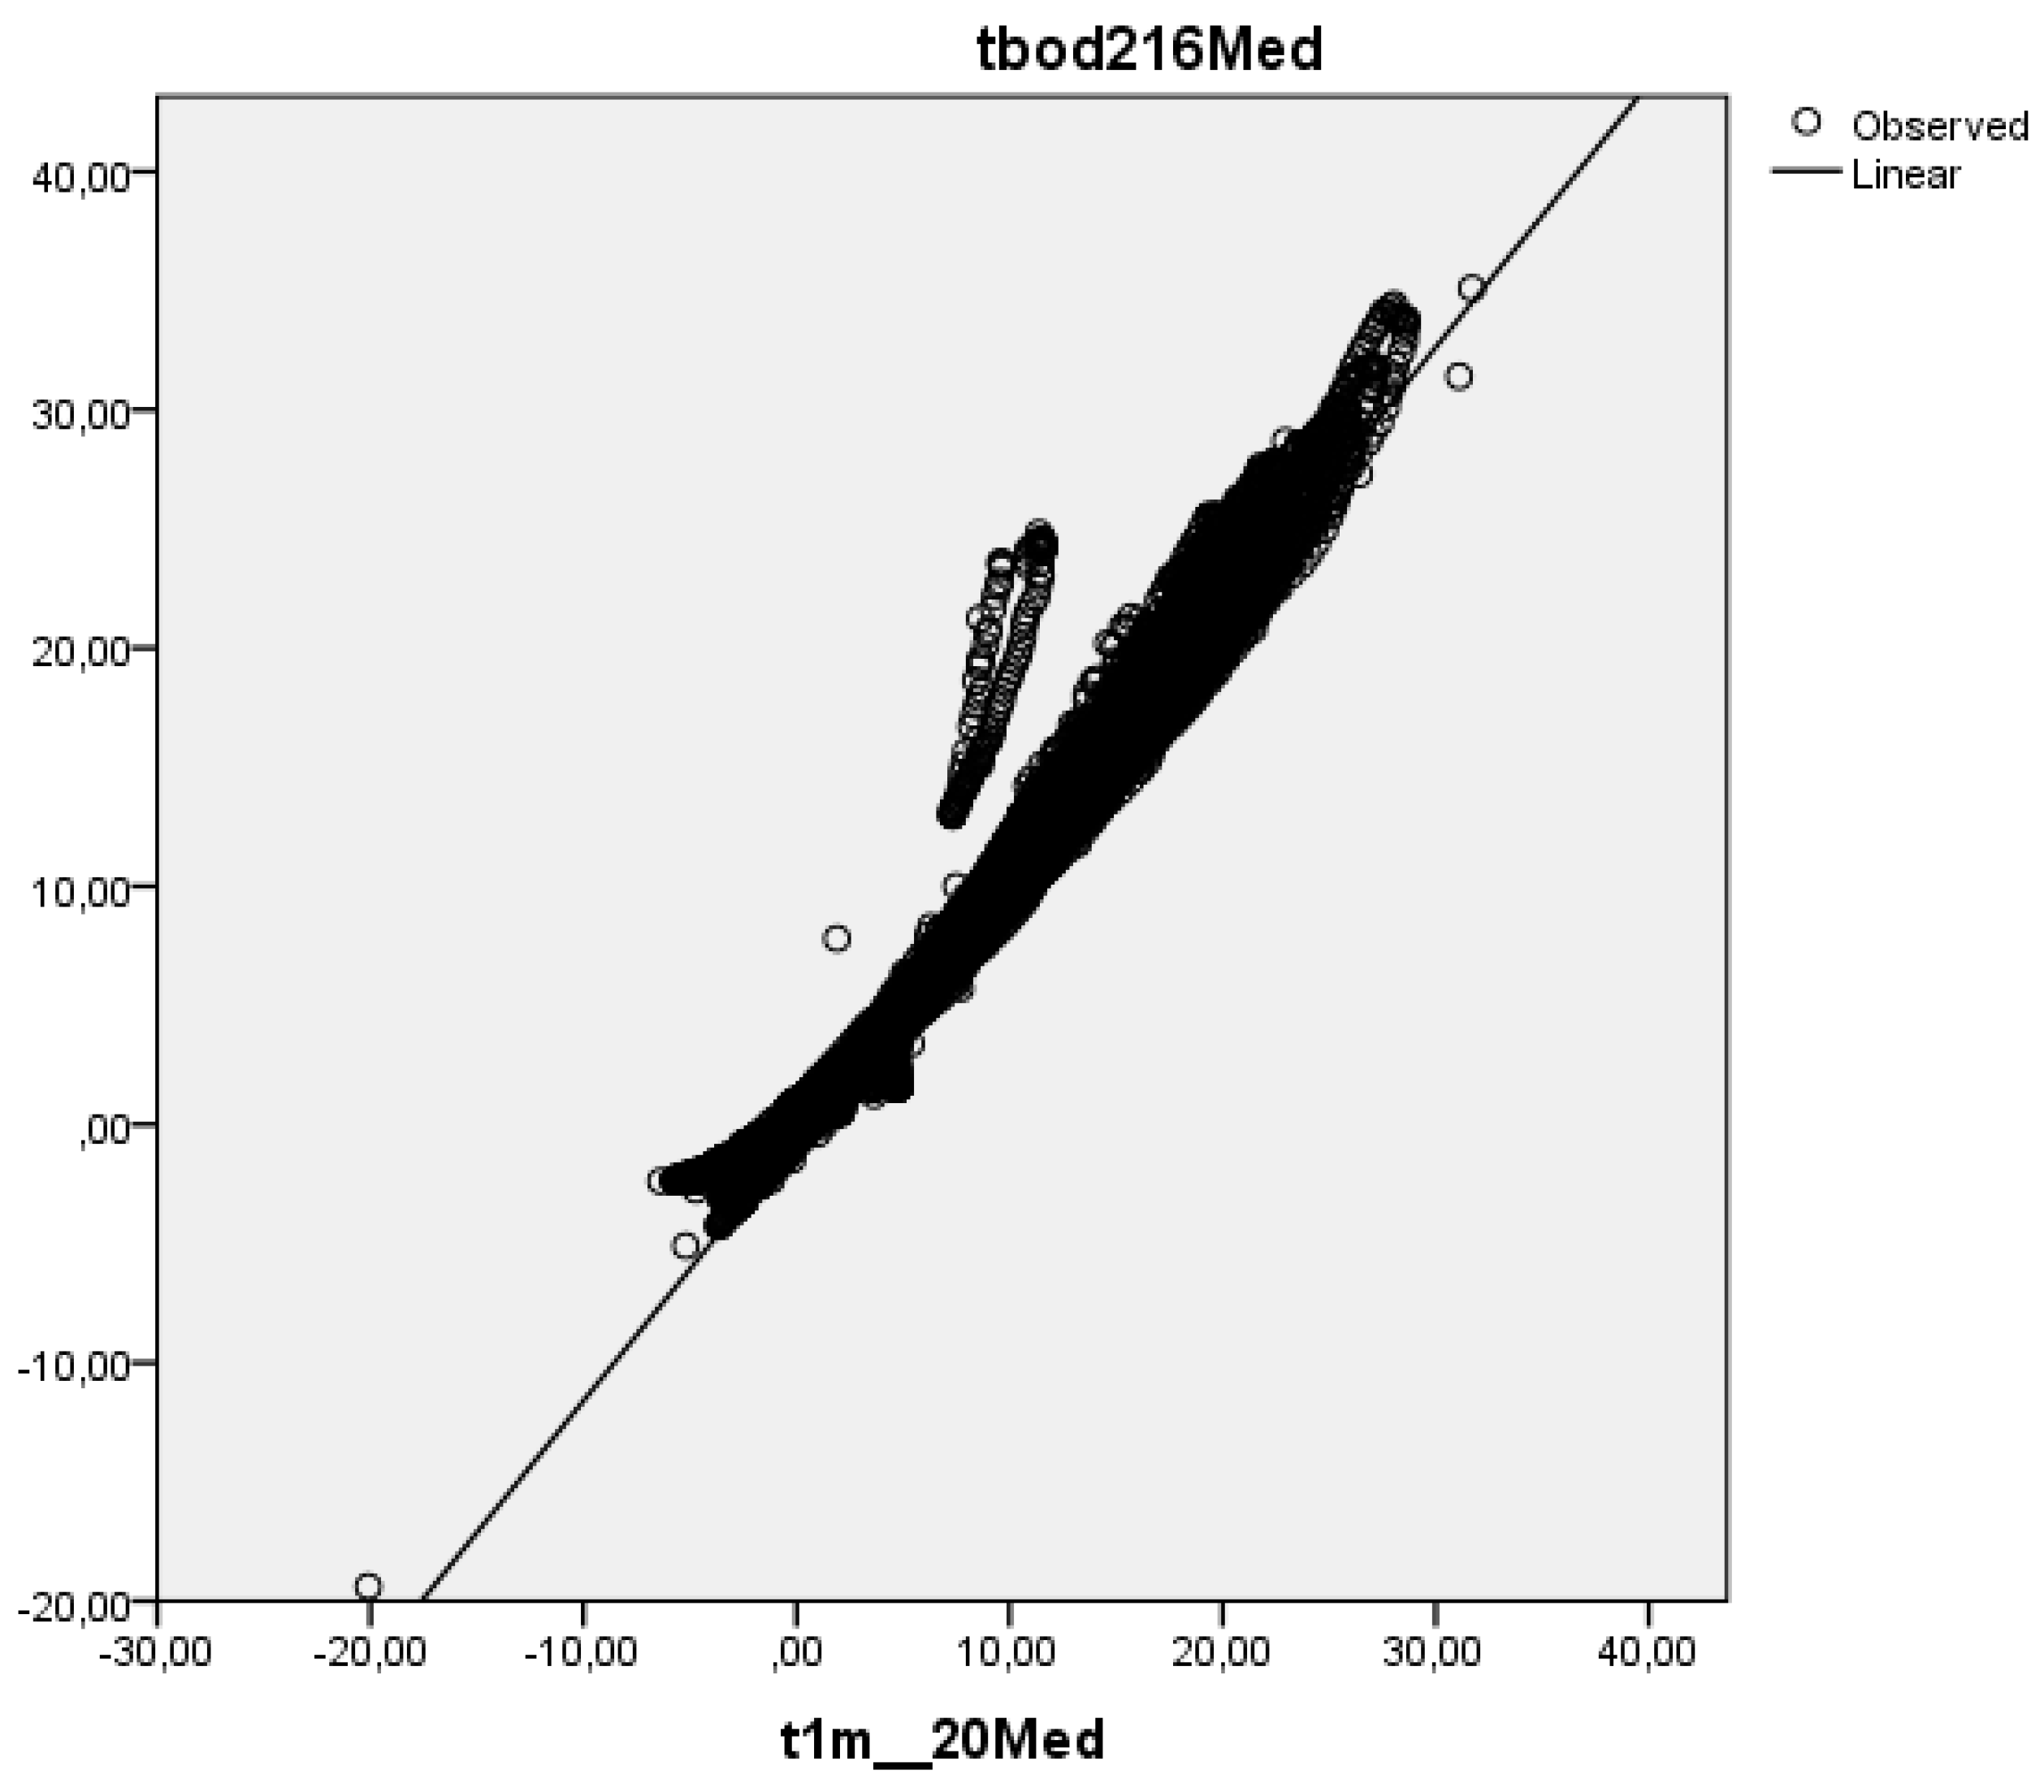
Method: Correlation matrix with SPSS. This has been illustrated in two figures: “Paired Sample Statistics” and the “Surface Gravel Temperature”, which uses a scatterplot to show the expected and measured air temperature values 1 m above the green roofs. The strong overlapping underlines the high correlation of the measured values and the correlation of Pearsons R.
Theory 2: Use of linear regression for the entire measurement period with the goal of proving the annual UHI effect or investigating the mitigation effect of EGRs. We are aware that longer periods of time can also be illustrated with amplitudes, and these “annual fluctuations” can be seen in hourly values that were aggregated to annual values. To be able to make clear statements, we consider the trend line to be the maximum smoothed line, and due to the clarity of our results, we did not want to go into the anomalies of individual measurements taken throughout the year.
Berlin’s inner-city airport Berlin Tempelhof provides the longest set of hourly weather values measured by the DWD (since 1951) at an inner-city location in Berlin (German capital with a population of almost 4 million). The set of comparative hourly measurements taken by the DWD at Airport Neubrandenburg-Trollenhagen (former East Germany) is much shorter, having started in 1992. Our own measurements at UAS Neubrandenburg started in 1999 (1 m above the roof, roof surface (gravel and green roof) and in the substrate of the gravel and green roofs).
In order to visualize these series of statistical values, the annual values of all of the data have been aggregated to daily amplitudes and were adapted for this article (in
Figure 2,
Figure 3,
Figure 4,
Figure 5,
Figure 6 and
Figure 7) using the more appealing presentation graphs provided by Excel.
Metadata about the sensor installation is important for the interpretation of the results [
22]: Differing from standard meteorology, the sensors are installed 1 m above the roof-top vegetation, with a ventilated radiation shield for the surface sensors and the soil sensors have been installed at a depth of 10 cm within the growing media layer, near to the filtration sheet. The climate data could vary from the data collected in Trollenhagen. The Pearson’s r-value is used as an indicator to improve the similarity of the results.
4. Results
This article describes the effects of typical EGRs on climate mitigation. The active influence that can be made by watering is discussed later, whilst enhancing the evapotranspiration follows and can be found in the next article of this journal [
23].
The average temperature of the official climate stations Berlin Tempelhof,
Table 3, spanning 1951–2016 with an average of 9.7 °C. Neubrandenburg-Trollenhagen Airport spanning the period of 1999–2018 is approximately 9 °C, the stations on the University building measured 9.3 °C, and the sensor at 1 m above the roof surface measured 9.5 °C. These values are related to outside city < sensor 1 m above the building (UHI-effect) and the effect inside the growing media.
With 9.38 °C measured at the open-space location in Trollenhagen and 9.5 °C measured one meter above the building in the town center of Neubrandenburg, there is almost no difference between the mean temperatures. The minimum air temperature is about 1 K cooler outside of the town on the open area than on top of the building in the urban context. The maximum temperature is 4 K cooler due to the height of the 4-story building and the subsequent higher wind profile. Air humidity is 7% higher outside of the town when compared to the roof value collected at a height of one meter above the roof in the town center. All values are connected with basic descriptive statistics for Trollenhagen in
Table 4 and all values for UAS Neubrandenburg in the following
Table 5.
The means of both surface and inside temperatures are nearly identical. Differences are found in the ranges between the minimum and maximum temperatures.
Pearson’s correlation helps to understand the differences between the air temperature at the “typical 1 m height” and the gravel (0.99) and green (0.987) surfaces, which are nearly identical and have a highly significant correlation. The average temperature on the surface is about 0.5 K warmer than the 1-meter control values. However, when regarding gravel with a significance of 0.96 and the green surface with a significance of 0.93, the effects of growing media are well-suited for interpretation (
Table 6).
The temperature values follow both a daily and an annual rhythm with a few special outliers on cold or hot days.
Figure 4a is an example of the temperature line for the air temperature 1 m above the roof. This diagram sums up 10-second measurements to 5-minute values and these are then combined in intermediate steps to create annual graphs.
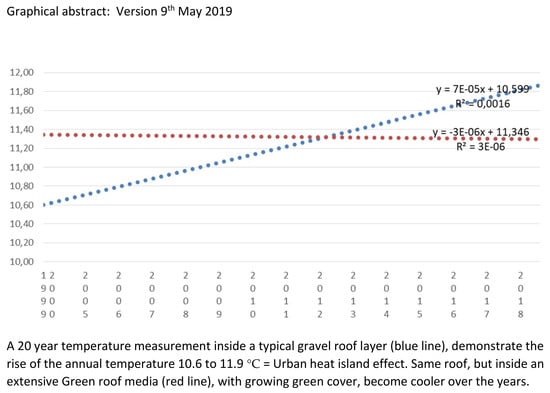
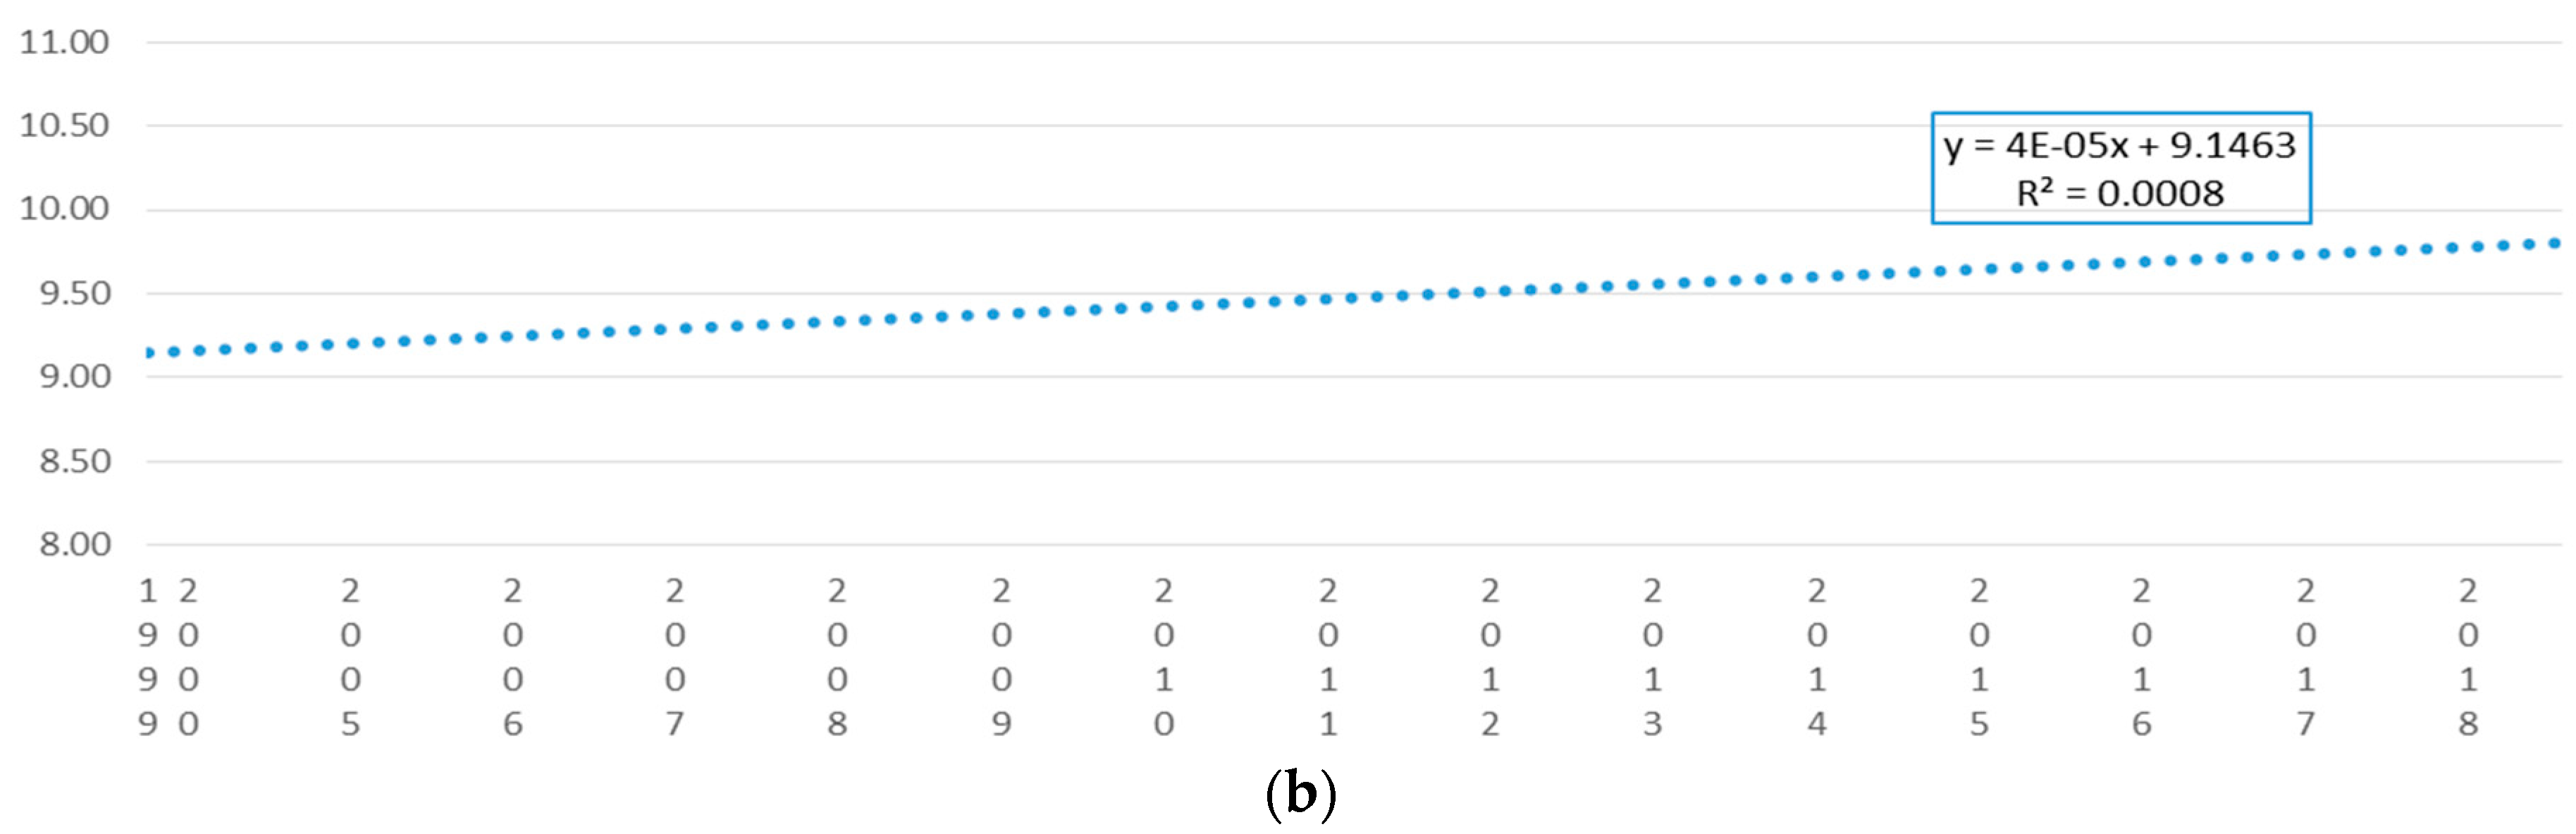
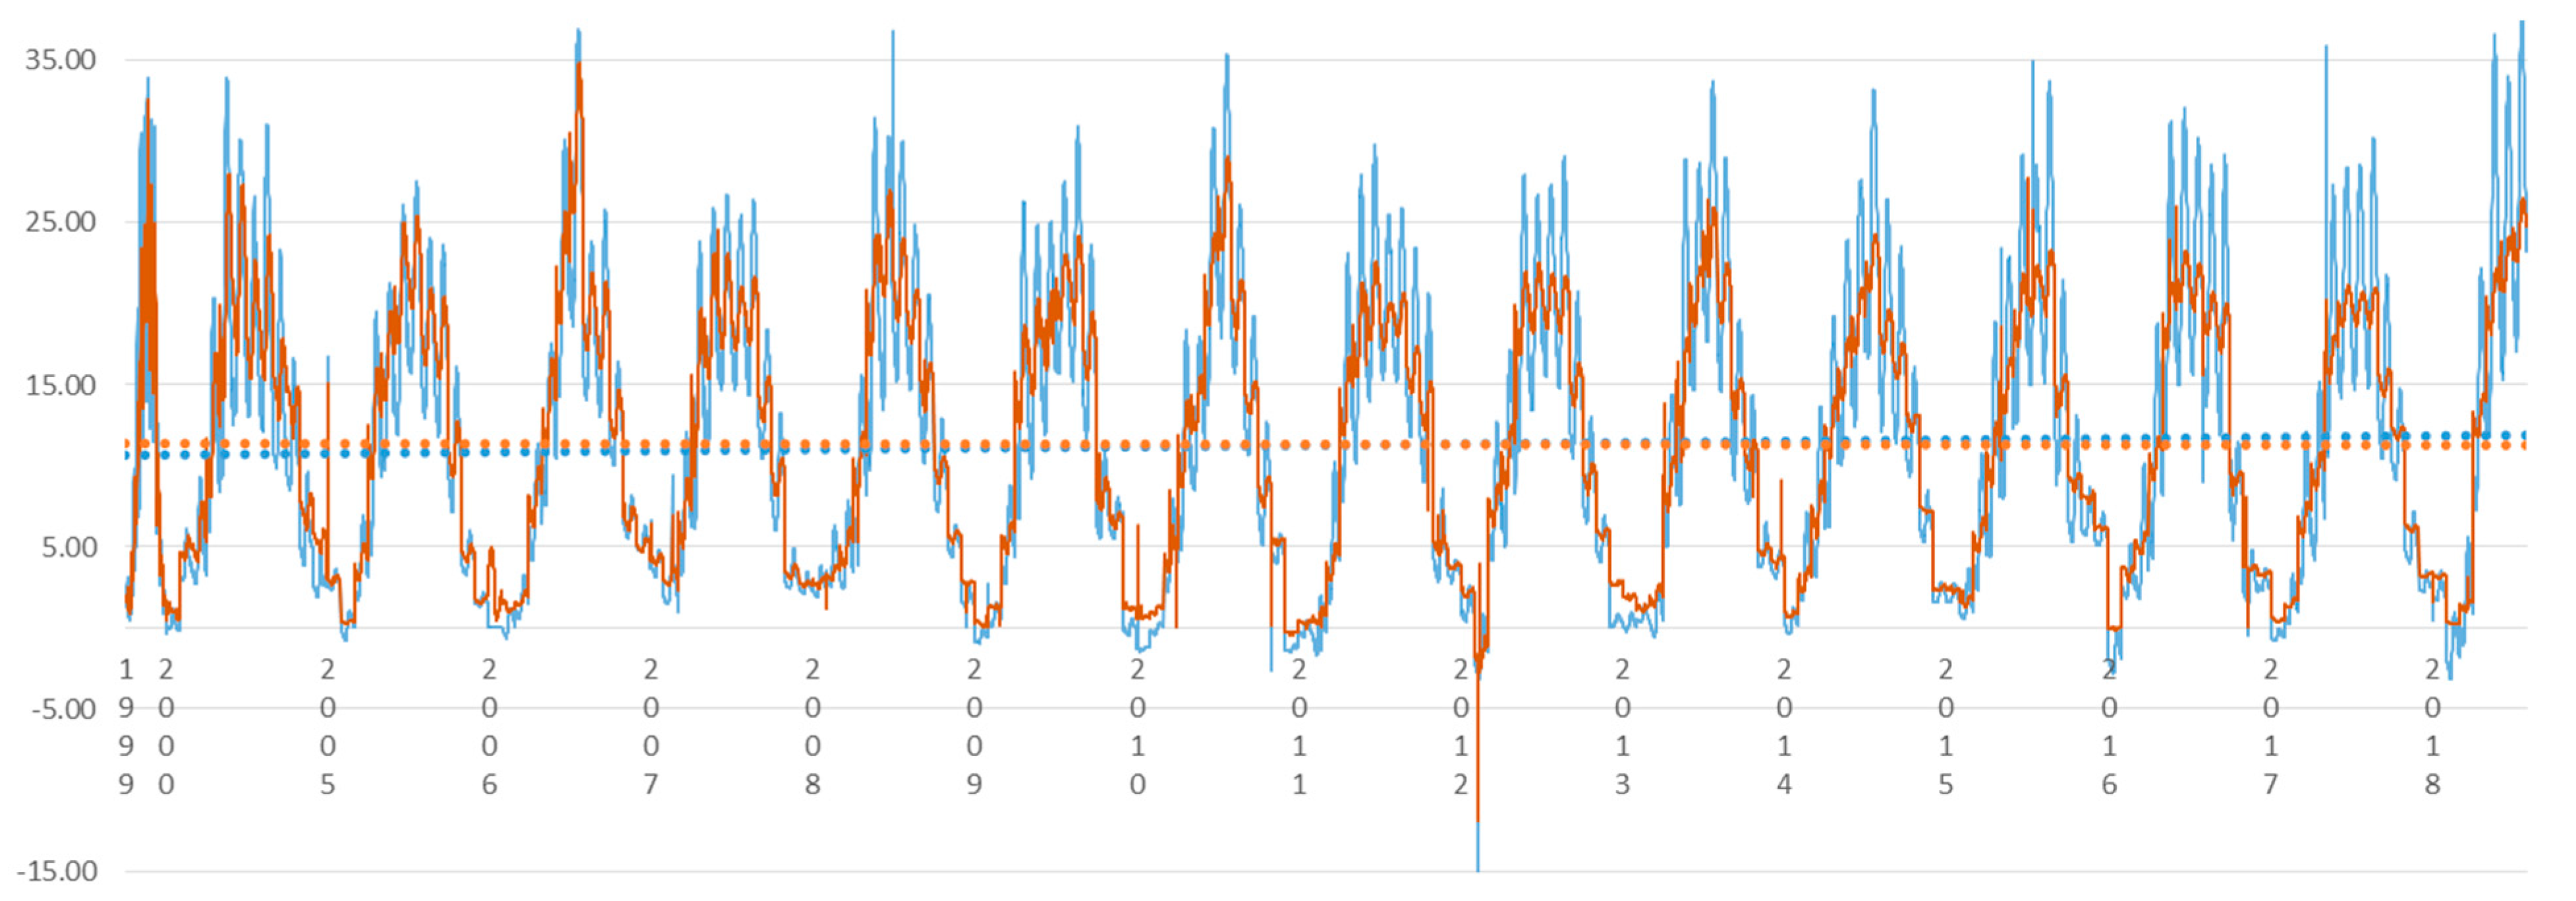
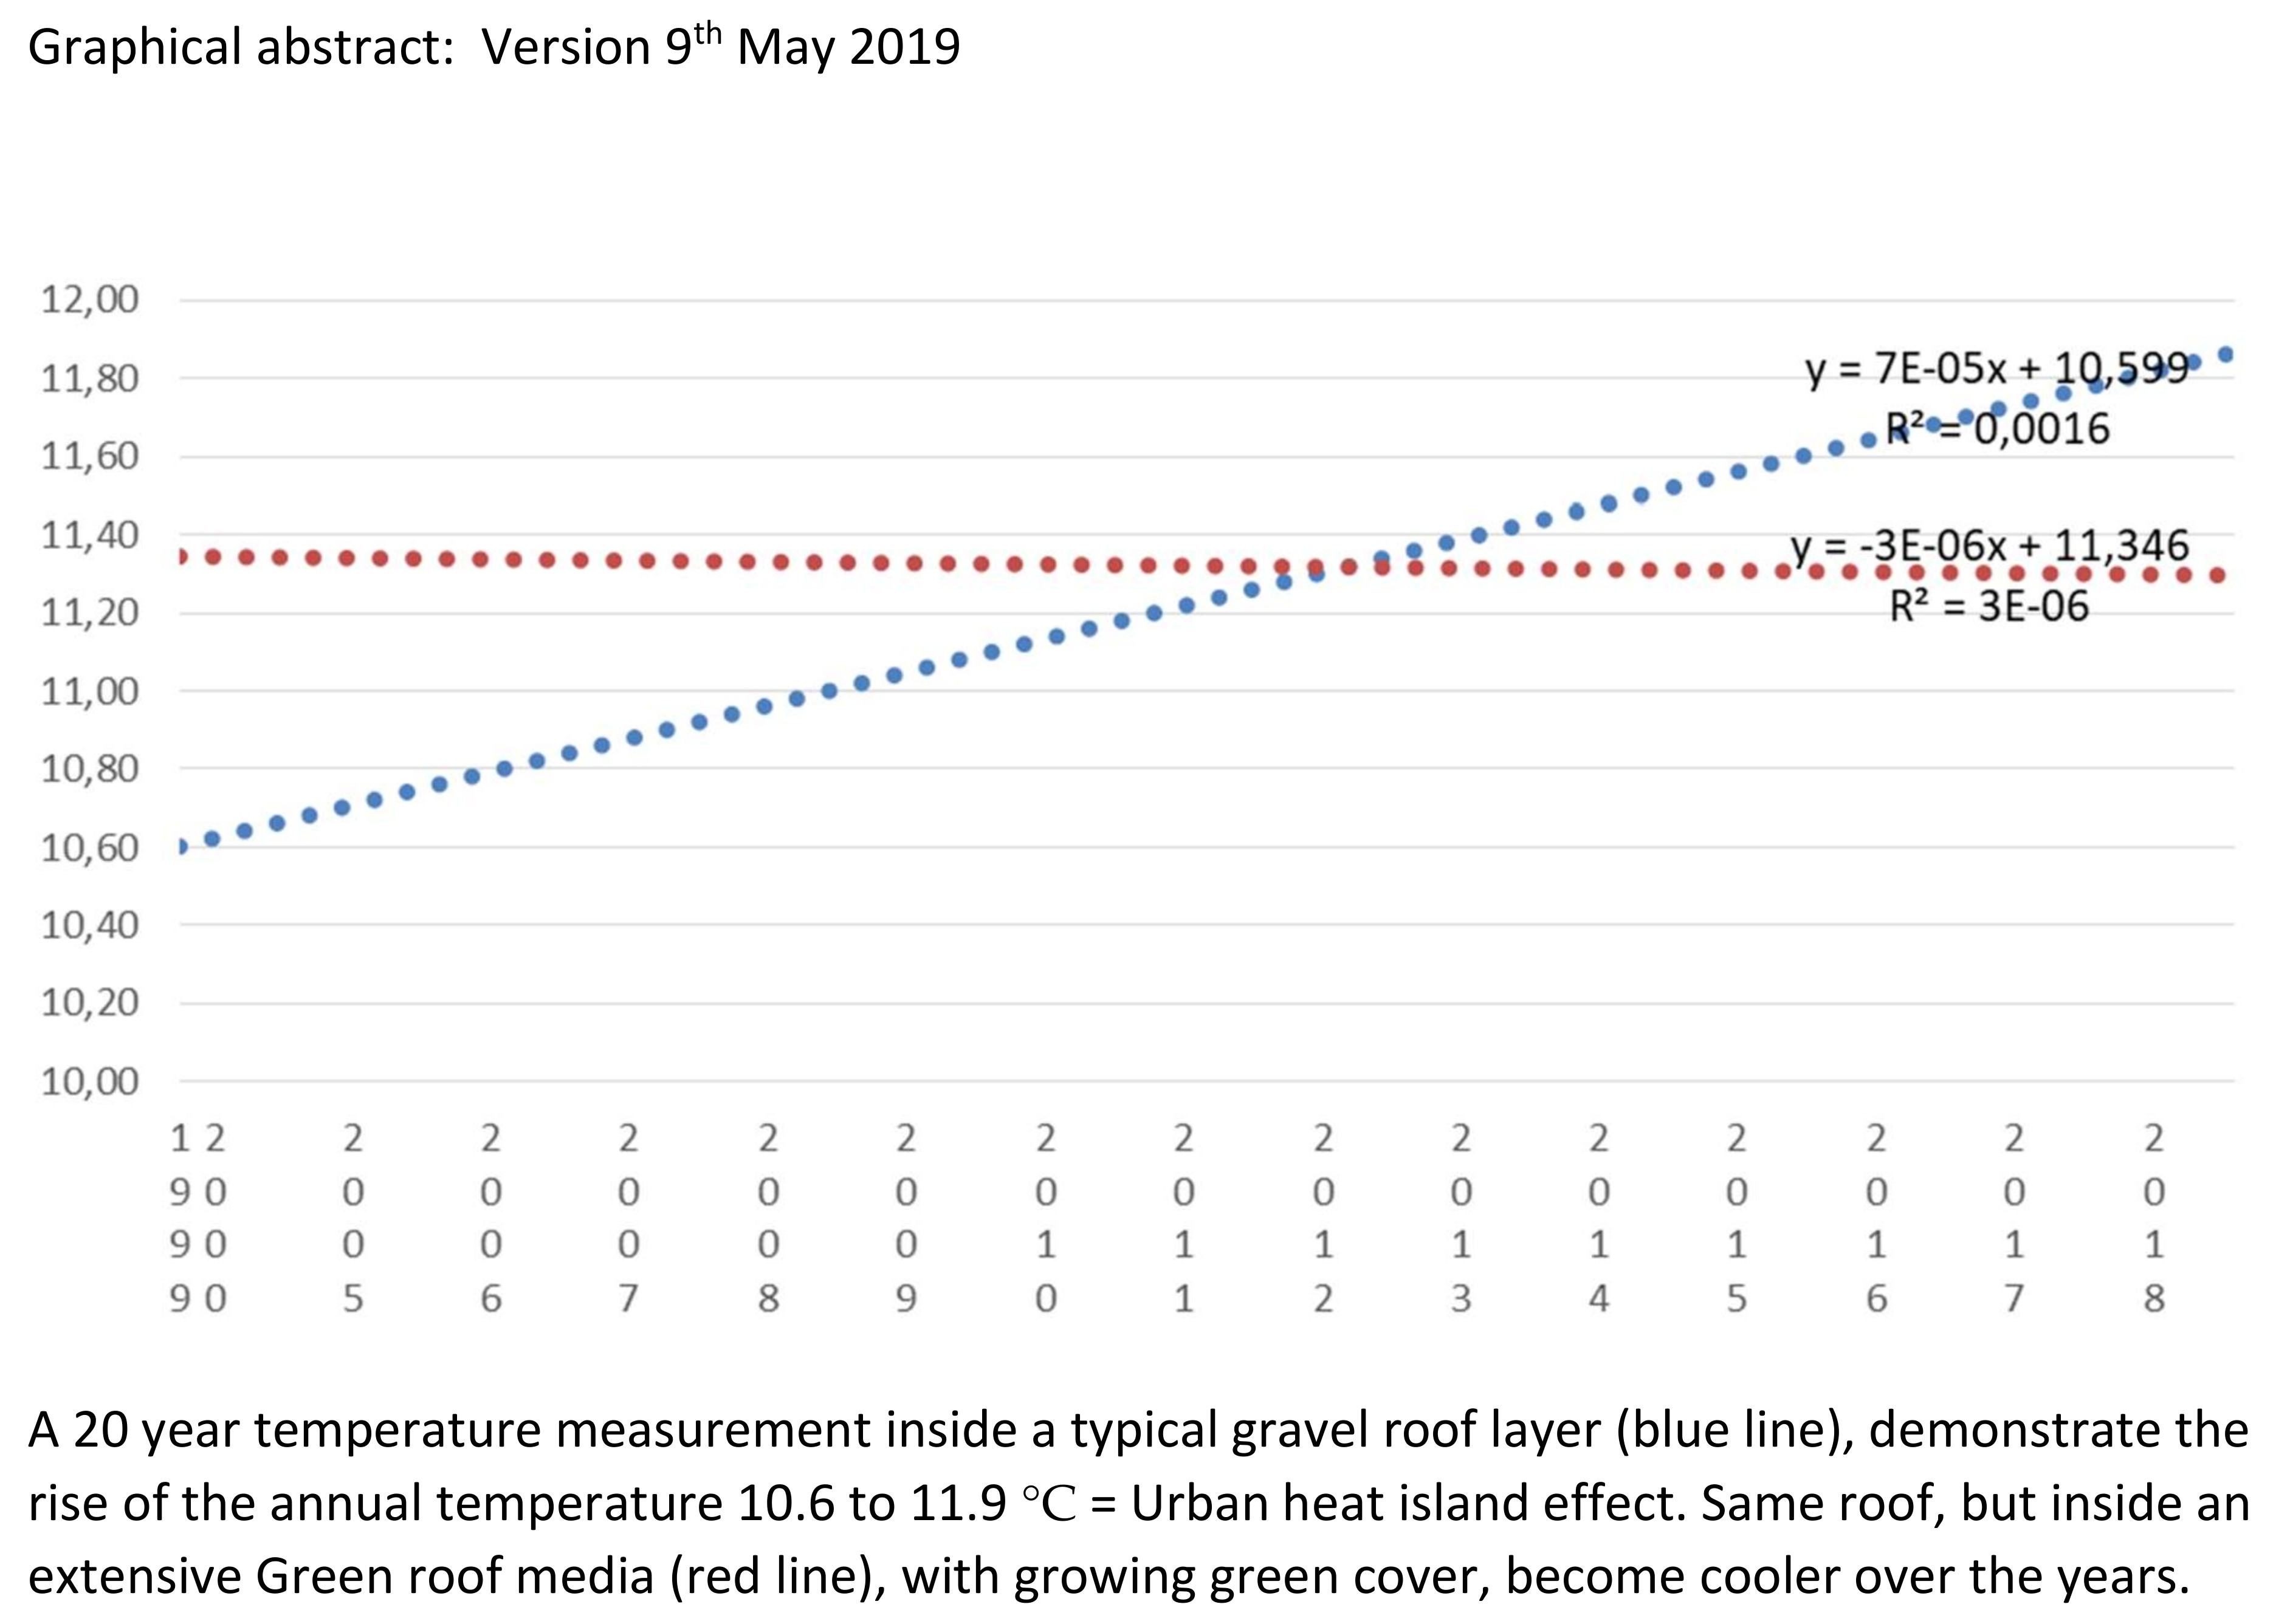
Figure 6 is an example of the annual graphs that were created this way for the ground temperature measured in the gravel surface (blue line) and in the green-roof substrate. Even these strong aggregations clearly show that the extreme temperatures were measured in the gravel surface. The special features of the data set become evident when the values are smoothed to trend lines, which, as expected, increase over the years in accordance with the UHI effect. It can be assumed that all values would behave according to the trend lines for the air temperatures (
Figure 4b), i.e., increase. This is what was seen in the surface temperatures (
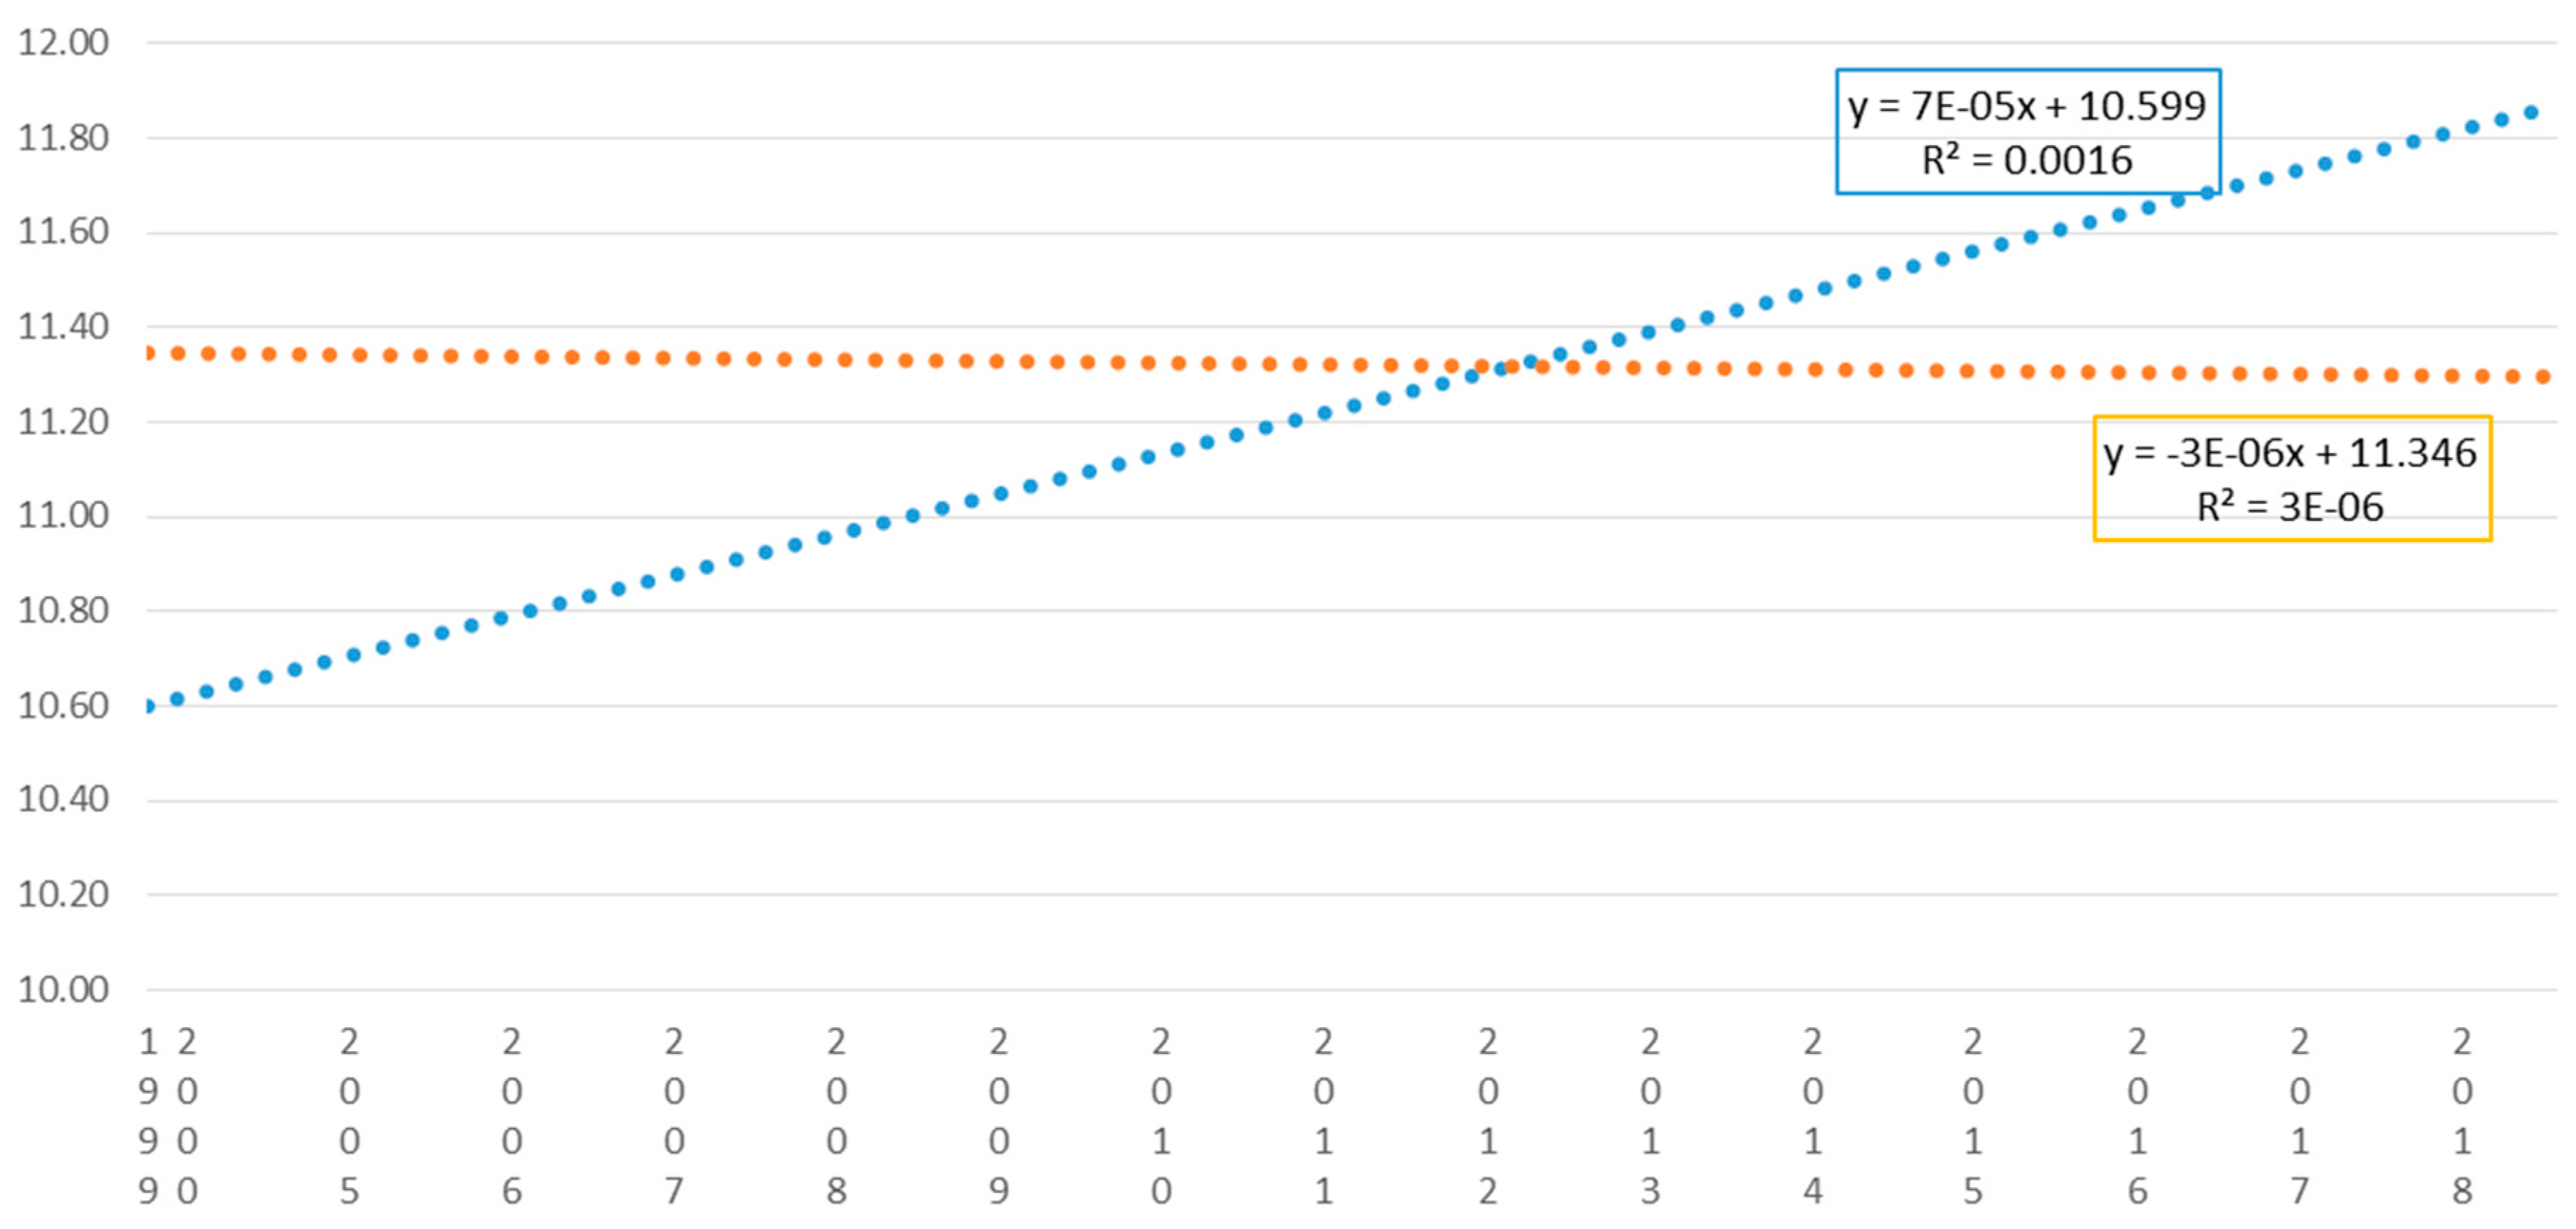
Figure 5) of the gravel roof, but not in the green-roof substrate (
Figure 7); this is the new finding and what has been proven by these long-term measurements.
The air, both surface temperatures, and the inside gravel temperature follow similar trend increases over the years. In contrast to this, the inside green temperature remains at a constant level and, in fact, the temperature decreases over time.
The green roof trend line started a little bit above 10 °C and decreases by approximately 0.5 K over the period from 1999–2018. The gravel temperature rises by a similar value of 0.5 K.
This difference can be explained by the maturing of the growing media, providing a densely covered vegetation layer that buffers the temperature more effectively than the big gravel stones that let air stream through them and capture the summer temperature with higher peak temperatures at sunny times of the day. In the end, there is a difference of about 1 K. This is a good message in the search for strategies to combat the urban heat island effect.
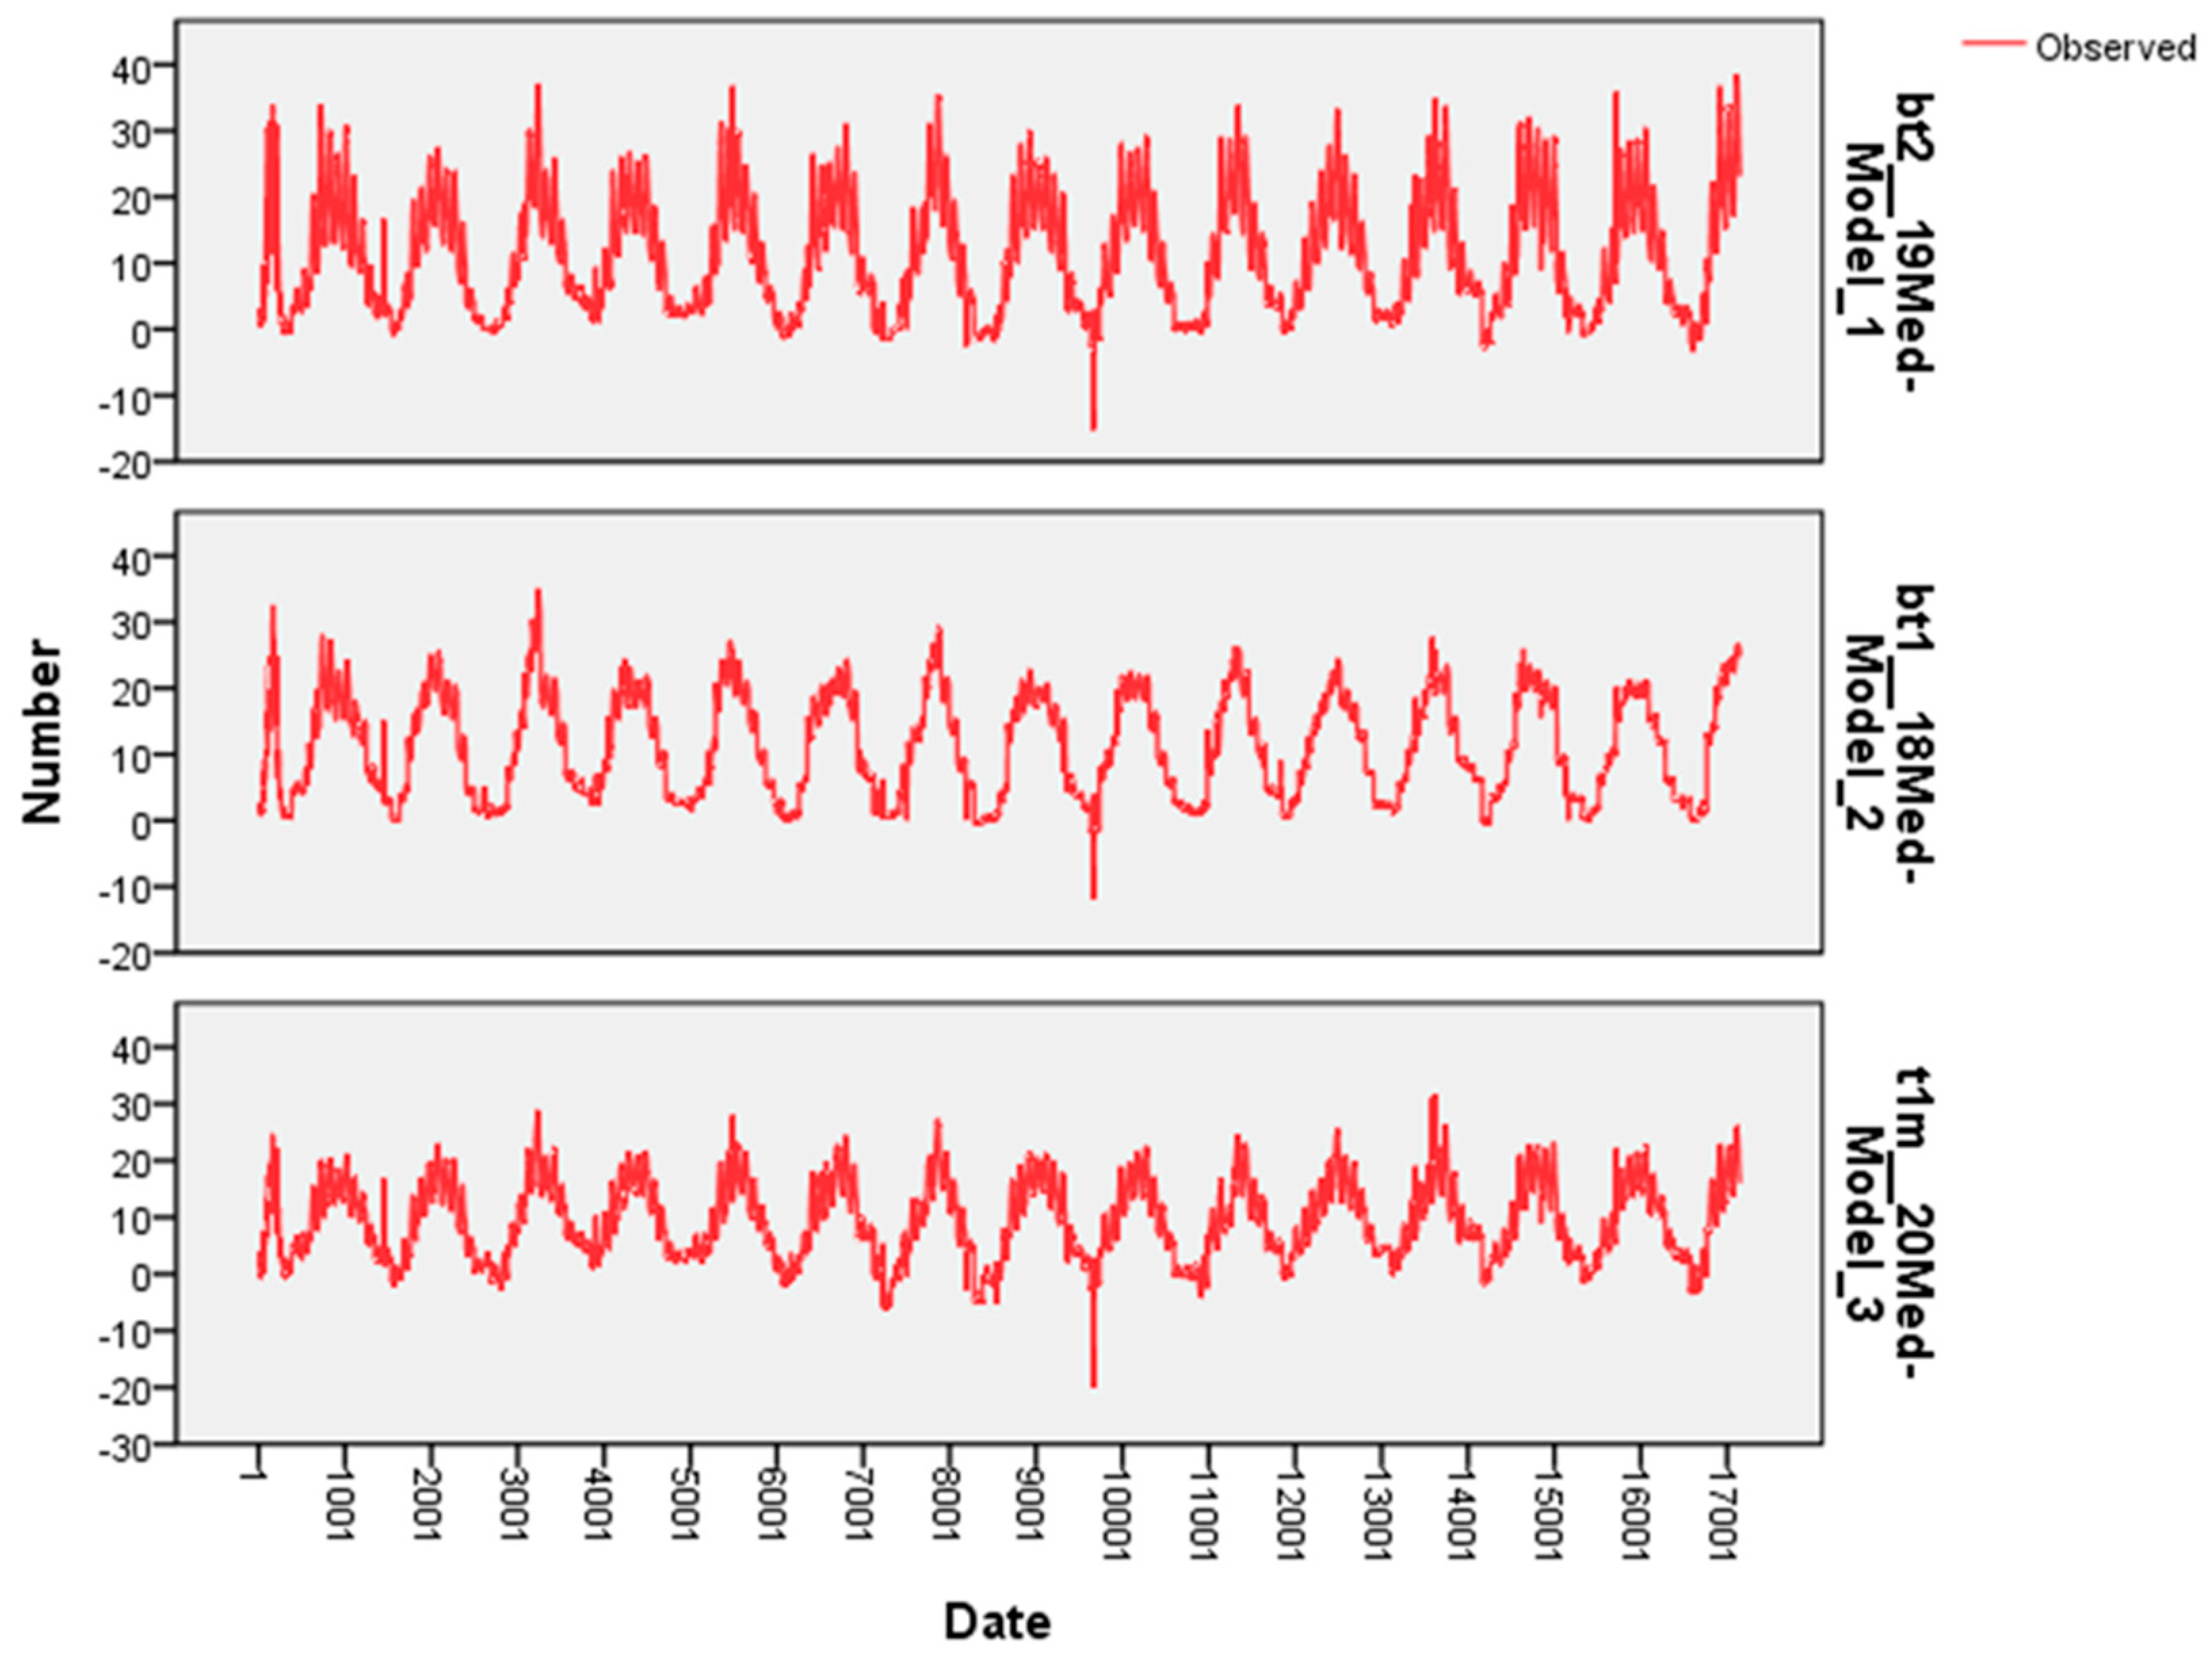
The statistical validation of the data sets can be explained using two examples. The paired sample statistics in
Figure 8 underline how variation inside the data sets has been interpreted. The separated temperature curves over the full time span show similar significance, but a higher fluctuation in the gravel material when compared to the slower changes in the growing media of the green roof (finer line of values). The 1-meter temperature reacts very similarly to the gravel temperature (similar layout of the lines); see
Figure 9.
In order to improve comparability, the linear regression resulting from the temperature values has been converted in
Table 7 for a period of 20 years, matching the measurement period at UAS Neubrandenburg.
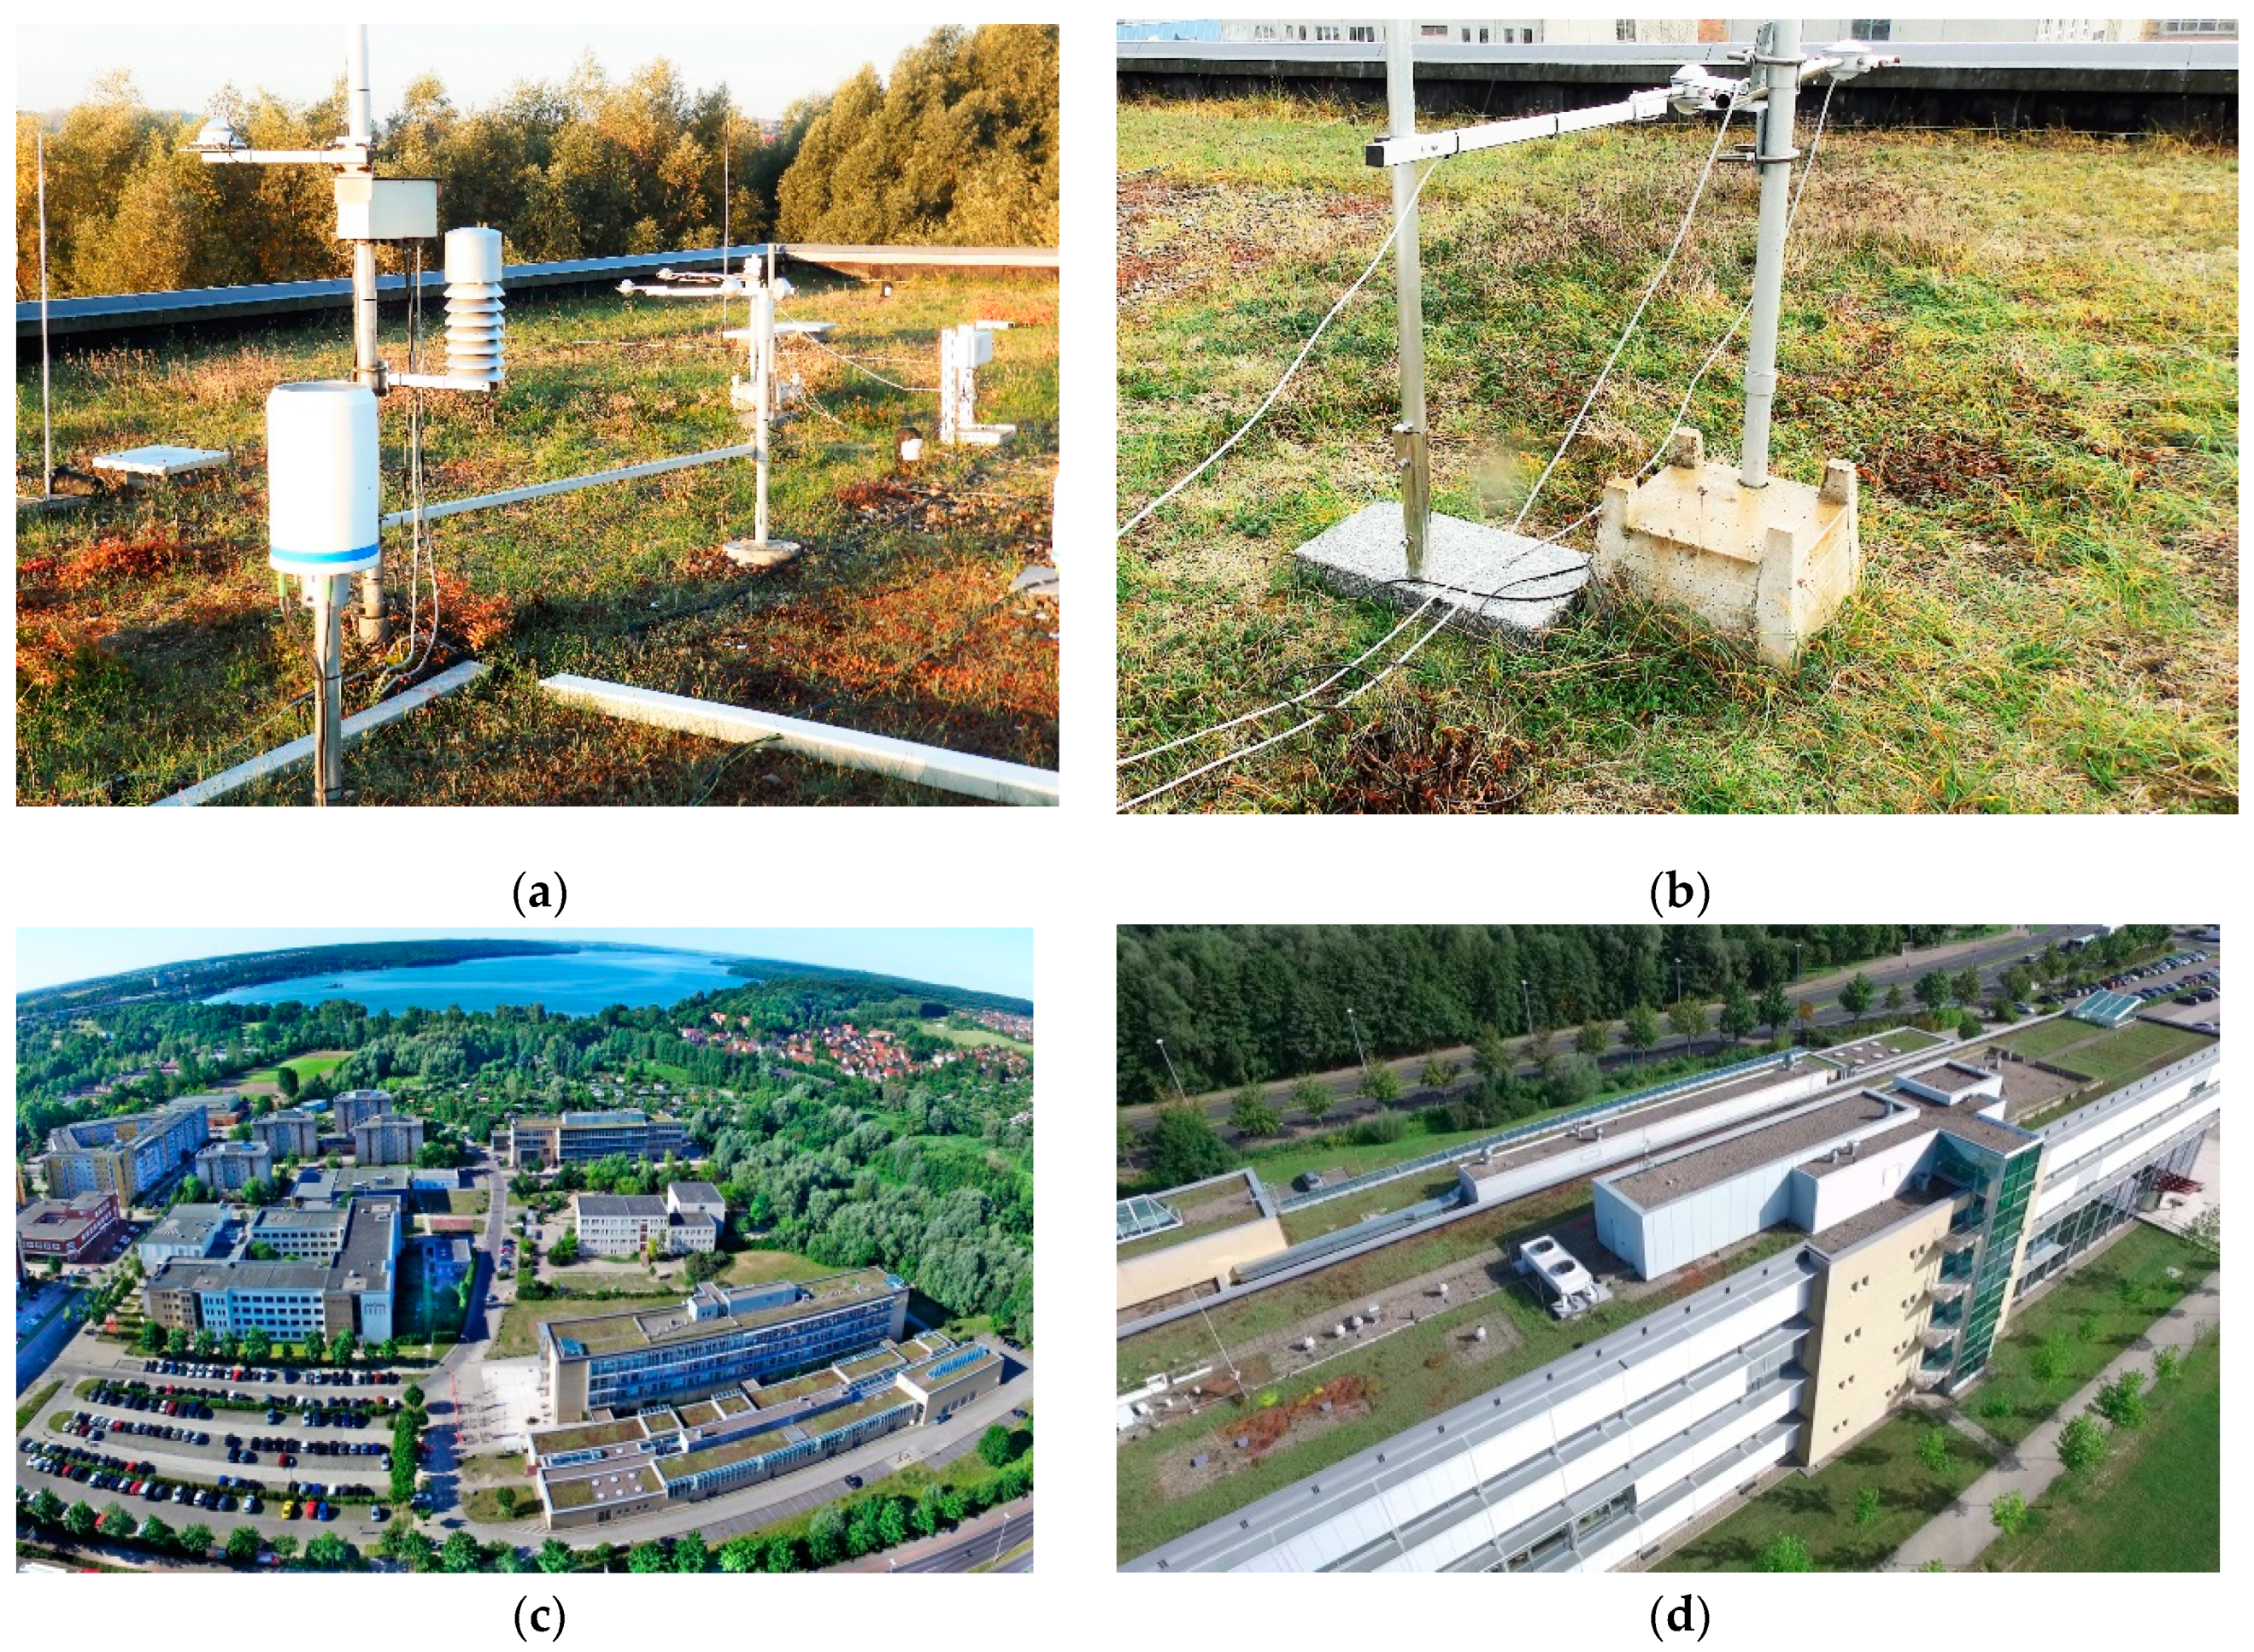
Within these 20 years of green roof research (
Figure 10), 2017 saw very humid conditions during the summer, with nearly no water stress and great blooming situations for several weeks from May through September. In contrast to this, 2018 was the hottest and driest summer for the last 150 years of climate surveys in Germany. This wet 2017 could be one reason for the cooling effect inside the Green roof in spite of hot and dry weather, see
Table 7.
5. Discussion
This installation represents typical EGRs with a sedum-dominated vegetation layer. About 85% of all green roofs in Germany are similar. The big benefit of this kind of vegetation cover is that it is robust against various kinds of climate variation throughout the years. This vegetation accepts both dry and extremely wet summer seasons. It adapts to wide ranges of climate variation. These vegetation layers were also not destroyed during extremely cold or mild winters [
24].
This type of EGR was tested in comparison to “gravel roofs” which is the standard type of bare-roof construction on buildings in Germany. The normal situation in Germany is that EGRs in northeastern Germany have to cope with scarce summer precipitation, in contrast to southern Germany, where, for example, the region around Munich is subject to heavy summer rainfall. Such EGRs are suited to variations in annual climate change. Due to climate change, two extreme years have been seen very recently with wet summer conditions in the summer of 2017 and 2018 entering the record books as the hottest and driest summer since the beginning of climate measurements 150 years ago. One conclusion is that these types of roof are extraordinarily well-adapted to extreme weather conditions and low maintenance, but the quality of biodiversity is only low. This type of roof successfully contributes to climate mitigation.
The cooling effect of green roof surfaces has previously been confirmed in many studies, for example by Bevilacqua et al. [
25]. It is cooler during the daytime, but in many cases warmer due to insulation during the night, especially where there are larger amounts of vegetation. This is well-documented in reports about the EGR in Neubrandenburg, e.g., with IR pictures that were published in 2005 [
26] and show some remarkable characteristics.
This study, as summarized above (in
Table 7), saw a change in climate, with the temperature rising in both Berlin and the town of Neubrandenburg (on top of the university’s building) by 0.6 K over the last 20 years. The airport Trollenhagen is located in the commuter area and saw a rise of 0.3 K in those 20 years.
The nearer the measurements were taken to the ground or the surface of the building, the higher the value, e.g., the sensors inside the gravel layer on the roof saw a rise of 1.4 K during this period. Both the green roof and gravel surfaces had similar trends with 0.7 °C. The positive effect of the EGR was shown inside the green roof, where there was a reduction of 0.1 K during this period. This value has to be compared with the value from inside the gravel layer, which produces a result that shows that the green roof reduced the temperatures by 1.5 K, which is near to the aim discussed in the global climate change debate stipulated in the IPCC report and the Paris Resolution with a 1.5 or 2 K goal for the immediate future [
27,
28].
If the 2 K increase in temperature as documented here continues for the next 65 years, Skelhorn et al.’s [
29] prognosis of a 3K increase for Manchester by 2080 could become true.
According to Koc [
30], about 165 related short–term studies of green roofs and climate performance have been documented. A simulation in Australia has shown that green roofs can also have influences of 1–5 K on the street-canyon level in Melbourne [
31]. Furthermore, these types of EGR have energy-saving effects. This was measured by own readings for this type of typical construction that were taken throughout the course of one year and showing an average saving effect of about 4% of winter heating costs [
32].
Urban areas across the globe are searching for practical strategies to mitigate rising urban temperatures. For example, Berlin [
33] suggests the introduction of more evaporative surfaces. Green roofs are one element of this concept with an effect of a maximum of 1.5 K. One third of the city’s surface is covered by roof spaces, but not all of these are suitable for this kind of evapotranspiration. Higher-quality evaporation could be achieved by cooling roofs with swamp-style spaces on top. In his thesis, Betzler [
34] calculated that if optimized roofs, living walls, and evaporative facades were to be installed on a new building in Hamburg, the building could evaporate 5 times more than normal buildings, as more rain would fall on the property every year. That means that if one building was developed as an evaporation cooling building, only every fifth subsequent building would have to be developed similarly to have the full effect. At an urban planning level, his green cooling factor value makes it possible to calculate this for every city, and evaporative buildings could make up 20% of future construction work. For example, about 3–8% of the roofs in Berlin are currently green roofs, which, as mentioned above, are about 85% similar to the roofs used in this study. For data about the green roof in Berlin, see the environmental online map [
35].
About 50% of the roofs have the potential to be greened if they are not too steep and are equipped with enough static to bear the weight. The advantages of green roofs are much more than just the urban cooling effect; this kind of urban surface reserve provides additional urban living space [
36]. Facades in Berlin [
37] have a vegetation cover of only approximately 1%; as a simple value, 30–50% of these could be used as evaporative functional facades and help to further cool the climate [
38]. Such concepts can be economically sustainable. The vertical greening technologies made possible by climbing plants are simple and effective; living walls that have emerged in the last years have made a great improvement This technique can also provide ecosystem services if the ground area is limited for other vegetation structures [
39].
5.1. Green Roofs as Active Systems to Mitigate Climate Effects
Greening buildings can contribute to climate mitigation with simple answers, including more diversity with higher biomass. This enhances the evapotranspiration [
40] and can perhaps provide a solution for ventilating a cold air stream into the hot inner city area, as seen in existing ideas that have been implemented at the ufaFabric in Berlin [
41], but also in modelled solutions for Shanghai [
42]. As this working group started in Berlin and later continued its work in Neubrandenburg, it was able to elucidate very special solutions to urban greenery; over the years, a lot of evidence has been gathered about the benefits of EGRs that make the outlook optimistic for further urban solutions.
Following the strong need for more climate mitigation and adaptation [
43], this textbook (with more than 2000 pages) from 2015 focuses on the description of climate change with an emphasis on adaptation, with only nine contributions addressing mitigation. In the last few years, awareness has grown for greening urban environments as a strong climate mitigation strategy.
The EGR functions as explained above, but grasses, shrubs, and other taller vegetation can perform better than sedum and result in more effective evaporation cooling [
44]. Water cisterns filled with rainwater are a further strategy for enhancing the active evaporation procedure [
45]. Two results of this research could be adapted in Germany: Firstly, the implementation of EGRs on more roofs, where the load barrier is low; but secondly, the upgrading of more intensive green roofs by adding further evaporative functions.
It must be pointed out that these roofs with greater functional demands require a higher level of professional maintenance in order for them to achieve their ambitious targets, which is a reduction of climate warming by more than 1.5 K.
Finding 1 is explained by Pearson’s R, and is shown in
Table 6; the temperature regime inside the green roof is different from the temperatures found inside the typical gravel roof layer or on the roof surface.
This is followed by finding 2: These results in
Table 7 show a general increase in the average temperature over the 20-year survey in the urban environment in general. The green roof did not follow this trend; it became slightly cooler (1.5 K) when compared directly with normal gravel solutions. This delivers opportunities in the struggle against global warming in built-up urban areas.
Heatwaves are consequences of climate change, plants on roofs can accept such changes, but this is not the case for large parts of the population. EGR or better blue-green infrastructures are highly recommended as new technologies in the fight against changing climates [
46].
Today, many politicians are searching for resource-efficient solutions for mitigating UHI. Green roofs have potential as a cooling tool. Green roofs as described here can be installed on nearly all flat roofs, which cover up to approximately 30% of cityscapes. In addition to a number of further energy-saving benefits and a real mitigation of urban global warming effects in cities, green roofs could contribute to achieving the European low carbon target by 2050 by providing a well-improved technology [
47].
Buildings are the cause of about 48% of all energy consumption. EGRs reduce the energy lost through roof surfaces and cool urban surfaces down via evapotranspiration [
48]. In cases in which EGRs were replaced by IGRs (Irrigated Green Roofs) with a thicker layer of vegetation, an extra cooling effect of 2.82 kWh/m
2 was measured on summer days [
49].
5.2. As a Future Outlook
The performance of the green roofs could be used subsequently to support the cooling technologies of buildings. For example: Ideally, the colder air stream above green roofs could be directed into the houses and used for environmental cooling technologies [
50].
The term “blue-green infrastructure” is used to describe new types of green roofs that are optimized to produce higher cooling rates due to more evapotranspiration. This is a way of achieving the concept of “swamp cities” by incorporating specialized green roofs.
6. Conclusions
The characteristics of the UHI are shown using trend lines for a typical extensive green roof over a period of 20 years.
The study shows that typical roof materials, for example gravel, contribute toward the UHI due to their ability to store energy and their color (albedo). The lack of evaporation surfaces in urban areas, as well as anthropogenic combustion processes, are the cause of current warming for which solutions must be found.
Politicians and planners are searching for solutions to combat these effects. The article provides a solution for building surfaces in urban areas. In most urban areas, almost half of the surfaces are covered by buildings of various kinds. This is where the greening of buildings can come into play. Instead of hard roofs that use tiles or gravel, green roofs could be used that would make an active contribution towards reducing these heat islands. As a result of this, EGRs play an active role in the fight against UHIs. This effect was measurable.
If we imagine this kind of roof surface on all of the worlds’ roofs, the Paris 2K target can be achieved solely by adapting the buildings’ roofs. The reason for this can be found in evapotranspiration as an energetic active cooling procedure and the plant cover’s shading effect on the roof surface (for more details on this, see the following article by Kaiser et al. in the same journal). Previously, this effect has been assumed or modeled, but it has now been measured over a long-term period. Key terms for further work are the continued development of green roofs into elements of the “blue-green infrastructure”, which in turn requires irrigation that not only benefits plant growth, but also the cooling of buildings.
However, the downside of this positive result is that roofs will be subject to greater amounts of weight and the functionality requires more maintenance work than the almost maintenance-free extensive green roofs. Future developments shall therefore require a cost-benefit calculation that also addresses the economic side of things.
Author Contributions
Conceptualization, Methodology, Investigation, Writing review: M.K., Formal Analysis, Data Curation: D.K. Translation Christopher Gray, Greifswald.
Funding
The research equipped was financed by the regular scientific finance of the UAS, Neubrandenburg. The personal resources by Bundesinstitut für Bau-,Stadt und Raumforschung, Bundesamt für Bauwesen und Raumordnung, Forschungsinitiative “Zukunft Bau”, Grant number SWD-10.08.18.7-16.41.
Acknowledgments
We thank UAS Neubrandenburg for their long-term and generous support for installing all the equipment on the buildings. Friendly support from the technical and administrative team members. Also to the peer review and technical team of the journal. Dedicated to Reinhard Bornkamm (*1931), Berlin, for initiating ecological green roof research in Germany and his personal guidance in this field of research over a long period.
Conflicts of Interest
The authors declare no conflict of interest.
References
- Walter, H. Bekenntnisse eines Ökologen: Erlebtes in acht Jahrzehnten und auf Forschungsreisen in allen Erdteilen mit Schlussfolgerungen Taschenbuch, 6th ed.; G.Fischer: Stuttgart, Germany; New York, NY, USA, 1999. [Google Scholar]
- Oberndorfer, E.; Lundholm, J.; Brass, B.; Coffmann, R.; Doshi, H.; Dunnett, N.; Gaffin, S.; Köhler, M.; Liu, K.; Rowe, B. Green roofs as urban ecosystems: Ecological structures, functions, and services. Bioscience 2007, 57, 823–833. [Google Scholar] [CrossRef]
- Bornkamm, R. Vegetation und vegetationsentwicklung auf kiesdaechern. Vegetatio 1961, 10, 1–24. [Google Scholar] [CrossRef]
- Sukopp, H.; Wittig, R. Stadtökologie, 2nd ed.; Gustav Fischer Verlag: Stuttgart, Germany, 1998; 474p. [Google Scholar]
- Koehler, M.; Poll, P.H. Long-term performance of selected old Berlin greenroofs in comparison to younger extensive greenroofs in Berlin. Ecol. Eng. 2010, 36, 722–772. [Google Scholar] [CrossRef]
- Köhler, M.; Barth, G.; Brandwein, T.; Gast, D.; Joger, H.G.; Vowinkel, K.; Seitz, U. Fassaden- und Dachbegrünung Ulmer (Stuttgart); Verlag Eugen Ulmer: Stuttgart, Germany, 1993; 329 S; ISBN 3-8001-5064-6. [Google Scholar]
- Kaiser, D.; Köhler, M. Bewässerte Gründächer; IRB-Bericht; FLL-Schriftenreihe: Bonn, Germany, 2019. [Google Scholar]
- Kravčík, M.; Pokorný, J.; Kohutiar, M.; Kováč, M.; Tóth, T. Water for the Recovery of the Climate—A New Water Paradigm. 2007. Available online: http://www.waterparadigm.org/download/Water_for_the_Recovery_of_the_Climate_A_New_Water_Paradigm.pdf (accessed on 31 January 2019).
- Köhler, M. Long Term Vegetation Research on Two Extensive Green Roofs in Berlin. In Urban habitats; Brooklyn Bot. Garden: Brooklyn, NY, USA, 2007; Volume 4, pp. 3–26. [Google Scholar]
- Köhler, M.; Ksiazek-Mikenas, K. Green roofs as habitats for biodiversity. In Nature Based Strategies for Urban and Building Sustainability; Pérez, G., Perini, K., Eds.; Butterworth-Heinemann: Oxford, UK, 2018; pp. 239–249. ISBN 978-0-12-812150-4. [Google Scholar]
- Shafique, M.; Kim, R.; Rafiq, M. Green roof benefits, opportunities and challenges—A review. Renew. Sustain. Energy Rev. 2018, 90, 757–773. [Google Scholar] [CrossRef]
- Besir, A.B.; Cuce, E. Green roofs and facades: A comprehensive review. Renew. Sustain. Energy Rev. 2018, 82, 915–939. [Google Scholar] [CrossRef]
- Envimet Environmental Climate Software Package. Available online: https://www.envi-met.com/ (accessed on 14 June 2019).
- Alexandri, E.; Jones, P. Temperature decreases in an urban canyon due to green walls and green roofs in diverse climates. Build Environ. 2008, 43, 480–493. [Google Scholar] [CrossRef]
- Barozzi, B.; Bellazzi, A.; Pollastro, M.C. The energy impact in buildings of vegetative solutions for extensive green roofs in temperate climates. Buildings 2016, 6, 33. [Google Scholar] [CrossRef]
- Eksi, M.; Rowe, D.B.; Wichman, I.S.; Andresen, J.A. Effect of substrate depth, vegetation type, and season on green roof thermal properties. Energy Build 2017, 145, 174–187. [Google Scholar] [CrossRef] [Green Version]
- Lösken, G.; Ansel, W.; Backhaus, T.; Bartel, Y.-C.; Bornholdt, H.; Bott, P.; Henze, M.; Hokema, J.; Köhler, M.; Krupka, B.W.; et al. Dachbegrünungsrichtlinien—Richtlinien für Planung, Bau und Instandhaltung von Dachbegrünungen—Ausgabe 2018; FLL, Ed.; FLL: Bonn, Germany, 2018. [Google Scholar]
- Climate Data Center CDC (NB-Trollenhagen: ID 5109, B-Tempelhof: ID 433). Available online: https://www.dwd.de/DE/klimaumwelt/cdc/cdc_node.html (accessed on 31 January 2019).
- WMO-Equipment. Available online: http://www.wmo.int/pages/prog/www/WMOCodes/Manual/WMO306_Vol-I-1-PartA.pdf (accessed on 31 January 2019).
- Clima Trollenhagen, Germany. Available online: https://de.climate-data.org/europa/deutschland/mecklenburg-vorpommern/trollenhagen-160086/#climate-graph (accessed on 31 January 2019).
- Clima Messtechnik, FundC, Hardware Installation. Available online: http://www.fundc.de/ (accessed on 31 January 2019).
- Aguilar, E.; Auer, I.; Brunet, M.; Peterson, T.C.; Wieringa, J. Guidelines on Climate Metadata and Homogenization; No. 1186; World Meteorological Organization: Geneva, Switzerland, 2003. [Google Scholar]
- Rosasco, P.; Perini, K. Selection of (Green) Roof Systems: A Sustainability-Based Multi-Criteria Analysis. Buildings 2019, 9, 134. [Google Scholar] [CrossRef]
- Ksiazek-Mikenas, K.; Köhler, M. Traits for stress-tolerance are associated with long-term plant survival on green roofs. J. Urban Ecol. 2018, 4, 1–10. [Google Scholar] [CrossRef]
- Bevilacqua, P.; Mazzeo, D.; Bruno, R.; Arcuri, N. Surface temperature analysis of an extensive green roof for the mitigation of urban heat island in southern mediterranean climate. Energy Build. 2017, 150, 318–327. [Google Scholar] [CrossRef]
- Köhler, M. Der Einsatz von Infrarot-Thermographie bei der Beurteilung von Gebäudebegrünungen. Dach+Gruen 2005, 14, 8–12. [Google Scholar]
- Schleussner, C.F. Differential climate impacts for policy. relevant limits to global warming: The case of 1.5 °C and 2 °C. Earth Syst. Dyn. 2016, 7, 327–351. [Google Scholar] [CrossRef]
- IPCC- Report, 2018, Global warming of 1.5 °C. Available online: https://report.ipcc.ch/sr15/ (accessed on 31 January 2019).
- Skelhorn, C.P.; Lindley, S.; Levermore, G. Urban greening and the UHI: Seasonal trade-offs in heating and cooling energy consumption in Manchester, UK. Urban Clim. 2018, 23, 173–187. [Google Scholar] [CrossRef] [Green Version]
- Koc, C.B.; Osmond, P.; Peters, A. Evaluating the cooling effects of green infrastructure: A systematic review of methods, indicators and data sources. Sol. Energy 2018, 166, 486–508. [Google Scholar]
- Imran, H.M.; Kala, J.; Ng, A.W.M.; Muthukumaran, S. Effectiveness of green and cool roofs in mitigating urban heat island effects during a heatwave event in the city of Melbourne in southeast Australia. J. Clean. Prod. 2018, 197, 393–405. [Google Scholar] [CrossRef]
- Köhler, M.; Malorny, W. Wärmeschutz durch extensive Gründächer. In Europäischer Sanierungskalender 2009; Beuth: Berlin, Germany, 2009; pp. 195–212. ISBN 978-3-410-16871-3. [Google Scholar]
- Becker, C.; Neuhaus, A. Stadtentwicklungsplan Klima KONKRET Klimaanpassung in der Wachsenden Stadt. Senatsverwaltung für Stadtentwicklung und Umwelt, Abteilung I Stadt- und Freiraumplanung. 2016. Available online: https://www.stadtentwicklung.berlin.de/planen/stadtentwicklungsplanung/download/klima/step_klima_konkret.pdf (accessed on 31 January 2019).
- Betzler, F. GDF—Green Density Factor and GCF—Green Cooling Factor. Ph.D. Thesis, TU Darmstadt, Darmstadt, Germany, 2016; 146p. [Google Scholar]
- Umweltatlas Berlin, Karte Gründächer, Map Green Roofs of Berlin. Available online: https://www.stadtentwicklung.berlin.de/umwelt/umweltatlas/i611.htm (accessed on 31 January 2019).
- STEP KLIMA. Available online: https://www.stadtentwicklung.berlin.de/planen/stadtentwicklungsplanung/download/klima/step_klima_konkret.pdf (accessed on 31 January 2019).
- Koehler, M.; Debrand-Passard, P. Fassadenbegrünungen in Berlin ein Vergleich von 1985 zu 2018. Stadt und Grün 2019, 9. in press. [Google Scholar]
- Perez, G.; Martonelli, I.; Cabeza, L.F. Vertical Greenery Systems (VGS) for energy saving in buildings: A review. Renew. Sustain. Energy Rev. 2014, 39, 139–165. [Google Scholar] [CrossRef] [Green Version]
- Perini, K.; Rosasco, P. Is greening the building envelope economically sustainable? Analysis to evaluate the advantages of economy of scope of vertical greening systems and green roofs. Urban For. Urban Green. 2016, 20, 328–337. [Google Scholar] [CrossRef]
- Lee, L.S.H.; Jim, C. Thermal-cooling performance of subtropical green roof with deep substrate and woodland vegetation. Ecol. Eng. 2018, 119, 8–18. [Google Scholar] [CrossRef]
- Cultural Center Ufa-Berlin. Available online: https://www.ufafabrik.de/en/14796/eco-pioneer.html (accessed on 31 January 2019).
- Ran, J.; Tang, M. Passive cooling of the green roofs combined with night-time ventilation and walls insulation in hot and humid regions. Sustain. Cities Soc. 2018, 38, 466–475. [Google Scholar] [CrossRef]
- Filho, W.L. Handbook of Climate Change Mitigation and Adaptation; Springer Science+Business Media: New York, NY, USA, 2015; p. 2189. [Google Scholar]
- Cao, J.J.; Hu, S.; Dong, Q.; Liu, L.J.; Wang, Z. Green roof cooling Contributed by C3, C4, and CAM Plant species. Energy Build. 2019, in press. [Google Scholar] [CrossRef]
- Tanaka, Y.; Kawashima, S.; Hama, T.; Nakamura, K. Thermal mitigation of hydroponic green roof based on heat balance. Urban For. Urban Green. 2017, 24, 92–100. [Google Scholar] [CrossRef]
- Taleghani, M.; Marshall, A.; Fitton, R.; Swan, W. Renaturing a microclimate: The impact of greening a neighbourhood on indoor thermal comfort during a heatwave in Manchester, UK. Sol. Energy 2019, 182, 245–255. [Google Scholar] [CrossRef]
- Schanes, K.; Jäger, J.; Drummond, P. Three Scenario Narratives for a Resource-Efficient and Low-Carbon Europe in 2050. Ecol. Econo. 2019, 155, 70–79. [Google Scholar] [CrossRef] [Green Version]
- Dixit, M.K. Life cycle recurrent embodied energy calculation of buildings: A review. J. Clean. Product. 2019, 209, 731–754. [Google Scholar] [CrossRef]
- Peng, L.L.H.; Yang, X.; He, Y.; Hu, Z.; Xu, T.; Jiang, Z.; Yao, L. Thermal and energy performance of two distinct green roofs: Temporal pattern and underlying factors in a subtropical climate. Energy Build. 2019, 185, 247–258. [Google Scholar] [CrossRef]
- Tang, M.; Zheng, X. Experimental study of the thermal performance of an extensive green roof on sunny summer days. Appl. Energy 2019, 242, 1010–1021. [Google Scholar] [CrossRef]
Figure 1.
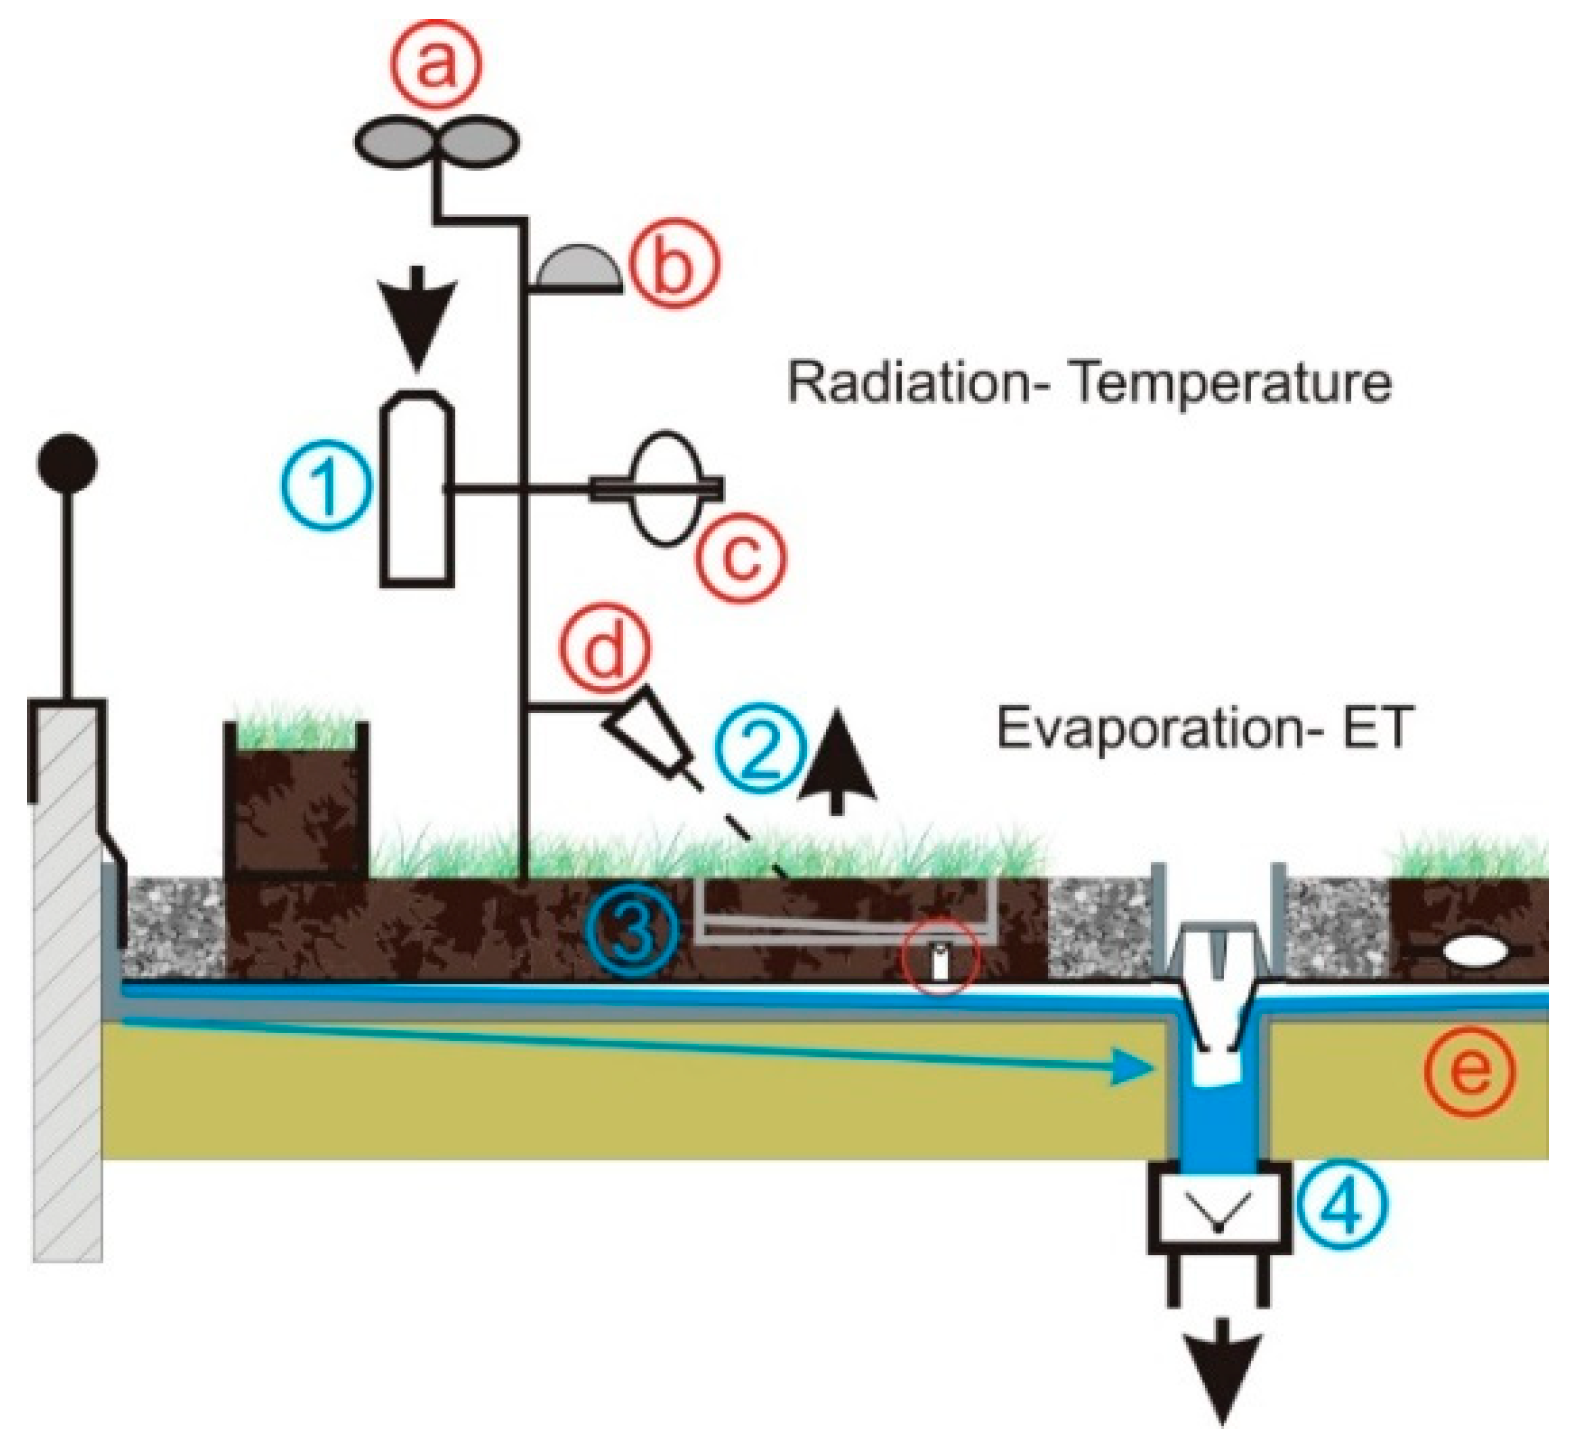
A cross-section schema of the sensors on the Extensive Green Roofs (EGR) in Neubrandenburg with the following sensors: Weather sensors: (a) Anemometer, (b) global radiation, (c) radiation balance, (d) infrared temperature sensors, (e) heat flux-plates. Water sensors: (1) Ombrometer rain gauge, (2) lysimeter, (3) tipping bucket (small), (4) tipping bucket (large).
Figure 1.
A cross-section schema of the sensors on the Extensive Green Roofs (EGR) in Neubrandenburg with the following sensors: Weather sensors: (a) Anemometer, (b) global radiation, (c) radiation balance, (d) infrared temperature sensors, (e) heat flux-plates. Water sensors: (1) Ombrometer rain gauge, (2) lysimeter, (3) tipping bucket (small), (4) tipping bucket (large).
Figure 2.
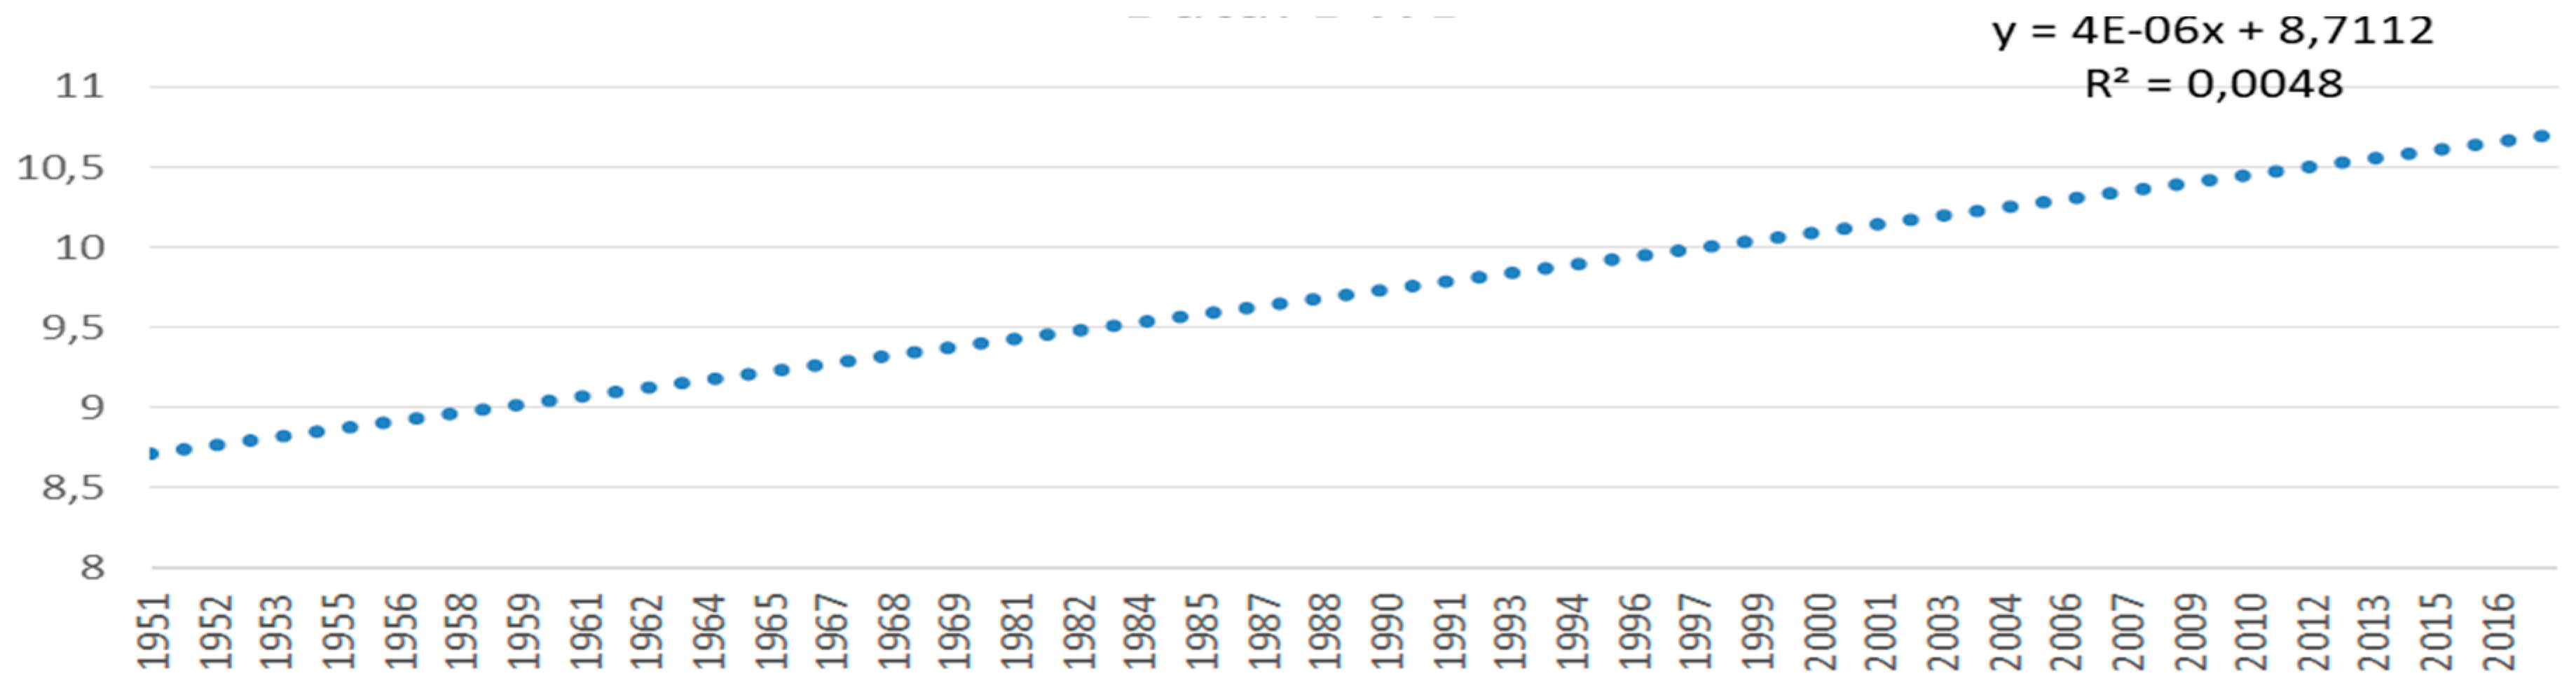
The trend line for air temperature increase in °C at a height of 2 m, Berlin-Tempelhof from 1951–2017, based on hourly values, n = 289.747 data sets [source: d, DWD].
Figure 2.
The trend line for air temperature increase in °C at a height of 2 m, Berlin-Tempelhof from 1951–2017, based on hourly values, n = 289.747 data sets [source: d, DWD].
Figure 3.
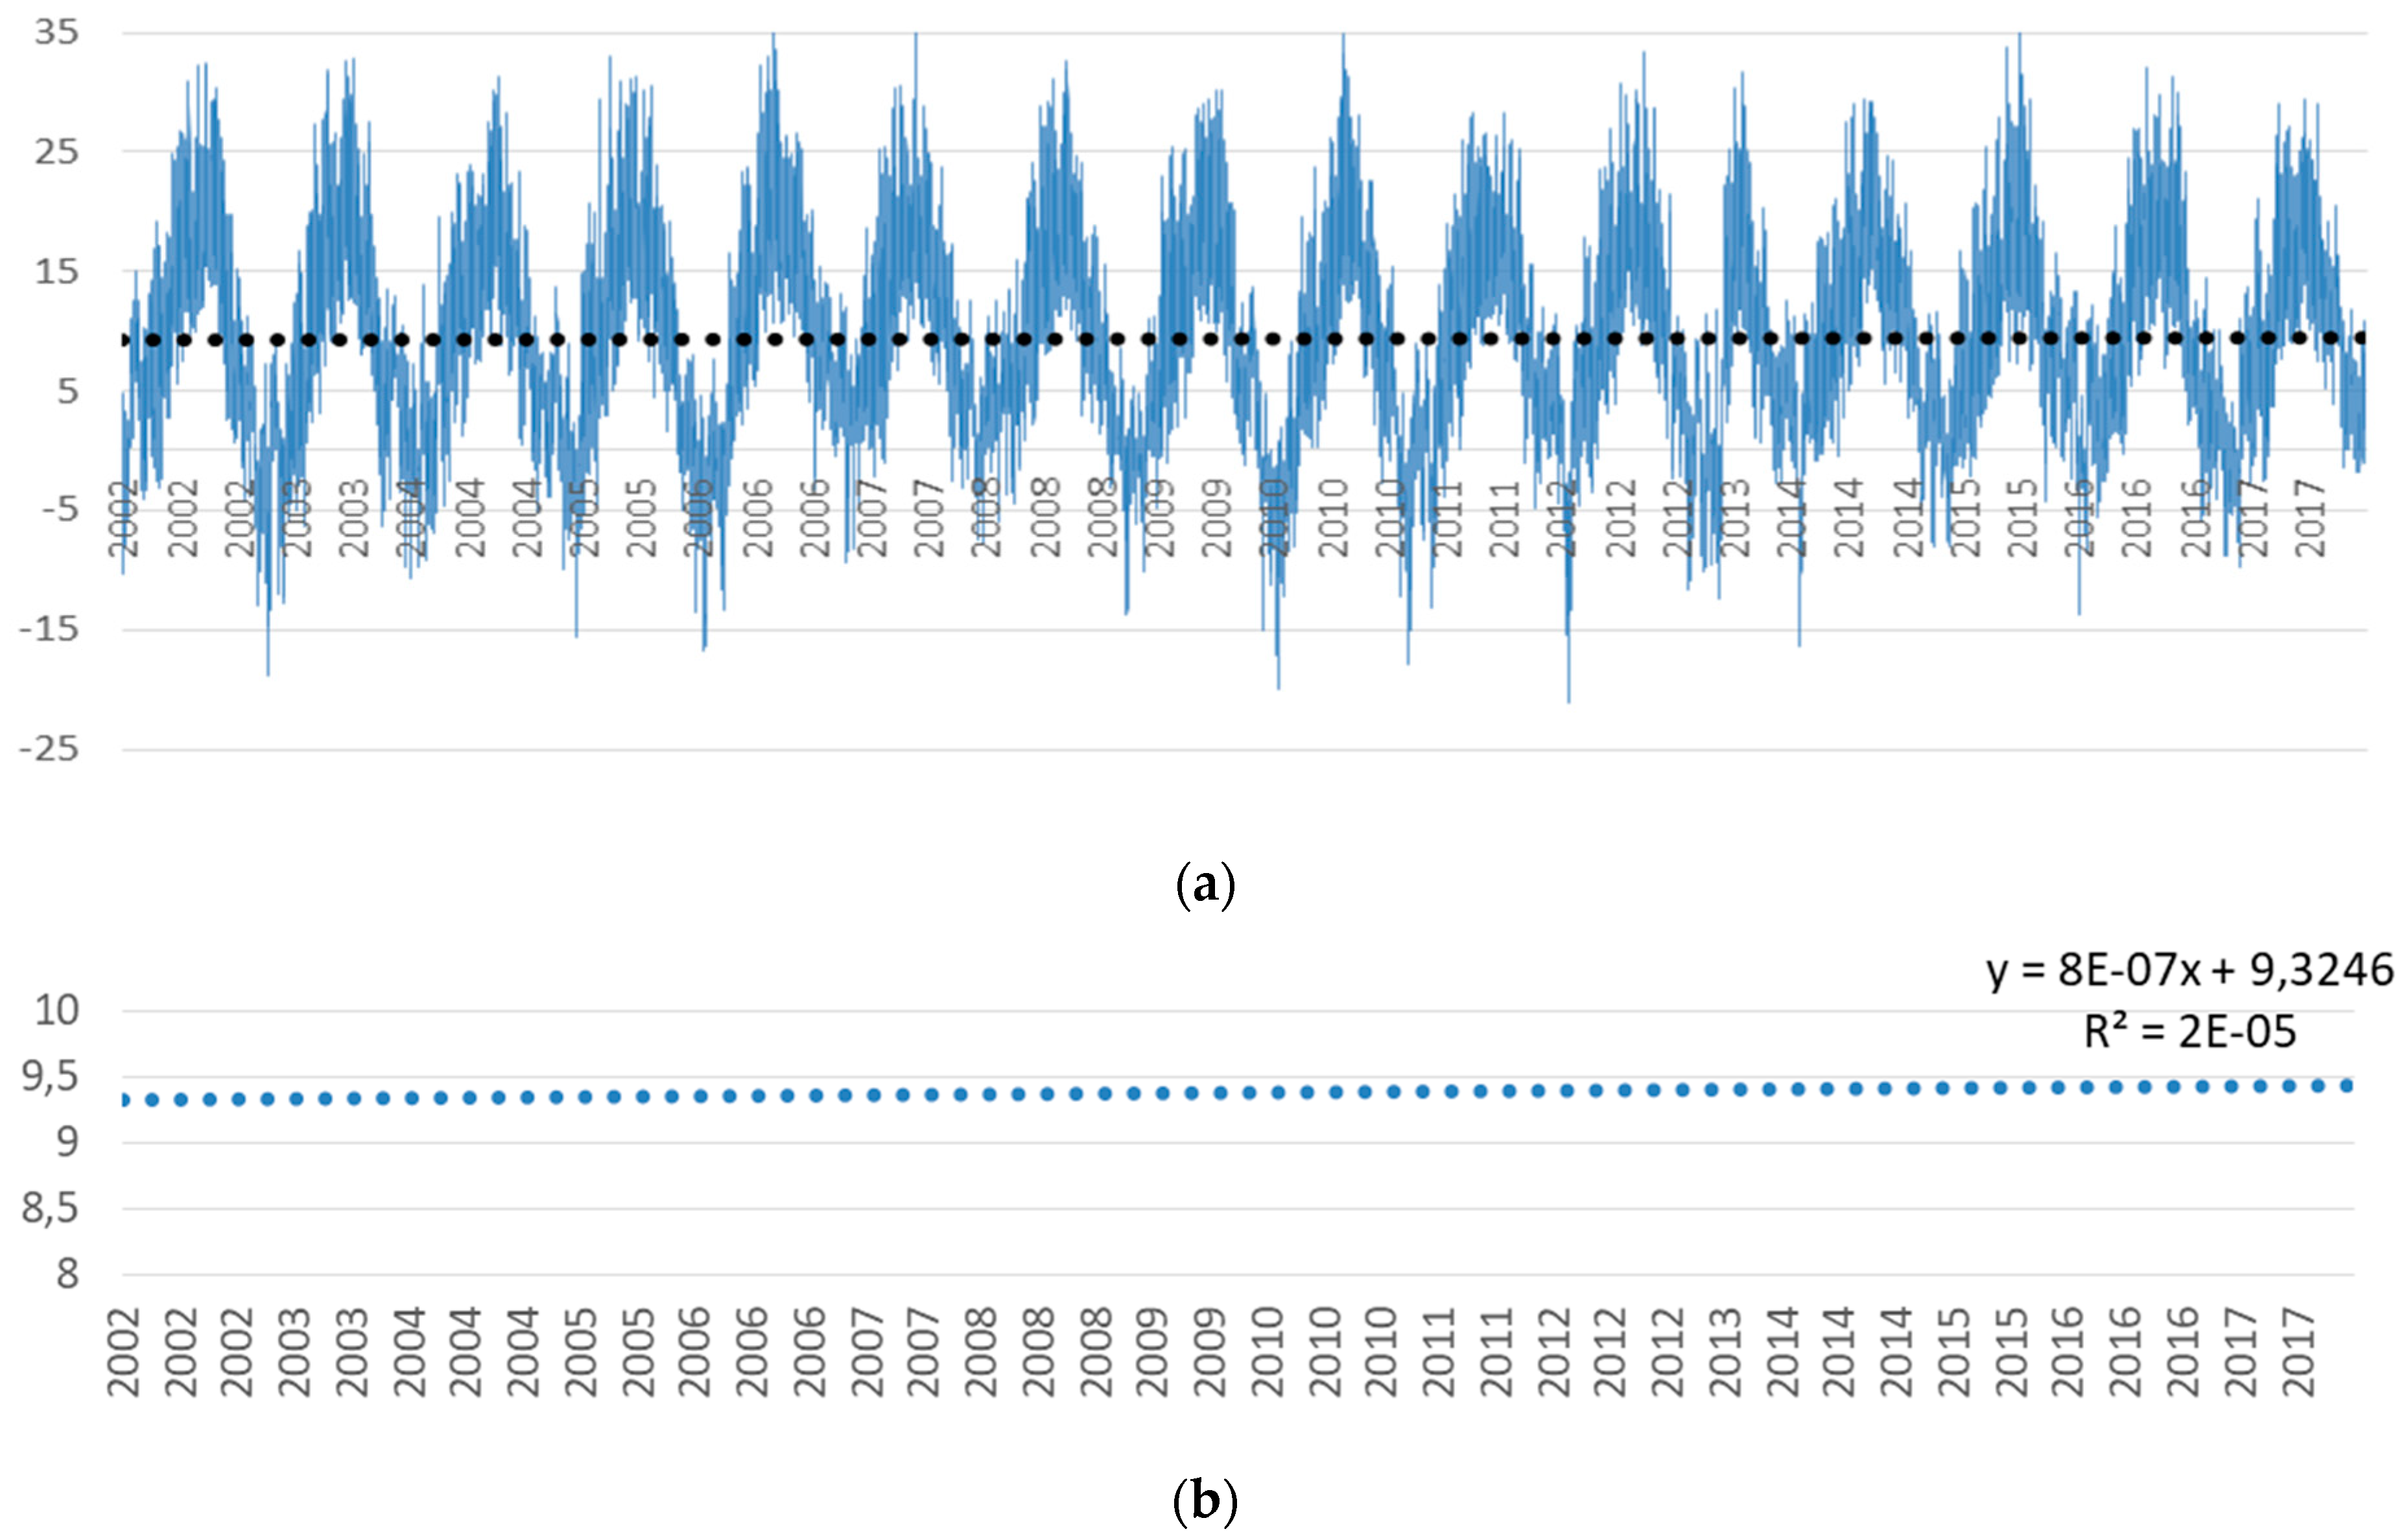
(
a) Hourly air temperature at 2 m in °C, NB-Trollenhagen from 2002–2017, [
18], based on own calculation. (
b) Air temperature trend line from 2002–2017, NB–Trollenhagen, [
18].
Figure 3.
(
a) Hourly air temperature at 2 m in °C, NB-Trollenhagen from 2002–2017, [
18], based on own calculation. (
b) Air temperature trend line from 2002–2017, NB–Trollenhagen, [
18].
Figure 4.
(a) T1m: Air temperature 1 m in °C above the roof vegetation, 1999–2018, UAS Neubrandenburg; own measurements. (b) Trend air temperature T1m, in °C UAS Neubrandenburg; own measurements.
Figure 4.
(a) T1m: Air temperature 1 m in °C above the roof vegetation, 1999–2018, UAS Neubrandenburg; own measurements. (b) Trend air temperature T1m, in °C UAS Neubrandenburg; own measurements.
Figure 5.
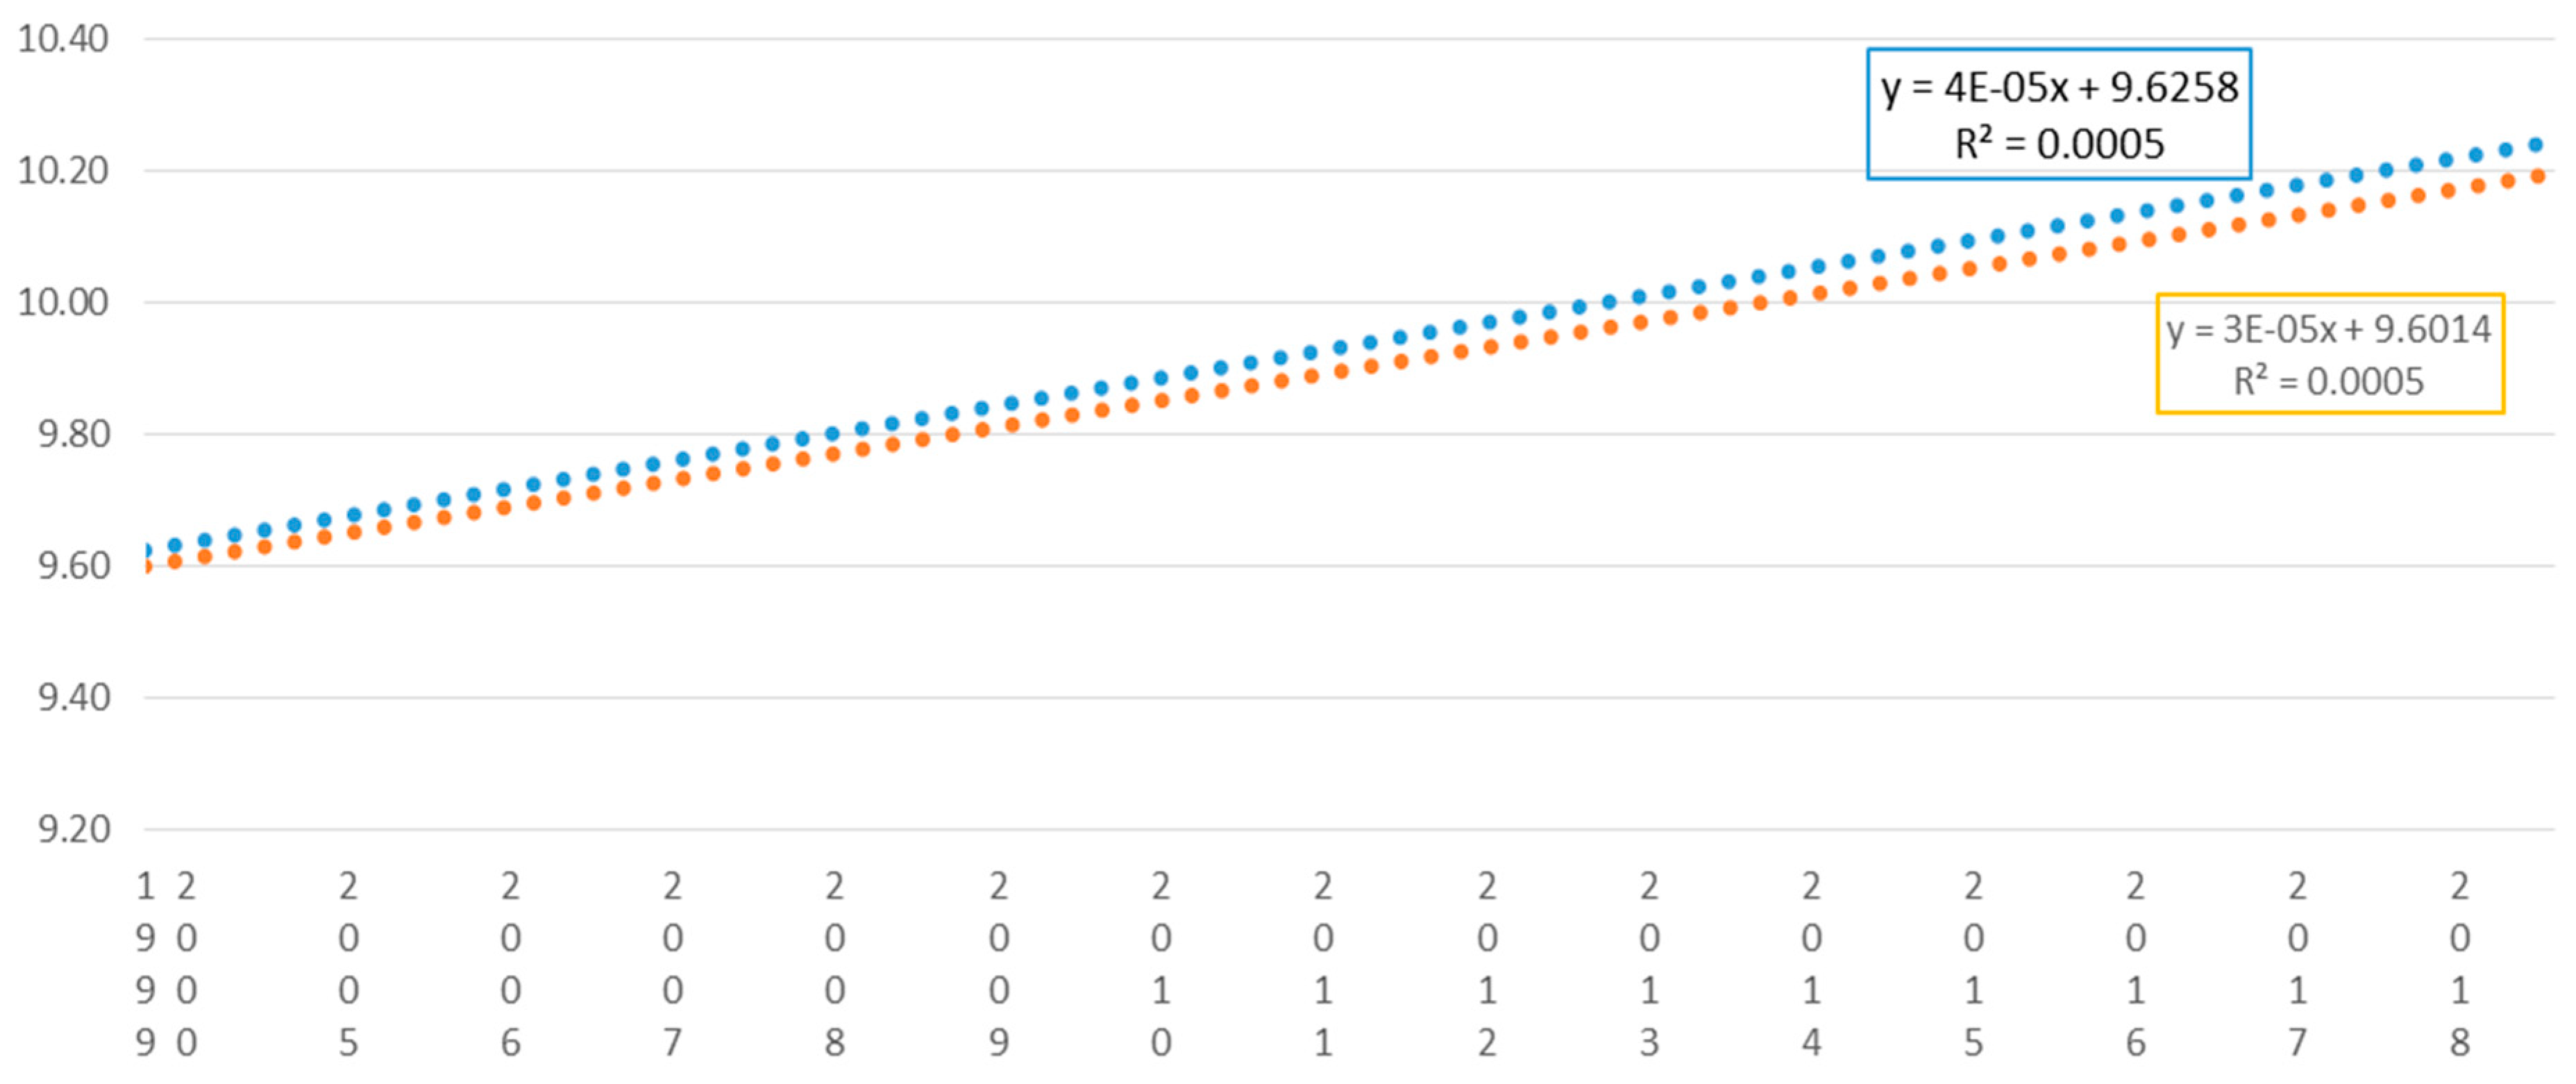
The trend surface temperature (green roof: Red line), (gravel roof: Blue line) in °C, UAS Neubrandenburg, from the years 1999–2018; own measurements.
Figure 5.
The trend surface temperature (green roof: Red line), (gravel roof: Blue line) in °C, UAS Neubrandenburg, from the years 1999–2018; own measurements.
Figure 6.
Inside green roof media (red lines), inside gravel (blue lines), mean annual temperature in °C, and trend lines from 1999–2018, UAS Neubrandenburg; own measurements.
Figure 6.
Inside green roof media (red lines), inside gravel (blue lines), mean annual temperature in °C, and trend lines from 1999–2018, UAS Neubrandenburg; own measurements.
Figure 7.
Detail from
Figure 6 showing the trend of temperatures in °C inside green roof soil (red) and inside gravel roof (blue) from 1999–2018.
Figure 7.
Detail from
Figure 6 showing the trend of temperatures in °C inside green roof soil (red) and inside gravel roof (blue) from 1999–2018.
Figure 8.
Paired sample statistics of temperature at 1m (t1m), gravel (bt2) and green (bt1) roof temperatures from 1999–2018.
Figure 8.
Paired sample statistics of temperature at 1m (t1m), gravel (bt2) and green (bt1) roof temperatures from 1999–2018.
Figure 9.
A scatterplot of the regression analysis of the complete data set since 1999, with strong dependence of the air temperature 1 m above the roof (t1m) and the dependent surface gravel temperature (Tbod).
Figure 9.
A scatterplot of the regression analysis of the complete data set since 1999, with strong dependence of the air temperature 1 m above the roof (t1m) and the dependent surface gravel temperature (Tbod).
Figure 10.
Detail view of the research site. (a) Sensors on the main green roof, located at 1 m above the roof surface; (b) Different radiation balance meter during calibration. (c) University of Applied Sciences, buildings with the green roof installations in the bottom right corner. (d) Building II with the sensors.
Table 1.
The climate measurement equipment of the research roof in Neubrandenburg. (Rating 1: High quality, good results; 2: Ok, with some issues; 3: Not recommended).
Table 1.
The climate measurement equipment of the research roof in Neubrandenburg. (Rating 1: High quality, good results; 2: Ok, with some issues; 3: Not recommended).
| Sensor | Specification | Accuracy | No of Sensors | In Use Since | Brand | Rating Quality |
|---|
| Air Temp. | PT100 | −40/+80 K
±0.15 K | 4 | 1999– | FUC | 1 |
| Soil Temp. | PT100
protected | −40/+80 K | 2 | 1999– | FUC | 1 |
| Infrared Temp. | TPM-FO-L | −20/+100 K | 2 | 1999–2018 | Heiman | 3 |
| IR-Temp. | MID 02 T4G | −40/+80 K | 3 | 2001– | Raytec | 2 |
| Hygro-Air-Temp. T1m | PT100 | −30/+70 K | 1 | 1999– | Thiesclima | 1 |
| Relative humidity in -1m | 0–2000 Ohm | 0–100% rh | 1 | 1999– | Thiesclima | 1 |
| Manual rain gauge after | | | | | | |
| Hellmann | Manual | 0.1 | 1 | 1999– | Lambrecht | 1 |
| Precip. after Joss-Tognini | 15188 | 0.1 mm | 3 | 1999– | Lambrecht | 2 |
| Prec. Rain-e-H 3 | 15184.540 020 | 0.01 mm | 2 | 2018 | Lambrecht | 1 |
| Anemometer, opto-electronic | 4.3303.22.007 | 0.1 m/s | 3 | 1999– | Lambrecht | 1 |
| Global radiation | Type 8101 | 0…1500 W/m2, linearity 1% | 2 | 1999 | Ph.Schenk, Wien | 1 |
| Radiation balance | Type 8110 | 0.3- >30Ym 2% accuracy | 5 | 1999 | Ph.Schenk | 2 |
| Double pyranometer | Type 8104 | 2× 0–1500 W/m2 | 3 | 2016 | Ph.Schenk | 1 |
| Heat flux sensors, | HFPO1 | −2000 … + 2000 W/m2 | 3 | 4 | Hukseflux | 1 |
Table 2.
The aggregation of the 10-second values to longer periods of time during the years of measurement. An overview of the number of accurate daily data sets is shown.
Table 2.
The aggregation of the 10-second values to longer periods of time during the years of measurement. An overview of the number of accurate daily data sets is shown.
| Years | Aggregation to | Valid Cases | Valid in % |
|---|
| 1999 | 1 h | 8374 of 8760 | 96 |
| 2000 | 15 min | 32.219 of 35040 | 98% |
| 2005–July 2018 | 15 min | 507 754 of 613200 | 83% |
Table 3.
Description statistics, (Berlin-Tempelhof (hourly values temperature n = 498747) 1951–2017.
Table 3.
Description statistics, (Berlin-Tempelhof (hourly values temperature n = 498747) 1951–2017.
| Sensor | Range | Min | Max | Mean | Std-Error | Std.Dev. | Variance Stat. |
|---|
| Air temperature in Tempelhof at 1 m in °C | 60.6 | −22.5 | 38.1 | 9.7 | 0.012 | 8.33 | 69.4 |
| Rel.-Humidity % | 80 | 20.0 | 100 | 75.1 | 0.03 | 17.3 | 300.0 |
Table 4.
Description statistics, (Trollenhagen (Troll) n = 5690 days, UAS Neubrandenburg, n = 5.624 days).
Table 4.
Description statistics, (Trollenhagen (Troll) n = 5690 days, UAS Neubrandenburg, n = 5.624 days).
| Sensor | Range | Min | Max | Mean | Std-Error | Std.Dev. | Variance Stat. |
|---|
Temp.Troll
°C | 56.8 | −21.1 | 35.7 | 9.4 | 0.021 | 7.9 | 62.7 |
rh Troll
% | 86 | 14 | 100 | 79,3 | 0.043 | 16.0 | 256.6 |
rhf- UAS
%
t1m-UAS | 78.9 | 21.0 | 99.9 | 71.8 | 0.1 | 14.1 | 197.7 |
| °C | 51.8 | −20.1 | 31.7 | 9.5 | 0.05 | 6.97 | 48.7 |
Table 5.
Descriptive statistics for further sensors UAS Neubrandenburg, 1999–2018 (all temperatures in °C).
Table 5.
Descriptive statistics for further sensors UAS Neubrandenburg, 1999–2018 (all temperatures in °C).
| Sensor | Range | Min | Max | Mean | Std-Error | Std.Dev. | Variance Stat. |
|---|
| Surface gravel | 54.5 | −19.4 | 35.1 | 9.9 | 0.6 | 7.9 | 61.0 |
| Surface green | 58.5 | −20.6 | 37.9 | 9.9 | 0.6 | 7.7 | 58.9 |
| Inside gravel | 53.9 | −15.2 | 38.6 | 11.2 | 0.1 | 9.1 | 81.5 |
| Inside green | 46.7 | −11.9 | 34.8 | 11.3 | 0.1 | 7.9 | 61.0 |
Table 6.
Pearson correlation temperatures at 1 m in contrast to the surface and inside media temperatures; significance level ** = p ≤ 0.01.
Table 6.
Pearson correlation temperatures at 1 m in contrast to the surface and inside media temperatures; significance level ** = p ≤ 0.01.
| Sensor | Pearson’s r | Covariance |
|---|
| Temp 1 m | 1 | 48.714 |
| Surface gravel | 0.987 ** | 53.859 |
| Surface green | 0.990 ** | 53.023 |
| Inside gravel | 0.962 ** | 60.623 |
| Inside green | 0.925 ** | 50.396 |
Table 7.
Urban heat island effect and trends between typical urban climate stations (Berlin-Tempelhof) and Neubrandenburg Trollenhagen in comparison to a roof station at 1m above the roof, surface temperatures of gravel and green roofs, and inside the layer of gravel and extensive green roof.
Table 7.
Urban heat island effect and trends between typical urban climate stations (Berlin-Tempelhof) and Neubrandenburg Trollenhagen in comparison to a roof station at 1m above the roof, surface temperatures of gravel and green roofs, and inside the layer of gravel and extensive green roof.
| Temperature at Location | Years [n] | Equation Y = | R2 | Range | Absolute diff. [in K] | Temp. Changes Past [20 years] |
|---|
| Air temp.Tempelhof | 65 | y = 4E − 06x + 8.71 | 0.0048 | 8.7–10.7 | 2 | 0.6 |
| Air temp. NB-Trollenhagen | 15 | Y = 8E − 07x + 9.32 | 2E−05 | 9.3–9.5 | 0.2 | 0.3 |
| Air temp. NB-Univ. 1m | 20 | Y = 4E − 0.5x + 9.15 | 0.0008 | 9.2–9.8 | 0.6 | 0.6 |
| Surface temp. Gravel | 20 | Y = 4E− 0.5x + 9.63 | 0.0005 | 9.6-10.3 | 0.7 | 0.7 |
Surface temp.
Green- | 20 | Y = 3E − 05x + 9.60 | 0.0005 | 9.6–10.3 | 0.7 | 0.7 |
Inside temp.
Gravel | 20 | Y = 7E − 05x + 10.51 | 0.0016 | 10.5–11.9 | 1.4 | 1.4 |
Inside temp.
Green | 20 | Y = −3E − 06x + 11.35 | 3E-0.6 | 11.3–11.4 | −0.1 | −0.1 |
© 2019 by the authors. Licensee MDPI, Basel, Switzerland. This article is an open access article distributed under the terms and conditions of the Creative Commons Attribution (CC BY) license (http://creativecommons.org/licenses/by/4.0/).


