Abstract
The demand for energy-efficient housing is on the rise in Egypt. The information about the individual materials used in the construction of typical residential wall assemblies are known in the literature. However, data from lab tests to validate the performance for whole composite walls are limited. Three typical wall types were constructed and tested utilizing a standard experimental evaluation procedure based on thermal convection loads. A research framework combining the validated thermal performance data from the experimental test and the simulated data was developed. The experimental tests were performed utilizing a state-of-the-art guarded hotbox apparatus and following the guidelines of the ASTM C1363-11 standard. The solar radiation load was taken into account in the calculations according to the standard, and the error estimation and uncertainty analysis for the experimental tests are reported. The results of the experimental testing are described and a recommendation of the best wall type is noted. The output of this research will help to initiate a material database of the thermal performance of typical residential wall types used in Egypt that have been validated in the lab. This will be useful for the building industry as a whole to understand the performance of the materials in composite assemblies and their impact on energy efficiency.
1. Introduction
In Egypt, there is limited information published on the thermal performance of the local brick used in building construction. For a typical wall system, standard details and materials are often used; however, variations exist according to the source of material, workmanship, and at times the design details used by architects. The variation often creates discrepancy in using simulation tools with fixed material libraries, resulting in inconsistent data; therefore, more studies are needed to develop data libraries for the purpose of validating simulation inputs in lieu of the generic values commonly loaded in material libraries. Throughout the literature, several techniques and standards have been developed for determining the thermal performance of building materials using different methods of experimental testing [1,2,3,4,5,6]. The thermal performance of a building envelope is dependent on the type and thickness of the installed insulation and a number of other factors such as thermal bridging, climate, ventilation, and workmanship [7,8,9,10,11,12]. To better understand the behavior of the skin, different types of experimental testing methods were reviewed for the purpose of understanding the testing conditions and limitations of each method [13,14,15,16,17,18]. This review is summarized in Table 1, showing a number of recent studies utilizing similar standards of measurement and similar experimental conditions, standards used, type of test specimen/module, and type of hotbox used. In this research, we utilize the guarded method and propose the use of experimental testing to analyze the performance of three wall systems commonly employed in Egypt; moreover, we propose to use the validated output to inform simulation tools in the future. A guarded method is a real-scale experiment. It consists in recreating homogeneous conditions, close to standard values in buildings, and measuring the loss through a specimen. The chamber acting as a guard for the metering box is a critical element in preventing heat losses during the experiments and assists in reaching a trusted steady-state condition. The assessment of U-values and R-values of these types of commonly built wall systems will contribute to the enhancement of future performance regarding compliance with emerging national and international energy efficiency requirements. The purpose of this research is to evaluate three commonly used “typical” residential wall systems in Egypt using experimental testing, in order to build a database of characterizations for commonly used residential wall systems.

Table 1.
Detailed description of the selected studies utilizing similar standards of measurements and similar equipment.
2. Description of Testing Apparatus
2.1. Test Rig
The test rig apparatus is composed by three chamber: cold (outdoor in a fixed position “OD”) and hot (indoor and mobile “ID”), simulating the external and internal building environment and tempering ring (this chamber is around the test specimen). The outdoor chamber and tempering ring are in a fixed position and the other chamber is mounted on castors and rails. The apparatus is calibrated according to ASTM C1363-11 (see Figure 1a). The specifications of the specimen were made per the standards and the specimen was placed in the tempering ring between the two chambers. The two chambers had an indirect system of thermoregulation with a rate of 0.2 °C/min and an accuracy of ±0.2 °C. The purpose of the tempering ring was to minimize the heat flux surrounding the perimeter of the sample. A wall frame for lab testing was built for the different types of wall samples (see Figure 1b). The warm and cold sides were equipped with a total of 58 surface temperature sensors “thermocouples” that were placed to measure the thermal performance of the specimen following the standard heat transfer equations for a steady-state condition (see Figure 2). The power of the fan and the heater of the metering box on the warm side were logged by the programmable logic controller (PLC) operating the test rig. This method was used in the determination of the steady-state thermal transmittance (U-value) and, accordingly, the thermal resistance (R) [1]. This method has a number of advantages as the specimen scale allows for better understanding of the skin on a large-scale sample. A considerable number of data points through the thermocouples were used for data acquisition. The thermocouples were used for better addressing and monitoring issues that are difficult to account for quantitatively, such as the precise measurement of the impact of thermal bridging, and changes in material not addressed in the typical simulation programs. This method allows for believability of the results using the actual materials used in construction in the location or region of the test. The disadvantages in dealing with the large-scale sample size include safety, cost, and constructability issues. The method requires experience in data interpretation and knowledge about heat transfer, flanking loss estimation [19,20], and calibration of the chamber on a uniform basis to make sure that the results are believable. The thermocouples were made of Omega Type J, which is a commonly used thermocouple for this application. This type of thermocouple features a smaller temperature range and a shorter lifespan at higher temperatures as compared tp other types. The thermocouple grade wire was −346 to 1400 F (−210 to 760 °C), and the extension wire was 32 to 392 F (0 to 200 °C). The thermocouples were placed according to the ASTM guidelines, which require that a minimum of five differential thermocouple pairs per m2 of metering box wall area be used. Accordingly, the thermocouples were spaced uniformly and symmetrically over the surface. Seventeen thermocouples were placed in the measuring area and four were placed on the surround panel. The sensors were utilized to understand when the wall reached the steady-state temperature and to better our understanding of the thermal performance of the wall during the test.
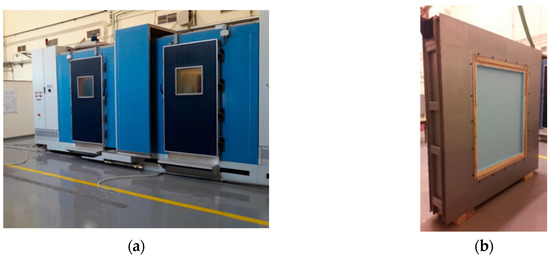
Figure 1.
Test rig apparatus and specimen: (a) test rig; (b) testing frame.
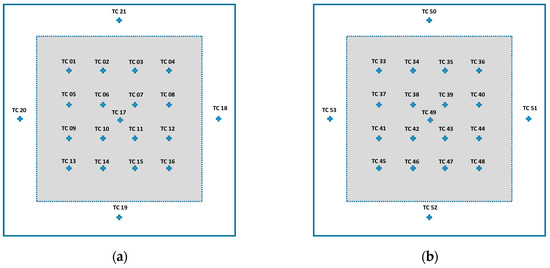
Figure 2.
Metered area of the test specimen: (a) warm side (ID); (b) cold side (OD).
2.2. Experimental Design
The test was performed on three wall systems with lengths of 149 cm × 124 cm and thicknesses as follows:
- (i)
- Plaster (2.5 cm) + Brick (20 cm) + Extruded polystyrene insulation (5 cm) + Plaster (2.5 cm) + Gypsum Wall Board (GWB) and Paint (1.3 cm) (noted as Wall System 1);
- (ii)
- Plaster (2.5 cm) + Brick (20 cm) + Plaster (2.5 cm) (noted as Wall System 2);
- (iii)
- Plaster (2.5 cm) + Brick (10 cm) + Plaster (2.5 cm) (noted as Wall System 3).
An uncertainty analysis was performed in order to accurately assess the span of error associated with the calculated output parameters from the experimental data. Different heat transfer quantities, such as heat transfer coefficients and resistances, were calculated based on the experimental measurements of basic quantities. The U-values as a function of different wall structures were investigated. All building constructions are external-load dominated. Solar radiation loads were superimposed on convection loads in order to calculate the net heat passing through the wall. Figure 3a–c show the structure of different walls tested in the laboratory with notations of warm-side and cold-side environmental temperatures.
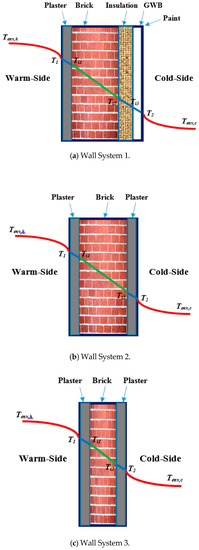
Figure 3.
Typical wall systems used in Egypt residential construction: (a) Wall System 1, (b) Wall System 2, and (c) Wall System 3.
The design of the experiment was based on acquiring measured data with time stamps, processing the data, and performing calculations to obtain key performance parameters. Steady-state values were obtained after the settling of dynamic characteristics of all parameters. These steady-state values were used to obtain final values. The sampling interval was 25 seconds as per the data acquisition device used. Controllable input factors were heater and fan powers of the metering box, as well as indoor (ID), outdoor (OD), and metering box temperatures. Response variables were surface temperatures of the tested specimens on both hot and cold sides. The expected test duration from start to finish (steady-state conditions) could reach 24 h or more until the temperature difference between the cold and warm side was almost constant and, in turn, Q was steady, including transient variations.
3. Research Framework
Figure 4 shows the block diagram of the present research framework in terms of sampling, calibration, testing, and analysis steps under each process. The sampling is comprised of the characterization of the designed panel, specimen construction, and preparation. The calibration part is comprised of the assembly of the materials matrix and the required tests for performing the calibration. The testing part is comprised of the application determination, the setup of the testing conditions, and the setup of the data acquisition. Finally, the analytical part is comprised of the 2D/3D analysis, uncertainty analysis, and output data generation.
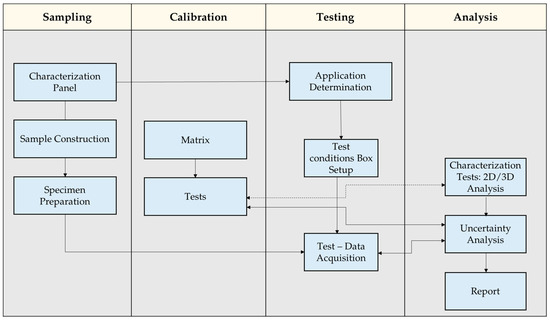
Figure 4.
Block diagram of the research framework of the study.
4. Uncertainty Analysis
The instruments used in the experimental test-rig were calibrated by manufacturers before the installation. Calibration certificates, manufacturer specifications, and datasheets of the measurement equipment were used to determine the measurement error associated with each equipment. Table 2 introduces the full-range uncertainty of the measurement equipment used in the experiments. The evaluations of uncertainty in a calculated parameter based on experimental measurements of individual quantities is based on the law of uncertainty propagation [21], given below:
where is the total uncertainty in the calculated value of the function based on individual uncertainties of independent parameters that are included in its calculation (,,…,). For instance, the uncertainty of the calculated value of the net heat gain through the tested wall (Q), based on measured independent parameters, is:
denoting that the calculated value of the net heat gain is a function of the heater power (Qh) and the fan power (Qf), which are individual functions of the measured voltage and current.
Table 2.
Full-range uncertainties in measurement equipment used.
5. Experimental Models and Calculations
In order to calculate the heat transfer quantities, the steady-state net heat flow rate (Q) across the wall thickness needs to be calculated using the following relation, according to the ASTM C1363-11 standard:
where
- Qh—heat power generated from the heater, W;
- Qf—fan input power, W;
- Qmw—metering box wall heat loss, W;
- Qf—flanking heat loss, W.
For the guarded hotbox apparatus, the heat flow through the metering box wall is zero. The flanking loss is assumed to be 10% of the net heat flow rate through the test specimen.
Accurate evaluation of the flanking loss value requires advanced simulation techniques such as CFD (computational fluid dynamics). In the present study, the assumption of the flanking loss value considers practical parameters such as improper fitting between the testing frame holding the test specimen and the guarded hot box apparatus wall. The thermal transmittance () is calculated using the following relation:
where
- Tenv,h—set point environmental warm side (ID), °C;
- Tenv,c—set point environmental cold side (OD), °C;
- A—specimen metered area, m2.
The hot and cold surface heat transfer coefficients (hh and hc) are respectively calculated as:
where
- T1—area weighted average temperature of the wall hot surface, °C;
- T2—area weighted average temperature of the wall cold surface, °C.
The thermal conductance (C) is calculated from:
The thermal resistances (Ru, R, Rh, and Rc) are respectively calculated as:
6. Results and Discussion
The calculated values of wall heat transfer properties are based on the environmental temperatures (hot and cold sides), the measured average temperature between hot and cold surfaces, as well as the net heat flow through the wall. The testing for each wall structure was implemented over a range of working temperatures—27 to 50 °C for outdoor (hot) temperature and 19 to 28 °C for indoor (cold) temperature. Note the variation of the U-value, which is the thermal transmittance (measured in W/(m2 K)) described as the rate of transfer of heat through each of the three composite wall systems divided by the difference in temperature. The better-insulated a structure is, the lower the U-value will be. The average U-values of Wall Systems 1, 2, and 3 were 3.48, 3.80, and 5.30, respectively, indicating that the best performing was Wall System 1. The detailed results are listed as follows.
6.1. Wall System 1
Table 3 shows the results for Wall System 1. As shown in Figure 3a, the wall was composed of a plaster layer of 2.5 cm, a brick layer of 20 cm, an extruded polystyrene (XPS) foam insulation layer of 5 cm, a GWB layer of 1.25 cm, and a layer of spackle and paint of 3 mm. Different heat transfer quantities were calculated for different testing days.
Table 3.
Heat transfer quantities for Wall System 1.
Figure 5, Figure 6 and Figure 7 show the dynamic characteristics of different system parameters during Test 1. Input controllable parameters (metering box heater and fan powers) are recorded in Figure 5.
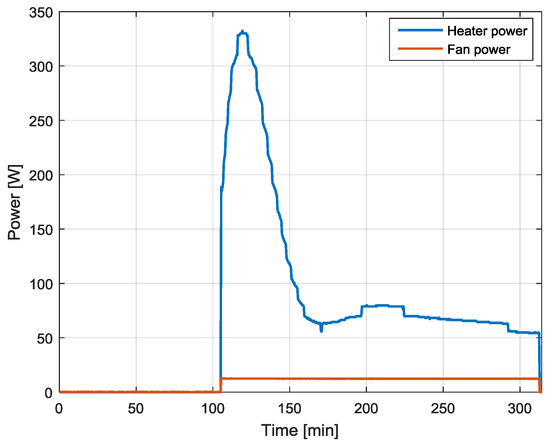
Figure 5.
Variation of heater and fan power with time during Test 1.
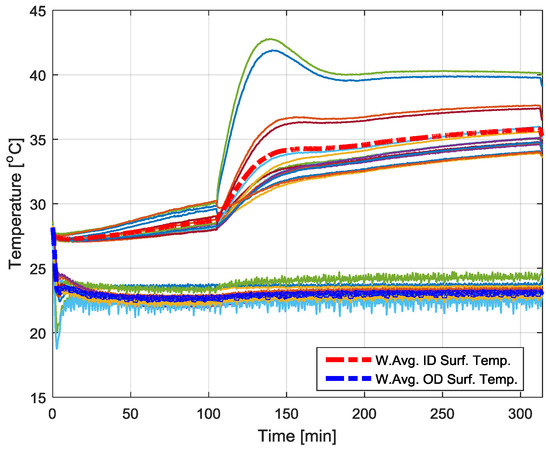
Figure 6.
Variation of specimen surface temperature with time during Test 1.
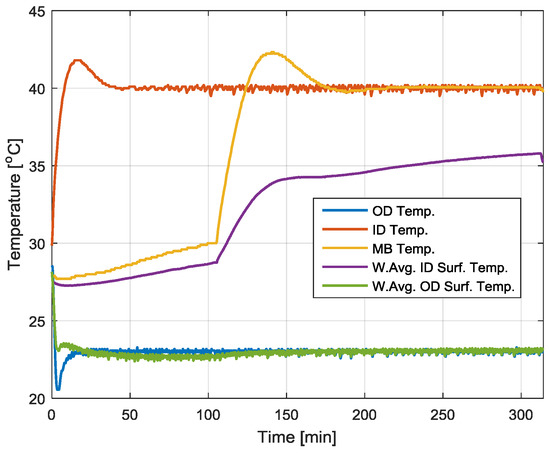
Figure 7.
Variation of ID, OD, and MB temperatures with time during Test 1.
The overshoot in heater power during the transient control behavior resulted a steady increase in specimen surface temperatures as well as in ID, OD, and metering box (MB) temperatures (Figure 6 and Figure 7). The fan power remained constant to stabilize output results. Fan power had a single setting while heater power varied more smoothly according to electrical current and voltage resolutions. In Figure 6, variations of specimen surface temperatures (ID and OD sides) experience quasi steady-state setting after about 200 minutes from the start of the test. Figure 7 summarizes variations of area-weighted average specimen surface temperatures as well as metering box and environmental ID and OD temperatures. Figure 8 shows the variation of thermal transmittance of Wall System 1 as a function of the average operating temperature within the wall, generated from various test runs. A decreasing U-value was noted with an average value of 3.5 W/m2 K. The generated values include the calculated experimental uncertainty.
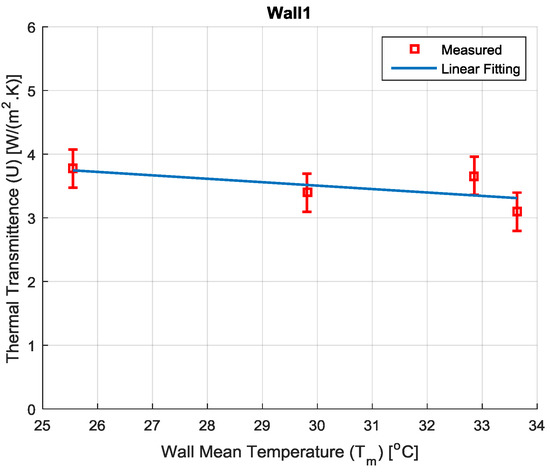
Figure 8.
Thermal transmittance of Wall System 1 as a function of the wall mean temperature.
6.2. Wall System 2
Table 4 shows the results for Wall System 2. As shown in Figure 3b, the wall was composed of a plaster layer of 2.5 cm, a brick layer of 20 cm, and a layer of plaster of 2 cm. Different heat transfer quantities were calculated for different testing days. Figure 9 shows the variation of thermal transmittance of Wall System 2 as a function of the average operating temperature within the wall, generated from various test runs. The changes in the U-value measurements were noted with an average value of around 4.0 W/m2 K.
Table 4.
Heat transfer quantities for Wall System 2.
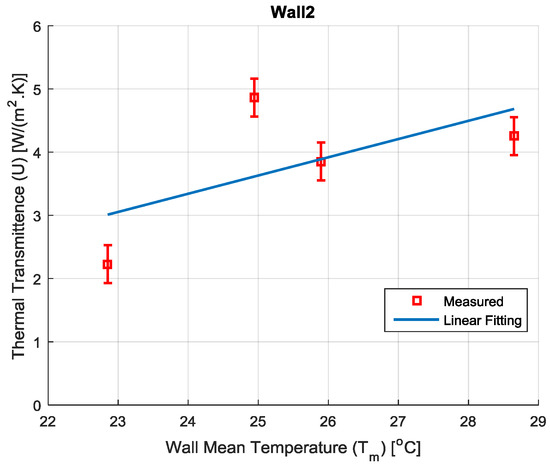
Figure 9.
Thermal transmittance of Wall System 2 as a function of the wall mean temperature.
6.3. Wall System 3
Table 5 shows the results for Wall System 3. As shown in Figure 3c, the wall was composed of a plaster layer of 2.5 cm, a brick layer of 10 cm, and a layer of plaster of 2 cm. Different heat transfer quantities were calculated for different testing days. Figure 10 shows the variation of thermal transmittance of Wall System 3 as a function of the average operating temperature within the wall, generated from various test runs. A decrease in the U-value measurement was noted with an average value of around 5.5 W/m2 K.
Table 5.
Heat transfer quantities for Wall System 3.
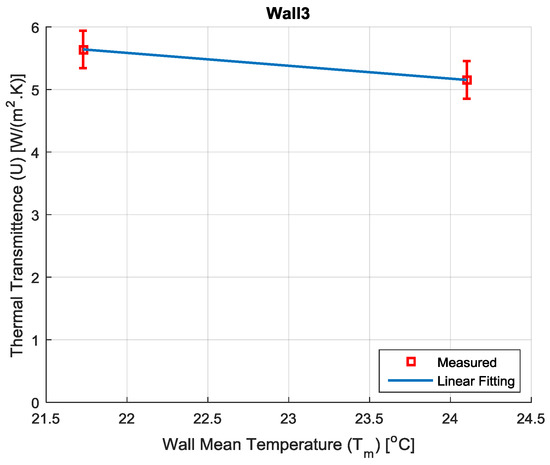
Figure 10.
Thermal transmittance of Wall System 3 as a function of the wall mean temperature.
The total calculated uncertainty of the U-value was around ±0.3 W/m2 K, which represents a maximum of 5% of the results.
7. Conclusions
This research used a comparative approach to compare three wall modules under similar climatic testing conditions, materials, and workmanship, in contrast to the single wall test approach used in previous studies. In addition, limited studies exist for the wall typologies for the climatic zone and location where this research was performed. A thermal performance database of composite wall types is the focus of this study. Table 1 shows the previous studies utilizing the same equipment, standards, and scope of work. The ASTM C1363 standard, a guarded testing equipment, and wall modules were utilized by our research team for the same purpose. Three wall systems, built and tested in the laboratory, and the thermal transmittance of each wall system were calculated for various conditions with different mean wall temperatures. Different heat transfer quantities were evaluated for each wall system as well. An uncertainty analysis for the error of the calculated quantities was performed based on measured values of basic quantities. In addition, the convective heat transfer loads and the solar radiation load were utilized to reveal the energy performance of each wall system, based on experimental data from a meteorological and solar measurement station. Using the experimental testing validated procedure, the thermal performance of each wall system was presented and explained. The experimentally evaluated heat transfer quantities of different wall systems, most importantly the overall heat transfer coefficient, were found to be variable from one wall system to the other, as expected and noted typically by simulation tools.
Wall System 3 is the most common wall type used in Egypt as the envelope of residential dwellings not conforming to the local code. Wall System 2 is the typical wall used in conformance with the building code. Wall System 1 is typically used in conformance with code and in affordable residential typologies. The results of experimental testing showed that the annual heat energy gained in Wall System 3 was the best, with the lowest U-value and accordingly the least heat gain. The significance of using the U-value as a performance indicator of thermal performance is mentioned in the literature, especially when it comes to in situ lab measurements of large-scale samples. While the method used in this paper followed common practice, the challenge caused by the variation in local heat flow over the wall surface should be handled with care so as not to affect the data. Therefore, it is necessary to use a specific method (i.e., a thermal imaging device) to ensure that the heat flow sensor is placed on the wall in a region of uniform heat flux. The usefulness of the U-value measurement therefore depends very much on the skill and experience of the operator in both setting up the measurement and in interpreting the results.
The impact of the vertical insulation clearly is visible in Wall System 1 in comparison to Wall System 2, “the code compliant wall”, and Wall System 3, “the commonly used wall in the market.” The value of the method proposed is that it advances beyond the current practice of using generic values in material libraries; instead, it allows builders to use custom values for actual wall systems used on location. The evaluation of composite walls’ thermal performance in this paper is unique as it provides performance data that cannot be achieved using manual calculations or by simulation tools. Specifically, it includes the workmanship factors, actual building materials, and large-scale sample measurements, thus reducing the error caused by making assumptions. Thermal performance data obtained from field tests for actual wall types with imperfections in workmanship and local brick types would be more valuable in informing simulation tools in lieu of generic material libraries that are typically loaded into simulation tools.
We recommend the formation of wall type performance data hubs local to the region or country in order to reflect the “actual” building level design and construction industry methods. The preceding lab work and discussion raise three questions: How valid are the results based on generic material libraries found in the typical simulation tools? Are the local material characteristics and imperfections and the level of workmanship factored into the analytical process of any given wall system? To what extent can we generalize from the literature? We believe that a much-needed assessment of the typical simulation-based methods through experimental testing and validation is warranted, to support better research methods and to allow designers and building science researchers to use market-specific thermal properties for the materials employed in lieu of standard material libraries.
Author Contributions
K.T. and A.A. contributed equally for the authorship of the work.
Funding
This research received no external funding.
Acknowledgments
We acknowledge the support given by the technicial help received to construct and validate the operation of the environmental chamber as well as the support given by the Department of Architecture at the American University in Cairo for to utilize the Building Sciences Lab (BSL) for this research.
Conflicts of Interest
The authors declare no conflict of interest.
References
- ASTM. C1363-11, Standard Test Method for Thermal Performance of Building Materials and Envelope Assemblies by Means of a Hot Box Apparatus; ASTM International: West Conshohocken, PA, USA, 2011; Available online: http://www.astm.org (accessed on 1 November 2018).
- Mumaw, J. Calibrated hot box: An effective means for measuring thermal conductance in large wall sections. In Heat Transmission Measurements in Thermal Insulations; ASTM International STP 544: Philadelphia, PA, USA, 1974. [Google Scholar]
- Perrine, E.L.; Linehan, P.W.; Howanski, J.W.; Shu, L.S. The Design and Construction of a Calibrated/Guarded Hot Box Facility. In Thermal Performance of the Exterior Envelopes of Buildings; ASHRAE SP28; American Society of Heating, Refrigerating, and Air-Conditioning Engineers, Inc.: New York, NY, USA, 1981; pp. 299–307. [Google Scholar]
- Achenbach, P.R. Design of a calibrated hot-box for measuring the heat, air, and moisture transfer of composite building walls. In Thermal Performance of the Exterior Envelopes of Buildings; ASHRAE SP28; American Society of Heating, Refrigerating, and Air-Conditioning Engineers, Inc.: New York, NY, USA, 1981; pp. 308–319. [Google Scholar]
- Miller, R.G.; Goss, W.P. Hot Box Instrumentation, Calibration and Error Estimation—A Survey, in Insulation Materials: Testing and Applications, 2nd ed.; ASTM International: Philadelphia, PA, USA, 1991. [Google Scholar]
- Giovanardi, A.; Baldracchi, P.; Lollini, R. A new test rig for the assessment of building envelope components integrating solar active systems. In Proceedings of the Eurosun-International Conference on Solar Heating, Cooling and Buildings, Graz, Austria, 28 September–1 October 2010. [Google Scholar] [CrossRef]
- Ghazi Wakili, K.; Tanner, C. U-value of a dried wall made of perforated porous clay bricks: Hot box measurement versus numerical analysis. Energy Build. 2003, 35, 675–680. [Google Scholar] [CrossRef]
- Asdrubali, F.; Baldinelli, G. Thermal transmittance measurements with the hot box method: Calibration, experimental procedures, and uncertainty analyses of three different approaches. Energy Build. 2011, 43, 1618–1626. [Google Scholar] [CrossRef]
- Luo, C.; Moghtaderi, B.; Hands, S.; Page, A. Determining the thermal capacitance, conductivity and the convective heat transfer coefficient of a brick wall by annually monitored temperatures and total heat fluxes. Energy Build. 2011, 43, 379–385. [Google Scholar] [CrossRef]
- Martin, K.; Erkorekab, A.; Floresb, I.; Odriozolaa, M.; Sala, J.M. Problems in the calculation of thermal bridges in dynamic conditions. Energy Build. 2011, 43, 529–535. [Google Scholar] [CrossRef]
- Saber, H. Investigation of thermal performance of reflective insulations for different applications. Build. Environ. 2012, 52, 32–44. [Google Scholar] [CrossRef]
- Martin, K.; Campos-Celador, A.; Escudero, C.; Gómez, I.; Sala, J.M. Analysis of a thermal bridge in a guarded hot box testing facility. Energy Build. 2012, 50, 139–149. [Google Scholar] [CrossRef]
- Bales, E.; Bass, L.B. Thermal Performance of the Exterior Envelopes of Buildings: Proceedings; American Society of Heating, Refrigerating and Air-Conditioning Engineers, Inc.: New York, NY, USA; USDOE Assistant Secretary for Conservation and Solar Energy: Washington, DC, USA; Office of Buildings and Community Systems: Denton, MD, USA, 1981.
- Sala, J.; Urresti, A.; Martín, K.; Flores, I.; Apaolaza, A. Static and dynamic thermal characterization of a hollow brick wall: Tests and numerical analysis. Energy Build. 2008, 40, 1513–1520. [Google Scholar] [CrossRef]
- Vivancos, J.L.; Soto, J.; Perez, I.; Ros-Lis, J.V.; Martínez-Máñez, R. A new model based on experimental results for the thermal characterization of bricks. Build. Environ. 2009, 44, 1047–1052. [Google Scholar] [CrossRef]
- Martin, K.; Flores, I.; Escudero, C.; Apaolaza, A.; Sala, J.M. Methodology for the calculation of response factors through experimental tests and validation with simulation. Energy Build. 2010, 42, 461–467. [Google Scholar] [CrossRef]
- Chen, F.; Wittkopf, S.K. Summer condition thermal transmittance measurement of fenestration systems using calorimetric hot box. Energy Build. 2012, 53, 47–56. [Google Scholar] [CrossRef]
- Ferrari, S.; Zanotto, V. The thermal performance of walls under actual service conditions: Evaluating the results of climatic chamber tests. Constr. Build. Mater. 2013, 43, 309–316. [Google Scholar] [CrossRef]
- Lavine, A.; Rucker, J.; Wilkes, K. Flanking loss calibration for a calibrated hot box. In Thermal Insulation, Materials, and Systems for Energy Conservation in the’80s; ASTM International: Philadelphia, PA, USA, 1983. [Google Scholar]
- Tarabieh, K.; Aboulmagd, A. A Comparative Evaluation for Three Residential Wall Insulation Systems in a Hot-Arid Climate Using Simulation Tools and Experimental Testing; AEI: Oklahoma City, Ok, USA, 2017; pp. 204–224. [Google Scholar] [CrossRef]
- ISO/IEC Guide 98:1995. Guide to the Expression of Uncertainty in Measurement; ISO: Geneva, Switzerland, 1995. [Google Scholar]
© 2019 by the authors. Licensee MDPI, Basel, Switzerland. This article is an open access article distributed under the terms and conditions of the Creative Commons Attribution (CC BY) license (http://creativecommons.org/licenses/by/4.0/).