Structural Performance of uPVC Confined Concrete Equivalent Cylinders Under Axial Compression Loads


Abstract
1. Introduction
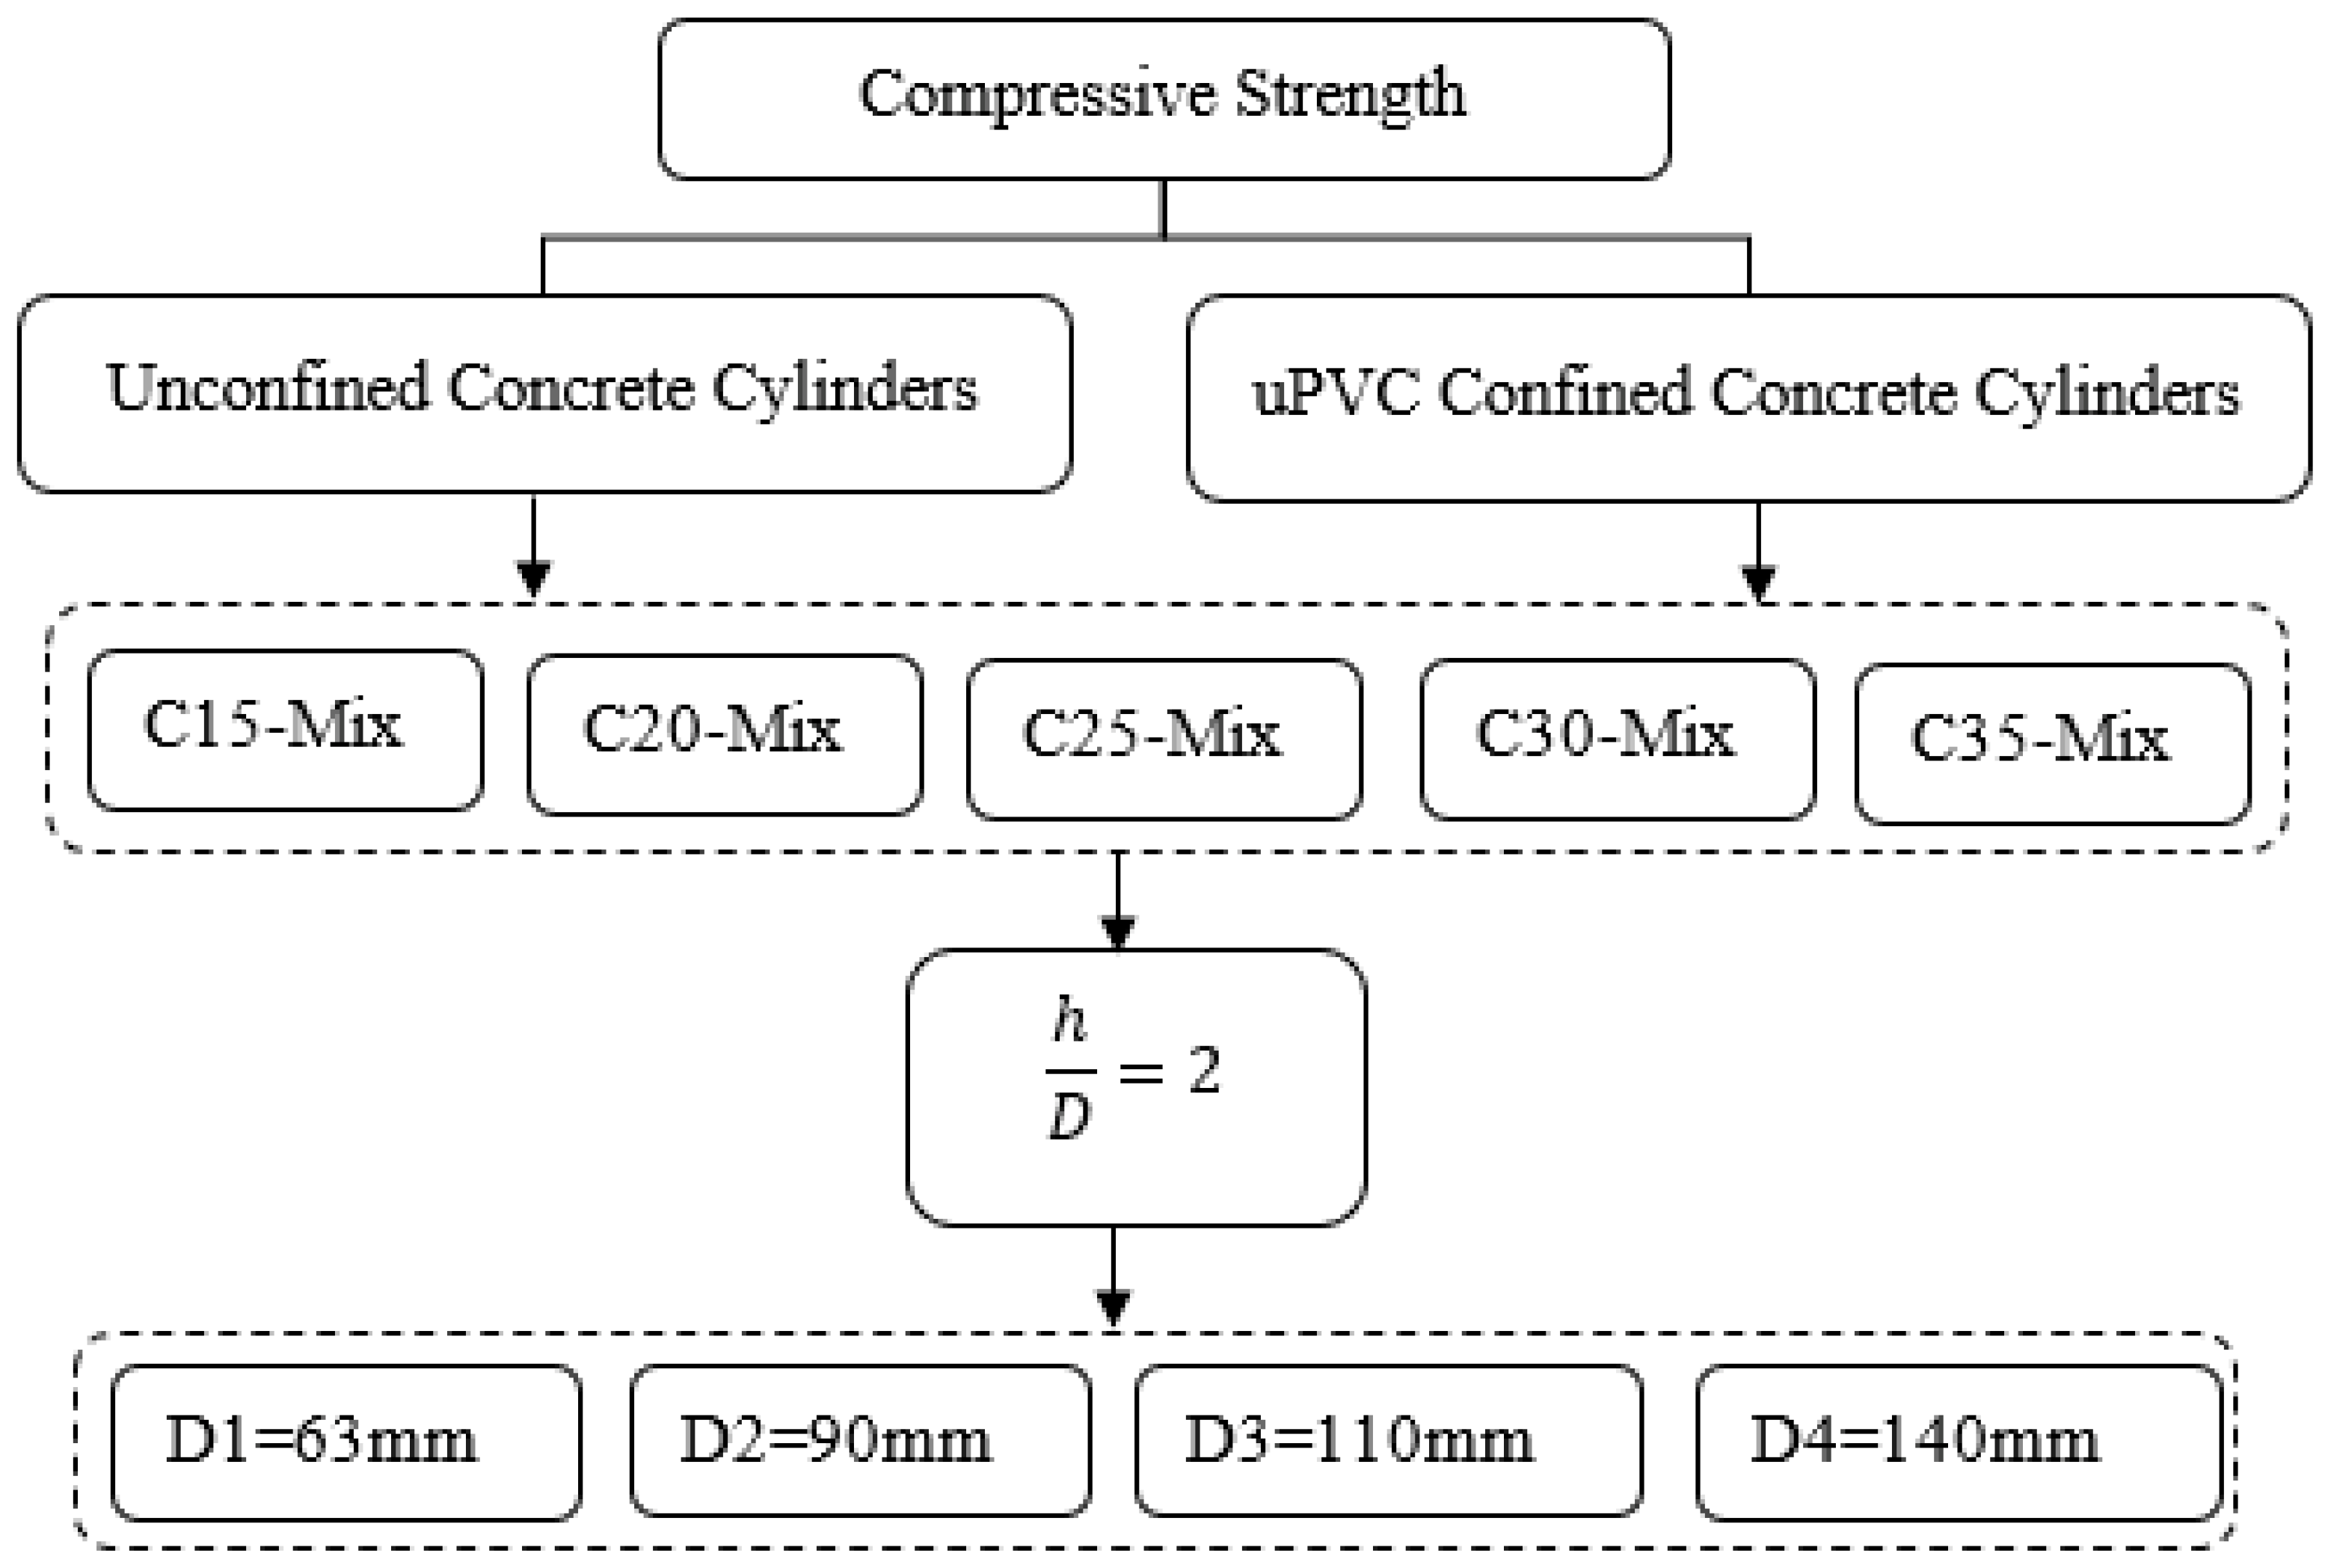
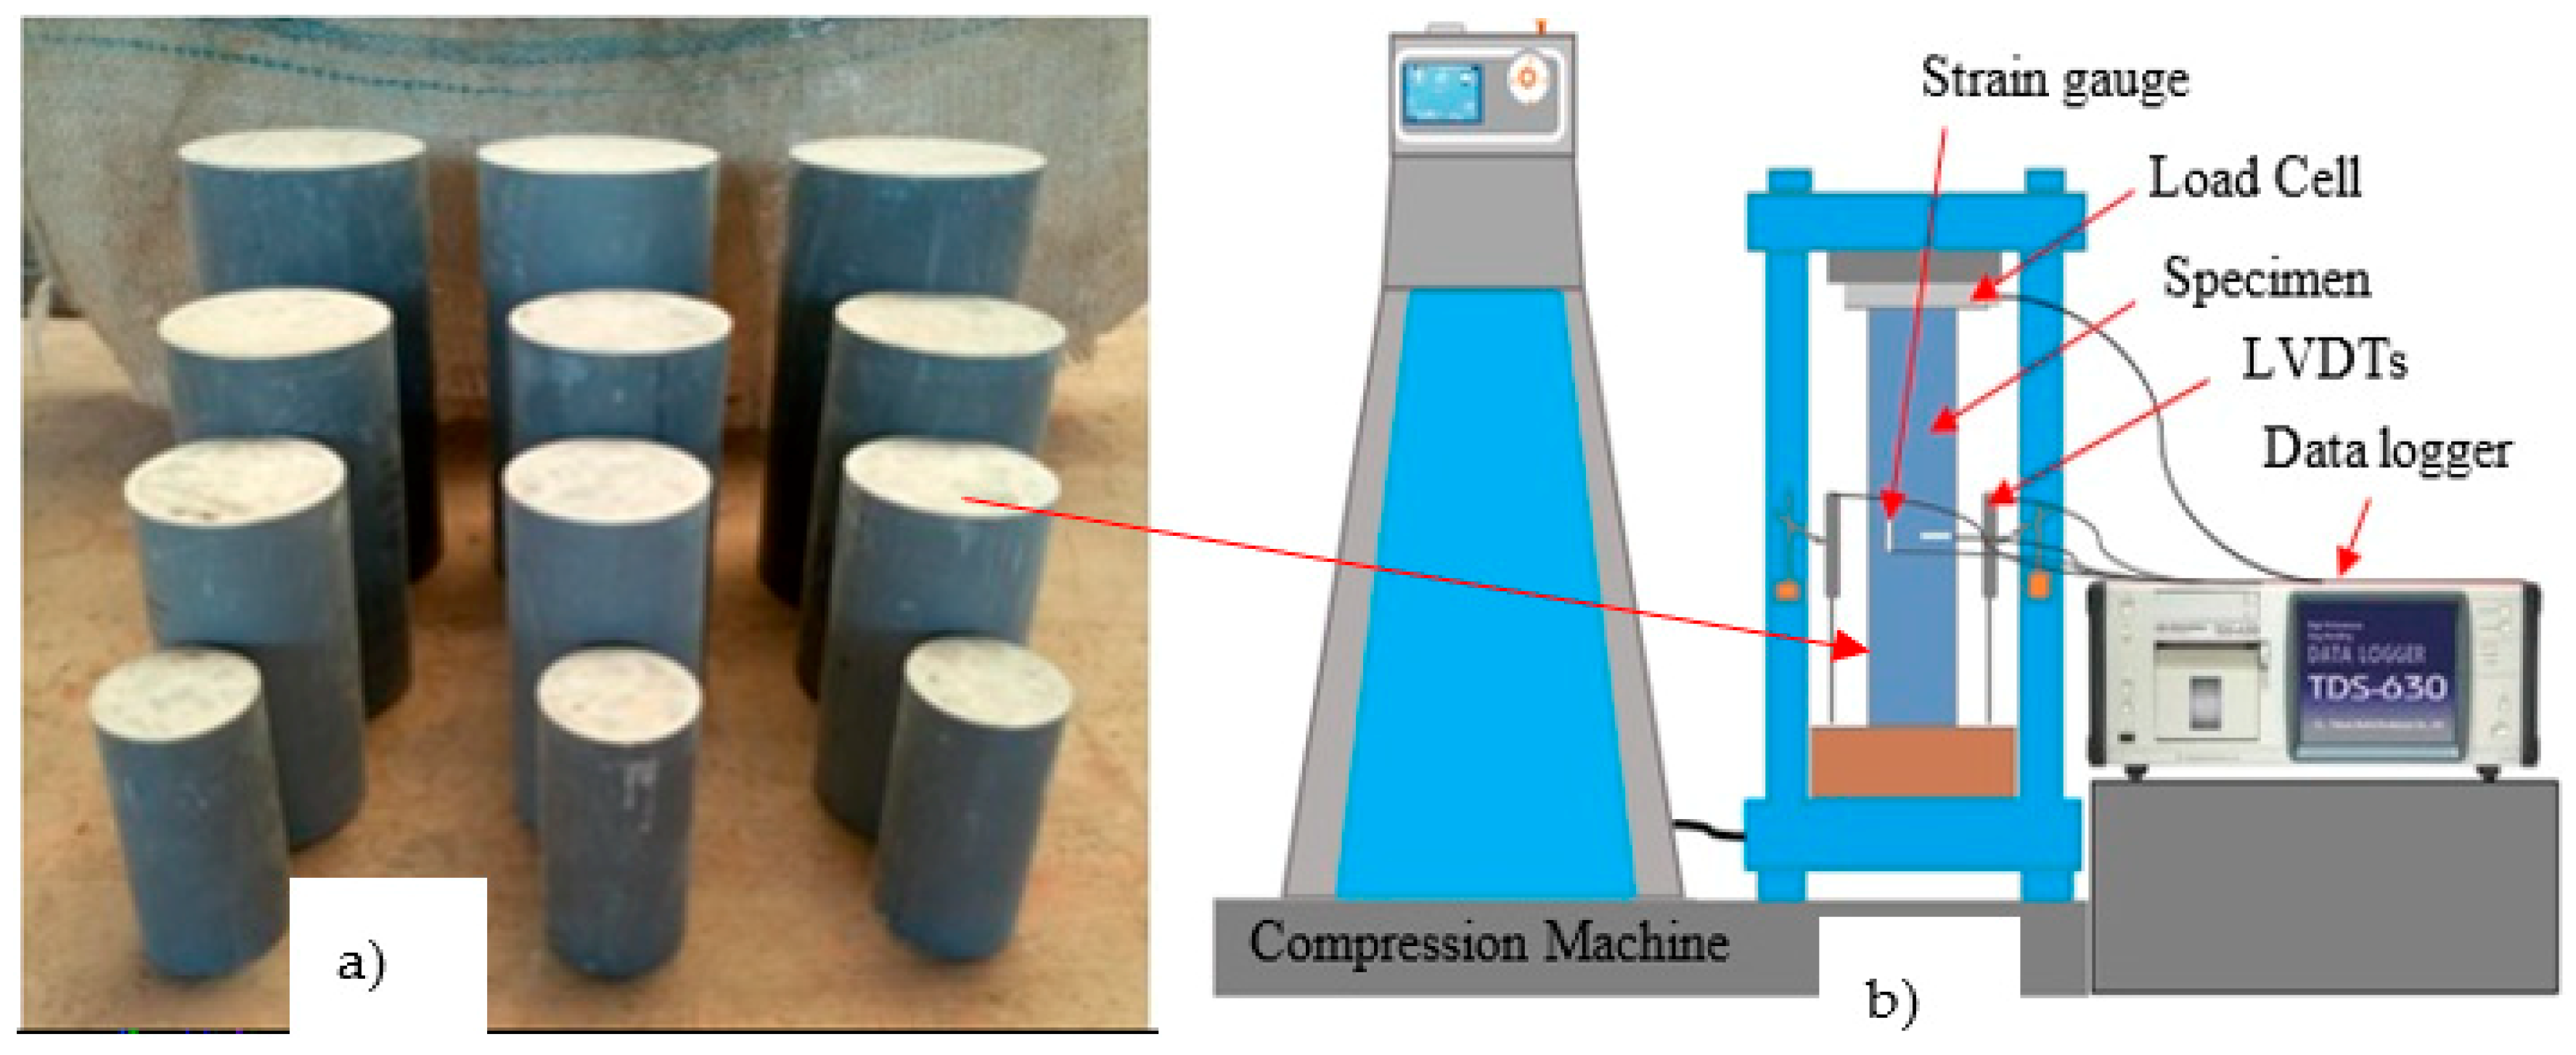
2. Experimental Program
2.1. Materials
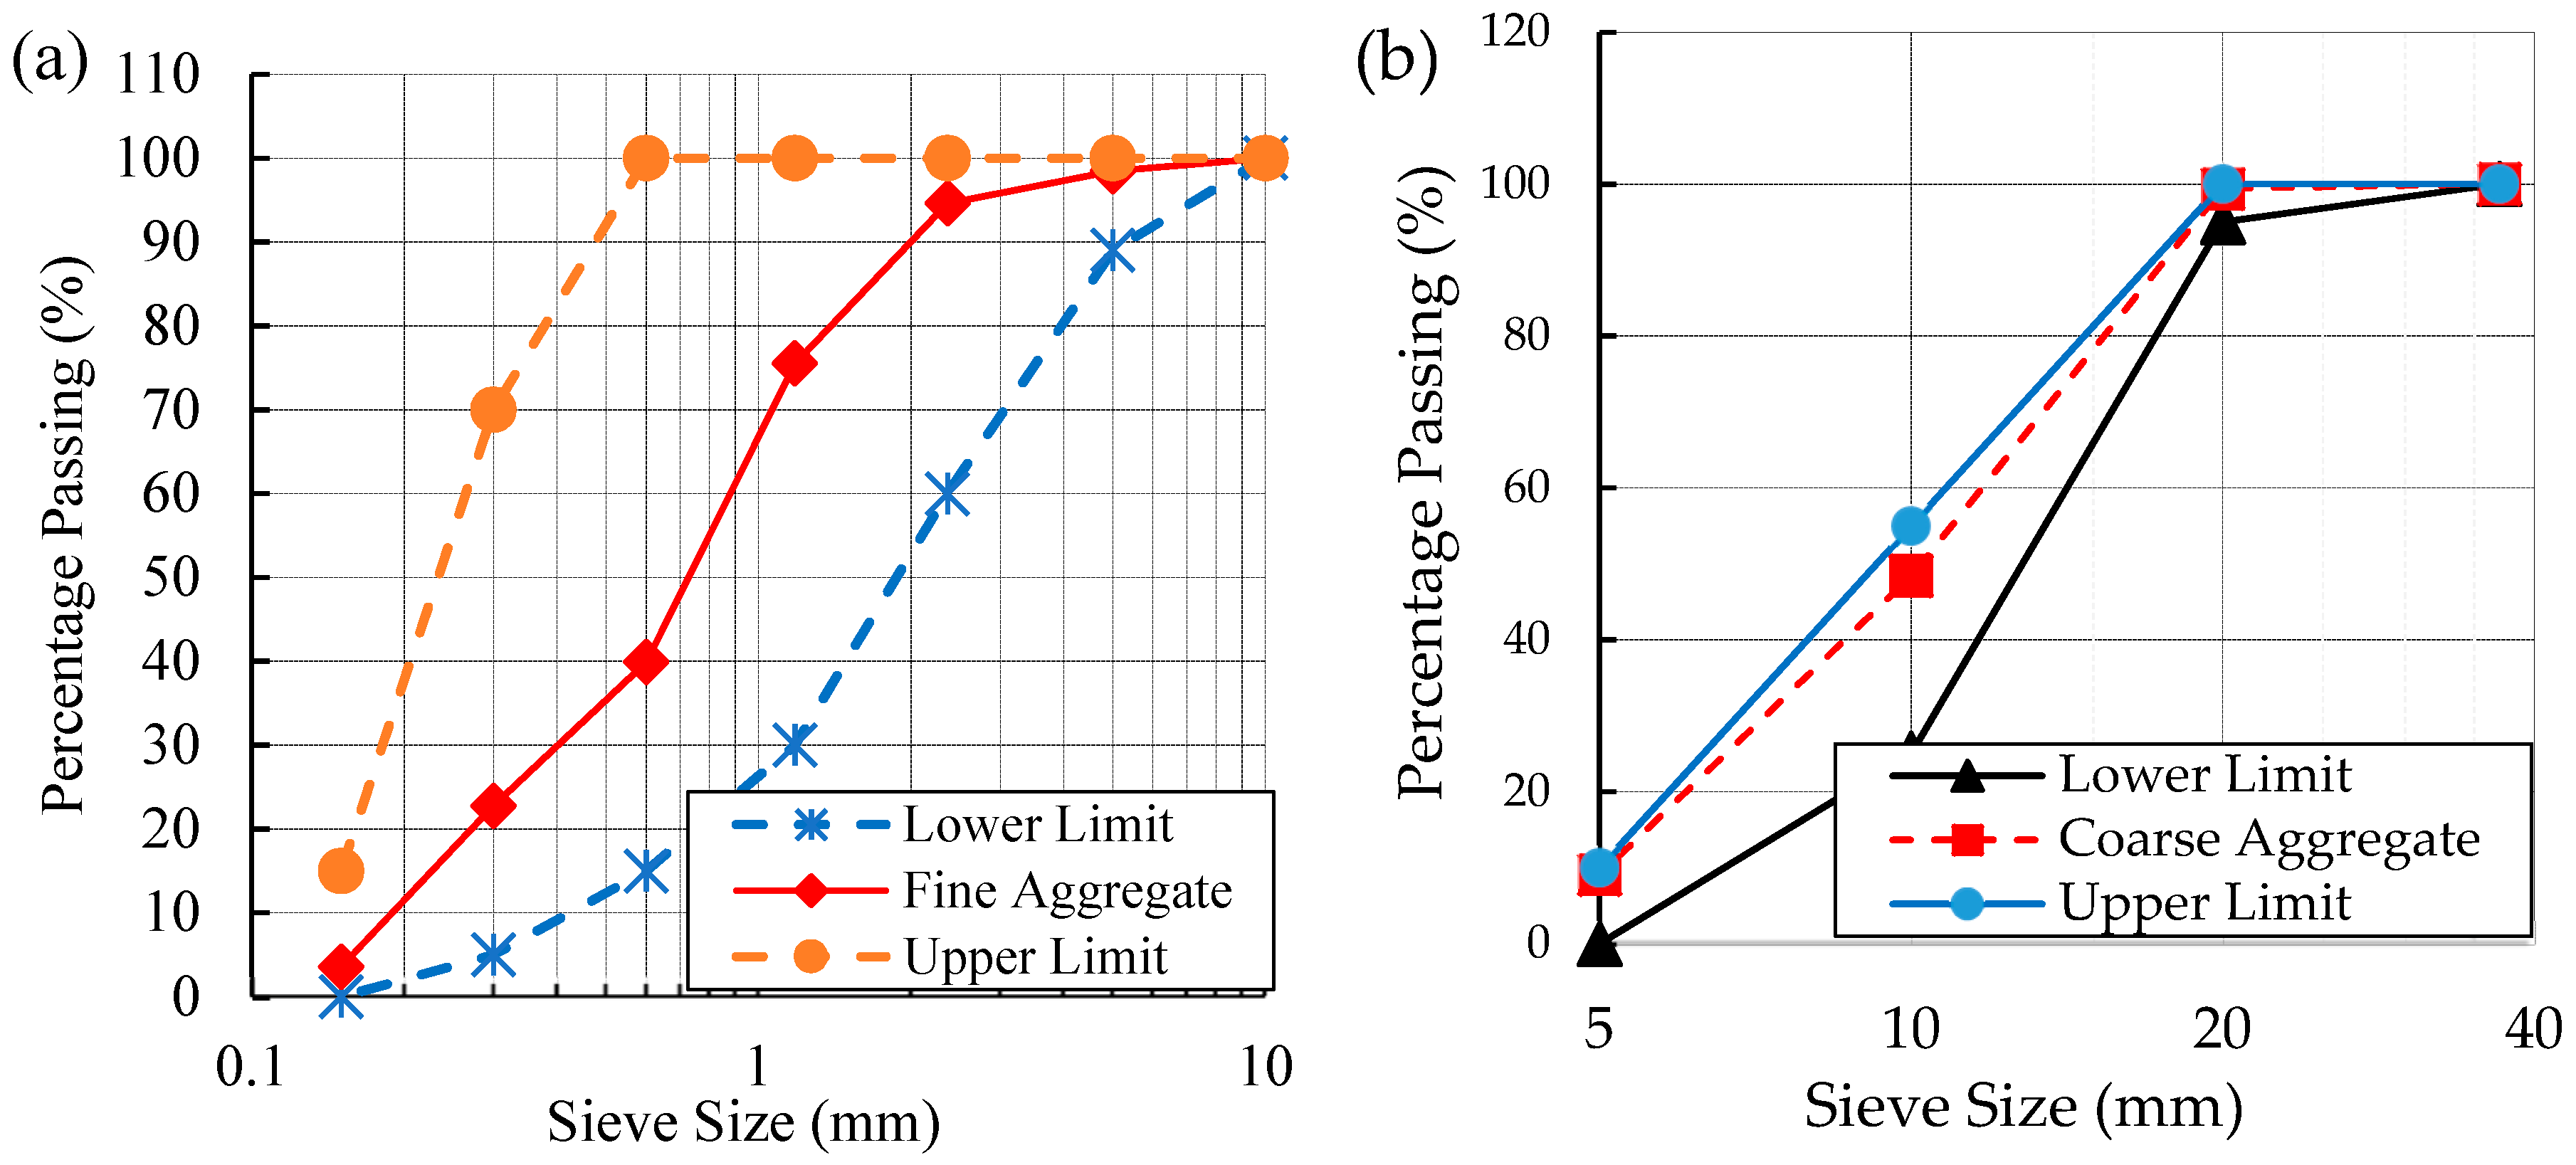
2.1.1. Aggregate
2.1.2. Cement
2.1.3. Concrete Mix Design
2.1.4. Fresh Properties of Concrete
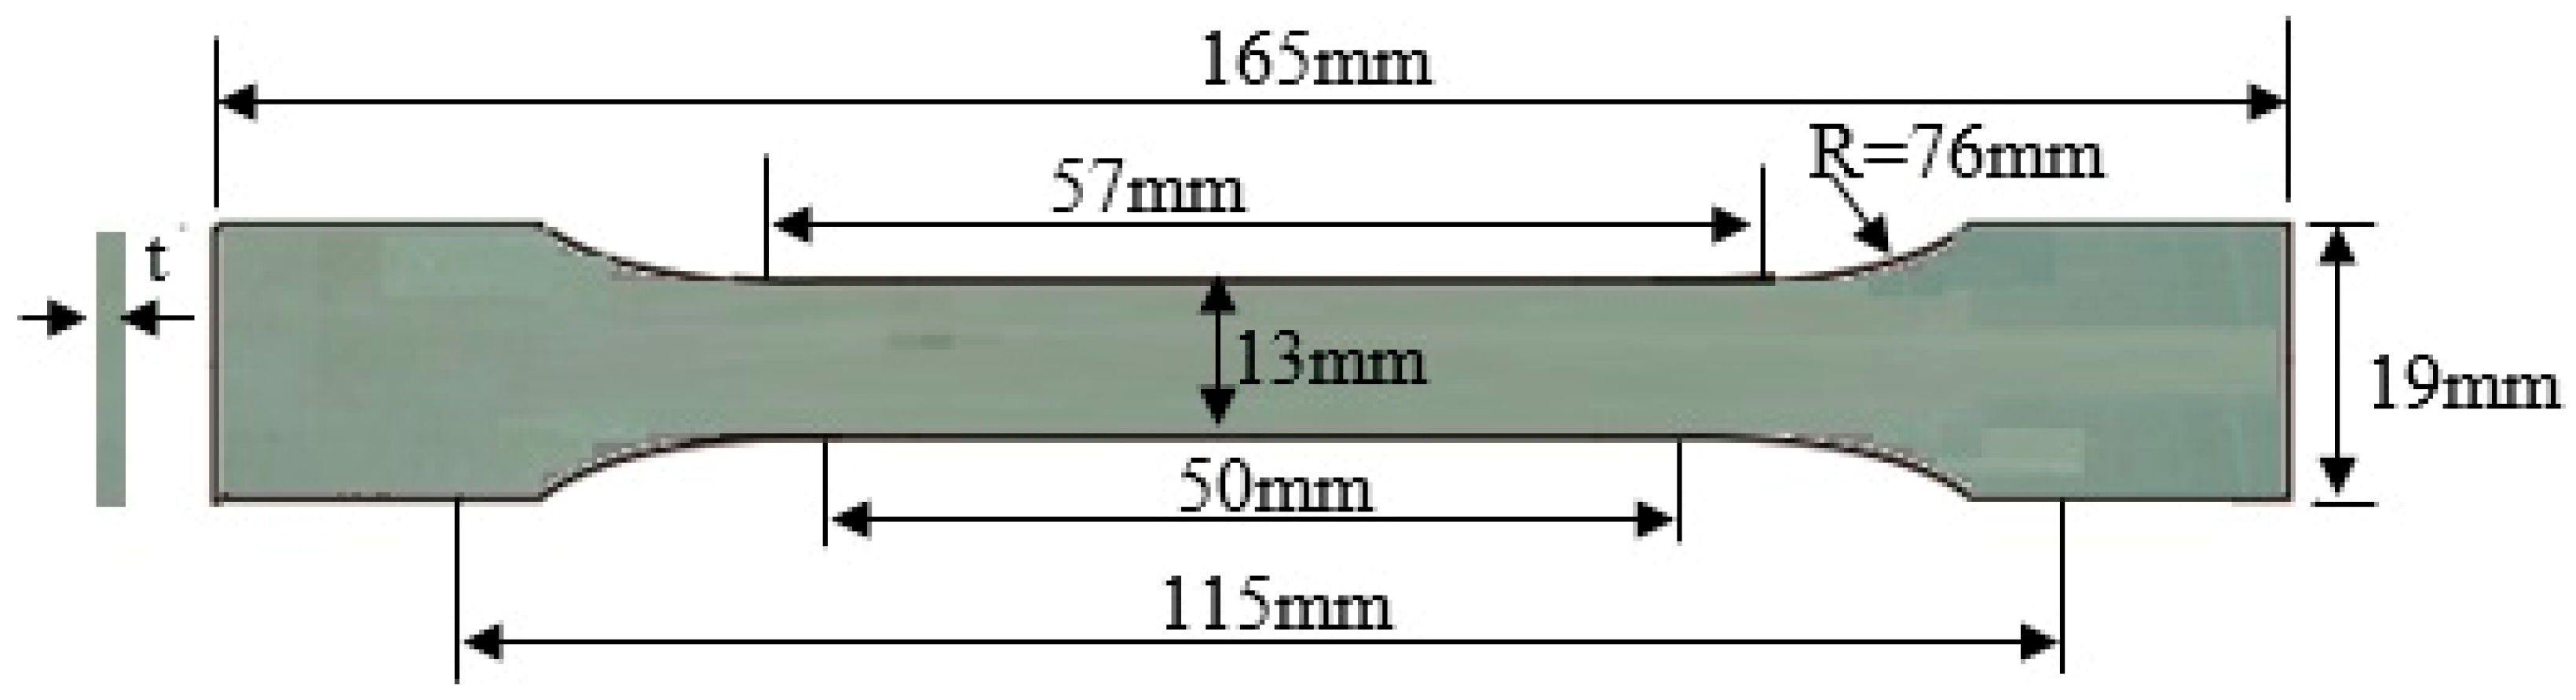
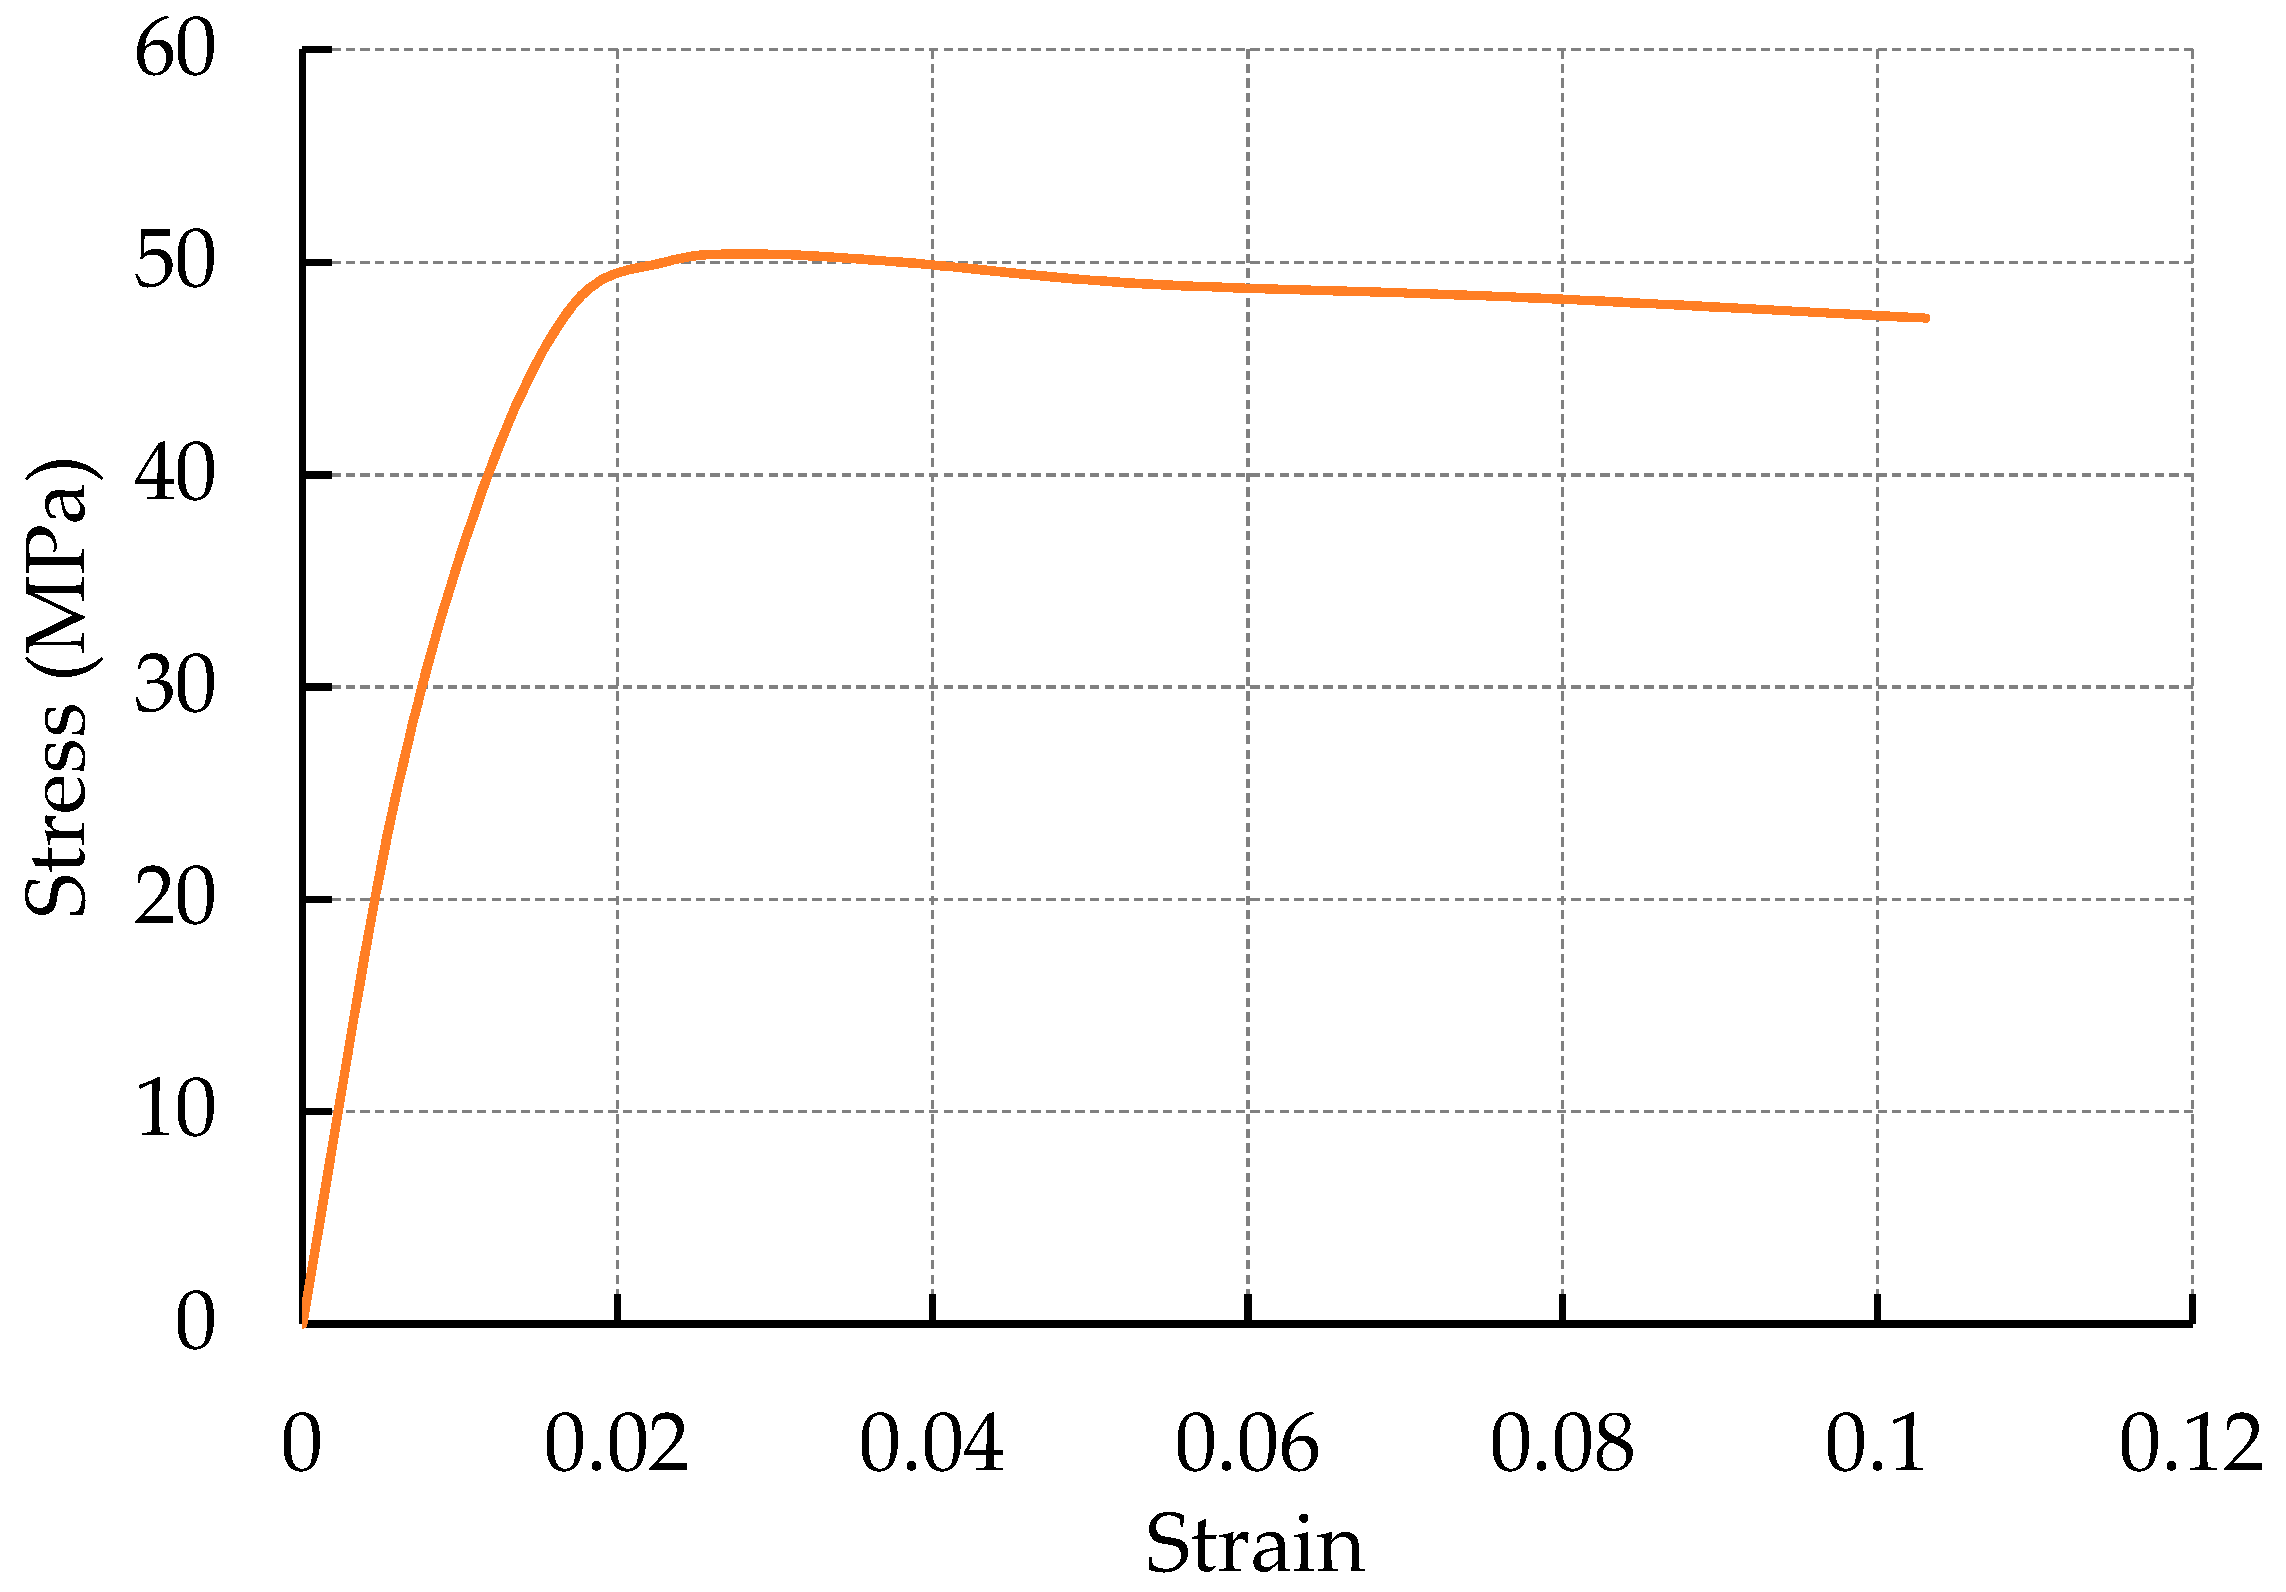
2.1.5. Un-Plasticized Polyvinyl Chloride (uPVC) Tube
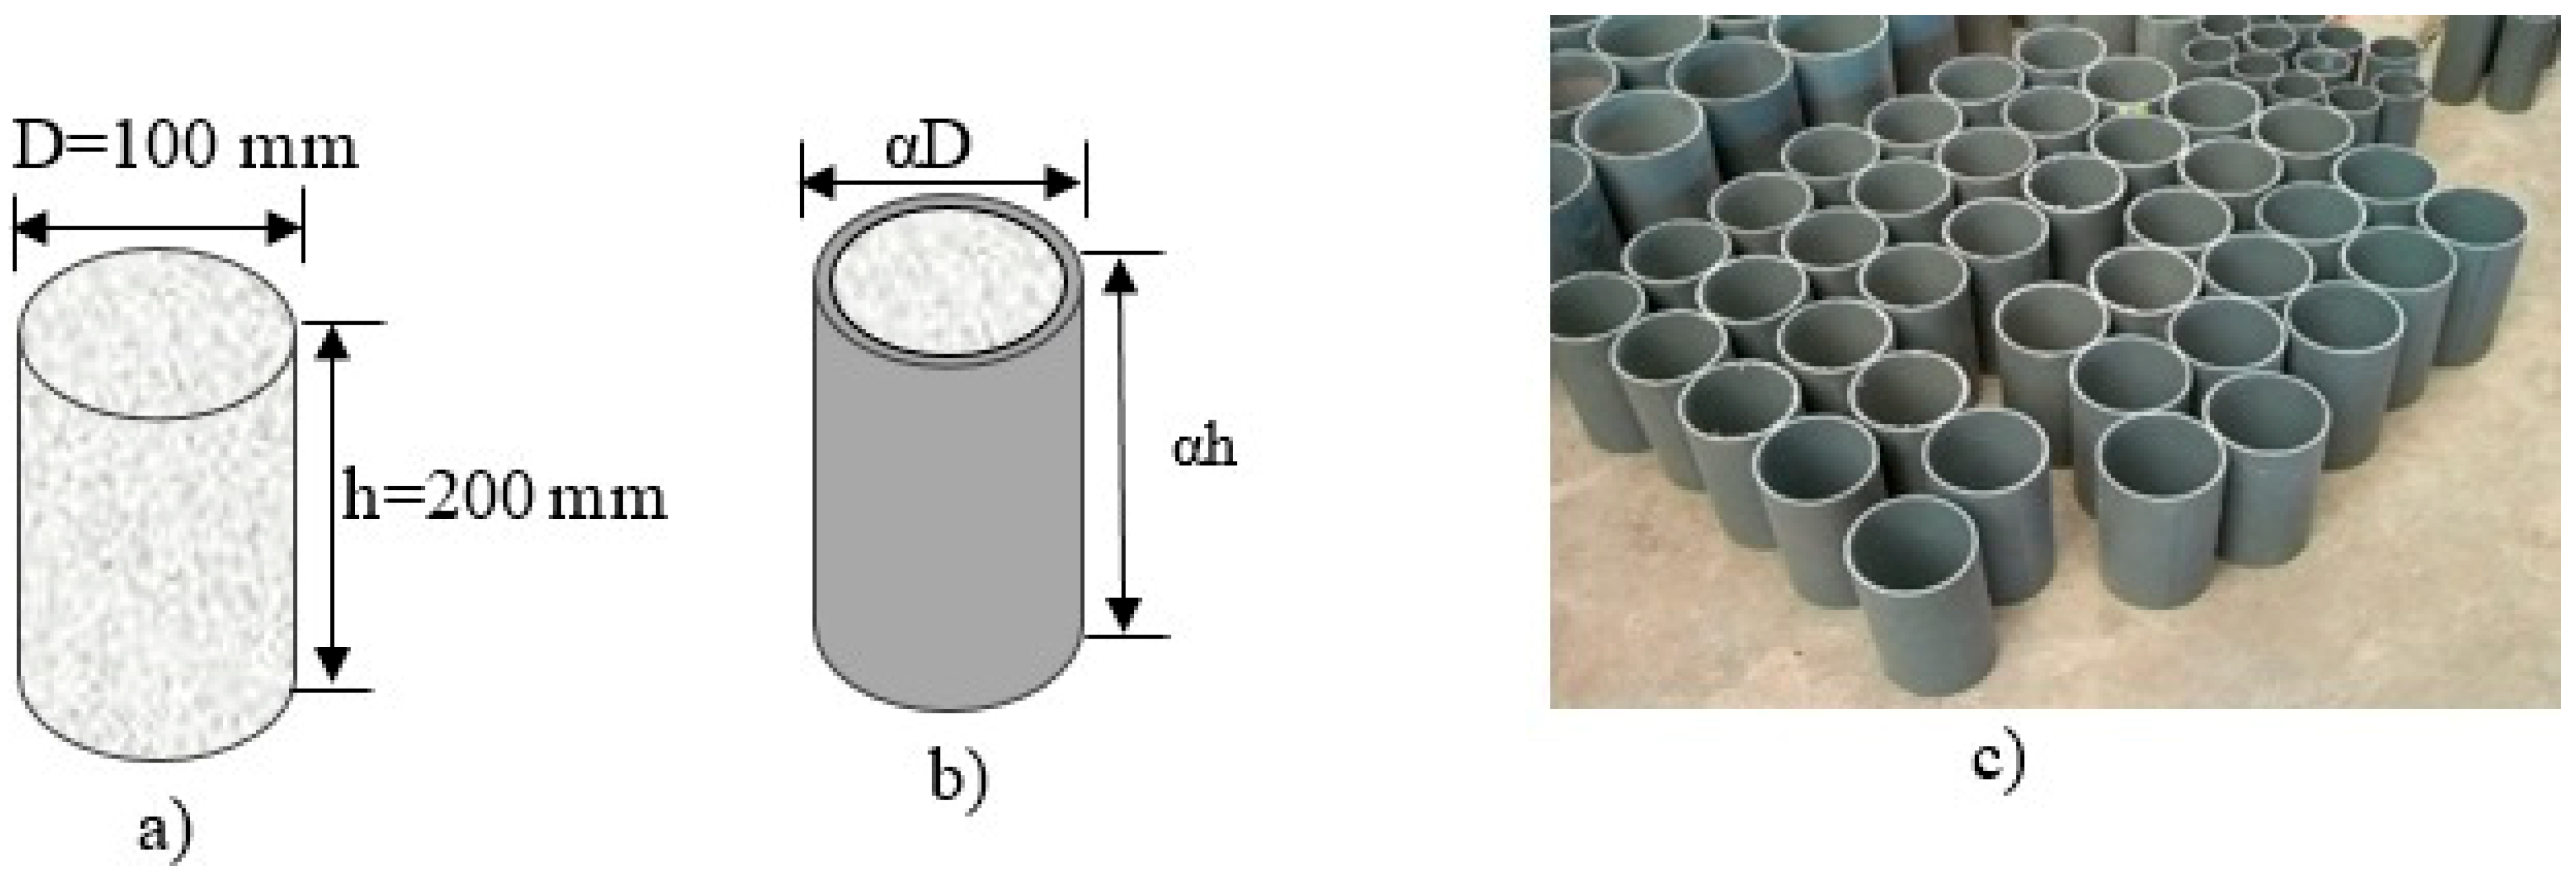
2.2. Concrete-Filled uPVC Tube Equivalent Cylinder (h/D = 2)
3. Results and Discussions
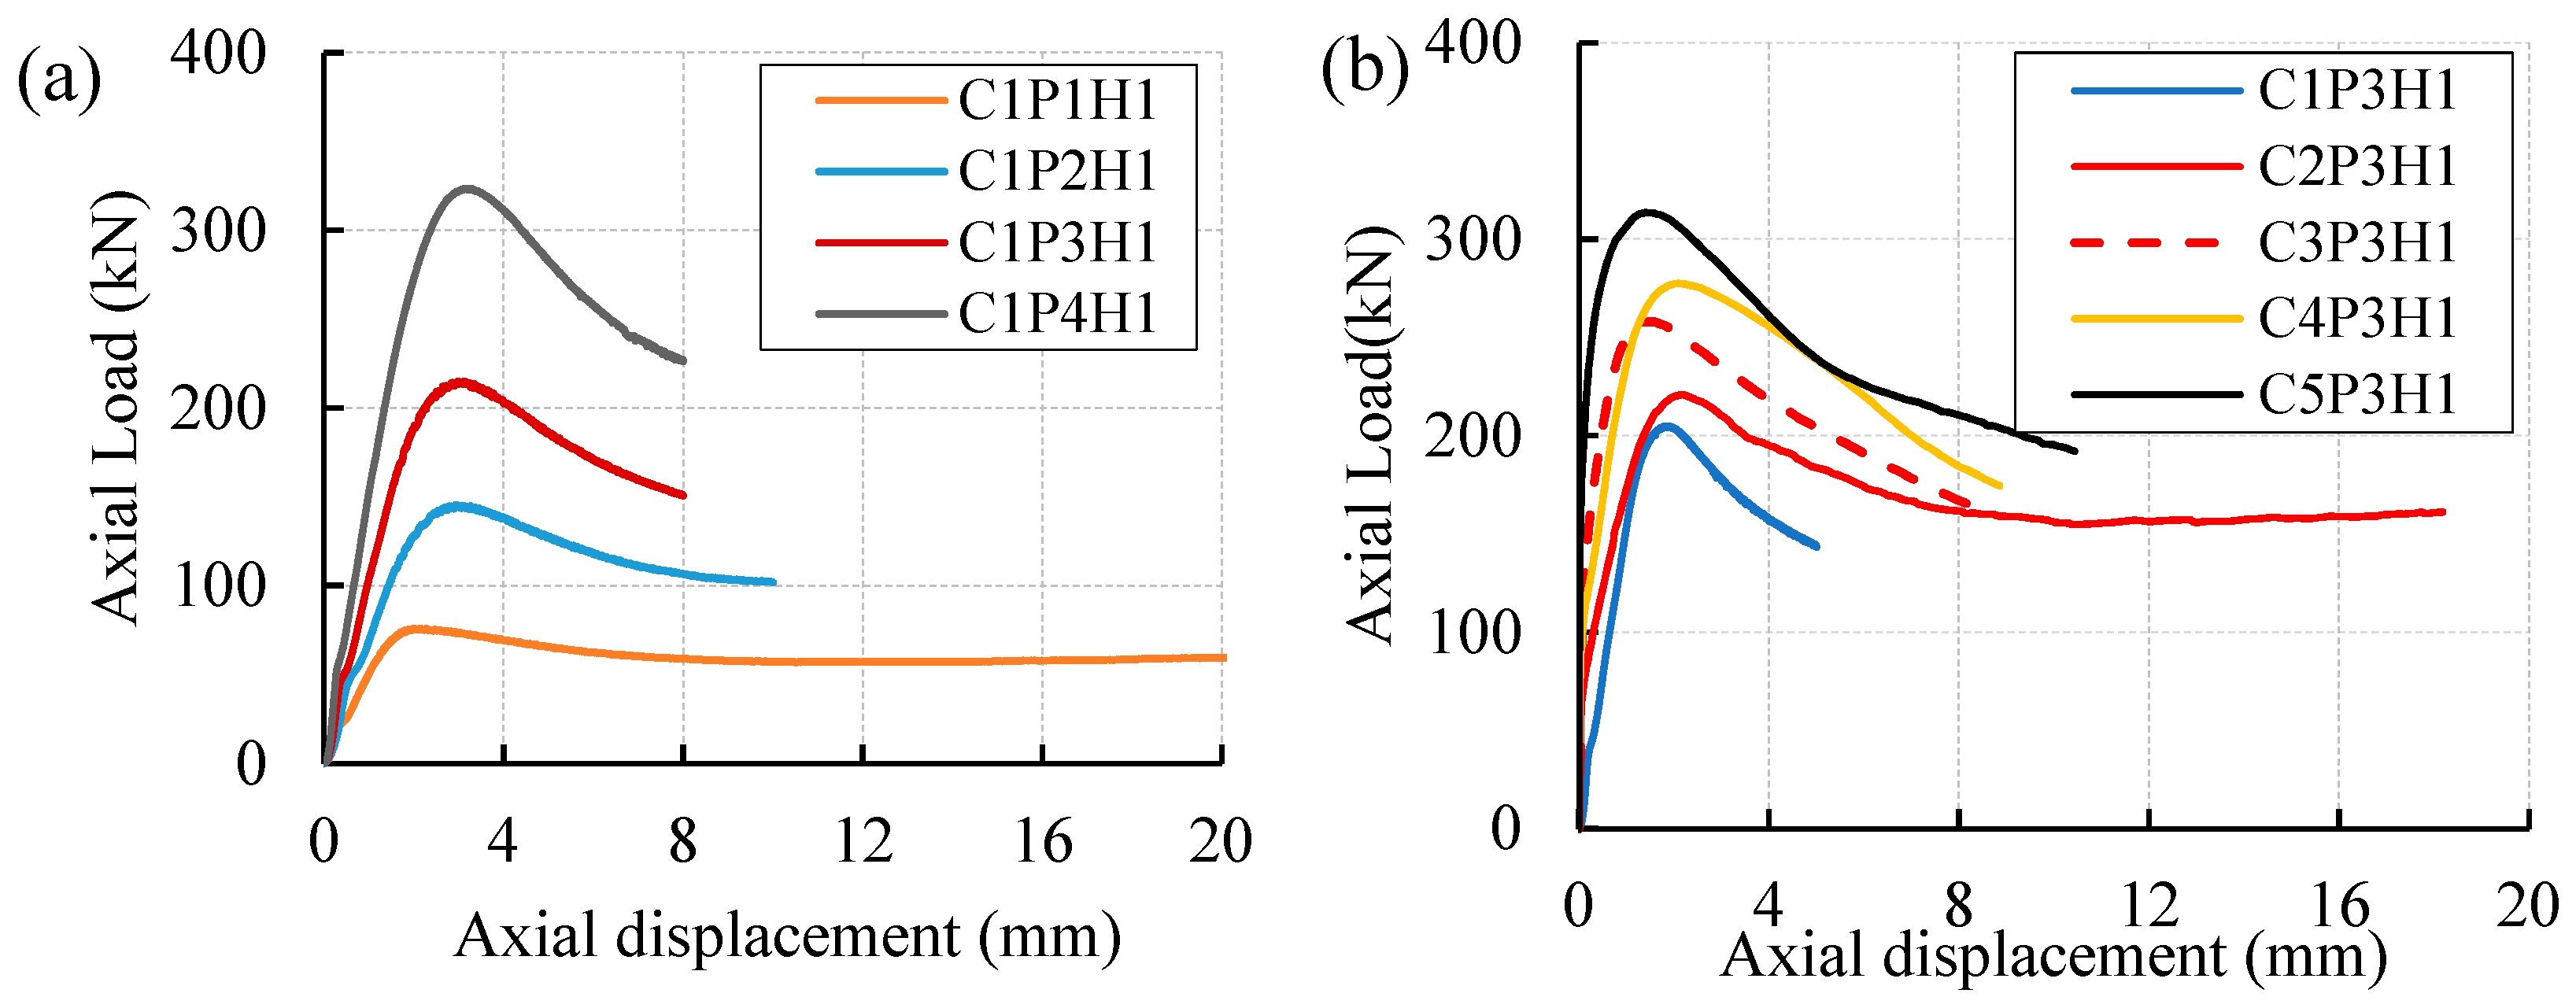
3.1. Load Carrying Capacity, Deformation and Specimen Behavior
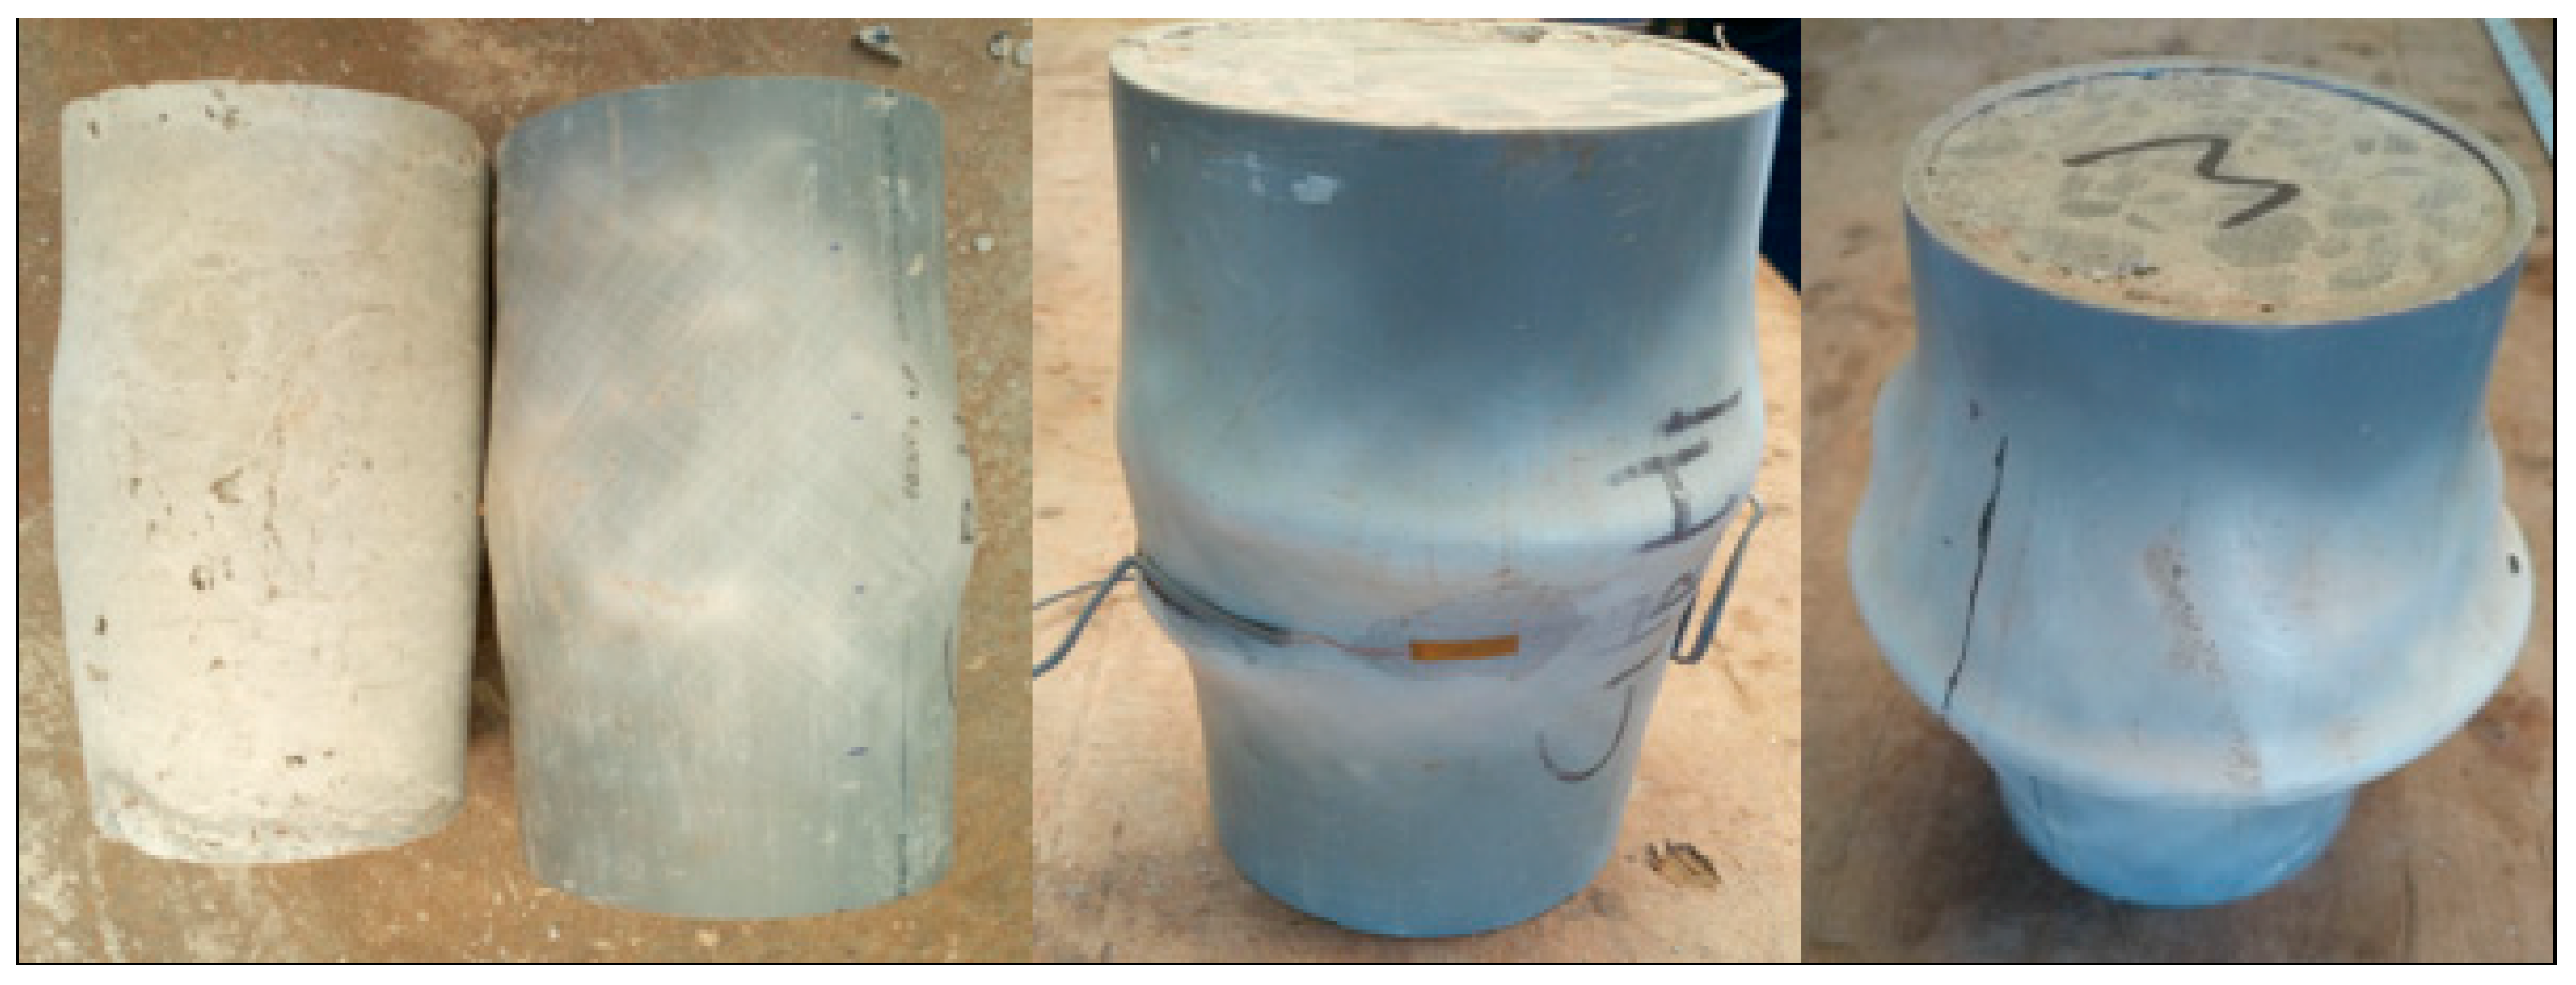
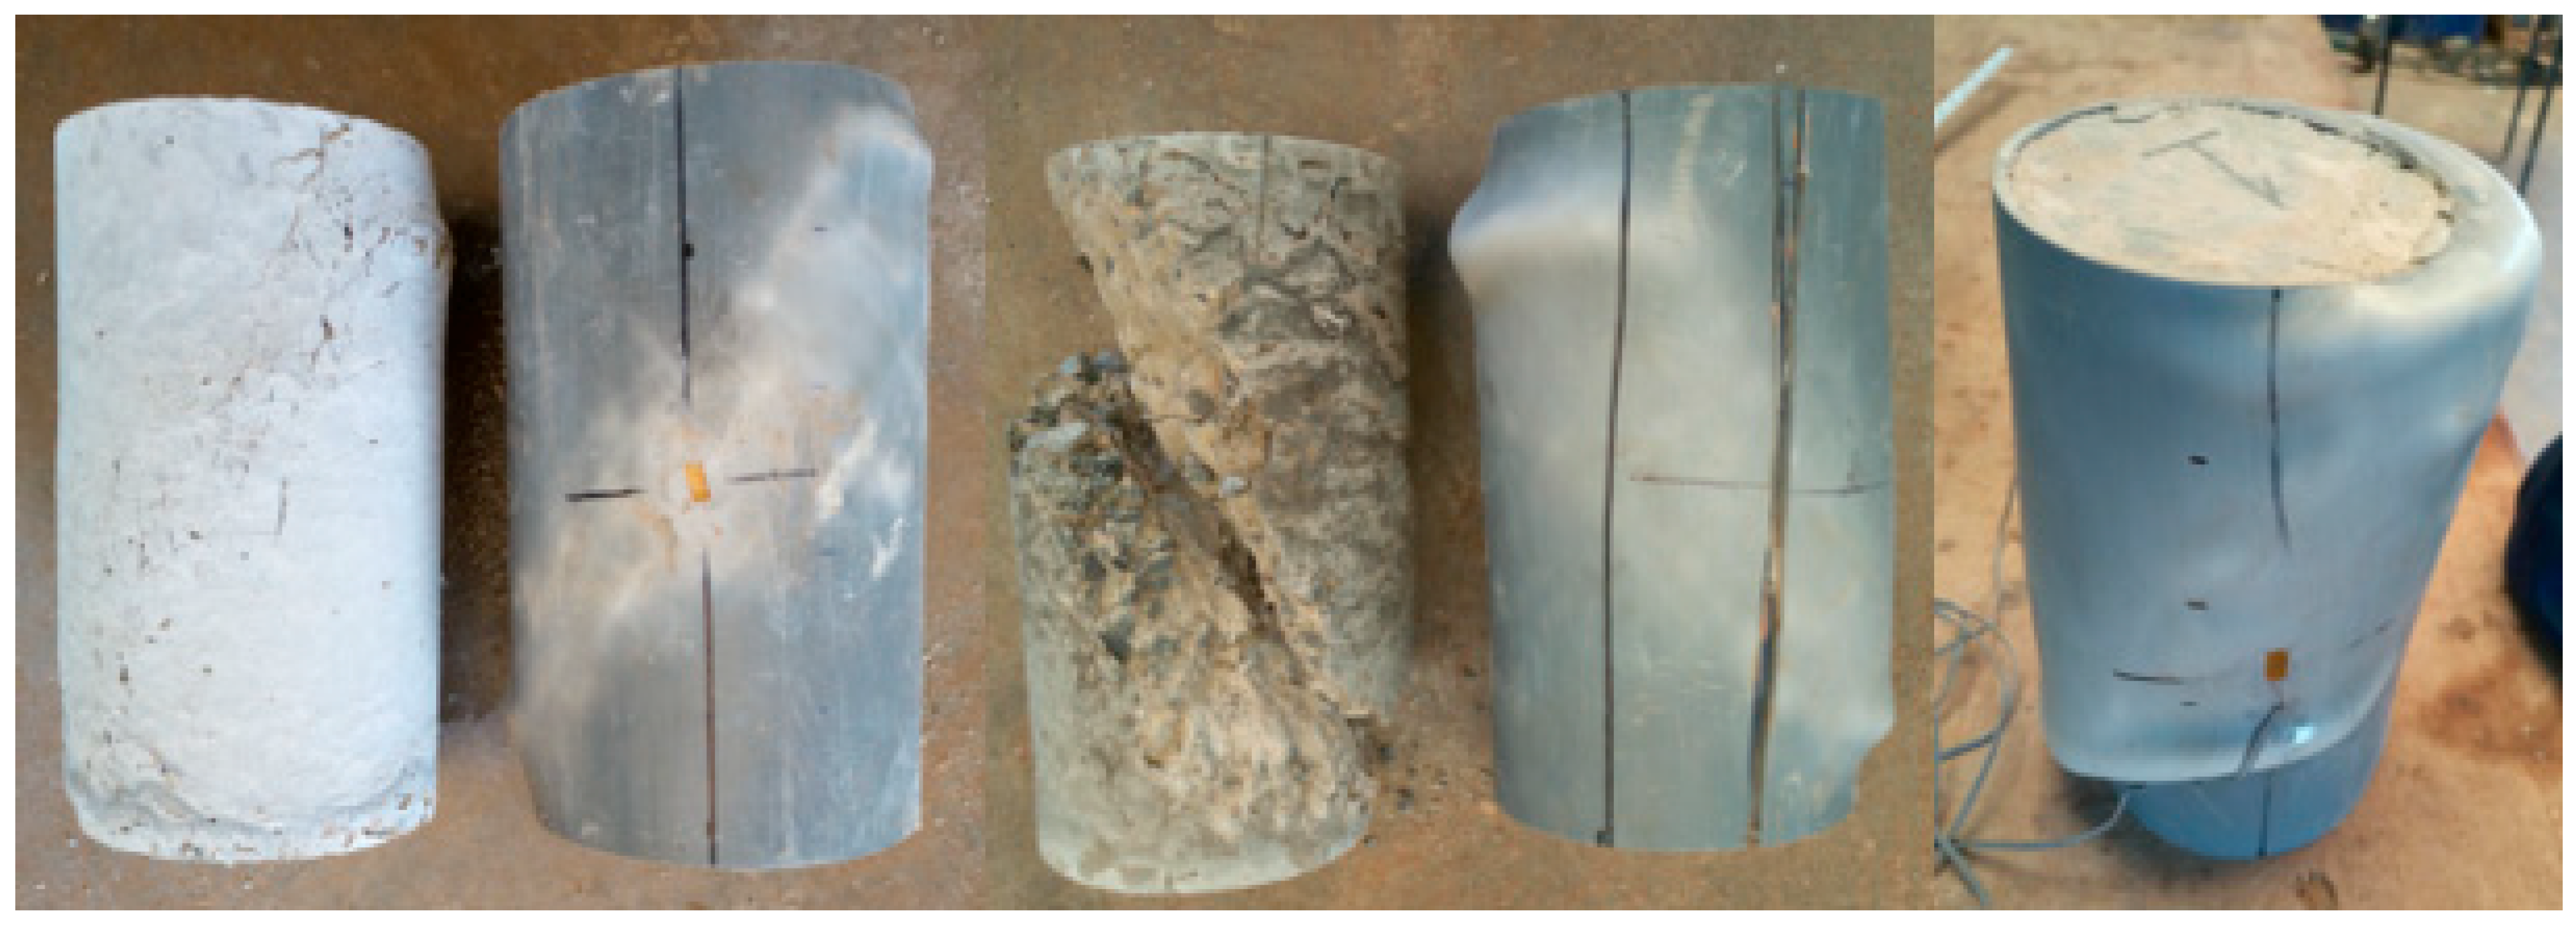
3.2. Failure Modes and Patterns
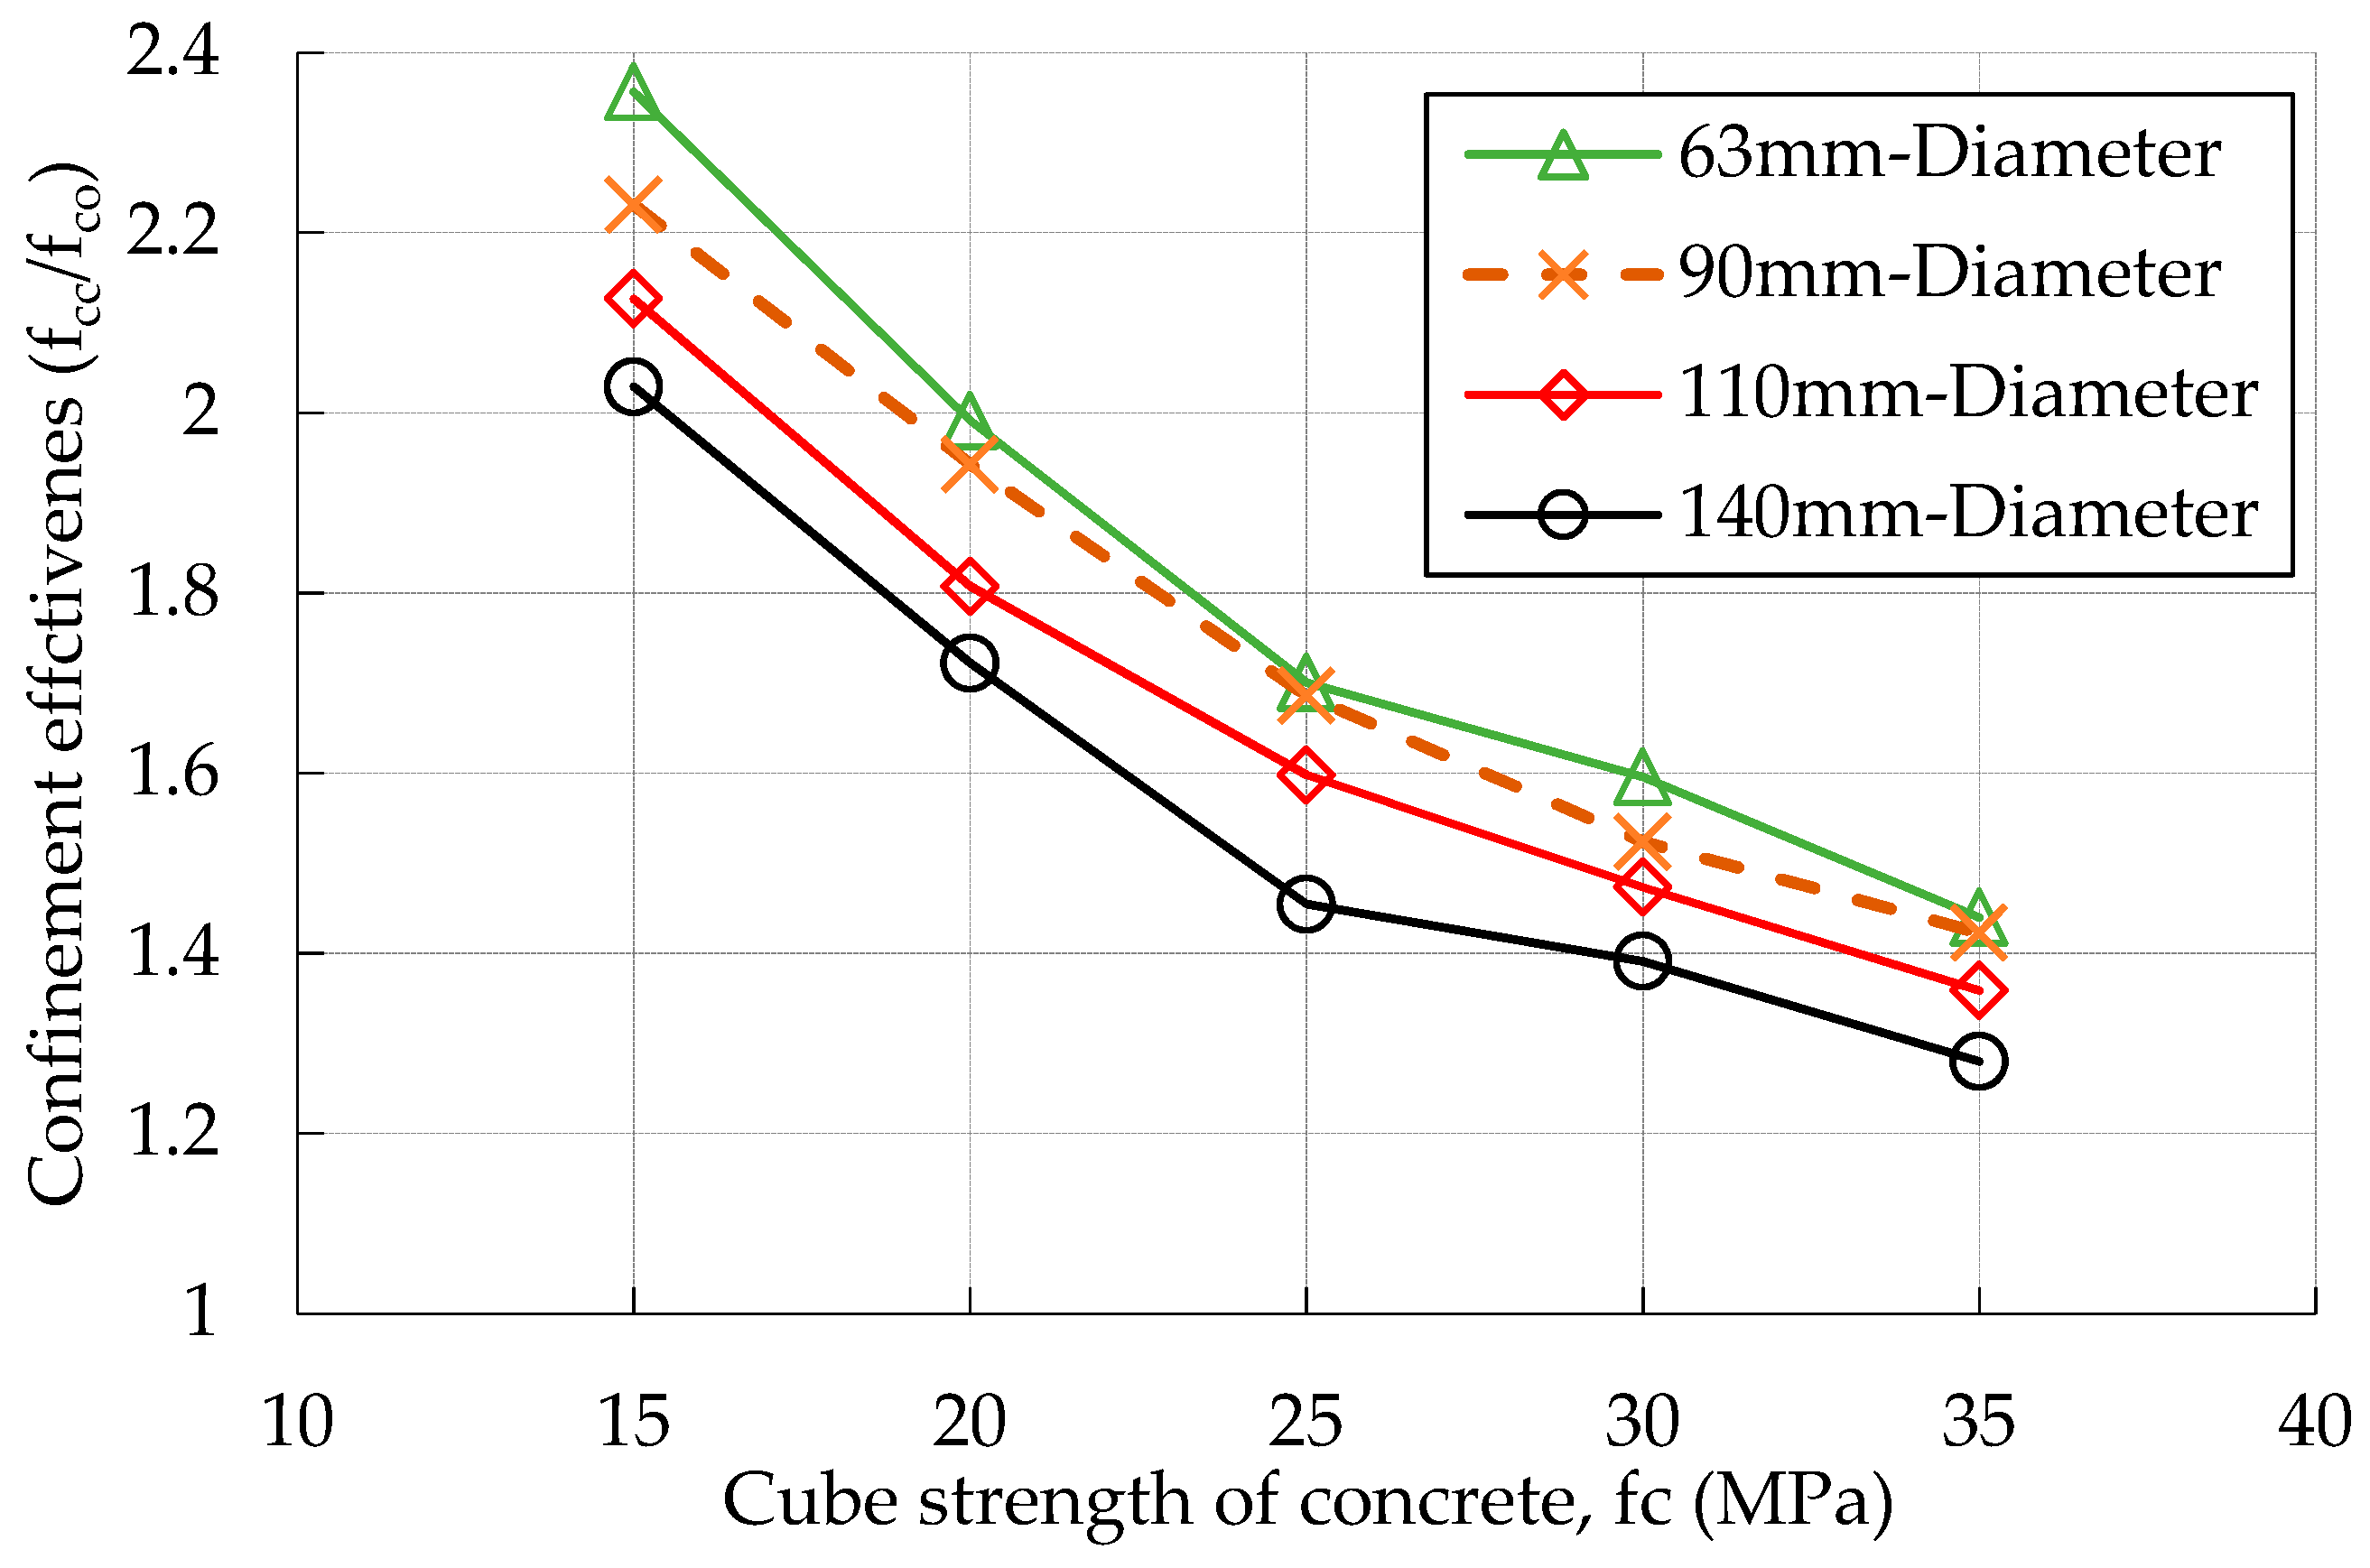
3.3. Confinement Effectiveness
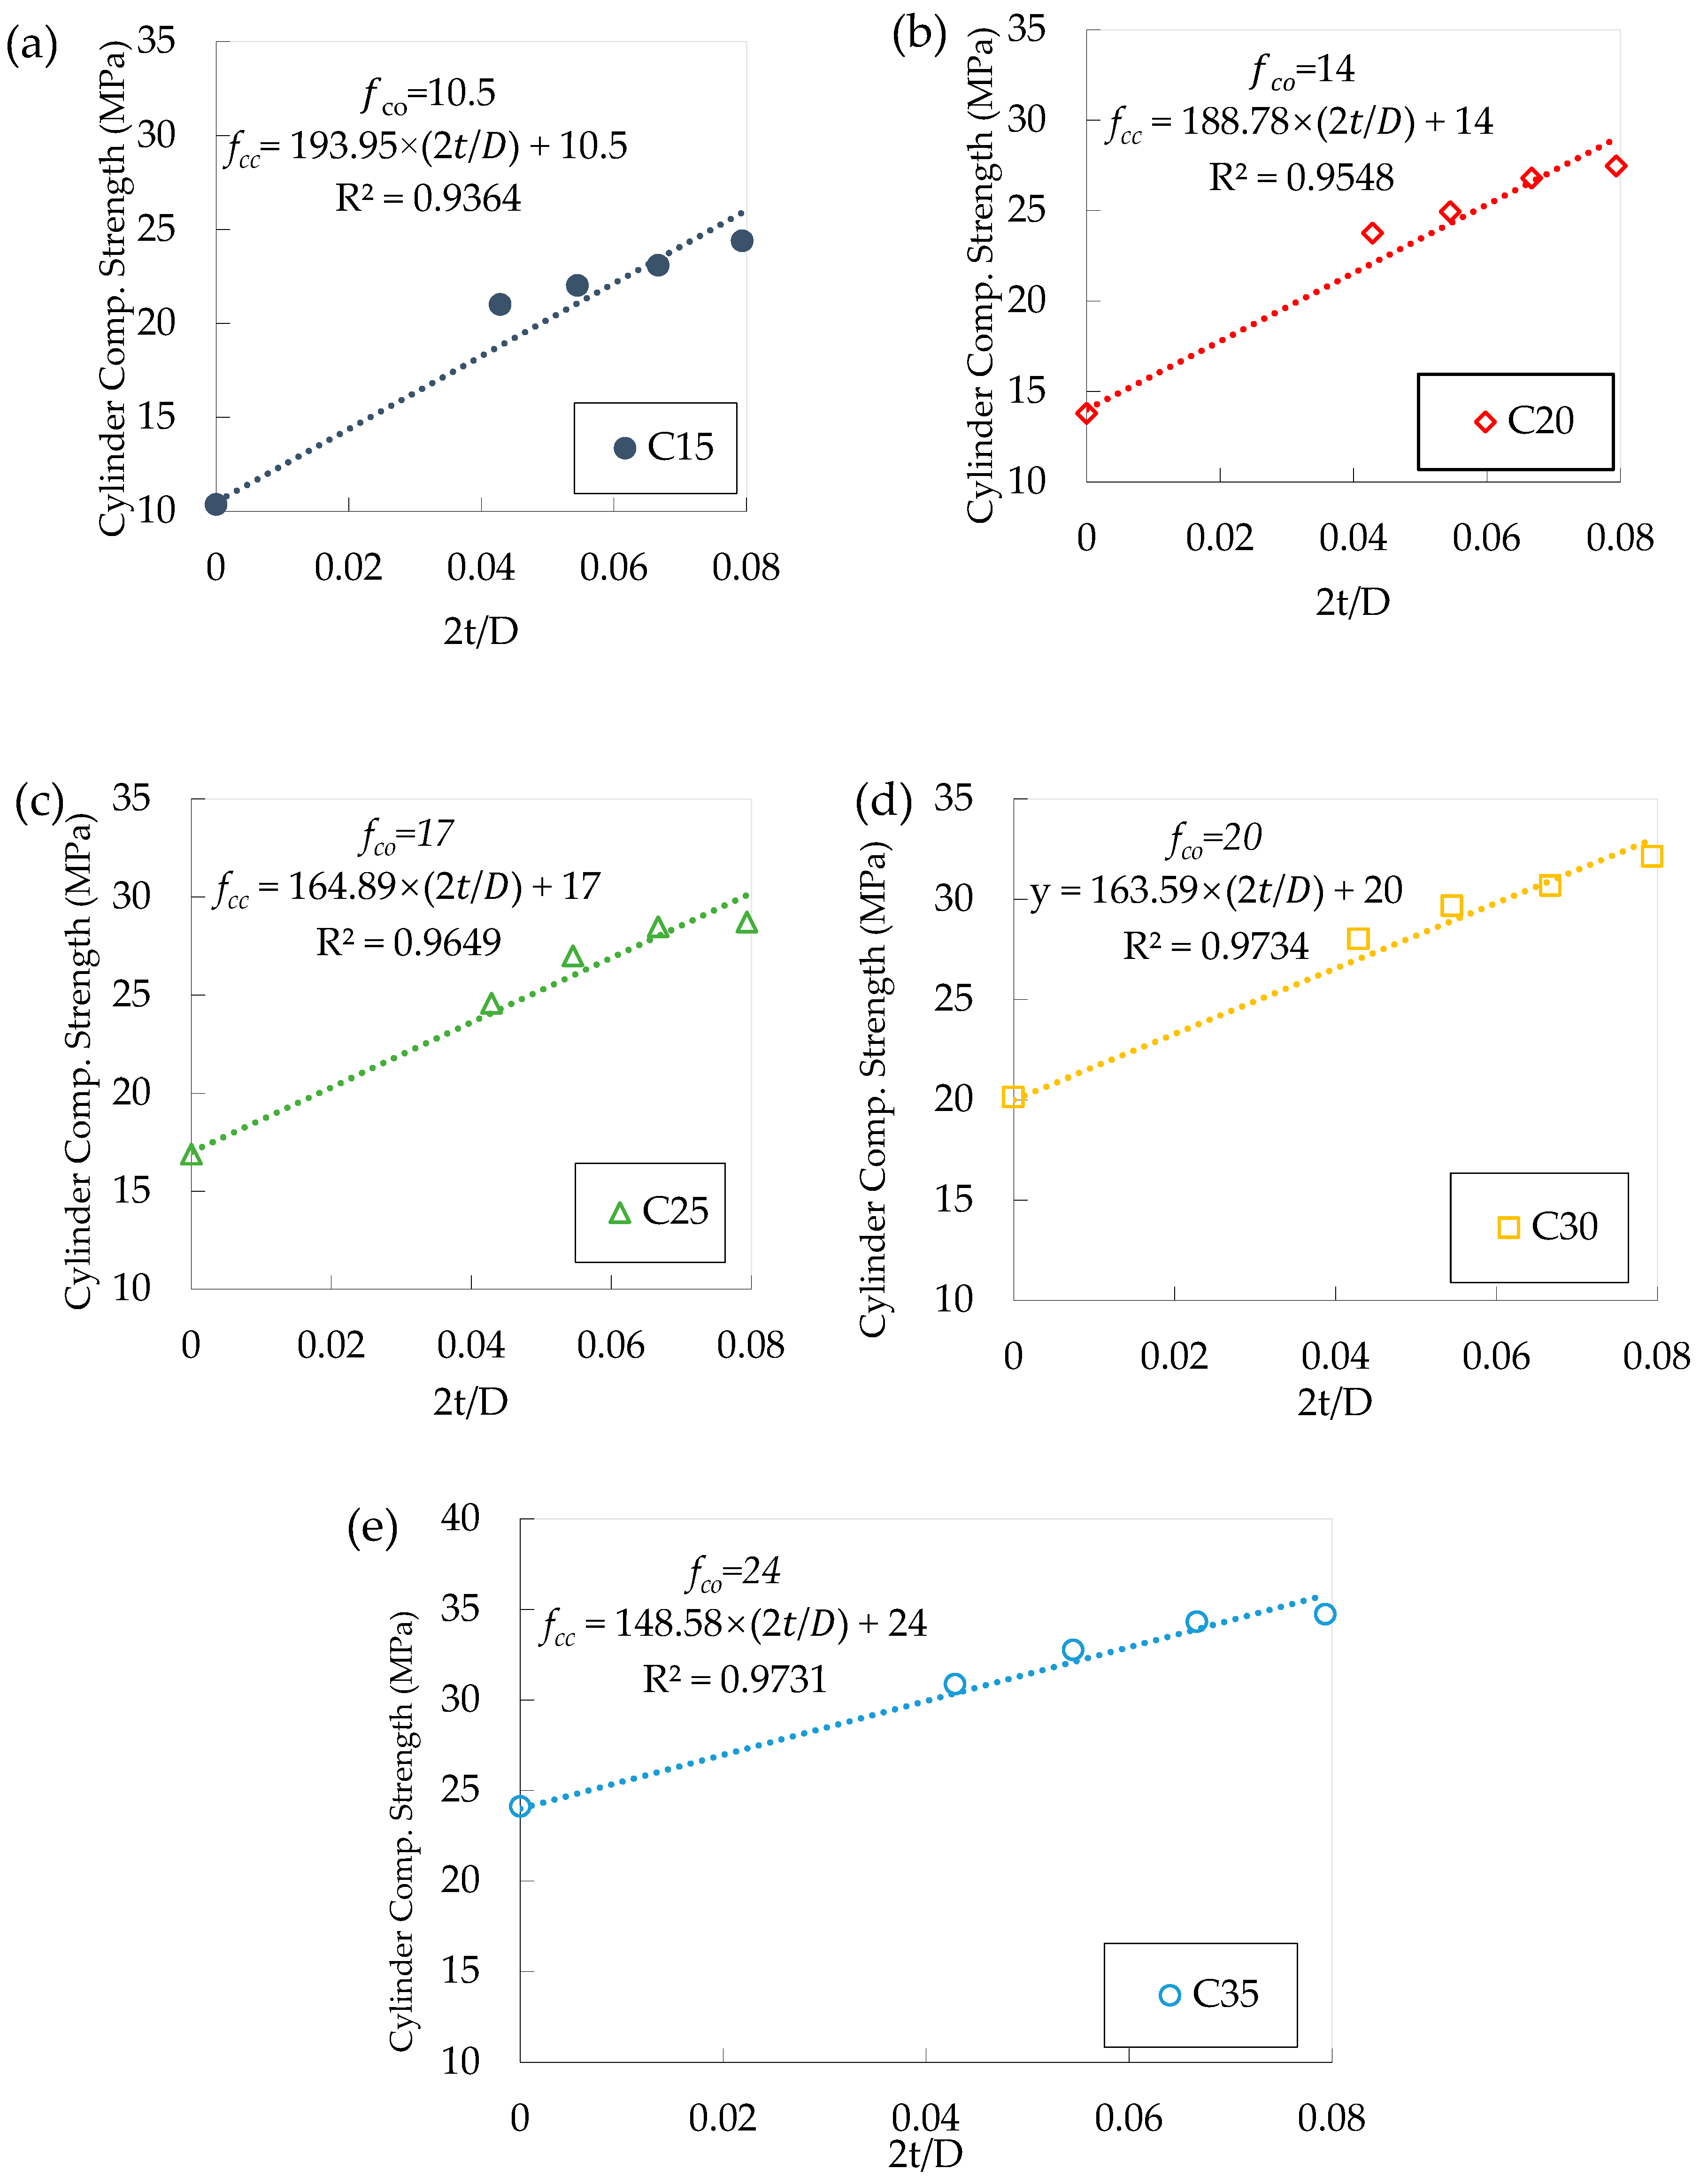
3.4. Effect of Thickness to Diameter (2t/D)
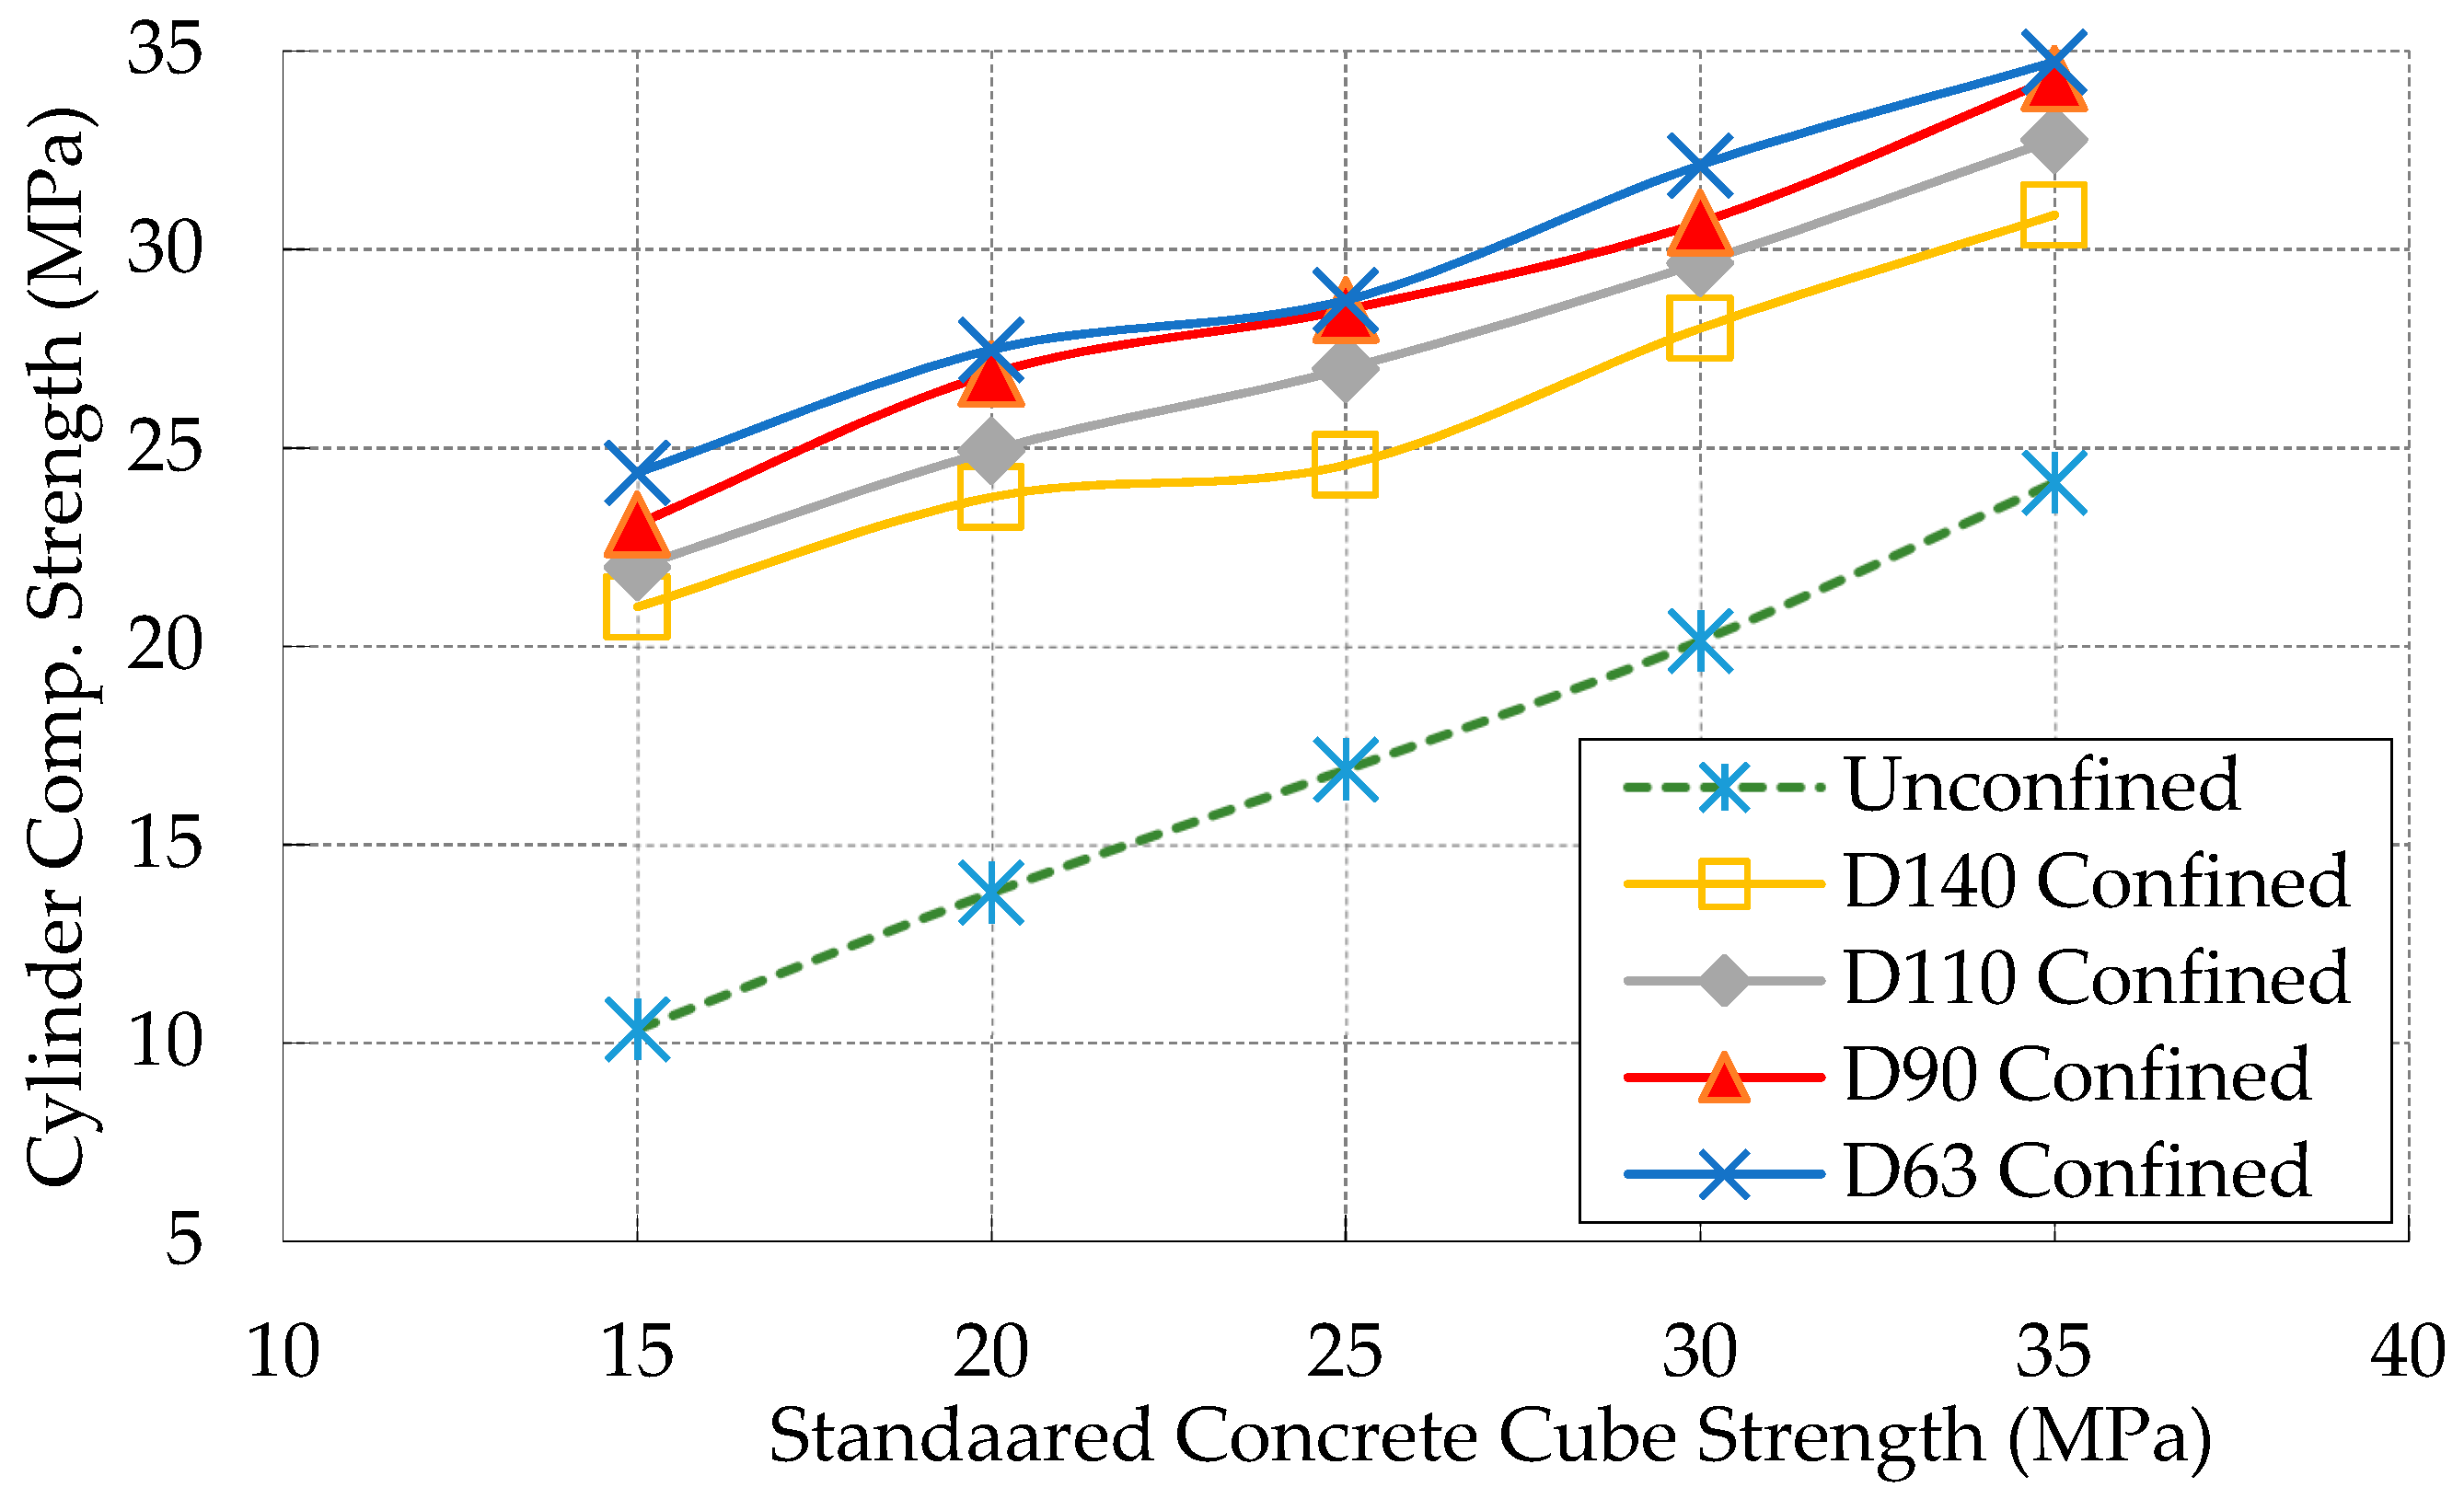
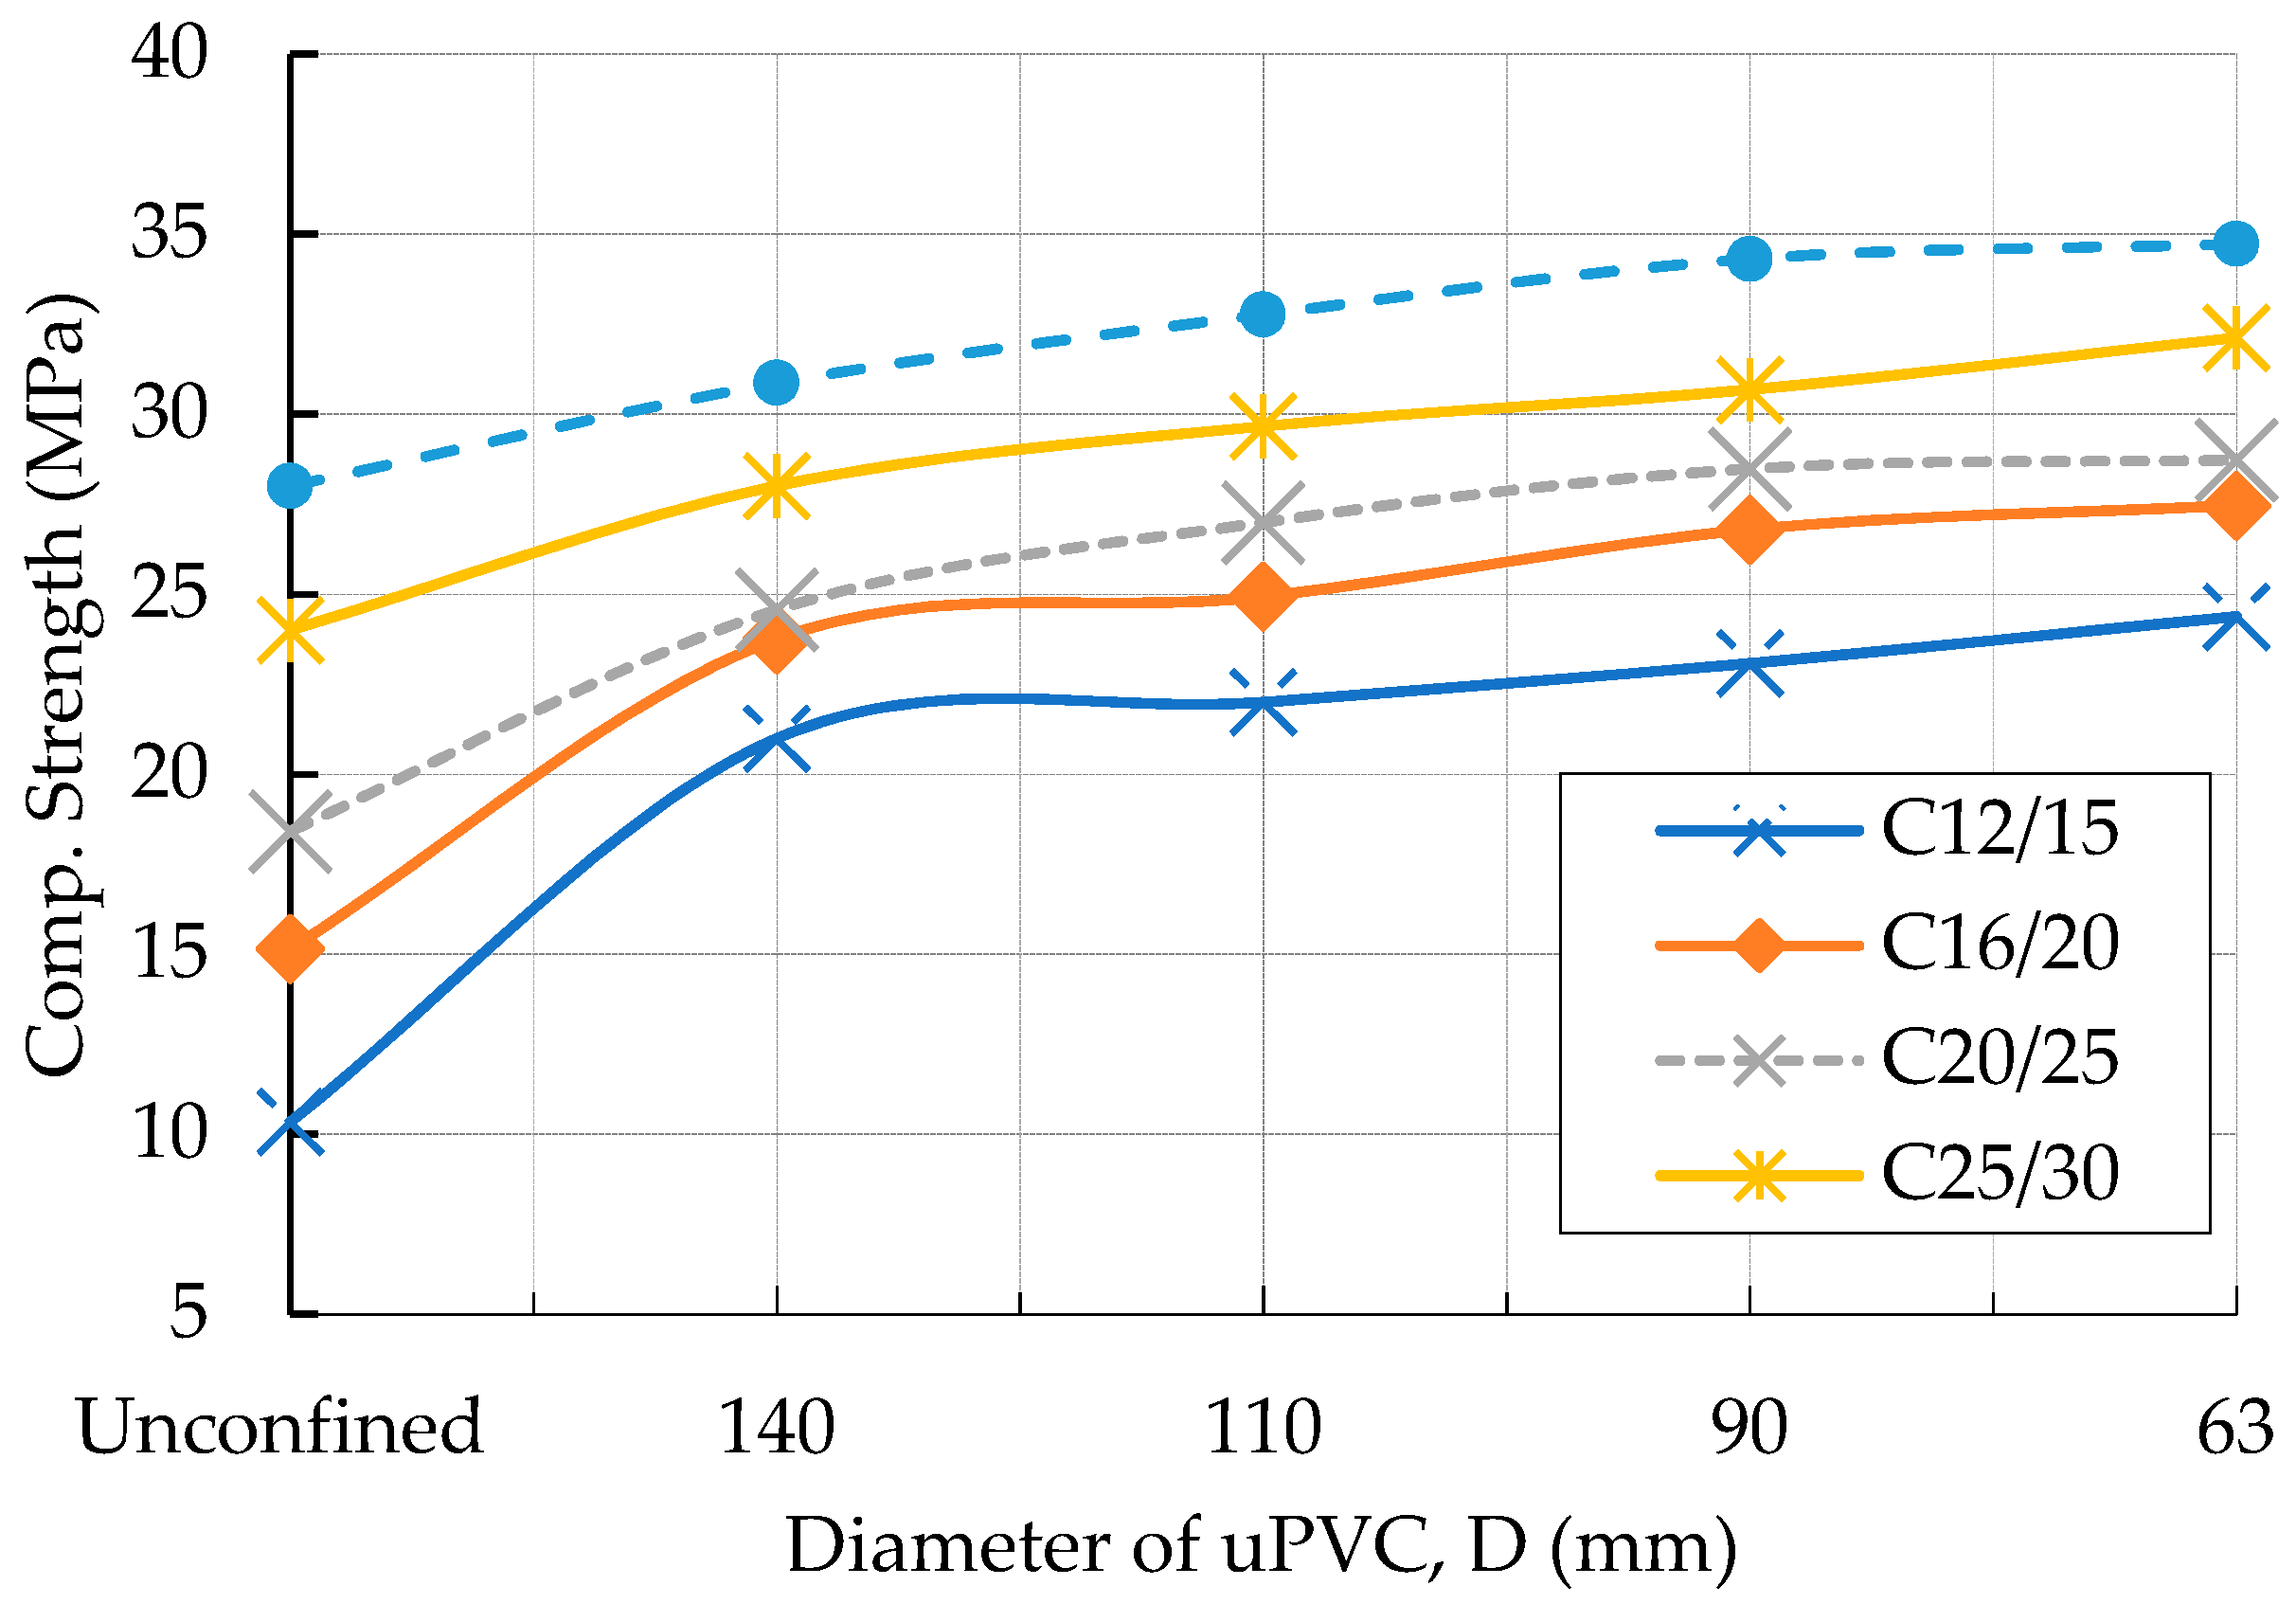
3.5. Effect of Core Concrete Strength and Pipe Size
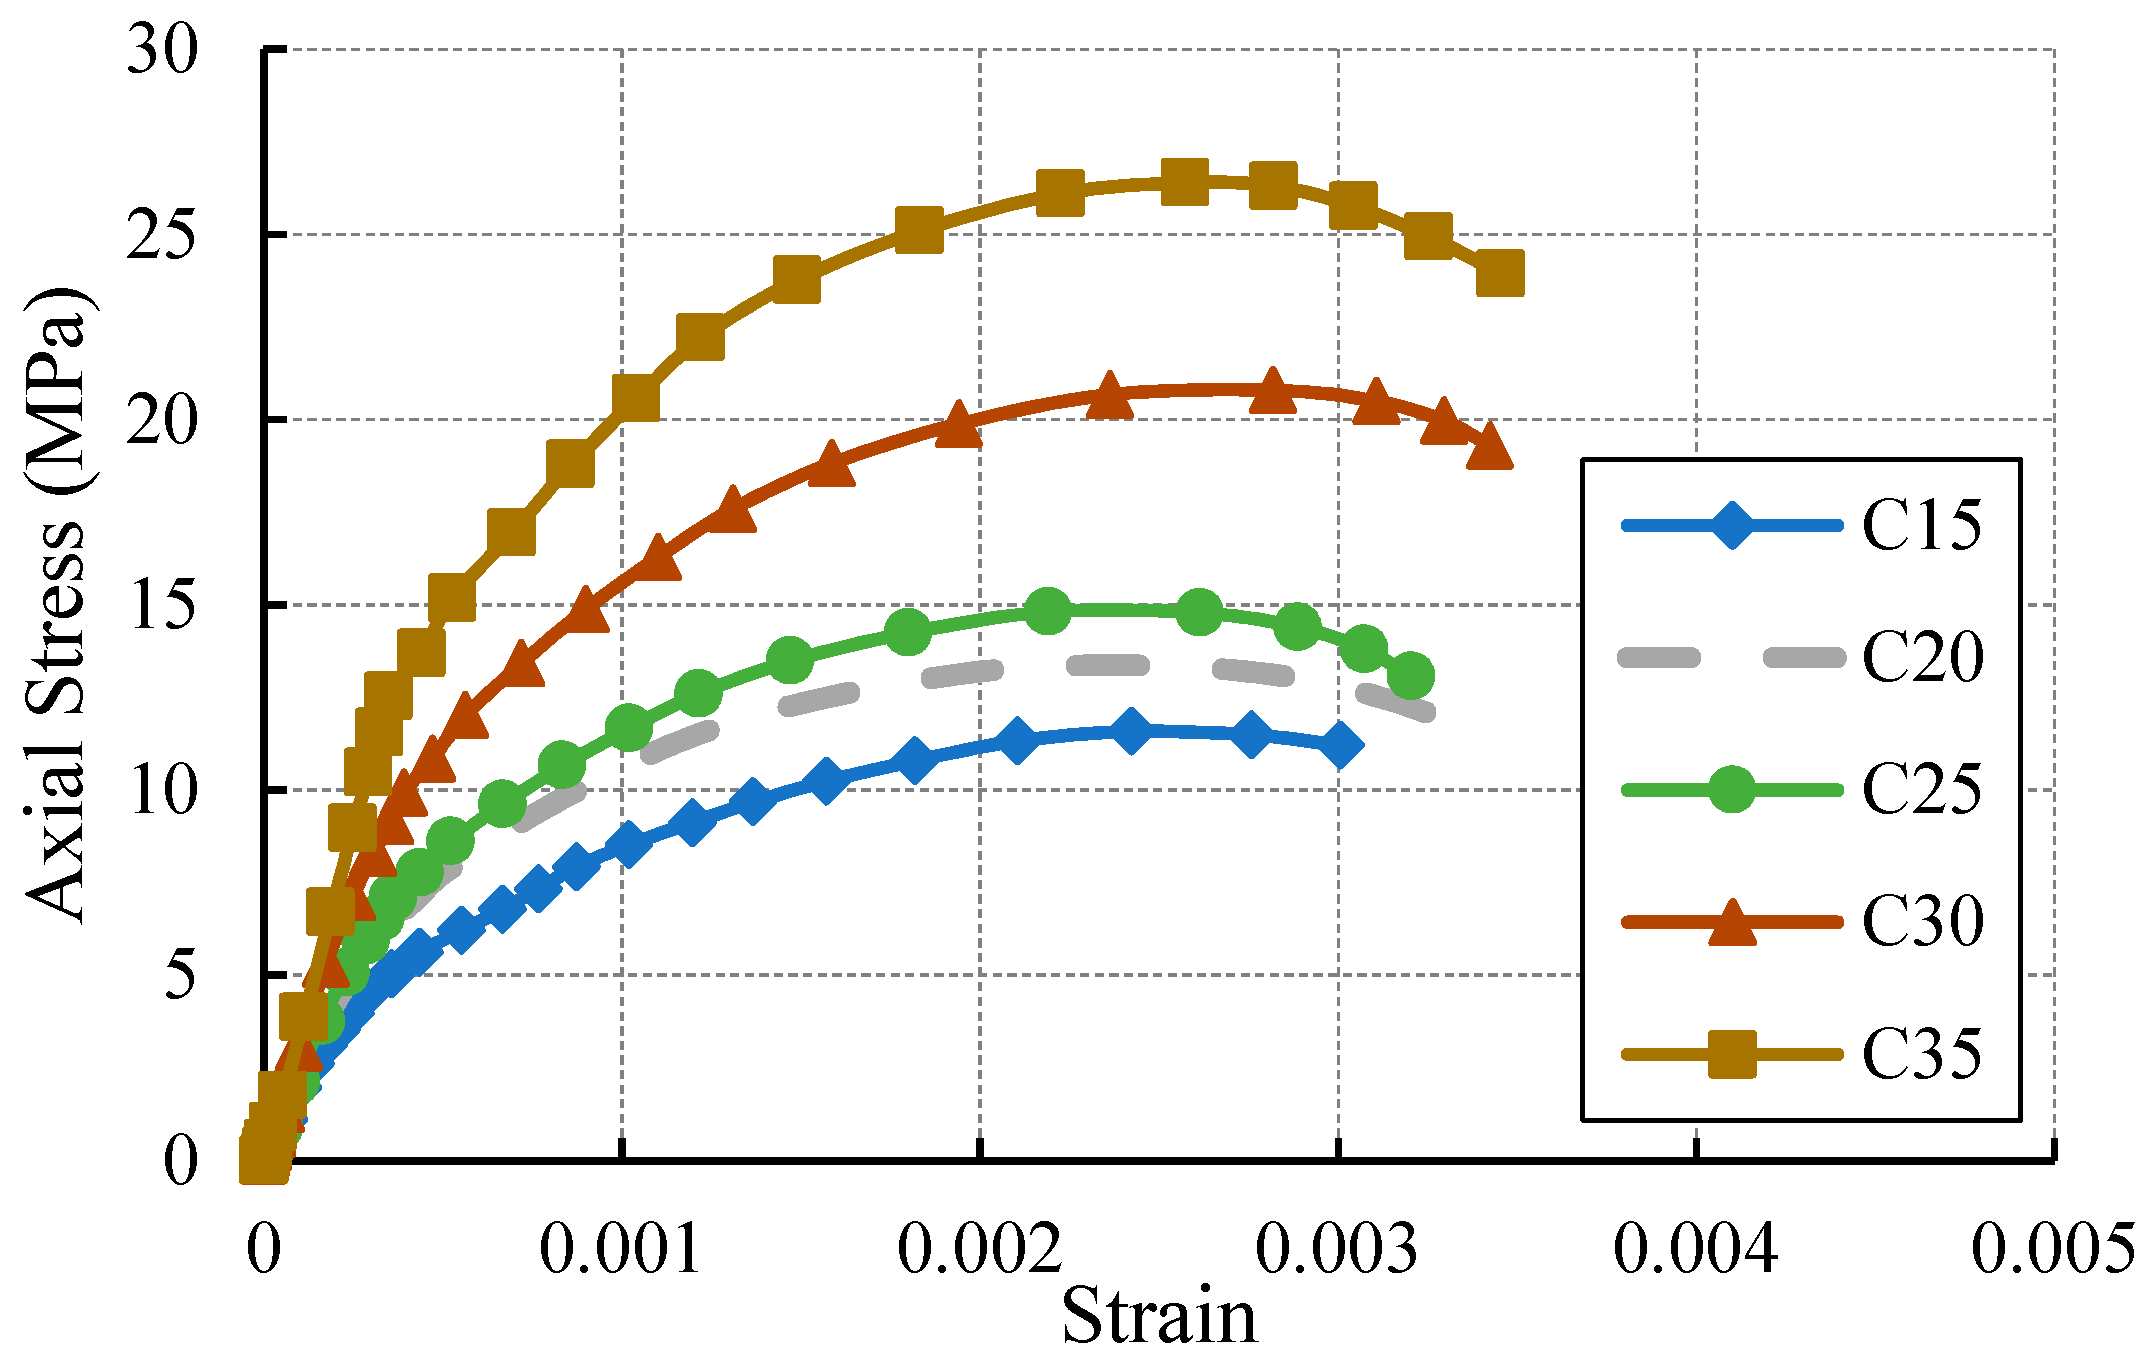
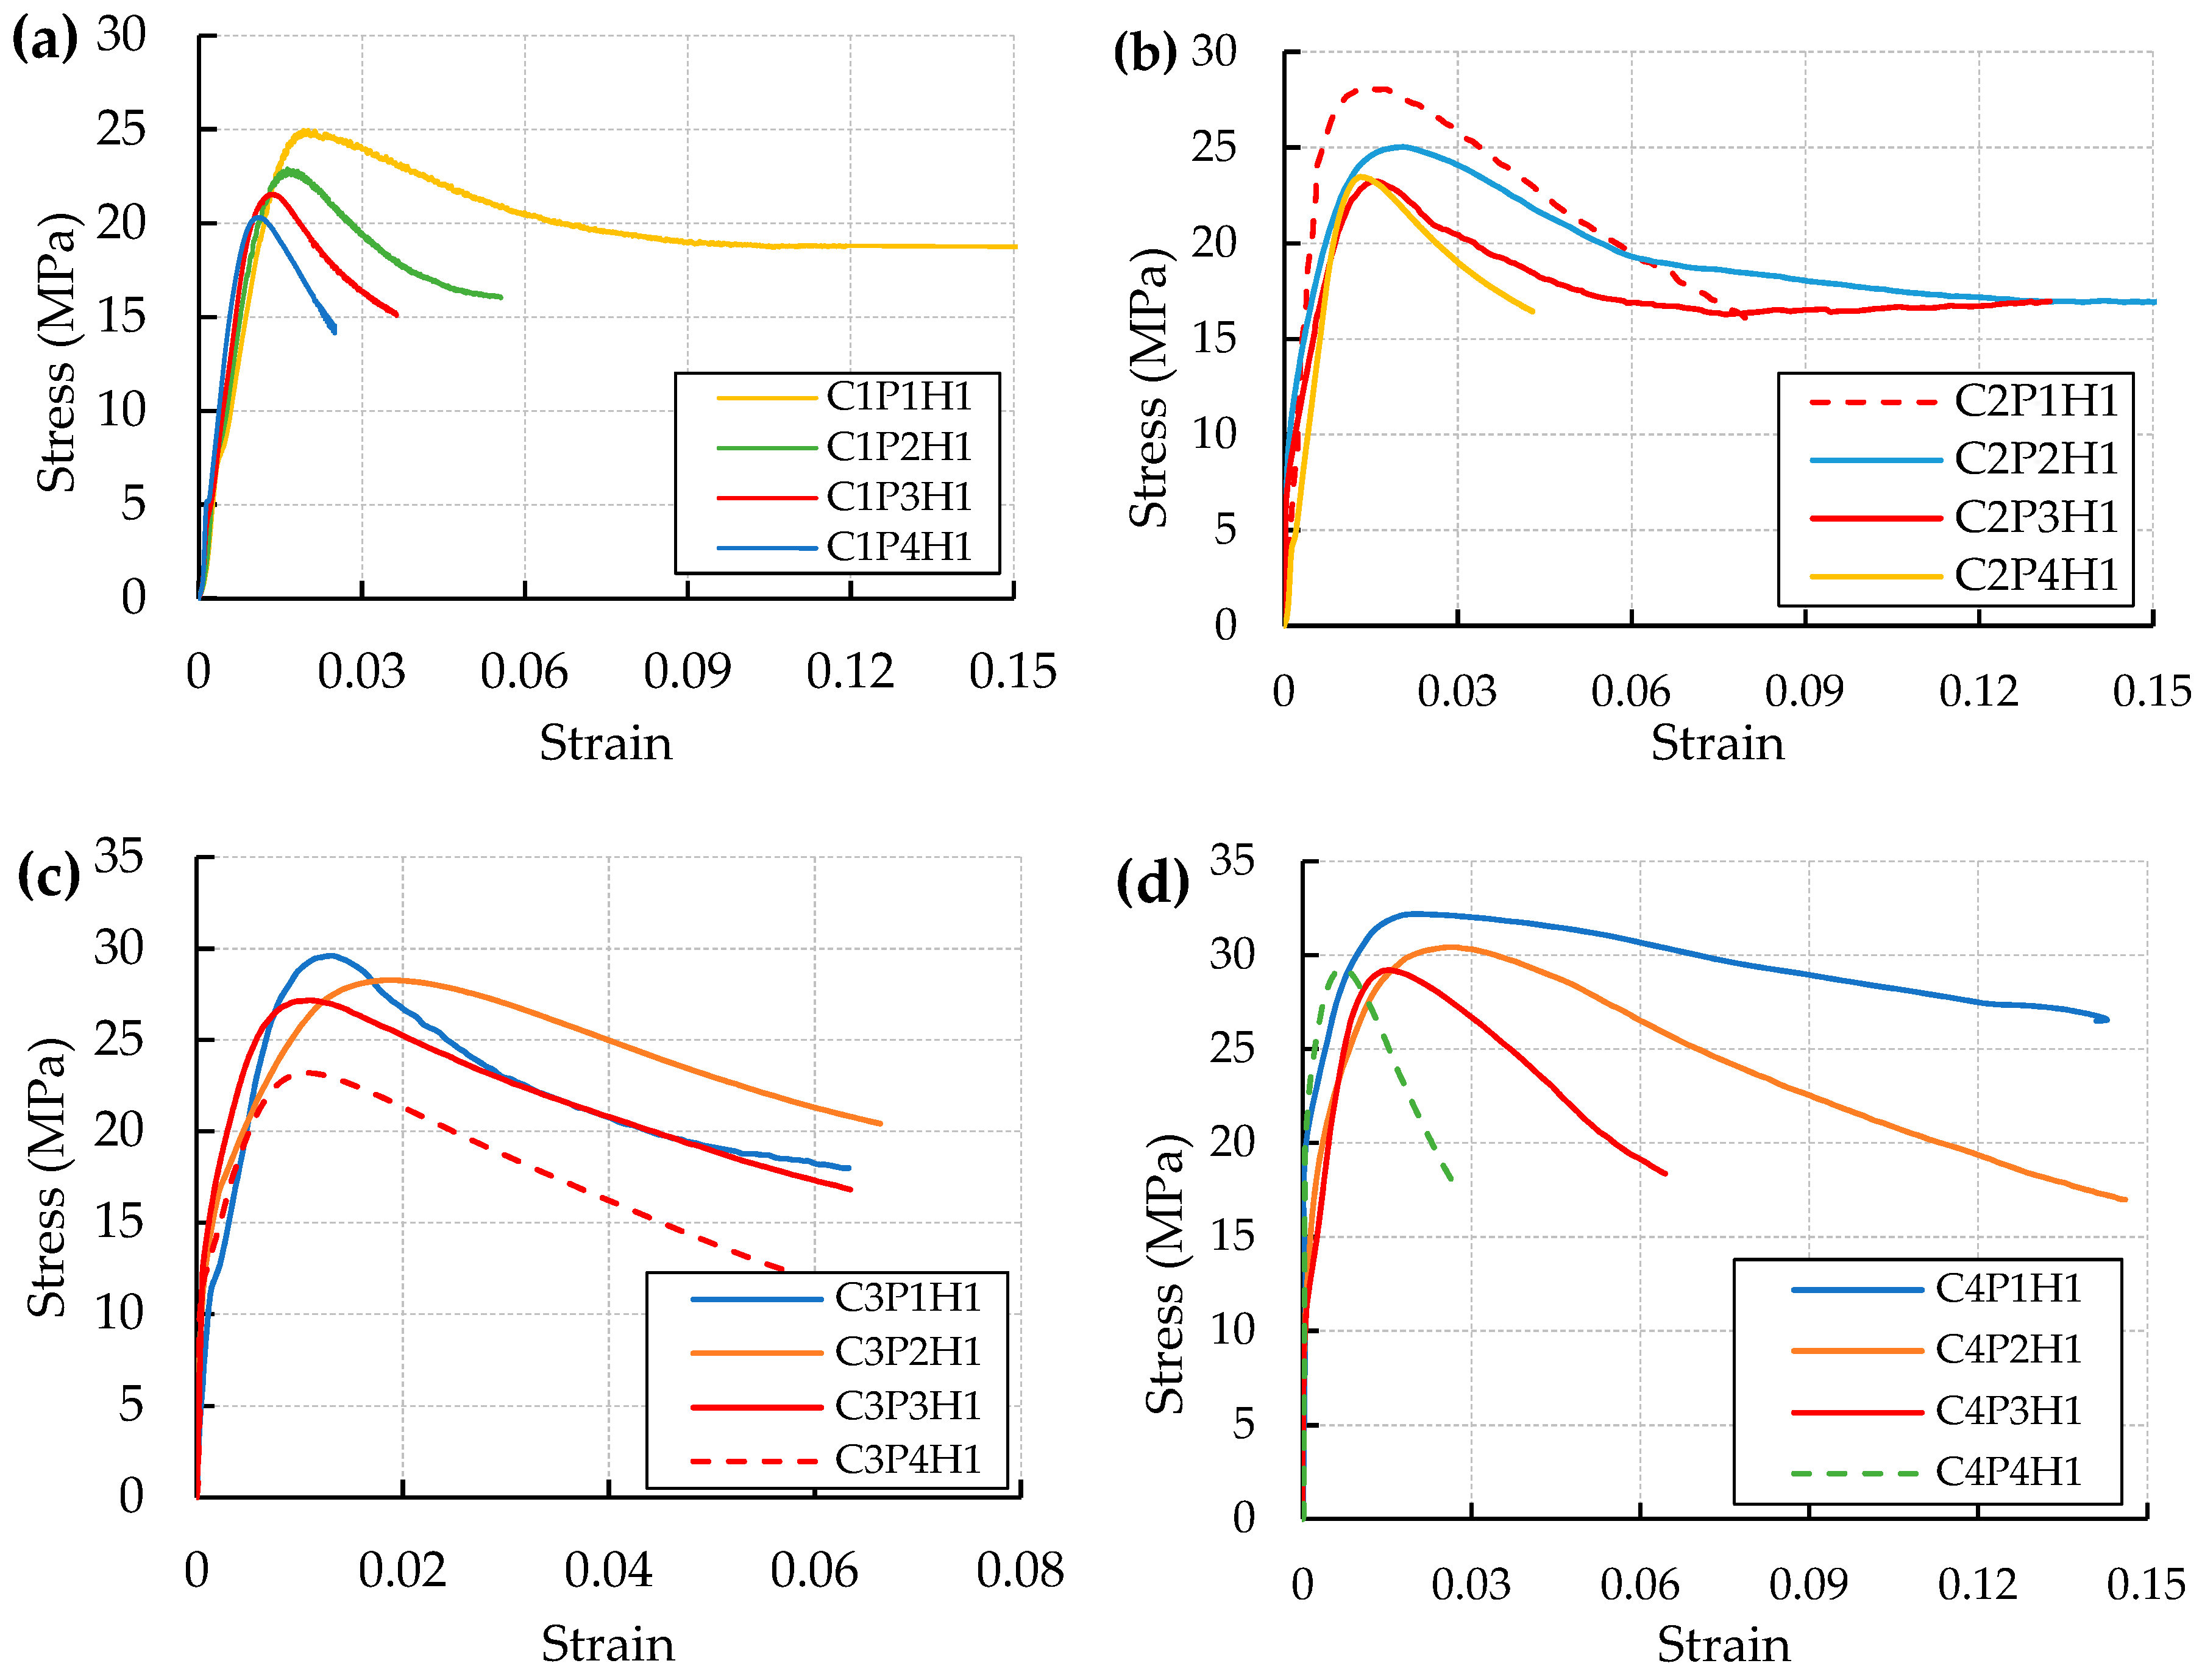
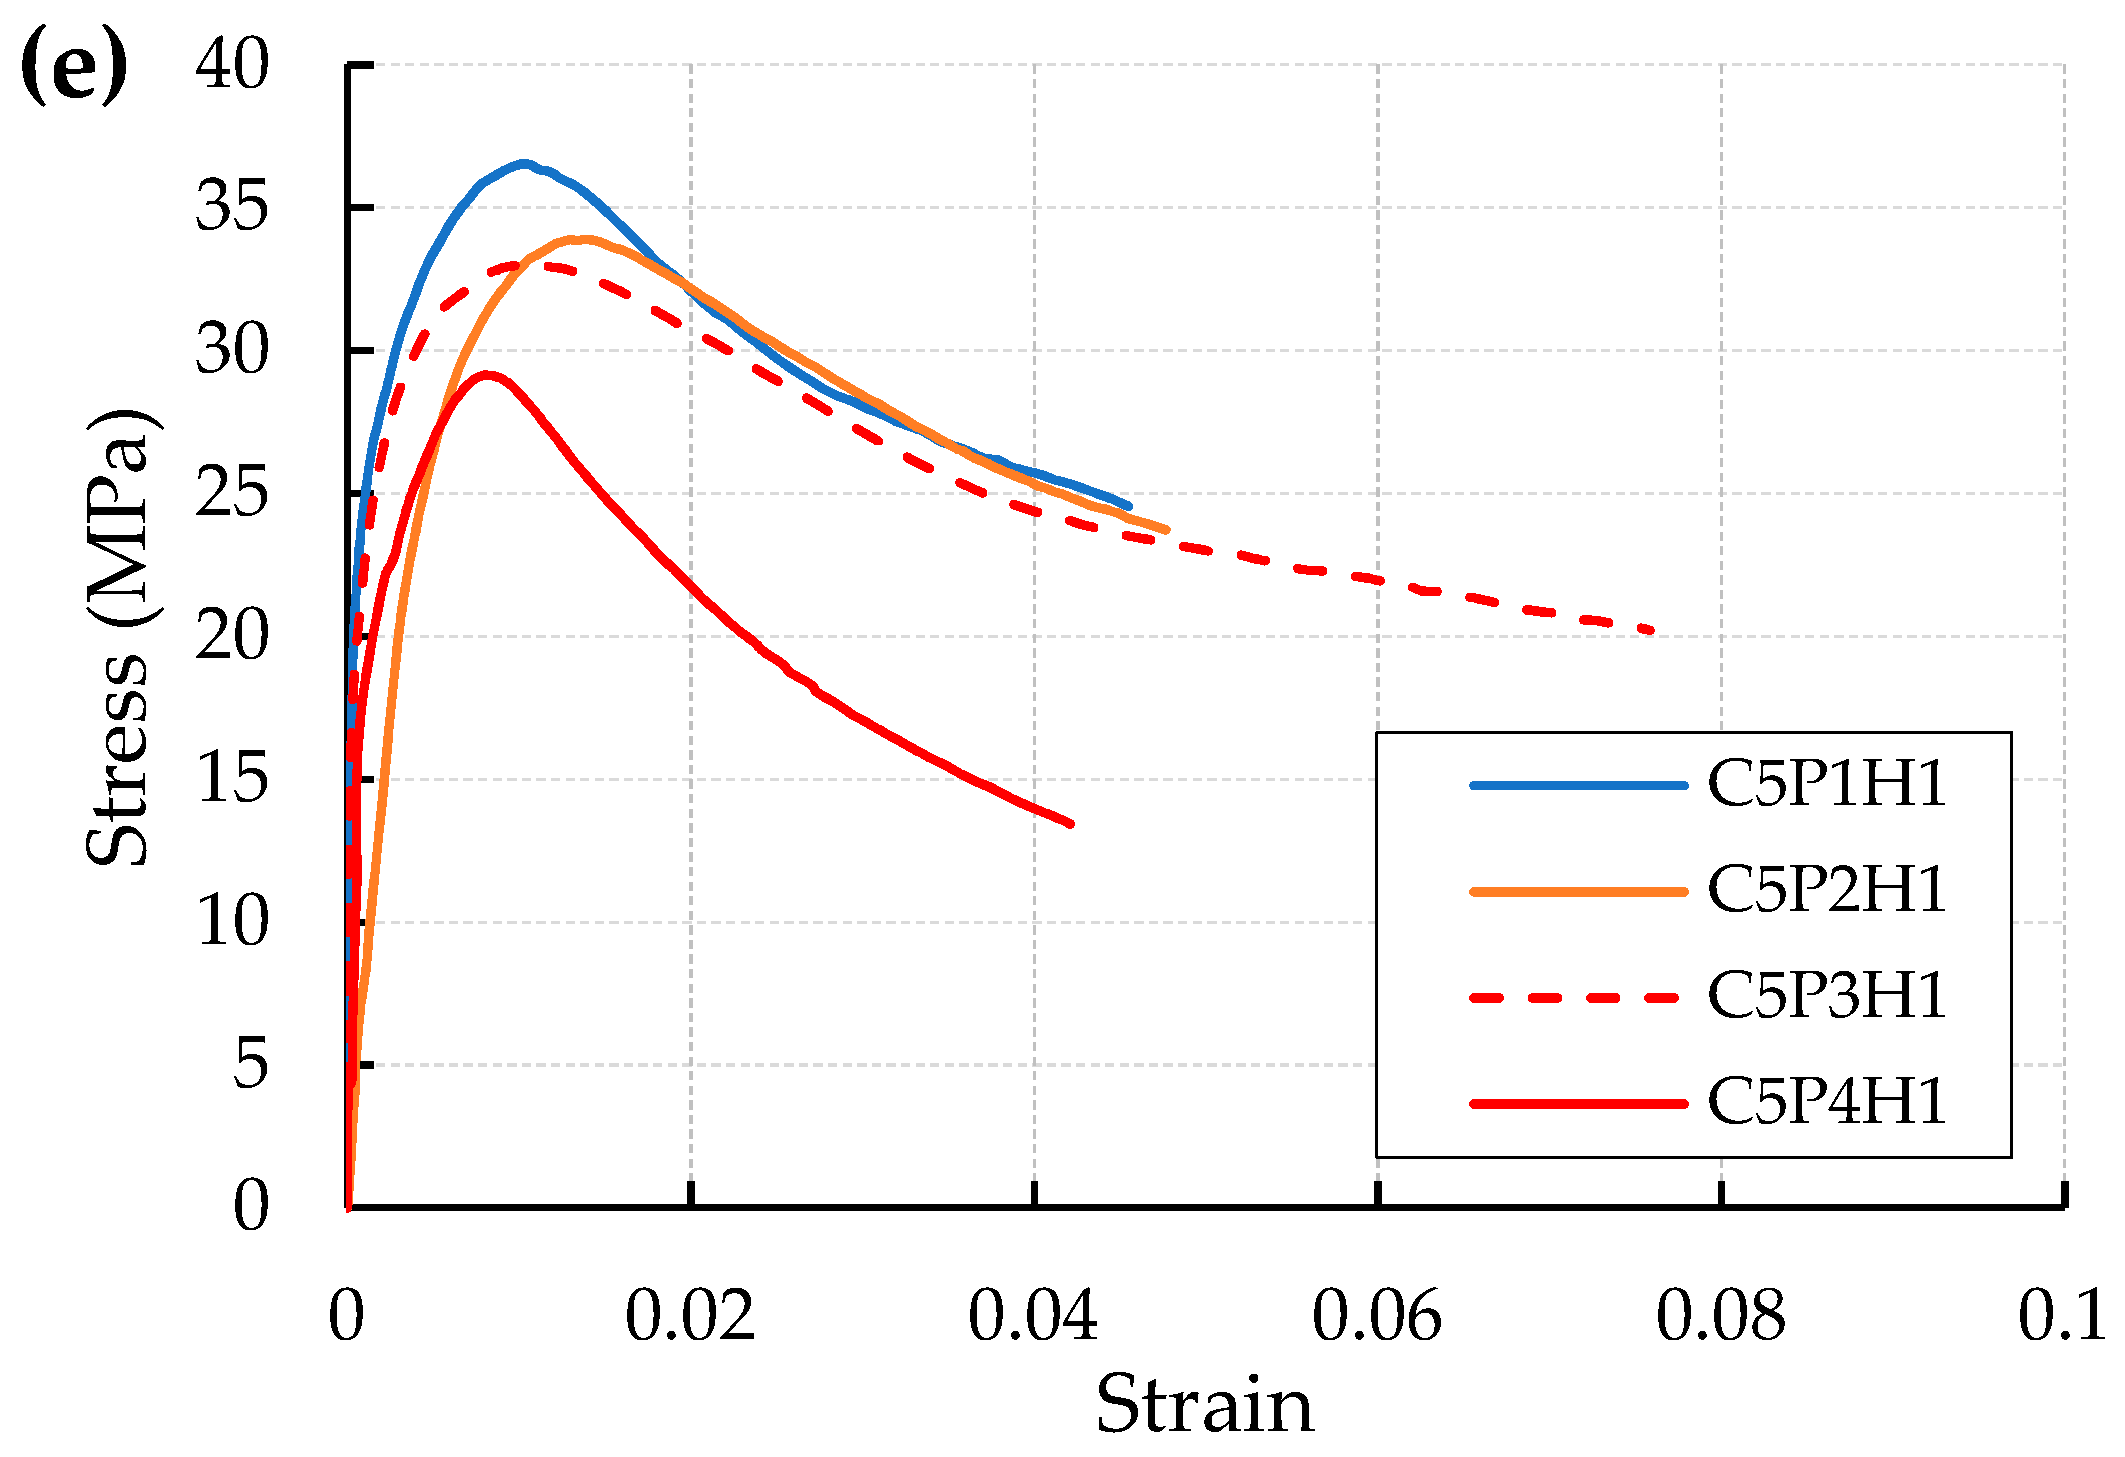
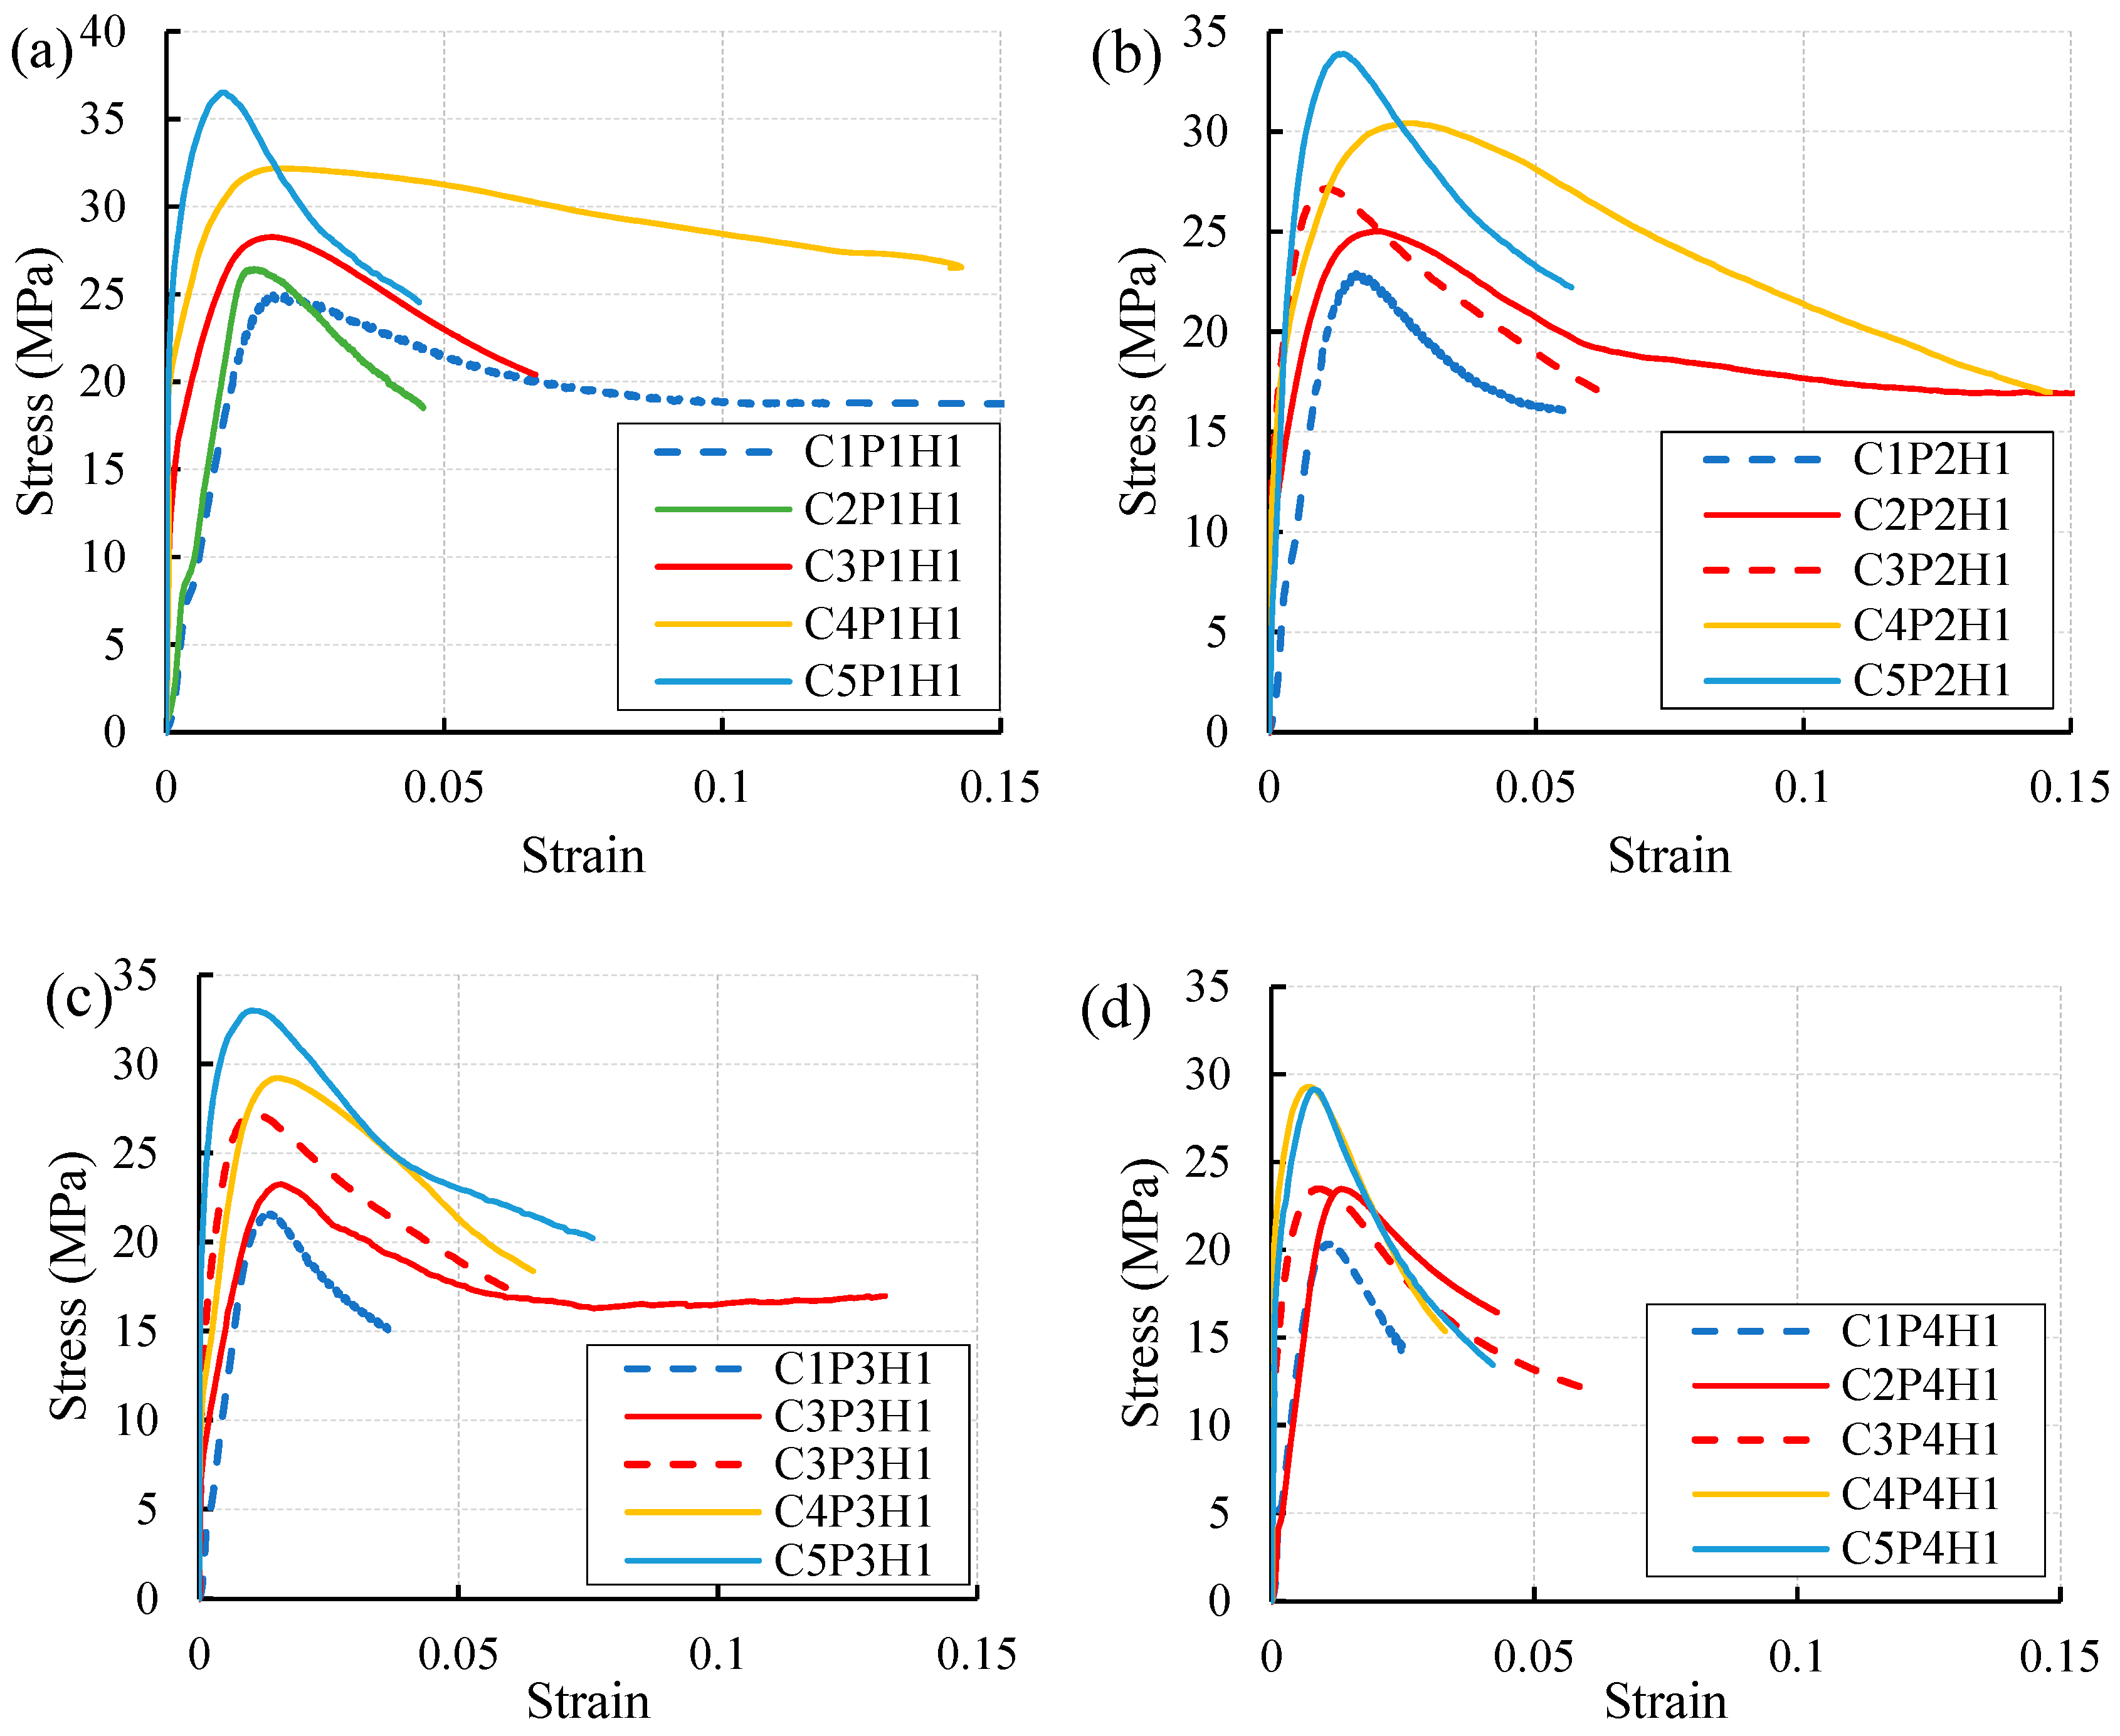
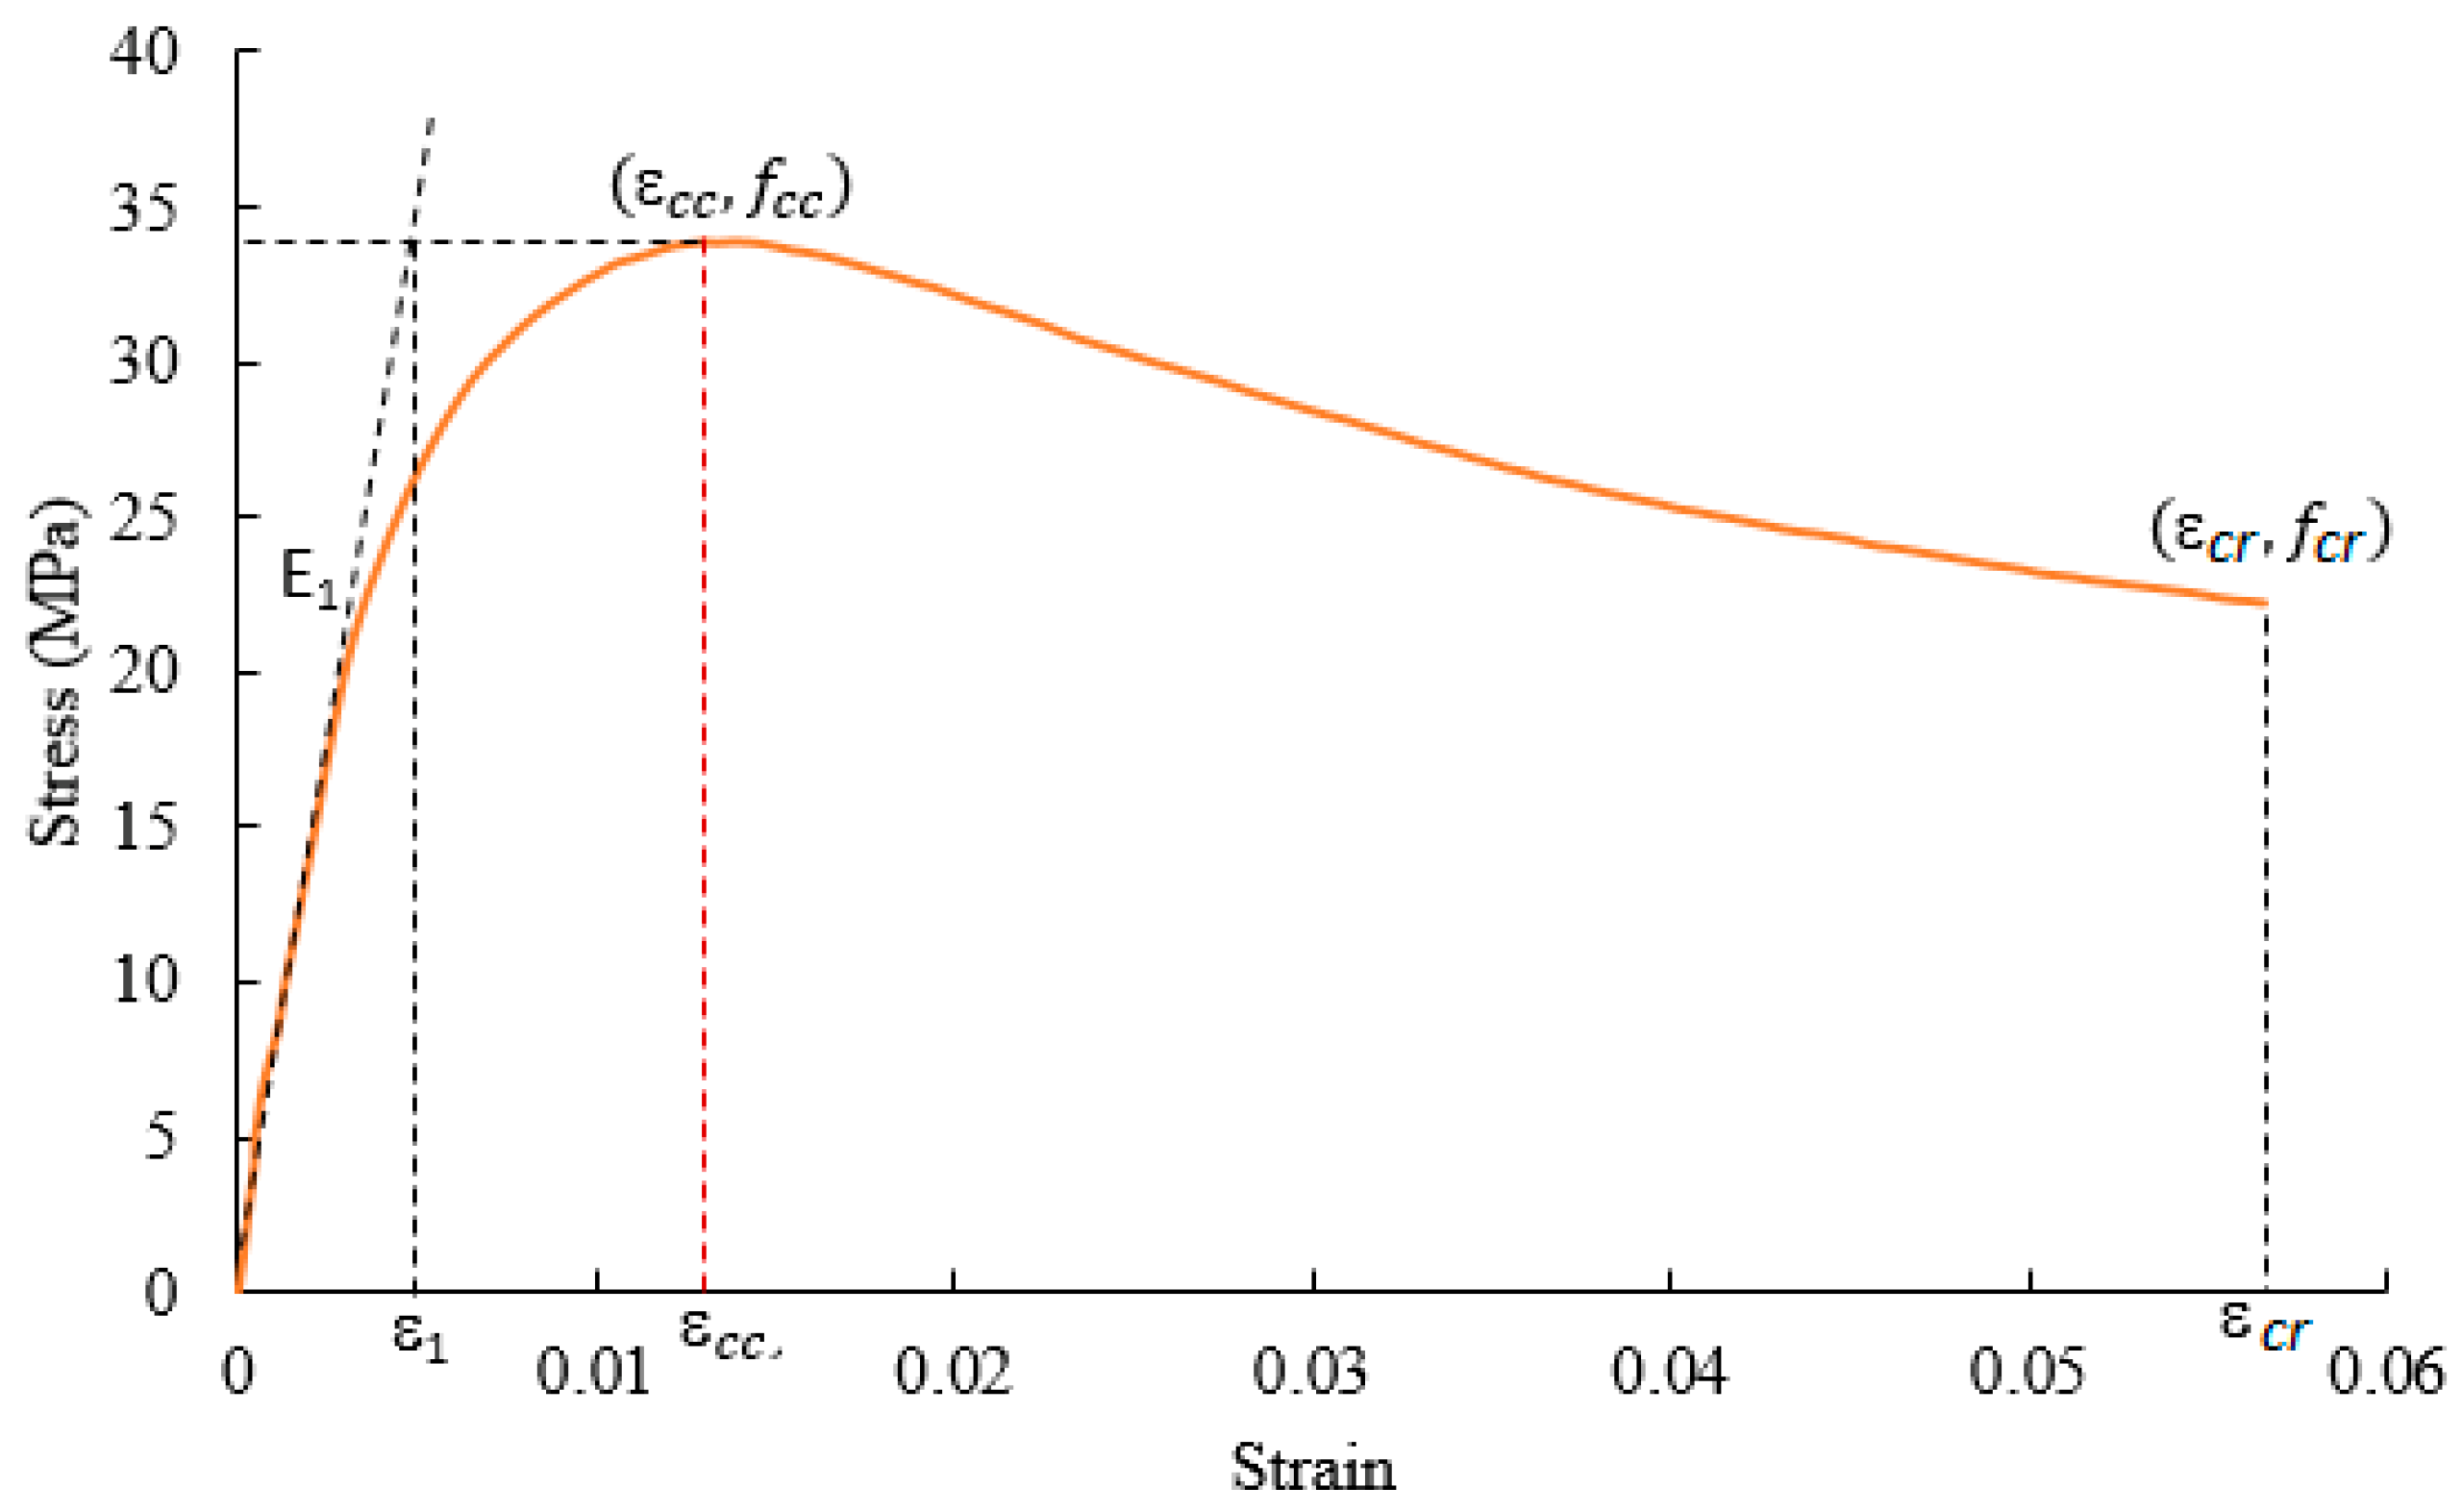
3.6. Stress-Strain Relation
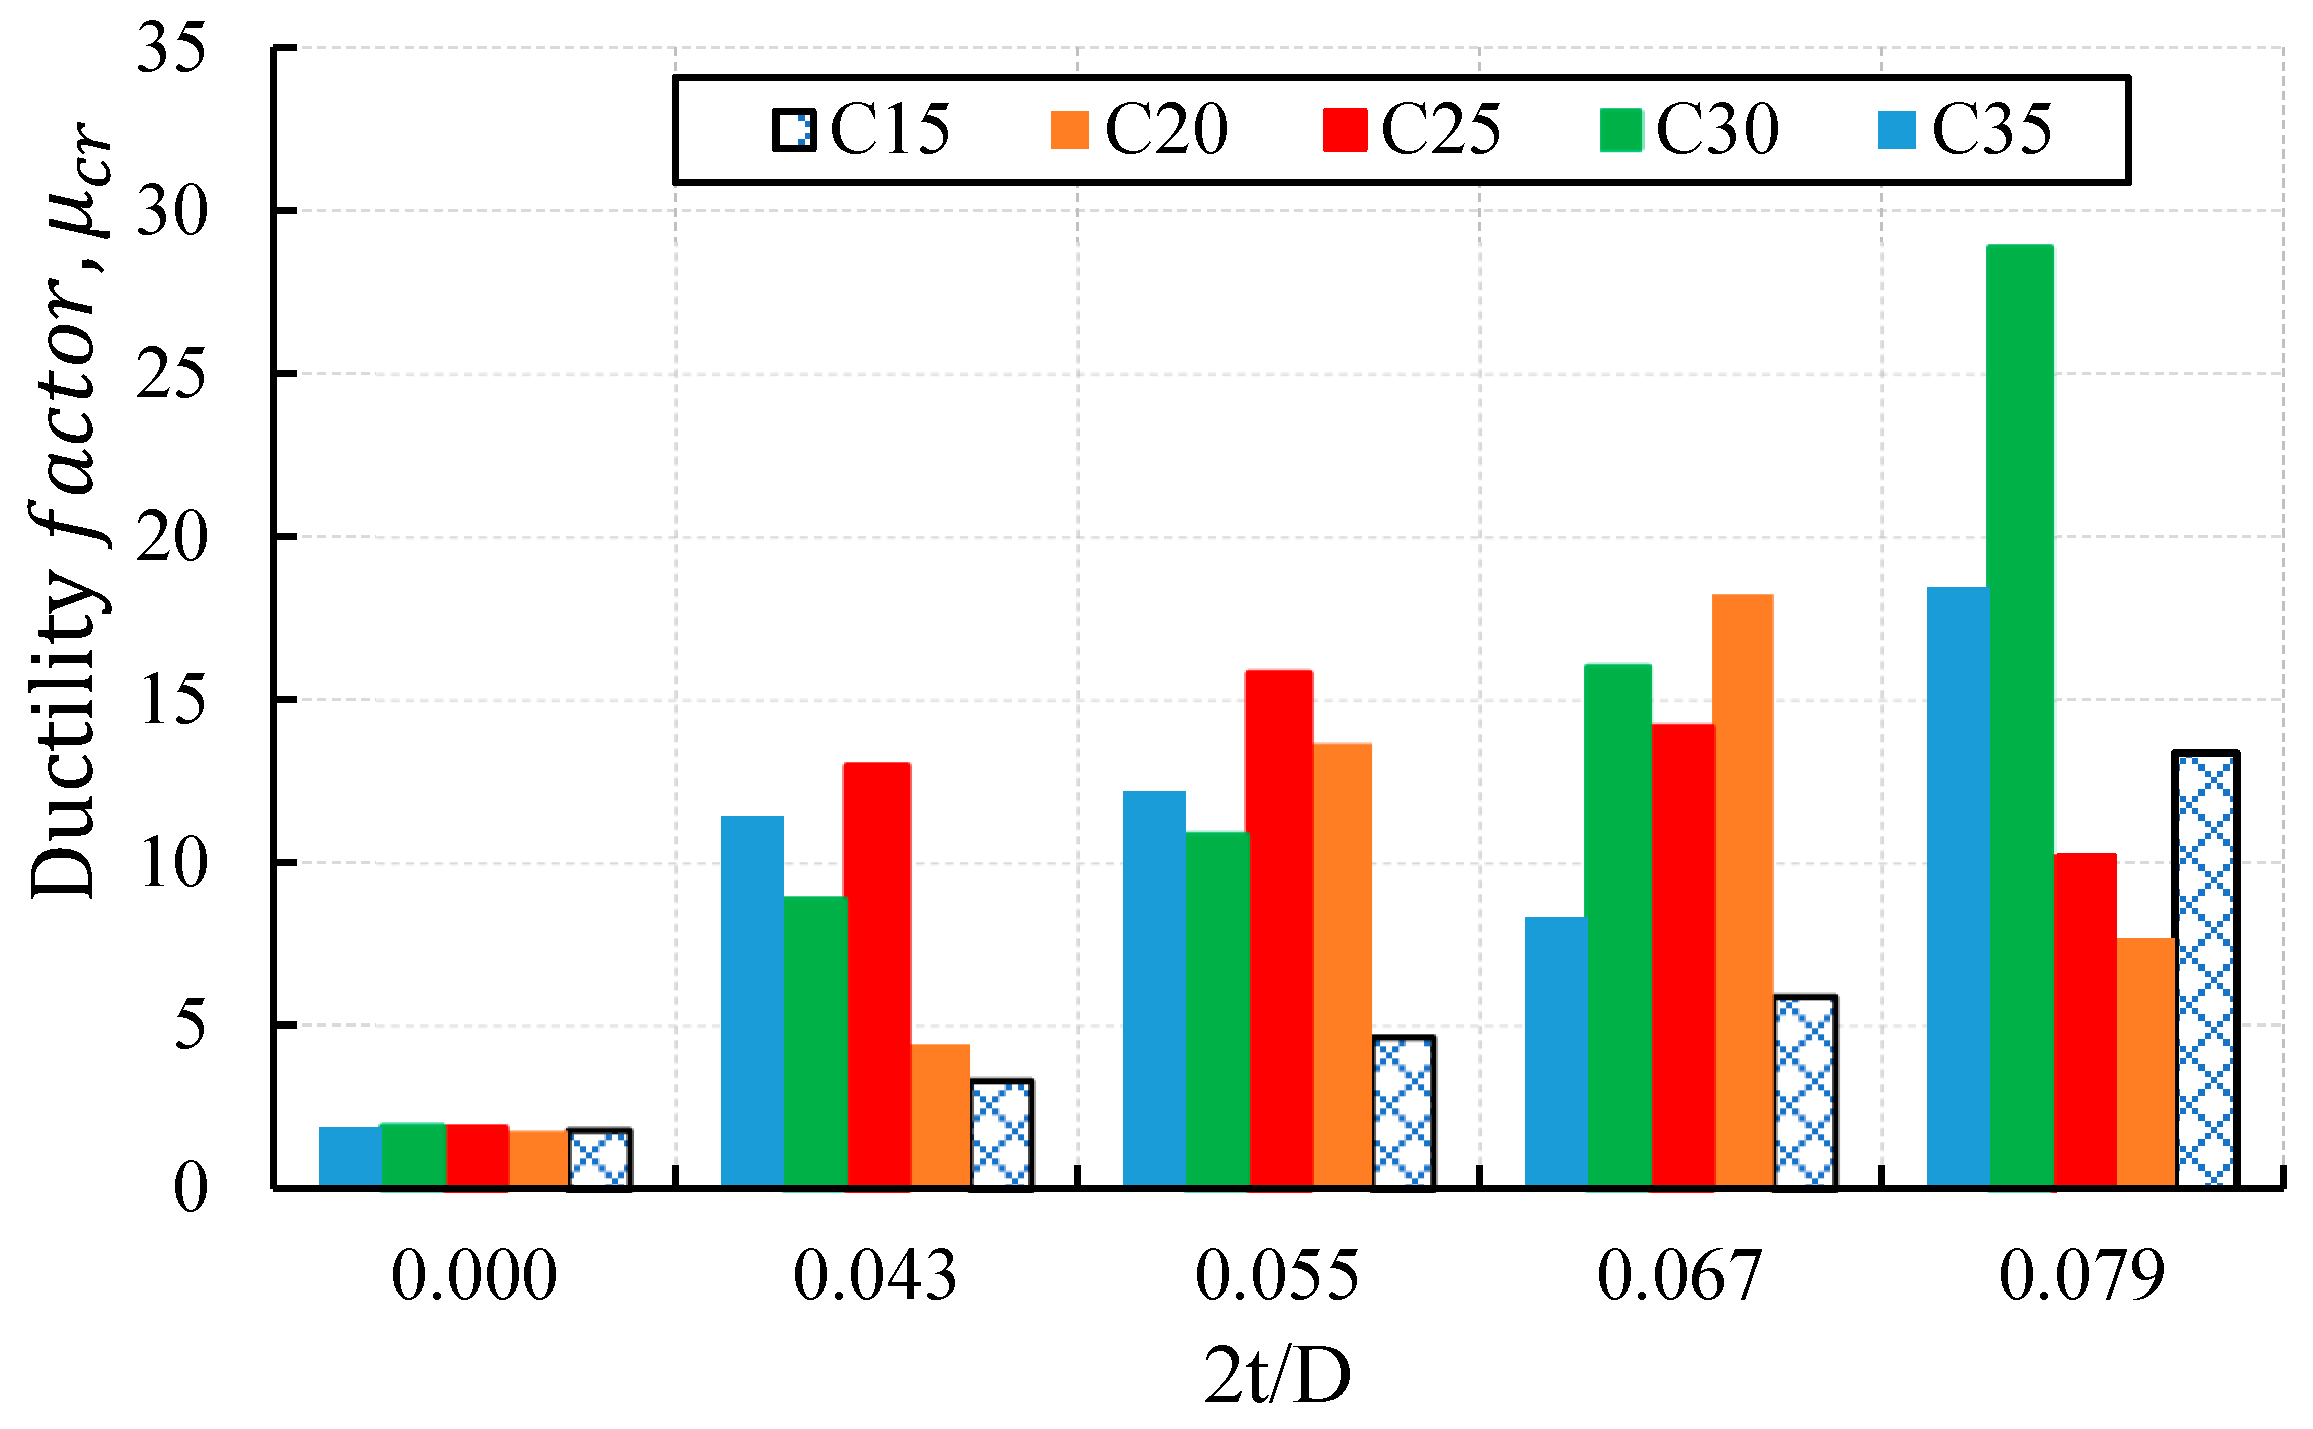
3.6.1. Ductility Factor
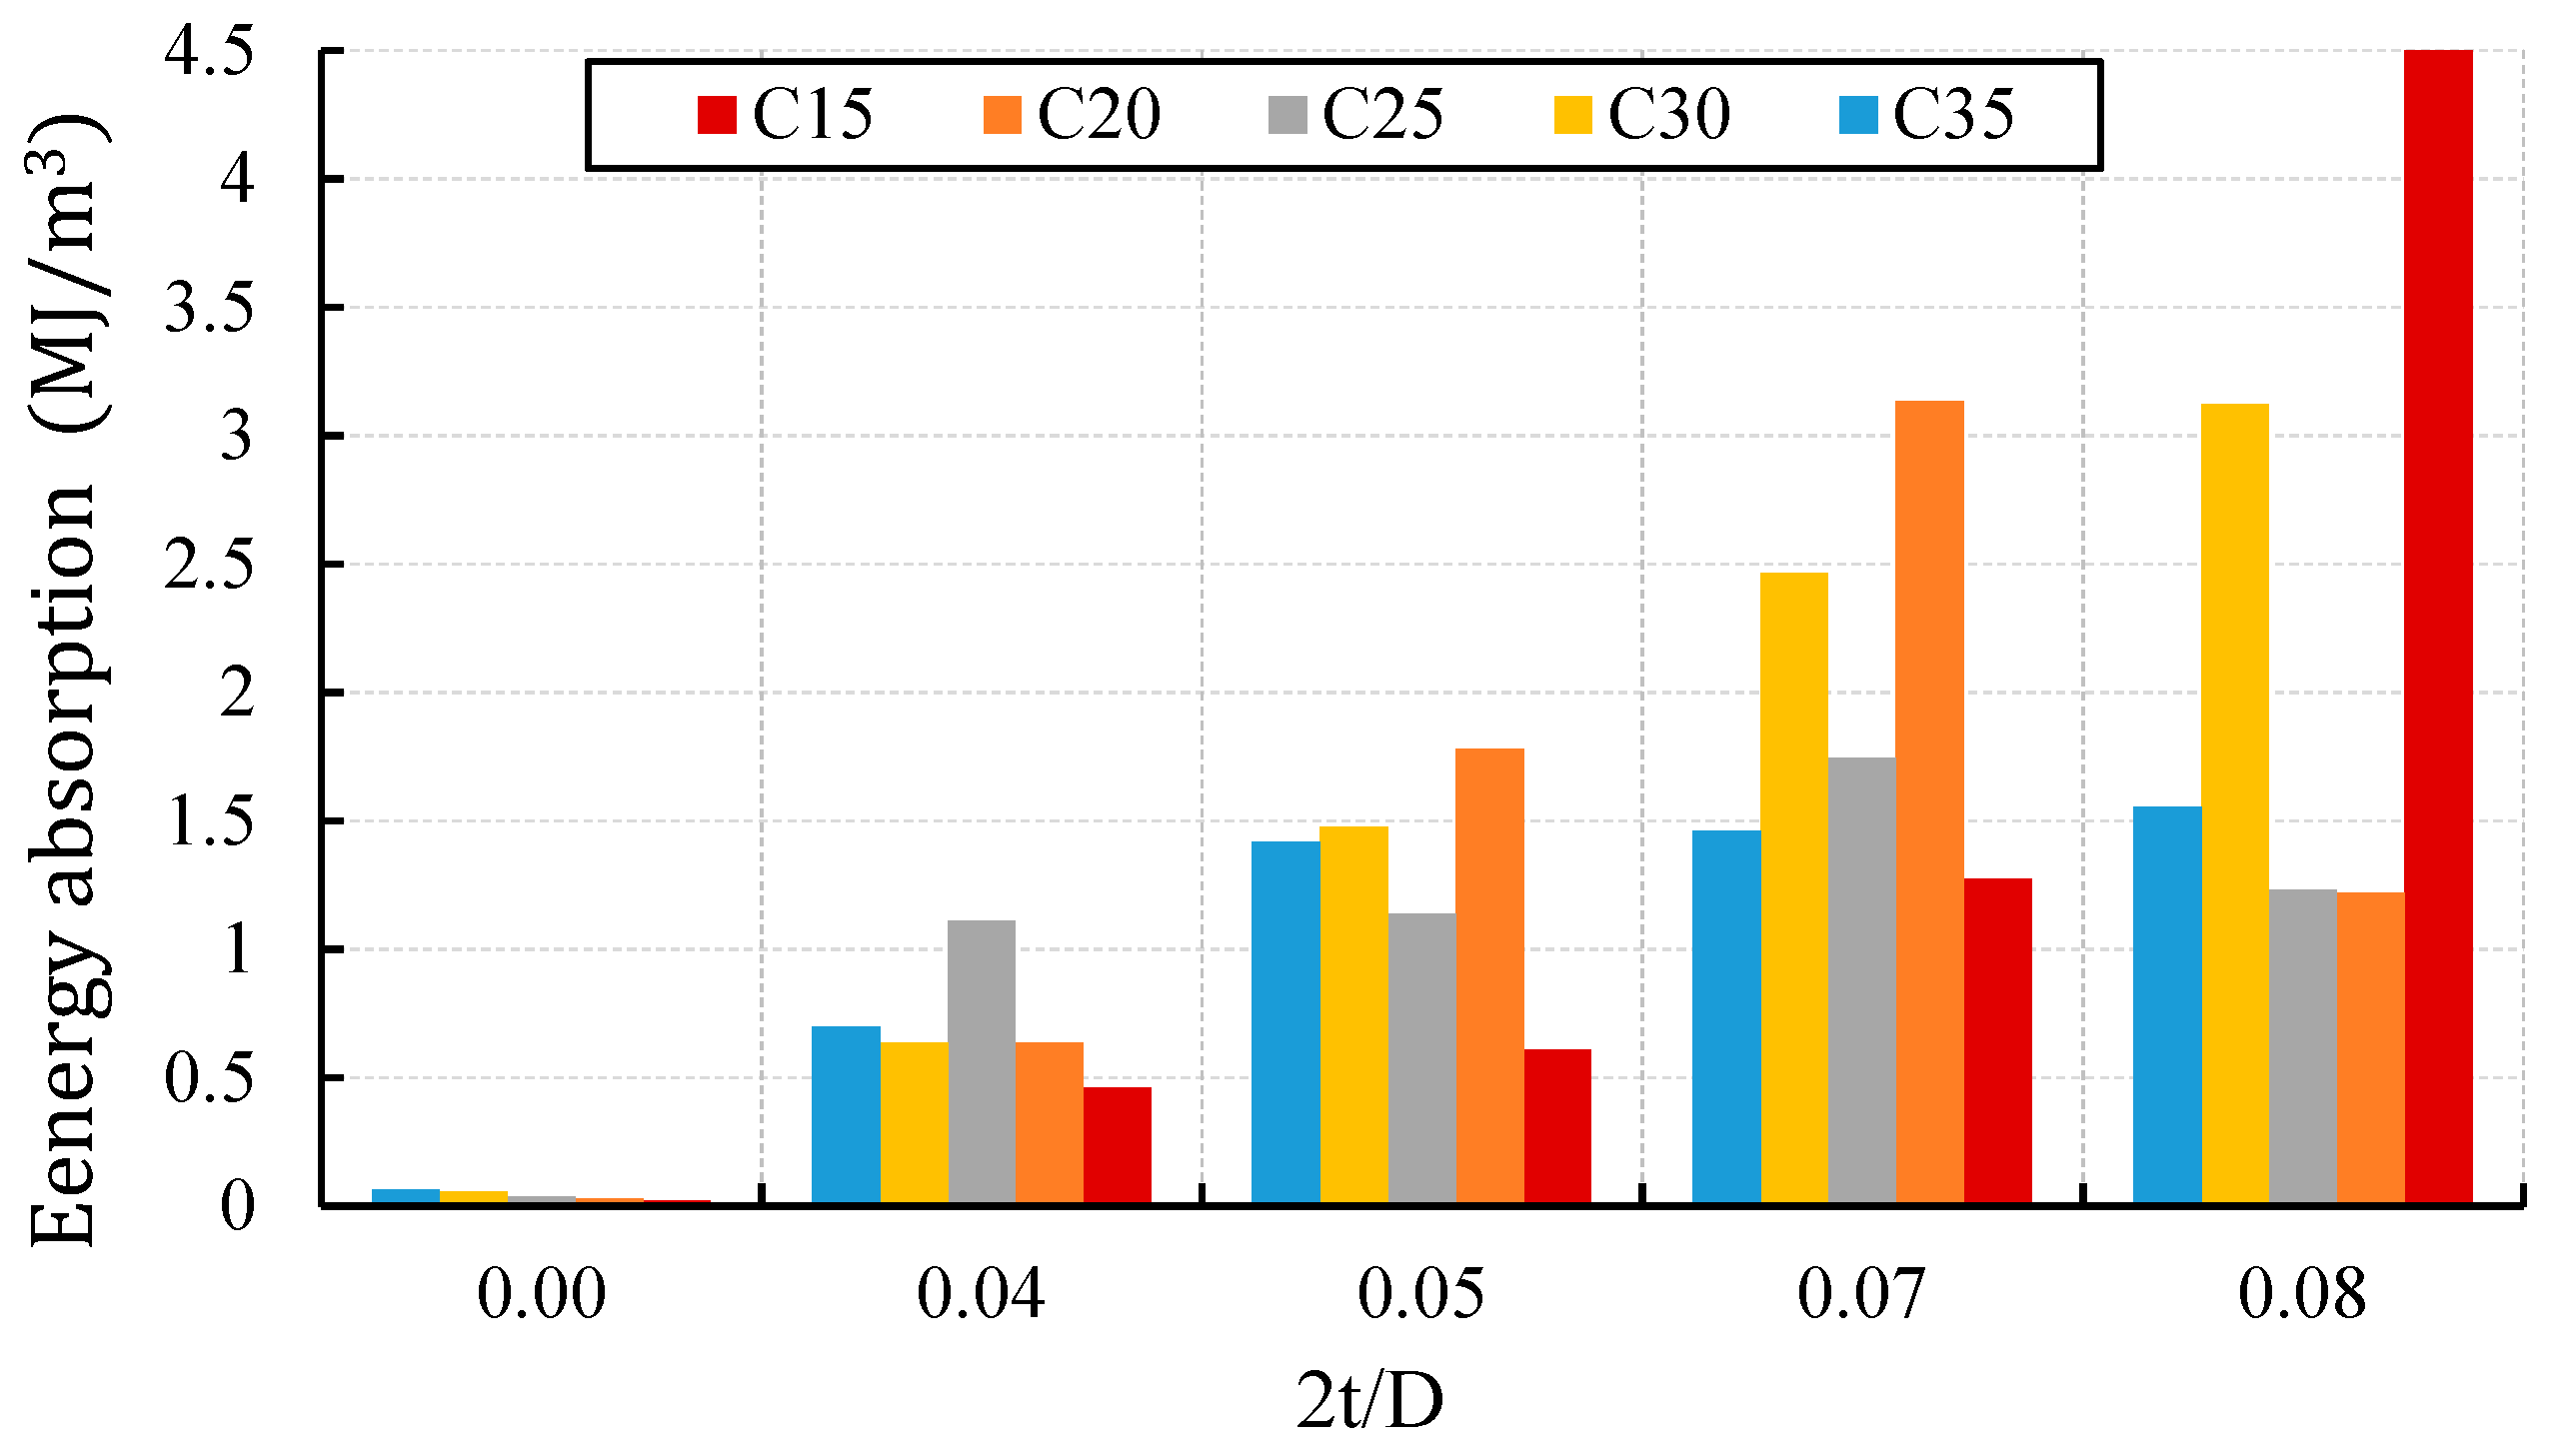
3.6.2. Energy Absorption Capacity
3.6.3. Work Index
3.7. Analytical Equations on Peak Strength and Strain
- —lateral confining pressure;
- —tensile strength of uPVC tube;
- —the confinement coefficient;
- D—the diameter of confined cylinder; and,
- t—the thickness of the uPVC tube as shown in Figure 21.
4. Conclusions
- The uPVC tube in a uPVC confined concrete equivalent cylinder significantly contributed to the axial load carrying capacity. The load carrying capacity at the confined state was 1.12–1.65 times the sum of individual carrying capacity at unconfined state. Unlike unconfined concrete, which undergoes a brittle failure after reaching a maximum load, uPVC confined concrete showed high deformation after reaching a maximum load exhibiting a ductile failure.
- The uPVC confined concrete cylinder exhibited a ductile failure with high axial deformation. The two prevalent failure modes observed were drum and shear type failure, which are dependent on the failure mode of the core concrete. The drum type failure occurred due to the expanding of core concrete at the middle from cone type failure, whereas the shear-type failure occurred due to shear failure of the core concrete.
- The uPVC tube in a uPVC confined concrete increased the strength by 1.28–2.35 times the unconfined equivalent concrete cylinder. The effectiveness of the confinement was dependent on the core concrete strength and the 2t/D ratio. The effectiveness increased as the core concrete strength decreases and the 2t/D ratio increases.
- The post-peak stress-strain behavior of uPVC confined concrete proved to be affected by the 2t/D ratio. The absolute value of the slope decreased as the 2t/D ratio increased.
- The uPVC confinement in uPVC confined concrete cylinder increased both the ductility and energy absorption. The ductility factor and energy absorption increased by 1.84–15.3 and 11–243 times of the equivalent unconfined concrete cylinder, respectively. The confinement helped the specimen to stay for a prolonged period of time without failure after reaching the maximum load. In addition, the uPVC confinement helped the material to undergo straining beyond the elastic state without failure for a prolonged period of time when compared to the unconfined concrete cylinder.
Author Contributions
Funding
Conflicts of Interest
Nomenclature
| Energy Absorption Capacity | Unconfined compressive strength | ||
| uPVC | Unplasticized polyvinyl chloride | Confined compressive strength | |
| t | Thickness | Work index | |
| RC | Reinforced concrete | uPVC tube Load-carrying Capacity | |
| PVC | Polyvinyl chloride | Unconfined Load carrying capacity | |
| h | height | Confined load carrying Capacity | |
| FRP | Fiber reinforced polymer | unconfined concrete energy absorption capacity | |
| D | Diameter | Confined concrete energy absorption capacity | |
| Principal stresses | Strain at failure load | ||
| Ductility factor | strain at max strength of Unconfined concrete | ||
| Confinement Coefficient | strain at max strength of Confined concrete | ||
| Yield stress of uPVC | Elastic strain at max strength | ||
| Lateral confining pressure |
References
- Alves, L.M.; Martins, P.A.F. Cold expansion and reduction of thin-walled PVC tubes using a die. J. Mater. Process. Technol. 2009, 209, 4229–4236. [Google Scholar] [CrossRef]
- Abdulla, N.A. Concrete filled PVC tube: A review. Constr. Build. Mater. 2017, 156, 321–329. [Google Scholar] [CrossRef]
- Oyawa, W.O.; Gathimba, N.K.; Geoffrey, N.M. Innovative composite concrete filled plastic tubes in compression. In Proceedings of the 2015 World Congress on Advances in Structural Engineering and Mechanics (ASEM15), Incheon, Korea, 25–29 August 2015; pp. 1–15. [Google Scholar]
- Fakharifar, M.; Chen, G. Compressive behavior of FRP-confined concrete-filled PVC tubular columns. Compos. Struct. 2016, 141, 91–109. [Google Scholar] [CrossRef]
- Oyawa, W.O.; Gathimba, N.K.; Mang’uriu, G.N. Structural response of composite concrete filled plastic tubes in compression. Steel Compos. Struct. 2016, 21, 589–604. [Google Scholar] [CrossRef]
- Gathimba, K.N.; Oyawa, W.O.; Mang’uriu, G.N. Performance of UPVC Pipe Confined Concrete Columns in Compression. MSc. Thesis, Jomo Kenyatta University of Agriculture and Technology, Juja, Kenya, 2015. [Google Scholar]
- Gupta, P.K. Confinement of concrete columns with unplasticized Poly-vinyl chloride tubes. Int. J. Adv. Struct. Eng. 2013, 5, 1–8. [Google Scholar] [CrossRef]
- Gupta, P.K.; Verma, V.K. Study of concrete-filled unplasticized poly-vinyl chloride tubes in marine environment. Proc. Inst. Mech. Eng. Part M J. Eng. Marit. Environ. 2014, 230, 229–240. [Google Scholar] [CrossRef]
- Fakharifar, M.; Chen, G. FRP-confined concrete filled PVC tubes: A new design concept for ductile column construction in seismic regions. Constr. Build. Mater. 2017, 130, 1–10. [Google Scholar] [CrossRef]
- Ranney, T.; Parker, L. Susceptibility of ABS, FEP, FRE, FRP, PTFE, and PVC Well Casing to Degradation by Chemicals; US Army Corps of Engineers (Report No. 195-1); USACE: Washington, DC, USA, 1995; Available online: https://usace.contentdm.oclc.org/digital/collection/p266001coll1/id/6165/ (accessed on 5 December 2018).
- Folkman, S. Validation of the long life of PVC pipes. In Proceedings of the 17th Plastic Pipes Conference, Chicago, IL, USA, 22–24 September 2014; pp. 1–9. [Google Scholar]
- Boersma, A.; Breen, J. Long term performance prediction of existing PVC water distribution systems. In Proceedings of the 9th International Conference PVC, Brighton, UK, 26–28 April 2005. [Google Scholar]
- Breen, J. Expected Lifetime of Existing Water Distribution Systems-Management Summary; TNO: The Hague, The Netherlands, 2006. [Google Scholar]
- Burn, S.; Davis, P.; Schiller, T. Long-Term Performance Prediction for PVC Pipes; Water Research Foundation: Denver, CO, USA, 2006. [Google Scholar]
- Wang, J.Y.; Yang, Q.B. Investigation on compressive behaviors of thermoplastic pipe confined concrete. Constr. Build. Mater. 2012, 35, 578–585. [Google Scholar] [CrossRef]
- Wang, J.; Yang, Q. Experimental Study on Mechanical Properties of Concrete Confined with Plastic Pipe Experimental Study on Mechanical Properties of Concrete. ACI Mater. J. 2010, 107, 132–137. [Google Scholar]
- Xue, J.; Li, H.; Zhai, L.; Ke, X.; Zheng, W.; Men, B. Analysis of mechanical behavior and influencing factors of high strength concrete columns with PVC pipe under repeated loading. J. Xi’an Univ. Archit. Technol. 2016, 48, 24–28. [Google Scholar]
- Wang, K.; Young, B. Fire resistance of concrete-filled high strength steel tubular columns. Thin-Walled Struct. 2013, 71, 46–56. [Google Scholar] [CrossRef]
- Jamaluddin, N.; Azeez, A.A.; Rahman, N.A.; Attiyah, A.N.; Ibrahim, M.W.; Mohamad, N.; Adnan, S.H. Experimental Investigation of Concrete Filled PVC Tube Columns Confined by Plain PVC Socket. In Proceedings of the MATEC Web Conference, Wuhan, China, 20–21 December 2017. [Google Scholar]
- Marzoucka, M.; Sennah, K. Concrete filled PVC tubes as compression members. In Proceedings of the International Seminar, Composite Material in Concrete Construction, Dundee, Scotland, UK, 5–6 September 2002; pp. 31–38. [Google Scholar]
- Saadoon, A.S. Experimental and Theoretical Investigation of PVC-Concrete Composite Columns. Ph.D. Thesis, University of Basrah, Basra, Iraq, 2010. [Google Scholar]
- Kurt, C.E. Concrete Filled Structural Plastic Columns. J. Struct. Div. 1978, 104, 55–63. [Google Scholar]
- British Standard Institution. BS EN 932-1 Tests for General Properties of Aggregates: Part 1. Methods for Sampling; British Standard Institution: London, UK, 1997. [Google Scholar]
- British Standard Institution. BS EN 933-1 Tests for Geometrical Properties of Aggregates Part 1: Determination of Particle Size Distribution—Sieving Method; British Standard Institution: London, UK, 2012. [Google Scholar]
- BSI Standards Ltd. BS EN 933-2 Tests for Geometrical Properties of Aggregates. Determination of Particle Size Distribution. Test Sieves, Nominal Size of Apertures; BSI Standards Ltd.: London, UK, 1996. [Google Scholar]
- BSI Standards Ltd. BS EN 1097-6 Tests for Mechanical and Physical Properties of Aggregates Part 6: Determination of Particle Density and Water Absorption; BSI Standards Ltd.: Brussels, Belgium, 2013. [Google Scholar]
- BSI Standards Ltd. BS EN 1097-5 Tests for Mechanical and Physical Properties of Aggregates Part 5. Determination of the Water Content by Drying in a Ventilated Oven; British Standards Institution (BSI): London, UK, 2008. [Google Scholar]
- European Standard. EN 197-1 Cement. Composition, Specifications and Conformity Criteria for Common Cements; European Standard: Brussels, Belgium, 2011. [Google Scholar]
- BSI Standards Ltd. BSI BS EN 206:2013: Concrete. Specification, Performance, Production and Conformity; BSI Standards Ltd.: London, UK, 2013. [Google Scholar]
- BSI Standards Ltd. BSI BS 8500-1:2006 + A1:2012 Concrete. Complementary British Standard to BS EN 206-1. Method of Specifying and Guidance for the Specifier; BSI Standards Ltd.: London, UK, 2012. [Google Scholar]
- BSI Standards Ltd. BS EN 12350-1 Testing Fresh Concrete, Part 1: Sampling Fresh Concrete; BSI Standards Ltd.: London, UK, 2009. [Google Scholar]
- BSI Standards Ltd. BS EN 12350-2 Testing Fresh Concrete, Part 2: Slump Test; BSI Standards Ltd.: London, UK, 2009. [Google Scholar]
- BSI Standards Ltd. BS EN 12350-6 Testing Fresh Concrete, Part 6: Fresh Density; BSI Standards Ltd.: London, UK, 2009. [Google Scholar]
- BSI Standards Ltd. BS 1881-103 Testing Concrete, Part 103: Method for Determination of Compacting Factor; BSI Standards Ltd.: London, UK, 1993. [Google Scholar]
- ASTM International. ASTM D638 Standard Test Method for Tensile Properties of Plastics; ASTM: West Conshohocken, PA, USA, 2014; ISBN 0521298466. [Google Scholar]
- Fakharifar, M.; Dalvand, A.; Sharbatdar, M.K.; Chen, G.; Sneed, L. Innovative hybrid reinforcement constituting conventional longitudinal steel and FRP stirrups for improved seismic strength and ductility of RC structures. Front. Struct. Civ. Eng. 2016, 10, 44–62. [Google Scholar] [CrossRef]
- Chen, Y.; Feng, R.; Xiong, L. Experimental and numerical investigations on steel-concrete-PVC SHS joints under axial compression. Constr. Build. Mater. 2016, 102, 654–670. [Google Scholar] [CrossRef]
- BSI. BSI Testing Hardened Concrete. Making and Curing Specimens for Strength Tests; BSI: London, UK, 2009; ISBN 0 580 36604 9. [Google Scholar]
- ASTM. ASTM C39/C39M-12, Standard Test Method for Compressive Strength of Cylindrical Concrete Specimens; ASTM: West Conshohocken, PA, USA, 2012; ISBN 5919881100. [Google Scholar]
- Cui, C.; Sheikh, S.A. Experimental Study of Normal- and High-Strength Concrete Confined with Fiber-Reinforced Polymers. J. Compos. Constr. 2010, 14, 553–561. [Google Scholar] [CrossRef]
- Najdanović, D.; Milosavljević, B. Strength and ductility of concrete confined circular columns. J. Croat. Assoc. Civ. Eng. 2014, 66, 417–423. [Google Scholar]
- Zhang, X.-H.; Lu, X.-B.; Zhang, L.-M.; Wang, S.-Y.; Li, Q.-P. Experimental study on mechanical properties of methane-hydrate-bearing sediments. Acta Mech. Sin. 2012, 28, 1356–1366. [Google Scholar] [CrossRef]
- Wu, Y.F. The effect of longitudinal reinforcement on the cyclic shear behavior of glass fiber reinforced gypsum wall panels: Tests. Eng. Struct. 2004, 26, 1633–1646. [Google Scholar] [CrossRef]
- Karabinis, A.I.; Rousakis, T.C. Concrete confined by FRP material: A plasticity approach. Eng. Struct. 2002, 24, 923–932. [Google Scholar] [CrossRef]
- Richart, F.; Brandtzaeg, A.; Brown, R.L. A Study of the Failure of Concrete under Combined Compressive Stresses; University of Illinois at Urbana Champaign, College of Engineering. Engineering Experiment Station: Champaign, IL, USA, 1928; Volume 26. [Google Scholar]
- Saatcioglu, B.M.; Razvi, S.R. Strength and ductility of confined concrete. J. Struct. Eng. 1992, 118, 1590–1607. [Google Scholar] [CrossRef]
- Bisby, L.A.; Dent, A.J.S.; Green, M.F. Comparison of Confinement Models for Fiber-Reinforced Polymer-Wrapped Concrete. ACI Struct. J. 2005, 102, 62–72. [Google Scholar]
- Cusson, D.; Paultre, P. Stress-Strain Model for Confined High-Strength Concrete. J. Struct. Eng. 1995, 121, 468–477. [Google Scholar] [CrossRef]
- Benzaid, R.; Mesbah, H.; Chikh, N.E. FRP-confined concrete cylinders: Axial compression experiments and strength model. J. Reinf. Plast. Compos. 2010, 29, 2469–2488. [Google Scholar] [CrossRef]
- Xiao, Q.G.; Teng, J.G.; Yu, T. Behavior and Modeling of Confined High-Strength Concrete. J. Compos. Constr. 2010, 14, 249–259. [Google Scholar] [CrossRef]


| Test Type | Specific Gravity | Bulk Density | Water Absorption | Moisture Content | Fineness Modulus |
|---|---|---|---|---|---|
| Fine Aggregate | 2.62 | 1479.96 kg/m3 | 2.42% | 0.28% | 3.65 |
| Coarse Aggregate | 2.7 | 1420 kg/m3 | 1.34% | 1.42% | |
| Standard | BS EN 1097-6: 2013 [26] | BS EN 1097-6: 2013 [26] | BS EN 1097-6: 2013 [26] | BS EN 1097-5 2008 [27] | BS EN 1097-5 2008 [27] |
| Constituent Materials | Cement | Fine Aggregate | Coarse Aggregate | Total Water |
|---|---|---|---|---|
| Units | kg/m3 | kg/m3 | kg/m3 | kg/m3 |
| C15 | 290 | 667 | 1253 | 223 |
| C20 | 325 | 632 | 1253 | 223 |
| C25 | 360 | 602 | 1247 | 222 |
| C30 | 380 | 582 | 1247 | 221 |
| C35 | 410 | 552 | 1247 | 221 |
| Fresh Property | Slump | Fresh Density | Compaction Factor |
|---|---|---|---|
| Units | mm | (kg/m3) | - |
| C15 | 60 | 2418 | 0.933 |
| C20 | 60 | 2431 | 0.932 |
| C25 | 60 | 2433 | 0.935 |
| C30 | 60 | 3438 | 0.928 |
| C35 | 60 | 2451 | 0.931 |
| Parameter | Ultimate Tensile Strength (MPa) | Young’s Modulus (GPa) | Poisson Ratio |
|---|---|---|---|
| Parallel to the Extrusion | 49.74 | 3.58 | 0.342 |
| Perpendicular to the Extrusion | 50.10 | 3.61 | 0.339 |
| Variance (%) | 0.72 | 0.84 | 0.880 |
| Parameter | Ultimate Tensile Strength (MPa) | Young’s Modulus (GPa) | Poisson Ratio |
|---|---|---|---|
| Gupta [7] | 27.50–52.00 | 3.38 | 0.380 |
| Gathimba et al. [6] | 39.96 | 3.38 | 0.380 |
| Fakharifar [36] | 50.36 | 4.03 | 0.419 |
| Alves and Martins [1] | 54.00 | 2.45 | 0.340 |
| Chen et al. [37] | 107.00 | 2.52 | 0.360 |
| Xue et al. [17] | 20.20 | 3.08 | - |
| Present study | 49.74 | 3.58 | 0.342 |
| Label | Axial Deformation at Maximum Load (mm) | Axial Deformation at Failure Load (mm) | Max.Lateral Expansion at Failure Load (mm) | |||||||
|---|---|---|---|---|---|---|---|---|---|---|
| C1P1H1 | 2.5 | 63 | 30.17 | 75.99 | 16.02 | 46.18 | 1.65 | 2.0 | 27.0 | 23.6 |
| C1P2H1 | 3 | 90 | 61.33 | 147.25 | 41.49 | 102.82 | 1.43 | 2.3 | 17.7 | 26.9 |
| C1P3H1 | 3 | 110 | 98.31 | 209.07 | 49.01 | 147.32 | 1.42 | 3.0 | 8.0 | 11.8 |
| C1P4H1 | 3 | 140 | 154.25 | 323.14 | 63.57 | 217.81 | 1.48 | 2.9 | 7.5 | 10.9 |
| C2P1H1 | 2.5 | 63 | 40.22 | 85.63 | 16.02 | 56.24 | 1.52 | 2.1 | 6.0 | 8.4 |
| C2P2H1 | 3 | 90 | 81.77 | 170.47 | 41.49 | 123.26 | 1.38 | 3.1 | 12.5 | 12.7 |
| C2P3H1 | 3 | 110 | 131.08 | 235.69 | 49.01 | 180.08 | 1.31 | 3.5 | 12.5 | 12.5 |
| C2P4H1 | 3 | 140 | 205.66 | 365.69 | 63.57 | 269.22 | 1.36 | 3.8 | 10.5 | 10.8 |
| C3P1H1 | 2.5 | 63 | 49.26 | 89.53 | 16.02 | 65.27 | 1.37 | 1.8 | 5.6 | 12.2 |
| C3P2H1 | 3 | 90 | 100.13 | 181.19 | 41.49 | 141.63 | 1.28 | 2.2 | 8.0 | 10.1 |
| C3P3H1 | 3 | 110 | 160.52 | 256.50 | 49.01 | 209.53 | 1.22 | 2.2 | 4.7 | 8.4 |
| C3P4H1 | 3 | 140 | 251.85 | 378.18 | 63.57 | 315.42 | 1.20 | 2.2 | 7.3 | 11.7 |
| C4P1H1 | 2.5 | 63 | 58.71 | 100.14 | 16.02 | 74.73 | 1.34 | 1.8 | 9.9 | 14.0 |
| C4P2H1 | 3 | 90 | 119.36 | 195.17 | 41.49 | 160.85 | 1.21 | 2.0 | 6.0 | 10.4 |
| C4P3H1 | 3 | 110 | 191.34 | 281.85 | 49.01 | 240.35 | 1.17 | 1.9 | 6.6 | 9.8 |
| C4P4H1 | 3 | 140 | 300.20 | 431.18 | 63.57 | 363.77 | 1.19 | 2.0 | 6.3 | 10.1 |
| C5P1H1 | 2.5 | 63 | 70.34 | 108.25 | 16.02 | 86.35 | 1.25 | 1.5 | 5.9 | 8.3 |
| C5P2H1 | 3 | 90 | 142.99 | 218.29 | 41.49 | 184.48 | 1.18 | 2.8 | 7.6 | 8.7 |
| C5P3H1 | 3 | 110 | 229.22 | 311.38 | 49.01 | 278.23 | 1.12 | 2.2 | 6.9 | 14.4 |
| C5P4H1 | 3 | 140 | 359.63 | 475.16 | 63.57 | 423.20 | 1.12 | 2.1 | 6.2 | 10.3 |
| Label | D (mm) | t (mm) | (MPa) | (MPa) | (mm/mm) | (mm/mm) | (mm/mm) | (mm/mm) | (MPa) | (MJ/m3) | ||||||
|---|---|---|---|---|---|---|---|---|---|---|---|---|---|---|---|---|
| C1 | 10.35 | 0.0021 | 0.0014 | 0.0024 | 1.803 | 0.019 | 2.650 | 1.000 | ||||||||
| C1P1H1 | 63 | 2.5 | 24.38 | 0.0183 | 0.01 | 0.1335 | 2.356 | 8.946 | 4.397 | 3.192 | 13.350 | 4.499 | 36.915 | 243.145 | ||
| C1P2H1 | 90 | 3 | 23.08 | 0.0137 | 0.0095 | 0.056 | 2.231 | 6.699 | 3.643 | 3.496 | 5.895 | 1.274 | 11.617 | 68.820 | ||
| C1P3H1 | 110 | 3 | 22.00 | 0.0153 | 0.008 | 0.03725 | 2.127 | 7.458 | 2.942 | 3.961 | 4.656 | 0.608 | 6.910 | 32.862 | ||
| C1P4H1 | 140 | 3 | 20.99 | 0.0107 | 0.008 | 0.0265 | 2.029 | 5.234 | 2.284 | 4.662 | 3.313 | 0.460 | 5.474 | 24.840 | ||
| C2 | 13.79 | 0.0026 | 0.0016 | 0.0029 | 1.790 | 0.028 | 2.509 | 1.000 | ||||||||
| C2P1H1 | 63 | 2.5 | 27.47 | 0.0133 | 0.0085 | 0.065 | 1.992 | 5.217 | 4.397 | 3.111 | 7.647 | 1.221 | 10.461 | 44.113 | ||
| C2P2H1 | 90 | 3 | 26.80 | 0.0181 | 0.008 | 0.146 | 1.943 | 7.115 | 3.643 | 3.570 | 18.250 | 3.134 | 29.235 | 113.192 | ||
| C2P3H1 | 110 | 3 | 24.93 | 0.0184 | 0.0095 | 0.13 | 1.808 | 7.216 | 2.942 | 3.786 | 13.684 | 1.779 | 15.023 | 64.264 | ||
| C2P4H1 | 140 | 3 | 23.76 | 0.0147 | 0.0090 | 0.04 | 1.722 | 5.778 | 2.284 | 4.363 | 4.444 | 0.636 | 5.951 | 22.980 | ||
| C3 | 16.89 | 0.0029 | 0.0017 | 0.0033 | 1.896 | 0.038 | 2.620 | 1.000 | ||||||||
| C3P1H1 | 63 | 2.5 | 28.72 | 0.0138 | 0.0055 | 0.056 | 1.700 | 4.826 | 4.397 | 2.691 | 10.182 | 1.230 | 15.570 | 32.217 | ||
| C3P2H1 | 90 | 3 | 28.48 | 0.0161 | 0.00525 | 0.0745 | 1.686 | 5.635 | 3.643 | 3.181 | 14.190 | 1.744 | 23.334 | 45.698 | ||
| C3P3H1 | 110 | 3 | 26.99 | 0.0098 | 0.00325 | 0.0515 | 1.598 | 3.433 | 2.942 | 3.432 | 15.846 | 1.138 | 25.949 | 29.815 | ||
| C3P4H1 | 140 | 3 | 24.57 | 0.0094 | 0.005 | 0.065 | 1.454 | 3.316 | 2.284 | 3.361 | 13.000 | 1.110 | 18.066 | 29.067 | ||
| C4 | 20.13 | 0.0031 | 0.0019 | 0.0035 | 1.885 | 0.054 | 2.884 | 1.000 | ||||||||
| C4P1H1 | 63 | 2.5 | 32.13 | 0.0159 | 0.004 | 0.1155 | 1.596 | 5.227 | 4.397 | 2.727 | 28.875 | 3.122 | 48.599 | 58.137 | ||
| C4P2H1 | 90 | 3 | 30.68 | 0.0221 | 0.0065 | 0.104 | 1.524 | 7.239 | 3.643 | 2.895 | 16.000 | 2.465 | 24.720 | 45.890 | ||
| C4P3H1 | 110 | 3 | 29.66 | 0.0129 | 0.006 | 0.065 | 1.473 | 4.225 | 2.942 | 3.238 | 10.833 | 1.477 | 16.602 | 27.507 | ||
| C4P4H1 | 140 | 3 | 28.01 | 0.0072 | 0.0035 | 0.031 | 1.391 | 2.373 | 2.284 | 3.449 | 8.857 | 0.634 | 12.933 | 11.804 | ||
| C5 | 24.12 | 0.0033 | 0.0020 | 0.0037 | 1.849 | 0.064 | 2.634 | 1.000 | ||||||||
| C5P1H1 | 63 | 2.5 | 34.73 | 0.0097 | 0.0035 | 0.0645 | 1.440 | 2.983 | 4.397 | 2.412 | 18.429 | 1.556 | 25.613 | 24.497 | ||
| C5P2H1 | 90 | 3 | 34.31 | 0.0154 | 0.007 | 0.058 | 1.423 | 4.726 | 3.643 | 2.798 | 8.286 | 1.460 | 12.161 | 22.987 | ||
| C5P3H1 | 110 | 3 | 32.77 | 0.0118 | 0.0045 | 0.05475 | 1.358 | 3.640 | 2.942 | 2.939 | 12.167 | 1.419 | 27.834 | 32.297 | ||
| C5P4H1 | 140 | 3 | 30.87 | 0.0080 | 0.00325 | 0.037 | 1.280 | 2.451 | 2.284 | 2.955 | 11.385 | 0.697 | 13.894 | 10.968 |
| Concrete Class | 2t/D | Cylinder Strength (MPa) | Determination Coefficient (R2) | Correlation Coefficient (R) |
|---|---|---|---|---|
| C15 | 0 | 10.50 | 0.936 | 0.967 |
| 0.043 | 18.81 | 0.936 | 0.967 | |
| 0.055 | 21.08 | 0.936 | 0.967 | |
| 0.067 | 23.43 | 0.936 | 0.967 | |
| 0.079 | 25.89 | 0.936 | 0.967 | |
| C20 | 0 | 14.00 | 0.955 | 0.977 |
| 0.043 | 22.09 | 0.955 | 0.977 | |
| 0.055 | 24.30 | 0.955 | 0.977 | |
| 0.067 | 26.59 | 0.955 | 0.977 | |
| 0.079 | 28.98 | 0.955 | 0.977 | |
| C25 | 0 | 17.00 | 0.965 | 0.982 |
| 0.043 | 24.07 | 0.965 | 0.982 | |
| 0.055 | 25.99 | 0.965 | 0.982 | |
| 0.067 | 27.99 | 0.965 | 0.982 | |
| 0.079 | 30.09 | 0.965 | 0.982 | |
| C30 | 0 | 20.00 | 0.973 | 0.986 |
| 0.043 | 27.01 | 0.973 | 0.986 | |
| 0.055 | 28.92 | 0.973 | 0.986 | |
| 0.067 | 30.91 | 0.973 | 0.986 | |
| 0.079 | 32.98 | 0.973 | 0.986 | |
| C35 | 0 | 24.00 | 0.973 | 0.986 |
| 0.043 | 30.37 | 0.973 | 0.986 | |
| 0.055 | 32.10 | 0.973 | 0.986 | |
| 0.067 | 33.91 | 0.973 | 0.986 | |
| 0.079 | 35.79 | 0.973 | 0.986 |
| Source | Peak Strength | AAE (%) | Strain | AAE (%) |
|---|---|---|---|---|
| Cusson and Paultre [48] | 7.4 | 48.0 | ||
| Sastcioglu and Razvi [46] | 26.0 | 57.5 | ||
| Richart et al. [45] | 10.6 | 19.3 | ||
| Benzaid et al. [49] | 13.1 | 29.3 | ||
| Bisby et al. [47] | 5.3 | 41.1 | ||
| Xiao et al. [50] | 13.9 | 21.4 | ||
| Present study | 1.8 | 16.7 |
© 2019 by the authors. Licensee MDPI, Basel, Switzerland. This article is an open access article distributed under the terms and conditions of the Creative Commons Attribution (CC BY) license (http://creativecommons.org/licenses/by/4.0/).
Share and Cite
Woldemariam, A.M.; Oyawa, W.O.; Nyomboi, T. Structural Performance of uPVC Confined Concrete Equivalent Cylinders Under Axial Compression Loads. Buildings 2019, 9, 82. https://doi.org/10.3390/buildings9040082
Woldemariam AM, Oyawa WO, Nyomboi T. Structural Performance of uPVC Confined Concrete Equivalent Cylinders Under Axial Compression Loads. Buildings. 2019; 9(4):82. https://doi.org/10.3390/buildings9040082
Chicago/Turabian StyleWoldemariam, Abraham Mengesha, Walter O. Oyawa, and Timothy Nyomboi. 2019. "Structural Performance of uPVC Confined Concrete Equivalent Cylinders Under Axial Compression Loads" Buildings 9, no. 4: 82. https://doi.org/10.3390/buildings9040082
APA StyleWoldemariam, A. M., Oyawa, W. O., & Nyomboi, T. (2019). Structural Performance of uPVC Confined Concrete Equivalent Cylinders Under Axial Compression Loads. Buildings, 9(4), 82. https://doi.org/10.3390/buildings9040082