1. Introduction
Since its adoption by large corporations, open-plan offices have received their fair share of criticism. Anecdotal evidence of the failures of open-plan offices coming from all corners of the industry has accumulated over the decades, and there is little doubt about the polarizing effect that the concept has among workers. Within academia, several research publications have been devoted to the topic, and this number is on the rise—a search on Scopus shows that the number of papers published with “open-plan office” as part of the title, abstract, or keywords in 2018 (n = 60) was 15 times higher than in 1999 (n = 4). When organized by the number of citations, in the top 30 papers published since 1999, the most common focus of investigations in decreasing order was indoor environmental quality (IEQ) (excluding acoustics), acoustics, and way of working.
When it comes to indoor environmental quality (excluding acoustics), the most highly cited papers found on our Scopus search mapped issues around personal control [
1], lighting [
2,
3], exposure to daylight [
4], and control systems and technology [
5,
6,
7]. Some of these papers also attempted to understand links between IEQ and satisfaction [
8,
9,
10], performance/perceived productivity [
2,
11], job satisfaction [
12], and energy conservation [
13]. Combined, the papers have consolidated a significant body of knowledge about occupants’ dissatisfaction indoors. A combination of methods, including subjective questionnaires and objective measurements in situ, has been deployed when evaluating occupants’ perception and indoor environmental quality performance. Perceived productivity within workspaces has also been extensively documented. What these papers normally overlook is the physical configuration of the space where the data was collected, with open-plan being used as a blanket term to describe workspaces, which has limited the ability to understand how specific interior design features may, if at all, be linked to poor satisfaction results found in subjective and/or objective assessments.
For acoustics, the most highly cited papers were devoted to understanding issues around balancing privacy and communication [
14,
15], speech intelligibility [
16], and predictive models [
17], which were noted as well-known weaknesses of open-plan offices. Papers have also been aimed at proposing new measurement methods [
18] as well as linking noise with performance [
19,
20,
21] and concentration levels [
22] in open-plan offices. Recent research on acoustic-related issues is undoubtedly promising, especially when considering that this IEQ dimension has been strongly linked to major productivity losses in open-plan offices. A move from traditional lab-based experiments to research conducted in situ is also noted, which is necessary, considering the several confounding variables influencing occupants’ perception indoors. Research on partitions and other physical and non-physical barriers to assist with poor-acoustic performance has also been welcomed by academia and industry. On this point, investigating interior design seems like a logical step in this field of research, especially its strategic use to address acoustic-related issues in open-plan offices.
When shifting the attention to the way of working, most highly-cited papers focused on the flexible office [
23], configuration of the space [
24], employees’ attitudes [
25], and coworking [
26]. This fascinating field of research, although not new, has been gaining momentum in academia and industry due to the significant changes observed in corporate real estate worldwide over the last decade. Perhaps, out of the three most highly cited papers investigated here, way of working is the topic with stronger links and evidence in terms of the design of offices. That said, traditionally, research published within this field shows a heavy reliance on one-off case studies within one organization, which has limited the possibility of in-depth investigations and generalization of results.
The majority of papers found in this Scopus search point to several shortcomings of open-plan offices, sometimes suggesting solutions to address dissatisfaction. However, only a few have attempted to explore key drivers behind occupants’ satisfaction and how open-plan offices can be improved, if at all, to achieve this goal. With the rapidly increasing numbers of people working in open-plan offices every day around the globe, it is time to focus on harvesting evidence from success stories, with the intention of potentially replicating solutions that have yielded high-satisfaction results. To this end, this study aimed to identify key drivers behind workers’ satisfaction, perceived productivity, and health while at the same time identifying critical physical environment-related features shared by high-performance, open-plan offices. To this end, this paper reports findings from a total of 8827 post-occupancy evaluation (POE) surveys conducted in 61 high-end offices in Australia. This database-level enquiry led to a detailed analysis of a subset of 18 high-performance workspaces (n = 1949). Results from data collected during site visits and fit-out specific features plus floor plan analysis of the offices were also included, providing the context needed to understand design-related choices shared by the subset of high-performance offices. By combining occupant survey responses with fit-out information, this paper aims to push the industry towards workspace design solutions that are adequate for open-plan, high-performance offices.
2. Materials and Methods
This paper presents results from research investigations conducted in Australian open-plan offices under the SHE (Sustainable and Healthy Environments) umbrella. This research platform focuses on how the design of indoor and outdoor environments can be harnessed to deliver satisfaction, health, and productivity. This multidisciplinary platform brings together experts from architecture, IT, and health science to develop collaborative investigations in Australian indoor and outdoor environments.
Under the SHE umbrella and for this paper, POE surveys were conducted with the BOSSA (Building Occupant Survey System Australia) Time-Lapse tool. Developed and managed by The University of Sydney and the University of Technology Sydney, the BOSSA Time-Lapse tool is endorsed by the National Australian Built Environment Rating System (NABERS), Green Building Council of Australia (GBCA), New Zealand Green Building Council (NZGBC), and the WELL Building Standard. Organizations volunteer to use POE surveys, mostly driven by the requirements of these tools.
The POE questionnaire includes background questions addressing participants’ gender, age, type of work, time spent in buildings, workspace arrangement and modules focusing on spatial comfort, individual space, indoor air quality, thermal comfort, noise distraction and privacy, visual comfort, personal control, building image, and overall occupant satisfaction. Workers rate their satisfaction on a seven-point scale (1 = lowest rating; 4 = neutral, and 7 = highest rating). For full questionnaire details, please refer to Reference [
27]. The web-based questionnaire takes less than 15 minutes to be completed by occupants.
For this paper, results concentrate on database-level analysis of a total 8827 POE surveys collected from 61 offices. In addition to POE surveys, floor plans and fit-out specific information were also collected from all workplaces investigated, along with site-visits from researchers. Structured notes were taken about the physical configuration of the space, including the presence of use of biophilic concepts and green features, such as vertical gardens and walls. This information aimed to provide the context for the interpretation of results from the POE surveys.
Out of 47 main POE survey questions, 28 were used as input, and 3 were used as output variables for the experimentation. Survey questions used as input variables are based on the work area; spatial, visual comfort, and thermal comfort; individual space; indoor air quality; noise distraction and privacy; personal control; connection to outdoor environment; and building image and maintenance. The output variables are the general survey questions on perceived productivity, health, and overall comfort of the work area.
Table 1 lists all the 31 variables used in this work.
The best-performing offices regarding perceived productivity, health, and overall comfort were then identified for a more in-depth analysis. As a result, findings from a subset of 1949 POE surveys from 18 offices are also reported here, and necessary information about this subset is presented in
Table 2. This subset features premium spaces, holding certifications from the Green Building Council of Australia (GBCA) and/or WELL Building Standard. Offices are located in buildings that hold a valid rating from the National Australian Built Environment Rating System (NABERS), which is typical to high-end corporate real estate in Australia. Tenants organizations are from the property industry, finance, government, design, and consultancy sectors. The majority of offices from the subset of 18 are open-plan, and 4 were designed to support activity-based working. All POE surveys were conducted at least 6 months after relocation and were mostly driven by GBCA’s rating requirements.
Table 2 shows basic information about the surveyed offices, comprising the subset featuring in the workspace ranking.
2.1. Statistical Analysis
2.1.1. Pre-Processing
Pre-processing involved replacing missing instances and discarding invalid instances. We represented the matrix with 28 input variables (i.e., features) as Xm×28 = [x1, …, x28], where xi represents each feature and m is the number of instances/observations in xi. Similarly, Ym×3 = [y1, …, y3] denotes the matrix of 3 output (y) variables. Any missing instance in each feature xi (e.g., jth instance of xi is xj,i) is estimated using a linear interpolation between the two adjacent instances (i.e., x j-1,i and xj+1,i).
Data (instances) from the workspaces with a sample size less than 20 were not considered in this experiment. The following steps were conducted for each output variable, and each time; instances from X X (e.g., instances at jth position in Xj,i) were discarded where the corresponding instance of output variable (i.e., yj,i) was ‘null.’ This last step resulted in different sample sizes for different output variables, i.e., productivity, health, and overall comfort of the work area.
2.1.2. Correlation-Based Feature Ranking
The first goal of the experiment was to identify which features were most strongly associated with the output variables. A correlation between input and output variables can identify the degree of association between them. A two-sided Pearson correlation coefficient is computed between each feature, x
i and each output variable, y
j. A Pearson correlation coefficient, ρ
x,y is computed with (1), where cov (x
i, y
j) is the covariance of (x
i, y
j) and σ is the standard deviation of them. The feature matrix X is sorted into a descending order (i.e., X′ = [x
p, …, x
q, …, x
r: y
j,p ≥ y
j,q ≥ y
j,r]) with respect to ρ
x,y values obtained for each y
j. A list of abbreviations is provided in
Table 1, including the full questions of the POE survey.
2.1.3. Statistical Difference
Wilcoxon rank-sum (WRS) test determines if two independent samples originate from populations with the same distribution. A WRS test is nonparametric, as it does not assume that the samples belong to a known (i.e., normal) distribution [
28]. Samples A and B were created for each output variable from the instances in X using the scores/ratings. Instances in X that corresponded to the ratings between 1 and 3 in a particular output variable (y
j,k) were grouped into A. Similarly, ratings in y
j,k between 4 and 7 were used to group the corresponding instances of X into B, as shown in Equations (2) and (3).
A two-sided WRS test was then conducted for each pair of A and B for each y
j,k = 1:3 with a null hypothesis stating that the data in A and B belong to distributions with equal medians, against the alternative hypothesis that they do not with a significance level α = 0.05. The test returns a p-value and h-value, where h = 1 indicates a rejection of the null hypothesis and h = 0 indicates rejection of the alternative hypothesis with a 5% significance level. The test p-h values were calculated with Equation (4).
2.1.4. Classification-Based Feature and Workspace Ranking
Forward feature selection (FSS) is a machine learning based feature selection approach that can rank many features predicting a particular output variable. FSS selects a subset of features in X that best predict the output variable. FSS starts with no feature and keeps adding features sequentially until the prediction performance stops improving [
29]. The following procedure was applied to each output variable y
i = 1:3. A ground-truth was computed for each output variable (y
i = 1:3) using the (5) ratings between 1 and 7 as follows:
The FSS uses k-fold cross-validation (k = 10) while selecting the candidate features, to randomly split the instances of X and y
i into 10 equal-sized disjoint subsamples. The FSS trains an SVM classifier and predicts a particular output variable for each subsample. This process is iterated, and each time a feature that has not been selected yet is added. The outcome of this process is a set of selected features with a set of criterion values. The criterion value is an estimation of the mean miss-classification rate, and the algorithm keeps adding features until there is no decrease in the criterion value. The selected features are considered to achieve higher classification accuracy than the rest of the features in X [
29]. We represented the subset of selected features as X′, where X′ ⸦ X and X′ = (x
1, …, x
n): n < 28 (i.e., X′ should have lesser number of features than X).
The criterion values for each selected feature were used as ‘weight’ to obtain a ranking of the workspace. A dot multiplication was computed between the criterion values for each selected feature and the instances of that feature. The multiplication outcome was separated for each workspace, and a mean was taken to compute a raking score for each workspace. The workspaces were then sorted according to this ranking score. The W = (w1, …, wt) (t = number of workspaces) can be considered as a list of the ranked workspace.
A similar feature selection was conducted using the divided subsamples from X and Y. The ‘office layout’ feature was used to separate both X and Y into two separate subsamples: ‘open-plan’ and ‘private’. An identical FFS-based feature ranking approach provided two lists of best-performing features for each output variables, along with respective criterion values.
2.1.5. Analyzing Top-Ranked Workspaces
The classification-based feature selection provided a subset of features (i.e., X′) that best-predicts each output variable (i.e., y1
:4). A list of ranked workspaces was then obtained for each output variable from the mean criterion scores of these features. Each feature, F
i contains a number of instances, namely satisfaction/agreement (score 5–7) and dissatisfaction/disagreement (score 1–3) scores. These measures do not incorporate the neutral scores (i.e., score 4). Fractions of satisfaction/agreement and dissatisfaction/disagreement scores were computed for the top four selected features for the four highest ranked workspaces, using Equations (6) and (7). These two measures indicate the overall rate of satisfaction/agreement and dissatisfaction/disagreement for each feature in each workspace and each output variable. This procedure was iterated for four output variables including productivity, health, overall comfort, and overall building.
2.1.6. Overall Satisfaction Scores
The selected features in X′ for the top four workspaces were combined to form a list of best-performing features. A mean of the instances of each feature in X′ was computed for each of the top-ranked workspaces for each output variable. This experiment was further extended by taking a similar mean of the instances of each feature in X′ for the ‘open-plan’ and the ‘private’ workspaces, regardless of the output variables and any particular workspace.
3. Results
3.1. High Performance Features at the Dataset Level
Table 3 presents 28 features (in descending order) along with the Pearson correlation coefficients. The order of features displayed in this table changes based on the correlation coefficients found for perceived productivity, health, and satisfaction with the overall comfort of the work area. This dataset-level enquiry shed light on key features shared by open-plan offices and facilitated the subsequent mapping of high-performance workspaces. Interestingly, although in different order of importance, the features depicted in
Table 3 and
Figure 1 show a strong link with the impact of interior design on the performance of these spaces according occupants’ subjective assessments reported on POE surveys.
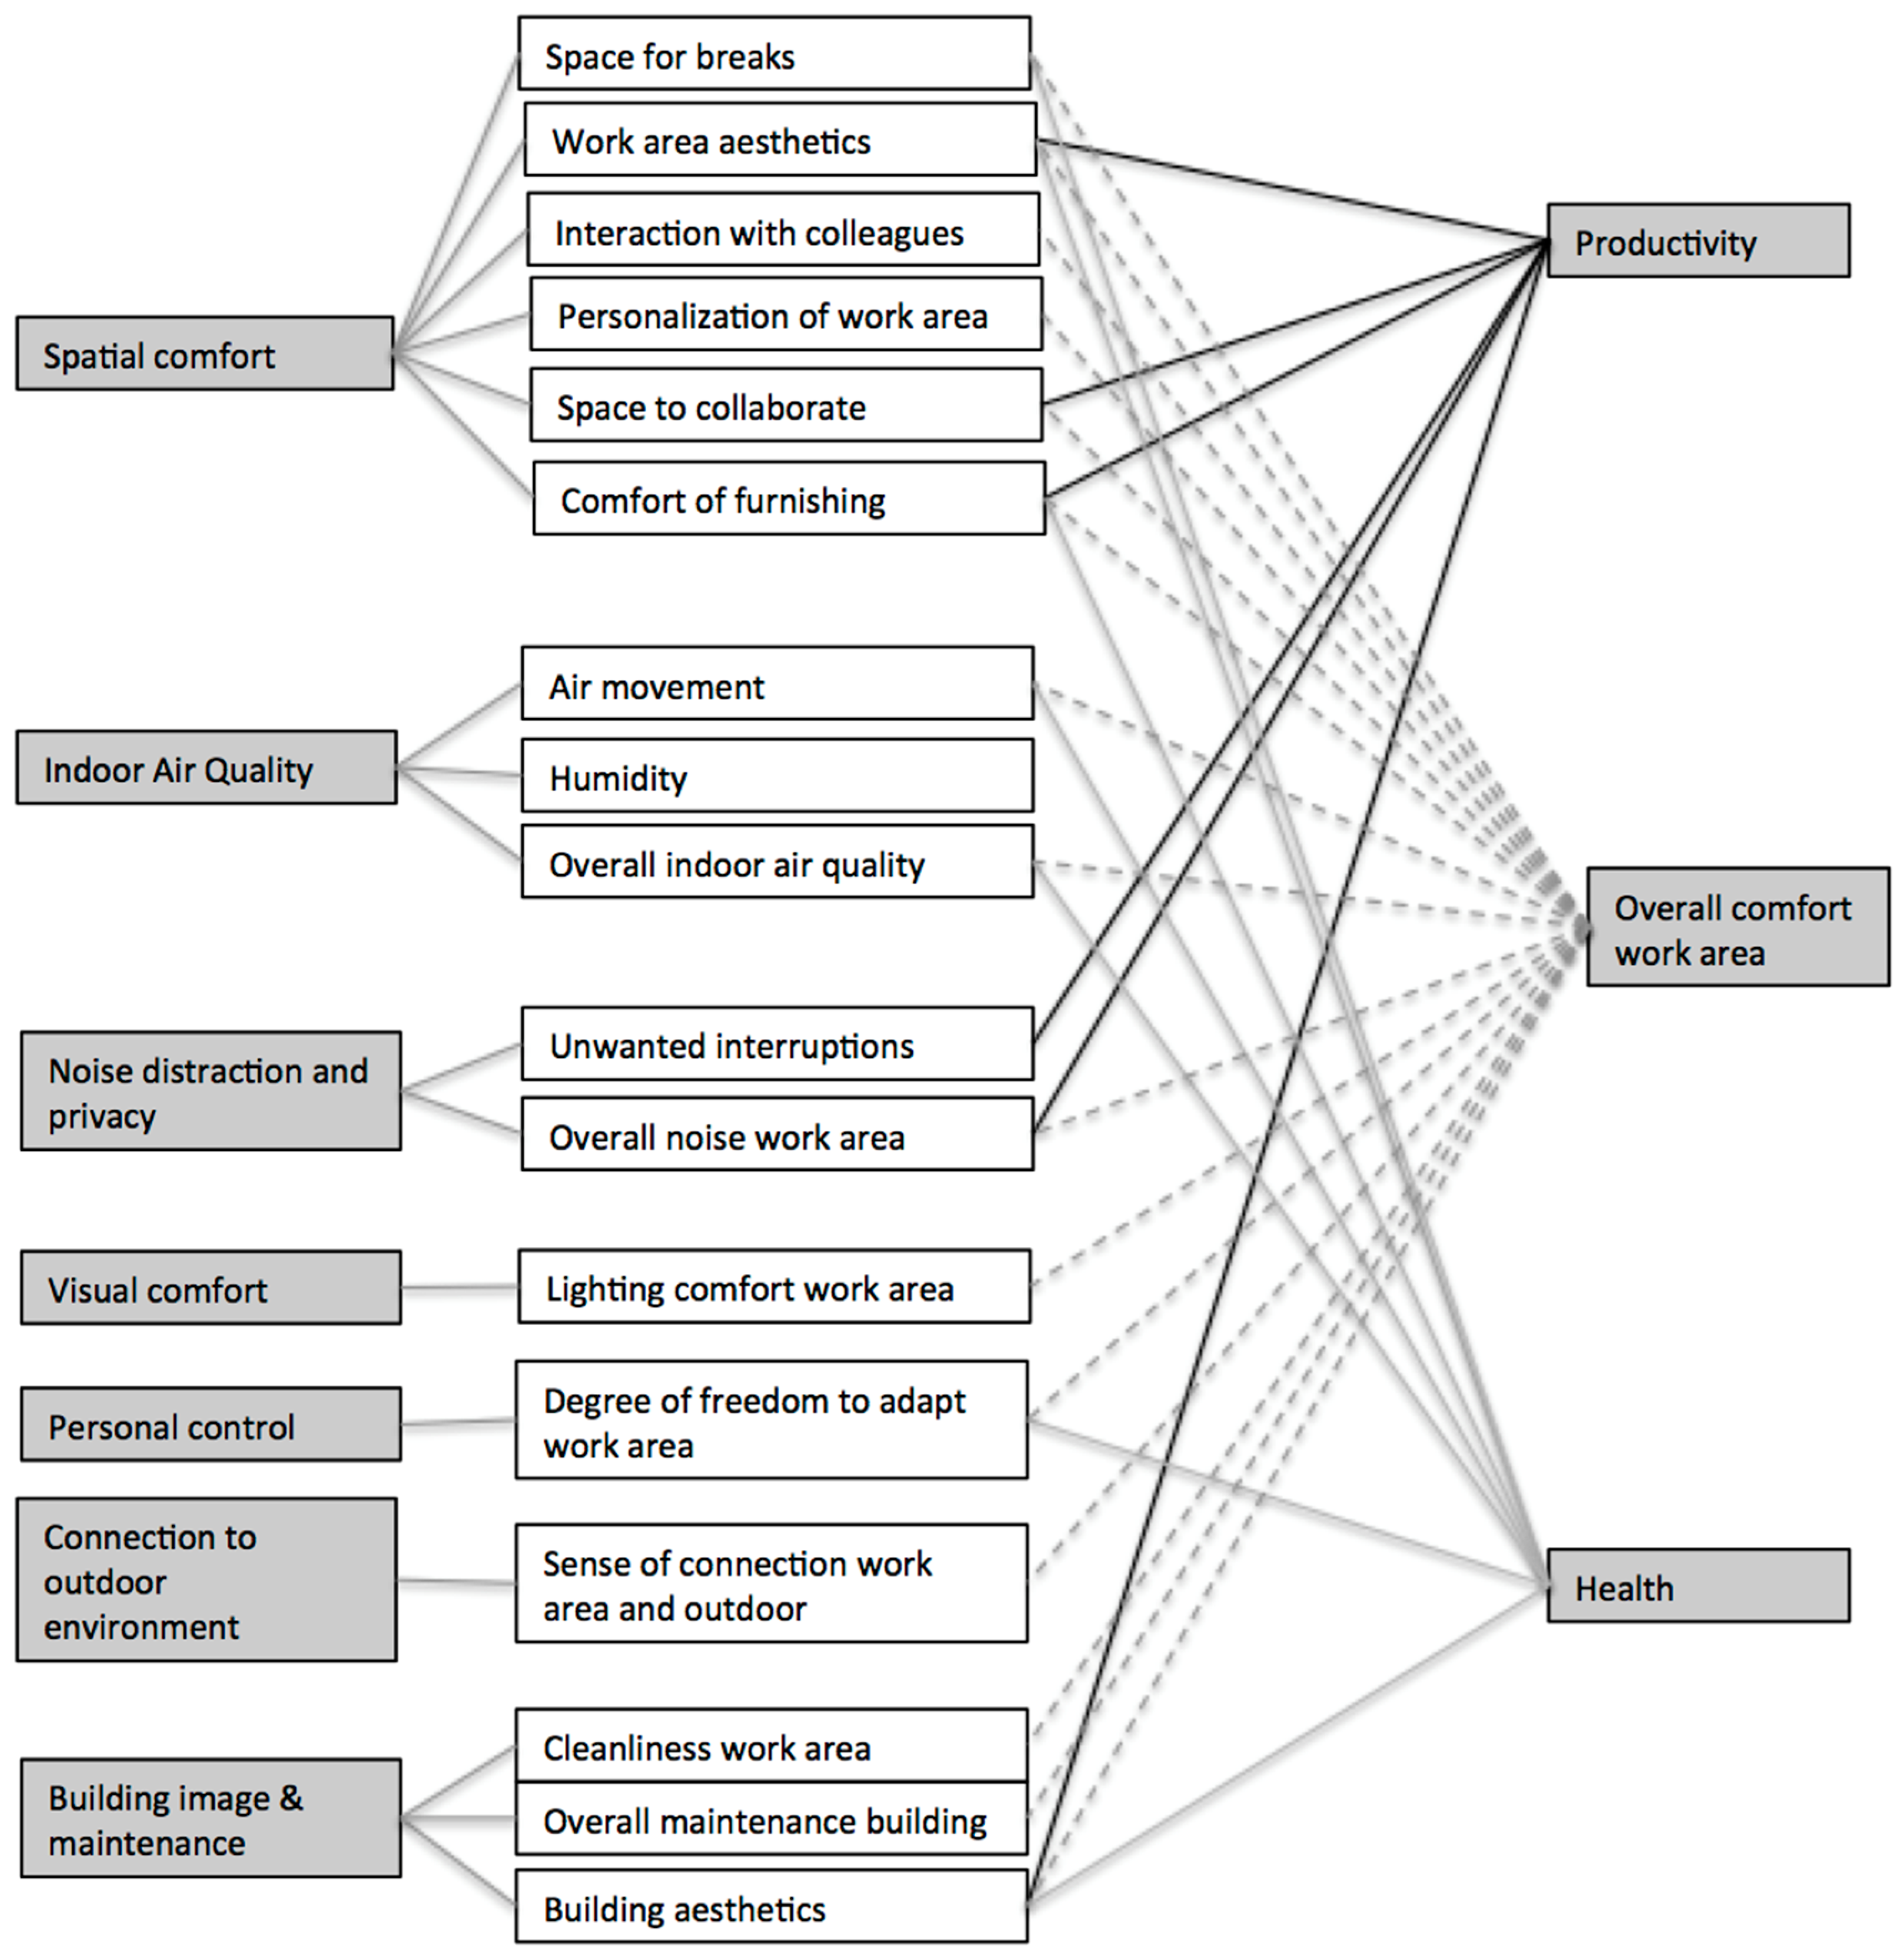
For perceived productivity, the features presenting large-size associations (ρ > 0.50) were six in total, including work area aesthetics, distraction/unwanted interruption, overall amount of noise, furnishing, building aesthetics, and space to collaborate. For health, questionnaire items presenting large-size associations (ρ > 0.50) were seven, namely air quality, work area aesthetics, air movement, building aesthetics, access to daylight, furnishing, and space for breaks. For comfort of the workspace, questionnaire items presenting large-size associations were seventeen in total: furnishing, work area aesthetics, air quality, building aesthetics, air movement, degree of adaptation, space for breaks, humidity, cleanliness, maintenance, connection to outdoors, interaction with colleagues, space for collaboration, lighting, noise, personalization of work area, and amount of space. As depicted in
Figure 1, when combined, large-size associations were mostly concentrated on questionnaire items linked with seven key dimensions, namely spatial comfort (six features), indoor air quality (three features), building image and maintenance (three features), noise distraction and privacy (two features), visual comfort (one feature), personal control (one feature), and connection to the outdoor environment (one feature).
When combined, results from
Table 3 and
Figure 1 clearly point to the importance and opportunities of exploiting interior design to address occupants’ dissatisfaction in open-plan offices. Work area aesthetics was highly ranked in all three dimensions investigated here, which is undoubtedly a domain driven by interior design. What is interesting about this result is that work area aesthetics has not been traditionally considered or investigated in research conducted in open-plan offices. Similarly, comfort of furnishing and degree of freedom to adapt the normal work area have also appeared prominently for all three dimensions investigated here. These results suggest that specifications for overall layout, zoning, and furniture should be carefully considered when designing open-plan offices.
3.2. High-Performance Features for Open-Plan and Private Offices
Table 4 lists the ranking of the best-performing features that predicted perceived productivity, health, and overall comfort of the work area for open-plan offices. The subset is considered as the best-performing feature subset among all 28 features in X. The number of features obtained for each output variable varies as the iteration feature selection breaks over the condition on classification performance.
Figure 2 and
Figure 3 depict the best-performing features for predicting perceived productivity, health, and overall comfort of work area per dimension and office typology.
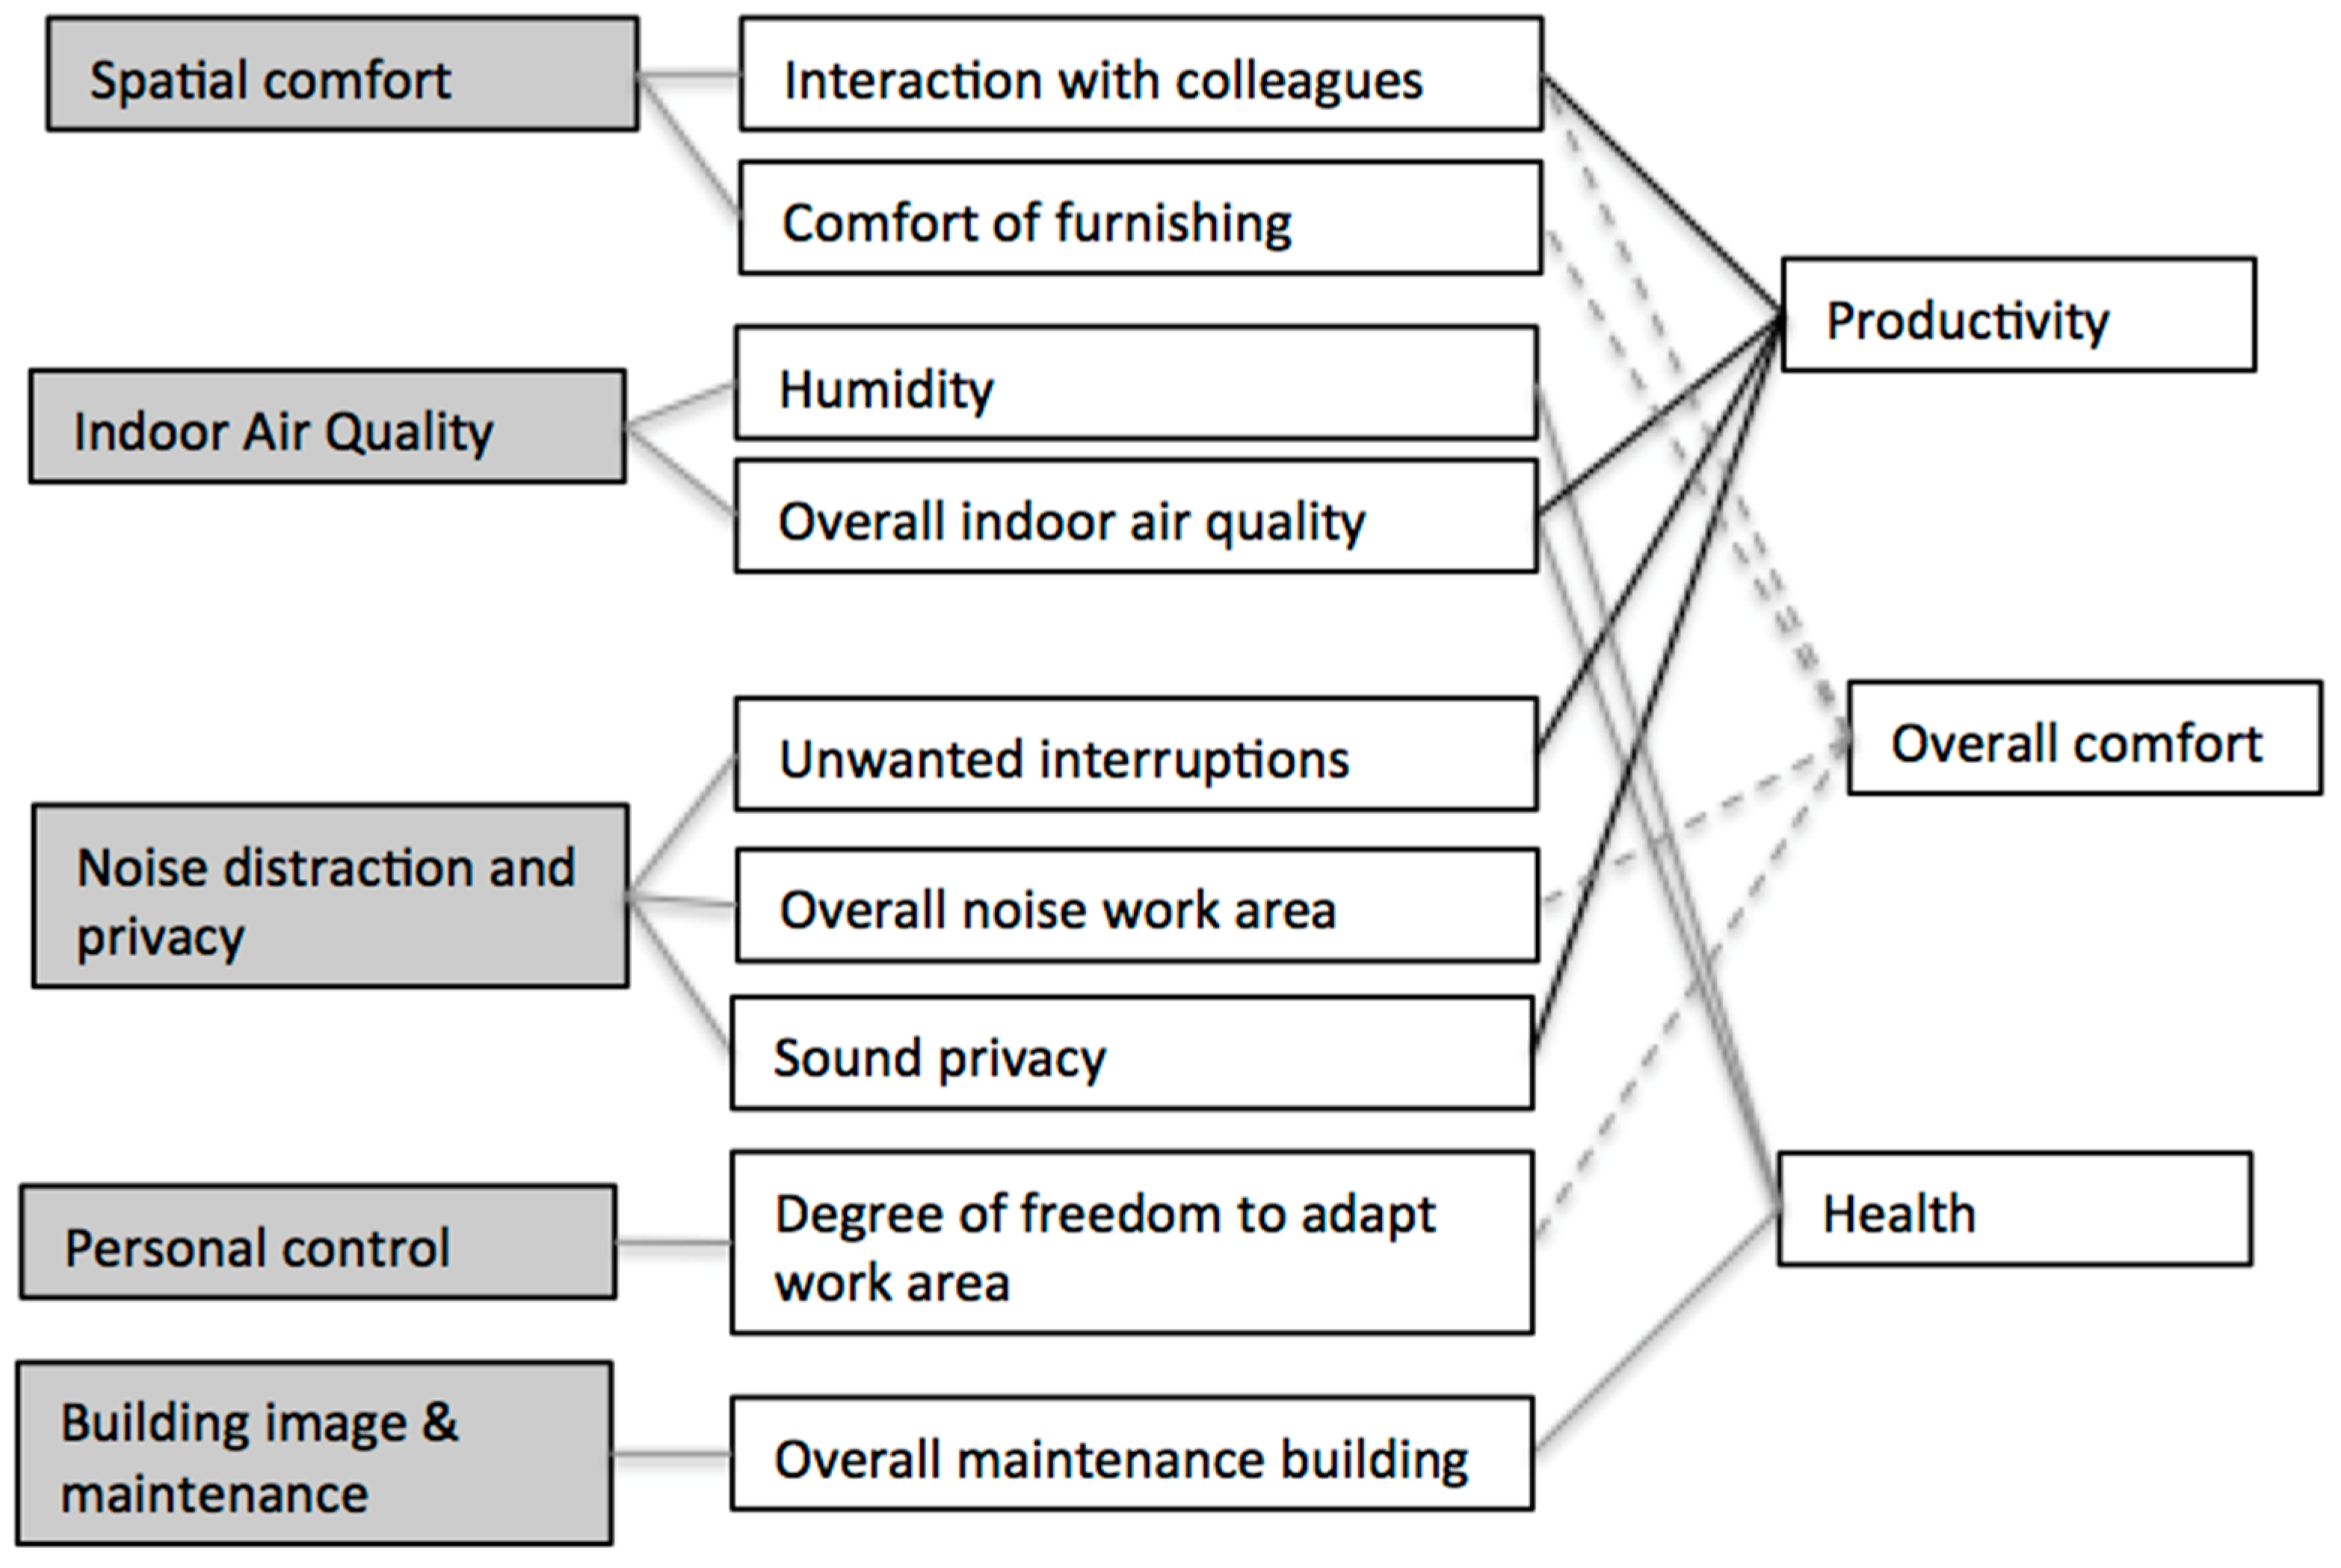
For open-plan offices, the best-performing features for predicting perceived productivity were a total of seven: amount of interruption, work area aesthetics, degree of adaptation of the work area, furnishing, overall amount of noise, cleanliness, and personal control over lighting. Furnishing, work area connection to outdoors, building aesthetics, sound privacy, and degree of adaptation of the work area were the critical predictors of health. As for the overall comfort of the work area, six features were key predictors, namely work area aesthetics, degree of adaptation of the work area, furnishing, overall air quality, cleanliness, and amount of interruption. As depicted in
Figure 2, critical predictors in open-plan offices can be linked to the spatial comfort of the work area, indoor air quality, noise distraction and privacy, personal control, connection to the outdoor environment, and building image and maintenance.
Table 4 shows the ranking of best-performing features of open-plan offices for predicting perceived productivity, health, and overall comfort of the work area.
Figure 2 shows the best-performing features of open-plan offices for predicting perceived productivity, health, and overall comfort of work area.
For private offices, the best-performing features for predicting perceived productivity were the amount of interruption, sound privacy, interaction with colleagues, and overall air quality. For health, the key predictors were overall air quality, humidity, and overall maintenance building. As for the overall comfort of the work area, four features were key predictors, namely degree of adaptation of the work area, furnishing, interaction with colleagues, and overall amount of noise. As depicted in
Figure 3, critical predictors in private offices can be linked to the spatial comfort of the work area, indoor air quality, noise distraction and privacy, personal control, and building image and maintenance.
Table 5 shows the ranking of best performing features for private offices and
Figure 3 shows the best-performing features for predicting perceived productivity, health, and overall comfort work area.
3.3. High-Performance Workspaces
Table 6 includes the rates (fractions) of satisfaction and dissatisfaction scores for the top-ranked workspaces for perceived productivity, health, and overall comfort. The fractional scores of the top workspaces were higher (>50%) for either satisfaction or dissatisfaction scores for the high-performing features for each output variable. This signifies that these high-performing features had a good correlation with the output variables and were selected during the classification-based feature selection.
Table 7 includes the mean satisfaction scores for the top workspaces in terms of perceived productivity, health, and overall comfort. The mean satisfaction scores fell between 4 and 6 (on a 7-point scale), which indicates that these features obtained high satisfaction scores overall.
4. Discussion
Dataset- and feature-level analysis show that the spatial comfort of the work area is key for predicting workers’ satisfaction, as confirmed by the results reported in References [
5,
6,
7,
8,
9]. The physical configuration of highly-ranked offices supports this finding, as their interior design privileged zoning and the implementation of a variety of spaces to support different activities during the day. These spaces had several zones intentionally allocated for breaks, collaboration, concentration, and private conversations. As a result, it is not surprising that satisfaction results from these offices were significantly higher regarding the amount of interruption and sound privacy—well-known issues of open-plan offices and also important predictors found here for perceived productivity, health, and satisfaction with the overall work area. This is an important finding considering the ever-challenging balance between collaboration and acoustics-related issues observed on open-plan offices. Investing in designs that provide workers with a variety of zones within open-plan offices will allow them to more efficiently develop different work-related activities that require concentration, privacy and/or interaction with others. This is a key move in mitigating acoustic-related issues in open-plan offices and should be carefully considered by designers.
In addition, high-performance workspaces presented high scores on key predictive features, namely overall aesthetics of the work area, comfort of furnishings, degree of freedom to adapt, and connection to outdoors. Once again, these aspects are related to the interior design of offices. Analysis of the physical configuration of these offices showed that their design predominantly embraced organic shapes intended to bring spaces together without visual barriers. When used, partitions employed glass and textured elements of plants. Pods of all sizes were also a prominent in these spaces and had walls with textured elements and/or plants, promoting visual integration but some privacy at the same time. The sense of spaciousness was also enhanced by the use of large voids, sometimes of the size of atriums and/or staircases. In addition, the design of these offices has also placed strong care on furniture ergonomics and presence of sit-stand workstations. The vast majority of offices also had workstations located near the façade, which allowed direct access to a view. These workstations are intended for temporary use, so no workers are permanently based there. Finally, the design of offices investigated here clearly embraced biophilic principles. Overall, layouts privileged workers’ access to daylight and views, locating workstations on the perimeter zones of the space. Green walls and other features were also consistently observed in several zones, enhancing workers’ exposure to nature.
5. Conclusions
This paper presented dataset-level analysis of a total of 8827 post-occupancy evaluation (POE) surveys conducted in 61 high-end offices in Australia and a detailed analysis of a subset of 18 high-performance workspaces (n = 1949). In addition to surveys, structured site visits and floor plans were reported here. When merged, these analyses allowed identification of critical features and physical configuration of offices highly ranked in terms of perceived productivity, health, and overall satisfaction with the work area.
Dataset-level analysis revealed large-size associations with spatial comfort (six features—space for breaks, work area aesthetics, interaction with colleagues, personalization of work area, space to collaborate, and comfort of furnishing), indoor air quality (three features—air movement, humidity, and overall indoor air quality), building image and maintenance (three features—cleanliness work area, overall maintenance building, and building aesthetics), noise distraction and privacy (two features—unwanted interruptions and overall noise work area), visual comfort (one feature—lighting comfort work area), personal control (one feature—degree of freedom to adapt work area), and connection to the outdoor environment (one feature—sense of connection work area and outdoor). For open-plan offices, critical predictors can be narrowed to spatial comfort of the work area, indoor air quality, noise distraction and privacy, personal control, connection to the outdoor environment, and building image and maintenance. For private offices, the critical predictors found are linked to the spatial comfort of the work area, indoor air quality, noise distraction and privacy, personal control, and building image and maintenance.
All offices with very high results for perceived productivity, health, and overall comfort of the work area were highly ranked in our analysis: a human-centered approach to interior design purposely allocated spaces to support a variety of work-related tasks and implemented biophilic design principles. These findings point to the importance of interior design in high-performance workspaces, especially when it comes to open-plan offices.


