Article

Thermal Performance of Insulated Constructions—Experimental Studies

SNTEF Building and Infrastructure, P.O. Box 4760 Torgarden, NO-7465 Trondheim, Norway
*
Author to whom correspondence should be addressed.
Buildings 2019, 9(2), 49; https://doi.org/10.3390/buildings9020049
Submission received: 18 January 2019 / Revised: 11 February 2019 / Accepted: 15 February 2019 / Published: 21 February 2019

Abstract

:
Buildings that are designed to meet high-energy performance requirements, e.g., passive houses, require well-insulated building envelopes, with increased insulation thicknesses for roof, wall and floor structures. We investigate whether there are differences in the efficiency of thermal insulation materials at different moisture levels in the insulation and if there is a larger or smaller risk of natural convection in wood-fibre based insulation than in mineral wool. The work has mainly been performed by use of laboratory measurements included permeability properties and full-scale measurements of thermal transmittance of mineral wool and wood-fibre insulated constructions. In addition, calculations have been used to calculate resulting effects on the thermal performance of constructions. Results showed that the thermal conductivity was unaffected by moisture in the hygroscopic range. The air permeability was found to be approximately 50% higher for the wood-fibre insulation compared to mineral wool insulation. Measurements showed that the largest U-values and Nusselt numbers were found for the wall configuration. Calculation of the U-value of walls showed that in order to achieve the same U-value for the wood-fibre insulated wall as the mineral wool, it is necessary to add 20 mm insulation to the 250 mm wall and approximately 30 mm for the 400 mm wall.

1. Introduction

This article describes an investigation of the thermal transmittance of highly insulated walls, roof and floor constructions performed by measuring the properties of wood-fibre and mineral-based insulation materials. This study was done in a context of the ongoing research project “Zero emission neighborhoods in smart cities” (ZEN) [1]. One of the many sub goals of the ZEN center is to contribute to new and improved low CO2 materials and construction systems for buildings.

1.1. Background—Challenges in Buildings with Thick Insulation Layers

The last few decades have shown a tightening of requirements regarding thermal performance of the building envelope in building regulations. In combination with an increasing rate of innovation in the construction industry, this has led to the fact that the amount of thermal insulation used in Norwegian buildings is increasing. Today’s well-insulated walls, floors and ceilings are built with thicknesses of as much as half a meter. However, there are practical challenges that must be addressed. Earlier research has suggested that the total life-cycle carbon footprint of a building is largely linked to the production of the buildings [2]. The type of materials we used is therefore crucial in achieving a future goal of carbon-neutral buildings. Among the most important building materials for withstanding the harsh Nordic climate are insulation materials.
In addition to the need of having good insulation levels, which contribute to energy savings, the risk of humidification of materials caused by precipitation during the construction period must be addressed. Moisture in insulation materials during operation should be avoided. This is especially important in heavily insulated thick structures. Furthermore, local air leakages can lead to humidification of structures from hot and humid indoor air. As indicated by previous research, high levels of moisture in wood-based insulation materials can lead to higher thermal conductivity values [3]. This reduces the performance of the insulation materials and ultimately the entire construction. A reduced insulation performance will lead to a higher yearly energy demand due to the additional heat losses. Additionally, and maybe more critical, this can have an impact on the peak heating demand during cold periods of the year. Reducing peaks in power consumption is likely to become a major aspect in flexible or smart power-grids in the future.
Wood-fibre insulation is an example of a product that is anticipated to have a relatively low carbon footprint and at the same time to have good insulation properties. In this study we investigated how this type of insulation perform regarding the challenges indicated above. The properties and performance of wood-fibre insulation are compared to that of a conventional mineral wool-based insulation material using material and full-scale measurements coupled with numerical simulation and calculations according to governing standards.

1.2. Moisture—Effects on Insulation Material Effectiveness

The short- and long-term effectiveness of thermal insulation materials is dependent on its thermal conductivity and its ability to maintain its thermal characteristics over time. A high moisture level in the insulation material will, in general, increase the thermal conductivity, and therefore reduce the effectiveness of the thermal insulation [3].
Moisture contents of typical mineral wools in equilibrium with relative humidity levels under 90% have been shown to be in the area of 1–3% by mass [4].
Vololonirina et al. [5], found that the thermal conductivity of a wood-fibre board increases as a function of moisture content. Vololonirina et al. [5] also measured the sorption and desorption isotherms for the tested wood-fibre board at 20 °C. They found that the moisture content of the tested wood-fibre board was 15–18% by mass in equilibrium with a humidity level of 90% RH (relative humidity), and that the moisture content in the range between 0% and 90% was approximately linearly dependent of RH. For moisture levels between 0% and 25% by mass the relationship between thermal conductivity and mass moisture content were found to be linearly dependent for wood-fibre at 25 °C.
NS-EN ISO 10456 [6] describes a procedure to determine the thermal conductivity of insulation materials based on moisture content and a reference moisture content. The standard gives values for mineral wool insulated structures exposed to moisture. No calculated values are given for wood-fibre insulation.

1.3. Convection—Effects on Insulation Material Effectiveness

Buildings that are designed to meet high-energy performance requirements, e.g., passive houses, require well-insulated building envelopes, with increased insulation thicknesses for roof, wall and floor structures. Previous studies have found that natural convection in thick insulation can occur and that this can impair the effect of insulation Uvsløkk el al. [7] especially during periods of time with cold exterior temperatures. The driving force of natural convection is given by the temperature difference and hence the density difference of the air in the cold and warm part of the insulation.
Additionally, increased insulation thicknesses may lead to a heightened risk of mould growth and moisture damage [8]. One reason for this is increased risk of natural convection in the insulated cavities causing moisture redistribution in the timber frame.
Convection in building structures is caused by pressure differences from driving forces like fans, wind and temperature differences. Resulting air movement caused by temperature differences is called natural convection. The driving force is buoyancy caused by density differences in the air because of the temperature differences.
In order to avoid convection, it is important that the insulation material fills the cavities completely, especially at the top and bottom of the cavities, in order to avoid air gaps. Gaps will decrease the flow resistance of the insulated cavity and hence increase the convection [9]. If the insulation thickness exceeds 200 mm, Uvsløkk et al. [7] recommend dividing the insulation into two parallel “cavities” using an airtight and vapour-open barrier in the middle of two insulation layers. By using this approach, the driving force—the temperature difference across each layer—will be reduced by 50% and the total flow resistance in each layer will be nearly doubled [7].

1.4. Convection and the Effect on Thermal Performance in Walls and Roofs

Previous studies have investigated natural convection and effect on thermal performance of both wall and roof structures. Some of these studies are old and investigate structures with thicknesses [10,11], that are thin compared to modern Nordic wooden frame structures. Hence, these studies are of little relevance to today’s structures.
In the mid-1990s, several measurements of large-scale sections of timber frame walls insulated with glass wool were performed in the Hot-Box apparatus at SINTEF Building and Infrastructure/NTNU in Trondheim, Norway [12,13,14]. The purpose of the work was to study natural convection in real timber frame walls. The wall thickness, type of glass wool and temperature conditions were varied. Some of the results were reported by [15]. The convection measurements in glass wool were summarized and supplemented by Janssen [7] The full-size wall measurements of Janssen [7] showed experimental Nusselt numbers (see Section 2.4) between 1.07 and 1.12 for a wall with 200 mm glass wool insulation dependent on the temperature difference across the wall. A Nusselt number of 1.07 means that the U-value of a wall with convection is 7% higher than the U-value with no convection. The 300 mm insulated wall gave Nusselt numbers between 1.04 and 1.14. Calculations predicted insignificant amounts of additional heat loss by internal natural convection. A hypothesis of border regions of higher permeability was formulated. The existence of these regions was indicated by air-flow measurements by Reference [16].
Concerning natural convection in roofs, Shankar et al. [17], Dyrbøl et al. [18] and Wahlgren et al. [19] have reported valuable calculations, respectively measurements and a thorough literature review concerning horizontal roofs. However, limited literature is available concerning pitched roofs. A laboratory study of highly insulated mineral wool structures with insulation thickness of 500 mm was conducted by Gullbrekken et al. [20]. Both inclination and temperature difference affected the thermal transmittance through the structure. Based on the measurements a Nusselt number up to 1.30 was calculated for a pitched roof with angle of 30° roof with the largest temperature difference (40 °C) over the measured roof. A literature review of convection in highly insulated pitched roofs was conducted by Roles and Langmans [21], highlighting the use of high-density insulation (>20 kg/m3) and a continuous and wind-tight vapour and wind barrier system in order to construct a well-performing pitched wooden roof.

1.5. Convection and the Effect on Moisture Transport

Natural convection in air permeable insulation will not only affect the heat transfer through a wall structure, but also cause moisture redistribution in walls [22]. The latter occurs when water vapour is transported by the air circulation inside the insulated cavities in the wall. Effects of natural and forced convection on the hygrothermal performance of highly insulated building structures have been studied in laboratory measurements by References [23,24,25]. The results showed increased moisture levels at the upper cold part of the walls due to natural convection. It was also stated that an airtight vapour barrier on the warm side is required in order to obtain a moisture-safe structure.

1.6. Objective and Scope

The aim of the study was to investigate whether there are differences in the efficiency of thermal insulation materials at different moisture levels in the insulation and if there was a larger or smaller risk of natural convection in wood-fibre based insulated constructions than in mineral wool insulated constructions.

2. Methodology—Experimental Work—Simulations and Sample Descriptions

Natural convection has been studied by laboratory measurements by use of a rotatable guarded Hot Box. Material level measurements of air permeability and conductivity has been conducted as well. Thermal transmittance (U-value) have been measured on a timber frame structure with 250 and 400 mm thick cavities filled with battens of glass wool insulation. The same structures were measured with wood-fibre battens as insulation material. Measurements were carried out according to NS-EN ISO 8990 [26] and are based on the mean value of between 12 and 24 one-hour measurement periods. The metering area of the Hot Box was 2450 mm × 2450 mm.

2.1. Material Level Measurements

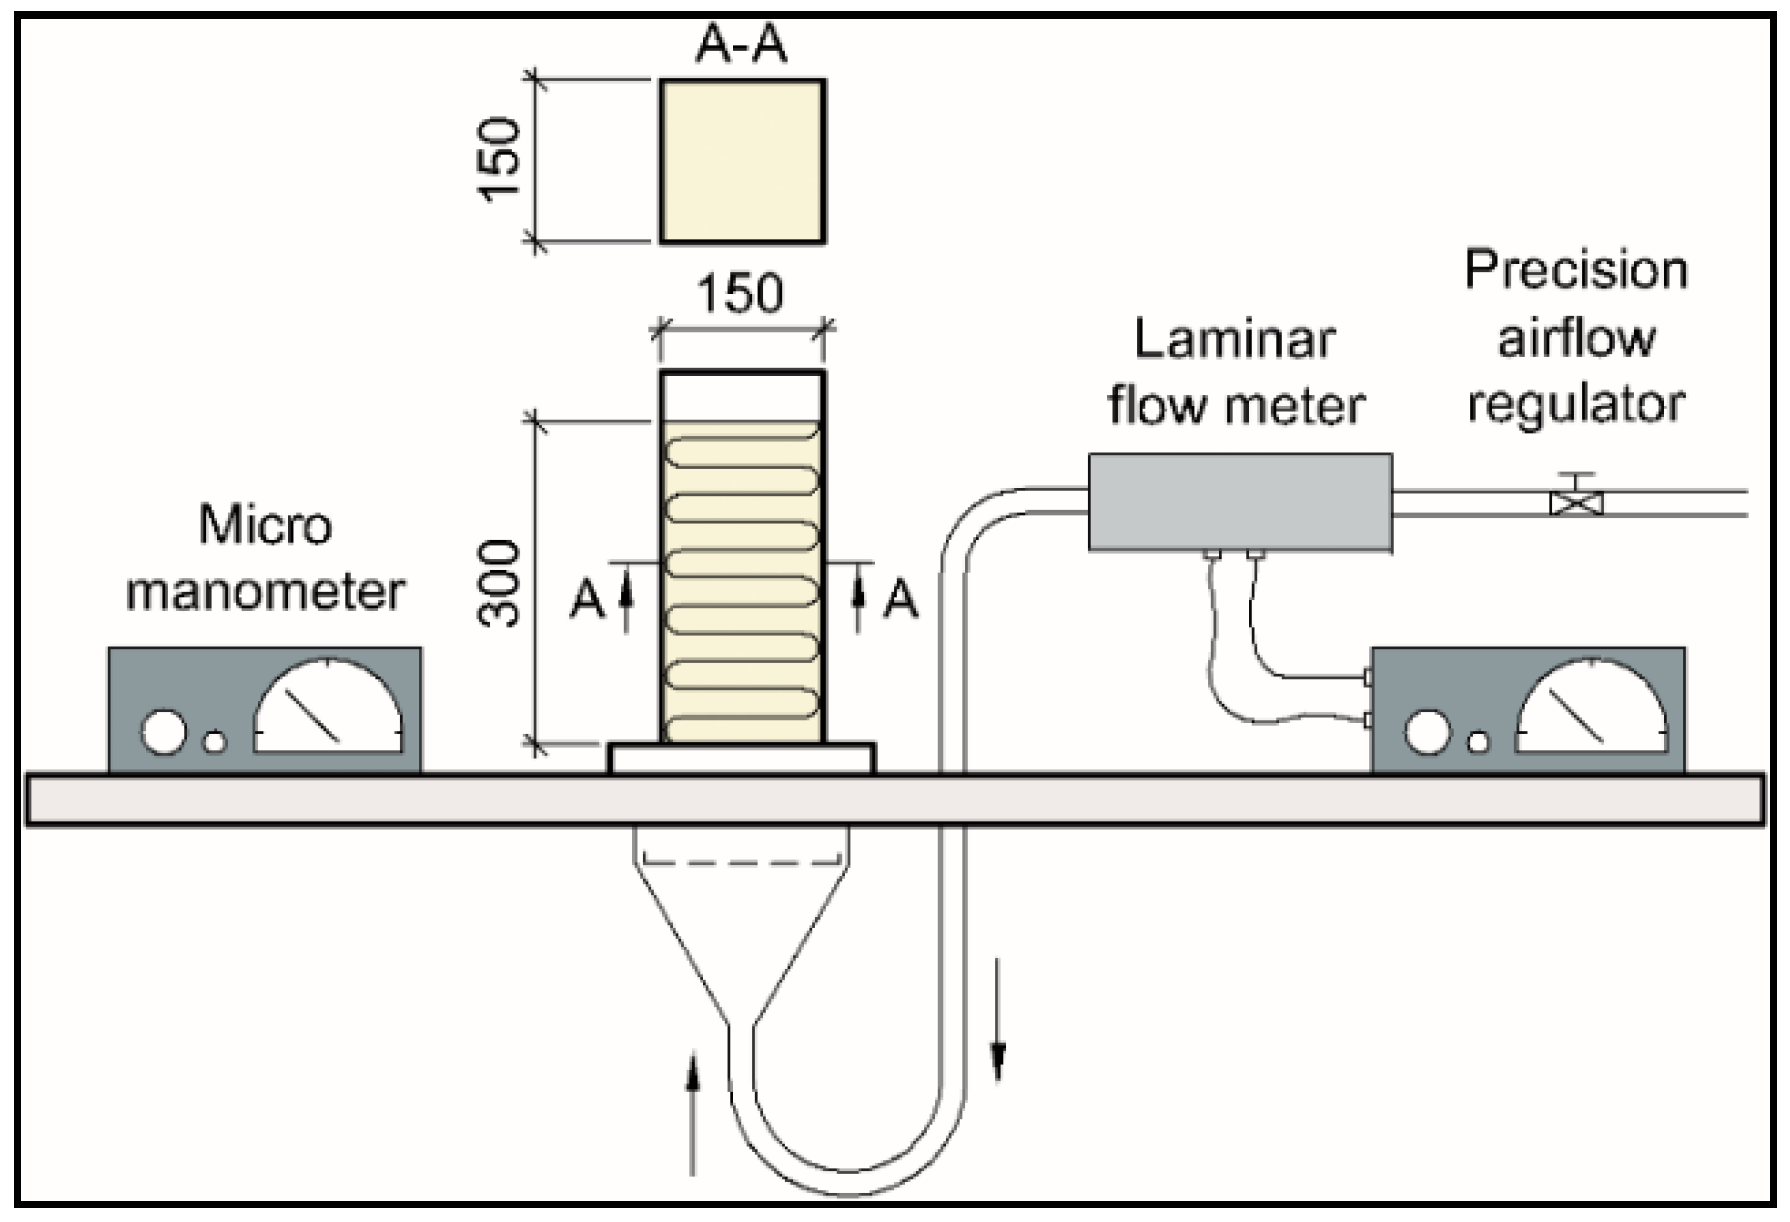
2.1.1. Air Permeability

The air permeability of the insulation was measured according to NS-ISO 9053:1993 [27], see Figure 1. A laminar flow meter was used to measure the air flow through the test specimens. A micro manometer was used to measure the air-pressure difference across the test specimens. Three test specimens of the 150 mm insulation battens and the 100 mm insulation battens were measured. Both the mineral wool specimens and the wood-fibre specimens were cut to fit the apparatus. The mineral wool specimens were over-sized by 5 mm to ensure proper filling of the cavity and thus avoid air-flow in the intersection between insulation and cavity wall. The wood-fibre specimen was cut precisely to fit due to being less flexible. Hence, oversizing was not possible.

2.1.2. Measurement of Thermal Conductivity

Thermal conductivity of the wood-fibre and mineral wool insulation was measured with different moisture content of the materials. Measurement at three moisture levels for the wood-fibre insulation were carried out to give a better understanding of whether the ratio of moisture to heat conductivity is linear below the saturation level. The mineral wool was tested in laboratory conditions only (20 °C and 20% RH). The test specimens had dimensions of 60 × 60 cm (width × length) from the 100 mm and 150 mm mineral wool and wood-fibre insulation boards.
The measurements were carried out according to Reference [28,29], using a heat flow meter apparatus (HFM) with 600 × 600 mm cooling plates and symmetrically placed heat flow meters with a measuring area of 300 × 300 mm. Vertically directed heat flow is imposed during the measurements with the warm side on top.
The pre-conditioned specimens with higher moisture levels than laboratory conditions, were wrapped in plastic foil before the measurements to sustain a constant moisture content in the samples. The thermal conductivity of all the specimens was measured when stable conditions had been reached. Measurements was compared with the standard humidity correction values and methods as described in Reference [6] and in current product standard NS-EN 13171 [30].
The material properties and test conditions are given in Table 1. The temperatures in Table 1 state the temperature conditions for the conditioning before the testing were performed.

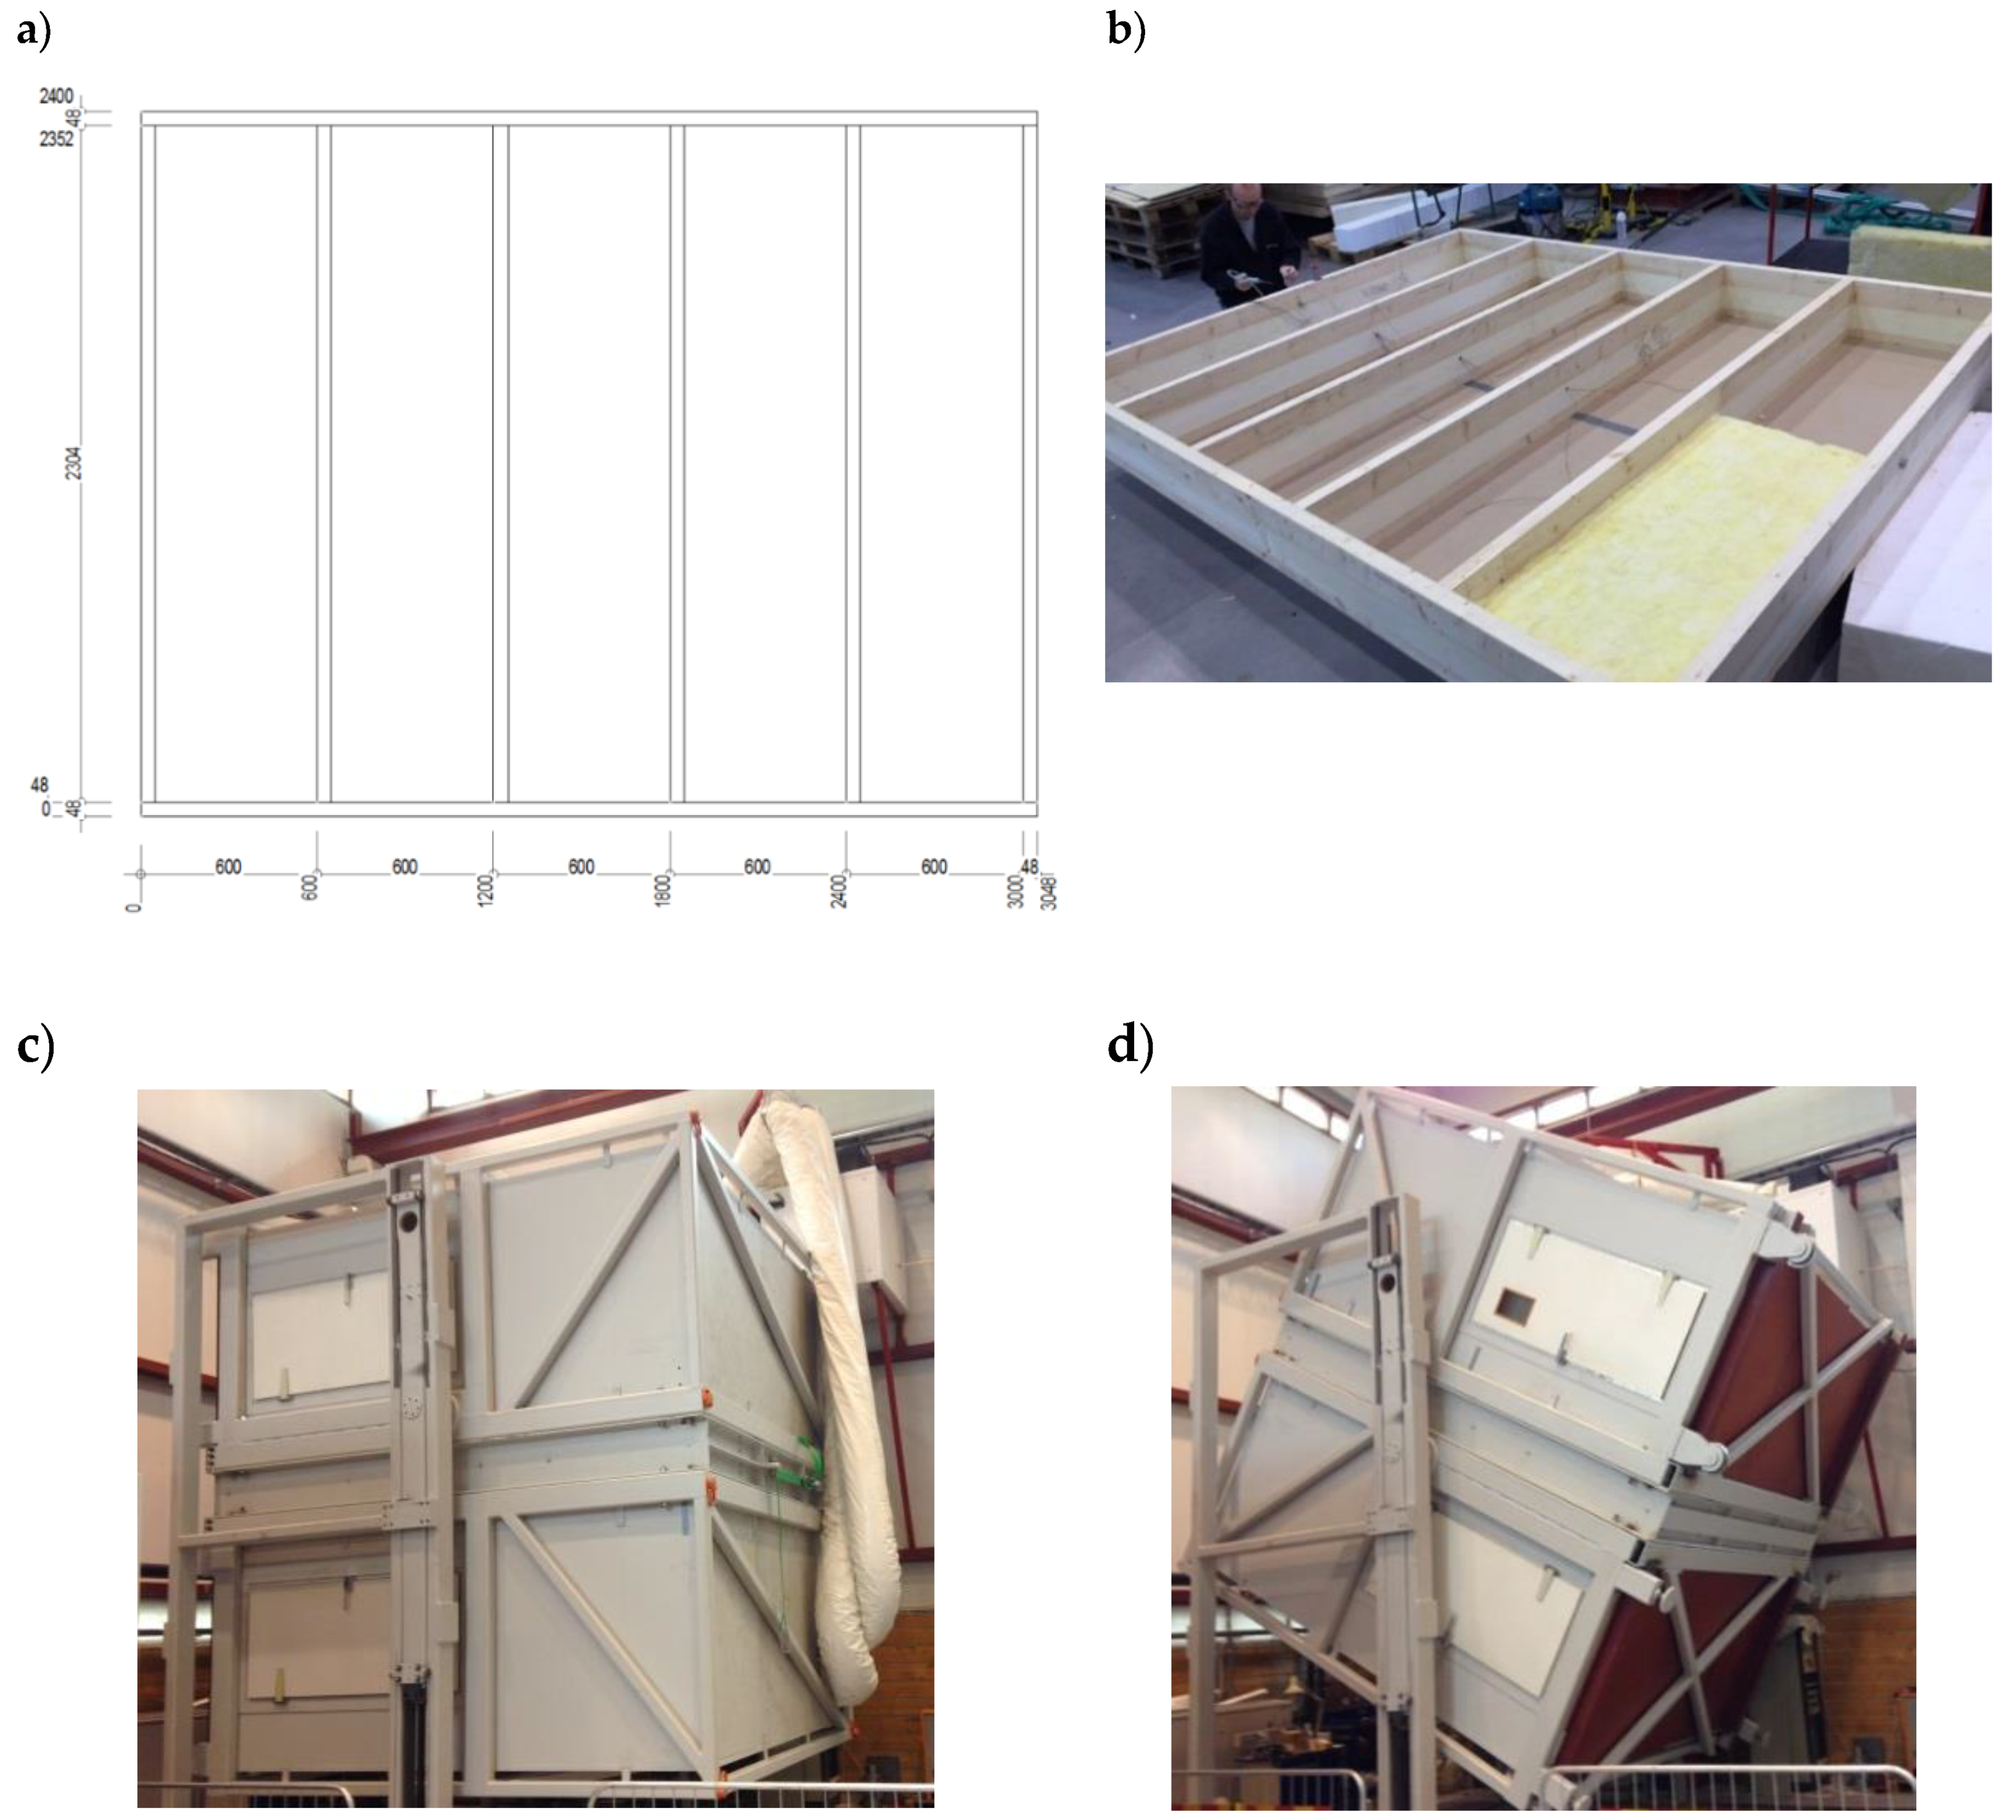
2.2. Full-Size Measurements—Test Field and Sample Descriptions

Two test fields were constructed and measured in the Hot Box apparatus, see Figure 2. Both test fields had outer dimensions 3048 × 2400 mm (width × height). One field were constructed using a 47 mm × 250 mm wood frame. The studs used were of the type ISO3, which are studs insulated with polyurethane (PUR) foam in the center 117 mm of the studs (The ISO3 frame with the PUR foam can be seen in Figure 2). The other test field were constructed by adding additional laminated wood studs with a dimension of 48 mm × 148 mm on the warm side of the ISO3 studs, creating a sample with 400 mm insulation thickness. The test field configuration can be seen in Figure 2.

2.3. Boundary Conditions and Test Configurations

Surface thermal resistance coefficients were adjusted close to the standardized ones prior to the tests by adjusting the air-flow velocities adjacent to the surface on the hot and cold sides. It is worth noting that during the measurements, the surface thermal resistances may differ slightly from the standardized values. Corrections to the values are made for these deviations so that all U-values are stated with normalized surface thermal resistance coefficients as specified in NS-EN ISO 8990 [26]. The standardized conditions are interior surface thermal resistance, Rsi = 0.13 W/m2K, and external surface resistance Rse = 0.04 W/m2K.
Natural convection occurring in insulation layers is dependent on several parameters: the insulation permeability, insulation thickness, temperature difference and inclination of the test section. All of which has been varied in this study. Two different insulation types were included, mineral wool and wood-fibre insulation. Insulation thickness of 250 mm and 400 mm were included, and temperature difference of 20 and 40 K over the sample fields were also included. The test fields were measured at inclination angles of 30°, 90° and 180°. The tests were performed at steady-state conditions with conditions as shown in Table 2.

2.4. Expressing Convection—The Modified Rayleigh and Nusselt Numbers

The modified Rayleigh number Ra* describes the risk of natural convection in an enclosure filled with a permeable material (e.g., an insulation material) exposed to a given temperature difference. Ra* is defined in NS-EN ISO 10456 [6], see Equation (1). According to NS-EN ISO 10456 [6], natural convection can be neglected when calculating U-values if Ra* < 2.5.
R a * = g β ρ c p ν × d k Δ T λ m
The properties of air are the heat expansion coefficient; β (1/K), kinematic viscosity; ν (m2/s), density; ρ (kg/m3), and specific heat capacity; cp (J/kg K). The properties of the insulation material are air permeability; k (m2), and thermal conductivity; λm (W/m2 K). ΔT is the temperature difference across the specimen with insulation thickness, d (m). The permeability of the mineral wool, k (m2), given in Equation (2) was calculated according to the following equation:
k = L × ν × d x A × Δ P
where L is the air flow (m3/s), ν is the kinematic viscosity (m2/s), dx is the insulation thickness (m), A is the cross-sectional area in which air is flowing through (m2), ΔP is the pressure difference (Pa).
When evaluating thermal performance of structural components, it is also relevant to investigate the ratio of the total heat transfer including convection to heat transfer without convection. This ratio is given by the Nusselt number, Nu, and has been calculated according to Equation (3):
N u = U U 0
U is the U-value measured in the Hot Box (W/m2K) and U0 is the U-value when there is no convection (W/m2K). In the present Hot-Box measurement the U0 is the value of the tested structure in horizontal floor configuration, with heat flow direction downwards. In this position there is no driving force for natural convection because the direction of the heat flow and the gravity are identical.

2.5. Uncertainty Assessment of Hot-Box Measurements

Previously, Grynning et al. [31] performed an assessment of the uncertainties related to the Hot-Box measurements. Procedures described in NS-EN ISO 12567-1 were used. The uncertainty assessment of the current study was based on the work performed by Reference [31].
As shown in Equation (4) the root-mean-square (RMS) method was used to derive the uncertainty propagation of the measured U-value total uncertainty propagation Δ P U w U w
Δ P U w U w = [ Δ P Φ w Φ w ] 2 + [ Δ P A w A w ] 2 + [ Δ P δ θ i e θ i e ] 2
Δ P Φ w Φ w is the uncertainty of the sample heat flow (W), Δ P A w A w is the uncertainty in the measurement area and Δ P δ θ i e θ i e is the uncertainty in the temperature difference between the cold and sides of the Hot Box.
The uncertainty of the sample heat flow is based on the heat-balance equation of the test chamber. Uncertainty of Δ P Φ w Φ w is expressed in Equation (5).
Δ P Φ w Φ w = [ Δ P Φ I N Φ w ] 2 + [ Δ P Φ E X T R Φ w ] 2 + [ Δ P Φ F L , w Φ w ]
where Δ P Φ I N Φ w is the uncertainty in power input to metering chamber (W), Δ P Φ E X T R Φ w is the uncertainty of the metering chamber heat flows and Δ P Φ F L , w Φ w is the uncertainty in the sample flanking heat loss (W). The various terms of the balance equation were not found to correlate.
Grynning et al. [31] used a reference temperature bath to show that the relative scattering in measured temperatures was lower than 0.02 K.
Rotation of the Hot Box introduces some new uncertainties compared to the measurements performed in Reference [31]. To reduce the possibility for the measurement chamber to move in relation to the test chamber, actuators were used to fix the position of the test chamber. The distance from test chamber to test section was continuously monitored throughout the experiments.

2.6. Simulation and Calculation of U-Values

U-values of the structures have been calculated using two different methods. Firstly, U-value calculations were carried out according to the methodology described in the governing standard ISO 6946 [32].
Secondly, simulations have been carried out using the 2D finite element software THERM ver. 7.3.2.0 [33], denoted “The THERM-Area method” in the results chapter. Here, the heat transfer due to 2D-effects of wood studs in the wall has been accounted for using a methodology in line with the descriptions in EN ISO 10211 [34]. A 2D wall-section with the wood studs included was simulated to find the total heat loss through the cross-section (L2D,total). Secondly the heat loss through a 1D-section of the stud and the 1D section of the insulation layer was simulated to find L2d,wood and L2D,iso respectively. The total length of the wooden studs (including sills and beams) in the measured structures is expressed as lstud. The linear 2D thermal loss from the studs ψstud was then calculated using Equation (6).
ψ s t u d = L 2 D , t o t a l L 2 d , w o o d L 2 D , i s o l s t u d
The U-value of the measured fields (Ustructure) were calculated according to Equation (7), which is based on an area-weighing of the U-values of the parts with a continuous insulation layer (Uiso) and the corresponding area (Aiso) and the U-value (Uwood) and the area (Awood) of the sections made of wood. The total area of the structure is expressed as Astructure and is the sum of Aiso and Awood. To this, the 2D effects of the studs were added, according to Equation (7).
U s t r u c t u r e = U i s o × A i s o + U i s o × A i s o + ψ s t u d × l s t u d A s t r u c t u r e

3. Results and Discussion

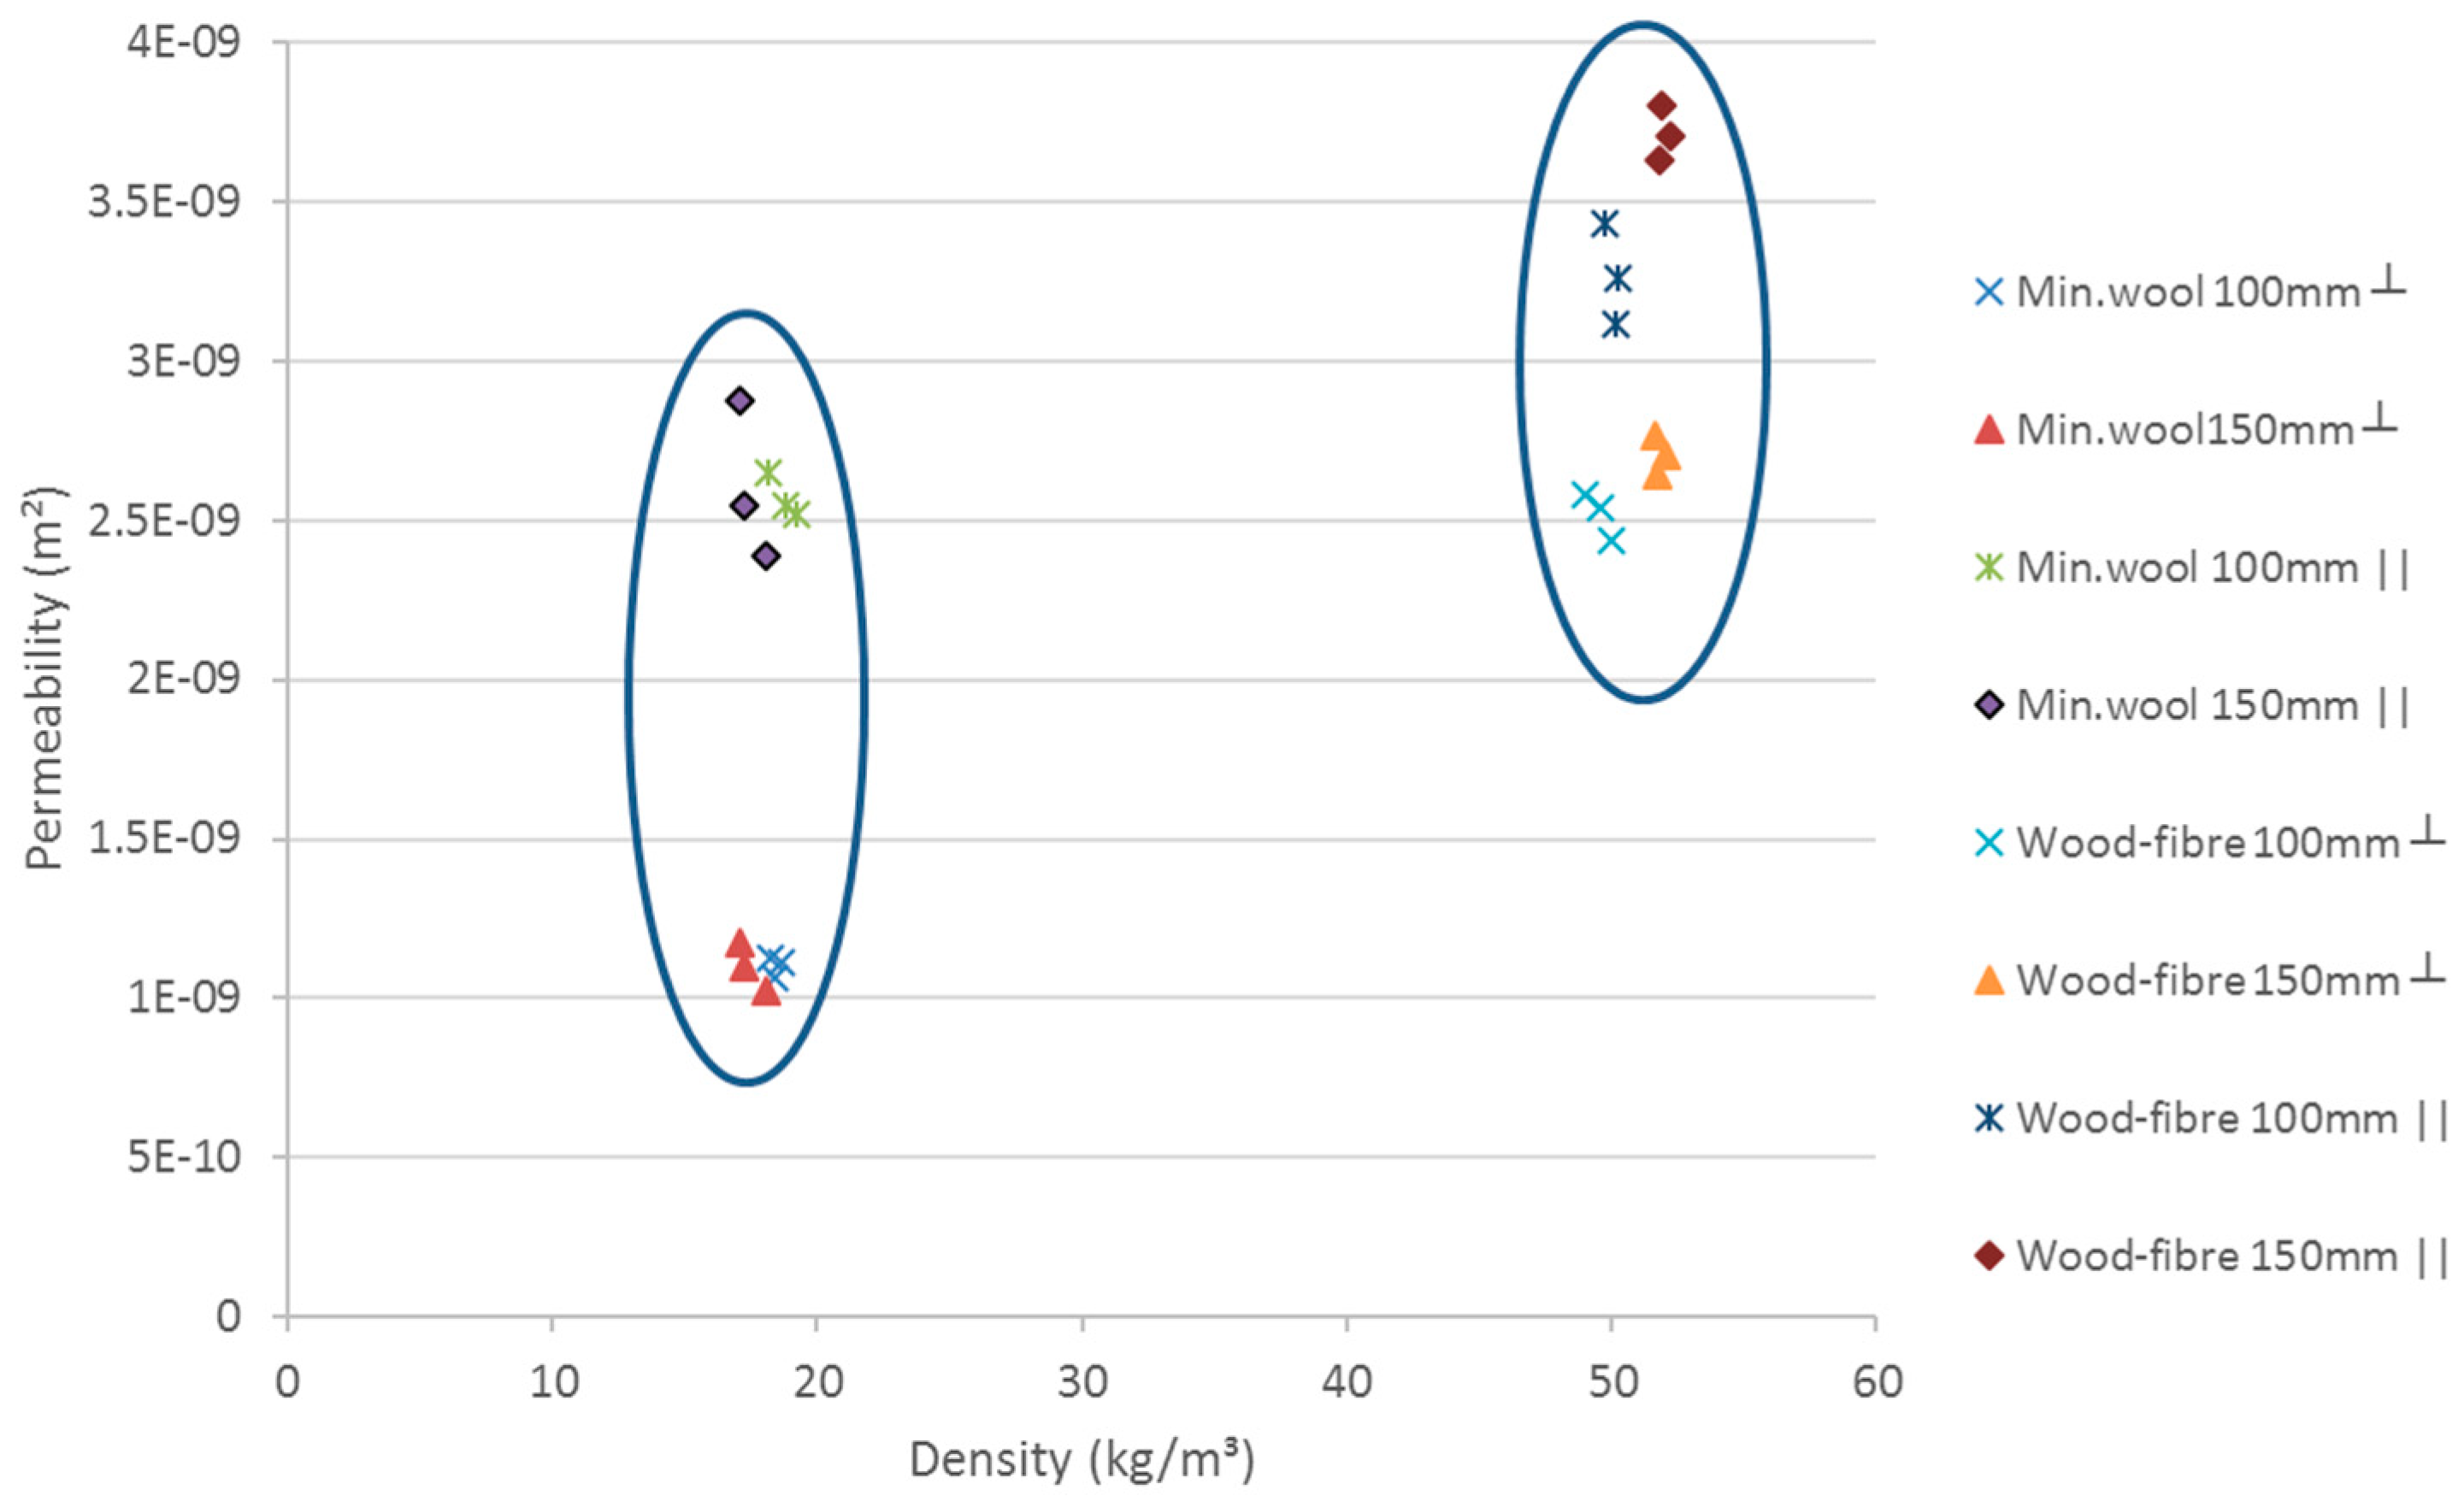
3.1. Air Permeability

Figure 3 shows the measured permeability of the 100 mm and 150 mm thick mineral wool- and wood-fibre insulation as function of the density of the glass wool. For the mineral wool insulation, the permeability was approximately twice as large parallel to the main fibre direction compared to the value perpendicular to the main fibre direction. The average value parallel to the main fibre directions was 1.1 × 10⁻⁹ m2. The corresponding value perpendicular to the fibre directions was 2.6 × 10⁻⁹ m2. These values are somewhat lower compared to the values reported by Gullbrekken et al. [20]. The densities of the mineral wool of these studies are comparable.
The difference in air permeability perpendicular and parallel to the fibre direction for the wood-fibre insulation was approximately 50%. The average measured value perpendicular to the main fibre direction was 3.5 × 10⁻⁹. The corresponding value parallel to the main fibre direction was 2.6 × 10⁻⁹. Higher permeability gives a larger calculated modified Rayleigh number. Hence, more natural convection can be expected for wood-fibre insulated constructions.

3.2. Material Level Results—Measured Values and Numbers from Literature

Based on the correlations found in the current material standard (ISO 10456) [6], an increase in the thermal conductivity of approximately 2.5% can be expected when the moisture content of wood-fibre insulation rises from about 19% to a situation where the insulation is saturated (100% moisture content). In the measurements we found that the thermal conductivity value of wood-fibre insulation increased by about 2%, see Figure 4 and Table 3. Within the uncertainties that may be related to the measurements, one can conclude that the standard calculations are confirmed by the measurements.

3.3. Full-Size Measurements

U-values from the Hot-Box measurements are shown alongside the surrounding conditions and calculated modified Rayleigh number and Nusselt number for the different tests are given in Table 4. Modified Rayleigh number is calculated according to Equations (2) and (3).

3.3.1. Angle of Inclination

For the wood-fibre insulation samples, the largest Nusselt numbers were found for the wall orientations. For the mineral wool insulation, the largest Nusselt numbers were also found for the wall orientation. A systematic correlation of the angle of inclination and Nusselt number could not be found. In general, lower Nusselt numbers were found for wood-fibre insulation compared to the mineral wool. Some of the Hot-Box measurements performed with wood-fibre insulation produced Nusselt numbers below 1. Consequently, some of the measured U-value for the roof and wall angle were lower than the flat floor measurements with no natural convection. However, this can be contributed to factors not accounted for in the uncertainty estimates of the measurements. The cooling unit used in the cold chamber of the Hot Box is decentralized from the measurement chamber itself, and cold air is supplied through a duct to the chamber. This leads to an increased air-pressure in the cold chamber relative to the measurement chamber on the warm side.
Standard surface resistance at the cold surface of the test section requires a rather high air speed along the cold surface of the test section. This implies a lower absolute pressure at the cold surface of the test section compared to the warm surface and hence possibility for convection through the test section. However, the test section was constructed as airtight as possible with a continuous vapour barrier beneath the gypsum board at the warm surface of the test section. During rebuilding of the test section, the vapour barrier was replaced in order to secure the airtightness of the test section.

3.3.2. Temperature Difference

We found that the Nusselt number is increasing by increasing temperature difference. The effect is largest for the mineral wool-measurements. The resulting Nusselt number for the 250 mm mineral wool insulated wall configuration of this study varies between 1.015 (Δθie = 20) and 1.038 (Δθie = 40) depending on the temperature difference. By increasing the insulation thickness to 400 mm the Nusselt number increases to 1.074 for the 20 K temperature difference and 1.068 for the 40 K temperature difference. For the wood-fibre insulated walls the Nusselt number for the wall configuration was rather small. This was not expected as the measured air permeability and hence a larger value of the calculated modified Rayleigh number for the wood-fibre constructions compared to the mineral wool constructions is indicating a higher Nusselt number for the constructions with wood-fibre insulation. A possible explanation is that wood-fibre insulation gives a lower practical air permeability of the insulated cavity due to a higher compressive strength, less flexibility and hence a better capability to fill the cavity. Previously the existence of such imperfections for mineral wool insulated constructions was presented by Reference [20]. However, the practical permeability of the insulated cavity was not measured.
A Nusselt number of 0.953 (Δθie = 20) and 1.001 (Δθie = 40) was calculated for the 250 mm insulated wall. For the 400 mm wall the Nusselt number increased to respective 1.011 and 1.014. Previously, Reference [16] calculated a Nusselt number of 1.07 (Δθie = 20) and 1.12 (Δθie = 40) based on Hot-Box measurements on a 200 mm mineral wool insulated timber frame. The similar Nusselt numbers for the 500 mm insulated wall of Gullbrekken et al [20] was 1.08 (Δθie = 20) and 1.15 (Δθie = 40). The Nusselt number of the 250 mm insulated wall is comparable with these previous studies. The calculated Nusselt numbers for the 400 mm wall of the previous study are considerably higher compared to these previous studies. One possible explanation could be uncertainties caused by pressure differences across the test specimen in the Hot-Box apparatus. These unaccounted-for air flows will contribute to higher measured U-values than an airtight solution without such air flows would have.

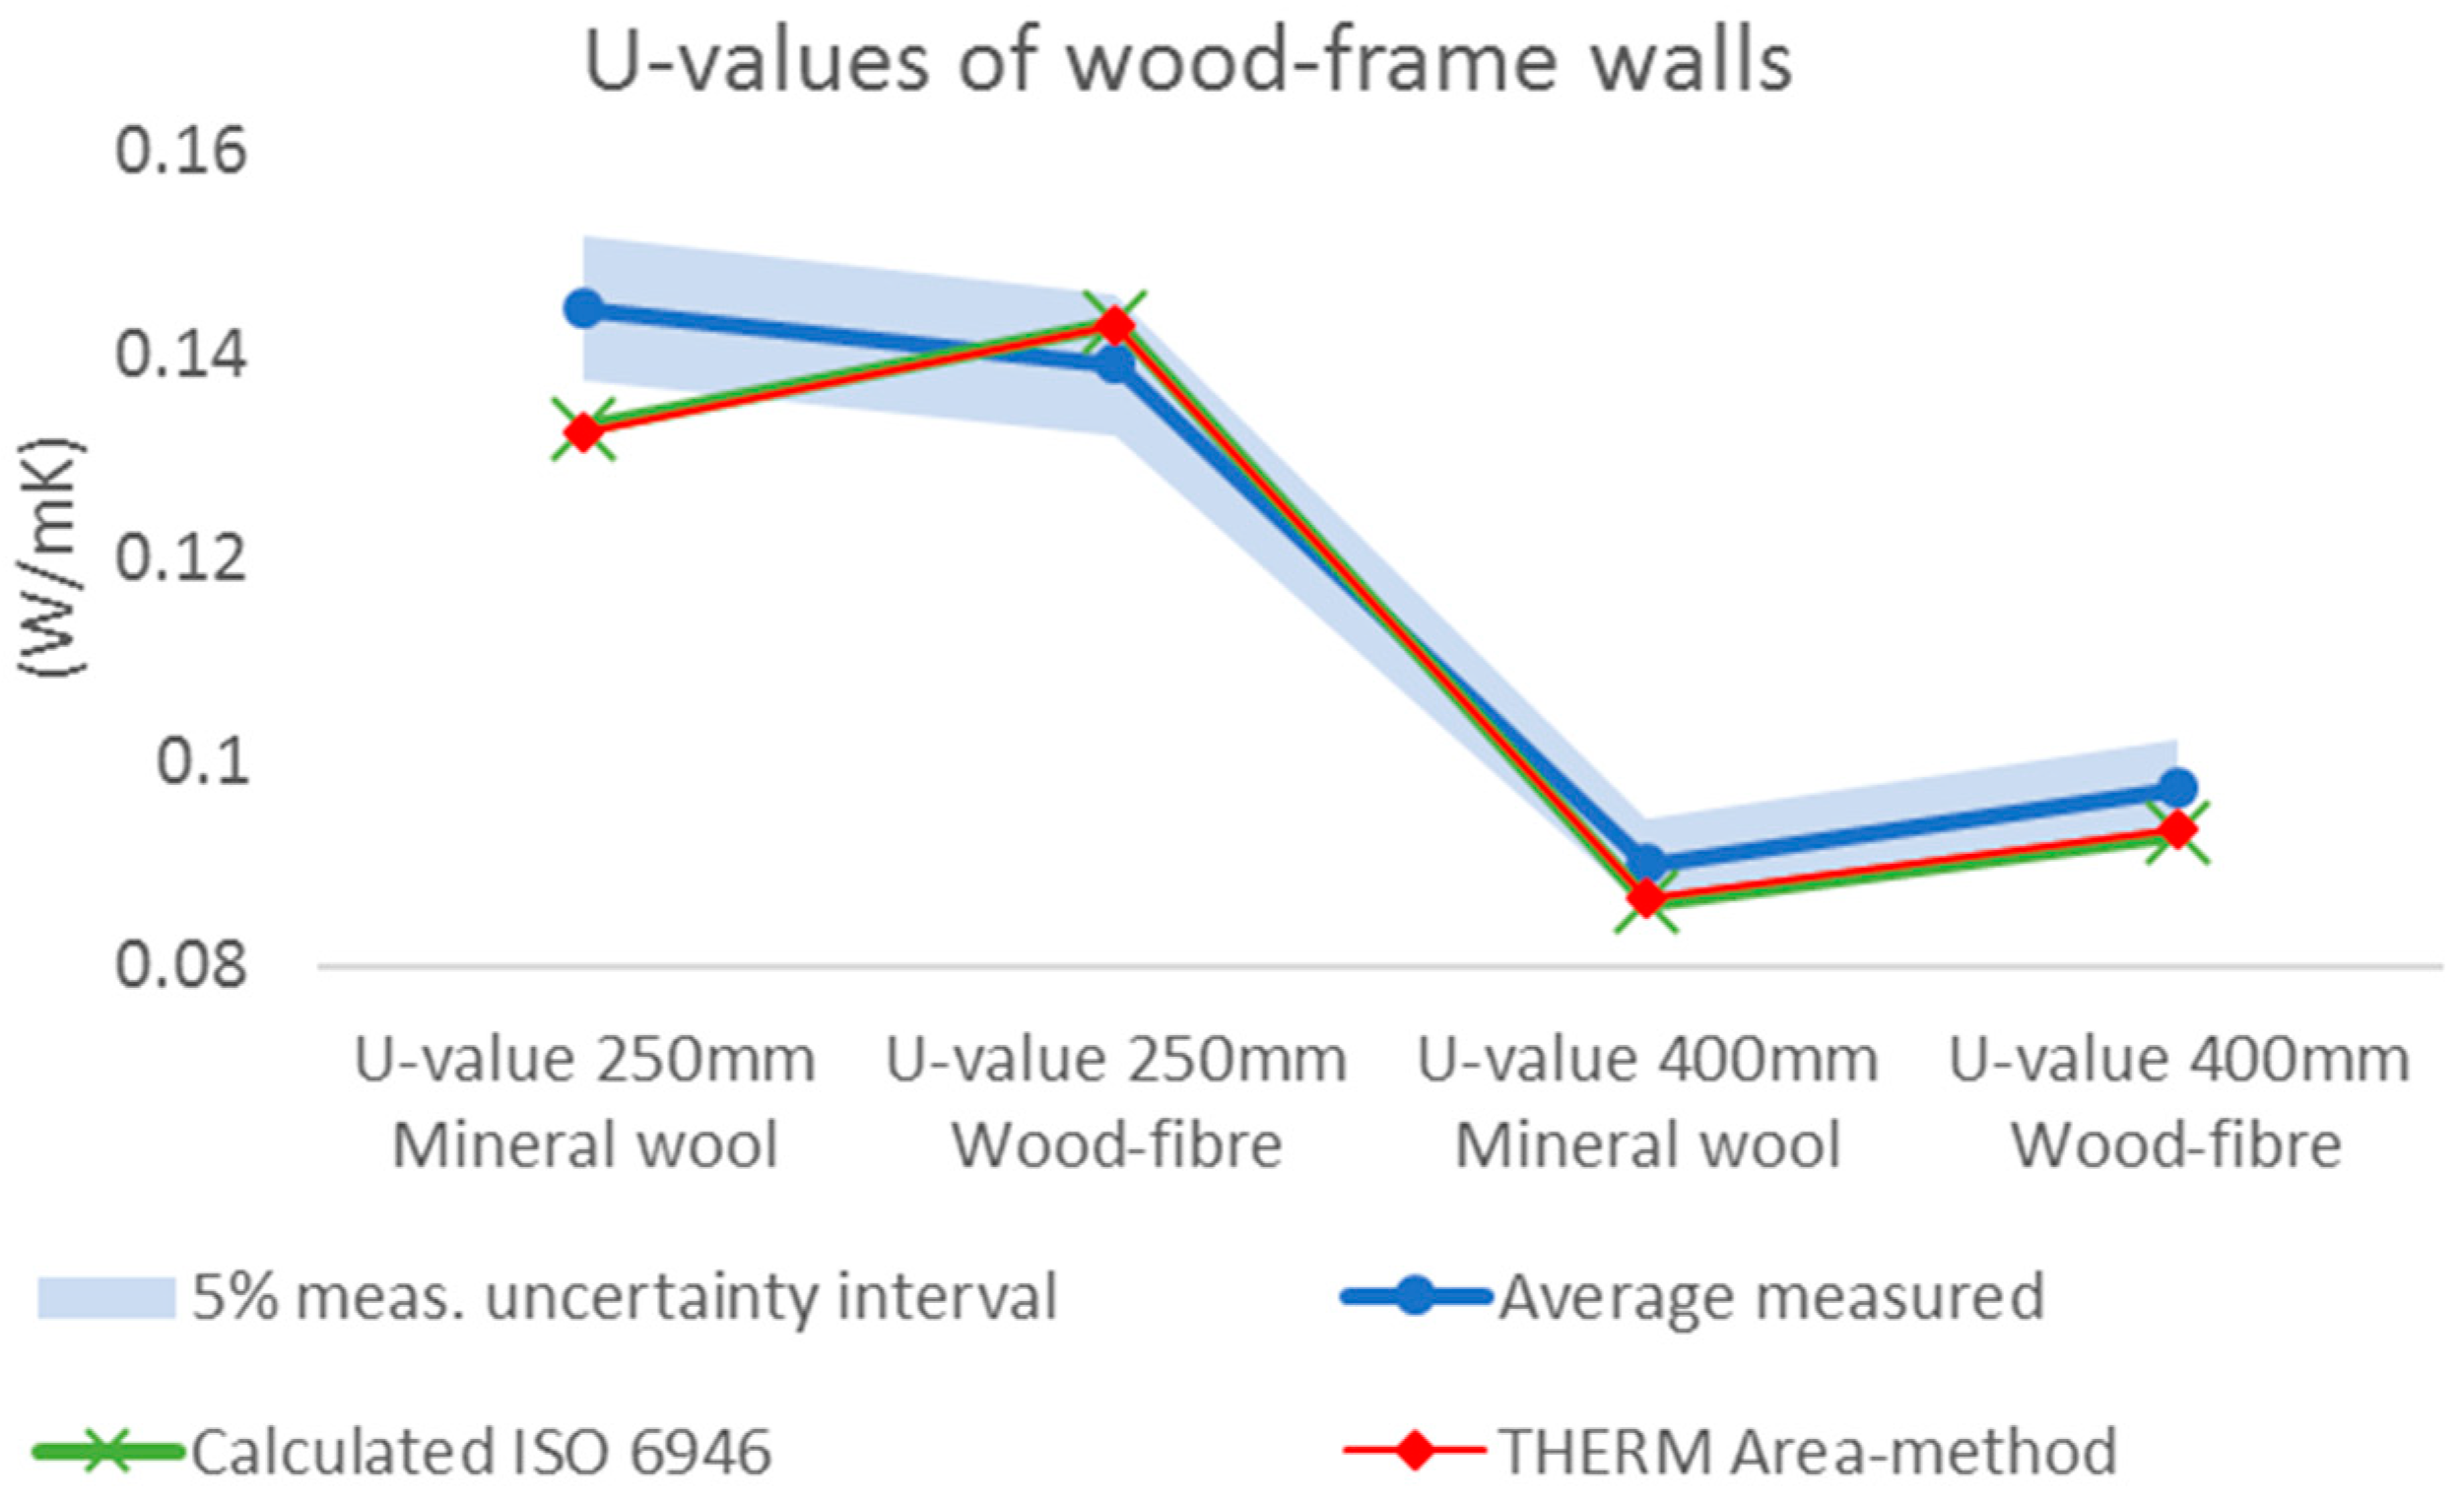
3.3.3. Measurements vs. Simulation Results

A major shortcoming of the simulation methods used is that convection in the insulation layers is difficult to account for. Hence simulated values are given under the assumption that no convection occurs. Figure 5 and Table 5 show the simulated values, using the two methods described in Section 2.5 compared to the measured values for these configurations. From the figure and table, one can see that the correlation between simulations and measurements are within the uncertainty boundaries of the measurements for three of the configurations. However, the structure with 250 mm insulation thickness and mineral wool shows a large discrepancy between the measured and calculated values. Both simulation methods underestimate the U-value compared to the measured value. However, this can be contributed to factors not accounted for in the uncertainty estimates of the measurements.
Figure 6 shows calculated U-values for walls insulated with mineral wool alongside calculated values using the measured thermal conductivities of dry and moist (16 weight-%) wood-fibre insulation for different wood-shares. The wood-share of the walls measured in the Hot Box were 7%. As one can see, the 250 mm and 400 mm wood-fibre insulated walls have approximately 8% higher calculated U-values than the mineral wool. If one accounts for moisture in the wood-fibre, the difference increases to approximately 11% for the 250 mm walls and 12% for the 400 mm walls.
To achieve the same U-value for the wood-fibre insulated wall as the mineral wool, it is necessary to add 20 mm insulation to the 250 mm wall and approximately 30 mm for the 400 mm wall.
The increased moisture level in the wood-fibre insulation corresponds to a need for an additional insulation thickness of 7 mm the 250 mm wall and 13 mm for the 400 mm walls to maintain the same U-value as the dry insulation.

4. Conclusions

In this paper, we set out to investigate whether there are differences in the efficiency of thermal insulation materials at different moisture levels in the insulation and if there is a larger or smaller risk of natural convection in wood-fibre based insulation than in mineral wool.
  • Measurements of thermal conductivity showed that the thermal performance of the insulation is unaffected by moisture in the hygroscopic range.
  • Air permeability of wood-fibre insulation was found to be somewhat higher to that of mineral wool despite a higher density.
  • The largest U-values and Nusselt numbers was measured for the wall configurations. A smaller effect of natural convection was found in wood-fibre compared to mineral wool insulation.

Author Contributions

L.G. was the main author of the article. In cooperation with S.G. and J.E.G. he has been responsible and performed the laboratory design including design and construction of the laboratory model and the laboratory measurements. He has also performed the data analysis of the laboratory measurements. S.G. has with his extensive expertise within the field of practical building physics contributed with advice and quality insurance of the laboratory design. He has also performed the calculations of the U-values of different construction variants. He has also commented on several drafts of the manuscript. J.E.G. has through his long expertise within the field of building physics contributed with design of the laboratory testing of thermal properties of the insulation materials. He has also commented on several drafts of the manuscript.

Funding

This research was funded by Norwegian research counsil, grant number 257660.

Acknowledgments

The authors gratefully acknowledge the support from the Research Council of Norway and several partners through the Research Center on Zero Emission Neighbourhoods in Smart Cities (FME ZEN) under grant No. 257660.

Conflicts of Interest

The authors declare no conflicts of interest.

References

  1. Sustainable Neighbourhoods with Zero Greenhouse Gas Emissions. 2018. Available online: https://fmezen.no/ (accessed on 31 August 2018).
  2. Hestnes, A.G.; Eik-Nes, N.L. Zero Emission Buildings; Fagbokforlaget: Bergen, Norway, 2017. [Google Scholar]
  3. Budaiwi, I.; Abdou, A. The impact of thermal conductivity change of moist fibrous insulation on energy performance of buildings under hot–humid conditions. Energy Build. 2013, 60, 388–399. [Google Scholar] [CrossRef]
  4. Jiřičková, M.; Černý, R. Effect of hydrophilic admixtures on moisture and heat transport and storage parameters of mineral wool. Constr. Build. Mater. 2006, 20, 425–434. [Google Scholar] [CrossRef]
  5. Vololonirina, O.; Coutand, M.; Perrin, B. Characterization of hygrothermal properties of wood-based products–Impact of moisture content and temperature. Constr. Build. Mater. 2014, 63, 223–233. [Google Scholar] [CrossRef]
  6. NS-EN ISO 10456. Hygrothermal Properties—Tabulated Design Values and Procedures for Determining Declared and Design Thermal Values; Standard Norge: Oslo, Norway, 2017. [Google Scholar]
  7. Uvsløkk, S.H.; Skogstad, B.; Grynning, S. How to prevent natural convection causing extra heat lodd and moisture problems in thick insulation layers. In Proceedings of the 3rd Nordic Passive House Conference by Passivehus Norden, Aalborg, Denmark, 7–8 October 2010. [Google Scholar]
  8. Gullbrekken, L.; Geving, S.; Time, B.; Andresen, I.; Holme, J. Moisture conditions in well-insulated wood-frame walls. Simulations, laboratory measurements and field measurements. Wood Mater. Sci. Eng. 2015, 10, 232–244. [Google Scholar] [CrossRef]
  9. Geving, S. Fuktskader Årsaker, Utbedringer og tiltak; SINTEF Byggforsk: Trondheim, Norway, 2011. [Google Scholar]
  10. Bankvall, C. Natural Convective Heat Transfer in Insulated Structures; Report 38; Division of Building and Technology, Lund Institute of Technology: Lund, Sweden, 1972. [Google Scholar]
  11. Lecompte, J. The influence of natural convection on the thermal quality og insulated cavity construction. J. Cib 1990, 6, 349–354. [Google Scholar]
  12. Johannessen, E. Hot-Box Målinger på Høyisolerte Bygningskonstruksjoner. Master’s Thesis, Norwegian Techniqual School (NTH), Trondheim, Norway, 1995. [Google Scholar]
  13. Jordanger, G.O. Naturlig Konveksjon i Vegger Laboratorieforsøk. Master’s Thesis, Norwegian Techniqual School (NTH), Trondheim, Norway, 1995. [Google Scholar]
  14. Bjerkevoll, G.O. Hot-Box Måliner på Høyisolerte Bygningskonstruksjoner. Master’s Thesis, Norwegian Techniqual School (NTH), Trondheim, Norway, 1994. [Google Scholar]
  15. Uvsløkk, S.; Skogstad, H.B.; Aske, I.J. Natural Convection in Timber Frame Walls with Thick Thermal Insulation Layer; VTT Building Technology: Espoo, Finland, 1996. [Google Scholar]
  16. Janssen, H. Thermal Performance of Highly Insulated Wood Frame Walls. Master’s Thesis, Katholieke Universiteit Leuven, Leuven, Belgium, 1997. [Google Scholar]
  17. Shankar, V.; Hagentoft, C.E. A Numerical Study of Effect of Natural Convection on Thermal Properties of Horizontal Oriented Porous Insulation. J. Build. Phys. 2000, 24, 155–167. [Google Scholar] [CrossRef]
  18. Dyrbøl, S.; Svendsen, S.; Elmroth, A. Experimental Investigation of the Effect of Natural Convection on Heat Transfer in Mineral Wool. J. Build. Phys. 2002, 26, 153–164. [Google Scholar] [CrossRef]
  19. Wahlgren, P. Overview and Literature Survey of Natural and Forced Convection in Attic Insulation. J. Build. Phys. 2007, 30, 351–370. [Google Scholar] [CrossRef] [Green Version]
  20. Gullbrekken, L.; Uvslokk, S.; Kvande, T.; Time, B. Hot-Box measurements of highly insulated wall, roof and floor structures. J. Build. Phys. 2017, 41, 58–77. [Google Scholar] [CrossRef]
  21. Roels, S.; Langmans, J. Highly insulated pitched roofs resilient to air flow patterns: Guidelines based on a literature review. Energy Build. 2016, 120, 10–18. [Google Scholar] [CrossRef]
  22. Geving, S.; Uvsløkk, S. Moisture conditions in timber frame roof and wall structures. In Project Report 273; Norwegian Building Research Institute: Trondheim, Norway, 2000. [Google Scholar]
  23. Økland, Ø. Convection in Highly-Insulated Building Structures. Ph.D. Thesis, Department of Civil and Transport Engineering, Norwegian University of Science and Technology, Trondheim, Norway, 1998. [Google Scholar]
  24. Langmans, J.; Klein, R.; Roels, S. Hygrothermal risks of using exterior air barrier systems for highly insulated light weight walls: A laboratory investigation. Build. Environ. 2012, 56, 192–202. [Google Scholar] [CrossRef] [Green Version]
  25. Kalamees, T.; Kurnitski, J. Moisture Convection Performance of External Walls and Roofs. J. Build. Phys. 2010, 33, 225–247. [Google Scholar] [CrossRef]
  26. British Standards Institution. Thermal Insulation—Determination of Steady-State Thermal Transmission Properties—Calibrated and Guarded Hot Box; Standard Norge: Oslo, Norway, 1996. [Google Scholar]
  27. NS-ISO 9053. Acoustics Materials for Acoustical Applications Determination of Airflow Resistance; Standard Norge: Oslo, Norway, 1993. [Google Scholar]
  28. ISO 8301. Thermal insulation—Determination of Steady-State Thermal Resistance and Related Properties—Heat Flow Meter Apparatus; Standard Norge: Oslo, Norway, 1991. [Google Scholar]
  29. NS-EN 12667:2001. Byggematerialers og produkters termiske egenskaper—Bestemmelse av varmemotstand ved skjermet og uskjermet varmestrømmåler—Produkter med høy og middels varmemotstand; Standard Norge: Oslo, Norway, 2001. [Google Scholar]
  30. NS-EN 13171:2012. Thermal Insulation Products for Buildings Factory Made Wood Fibre (WF) Products Specification; Standard Norge: Oslo, Norway, 2012. [Google Scholar]
  31. Grynning, S.; Misiopecki, C.; Uvsløkk, S.; Time, B.; Gustavsen, A. Thermal performance of in-between shading systems in multilayer glazing units: Hot-box measurements and numerical simulations. J. Build. Phys. 2015, 39, 147–169. [Google Scholar] [CrossRef]
  32. NS-EN ISO 6946:2017. Building Components and Building Elements Thermal Resistance and Thermal Transmittance Calculation Methods; Standard Norge: Oslo, Norway, 2017. [Google Scholar]
  33. THERM Version 7.6.1. Available online: https://windows.lbl.gov/software/therm (accessed on 20 February 2019).
  34. NS-EN 10211:2017. Thermal Bridges in Building Construction Heat Flows and Surface Temperatures Detailed Calculations; Standard Norge: Oslo, Norway, 2017. [Google Scholar]
Figure 1. Principle of the apparatus used to measure the air permeability of the insulation material samples. The units for the numbers in the figure are mm.
Buildings 09 00049 g001
Figure 2. (a) Front elevation of the test section. (b) Picture of the frame of the ISO3 PUR insulated frame ready for insulation. (c) Test section positioned as floor in the Hot-Box apparatus. (d) Angle of inclination of test section in the Hot Box is 30°.
Buildings 09 00049 g002
Figure 3. Measured permeability perpendicular and parallel to the main fibre direction performed with mineral wool and wood-fibre insulation.
Buildings 09 00049 g003
Figure 4. Measured and calculated (according to NS-EN ISO 10456) thermal conductivity of wood-fibre insulation as function of moisture content.
Buildings 09 00049 g004
Figure 5. Calculated U-values of wood-frame walls. The calculations are performed according to ISO 6946 and by using THERM.
Buildings 09 00049 g005
Figure 6. Wood-share and moisture effects on the thermal transmittance (U-value) of the 250 mm (a) and 400 mm (b) walls. Note the different scales on y-axes.
Buildings 09 00049 g006
Table 1. Material specimen properties and test conditions for the thermal conductivity measurements. t, state the thickness of the insulation batten in mm, ρ state the measured density of the different specimen in (kg/m3), T states the temperature (°C) and RH (%) states the relative humidity of the room where the samples were stored before testing.
Sample
Number
Materialt
(mm)
ρ
(kg/m3)
T
(°C)
RH
(%)
1Wood fibre10051.2350
2Wood fibre15054.22350
3Wood fibre10056.42375
4Wood fibre15053.62375
5Wood fibre10047.82020
6Wood fibre15050.52020
7Mineral wool10017.42020
8Mineral wool15017.02020
Table 2. Overview of test parameters and conditions during the different Hot-Box measurements. “x” denotes the build up of the different variants.
Test VariantAngle of InclinationTemperature Cold RoomTemperature Warm RoomInsulation TypeInsulation Thickness
30901800−102030Min.Wood250400
1x x x x x
2 x x x x x
3 xx x x x
4x x xx x
5 x x xx x
6 x x xx x
7x x x xx
8 x x x xx
9 xx x xx
10x x x xx
11 x x x xx
12 x x x xx
13x x x x x
14 x x x x x
15 xx x x x
16x x xx x
17 x x xx x
18 x x xx x
19x x x x x
20 x x x x x
21 xx x x x
22x x x x x
23 x x x x x
24 x x x x x
Table 3. Measured and calculated (according to NS-EN ISO 10456) thermal conductivity of wood-fibre insulation as function of moisture content.
Thermal Conductivity (W/mK)Moisture Content (weight-%)
dry18.792.4Saturated
Measured 0.037 ± 0.0010.037 ± 0.0010.038 ± 0.001
Calculated according to
NS-EN ISO 10456
0.0370.0370.0370.038
Table 4. Results from the Hot-Box measurements.
Insulation Thickness (mm)θi
(C)
θi
(C)
θi
(C)
Δθie
(C)
Angle
(deg)
Measured U-Value (W/m2 K)Calculated U-Value (W/m2 K)Modified Rayleigh Number (-)Nusselt Number (-)
Min. wool2502001020900.144 ± 0.0080.1331.3381.015
25030−101040900.148 ± 0.008 2.6761.038
2502001020300.142 ± 0.008 1.3380.998
25030−101040300.145 ± 0.008 2.6761.014
25020010201800.142 ± 0.008 1.3381.000
25030−1010401800.143 ± 0.008 2.6761.000
Wood fibre2502001020900.139 ± 0.0080.1431.6760.953
25030−101040900.148 ± 0.008 3.3521.001
2502001020300.142 ± 0.008 1.6760.974
25030−101040300.146 ± 0.008 3.3520.992
25020010201800.146 ± 0.008 1.6761.000
25030−1010401800.147 ± 0.008 3.3521.000
Min. wool4002001020900.090 ± 0.0050.0871.6761.074
40030−101040900.097 ± 0.005 3.3521.068
4002001020300.091 ± 0.005 1.6761.083
40030−101040300.093 ± 0.005 3.3521.022
40020010201800.084 ± 0.005 1.6761.000
40030−1010401800.091 ± 0.005 3.3521.000
Wood fibre4002001020900.097 ± 0.0050.0932.6661.011
40030−101040900.103 ± 0.006 5.3311.014
4002001020300.096 ± 0.005 2.6660.995
40030−101040300.103 ± 0.006 5.3311.014
40020010201800.096 ± 0.005 2.6661.000
40030−1010401800.102 ± 0.006 5.3311.000
Table 5. Measured and calculated U-values for the different wall configurations.
U-Values (W/m2 K)Wall Configuration
250 mm
Mineral Wool
250 mm
Wood-Fibre
400 mm
Mineral Wool
400 mm
Wood-Fibre
Measured *0.145 ± 0.0070.139 ± 0.0070.090 ± 0.0050.098 ± 0.005
Calculated according to THERM Area-method0.1320.1430.0870.093
Moist insulation (16 weight-%) 0.148 0.096
Calculated according to NS-EN ISO 69460.1330.1430.0860.093
Moist insulation
(16 weight-%)
0.147 0.096
* Uncertainties are stated for a 95% confidence interval.

