Article

Seismic Performance of High-Rise Condominium Building during the 2015 Gorkha Earthquake Sequence

1
Earthquake Resistant Technology Development and Consultancy Center, Kathmandu 44621, Nepal
2
Institute of Engineering, Pulchowk Campus, Lalitpur 44700, Nepal
3
Structural and Geotechnical Dynamics Laboratory, StreGa, DiBT, University of Molise, CB 86100 Campobasso, Italy
*
Author to whom correspondence should be addressed.
Buildings 2019, 9(2), 36; https://doi.org/10.3390/buildings9020036
Submission received: 27 November 2018 / Revised: 26 January 2019 / Accepted: 28 January 2019 / Published: 30 January 2019

Abstract

:
On 25 April 2015, a strong earthquake of magnitude 7.8 struck central Nepal including the capital city, Kathmandu. Several powerful aftershocks of magnitude 6.7, 6.9 and 7.3 together with hundreds of aftershocks of local magnitude greater than 4 hit the same area until May 2015. This earthquake sequence resulted in considerable damage to the reinforced concrete buildings apart from brick and stone masonry constructions. High-rise buildings in Nepal are mainly confined in Kathmandu valley and their performance was found to be in the life safety to collapse prevention level during the Gorkha earthquake sequence. In this paper, seismic performance assessment of a reinforced concrete apartment building with brick infill masonry walls that sustained life safety performance level is presented. Rapid visual assessment performed after the 12 May aftershock (MW 7.3) highlighted the need for detailed assessment, thus, we carried out nonlinear time history analysis using the recorded accelerograms. The building was first simulated for the recorded acceleration time history (PGA = 0.16 g) and the PGA was scaled up to 0.36 g to assess the behaviour of building in the case of the maximum considered earthquake occurrence. The sum of results and observations highlighted that the building sustained minor damage due to low PGA occurrence during the Gorkha earthquake and considerable damage would have occurred in the case of 0.36 g PGA.

1. Introduction

High-rise apartment building construction in Nepal started mainly after 2000 and most of such constructions are constructed within Kathmandu valley. The density of high-rise construction is greater towards the southern part of Kathmandu valley than in any other parts of the city. As the horizontal expansion of the settlements is almost saturated in Kathmandu valley, medium to high rise buildings are the only option to meet the growing housing demand. Medium to high rise buildings in Nepal are special moment resisting frame (SMRF) constructions designed per Indian Standard Code (ISC) [1]. Before the 2015 Gorkha earthquake, there were 70 high-rise apartments in Kathmandu valley. Among them, two were red tagged (non-habitable) after the Gorkha earthquake and the performance level was ‘life safety’ in rest of the apartment buildings. Several other studies (e.g., Gautam et al. [2], Gautam and Chaulagain [3], among others) present generic observation reports of various types of existing buildings in Kathmandu valley and other affected areas; however, results of analytical models are limited (e.g., Barbosa et al. [4]). Varum et al. [5] performed ambient vibration measurements in some medium to high-rise buildings in Kathmandu valley after the Gorkha earthquake to have insights of the damages focusing on the effects of infill masonry. Gautam et al. [6] recently formulated the taxonomy and vulnerability of Nepali residential buildings and they placed medium to high rise RC buildings under D-E vulnerability class per EMS-98 vulnerability classification system [7].
Post-earthquake damage assessment and validation efforts are important to understand the behaviour of the structures under extreme loading. Several studies (e.g., [4,5,6,7,8,9], among others) in the past focused on the same approach used in this study. On the other hand, quite a few studies (e.g., [10,11,12]) focused on the seismic performance and vulnerability of medium-to-high rise buildings after significant earthquakes in Italy and Spain as well. Similarly, Westenenk et al. [13] conducted field survey and analysed some buildings after the 2010 Maule earthquake in Chile. They concluded that less than 10% elements were damaged due to the Maule earthquake as the structures were not capable of distributing the damage. Scawthon [14] reported the damage in all building typologies after the 2004 Niigata earthquake in Japan and concluded that newer constructions performed better than other building types. Holliday and Grant [15] presented an account of collapsed and survived buildings during the 2010 Haiti earthquake. Similar case studies were also presented by Gautam and Rodrigues [16] for the buildings affected by several earthquakes in Nepal. The Icelandic building damage scenario was presented by Rupakhety et al. [17]. Computational aspects of infill masonry and performance of similar types of buildings are reported by several researchers worldwide (e.g., [18,19,20,21,22]). In most of the contributions, researchers performed damage assessment in the beginning and then analysed the same structures using finite element modelling. Some of the post-earthquake damage assessment studies extended their works to disseminate the vulnerability of building classes as well. Thus, it is clear that post-earthquake damage assessment and subsequent interpretations or modelling are very important to understand the seismic behaviour of typical building classes.
Aiming to depict the seismic performance of a condominium located in Kathmandu, this study presents the details of damage recorded during the field reconnaissance. Thereafter then three-dimensional finite element modelling was done for the same building. Description of the case study block, site condition, strong ground motion and visual damage observation are presented together with the results of nonlinear time history analysis to highlight the seismic performance of condominium buildings in the case of low to moderate PGA occurrence.

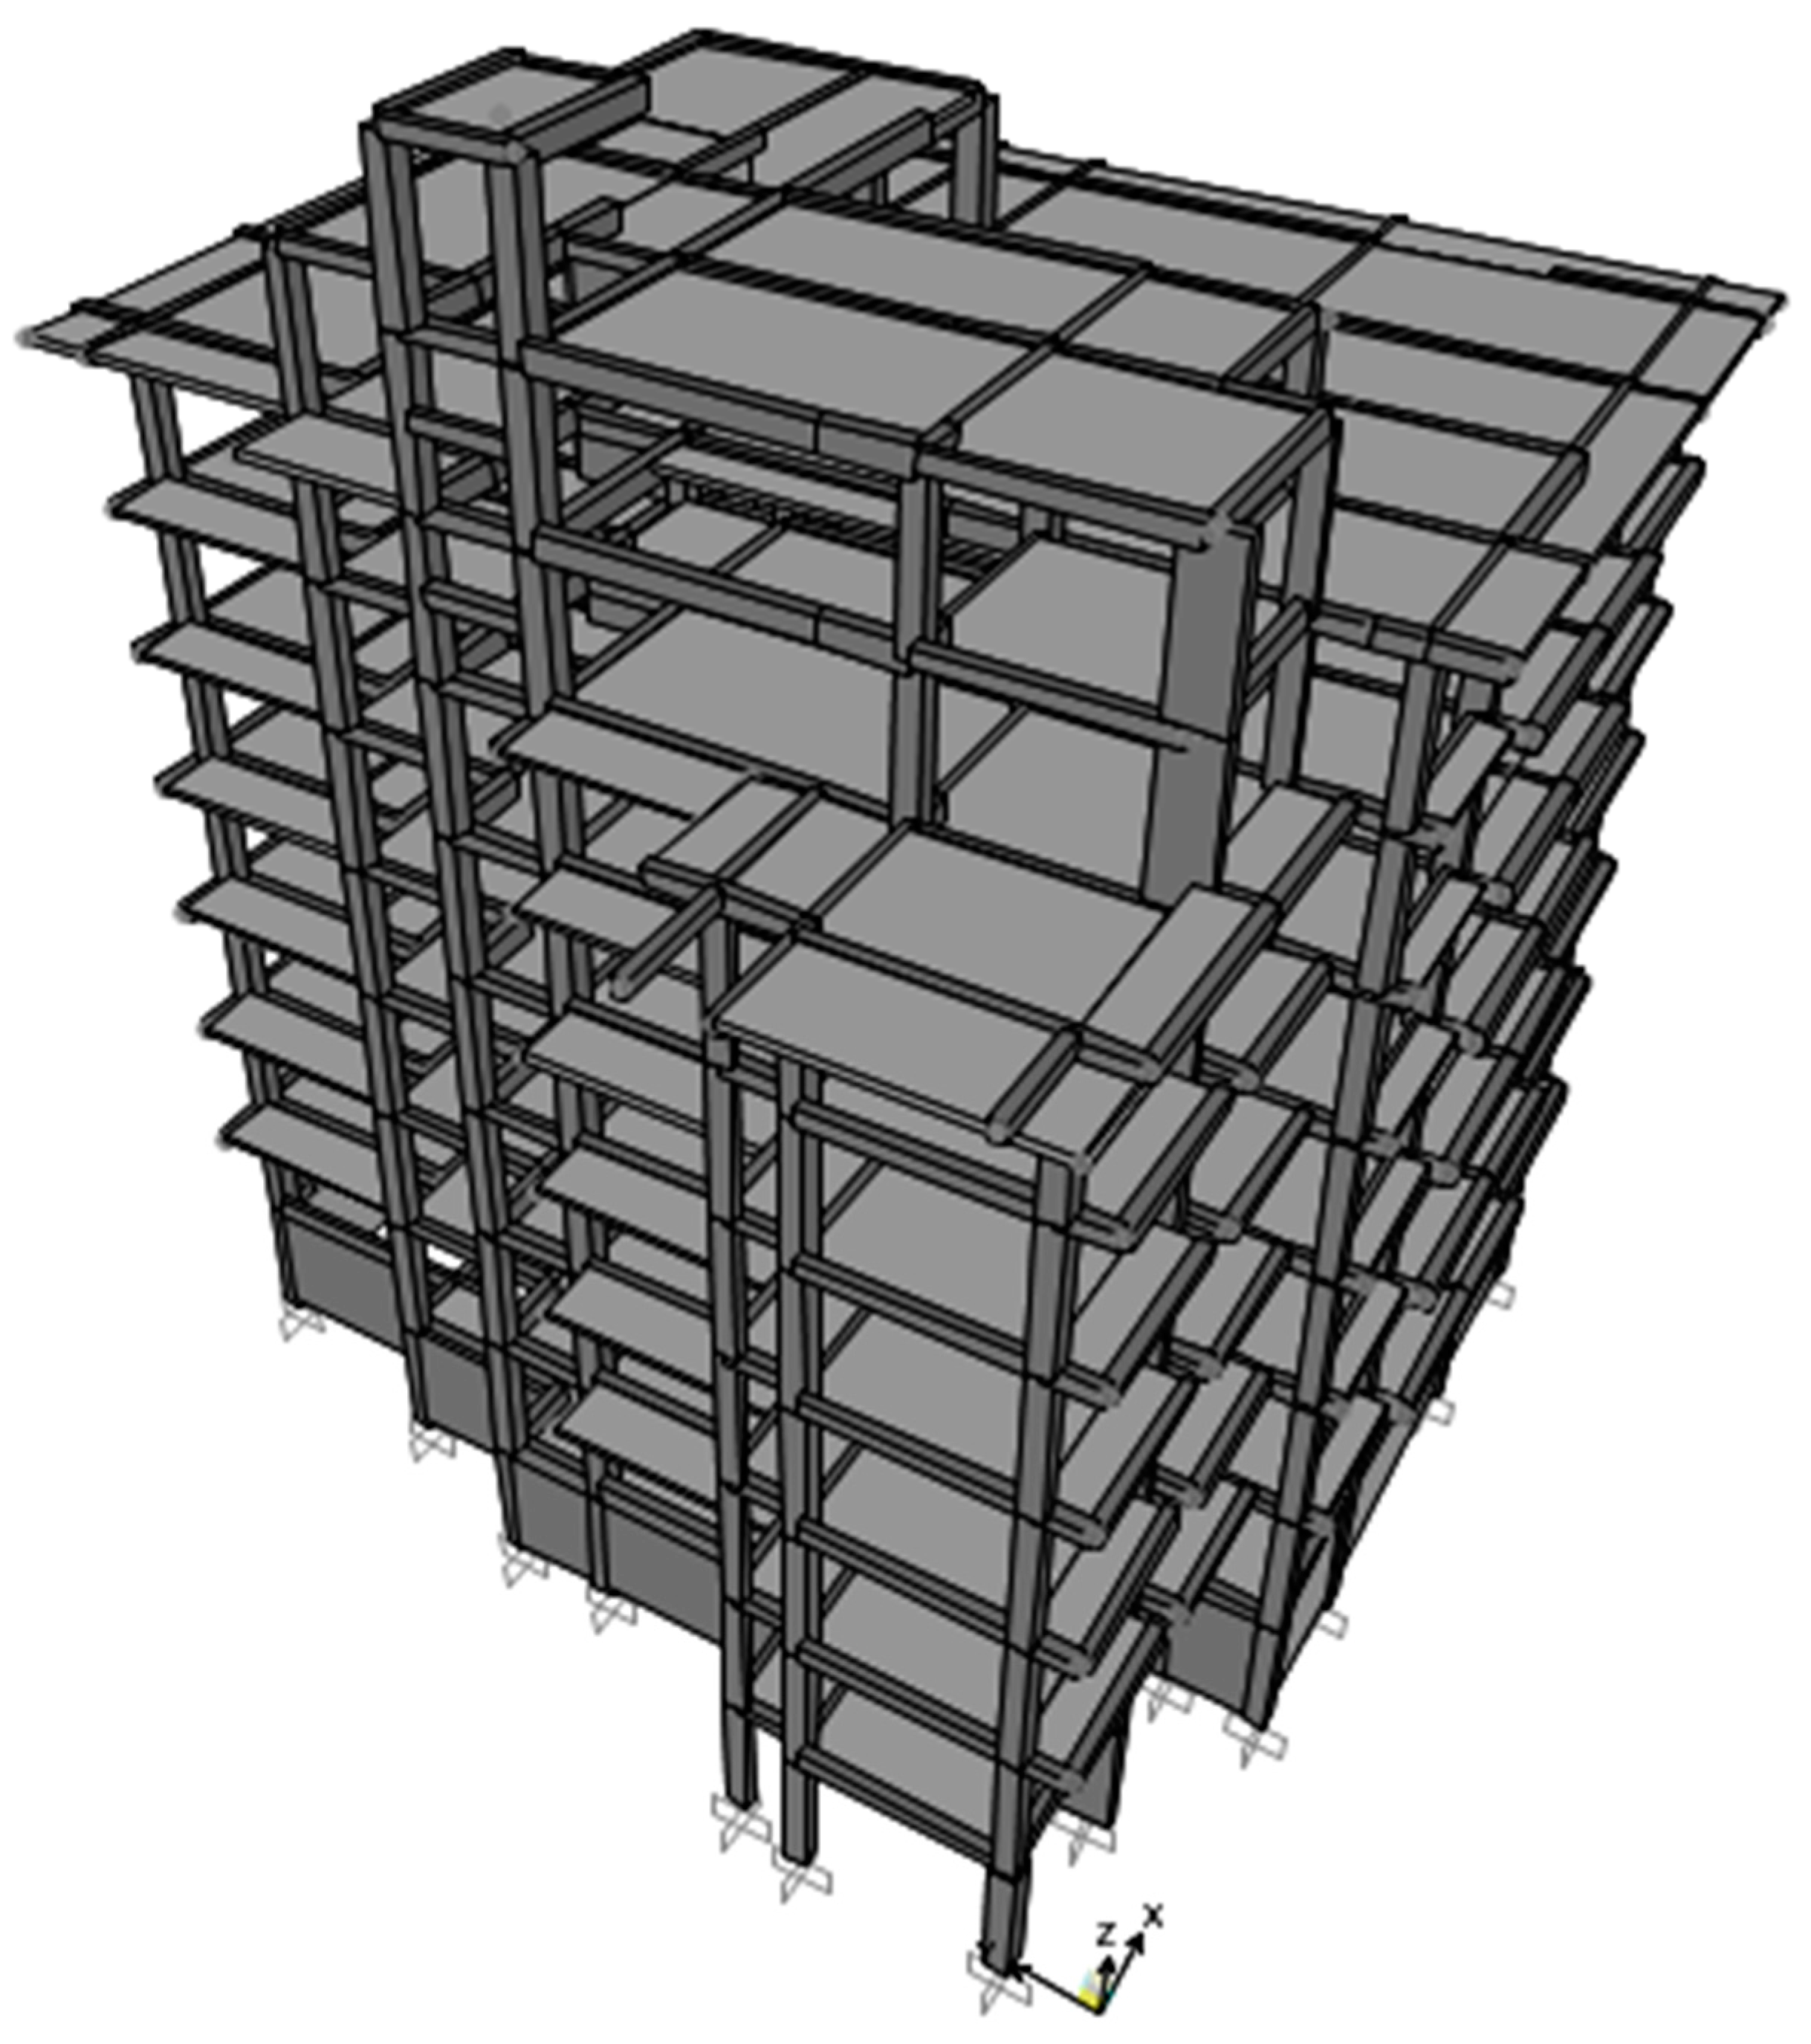
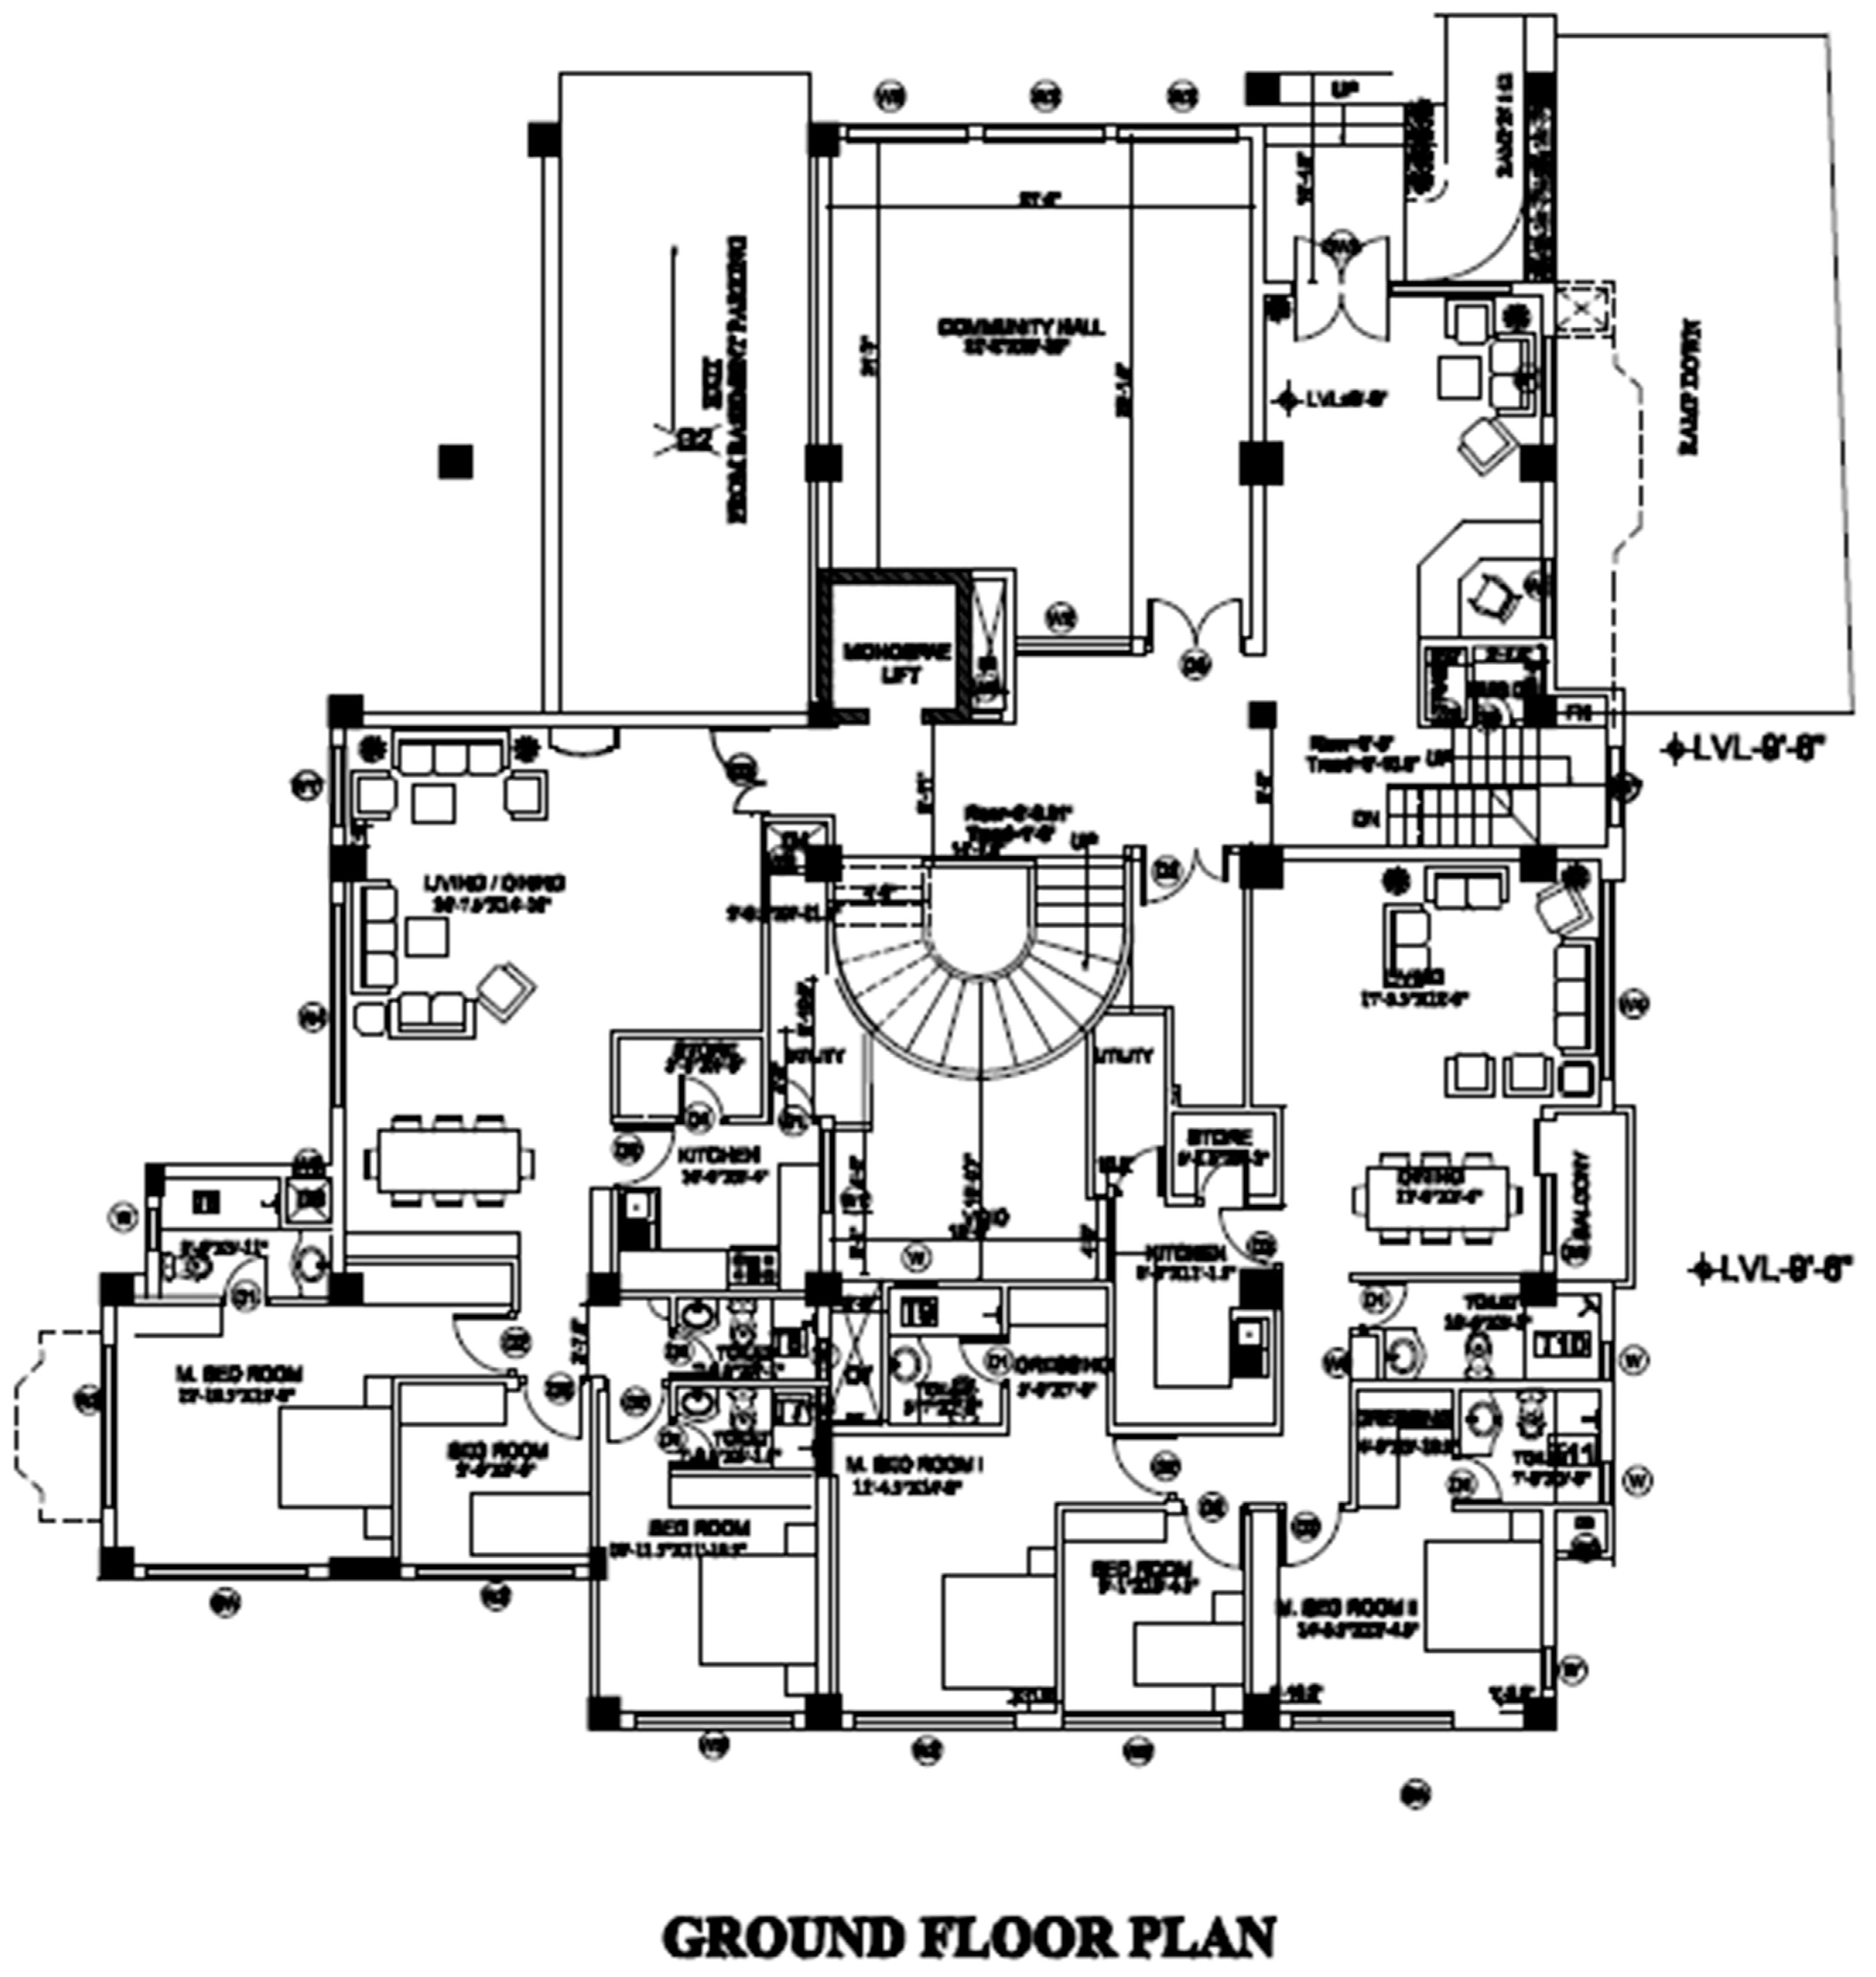
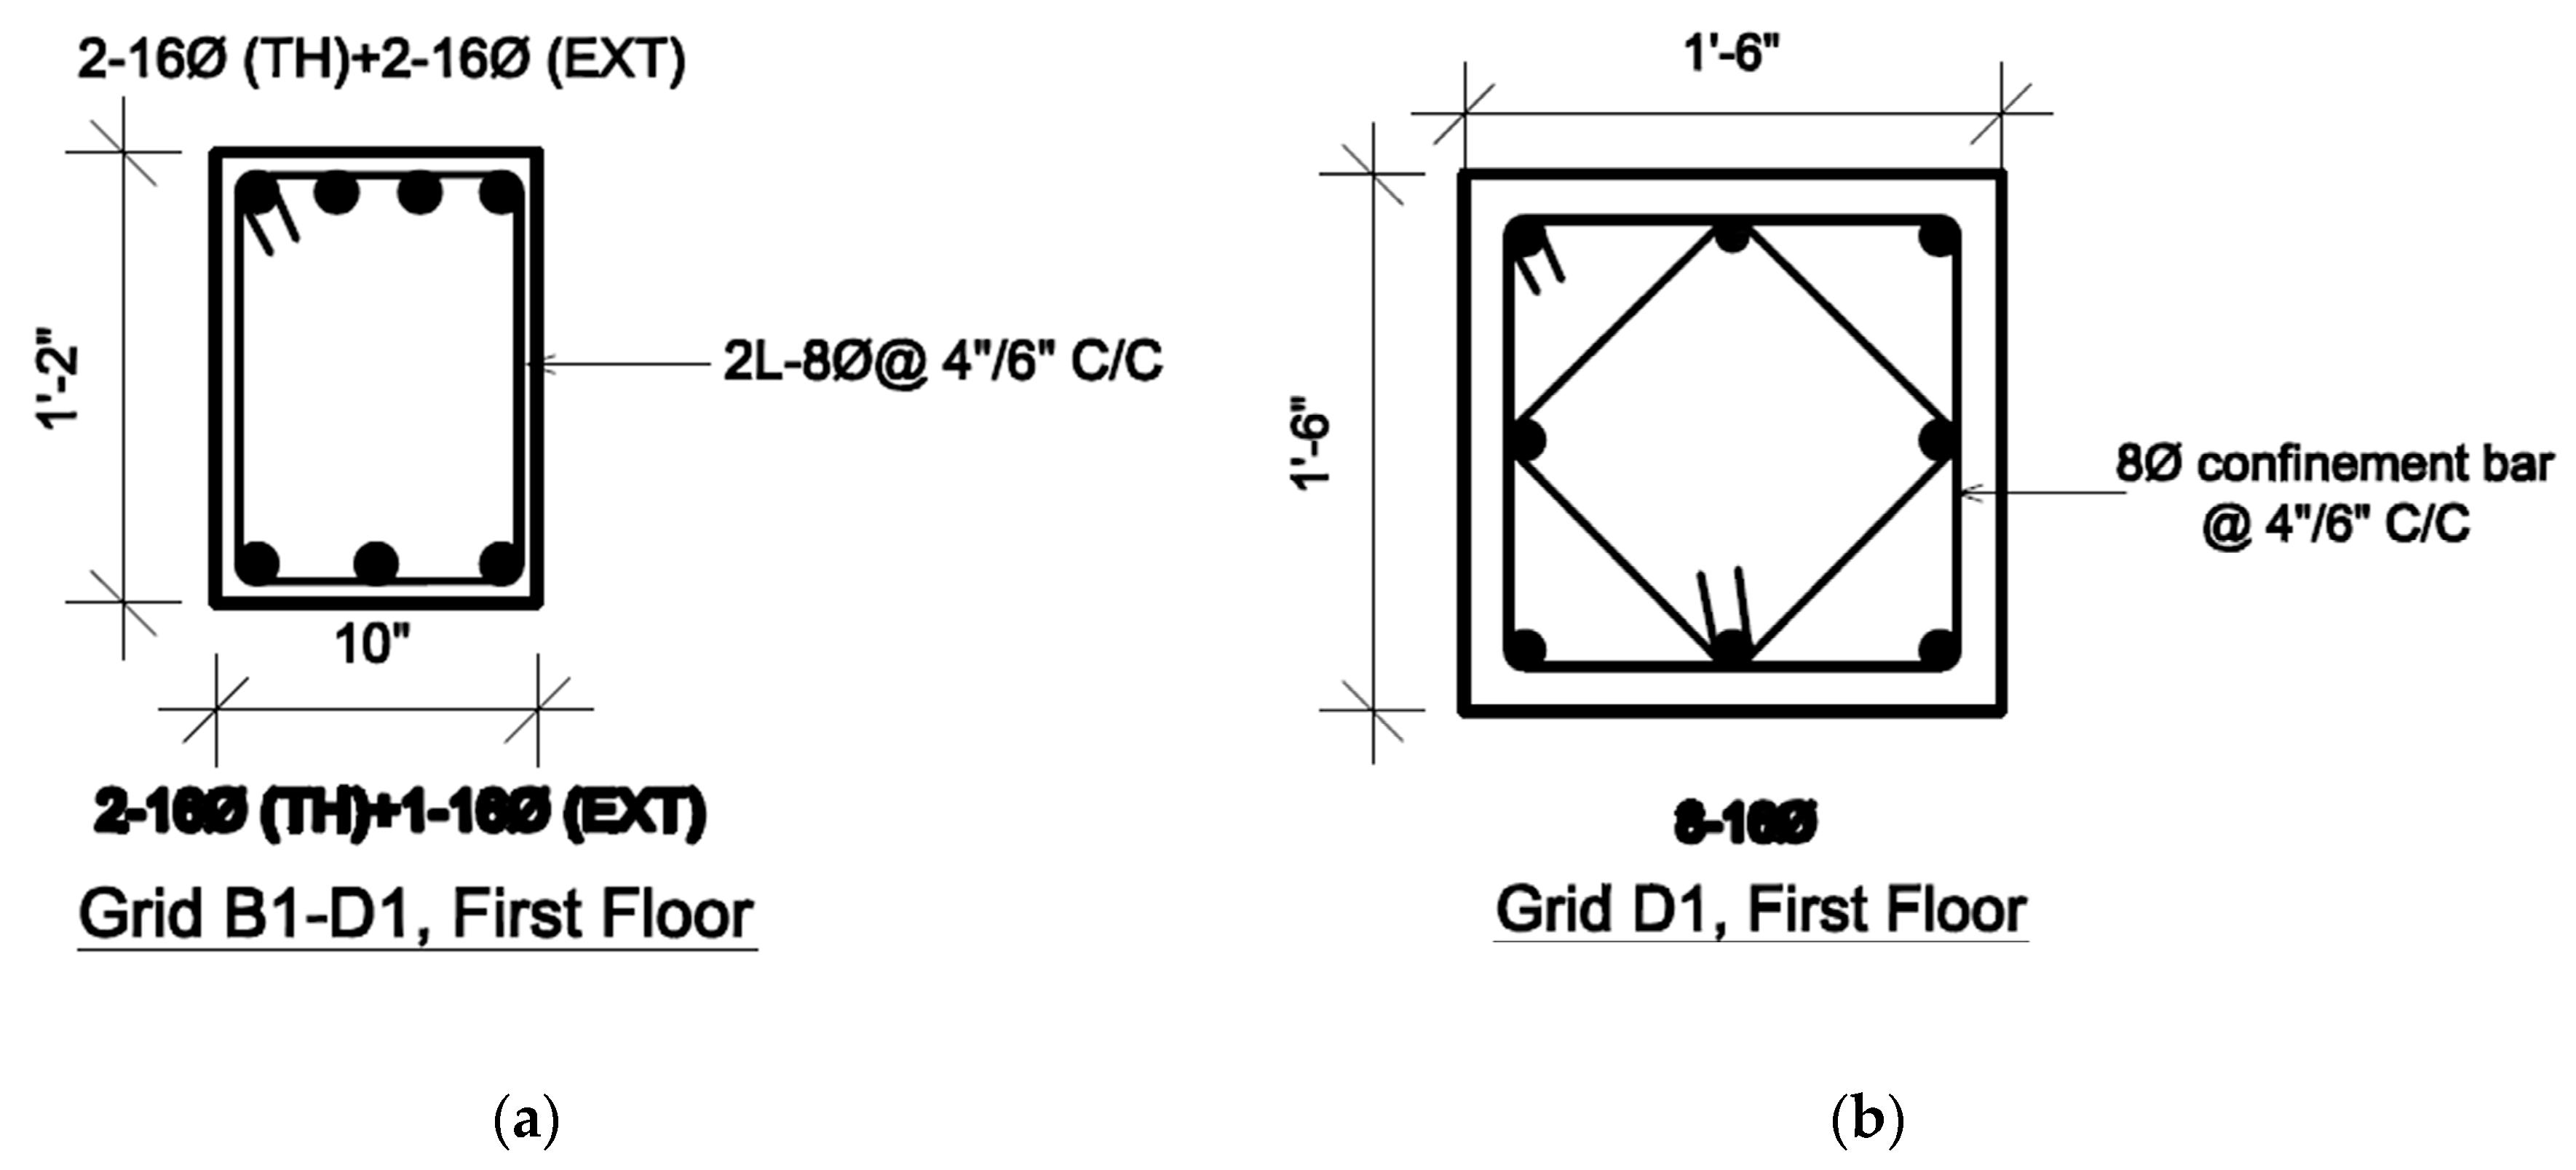
2. Materials and Methods

A building from central Kathmandu was selected after the earthquake to study the seismic performance of multi-storey engineered RC building. The building was constructed in 2010. At first, the building was visually inspected using the FEMA-154 guidelines [23] and the rapid visual assessment of the building prompted a detailed vulnerability assessment. Considering the level of damage, a detailed damage assessment was conducted using finite element modelling. Nonlinear pushover and nonlinear time history analysis were adopted in SAP 2000 v.19 [24] to study the behaviour of the case study building. The case study building is a reinforced concrete construction with brick infill masonry walls. The building has a basement, ground floor, six stories and a stair cover (B+G+6+SC). Furthermore, the building comprises 230 mm thick masonry wall throughout. The weight of the infill masonry was also considered during structural modelling. The building has the dimension of 21.5 × 25.5 m in x- and y- directions respectively. Total floor area of the building under study is 5808.37 sq. ft. Similarly, the floor height of the building is 3 m, whereas the basement height is 2.9 m. This condominium building is a representative of the ongoing high-rise construction in Kathmandu valley. Similar construction technology, workmanship and structural as well as non-structural components could be found in almost all high-rise apartment buildings as reported by Barbosa et al. [4], thus, this building was considered as a case study building.
The building is situated in a medium soil type as per the Indian Standard Code. The medium soil type was determined using the results of geotechnical logging that was done before the construction of the condominium. The medium soil type indicates poorly graded sands with gravel with little or no fines having standard penetration resistance values between 10 and 30 as per the Indian standard [25]. In the building, M25 grade concrete and Fe-500 reinforcement bars were used during construction. As per the recently updated Indian Standard Code the importance factor of 1.2 was considered for finite element analysis. The response modification factor and damping factor were respectively adopted as 5% and 5% as suggested by the Indian Standard Code [25]. The seismic acceleration coefficient (Ca) was taken as 0.16 and the seismic velocity coefficient (Cv) was taken as 0.2176 for 0.16 g PGA. In this case, the base shear was calculated as 482.051 KN. Furthermore, to assess the performance of the building in the case of design PGA, that is, 0.36 g, another analysis was conducted using Ca as 0.36 and Cv as 0.49 that resulted the total base shear of 675.92 KN. After calculating the base shear, a three-dimensional finite element bare frame model was prepared using SAP 2000 v.19 [24]. To obtain some properties for the validation, non-destructive test was carried out using Rebound Hammer. The test suggested the compressive strength of the concrete as 25 MPa and the same value was adopted in the finite element model as shown in Figure 1. A typical floor plan (ground floor) is shown in Figure 2. Similarly, Figure 3 shows details of a typical beam and a column of the case study building. The stress-strain relationship as suggested by IS 456:2000 [25] was used in modelling. Basic material properties used in modelling are as listed as follows:
  • Modulus of Elasticity of steel, Es = 200,000 MPa
  • Modulus of Elasticity of concrete, Ec = 5000√fck = 25,000 MPa
  • Characteristic strength of concrete, fck = 25 MPa
  • Yield stress for steel, fy = 500 MPa
Nonlinear time history analyses were conducted using KATNAP time history recorded by the United States Geological Survey [26]. The acceleration time history used for the time history analysis is shown in Figure 4. Nonlinear analysis was performed using Taketa model which is available in the SAP 2000 finite element program.

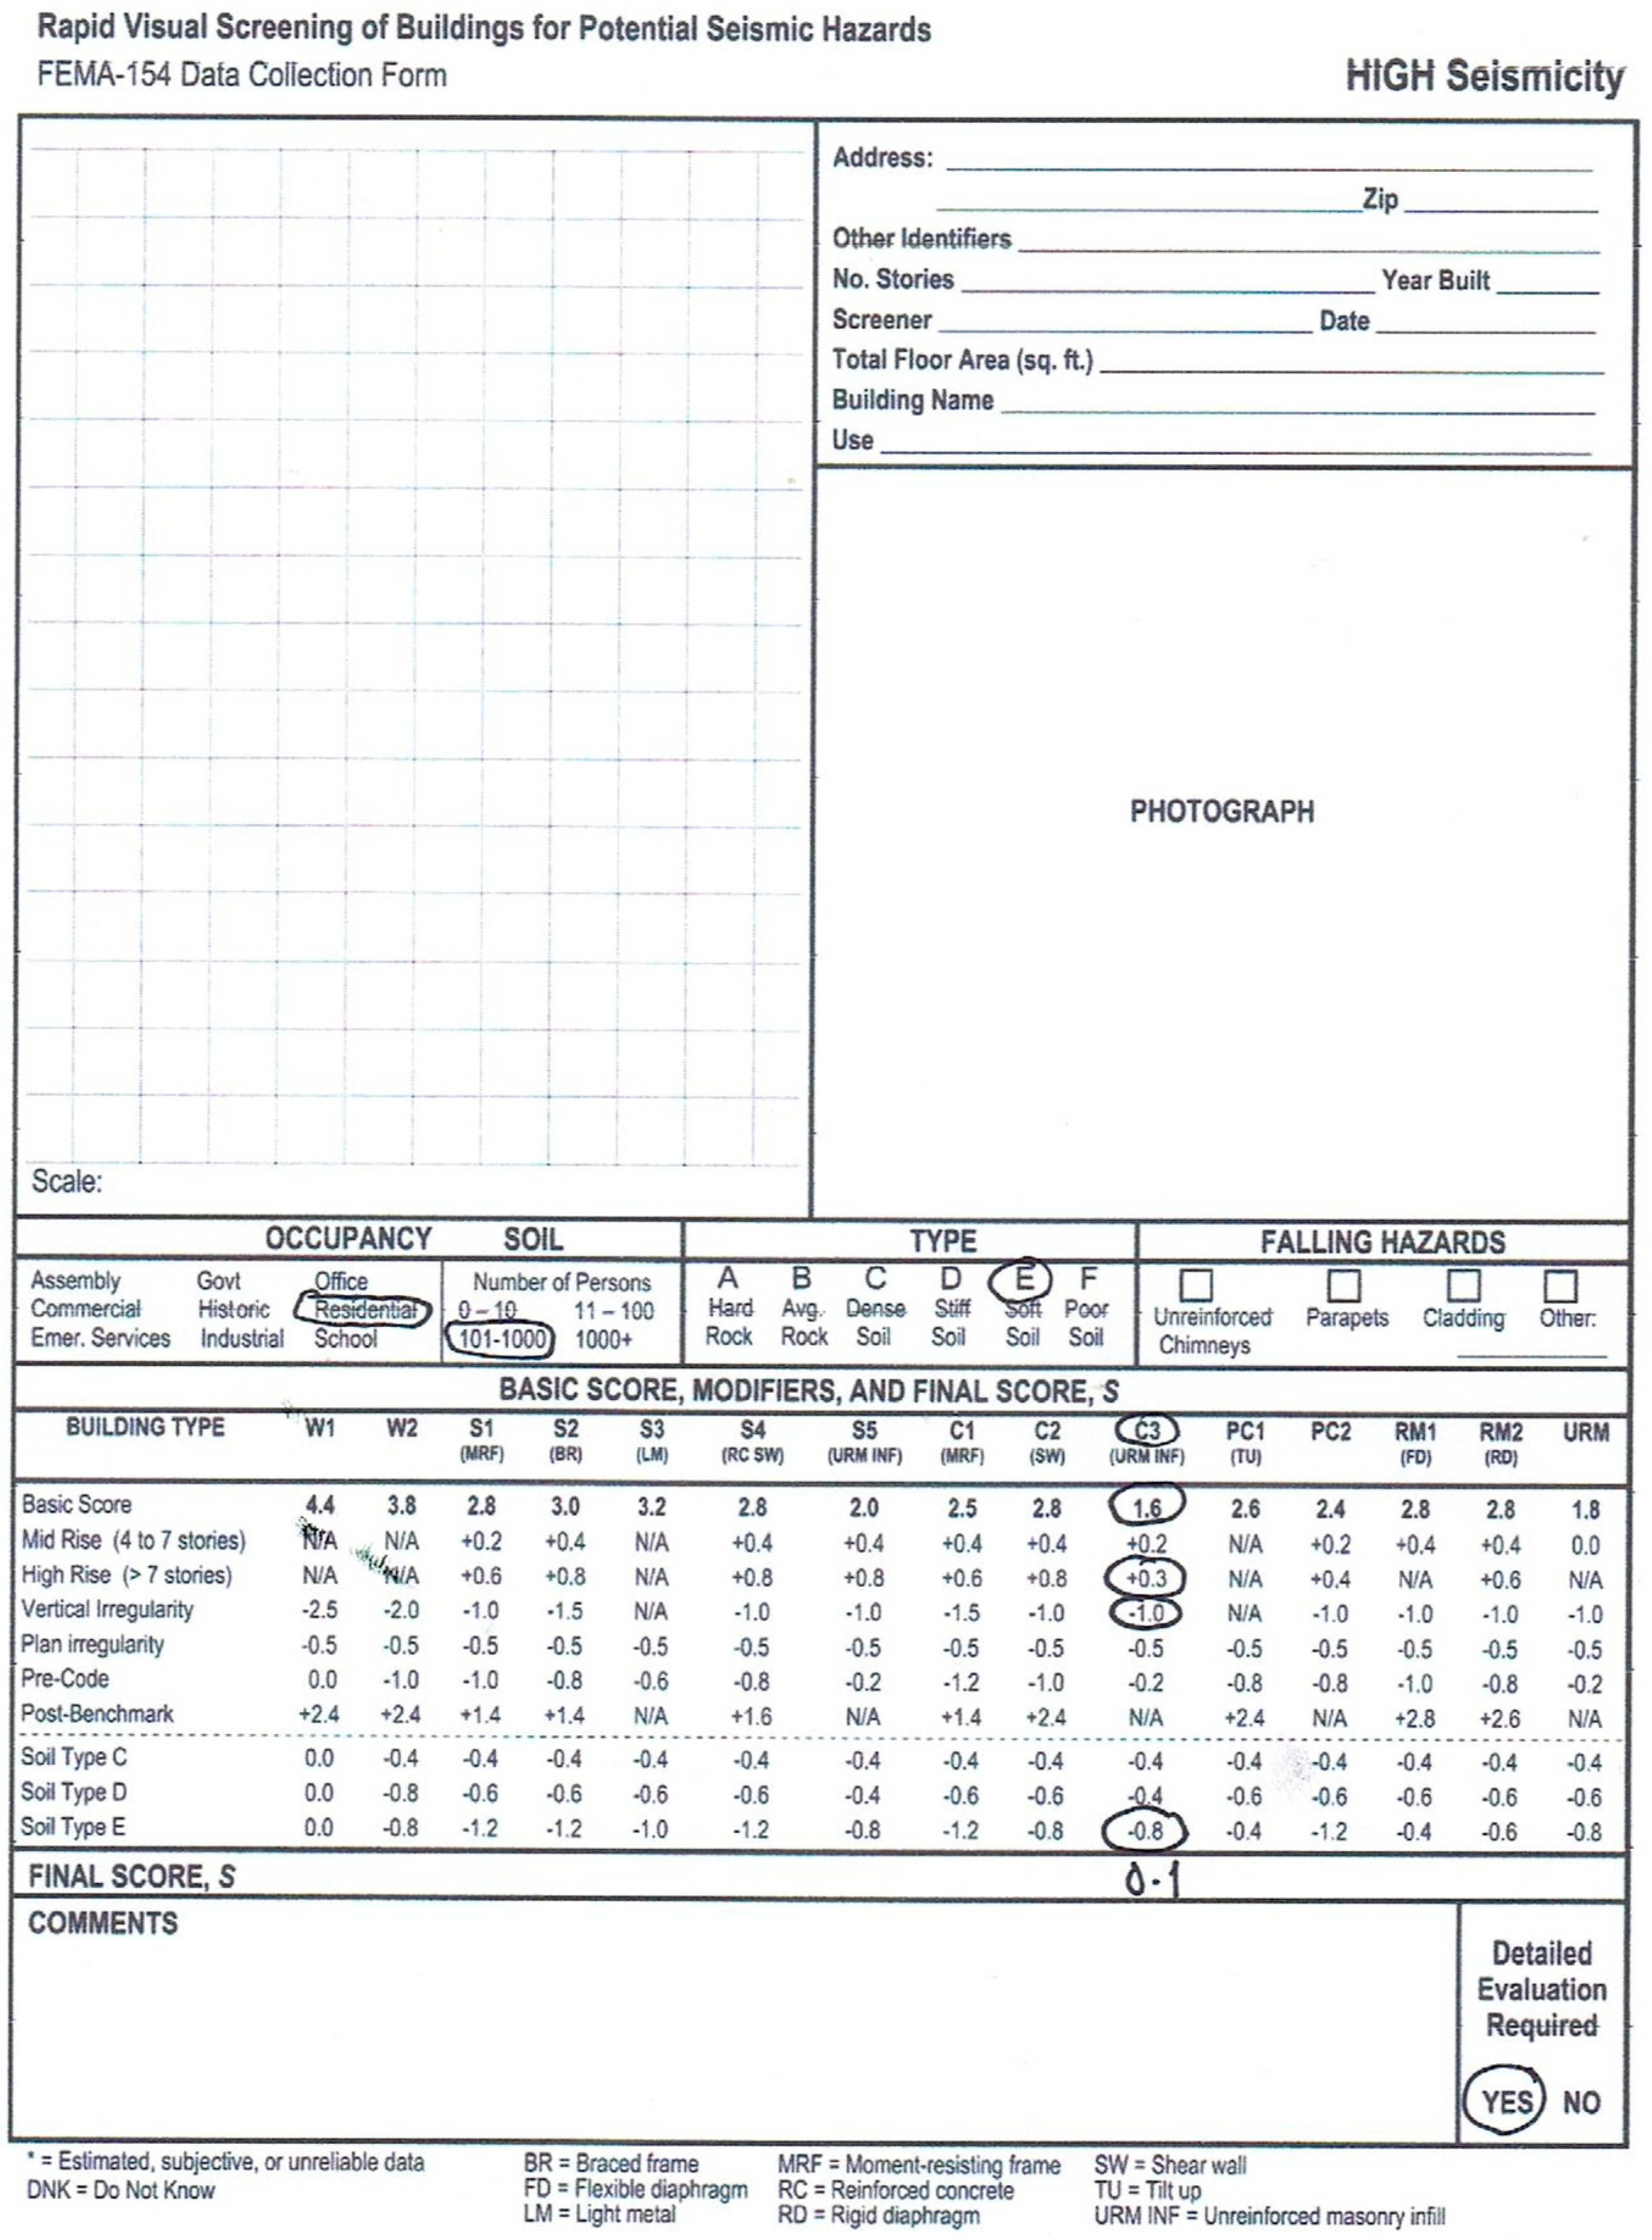
3. Rapid Visual Assessment after the Gorkha Earthquake Sequence

Figure 5 shows a field observation sheet recorded during rapid visual observation. As noted in Figure 5, the building is used for residential purpose and the occupancy range was 101–1000. The building is a space frame building containing infill walls. Infill wall was unreinforced brick masonry; thus, the building type was noted as C3 as shown in Figure 5. The building was constructed following the IS code provisions up to the 7th floor with basement and roof cover and from the observations, the case study building was irregular in vertical direction. As the total score (0.1) was less than the cut-off score of 2.0, detailed evaluation of the building was required. To perform the detailed evaluation of the building, detailed survey was conducted for each component of the building. Mostly, infill wall damage was noted throughout the building. Figure 6 shows the infill wall damage which is present throughout the building. Fundamentally, two major reasons would have contributed to the widespread damage to the infill walls. The first is due to lack of reinforcement so that the masonry units were not able to sustain the shaking as in such buildings infills are provided once the frames are finished. Due to prevalent construction practice of providing infill walls once the frame is completed, the structural and non-structural components would not be duly connected. In addition to damage in infill walls; other recorded damages were categorized into seven types: HLC (hairline crack), PC (plaster crack), PF (plaster fall), WC (wall crack/brick crack), WS (wall spill and shift, that is, shifting of wall due to concrete spill), WB (wall and beam joint crack), MJ (mortar joint crack), TC (tile crack and fall). Distribution of these seven types of damages in each storey was recorded carefully and the damage fraction to each category was also calculated. The distribution of various types of damages in each storey is presented in Figure 7. Different types of damages were noted for each storey of the building first and then as per the occurrence of each damage category, the total damage to each storey was converted to 100%. Thereafter, share of each damage mechanism was calculated and finally Figure 7 was plotted. As shown in Figure 7, plaster crack comprised the largest damage fraction throughout the building. In the ground storey, PC, PF and MJ crack were significant damage types observed during the assessment. Similarly, PF, PC, MJ and WC were noted as the significant damage types in the first storey. The second storey had HLC, PC and MJ as the dominant damage types. The third storey observed PC, MJ, TC and WC as the major damage types. The fourth storey depicted the similar damage pattern as that of the third storey. In the fifth storey, PC, WC, WS and MJ were noted as the significant damage types. The sixth storey reflected that the dominant damage types were TC, PC, MJ and WC. It is noted that the wall crack was also dominant in the upper storeys. This should be probably due to the effect of strong vertical shaking during the 2015 Gorkha earthquake as highlighted by Gautam et al. [27] and Gautam and Chaulagain [3].

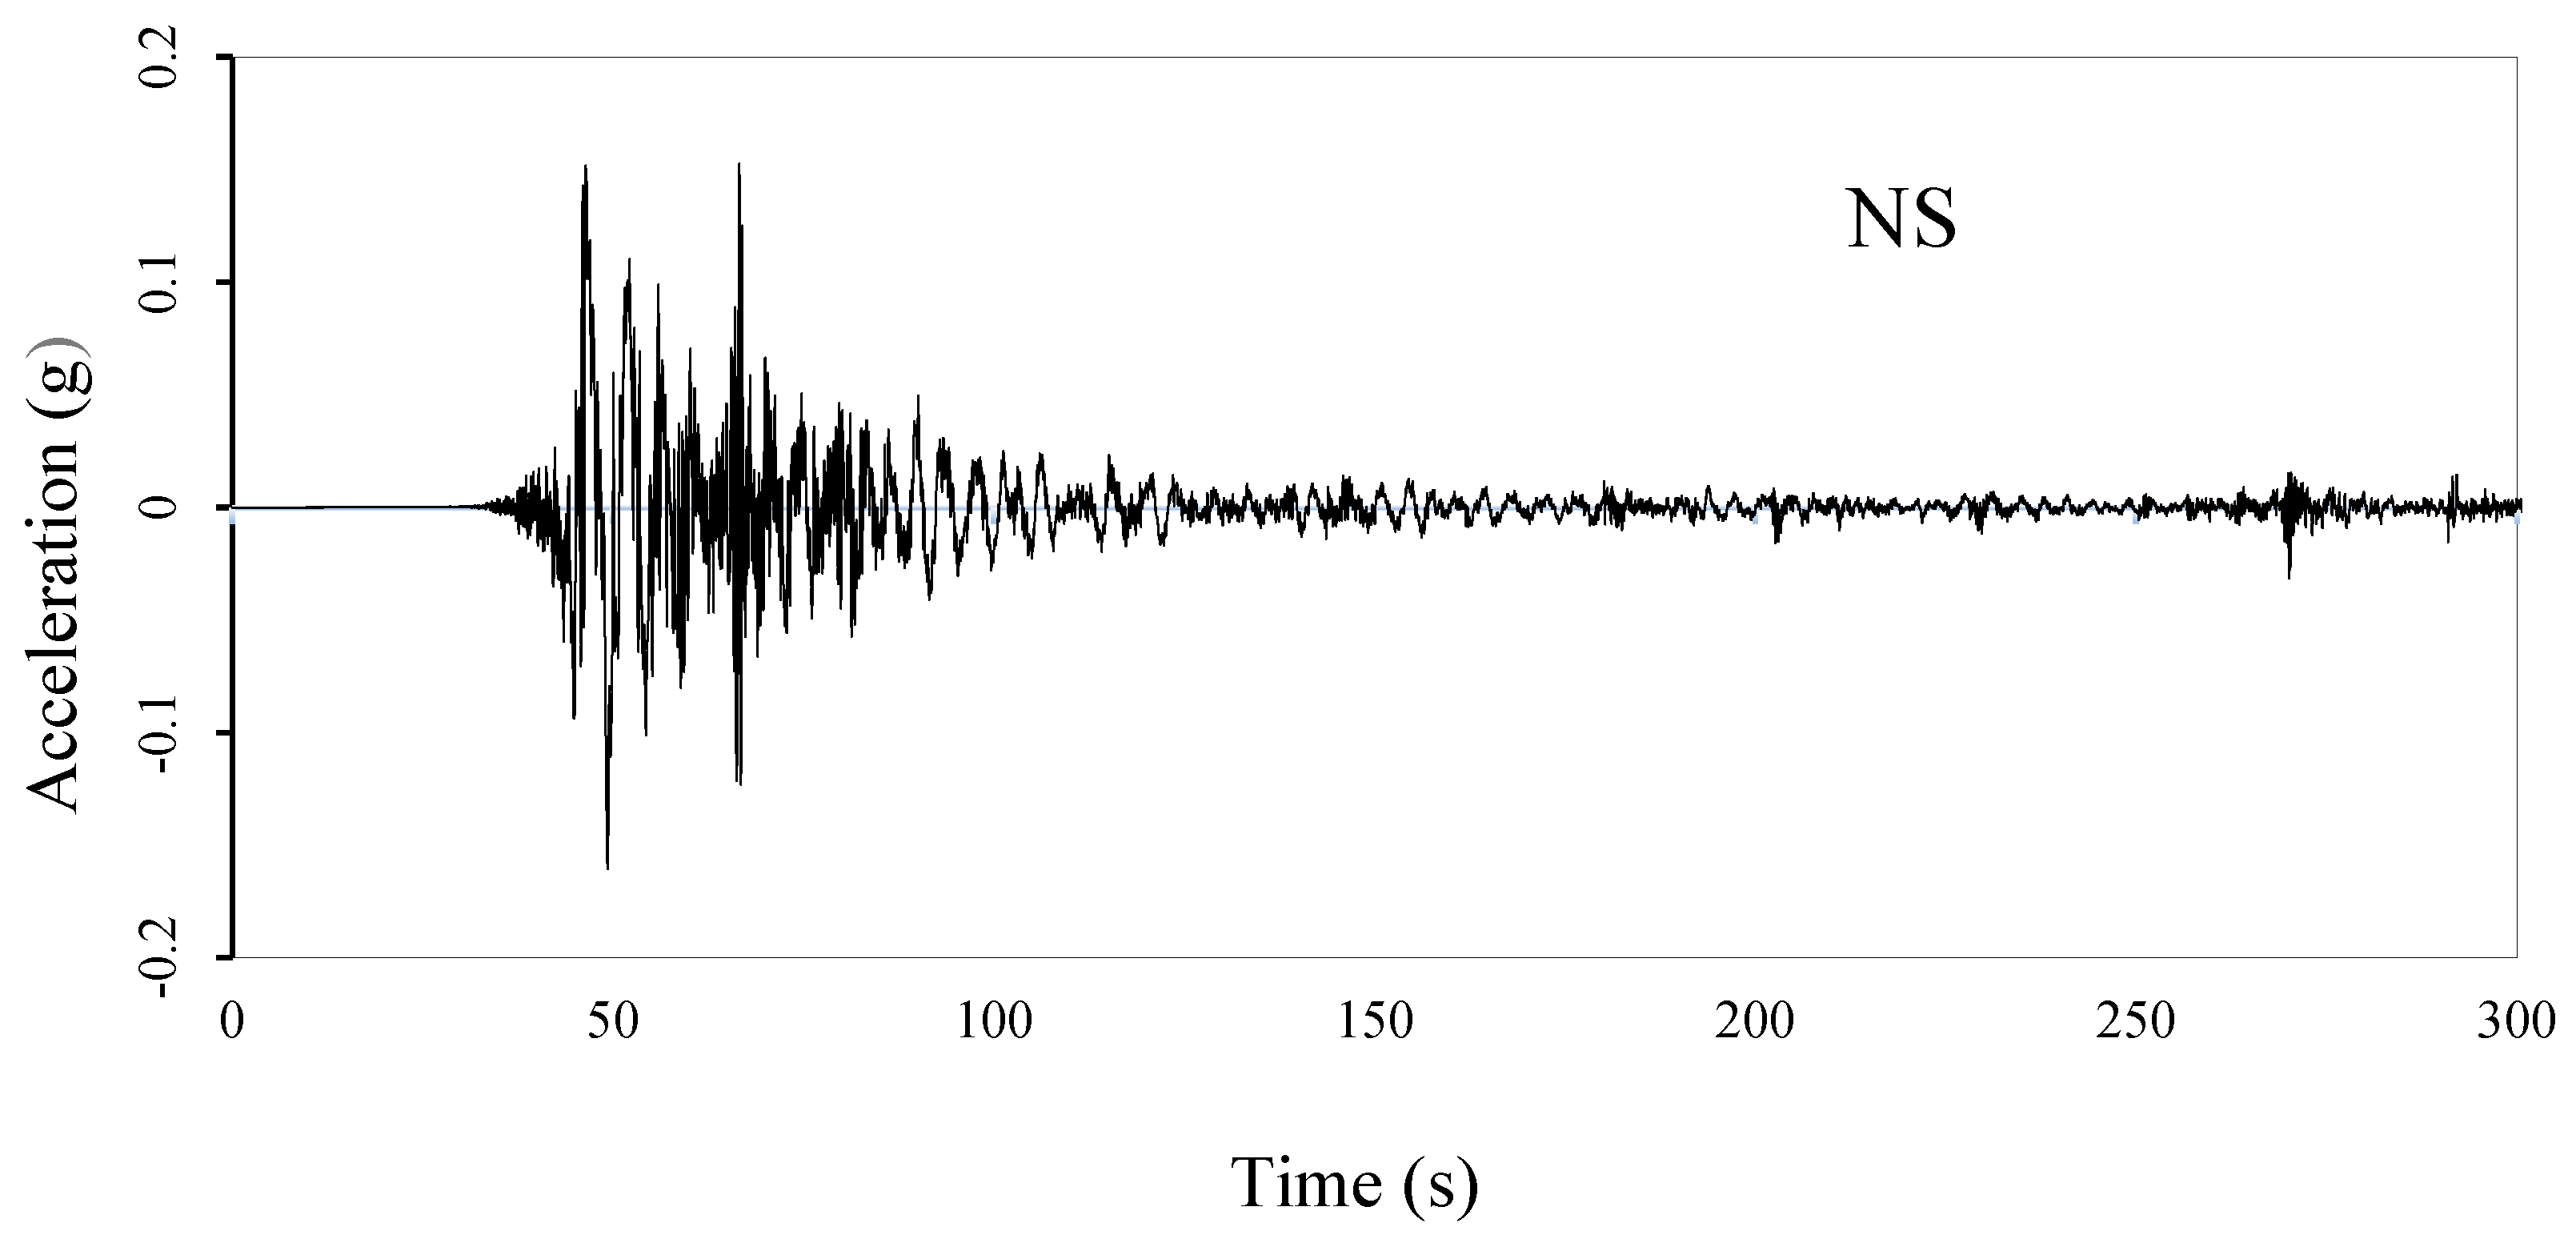
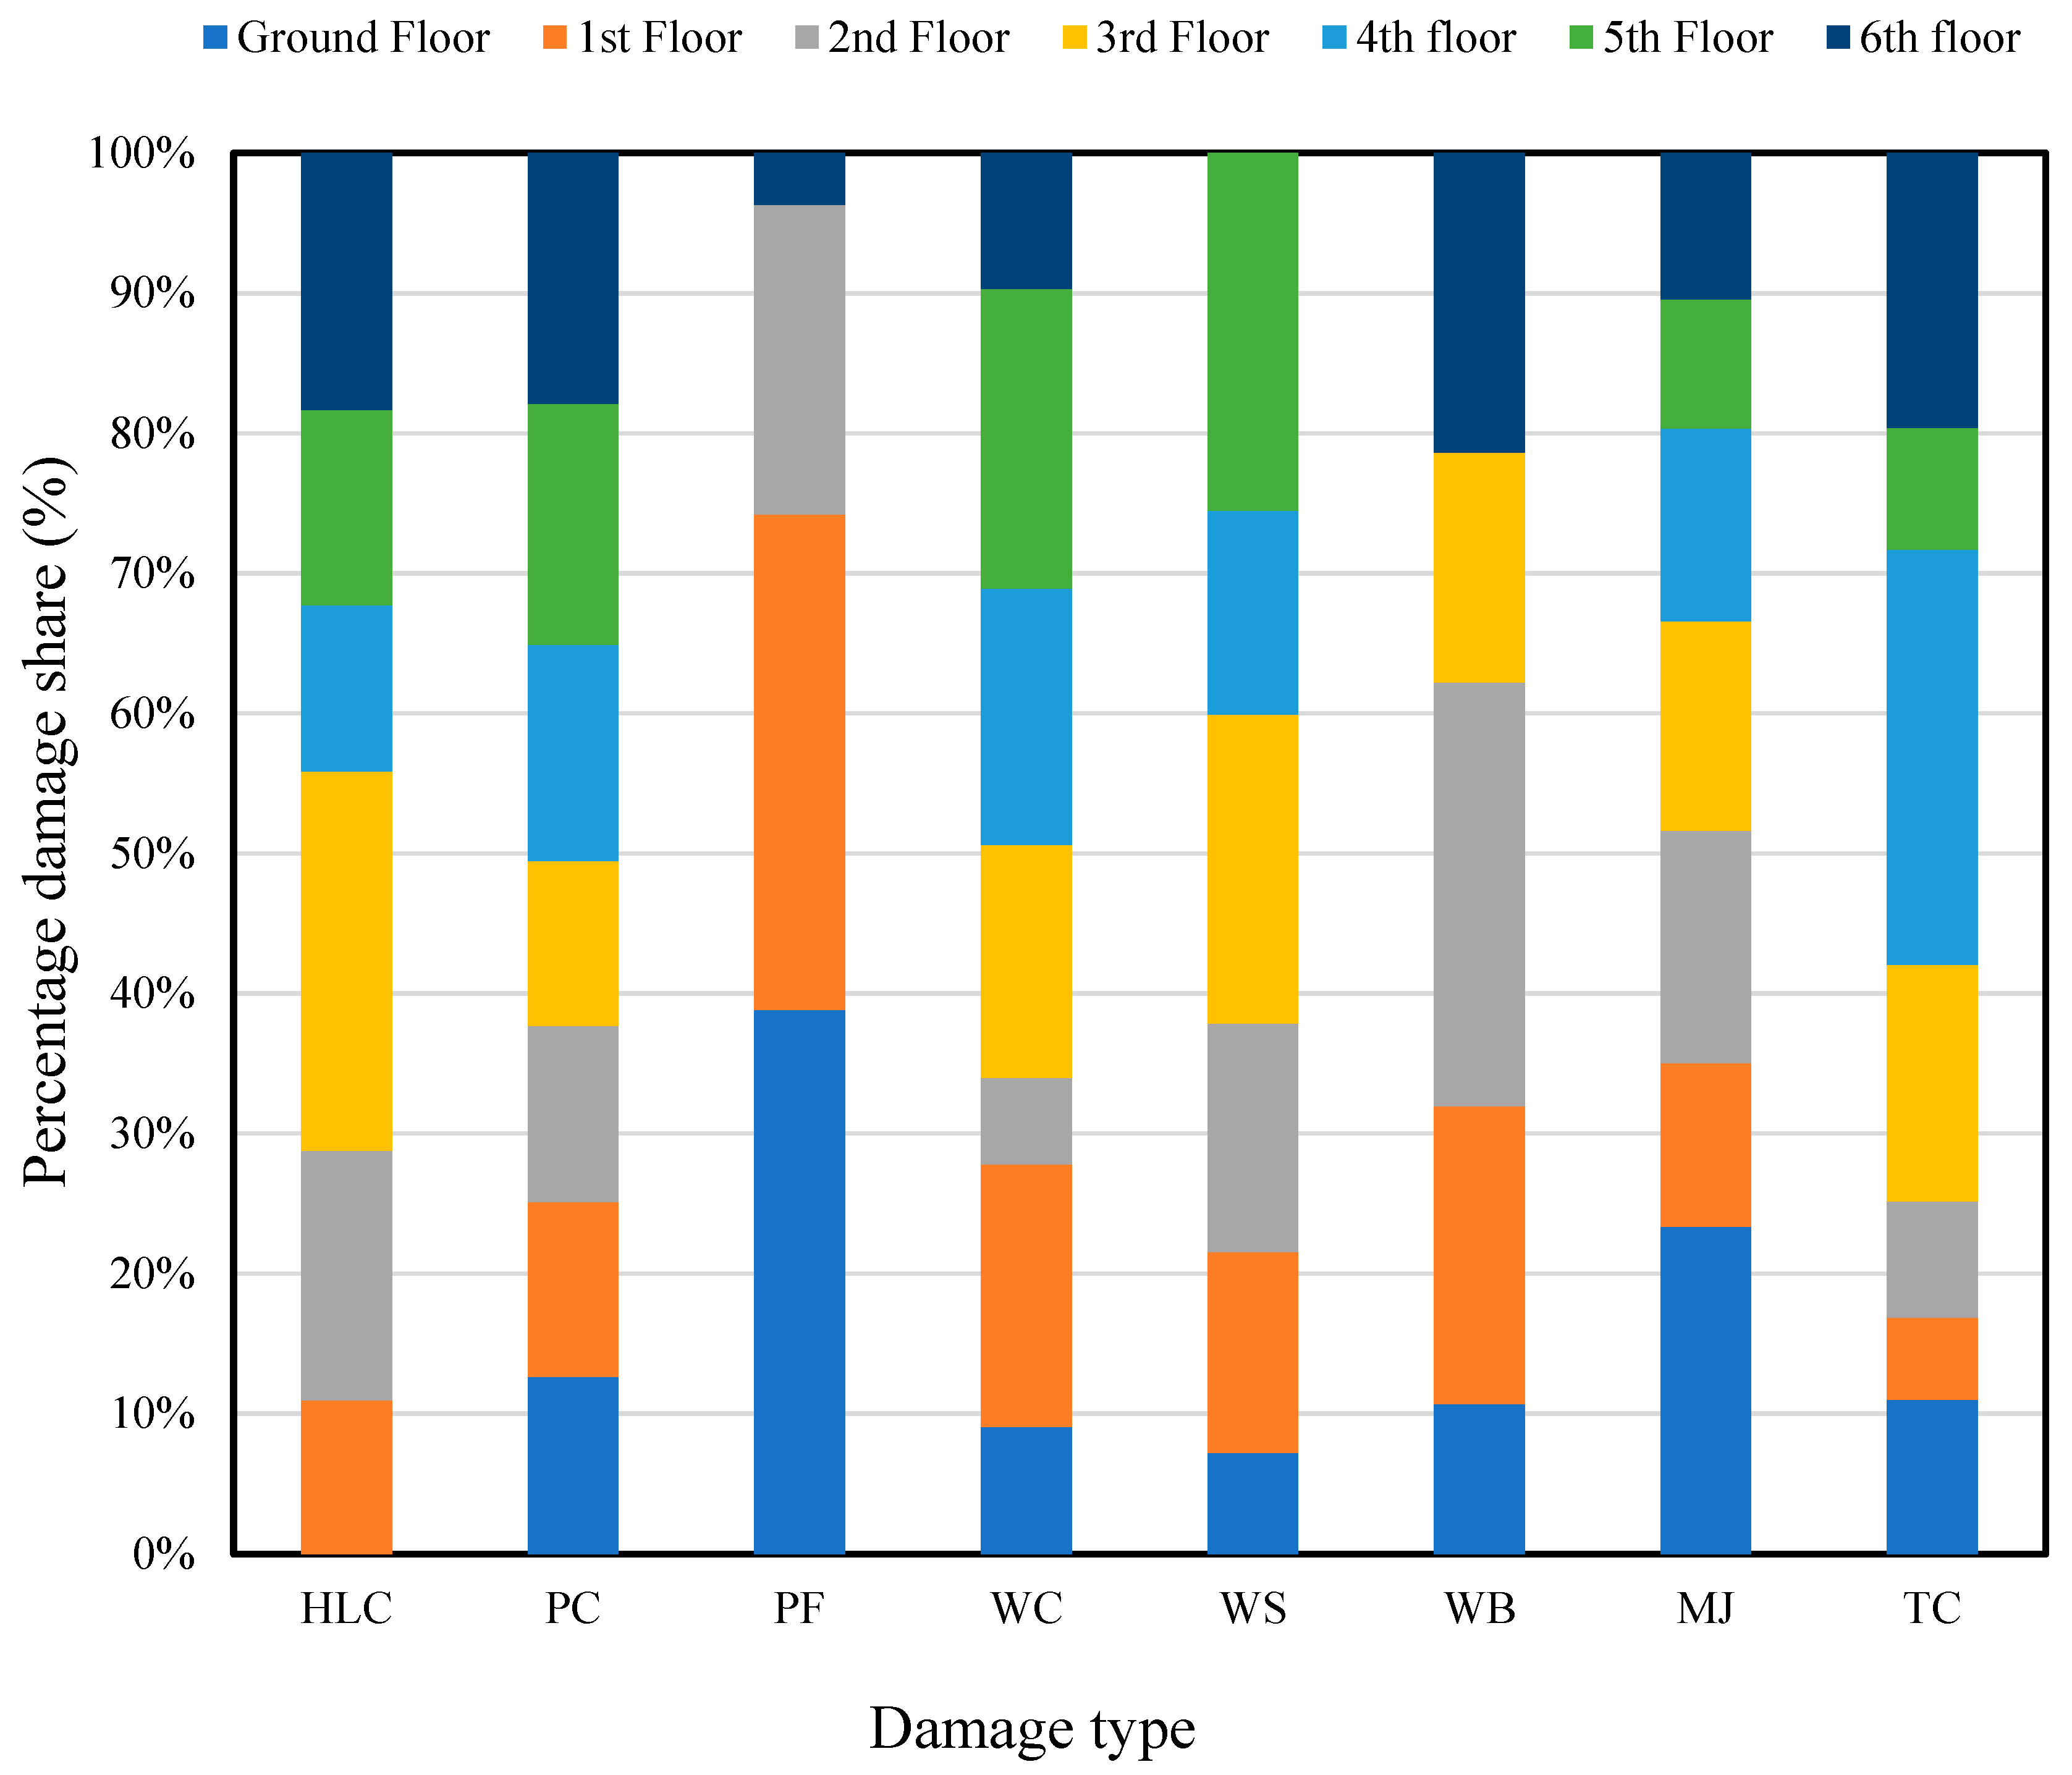
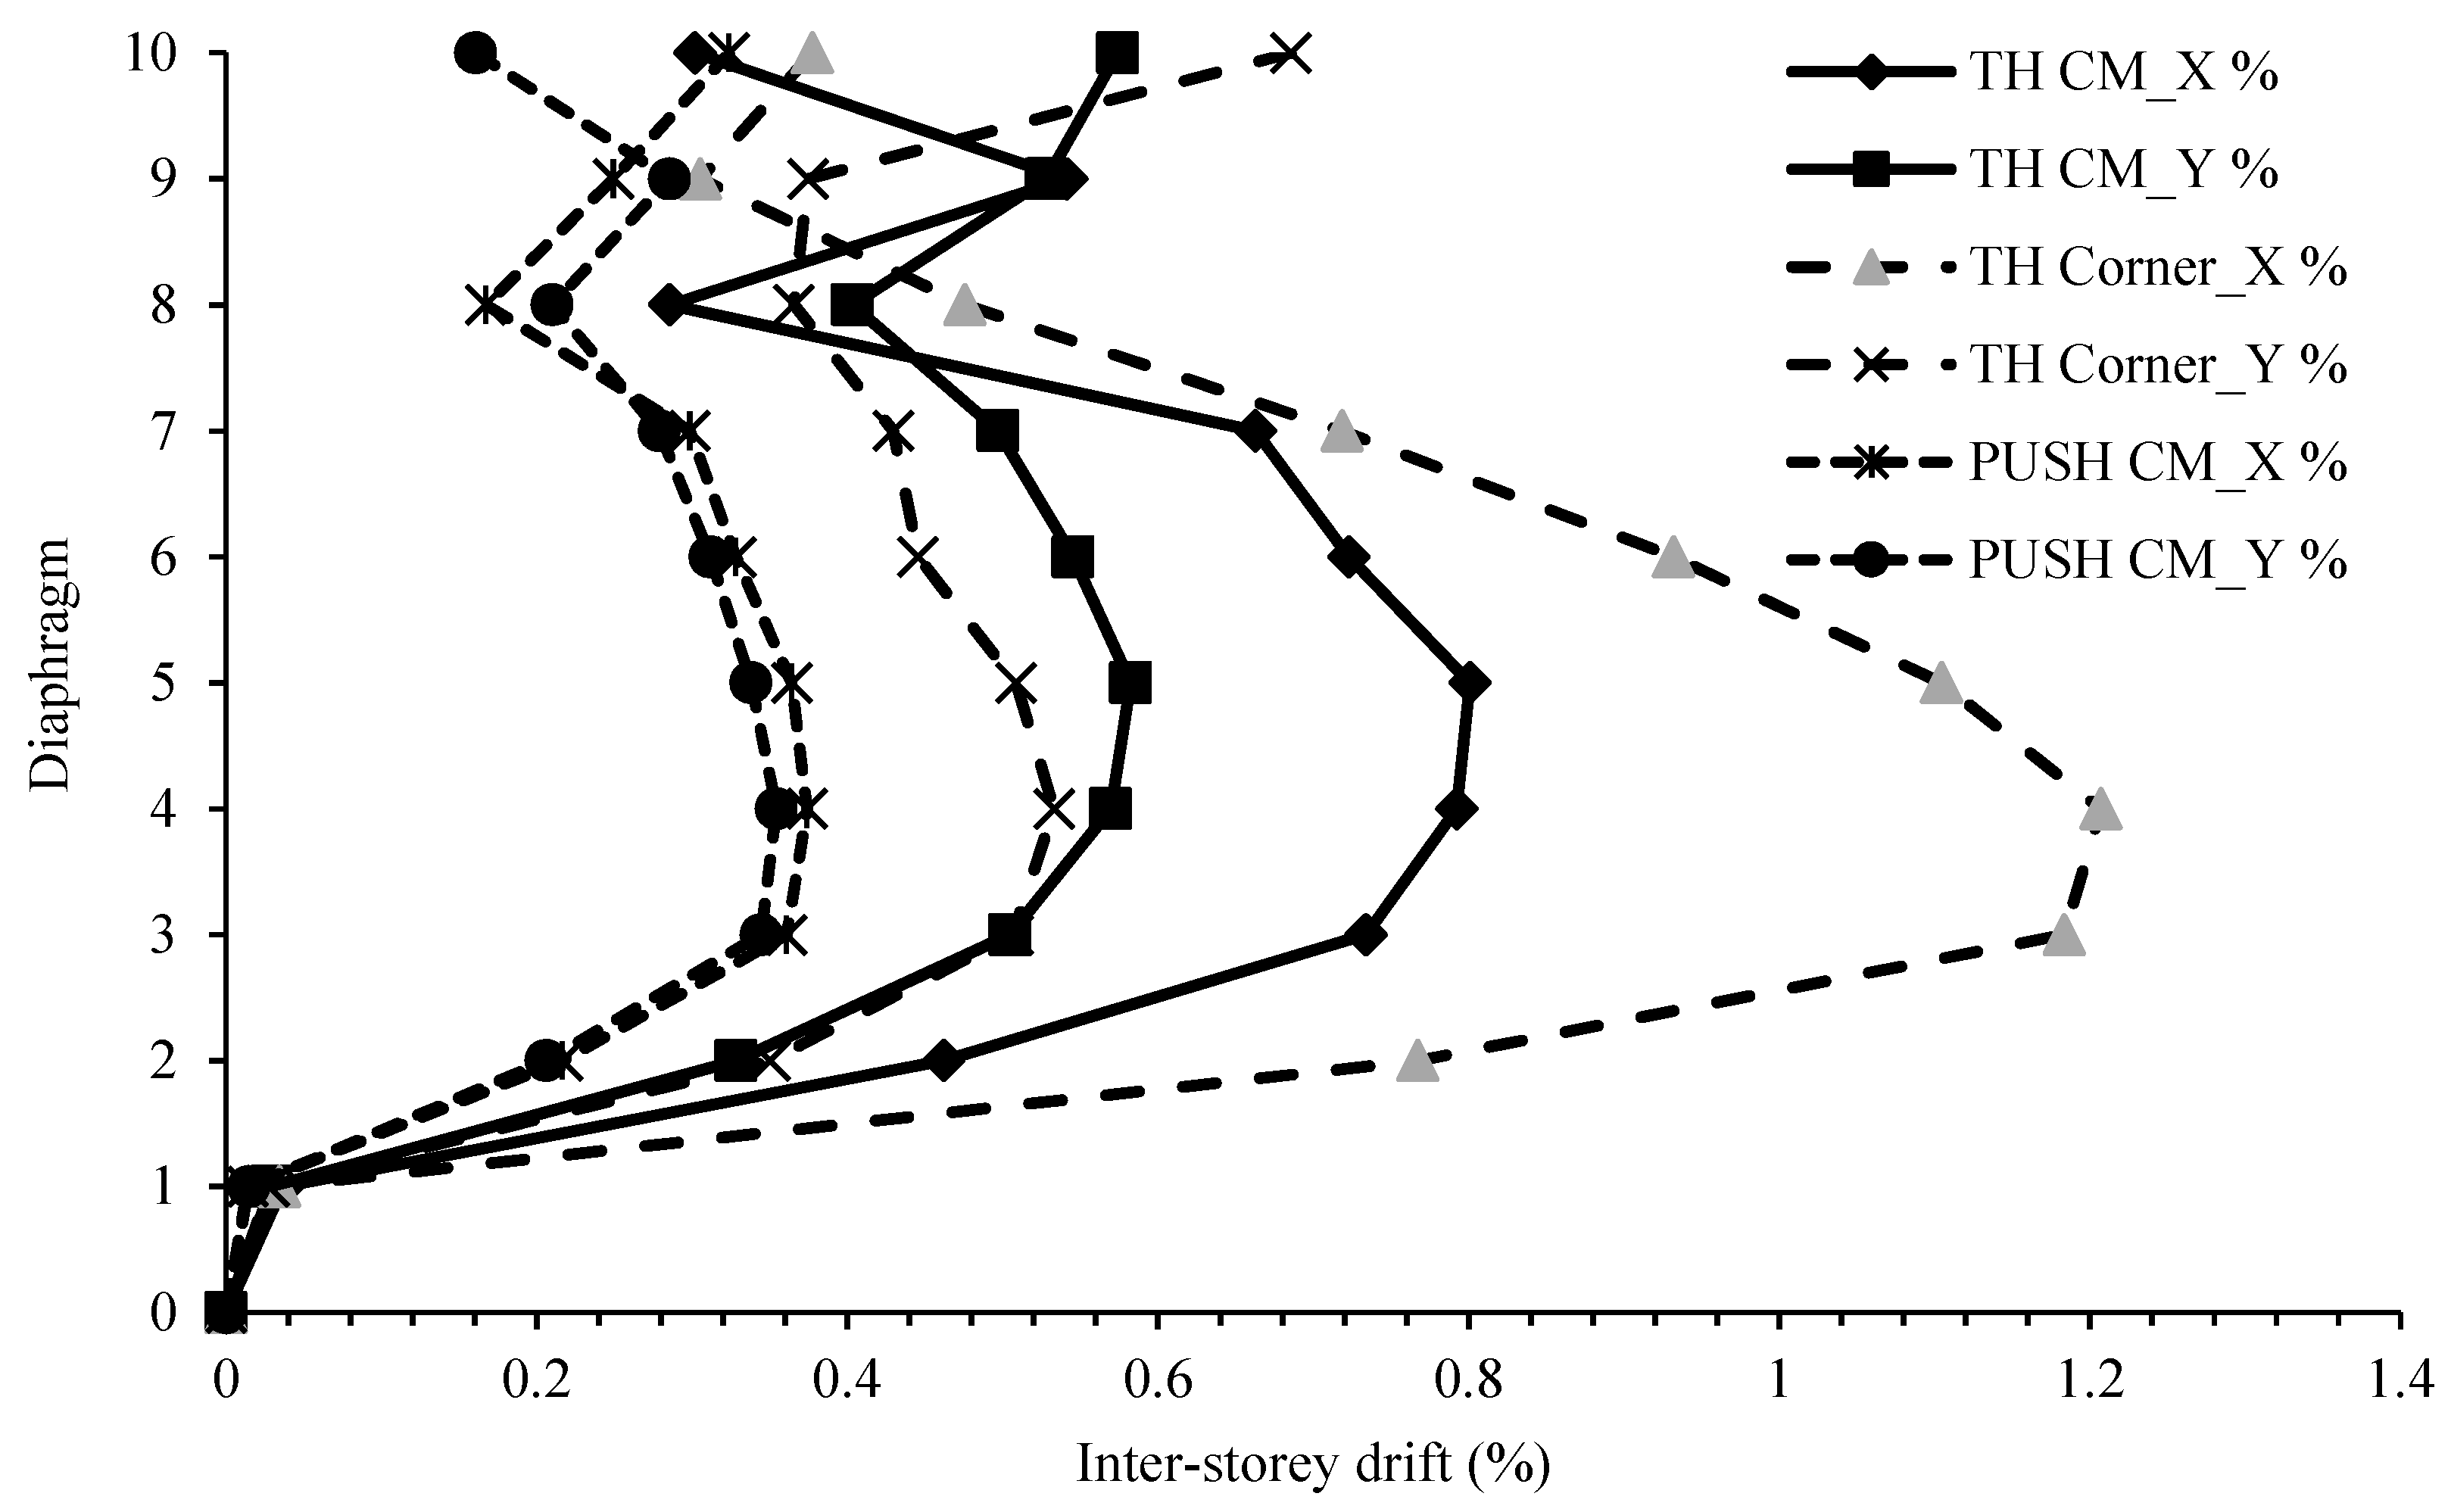
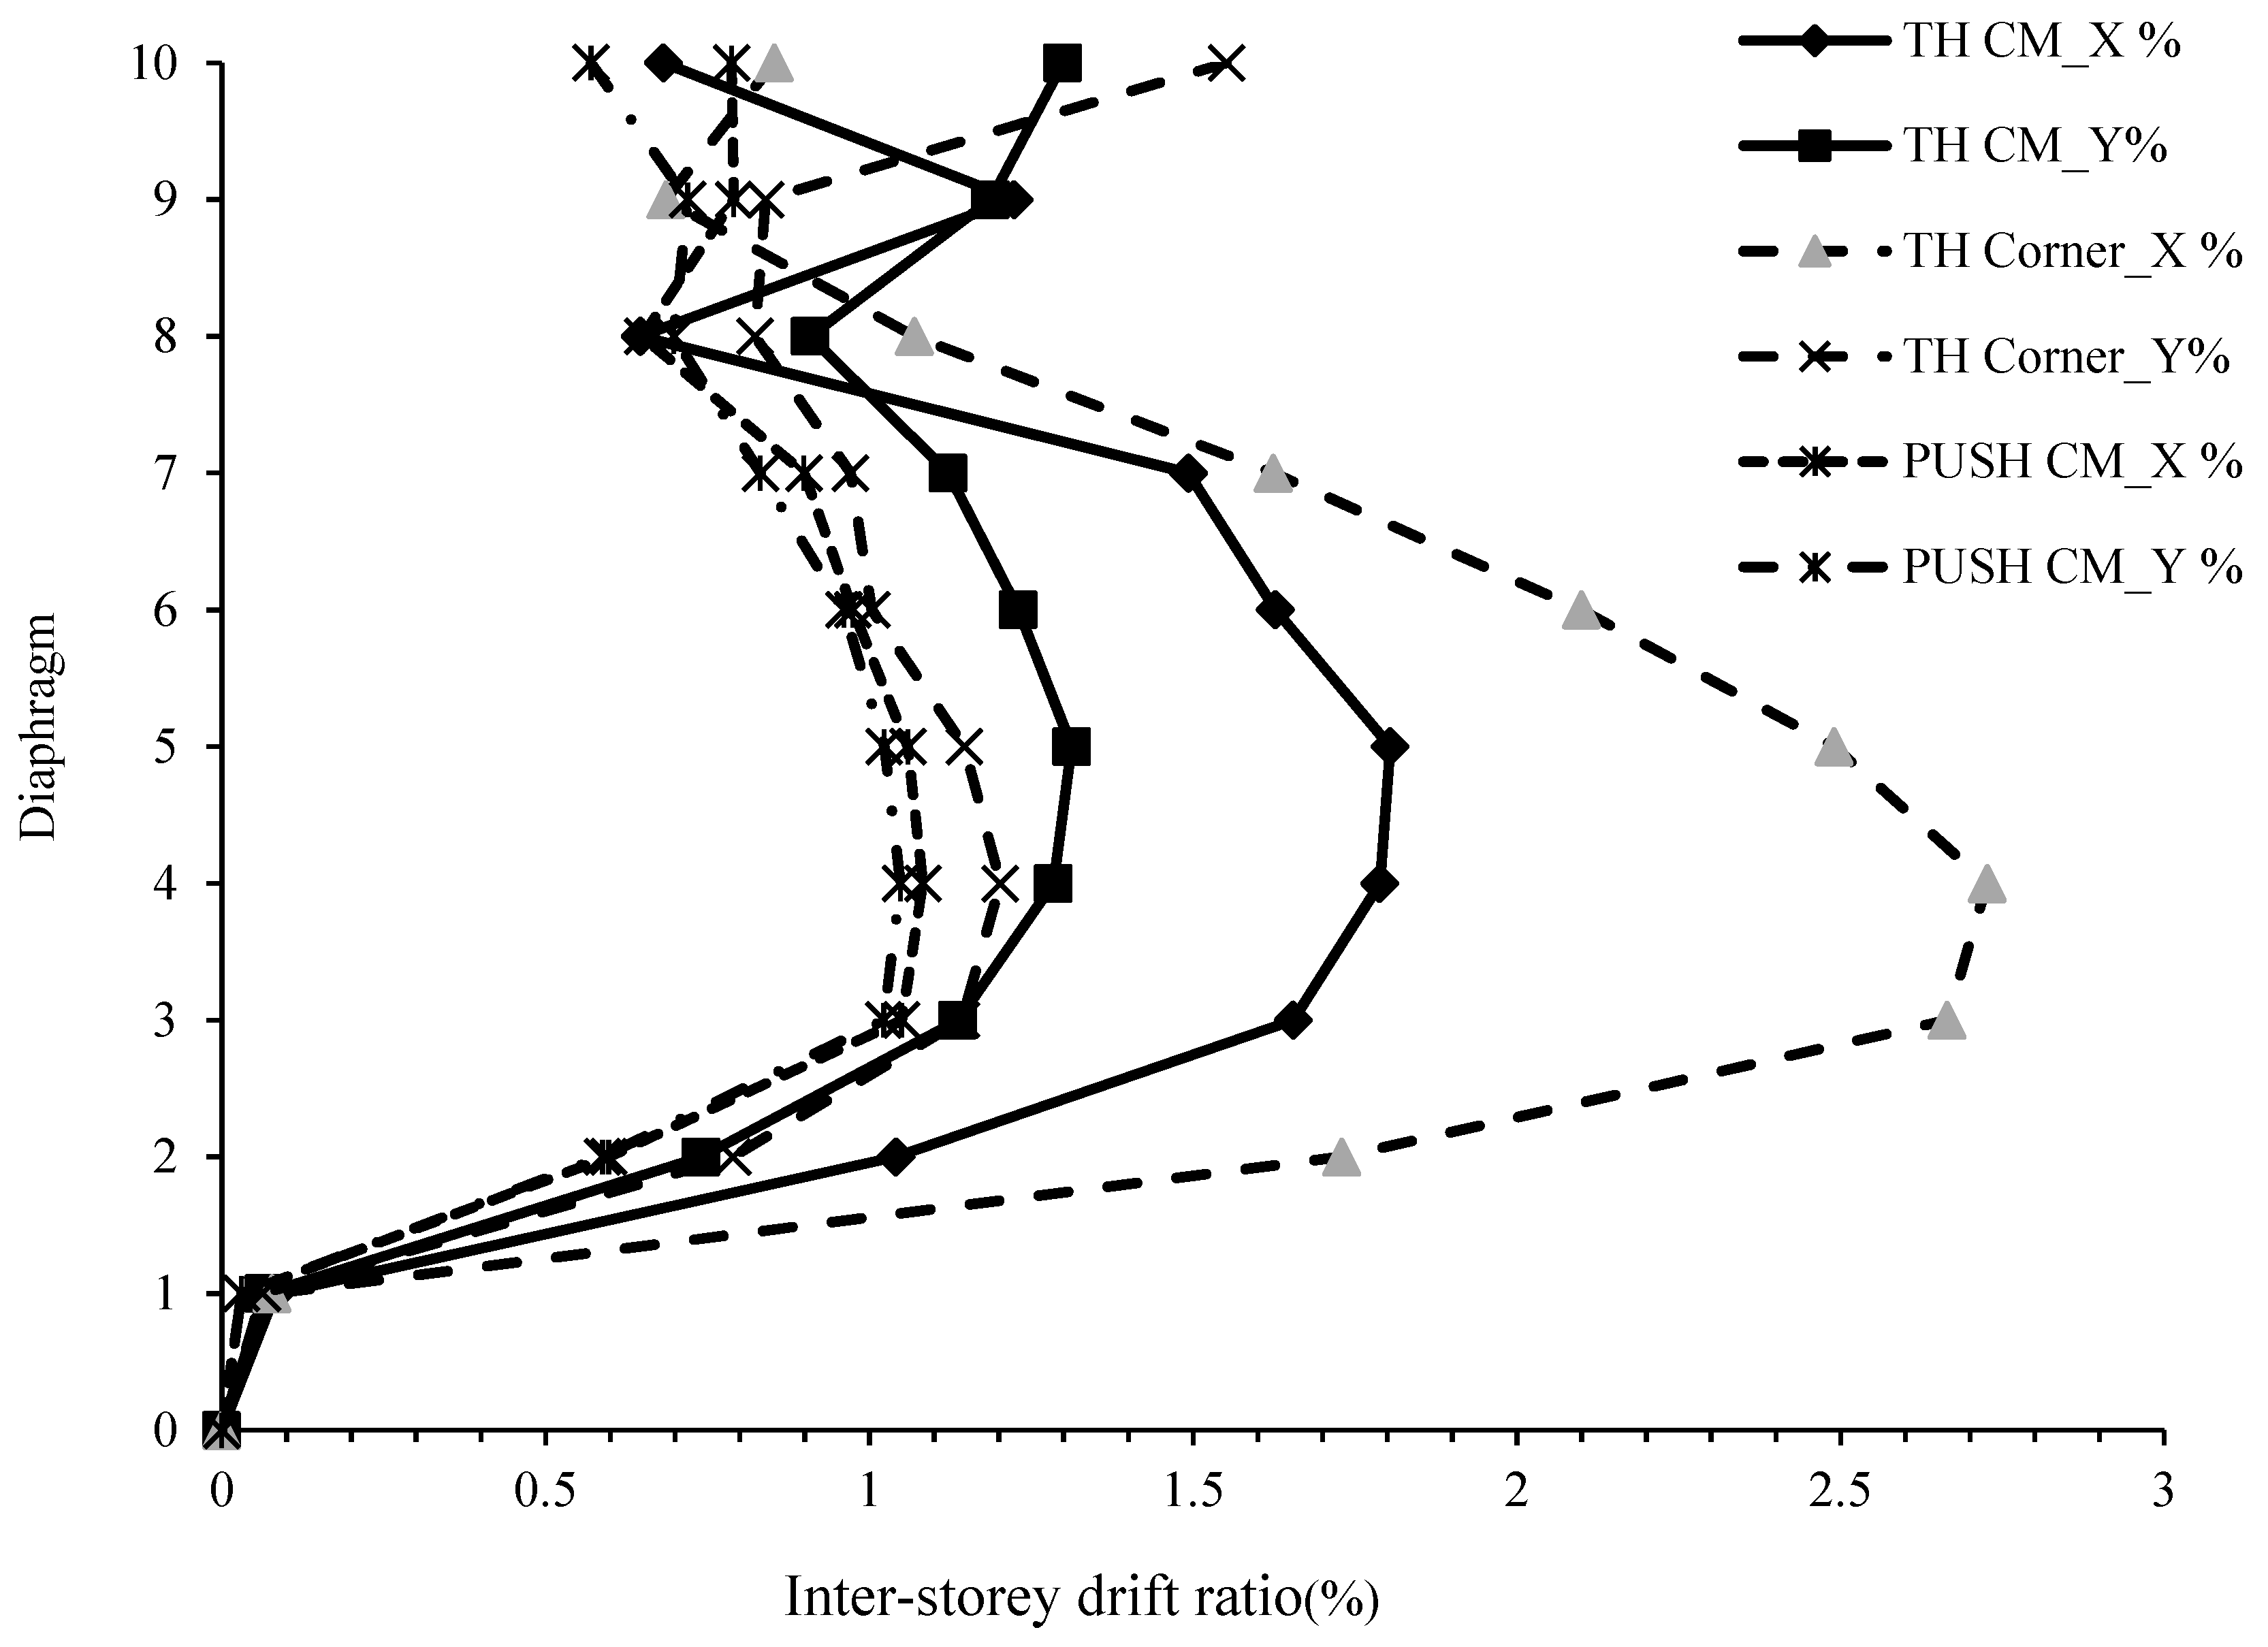
4. Analytical Modelling Results

Pushover analyses in the x- and y- directions were performed at first and the pushover curves of the building are shown in Figure 8. As shown in Figure 8, base shear capacity of the case study building can be considered significantly high. The seismic weight of the building was calculated as 51,177.75 KN considering 100% of dead load (DL), 25% of live load (LL) (when LL ≤ 3 KN/m2) and 50% of live load (LL) (when LL > 3 KN/m2). The natural periods of the building in x- and y-directions were obtained as 0.588 s and 0.551 s respectively. To perform pushover analysis, 11 diaphragms were created for the entire structure as shown in Table 1. After assigning the hinges, the storey drifts were obtained from the analysis for both 0.16 g (PGA equivalent to Gorkha earthquake) and 0.36 g (PGA equivalent to the maximum considered earthquake, that is, MCE) PGAs. Both pushover analysis and nonlinear time history analyses were conducted to check the variation of performance of the structure. Figure 9 depicts the inter-storey drift (ISD) plots for pushover and time history analysis for the corner column as well as the centre of mass (CM). As shown in Figure 9, the maximum drift was observed in the second floor (diaphragm 3–4) in the case of time history analysis along the x-axis. Figure 9 also highlights that the pushover analyses leads to conservative results than the time history in terms of inter-storey drift. As the maximum inter-storey drift was limited to 1.2% that falls under ‘operational’ performance level per VISION-2000 [28]. The same performance level was observed during the Gorkha earthquake as well (see e.g., [4]). One more analysis was conducted to depict the behaviour of the building in the case of MCE. Thus, the PGA was scaled up to 0.36 g and both pushover and nonlinear time history analyses were carried out in both x- and y-directions. Using the similar hinge conditions, the ISD for 0.36 g PGA is presented in Figure 10.
As shown in Figure 10, the maximum ISD has reached greater than 2.5% which denotes that in the case of MCE, the building would cross the life safety performance level. So, the moderate damage recorded during the Gorkha earthquake should be clearly due to the low PGA occurrence in Kathmandu valley. As in the case of 0.16 g PGA, pushover analyses depicted conservative results in terms of the inter-storey drift at 0.36 g too.

5. Conclusions

After the 2015 Gorkha earthquake sequence, rapid visual assessment was conducted in an apartment building located in central Kathmandu, Nepal. The rapid visual screening suggested the detailed assessment, thus, detailed damage assessments were conducted in two phases. The first tranche of assessment comprised damage identification and the second tranche comprised finite element modelling of the structure that covered pushover and nonlinear time history analysis. Modelling was done at 0.16 g PGA (as recorded during the Gorkha earthquake) and 0.36 g (which is equivalent to the maximum considered earthquake PGA). As the PGA was relatively low during the Gorkha earthquake, the building showed operational performance level; however, at 0.36 g, the results indicate that the storey drift would cross the life safety performance level leading to a severe damage to the building. It is fundamental to note that the damage was concentrated in non-structural component of the building. More precisely, the damage was primarily in the brick infills throughout the building.
One of the limitations of this study is that infill models were not created but the weight of the wall was considered in analysis so that the exact mechanisms in each infill wall were not cross-validated. It is worthy to note that the contribution of infill panels is a crucial aspect in the seismic performance of building. Owing to this fact and limitation of this study, readers are directed to the related papers to have further insights (e.g., [18,19,20,21,22]). Future studies may incorporate the contribution of infill walls to justify the damage occurrence and seismic performance of the building.

Author Contributions

Conceptualization, S.M.; methodology, D.G. and S.K.; software, S.M., S.K. and D.G.; validation, S.K. and D.G.; formal analysis, S.M.; investigation, S.M.; resources, P.D., D.G. and S.K.; data curation, S.M.; writing—original draft preparation, D.G.; writing—review and editing, D.G., S.K., P.D. and S.M.; visualization, D.G. and S.M.; supervision, S.K. and P.D.; project administration, P.D.

Funding

This research received no external funding.

Acknowledgments

Authors are grateful to the authorities who allowed to investigate the building.

Conflicts of Interest

The authors declare no conflict of interest.

References

  1. Bureau of Indian Standard. Criteria for Earthquake Resistant Design of Structures, 6th ed.; Bureau of Indian Standard: New Delhi, India, 2016.
  2. Gautam, D.; Rodrigues, H.; Bhetwal, K.K.; Neupane, P.; Sanada, Y. Common structural and construction deficiencies of Nepalese buildings. Innov. Infrastruct. Solut. 2016, 1. [Google Scholar] [CrossRef] [Green Version]
  3. Gautam, D.; Chaulagain, H. Structural performance and associated lessons to be learned from world earthquakes in Nepal after 25 April 2015 (MW 7.8) Gorkha earthquake. Eng. Fail. Anal. 2016, 68, 222–243. [Google Scholar] [CrossRef]
  4. Barbosa, A.R.; Fahnestock, L.A.; Fick, D.R.; Gautam, D.; Soti, R.; Wood, R.; Moaveni, B.; Stavridis, A.; Olsen, M.J.; Rodrigues, H. Performance of medium-to-high rise reinforced concrete frame buildings with masonry infill in the 2015 Gorkha, Nepal, earthquake. Earthq. Spectra 2017, 33, S197–S218. [Google Scholar] [CrossRef]
  5. Varum, H.; Furtado, A.; Rodrigues, H.; Dias-Oliveira, J.; Vila-Pouca, N.; Arede, A. Seismic performance of the infill masonry walls and ambient vibration tests after the Ghorka 2015, Nepal earthquake. Bull. Earthq. Eng. 2017, 15, 1185–1212. [Google Scholar] [CrossRef]
  6. Gautam, D.; Fabbrocino, G.; Santucci de Magistris, F. Derive empirical fragility functions for the residential buildings in Nepal. Eng. Struct. 2018, 171, 612–628. [Google Scholar] [CrossRef]
  7. Grunthal, G. Euripean Macroseismic Scale 1998 (EMS-98); Centre Européen de Géodynamique et de Séismologie: Luxemburg, 1998. [Google Scholar]
  8. Centeno, J.; Ventura, C.E.; Ingham, J.M. Seismic performance of a six-story reinforced concrete masonry building during the Canterbury earthquake sequence. Earthq. Spectra 2014, 30, 363–381. [Google Scholar] [CrossRef]
  9. Sawaki, Y.; Rupakhety, R.; Olafsson, S.; Gautam, D. System identification of a residential building in Kathmandu using aftershocks of 2015 Gorkha earthquake and triggered noise data. In Proceedings of the International Conference on Earthquake Engineering and Structural Dynamics, ICESD 2017; Rupakhety, R., Olafsson, S., Bessason, B., Eds.; Geotechnical, Geological and Earthquake Engineering. Springer: Berlin, Germany, 2019; Volume 47, pp. 233–247. [Google Scholar] [CrossRef]
  10. Verderame, G.M.; Ricci, P.; De Luca, F.; Del Gaudio, C.; De Risi, M.T. Damage scenarios for RC buildings during the 2012 Emilia (Italy) earthquake. Soil Dyn. Earthq. Eng. 2014, 66, 385–400. [Google Scholar] [CrossRef] [Green Version]
  11. Del Gaudio, C.; Ricci, P.; Verderame, G.M.; Manfredi, G. Urban scale seismic fragility assessment of RC buildings subjected to L’Aquila earthquake. Soil Dyn. Earthq. Eng. 2017, 96, 47–63. [Google Scholar] [CrossRef]
  12. Romao, X.; Costa, A.A.; Pauperio, E.; Rodrigues, H.; Vicente, R.; Varum, H.; Costa, A. Field observations and interpretation of the structural performance of constructions after the 11 May 2011 Lorca earthquake. Eng. Fail. Anal. 2013, 34, 670–692. [Google Scholar] [CrossRef]
  13. Westenenk, B.; de la Llera, J.C.; Besa, J.J.; Junemann, R.; Moehle, J.; Luders, C.; Inaudi, J.A.; Elwood, K.J.; Hwang, S.-H. Response of reinforced concrete buildings in Concepcion during the Maule earthquake. Earthq. Spectra 2012, 28, S257–S280. [Google Scholar] [CrossRef]
  14. Scawthorn, C. Building aspects of the 2004 Niigata Ken Chuetsu, Japan, earthquake. Earthq. Spectra 2006, 22, S75–S88. [Google Scholar] [CrossRef]
  15. Holliday, L.; Grant, H. Haiti building failures and a replicable building design for improved earthquake safety. Earthq. Spectra 2011, 27, S277–S297. [Google Scholar] [CrossRef]
  16. Gautam, D.; Rodrigues, H. Seismic vulnerability of urban vernacular buildings in Nepal: Case of Newari construction. J. Earthq. Eng. 2018. [Google Scholar] [CrossRef]
  17. Rupakhety, R.; Sigbjornsson, R.; Olafsson, S. Damage to residential buildings in Hveragerði during the 2008 Ölfus Earthquake: Simulated and surveyed results. Bull. Earthq. Eng. 2016, 14, 1945–1955. [Google Scholar] [CrossRef]
  18. Gerardi, V.; Ditommaso, R.; Auletta, G.; Ponzo, F.C. Reinforced concrete framed structures: Numerical validation of two physical models capable to consider the stiffness contribution of infill panels on framed structures in operative conditions. Ing. Sismica 2018, 35, 1–21. [Google Scholar]
  19. Bilotta, A.; Tomeo, R.; Nigro, E.; Manfredi, G. Evaluation of the seismic demand of an existing tall building. Ing. Sismica 2018, 35, 67–87. [Google Scholar]
  20. Montuori, R.; Nastri, E.; Piluso, V. Modelling of floor joists contribution to the lateral stiffness of RC buildings designed for gravity loads. Eng. Struct. 2016, 121, 85–96. [Google Scholar] [CrossRef]
  21. Donà, M.; Minotto, M.; Saler, E.; Tecchio, G.; da Porto, F. Combined in-plane and out-of-plane seismic effects on masonry infills in RC frames. Ing. Sismica 2017, 34, 157–173. [Google Scholar]
  22. Preti, M.; Bolis, V. Seismic analysis of a multistory RC frame with infills partitioned by sliding joints. Ing. Sismica 2017, 34, 175–187. [Google Scholar]
  23. Federal Emergency Management Agency. Rapid Visual Screening of Building for Potential Hazards: A Handbook; Federal Emergency Management Agency: Washington, DC, USA, 2015.
  24. Computers and Structures [CSI] Inc. SAP: Integrated Software for Structural Analysis and Design, v. 19; Computers and Structures [CSI] Inc.: Walnut Cree, CA, USA, 2001. [Google Scholar]
  25. Bureau of Indian Standard. Plain and Reinforced Concrete–Code of Practice [IS 456-2000]; Bureau of Indian Standard: New Delhi, India, 2000.
  26. U.S.G.S. M 7.8–36 km E of Khudi, Nepal. 2015. Available online: https://earthquake.usgs.gov/earthquakes/eventpage/us20002926/executive (accessed on 25 November 2018).
  27. Gautam, D.; Santucci de Magistris, F.; Fabbrocino, G. Soil liquefaction in Kathmandu valley due to 25 April 2015 Gorkha, Nepal earthquake. Soil Dyn. Earthq. Eng. 2017, 97, 37–47. [Google Scholar] [CrossRef]
  28. Structural Engineers Association of California (SEAOC), VISION-2000. A Framework for Performance-Based Design; Vols. I, II, III; VISION-2000 Committee: Sacramento, CA, USA, 1995. [Google Scholar]
Figure 1. Finite element model of the case study building.
Buildings 09 00036 g001
Figure 2. Ground floor plan of the case study building.
Buildings 09 00036 g002
Figure 3. Details of structural members: (a) Typical beam; (b) Typical column.
Buildings 09 00036 g003
Figure 4. Acceleration time history of Gorkha earthquake (North-South component) at KATNAP station.
Buildings 09 00036 g004
Figure 5. Summary of the rapid visual assessment of the building.
Buildings 09 00036 g005
Figure 6. Infill wall damage due to Gorkha earthquake in the case study building.
Buildings 09 00036 g006
Figure 7. Storey-wise distribution of damage in the case study building.
Buildings 09 00036 g007
Figure 8. Pushover curves for the building.
Buildings 09 00036 g008
Figure 9. Inter-storey drift ratio for the 0.16 g PGA input. In figure, TH indicates the time history analysis and PUSH indicates the pushover analyses conducted in both x- and y-directions.
Buildings 09 00036 g009
Figure 10. Inter-storey drift ratio for the 0.36 g PGA input. In figure, TH indicates the time history analysis and PUSH indicates the pushover analyses conducted in both x- and y-directions.
Buildings 09 00036 g010
Table 1. Configuration of diaphragm for FE analysis.
DiaphragmFloor level
9-10Stair Cover
8-97th Floor
7-86th Floor
6-75th Floor
5-64th Floor
4-53rd Floor
3-42nd Floor
2-31st Floor
1-2Ground Floor
0-1Basement
0Base

