1. Introduction
The IPCC’s Fifth Assessment Report notes that continued GHG emissions due to human-induced contribution at or above current rates would cause further warming and induce many adverse changes in the global climate system [
1]. Studies that have quantified the effects of global warming and projections of ambient temperature increases [
1] indicate that more warm days are expected in most parts of subtropics and tropics [
2]. Warming climates increase internal temperatures of buildings and studies have shown that this relationship is linear [
3]. Increase of extreme air temperatures may considerably impact the electricity demand for cooling [
4] and thus emissions [
5]. With the warming of cities [
6], both free running and air conditioned office buildings designed for existing climatic conditions are increasingly prone to indoor overheating in future. With the projected increase in energy use and the demand for more comfortable indoor environments in office buildings, there is a growing concern for high energy consumption and its likely adverse impacts on the environment [
7]. Further, overheating cannot be avoided completely under expected warming climate scenarios [
8]. These behaviors would obstruct the efforts of emission reduction strategies and targets for the building sector [
9] and require the understanding of thermal behavior patterns of buildings in warming climates if strategies need to be identified to control unnecessary indoor overheating [
10].
A linear correlation between the increase of average external air temperature and the increase of building cooling load, and thus the total energy use, is established for air conditioned buildings [
11,
12]. The average energy consumption in most countries varies between 100 and 500 kWh/m
2/a due to many reasons including climate type, climate change factor, building characteristics, HVAC and lighting systems, office equipment, and operational schedules [
13]. Further, urban environments are faced with the challenge of population inflation resulting in urban heat island (UHI) effects [
14]. Hence, buildings, infrastructure and open spaces must be adequately “climate change proofed” to counter long term effects of urbanization and climate change effects [
15]. Colombo, the commercial capital of Sri Lanka is no exception to high temperatures resulting from global warming and surface urban heat island (SUHI) effects due to the increase of building density, population and anthropogenic heat from traffic congestion, etc. [
16].
Electricity use in the commercial building sector of Sri Lanka contributes 24% to the total consumption [
17]. The annual energy consumption in office buildings in Colombo, which is known as a typical warm humid city in Asia, is ~250 kWh/m
2/a [
17]. Studies that do exist for Sri Lanka highlights that demand side management of operational energy use by buildings are primarily focused on highly sophisticated end use equipment which may be commercially available but not financially viable due to negative cost options. Further, it is also highlighted that apart from limited hydropower capacity, other available technologies such as wind and dendro power impose a cost penalty on GHG mitigation [
18].
1.1. Climate Response for Energy Sustainability: An Adaptation and Mitigation Option
Adaptation [
19] and mitigation are complementary approaches for reducing global warming impacts on buildings and thereby emissions [
1,
20]. Improving energy sustainability of building operations through climate responsive building design is definitely the most significant and cost effective action the commercial office-building sector can take in its direction to reduce dependency on non-renewable energy resources and GHG emissions. Energy in buildings is consumed mainly for cooling, heating, and lighting [
21] while a portion is used for equipment. Integration of energy conservation interventions involves both technological and nontechnological aspects of building design and operation.
Many believe that a well implemented mix of regulatory instruments such as mandatory codes, carbon energy tax policies and tradable permits, and voluntary instruments such as unilateral and negotiated agreements and voluntary programs are effective nontechnological aspects for achieving energy efficiency which could incur lower implementation costs as well [
8].
Bioclimatic design [
22,
23] is seen as an appropriate basis for technological aspects of climate responsive design which involves the way buildings filter the climate for occupants’ comforts involving four equally important interlocking variables—climate, biology, technology, and architecture. Bioclimatic design involves the conscious decision to operate buildings in the “selective mode”, where the external environment impinges on the building and indoor environments are achieved from building–climate interplay. The “exclusive mode”, which seeks to barricade the indoor environment from climate influence, effectively excludes benefits such as passive cooling and passive heating [
24].
The building envelope, cross-section, and form are main bioclimatic drivers that foster interventions to reduce negative impacts of outdoor air temperature, summer heat gain, winter heat loss, optimization of daylight, and appropriate solar control. Morphological characteristics of buildings in terms of plan form, sectional form, envelope, orientation, and fenestration details and their effects on energy consumption are known [
25]. Of them, plan form is a major contributor that controls the level of “building–climate interplay” [
26] and thus the indoor air temperature levels in buildings.
Consideration of a building’s geometry as an application of “air fluid composition” based on “plan form” consists of several design drivers such as structure, space planning, number of floor plates, disposition of open plan cellular spaces, the number of stacks, and style of atriums and light wells; this seemingly offers benefits for operational energy saving, indoor air quality improvement and, likely, tolerance to climate change effects in buildings [
27].
In multilevel buildings, height and lesser roof area in relation to external facade area means that the heat transfer between indoor environment and outdoor climate is significant through the façade and fenestration. Three ways of heat gain due to environmental and internal load transfer are known—conduction through opaque surfaces, conduction through glazed areas, and radiation through glazed areas [
28]. The bioclimatic approach in heat gain control offers an excellent opportunity to enhance a modified indoor environment as well by improving quality of daylight without heat gain, reducing conductive environmental heat gain through envelope, and better control of indoor temperature.
Heat gain due to internal loads from equipment and higher occupancy rates can be greater in office buildings in certain climates with daytime ambient temperatures ranging within the comfort zone. Gaun’s [
6,
24] simulation study predicts more indoor overheating potentials primarily due to internal loads in commercial office buildings in moderate climates, where summer air temperatures move closer to the comfort zone. In these climates, a reduction in summertime air conditioning use could be dominated by the use of internal thermal mass [
29]. On the other hand, in tropical zones with severe warm humid conditions, controlling sun penetration offers better opportunities for delivering improved energy efficiency in conditioned buildings. The bottom line is that we should be in a position to make a deliberate and positive impact on improving energy efficiency through building facades [
30,
31,
32] and plan depths [
33]. Acquiring the most effective plan depth and envelope has value for climate responsiveness and thus advanced energy performance, increased human thermal comfort and climate sensitive role of buildings [
34].
1.2. Heat Stress through Building Façades in Tropics
Heat stress [
35] on building occupants is usually measured in terms of Wet Bulb Globe Temperature (WBGT) that combines air temperature, humidity, radiation, and air flow into a single value. Studies have quantified that in warm humid climates, levels of heat stress for occupants in free running buildings are mostly higher than the preferred comfort level of WBGT in the whole year [
36]. This suggests the criticality of the climate in tropics and the need for careful integration of appropriate design interventions to avoid environmental heat stress through building facades.
Patterns of environmental heat gain through building facades due to direct radiation on different types of plan forms are known [
37,
38]. Shallow and linear plan forms with narrower facades along east–west axis promote least direct exposure to direct solar heat gain in equatorial climates. However, with high levels of cloud cover in tropics, presence of diffused radiation is a major challenge in making a building resistant to heat stress.
Percentage of glazing area of a wall know as window-to-wall ratio (WWR) of a façade can have a significant impact on heat gain potential and thus energy consumption levels in terms of cooling and heating in buildings [
39]. Aspect ratio of a plan form is another key geometric parameter that defines the building surface area by which heat is transferred between the interior and exterior environment [
40] and the amount of façade area that is subject to solar gain. The extent to which this can be beneficial or detrimental depends on the climate type. Heat transfer through opaque materials in the façade is another concern to be addressed.
In Sri Lanka, building heat stress remains a largely less investigated area. The few studies that do exist are focussed on energy efficiency measures of orientation, building envelope and lighting on free running indoors. Particularly, heat stress through facades has been least investigated for air conditioned buildings of any form. Reducing the risk of heat gain into air conditioned buildings is an essential phenomenon to study. When a building is air conditioned, the excessive heat gains through facades may not be perceptive to the occupants due to the conditioned environment inside, but nevertheless contribute to the increase of air conditioning energy load, thus exacerbating the emissions and global warming problem [
41,
42,
43]. An in-depth understanding of performance improvement for building design for air conditioned indoors in tropics is yet to be achieved.
2. Climate in Colombo
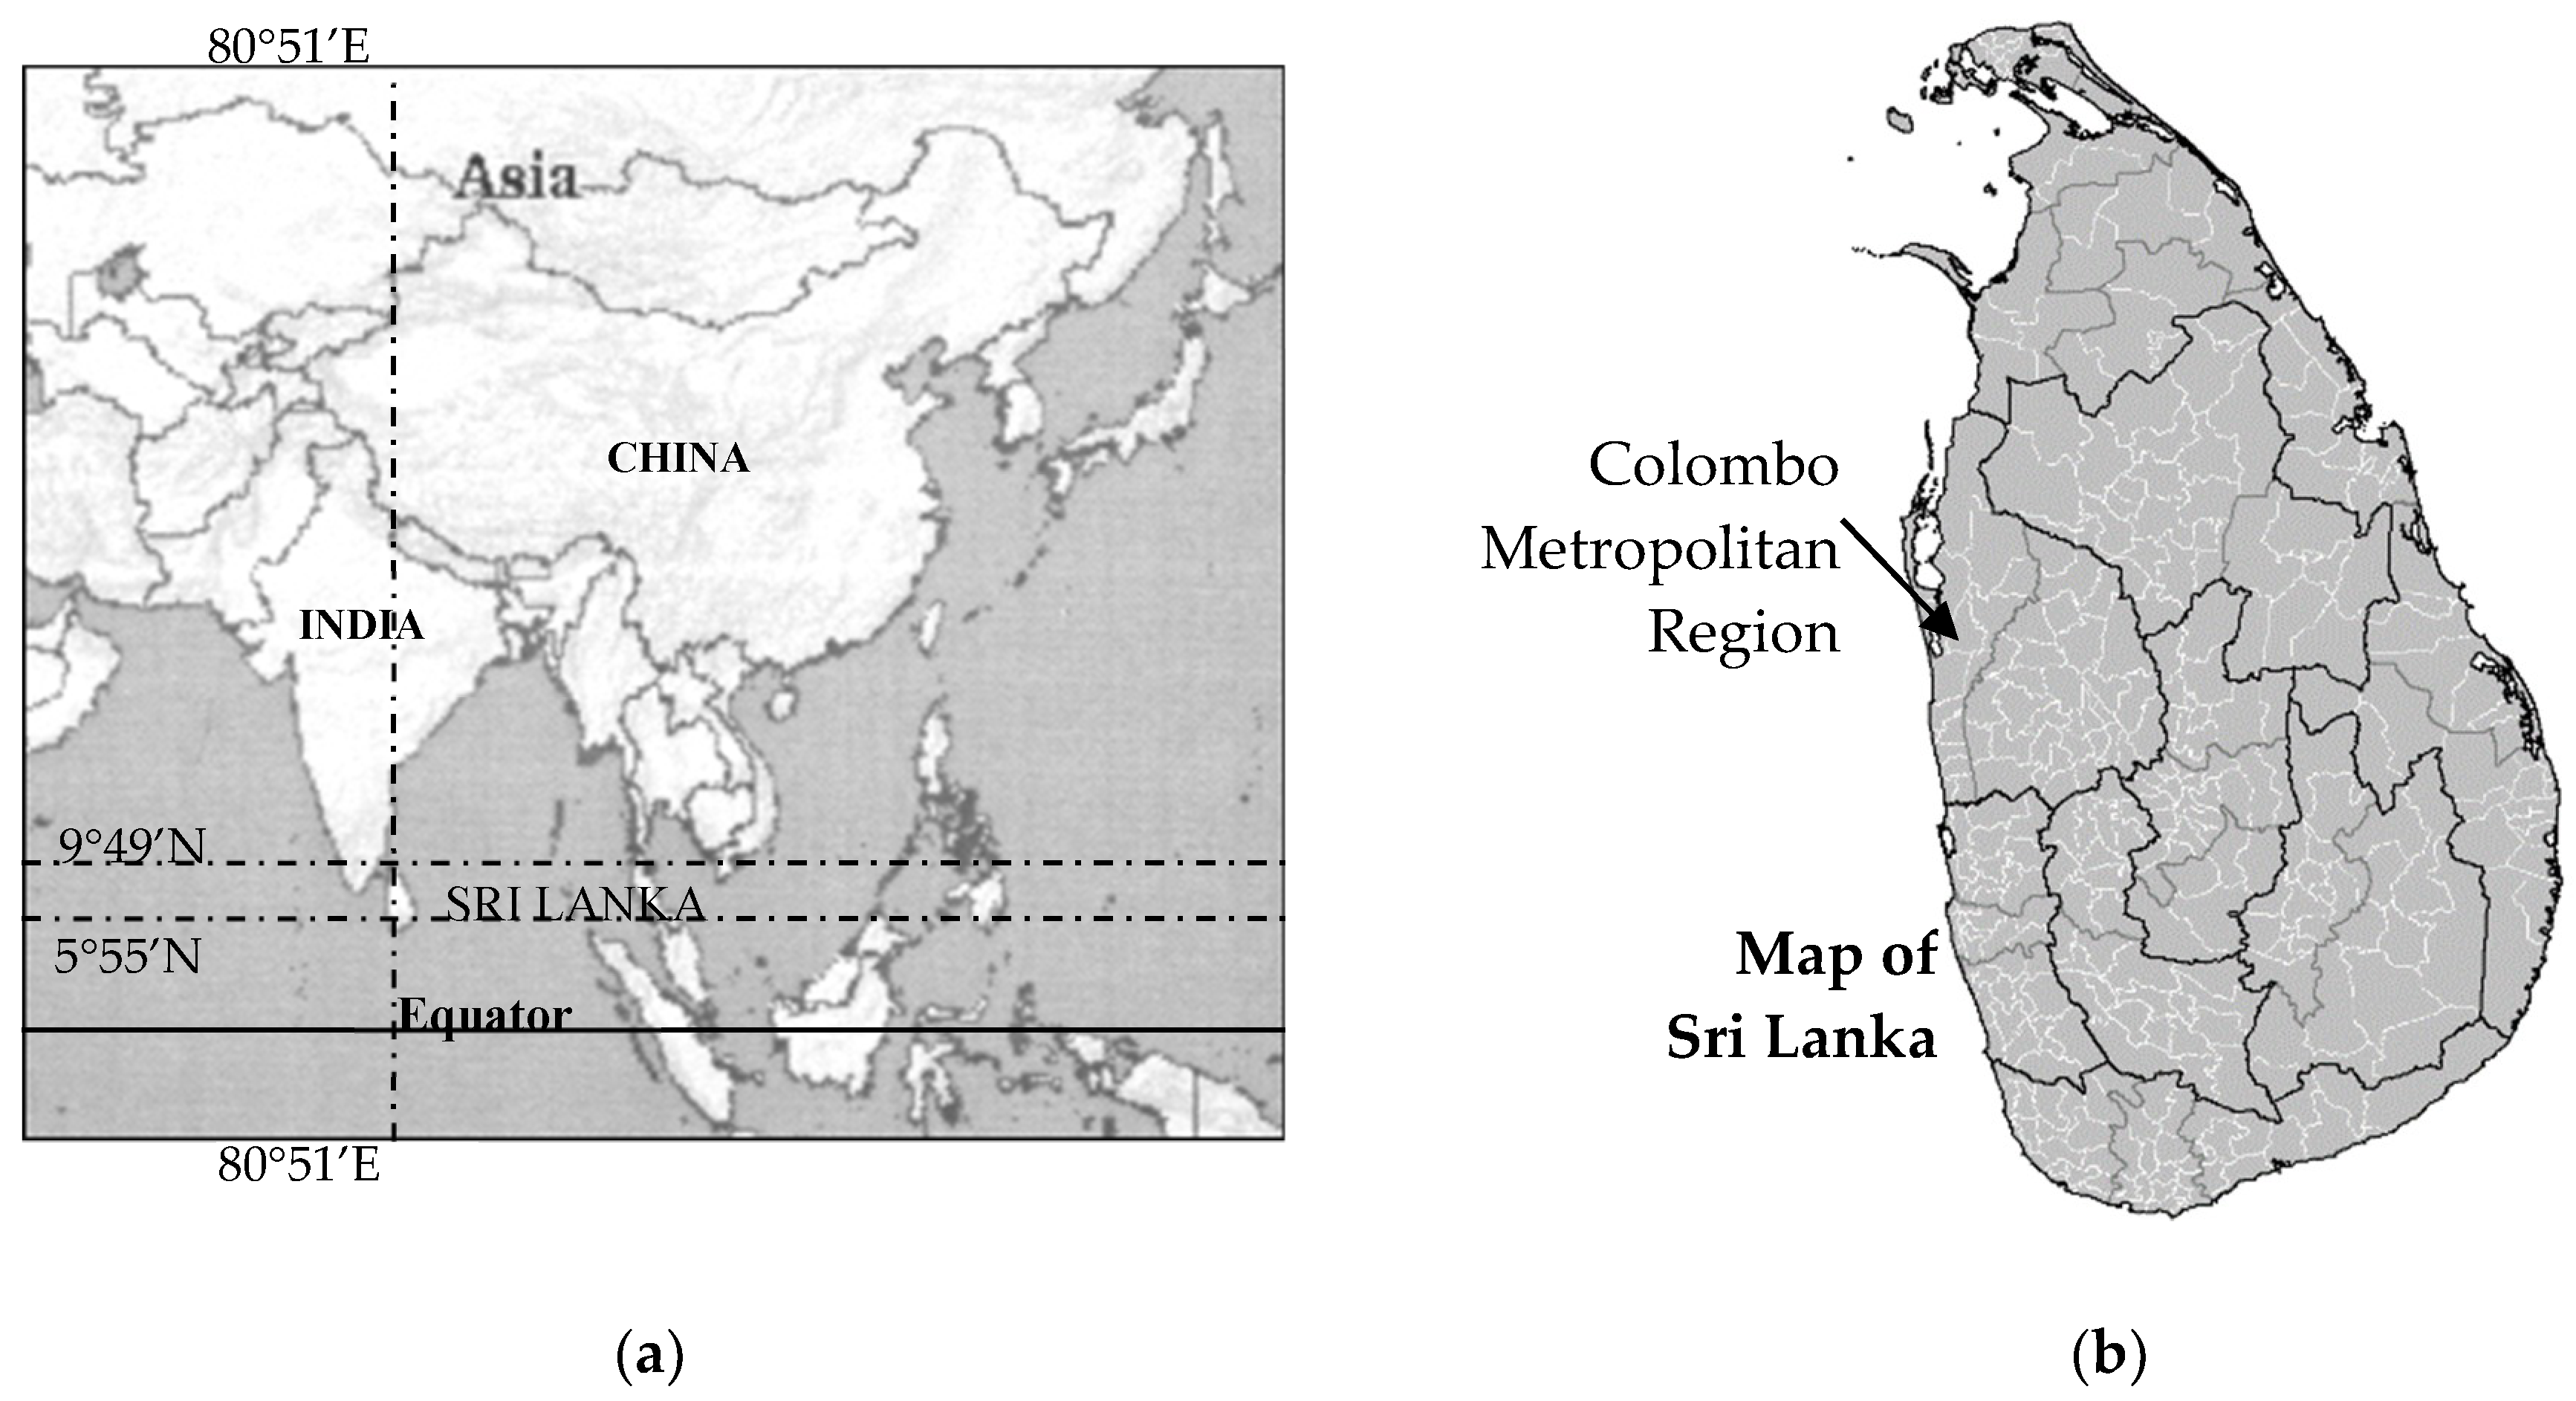
Warm humid tropical climates are found in the region extending 15° North and South of the equator (
Figure 1). Colombo (latitude 5°55′ to 9°49′ N and longitude 79°51′ and 81°51′ E) is an example of this climate and is characterised by lack of seasonal variations in temperature. The mean monthly temperatures range from 27 °C in November to 30 °C in April and relative humidity varies from 70% to 80% during a typical year. The daily maximum temperatures are high as 25 °C to 38 °C and the daily pattern in the dry season (September to November and March to May) has diurnal temperature range of 7 to 8 °C. Air temperature in these climates does not vary substantially over the daily typical cycle, thus limiting the opportunity for thermal mass for passive cooling. While solar effects are consistent, seasonal rain patterns affect temperature level (perceptions), but rainfall is increasingly unpredictable.
KŐppen Geiger climate classification demonstrates that nearly 60% of the geographical area of Sri Lanka represents type “Af”—an equatorial fully humid climate. Of the 8760 hourly data points of dry bulb temperature in the psychrometric chart developed for this study using Climate Consultant 5.5 software, nearly 60% and 40 % of data points represent air temperatures in the range of 27–38 °C and 21–27 °C respectively (
Figure 2). Annual monthly mean, maximum temperature, and relative humidity in Colombo vary within the ranges of 26.2 to 28.8 °C, 29.2 to 31.4 °C, and 73.8 to 83.6, and 90.2 to 97.9%, respectively.
The main characteristic of the warm humid climate in Colombo, from the human comfort and building design viewpoint, is a combination of high temperature and high humidity which in turn reduces the dissipation of body’s surplus heat. Irradiation in Colombo ranges from 400 to 6000 W/m
2 throughout the year. Olgyays [
22] criterion of ‘’optimum shape”—taking into account solar radiation, temperature, and other climatic conditions—calls for buildings freely elongated in the east–west direction. This provides shelter from the Sun for north–south facades and, in addition, facilitates the air movement entering from the south–west of buildings. Moreover, the directional effects of airflow inlets and building orientation can help to ameliorate the indoor airflow situation [
38]. The presence of solar radiation relates to the temperature increase in the ambient air. Thus, prior to incoming air travelling through the indoor spaces, its sol-air temperature should always be reduced at the source by shading. The most efficient way of protecting a building is to shade the windows and other openings to improve immediate microclimate [
44,
45]. Shading against solar radiation reduces the effective temperature experienced by an occupant by up to 8 °C and could reduce the environmental heat transfer as well.
2.1. The Urban Climate and Building Stock in Colombo
World’s urban population is expected to increase to 68% by 2050 and projections show that 70% of global urbanization will concentrate in countries of Asia and Africa by the year 2050 [
46]. Urbanization in tropics accounts for a significant proportion in Global GHG emissions [
47]. Colombo Metropolitan Region (CMR) is no exception to this, and indicates Surface Urban Heat Island (SUHI) effects intensifying from 2007 to 2017 due to rapid urbanization [
16]. In 2005 the extent of UHI was 42% of the total land area of CMR. This UHI is growing and predicted for an annual increase of 1.75%. Moreover, an increasing trend is apparent in the extent of built-up area, which increased from 74% in the year 2005 to 97.3% in the year 2013 [
48]. Scientific disclosure of the influence of UHI on increasing energy demand is well established.
Building stocks in many developed countries have been evaluated for the relationship between energy consumption and built characteristics [
26,
49,
50]. They have been further investigated to identify the effect of building morphology such as shape, composition, orientation, and fenestration details for assessment of building performance and the end user energy demand [
51,
52,
53]. However, similar studies on building stocks in Sri Lanka are less prioritized. The available few studies on energy consumption of buildings have focused on energy efficiency measures of lighting and simulations to assess indoor environmental quality of residential buildings [
54,
55]. Furthermore these studies are based on secondary data, which evidences the lack of a comprehensive national database that integrates the characteristics of the building stock and the energy utility intensities.
CMR, which has the highest office building density in Sri Lanka, was selected to explore the national urban building stock in respect to thermal performance and end-user energy demand.
3. Method of Study
The study was conducted in 3 phases involving 87 commercial multilevel office buildings covering an approximate floor area of 73,000 m2. Phase I consisted of a walk through survey of all buildings and an onsite thermal performance investigation of selected buildings to evaluate the impact of building morphology on Building Energy Index (BEI), for which office buildings of each division is presented as the mean BEI. It was defined as the ratio of total annual energy used in kWh per Meter Square per annum. A walkthrough field investigation was performed in 35 Grama Niladhari (GN) divisions in the CMR (GN division is the smallest administrative division in Sri Lanka). Data collection protocol was structured with the use of geographical information system (GIS) data and activity zone maps of the CMR. The identified office building stock excluded mixed administrative buildings but included buildings exclusively used for administrative activities of private and government organizations including banks and other financial offices. Building morphology data was focused on building design parameters such as orientation, plan shape, construction materials, and fenestration characteristics such as WWR and aspect ratio (façade length/depth). Technical and operational characteristics were recorded as working hours, space conditioning systems, and usage of office equipment. Occupied hours, occupancy profiles, air conditioning systems, and type and number of equipment used were observed as nearly similar in these buildings. Thermal variables of indoor air and surface temperatures were recorded using HOBO UX100-003 data loggers, and monitored continuously for a week in randomly selected samples from the 87 buildings during one of the hottest months of March 2017. Climatic data of Meteorological Department of Sri Lanka shows that March and April as the hottest months in a typical year. A statistical analysis of the entire building stock in respect to BEI and morphological characteristics was conducted at the end of Phase I, developing a classification of the building stock in terms of BEI in an integrated framework of orientation, plan shape, WWR and Aspect Ratio.
Phase II of the research project involved a comprehensive thermal performance investigation of two critical case buildings identified from the statistical analysis of Phase I. The two buildings were identified as having two extreme levels of BEIs despite having similar morphological characteristics, occupant and equipment densities with shallow plan forms with perfect orientations along the east–west axis. Indoor air temperature variations across the depths of their shallow plan forms from perimeter to perimeter were quantified in air conditioned mode using 22 HOBO UX 100-003 meters from 6 am to 6 pm over a week in April 2018. A typical floor plate was considered as a collection of 3 m × 3 m multizones and each zone had a HOBO meter. Measuring 3 m × 3 m zones contributed to give one average value for the entire floor plate and was considered more accurate than considering just one or few points in the respective floor plates. The two critical cases are orientated with the longer facades facing north and south, due to which it can be assumed that heat stress on facades due to direct solar exposure is minimal. The objective of Phase II was to investigate the levels of indoor air temperature inside these two buildings and then to judge any correspondence between BEI and level of indoor air temperature in constant conditioned mode.
Phase III was an extension to Phase II and continued for further two weeks, day and night from 26th July to 16th August 2018 and measurements were taken in multizones of 3 m × 3 m at 10-min intervals. Measurements included both inside and outside perimeter wall surface temperatures, indoor air temperatures and RH in all 3 m × 3 m multizones, and air temperature just outside the exterior walls on all four orientations. Wall surface temperatures were taken using ONSET thermo couples UX120-014M.
4. Phase I of the investigation
4.1. Dispersion of the Office Building Stock
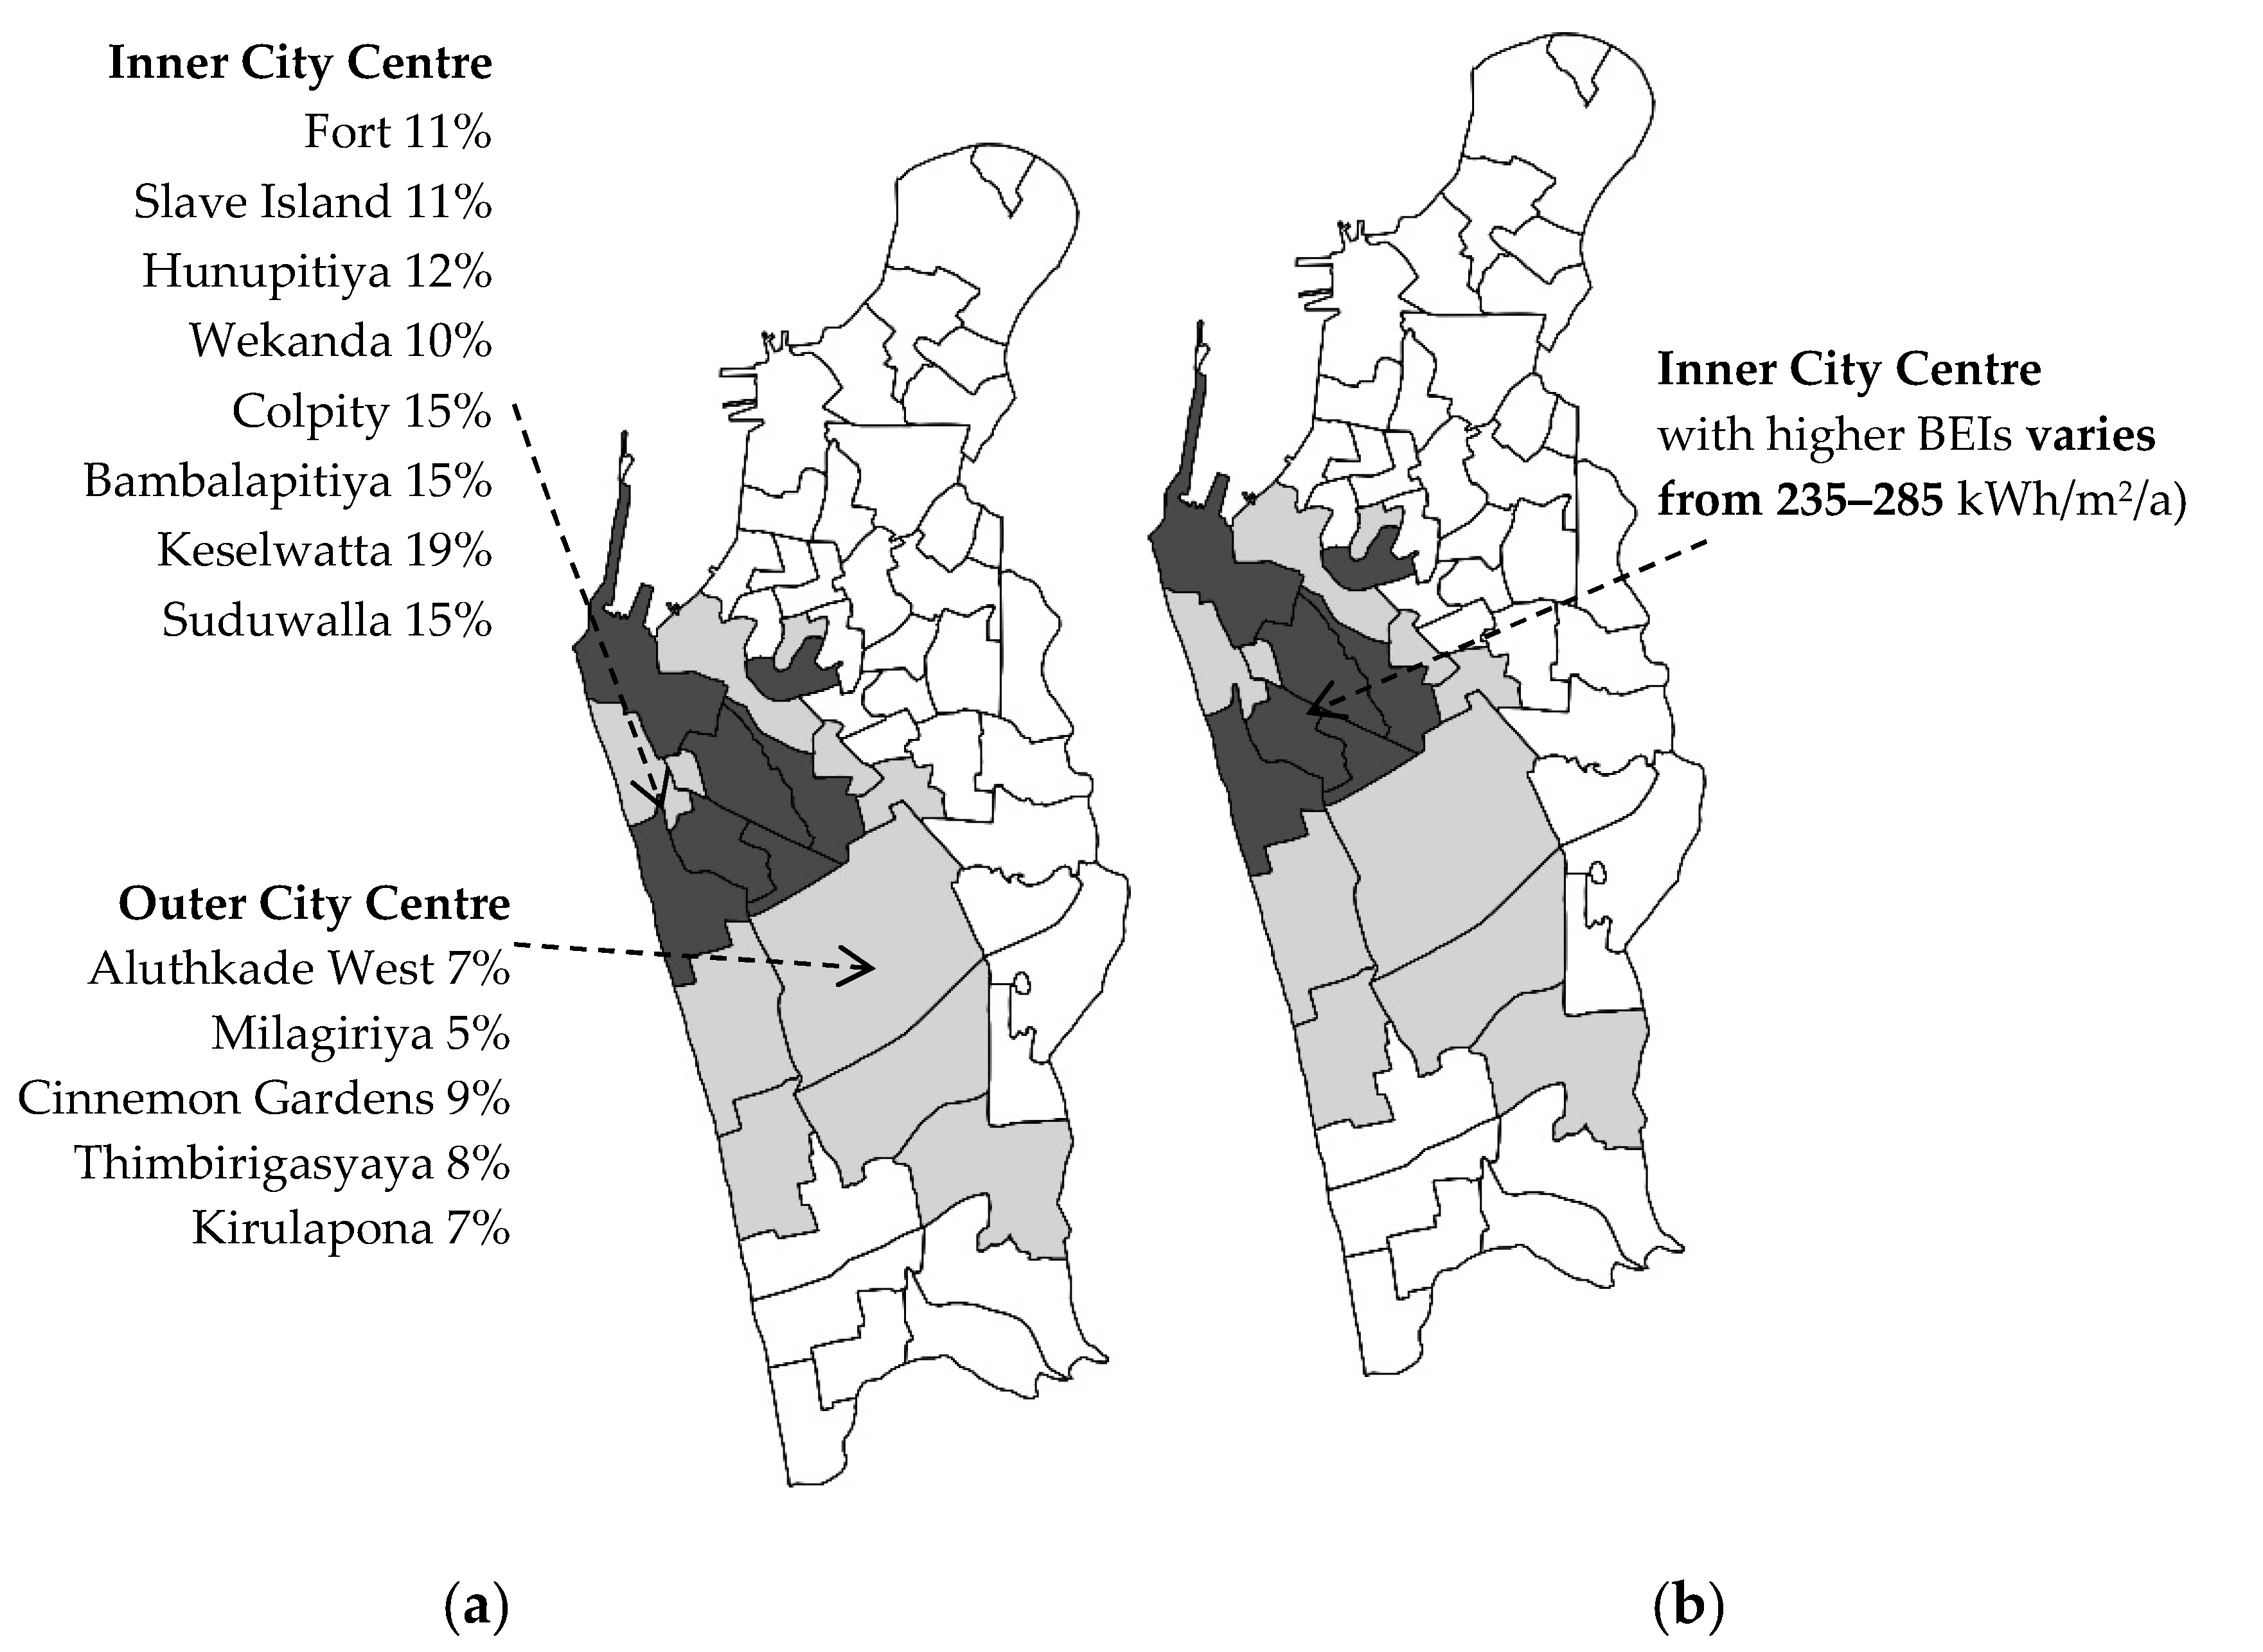
The office building stock is concentrated towards Northwest and West locations of the CMR.
Figure 3 shows the distribution of the stock and BEIs of the critical GN divisions in CMR. Thirteen of 35 GN divisions have a substantial number of office buildings as shown in
Figure 3a. The percentage of office buildings to total buildings of these GN divisions varies from 5 to 19%. The highest building stock of offices is in Keselwatte GN Division and the lowest is visible in Milagriya GN Division with percentages of 19 and 5, respectively. Descending order of GN divisions from the 2nd highest percentage of 16 up to 10% of the office stock are Suduwella, Colpetty, Bambalapitiya, Hunupitiya, Slave Island, Fort, and Wekanda. Positioning of office buildings along high-density traffic arteries is common in these zones, and the corresponding roads are Galle road, Dharmapala Mawatha, Sangharaja Mawatha, Sir James Peiris Mawatha, and D.R Wijewardana Mawatha. Thus the “road side sealed offices” represent the overarching character of national urban office building stock in CMR.
Phase I included three main Steps of investigations. The objective of the 3 steps is to sample the identified building population in the following manner:
Identifying dispersion pattern of office building stock in CMR—Step 1.
Characterizing 87 selected buildings in concentrated, dense areas in CMR in respect to BEI with plan forms, façade configurations/orientations, and compositions with neighboring buildings—Step 2.
Statistical analysis to sample the building population mentioned in Step 2 in respect to BEI, orientation, and morphological characteristics of WWR and Aspect Ratio—Step 3.
4.2. Percentage Distribution of the Building Stock in Terms of BEI—Step 1
BEIs of the office building stock were assessed for 06 critical GN divisions. These six GN divisions represent a considerable number of office buildings and correspond to a range of 19 to 10 percent of office buildings in each division. BEI for office buildings of each division is presented as the mean value.
Figure 3b presents the BEIs of six critical GN divisions. The results indicate that the annual BEI varies from 235 to 285 kWh/m
2/a. The highest demand is apparent in Kollupitiya GN Division followed by Hunupitiya GN Division with an office building stock of 15% and 12%, respectively. Results prove that there is no relationship between the percentage of the building stock and BEI (
Table 1), demanding the importance of investigating morphology of office buildings in critical GN divisions.
Three levels of BEI ranges were identified in the pilot investigation. They are Lower Range (LR), Average Range (AvR) and Critical Range (CR), see
Table 1.
The lower range was decided to be 110 to 120 KWh/m
2/a—a commonly known acceptable practice [
56]. Nearly 36% of buildings are found to be in this region. The average range claims BEIs between 150 and 250 kWh/m
2/a, which is the national average of office buildings in Sri Lanka [
17] but still considered as high. The critical range includes more than 10% of the stock with BEIs over 250 kWh/m
2/a.
a. Dispersion of BEIs in the Office Building Stock
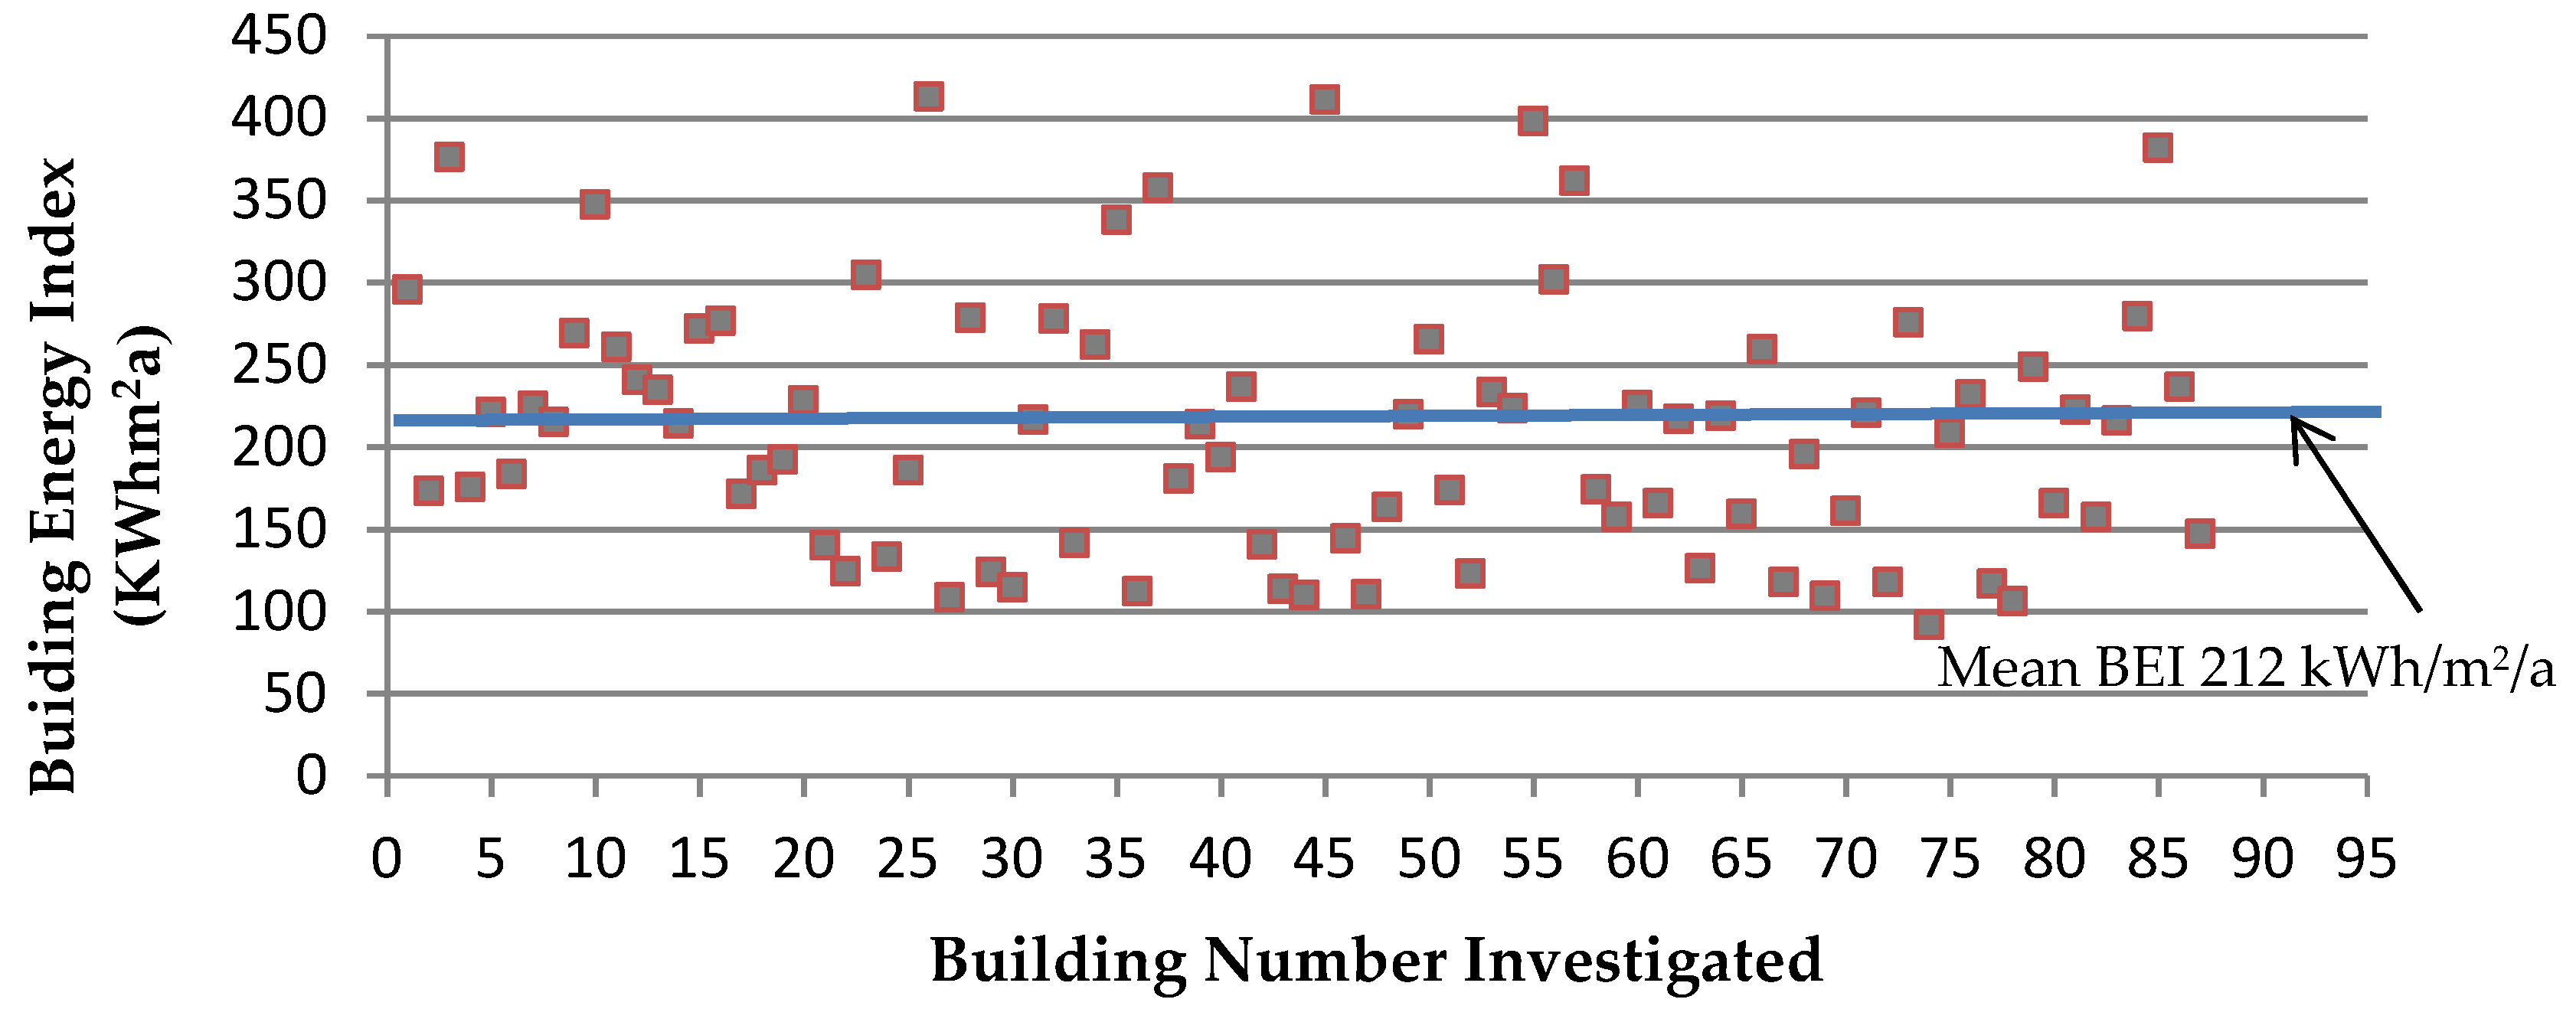
The annual BEI in these office buildings varies within a range from 91 to 412 kWh/m
2/a and 95% of the buildings are above 110 kWh/m
2/a, which represents the accepted standard for energy efficient building codes [
56]. Within this building stock, 56% of the buildings show an annual BEI above 200 kWh/m
2/a, of which almost half of the buildings are above 250 kWh/m
2/a. The mean BEI for critical office building stock in CMR is 212 kWh/m
2/a and thus solidifies that the building stock is energy obsolete beyond the standards (
Figure 4). The outcome advises further investigation of the thermal performance of the building stock and related parameters, which has an effect in the end use energy demand of this stock.
4.3. Characteristics of the Building Morphology and Sampling—Step 2
Characterizing building morphology with specific concerns to plan form, fenestration material details, orientation and composition with neighboring buildings was assessed.
b. Building Facade Detailing and Orientation
Building facade detailing demonstrates a significant impact on the thermal behavior of a building determined by “glazed to wall” ratio and facade orientation [
56]. Increased glazing proportions of the facades facing critical orientations of hot climates promotes higher gain in solar radiation and the overheated interiors increase the cooling load of air conditioned offices. On the other hand, perimeter areas benefit from the higher percentage of glazing in terms of daylight. However, the large amount of daylight, which enters a space through highly glazed areas, often reduces the quality of visual comfort due to glare problems. Therefore, this study identified a characterization of the building stock in this respect.
Table 3 presents material compositions of front facades and percentage distribution of each facade type within the office building stock.
Facades are predominantly composed of glass and aluminum cladding. The percentage distribution of these materials in front facades is 17%, 26%, and 57%, respectively. Glazed facades are primarily curtain walls and composed of fixed and few operable panels with blinds to control direct solar radiation. These facades are orientated in different directions within the building stock.
Table 4 represents the details of the facade orientations, their percentage distributions, and the relationship between the orientation and mean BEI. Office buildings in this stock represents four main orientations such as East–west (EW), North–south (NS), Northeast–Southwest (NE–SW), and Northwest–Southeast (NW–SE). Building forms have similar envelope properties of high mass concrete and brick. Floor to floor height varies between 3 and 3.5 m in all buildings.
Table 4 presents the percentage distribution of office buildings for EW, NS, NE–SW, and NE–SW orientations which are 41%, 14%, 26%, and 19%, respectively. The major characteristic is the orientation of the front façade towards East or West direction along the major roads running from north to south. This has become a design challenge for architects but no efforts are seen in making these facades more defensive from direct solar gain from east and west in the inevitable situation of having to use this specific orientation. Thus the building stock is evident for less attention on climate responsive design strategies which has affected the end use energy demand. Buildings with EW-oriented front facades demonstrate the highest mean BEI of 212 kWh/m
2/a. These findings confirm the criticality of the building morphology in addition to inappropriate orientation and material usage irrespective to climatic forces of the locality.
c. Composition with Other Buildings
Buildings within an urban block can be either attached to other buildings or exist independently, detached. This office building stock consists of a mix of both compositions with 63% detached buildings and 37% attached buildings. Attached buildings have variations, such as attached from single and both facades. Varied compositions show marginal differences in annual BEI with 211 and 210 kWh/m2/a for detached and attached buildings, respectively. Buildings with both sides attached to other buildings display better control of solar heat gain to office interiors. However, this means that the use of artificial lighting is increased due to daylight restrictions. Lack of difference between BEIs of the two types highlights the energy demand for lighting, and thus informs the importance of a comprehensive study to calculate the tenancy energy demand of this stock. However, lack of regulatory mechanisms to initiate sub metering of the national building stock is a limitation.
4.4. Statistical Analysis with BEI, WWR, Aspect Ratio, and Orientation
Multiple linear regression models were applied to identify any nexus between façade composition (window-to-wall ratio—WWR), plan form (aspect ratio), building orientation, and physical configuration to BEIs of the building sample population. Aspect ratio is the footprint in a ratio of length and width relative to the east–west or north–south. A change in the aspect ratio can vary the façade area subject to solar radiation [
40]. WWR and aspect ratio define the glazing area of a façade and, therefore, can have a clear impact on cooling or heating [
56]. The work attempted to model the relationship between two or more explanatory variables and a response variable by fitting a linear equation to observed data. The multiple linear regression equation is as follows.
where y is the predicted or expected value for the linear model with regression coefficients of dependent variable b
1 to b
n and y intercept b
0 when the values for the predictor variables are X
1 to X
n, which is the building energy index. X
1 through X
n are n distinct independent variables, which are the building morphological parameters. B
0 is the value of y when all of the independent variables (X
1 through X
n) are equal to zero, and b
1 through b
n are the estimated regression coefficients. Each regression coefficient represents the change in y relative to a unit change in the respective independent variable.
The regression analysis was carried out in three stages for 87 buildings. First stage was to analyze whether independent variables are correlating with each other to prevent multi colinearity in the regression models. The evaluation of independent variables was based on analyzing correlation coefficient and p-values. Second stage was to perform subset regression analysis to ascertain the relationship between dependent variable of BEI with independent variables of building morphological characteristics such as WWR, aspect ratio, and orientation. Subset regression analysis helped to evaluate all possible regression models. These models were revaluated based on R2 value, R2 adjusted value, and Mallow’s Cp value. The highest R2 value and R2 adjusted value with lesser Mallow’s Cp value was taken into account when determining the best fit models. The minimum R2 value was taken as 50%, where 50% of the predicted value of BEI was explained by the model. Stepwise regression was conducted to evaluate the predictors in the selected models. R2 value and p-value were considered when reviewing the best fit models. Polynomial regression analysis was preceded during the occasions when R2 value was marginal.
p-values of the independent variables, namely WWR of all four facades, the aspect ratio of the plan, and building orientation with the BEI, remained less than 0.05 in 95% of confidence intervals in regression models with four major prevailing orientations of the sample building stock. The four orientations were North–South axis, East–West axis, Northwest–Southeast axis, and Northeast–Southwest axis. The analysis was carried out for all three groups based on the BEIs of the stock namely Lower Range, Average Range and Critical Range.
Table 5 shows summative results of the analysis showing a nexus between BEIs, WWRs and orientations.
Plan forms with longer facades facing north and south directions maintain relatively lower BEIs compared to other orientations in all three groups of BEI ranges. Results show that façade orientations have greater impacts on the BEIs and thus plan forms on the east–west axis performs better. However, it is interesting to note that few buildings in this group claim BEIs as high as 250.31 kWh/m2/a, falling in to the critical range.
With two orientations of plan forms on NS (north–south) and EW (east–west) axes, BEIs claim a diversity showing a significant change of impact from facades facing NS and EW orientations. This was a common behavior in all three ranges, i.e., lower, average, and critical. The change of impact due to other orientations was less significant. Multiple regression models developed to configure a nexus between aspect ratio and WWR of NS- and EW-oriented buildings in all three BEI ranges highlight a criticality of plan form with higher aspect ratios. This was evident with high BEI averages and they can be identified as shallow plan forms orientated on EW orientations. Despite these forms are ideal for tropics, an increase of the aspect ratio is seen as a strong independent variable contributing to higher BEIs, the critical range (
Table 6). Outcome demands a field investigation of these buildings.
5. Phase II and Phase III of the Investigation
Phase II was more focused on the shallow plan forms. As discussed in the Phase I, buildings with higher aspect ratios on the East–West direction have a shallow plan form with two extremes of BEI values, i.e., lower and critical ranges.
5.1. Sampling of the Building Stock for Phase II
Conducting a thermal performance investigation on two sample buildings with shallow plan forms was aimed at in Phase II. The classification of building morphological characteristics showed that 63% of building stock has shallow plan forms, compared to 26% of deep and 12% of composite forms. Of the shallow forms, 17 buildings are seen orientated on the EW axis in different locations. Two buildings were then sampled from these 17 buildings that showed different levels of BEIs ranging from 110 to 320 kWh/m2/a in the outcome of statistical analysis in Phase I.
Buildings attached or close to other structures were eliminated from the beginning of the study. Only free standing buildings were considered so that impact of urban climate on all facades of any particular building could be assessed.
The two sample office buildings—“A” and “B”—are composed of similar morphological character (WWR and aspect ratio), orientation, operational profile, and occupant and equipment density but extensively different from the BEI point of view (
Table 7). Both buildings are occupied from 8 am to 6 pm on weekdays and are located in similar urban contexts just a kilometre apart.
The objective of the focused field investigation was to assess the distribution pattern of heat stress on indoor environment depending on the plan depth. Building “A” has BEI as high as 340 kWh/m
2/a whereas the Building “B” has a moderate level of 120 kW/hm
2/a, which is close to acceptable level. Front narrower façade with the main entrance is positioned facing east orientation in both cases.
Table 7 explains similarity of the operational and physical characteristics of the two buildings. The only difference between the two building forms is the floor area where a typical floor plate of Building “B” is relatively larger than the same of Building “A”. However, occupant and equipment density are comparatively similar in both cases.
Multizone indoor air temperature reading in 3 m × 3 m zones across the plan depth (and along the building length as explained in the method) were taken using HOBO data loggers during three working days in the month of April 2018 (23rd–27th of April 2018) at 10 min intervals and then averaged to hourly values. The measurement rationale was to ascertain a number of comparisons that are as follows.
Dynamics of air temperature distribution in peripheral and central zones on a typical floor plate to assess the collective heat stress effect of façades and plan depth.
Dynamics of air temperature deviation from the set point temperature to assess the thermal load on the air conditioning system.
The study acknowledges that any dynamics in the indoor air temperature demonstrates an effect of environmental loads on air conditioning and the indoor thermal behaviour. Microclimatic data just outside the building were recorded onsite. The central air conditioning system of both cases is similar in specifications (15 tons per 1 AHU). However, Building “A” has a higher number of diffusers (1 for each 13 m2) than in Building “B” (1 for each 36 m2) per floor. Readings were taken in three typical floors above 6th level in both buildings. Temperature fluctuations on the day that the study was conducted when the building was in non-functional mode (weekends) demonstrates the effect of environmental load on indoor thermal behaviour.
5.2. Phase III
Phase III was aimed at repeating the investigation performed in Phase II but continuously over 20 days from 26th July to 16th August 2018. Measurements of each 3 m × 3 m multi-zones recorded at 10-min intervals were later averaged to hourly values, which in turn averaged to a single value for the entire floor. Objective of Phase III was to ascertain the following.
Hourly pattern of dynamics of average indoor air as a single value in a typical floor against the coordinating set point temperatures.
Quantify the extremes of heat stress on air conditioned environments and identify contributing factors.
6. Results and Discussion
Set-point temperature of all office and useable floors of both buildings is 24 °C degrees. Despite this, indoor air temperature dynamics in varied levels were seen during the daytime in both buildings.
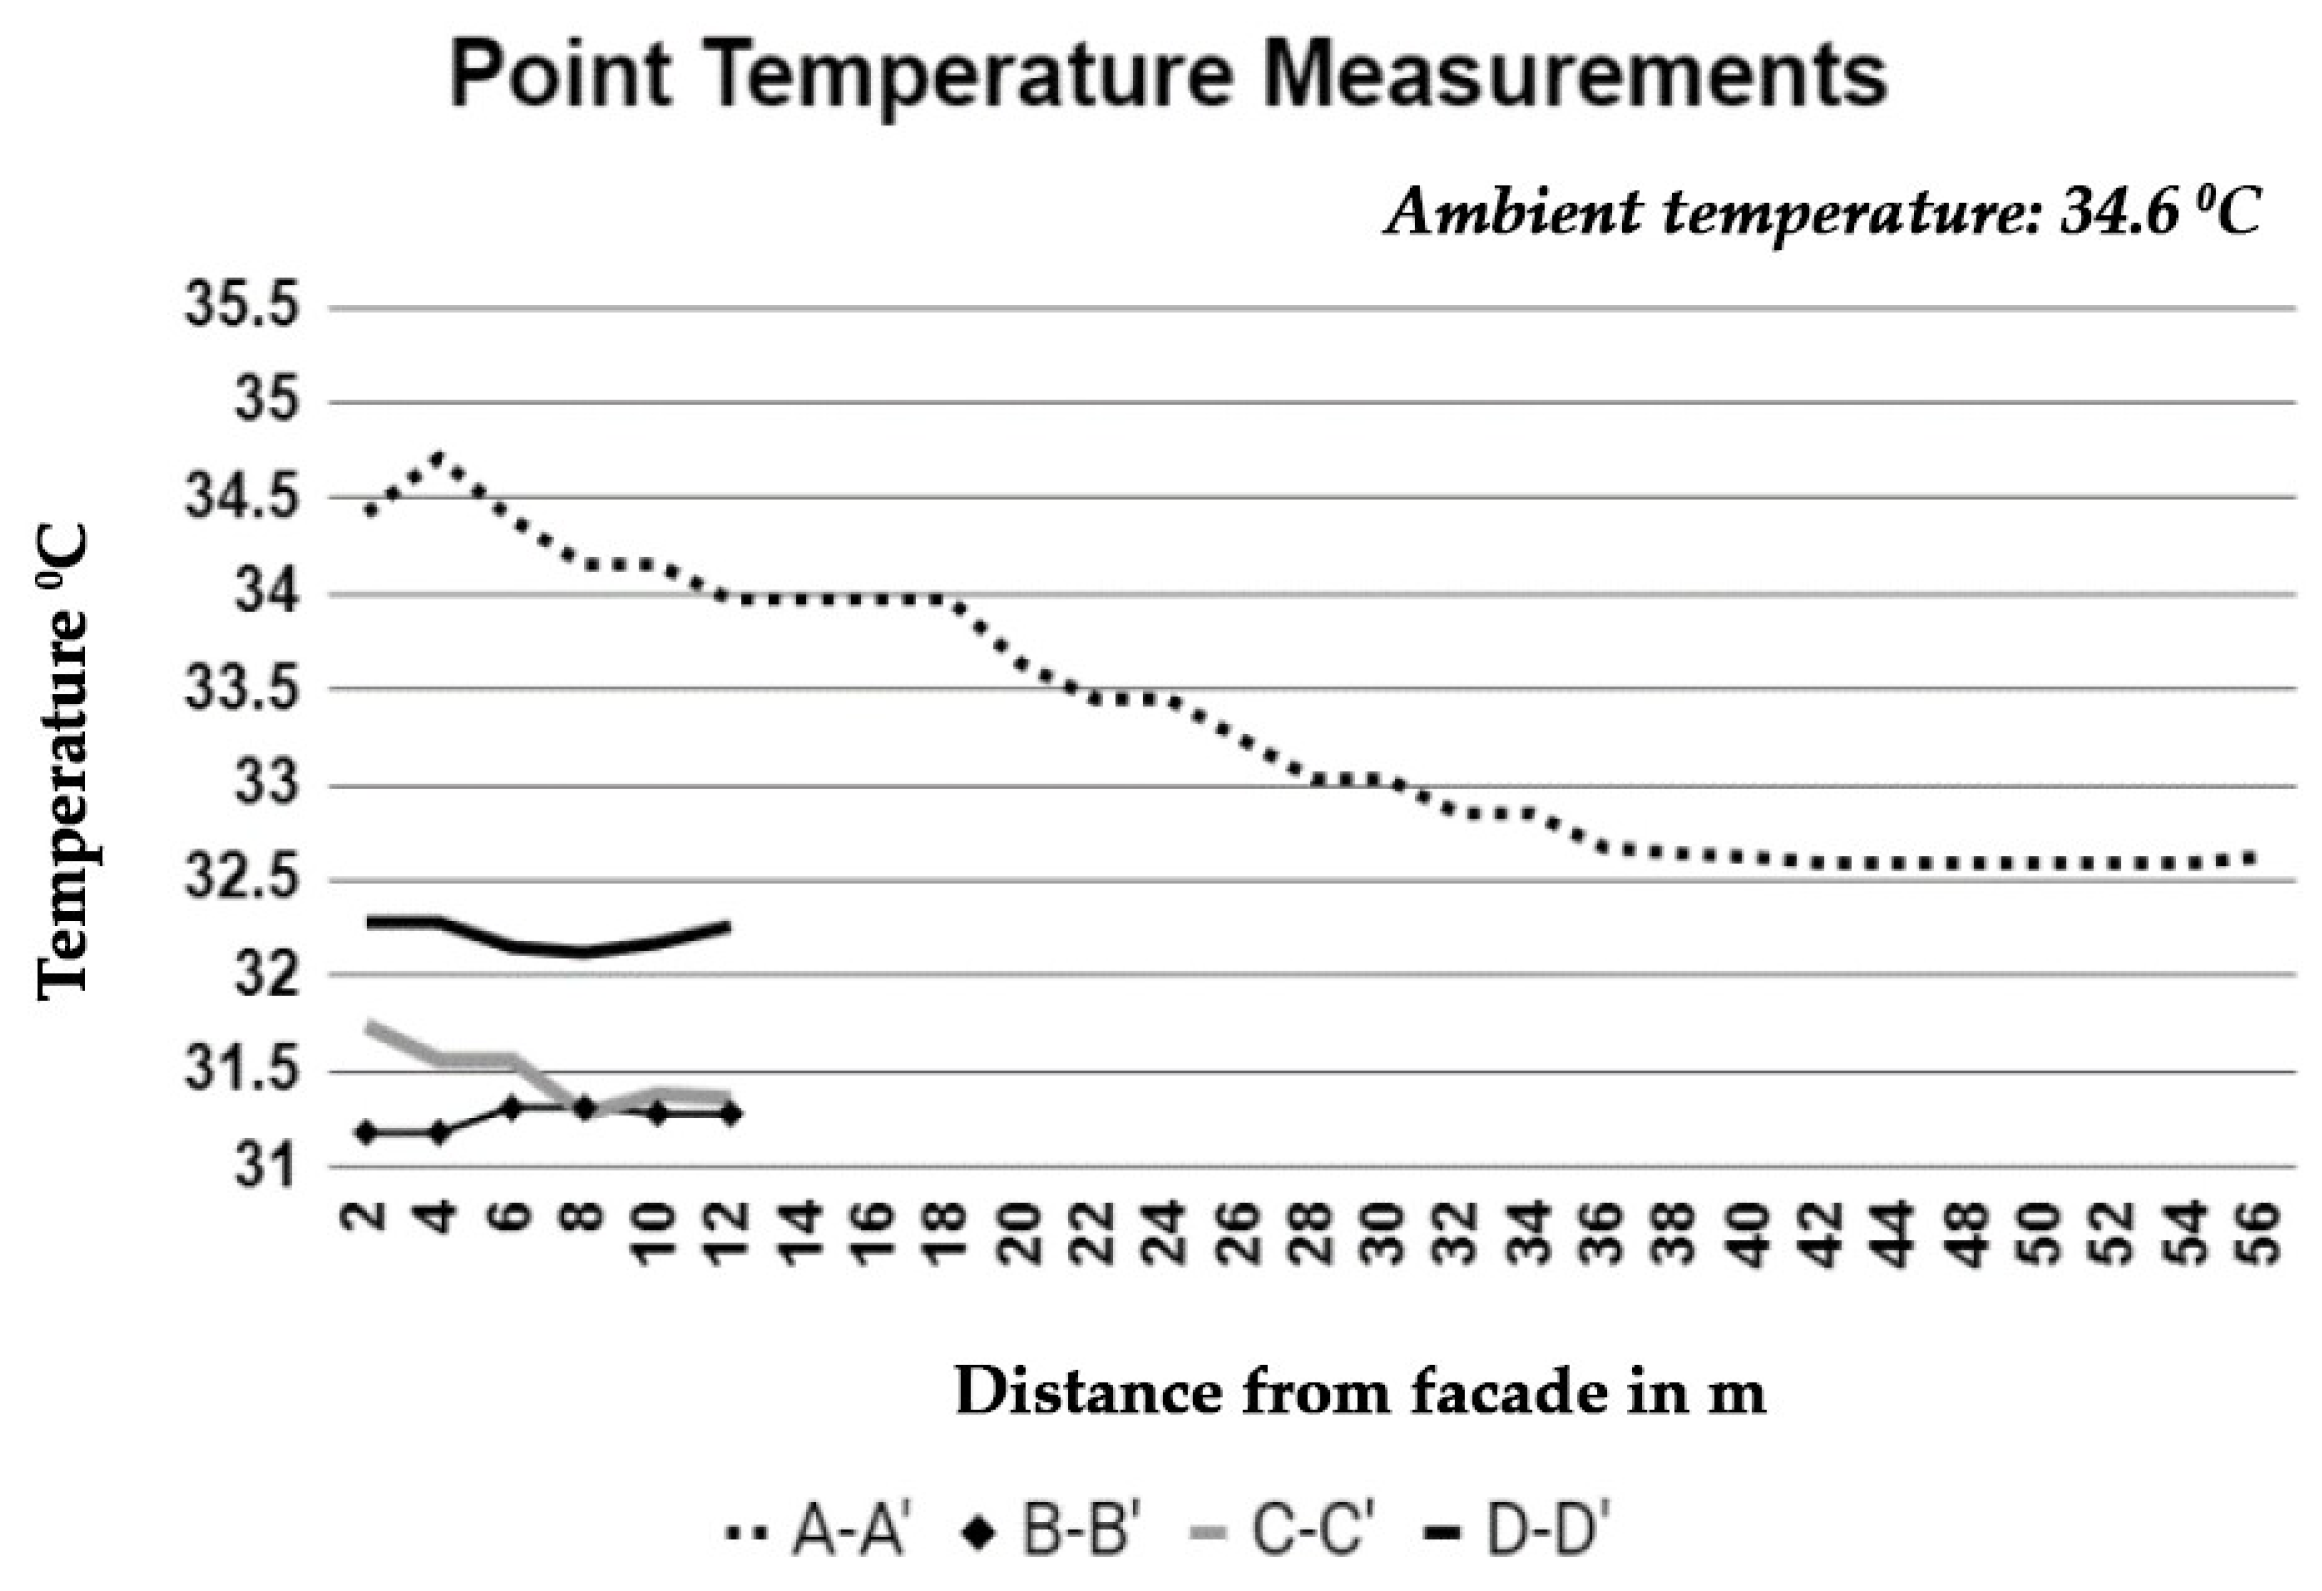
Results show that an increase of indoor air temperature up to 31 to 32 degrees C across all 3 m × 3 m zones along sections—A-A, B-B, and C-C—in Building “B” (see
Table 7) while temperature readings in the internal zone close to west façade and east facades along D-D remained at 34 and 31, respectively, at midday (
Figure 5) when the sun was just above the building and no direct radiation could penetrate through the sides. Solar axis to buildings in Colombo between the 23rd and 27th April is normally over the head, therefore there is no way of entering solar access from sides. However, a middle floor was investigated in this study so that effect of heat from vehicular traffic was considered minimal. This thermal behaviour explicitly suggests the presence of heat stress on the air conditioning system from the façade. Office equipment inside the three floors remained switched off from the morning to assist the research, so that indoor heat generation was limited to a minimum. As mentioned in a previous section, the BEI of this building was approximately 120 kWh/m
2/a, but heat stress of 10.7 °C indoor air temperature above the set-point is an issue to be addressed.
The set-point temperature of both buildings was at 24 °C. Despite similarities in set point temperatures, Building “A” was assessed with lesser elevation of indoor air temperature ranging between 24.4 and 25.1 °C (
Figure 6). It has a highly dense AC diffuser system than Building “B” and results show that it is capable of maintaining indoor air temperature closer to the set point temperature, but at a much higher energy cost at a BEI of 320 kWh/m
2/a. Results suggest the criticality of shallow plan forms on end user energy demand of the building stock.
Shallow plan depths of Building “B” and “A” are 12 m and 16 m, respectively. Length of the floor plates of Buildings “B’ and A” are 50 m and 38 m, respectively. Multizone air temperature distribution across the depths and lengths of floor plates are shown in the two graphs above (
Figure 5 and
Figure 6). Considerable dynamics of air temperatures well above set point temperature in all zones across these depths and lengths demonstrate increased demand on cooling energy due to high levels of external gains through facades.
Performance behavior of Buildings “B” and “A” in Phase III are shown in
Figure 7 and
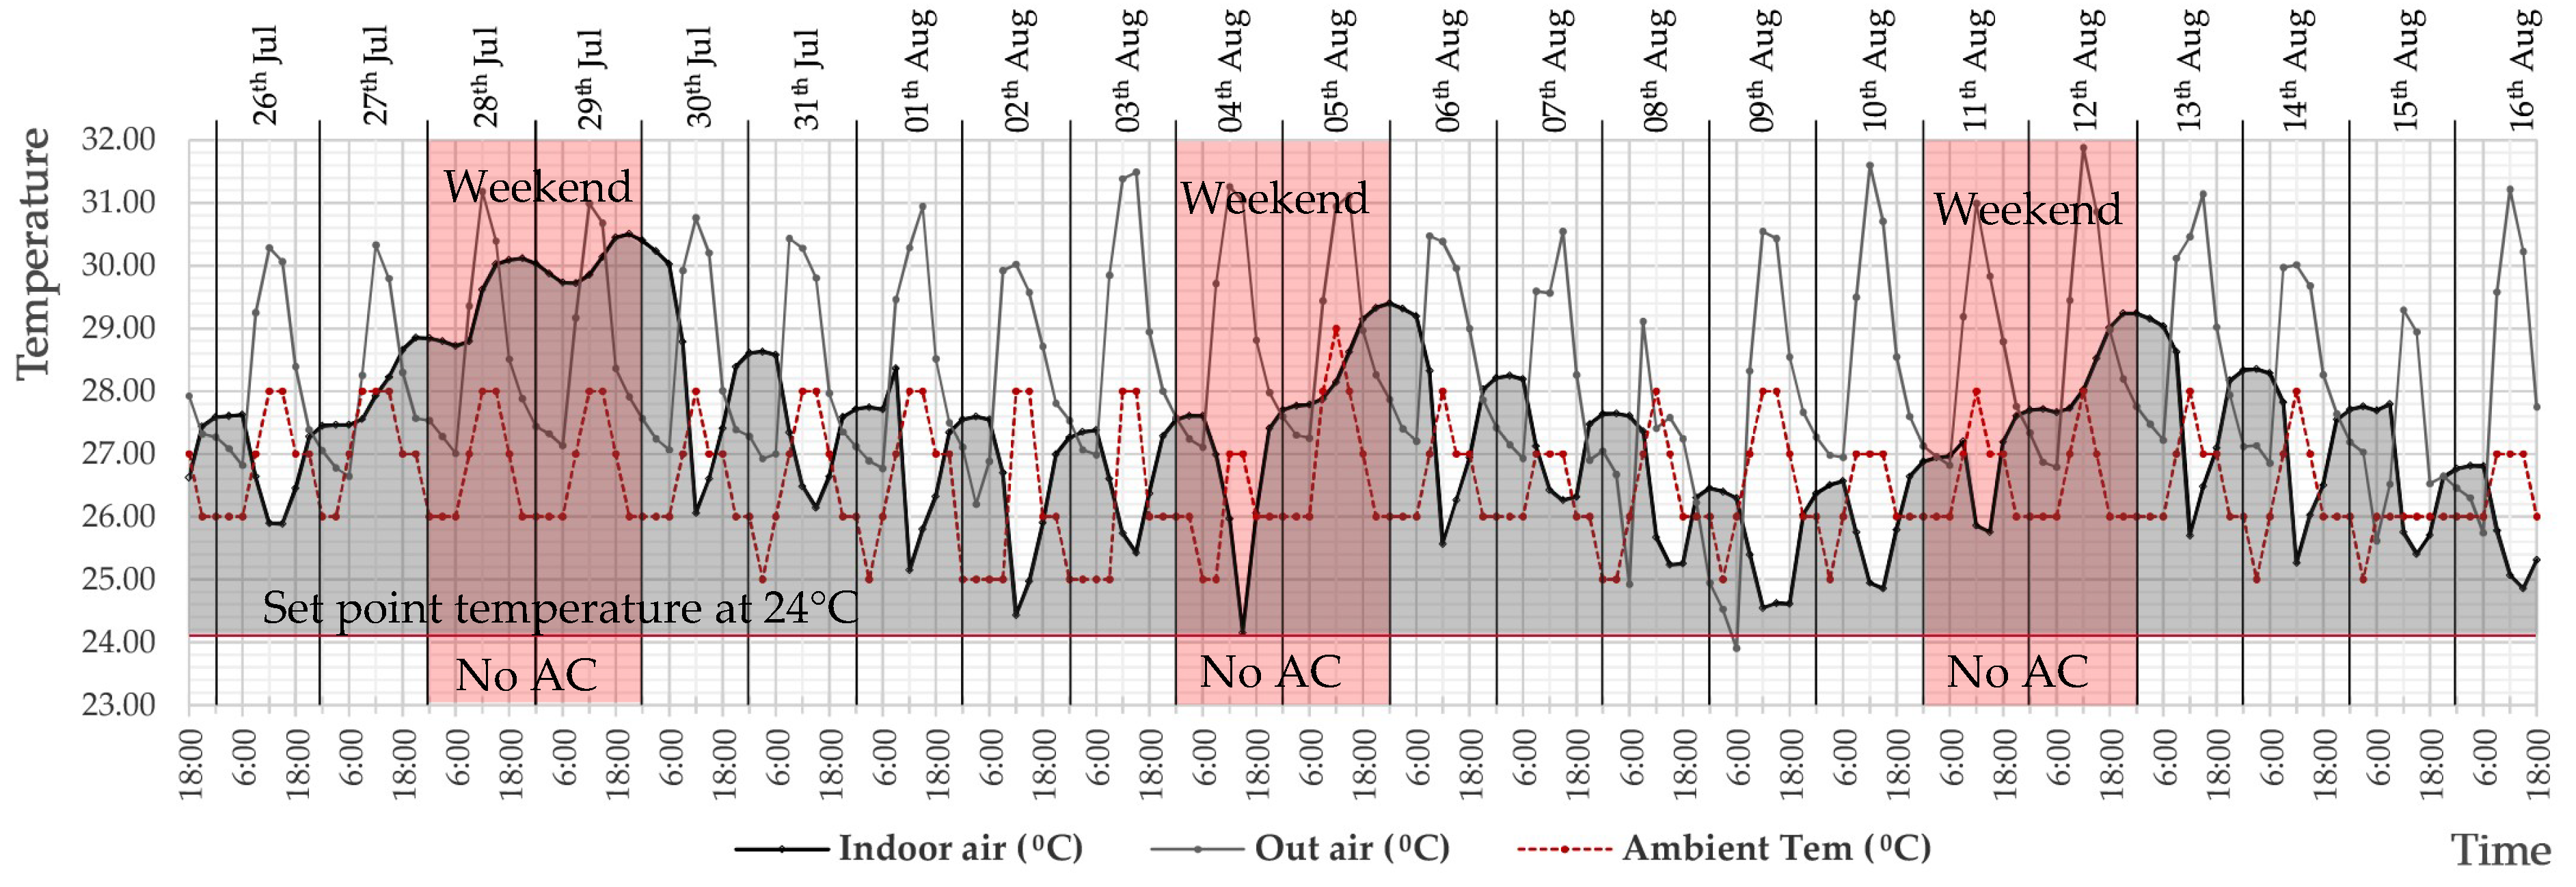
Figure 8 respectively. During this period maximum ambient moved around 28 °C, an ambient climatic situation which is not extreme and also lower than the ambient levels during Phase II, (which fluctuated between 31 and 34 degree C). Air just outside the building, measured at the 8th floor level revealed a heat built up situation just outside the façade, suggesting solar gain from outside.
Cooling system of the building has been able to control the indoor air to keep its temperature at approximately 26–26.5 °C during midday, but results show an overheating situation in nights and during weekends. Overheating situation in the night indicates a level of heat stress from the heat released from the envelope. Overheated situations in the weekends show a greater level of heat stress from the facades.
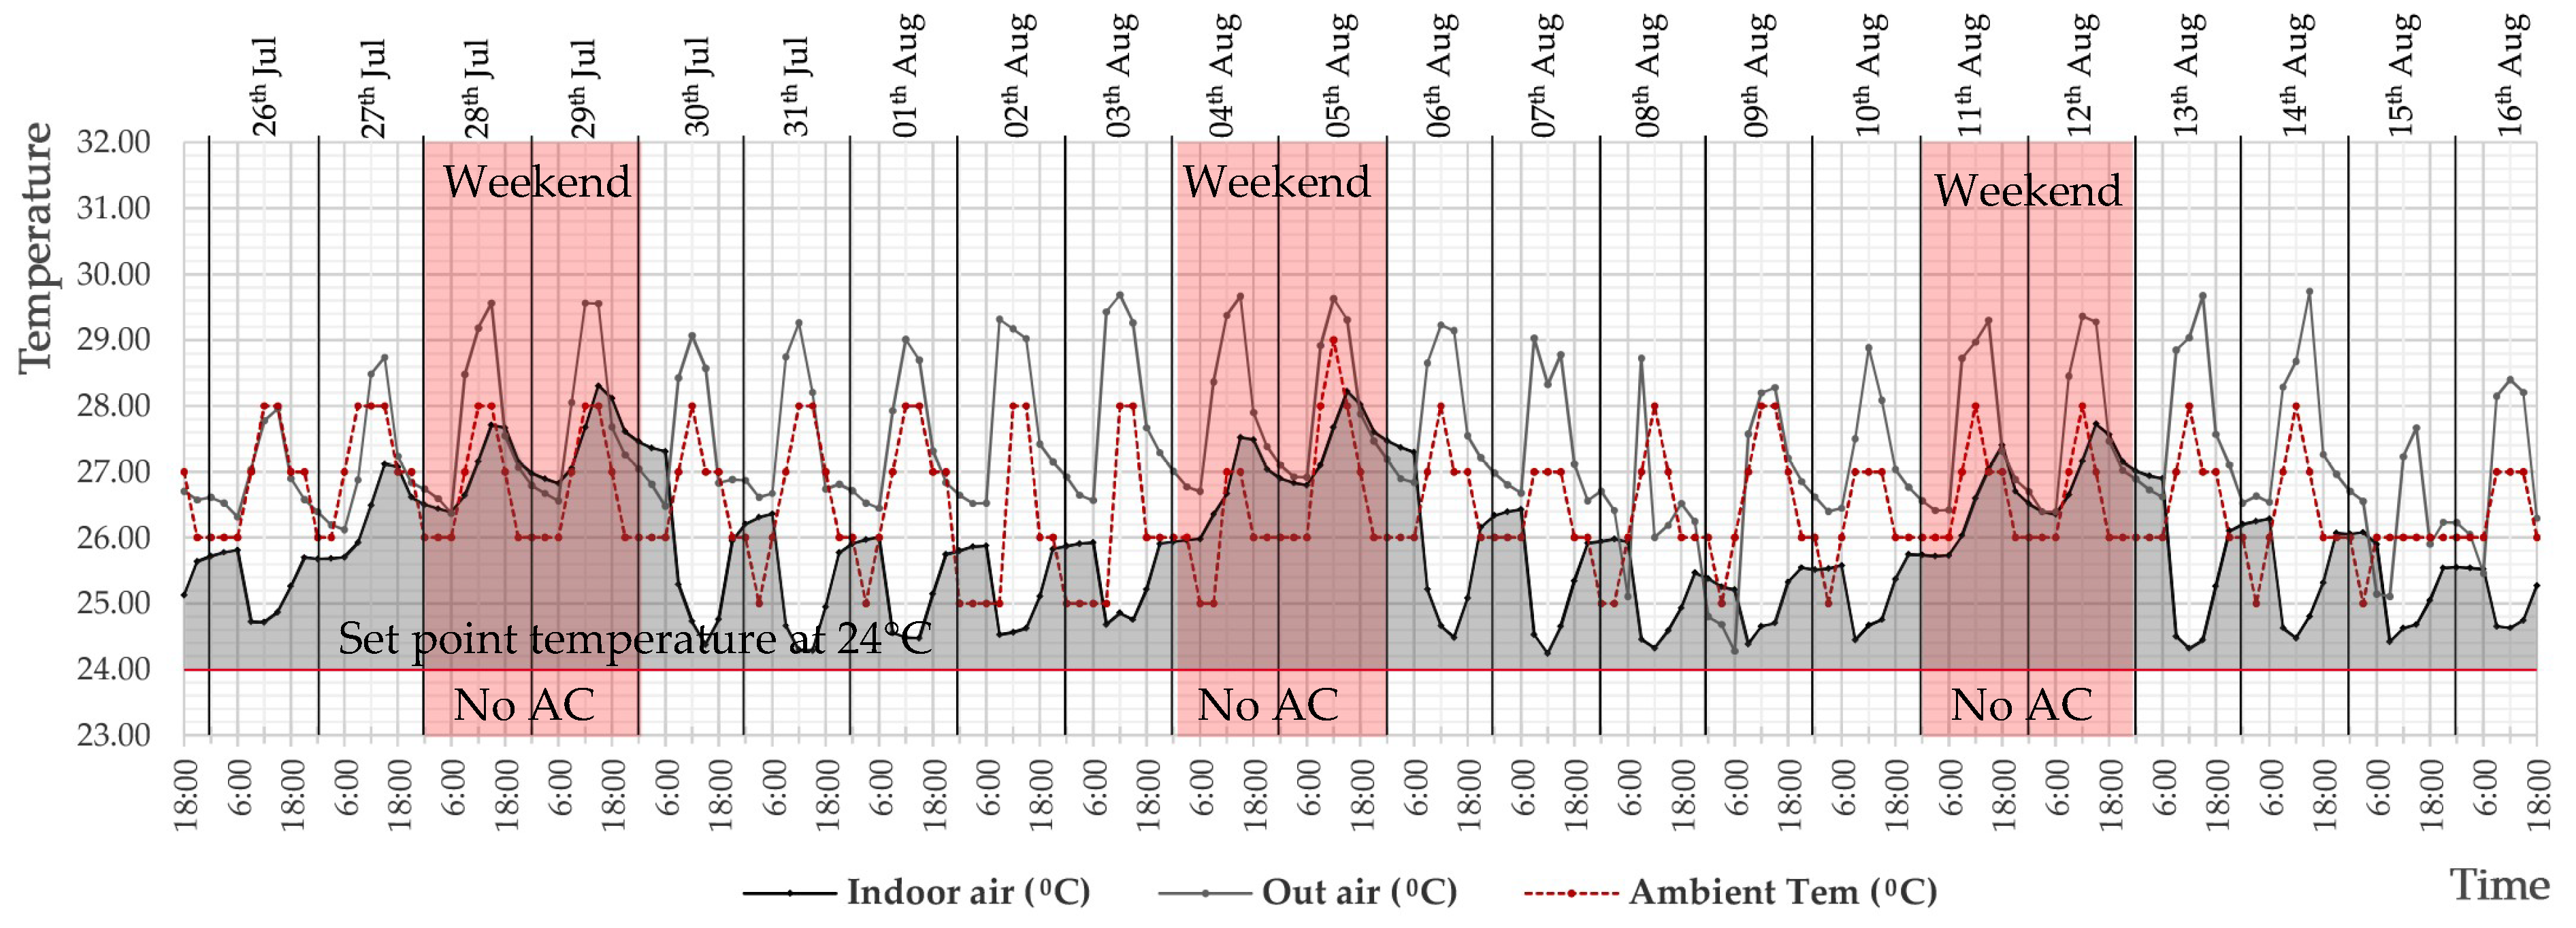
Thermal behavior of Building “A” followed a similar pattern to the Building “B” but showed relatively a smaller dynamics from the set point temperature at a much higher energy cost at a BEI of 320 kWh/m
2/a (see
Figure 8), similar to Phase II outcome. Situations in weekends showed a severe heat stress due to environmental gain on the indoor air. The results indicate the following.
Overheated microclimates, well above the ambient, outside the buildings at high elevations
Severe heat stress and indoor overheating during weekends (nonfunctional hours)
Higher indoor air temperature levels than the set point temperature through daytime AND elevation of indoor air above ambient in early morning hours
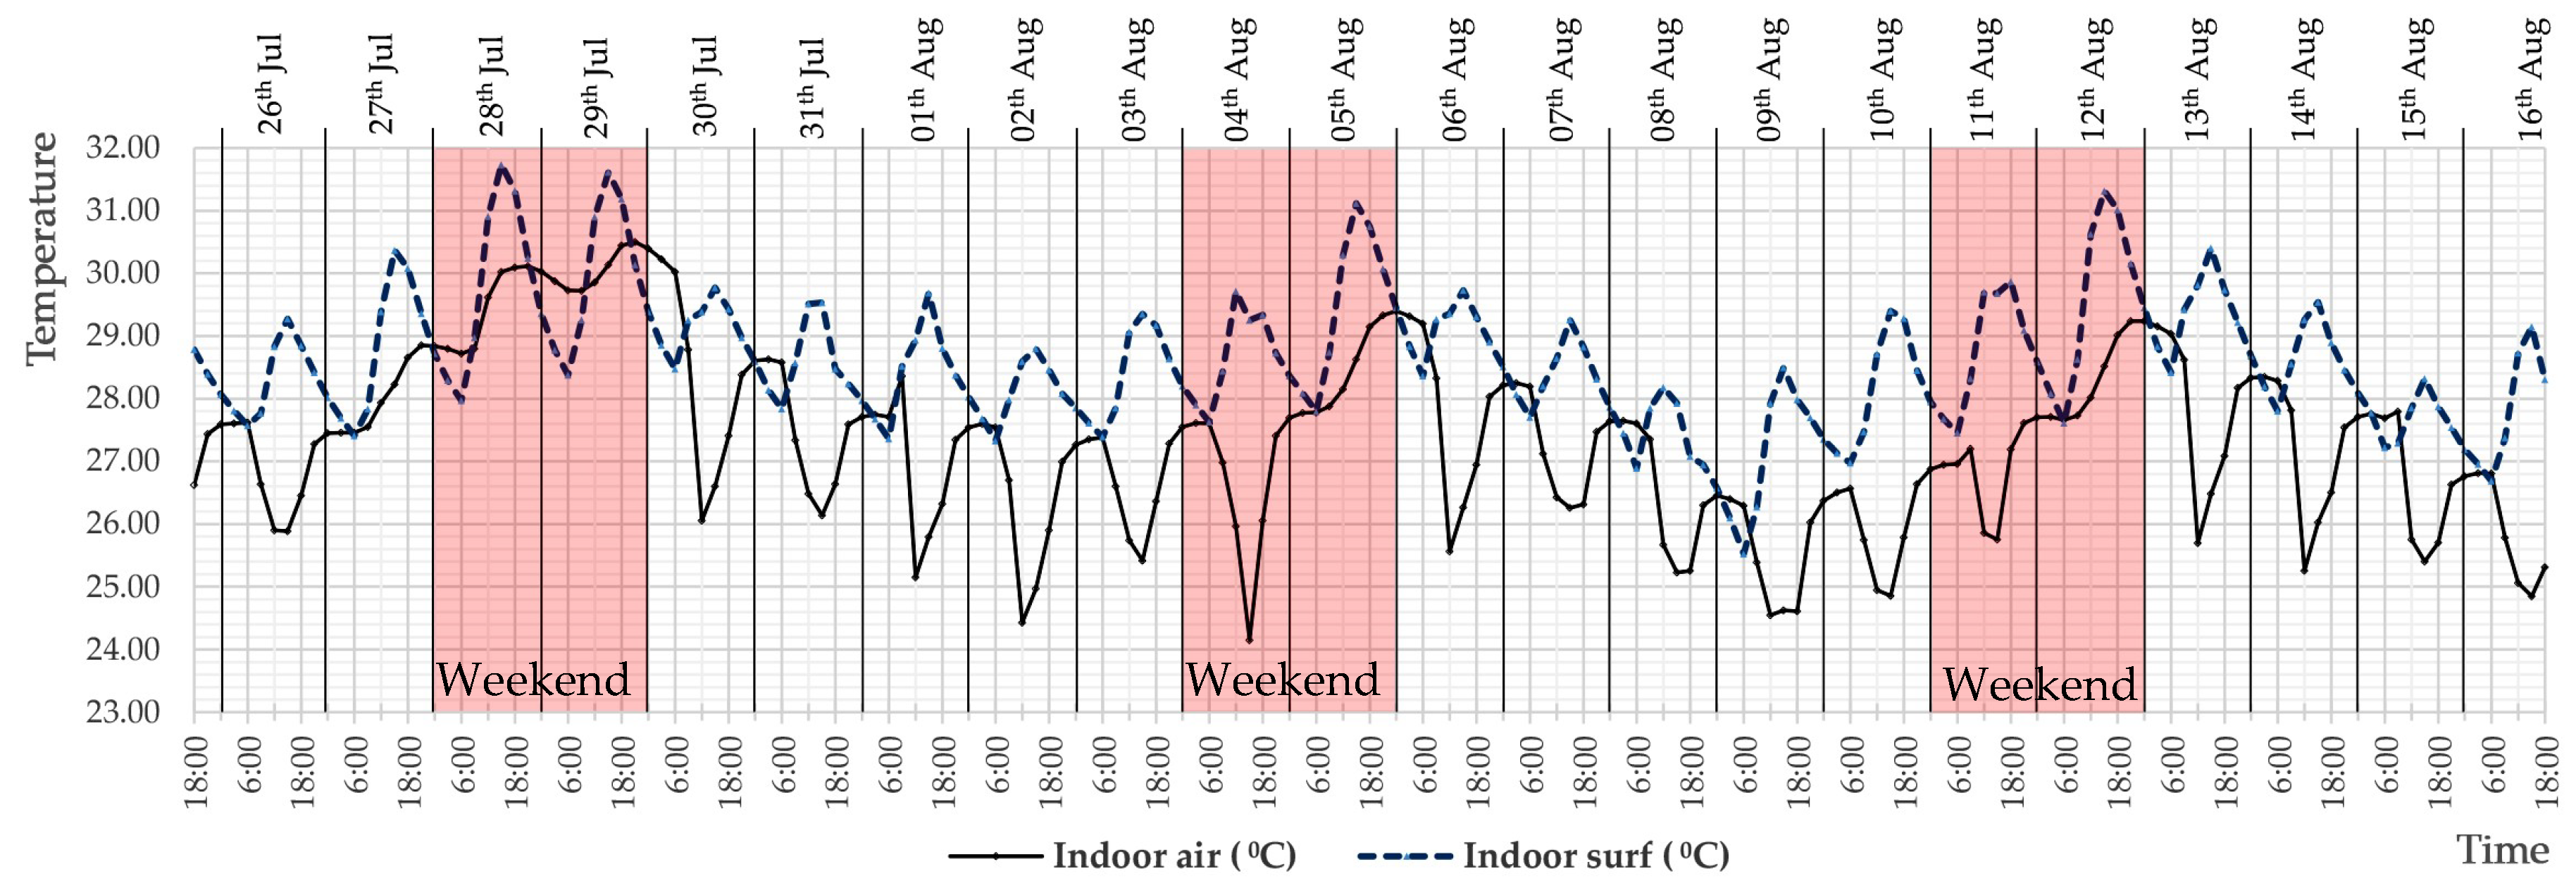
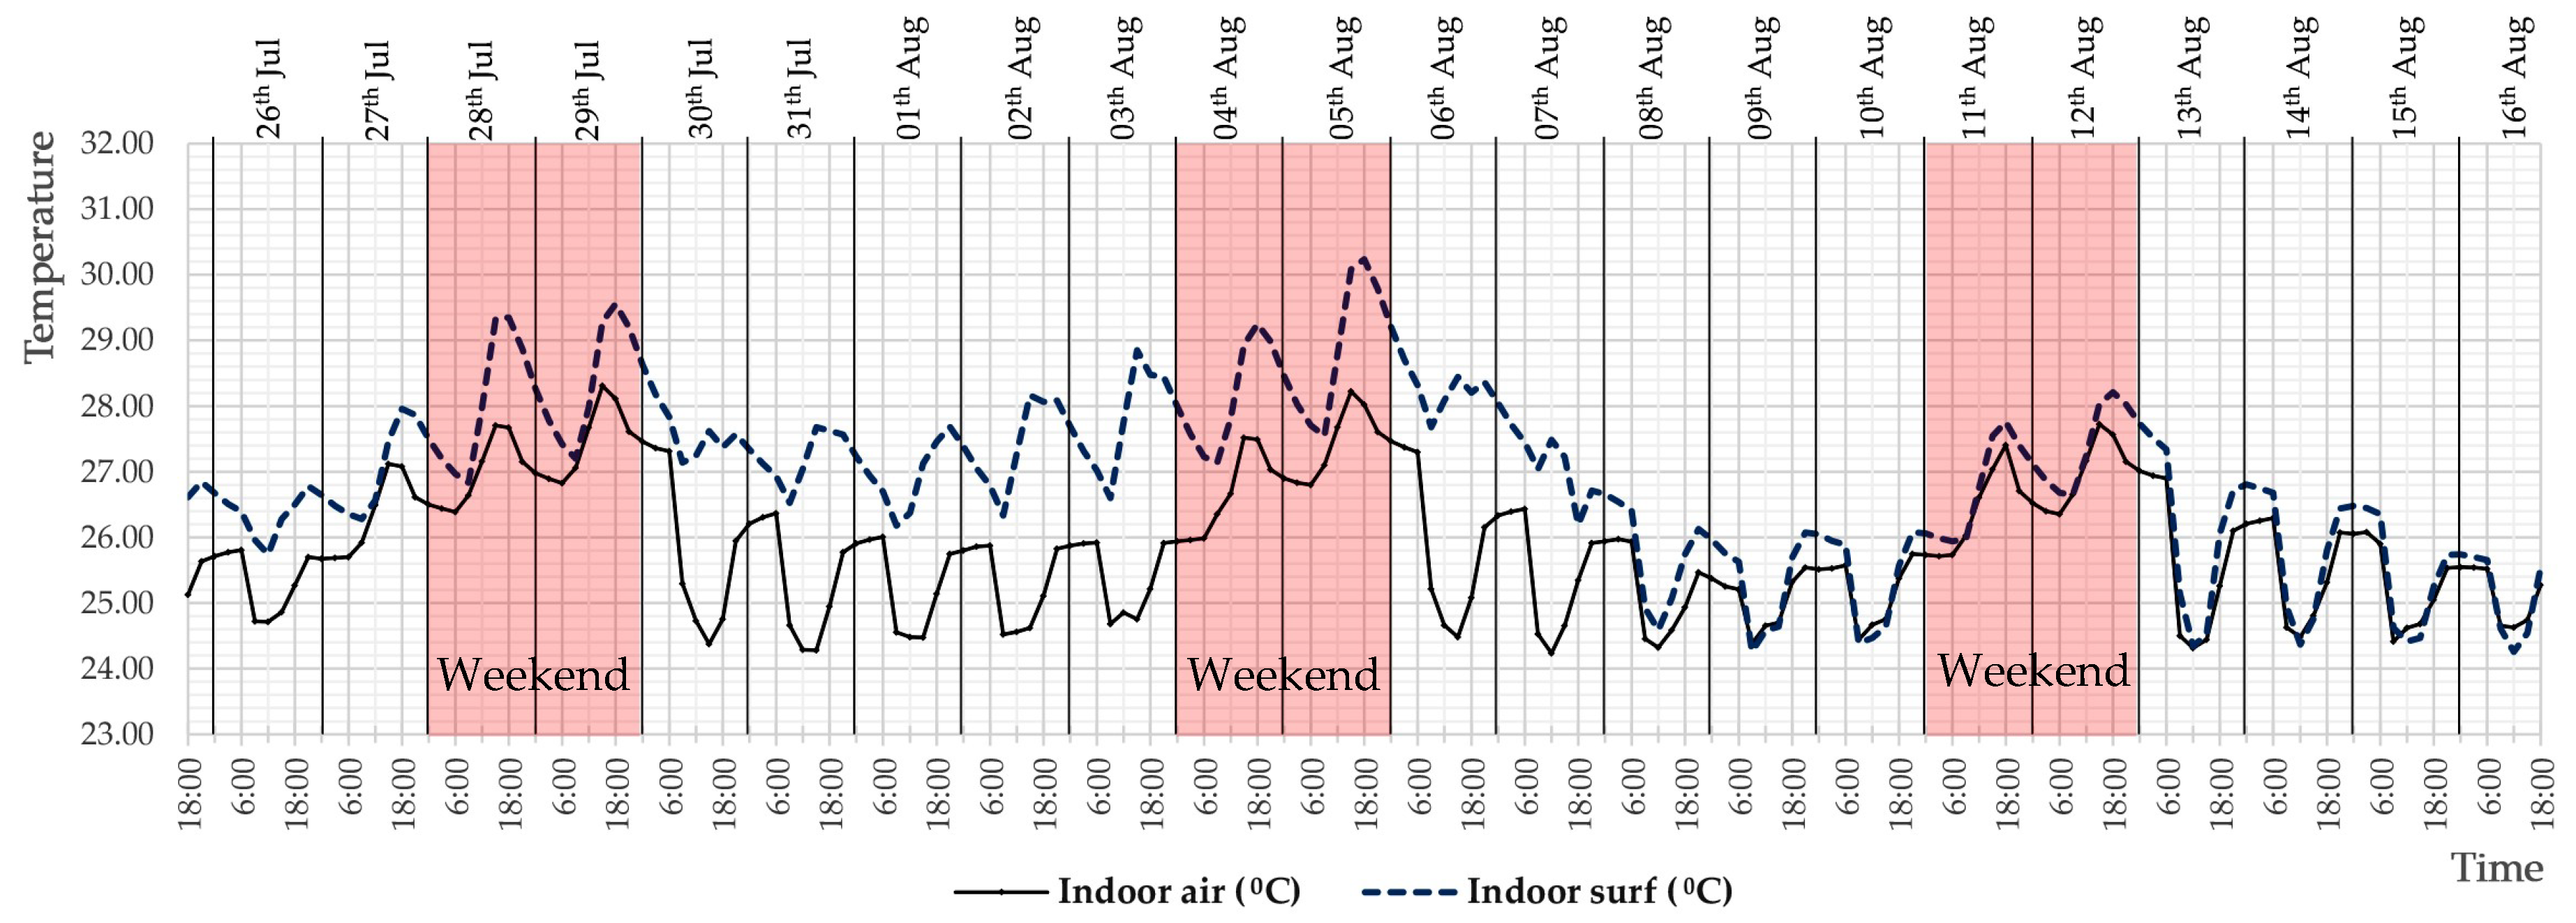
Wall surface temperature behavior was quantified during Phase III. Hourly values of internal wall surface temperatures of four exterior facades were averaged to a single wall surface value in hourly terms and then compared with corresponding indoor air. Results show a close interaction of indoor air with internal wall surface temperatures reflecting a heat stress impact from facades (
Figure 9 and
Figure 10). Despite air conditioning, internal wall surfaces reach higher values up to 28.5–29.5 °C until noon indicating heat gain from outside. Internal wall surface starts to drop after 3 pm when direct exposure of facades to outside radiation starts diminishing indicating a release of stored heat to indoors from walls. Heat sink capacity of thermal mass in the envelope was not observed. Indoor air and surface temperatures reach close to each other by early morning at ~6 am.
7. Conclusions—Generalized Findings
Results suggest a problem associated with shallow plan form buildings. Although the work is mainly focused on two specific buildings, they represent most of the thermophysical characteristics of the larger building population in Colombo. Inward heat transfer across the plan depth up to 16 m in Building “A” and 12 m in Building “B” from the façade is a critical problem that may be addressed through appropriate façade design. Findings suggest that presence of heat stress in terms of higher air temperature in air conditioned indoors along the length of the plan form is visible.
Elevation of indoor air temperature in air conditioned environments by 10.5 °C above the set point temperature is considered critical in respect to energy demand. The two buildings investigated fall within the following two extremes of thermal performance scenarios:
Air conditioned buildings with shallow plan forms may be able to maintain indoor air temperatures close to set point temperatures at 24 °C but at a very high energy cost.
Air conditioned buildings with shallow plan forms can maintain a building energy index of ~120 kWh/m2/a, but maintaining indoor air temperature close to set point temperature becomes problematic and sometime an elevation of indoor air temperature by even 10.5 °C above the set point temperature could be visible.
More research is underway to further strengthen these findings for a wider section of buildings in warm humid climates. The survey on plan form characteristics and orientation of a multi-level office building population in Colombo showed that nearly 80 per cent of buildings do not have appropriate orientation for solar defense. Their main building facades are facing either east or west orientations. A sound repositioning effort that focuses on minimizing environmental heat stress on building facades and thus exploring energy efficiency in multi-level commercial office building sector for the life of both exiting stock and new buildings is critical. This provides a level of opportunity for the building stakeholders to improve their asset values for the life of buildings and contribute to emission reduction targets.
While it is important to recognize that the results from the field investigations are not fully generalized due to limitations, the outcome on the heat stress behavior on conditioned office environments serves as a detailed comprehension for energy sustainability of office buildings. The better that architects and engineers understand the indoor thermal environment inside conditioned office buildings, the better design research will be able to link technological characteristics of envelope and plan form with energy consumption levels from heat stress on envelope towards a deeper comprehension of how best to reduce environmental heat stress on facades in the face of warming climates.
Author Contributions
U.R., Conceptualization, Methodology, Formal Analysis, Investigation, Draft Preparation, Final Writing, Project administration, U.R.
Funding
This research received a grant from National Research Council of Sri Lanka in order to purchase equipment. The grant number NRC/109/13.
Acknowledgments
The author acknowledges Grant No 109-13 of National Research Council of Sri Lanka for funding of equipment, as well as Indrika Rajapaksha and Waruni Jayasinghe for assisting the project administration; Ruksala Ishani, and Supun Rodrigo who have provided assistance in data collection.
Conflicts of Interest
The author declares no conflict of interest.
References
- IPCC. Contribution of Working Groups I, II and III to the Fifth Assessment Report of the Intergovernmental Panel on Climate Change. In Climate Change 2014: Synthesis Report; Core Writing Team, Pachauri, R.K., Meyer, L.A., Eds.; IPCC: Geneva, Switzerland, 2014. [Google Scholar]
- Seo, S.; Mendelsohn, R.; Munasinghe, M. Climate change and agriculture in Sri Lanka: A Ricardian valuation. Environ. Dev. Econ. 2005, 10, 581–596. [Google Scholar] [CrossRef]
- Garnaut., R. The Garnaut Climate Change Review; Final Report; The Cambridge University Press: Cambridge, UK, 2008; Available online: http://www.garnautreview.org.au (accessed on 12 November 2017).
- Coley, D.; Kershaw, T. Changes in internal temperatures within the built environment as a response to a climate change. In Building and Environment; Elsevier Science: Amsterdam, The Netherlands, 2010; Volume 45, pp. 89–93. [Google Scholar]
- Torcellini, P.; Pless, S.; Deru, M.; Crawley, D. Zero Energy Buildings: A Critical Look at the Definition; Conference Paper NREL/CP-550-39833; U.S. Department of Energy: Washington, DC, USA, June 2006.
- Guan, L. Preparation of future weather data to study the impact of climate change on buildings. Build. Environ. 2009, 44, 793–800. [Google Scholar] [CrossRef]
- Howden, S.M.; Crimp, S. Effect of Climate and Climate Change on Electricity Demand in Australia. In Proceedings of the Integrating Models for Natural Resources Management Across Discipline, Issue and Scales, Canberra, Australia, 10–13 December 2001; Ghassemi, F., Whetton, P., Little, R., Littleboy, M., Eds.; MSSANZ Inc.: Canberra, ACT, Australia, 2001; pp. 655–660. [Google Scholar]
- Lee, W.L.; Yik, F.W.H. Regulatory and voluntary approaches for enhancing building energy efficiency. Prog. Energy Combust. Sci. 2004, 30, 377–499. [Google Scholar] [CrossRef]
- GBCA (Green Building Council of Australia. The Value of Green Star—A Dacade of Environmental Benefits, May 2013. Available online: http://www.gbca.org.au (accessed on 22 January 2019).
- Hyde, R.; Rajapaksha, I.; Groenhout, N.; Barram, F.; Rajapaksha, U.; Shahriar, A.N.M.; Candido, C. Towards a methodology for retrofitting commercial buildings using bioclimatic principles. In Proceedings of the 43rd ANZAScA Conference, The University of Tasmania, Hobart, Australia, 25–27 November 2009; Available online: http://trove.nla.gov.au/version/170149721 (accessed on 20 January 2019).
- De Wilde, P.; Coley, D. The implications of a changing climate for buildings. Build. Environ. 2012, 55, 1–7. [Google Scholar] [CrossRef]
- Levin, M.D.; Price, L.; Martin, N. Mitigation options for carbon dioxide emissions from buildings. Energy Policy 1996, 24, 937–949. [Google Scholar] [CrossRef]
- Burton, S.; Sala, M. Energy Efficient Office Refurbishment; Earthscan: London, UK, 2001. [Google Scholar]
- Jenerette, G.D.; Harlan, S.L.; Brazel, A.; Jones, N.L.; Stefanov, W.L. Regional relationships between surface temperature, vegetation, and human settlement in a rapidly urbanizing ecosystem. Landsc. Ecol. 2007, 22, 353–365. [Google Scholar] [CrossRef]
- McEvoy, D. Climate change and cities. In Built Environment; Alexandrine Press: Marcham, UK, 2007; Volume 33, No. 01; pp. 5–9. [Google Scholar]
- Manjula, R.; Estoque, R.C.; Murayama, Y. An Urban Heat Island Study of the Colombo Metropolitan Area, Sri Lanka, Based on Landsat Data (1997–2017). ISPRS Int. J. Geo-Inf. 2017, 6, 189. [Google Scholar]
- SLSEA. Energy Consumption in Buildings, Website of Sri Lanka Sustainable Energy Authority. 2017. Available online: www.energy.gov.lk (accessed on 27 September 2018).
- Wijayatunga, P.D.C.; Fernando, W.J.L.S.; Shrestha, R.M. Greenhouse gas emission mitigation in the Sri Lanka power sector supply side and demand side options. Energy Convers. Manag. 2003, 44, 3247–3265. [Google Scholar] [CrossRef]
- De Dear, R. The Adaptive Model of Thermal Comfort: Macquarie University’s ASHRAE RP-884 Project. 2004. Available online: http://aws.mq.edu.au/rp-884/ashrae_rp884_home.html (accessed on 28 August 2018).
- Kwok Alison, G.; Rajkovich Nicholas, B. Addressing climate change in comfort standards. Build. Environ. 2010, 45, 18–22. [Google Scholar] [CrossRef]
- LaSalle. Commercial Buildings Going Green. 2004. Available online: www.joneslasalle (accessed on 20 November 2017).
- Olgyay, V. Design with Climate: Bioclimatic Approach to Architectural Regionalism; Princeton University Press: Princeton, NJ, USA, 1963. [Google Scholar]
- Hyde, R. Climate Responsive Design: A Study of Buildings in Moderate and Hot Humid Climates; E and FN Spon: London, UK, 2000. [Google Scholar]
- Hawkes, D. The theoretical basis of comfort in the selective control of environment. Energy Environ. 1982, 5, 127–134. [Google Scholar] [CrossRef]
- Guan, L. Implication of global warming on Air- Conditioned office buildings in Australia. Build Res. Inf. 2009, 37, 43–54. [Google Scholar] [CrossRef]
- Dascalaki, E.G.; Droutsa, K.; Gaglia, A.G.; Kontoyiannidis, S.; Balaras, C.A. Data collection and analysis of the building stock and its energy consumption. Energy Build. 2010, 42, 1231–1237. [Google Scholar] [CrossRef]
- Lomas, K.J. Architectural design of an advanced naturally ventilated building form. Energy Build. 2007, 39, 166–181. [Google Scholar] [CrossRef]
- Szokolay, S.V. An Introduction to Architectural Science: The Basis of Sustainable Design, 3rd ed.; Routledge, Taylor and Francis Group: New York, NY, USA, 2014. [Google Scholar]
- Peterkin, N. Rewards for passive solar design in the Building Code of Australia. Renew. Energy 2009, 34, 440–443. [Google Scholar] [CrossRef]
- Kabre, C. Trends in solar control in contemporary buildings. In Proceedings of the Thermal Performance and Comfort—ANzAScA 97 International Conference Session 2, The University of Queensland, Australia, 29 September–3 Octomber 1997; pp. 19–26. [Google Scholar]
- Haase, M.; da Silva, F.M.; Amato, A. Simulation of ventilated facades in hot and humid climates. Energy Build. 2009, 41, 361–373. [Google Scholar] [CrossRef]
- Eskin, N.; Turkmen, H. Analysis of annual heating and cooling energy requirements for office buildings in different climates in Turkey. Energy Build. 2008, 40, 763–773. [Google Scholar] [CrossRef]
- Napier, J. Climate Based Façade Design for Business Buildings with Examples from Central London. Buildings 2015, 5, 16–38. [Google Scholar] [CrossRef]
- Trubiano, F. Performance Based Envelopes: A Theory of Spatialized Skins and the Emergence of the Integrated Design Professional. Buildings 2013, 3, 689–712. [Google Scholar] [CrossRef]
- Parsons, K. Heat stress standards ISO 7243 and its global application. Ind. Health 2006, 44, 368–379. [Google Scholar] [CrossRef]
- Chowdhury, S.; Hamada, Y.; Ahmed, K.S. Prediction and comparison of monthly indoor heat stress (WBGT and PHS) for RMG production spaces in Dhaka, Bangladesh. Sustain. Cities Soc. 2017, 29, 41–57. [Google Scholar] [CrossRef]
- Lam, J.C. Energy analysis of commercial buildings in subtropical climates. Build. Environ. 2000, 35, 19–26. [Google Scholar] [CrossRef]
- Baker, N.V. Passive and Low Energy Building Design for Tropical Island Climates; Commonwealth Secretariate: London, UK, 1987. [Google Scholar]
- Feng, G.; Chi, D.; Xu, X.; Dou, B.; Sun, Y.; Fu, Y. Study on the Influence of Window-wall Ratio on the Energy Consumption of Nearly Zero Energy Buildings. Procedia Eng. 2017, 205, 730–737. Available online: www.sciencedirect.com (accessed on 18 November 2018). [CrossRef]
- McKeen, P.; Fung, A.S. The Effect of Building Aspect Ratio on Energy Efficiency: A Case Study for Multi-Unit Residential Buildings in Canada Philip. Buildings 2014, 4, 336–354. [Google Scholar] [CrossRef]
- Rajapaksha, I.; Rajapaksha, U. Criticality of Building Morphology on End Use Energy Demand: Evidence based assessment of urban office stock in Colombo Metropolitan Region. In Proceedings of the Symposium of Sri Lanka Sustainable Energy Authority, Colombo, Sri Lanka, 6–7 December 2017. [Google Scholar]
- Lee, W.V.; Steemers, K. Exposure duration in overheating assessment: A retrofit modeling study. Build. Res. Inf. 2017, 45, 6–12. [Google Scholar]
- Jayatilake, K.; Rajapaksha, U. Interactive architecture and contextual adaptability: Issues of energy sustainability in contemporary tall office buildings in Colombo. In Building the Future—Sustainable and Resilient Built Environments, Proceedings of 9th FARU International Research Conference, Colombo, Sri Lanka, 9–10 September 2016; Rajapaksha, U., Ed.; University of Moratuwa: Moratuwa, Sri Lanka, 2016; pp. 354–366. [Google Scholar]
- Yau, Y.H.; Hasbi, S. A review of climate change impacts on commercial buildings and their technical services in the tropics. Renew. Sustain. Energy Rev. 2013, 18, 430–441. [Google Scholar] [CrossRef]
- Goulding, J.R.; Lewis, J.O.; Steemers, T.C. (Eds.) Energy Conscious Design; BT. Batsford for the Commission of the European Communities: London, UK, 1992. [Google Scholar]
- UN DESA. 2018 Revision of World Urbanization Prospects; United Nations—Department of Economic and Social Affairs, Multimedia Library Publications, 16 May 2018. Population Division of UN. Available online: www.un.org (accessed on 20 January 2018).
- UNFPA. UNFPA Report on ‘State of the World’s Population 2007; UNFPA: New York, NY, USA, 2007. [Google Scholar]
- Ukkwatta, N.L.; Dayawansa, N.D.K. Urban Heat Islands and the Energy Deamn: An Analysis for Colombo City of Sri Lanka Using Thermal Remote sensing data. Soc. Soc. Manag. 2012, 1, 124–131. [Google Scholar]
- Mortimer, N.D.; Ashley, A.; Elsayed, M.; Kelly, M.D.; Rix, J.H.R. Developing a database of energy use in the UK non-domestic building stock. Energy Policy 1999, 27, 451–468. [Google Scholar] [CrossRef]
- Choudhary, R.; Tiran, W. Influence of district features on energy consumption in non-domestic buildings. Build. Res. Inf. 2014, 42, 32–46. [Google Scholar] [CrossRef]
- Depecker, P.; Menezo, C.; Virgone, J.; Lepers, S. Design of building shapes and energetic consumption. Build. Environ. 2001, 36, 627–635. [Google Scholar] [CrossRef]
- Catalina, T.; Virgone, J.; Iordach, V. Study on the impact of building form on the energy consumption. In Proceedings of the Building Simulation, 12th Conference of International Building Performance Simulation Association, Sydney, Australia, 14–16 November 2011; pp. 1726–1729. [Google Scholar]
- Tsikaloudaki, K.; Laskos, K.; Bikas, D. On the establishment of climatic zones in Europe with reagrd to the energy performance of buildings. Energies 2012, 5, 32–44. [Google Scholar] [CrossRef]
- Wijayatunga, P.; Attalage, R. Analysis of rural households energy supplies in Sri Lanka: Energy efficiency, fuel switching and barriers to expansion. Energy Convers. Manag. 2003, 44, 1123–1130. [Google Scholar] [CrossRef]
- Ratnaweera, C.; Hestnes, A.G. Enhanced cooling in typical Srilankan dwellings. Energy Build. 1996, 23, 183–190. [Google Scholar] [CrossRef]
- ECG19. Energy Consumption Guide: Energy Use in Offices. 2003. Available online: http:www.cibse.org (accessed on 9 September 2018).
Figure 1.
(a) Sri Lanka in the world map. It is situated between 9°49’N and 5°55’N of Equator. (b) Sri Lanka.
Figure 1.
(a) Sri Lanka in the world map. It is situated between 9°49’N and 5°55’N of Equator. (b) Sri Lanka.
Figure 2.
Psychrometric chart for Colombo developed from Climate Consultant 5.5 during the study.
Figure 2.
Psychrometric chart for Colombo developed from Climate Consultant 5.5 during the study.
Figure 3.
Map of Colombo Metropolitan Region showing (a) dispersion of the office building stock and (b) an inner city center with buildings with higher Building Energy Indices (BEIs).
Figure 3.
Map of Colombo Metropolitan Region showing (a) dispersion of the office building stock and (b) an inner city center with buildings with higher Building Energy Indices (BEIs).
Figure 4.
Building energy indices of 87 buildings.
Figure 4.
Building energy indices of 87 buildings.
Figure 5.
Multizone air temperature behavior in this air conditioned Building “B”- move between 31.5 and 34.7 °C despite set point temperature at 24 °C; BEI is around 120 k/Whm2/a, but high risk of heat gain is visible.
Figure 5.
Multizone air temperature behavior in this air conditioned Building “B”- move between 31.5 and 34.7 °C despite set point temperature at 24 °C; BEI is around 120 k/Whm2/a, but high risk of heat gain is visible.
Figure 6.
Multizone air temperature behavior of this air conditioned Building “A” moves just 1.1 °C above set point temperature of 24 °C but at a very high energy cost of nearly 340 kWh/m2/a.
Figure 6.
Multizone air temperature behavior of this air conditioned Building “A” moves just 1.1 °C above set point temperature of 24 °C but at a very high energy cost of nearly 340 kWh/m2/a.
Figure 7.
Building “B”: Hourly severe heat stress behavior in terms of air temperature on the 8th floor over a period of 20 days in July–August 2018; indoor air moved well above set point temperature.
Figure 7.
Building “B”: Hourly severe heat stress behavior in terms of air temperature on the 8th floor over a period of 20 days in July–August 2018; indoor air moved well above set point temperature.
Figure 8.
Building “A”: Hourly moderate heat stress behavior in terms of air temperature in the 8th floor over a period of 20 days in July–August 2018. Indoor air moved closer to set point but at a much higher energy cost of BEI.
Figure 8.
Building “A”: Hourly moderate heat stress behavior in terms of air temperature in the 8th floor over a period of 20 days in July–August 2018. Indoor air moved closer to set point but at a much higher energy cost of BEI.
Figure 9.
Wall surface and indoor air temperature behavior in Building “B”.
Figure 9.
Wall surface and indoor air temperature behavior in Building “B”.
Figure 10.
Wall surface and indoor air temperature behavior in Building “A”.
Figure 10.
Wall surface and indoor air temperature behavior in Building “A”.
Table 1.
Percentage distribution of three ranges of BEIs of the building stock.
Table 1.
Percentage distribution of three ranges of BEIs of the building stock.
| Levels of BEI Ranges | Values of BEI Ranges | Percentage Distribution |
|---|
| Lower Range (LR) | 100–150 kWh/m² per annum | 35.72% |
| Average Range (Av.R) | 150–250 kWh/m² per annum | 54.08% |
| Critical Range (CR) | Above 250 kWh/m² per annum | 10.20% |
Table 2.
Common plan form classification of the building stock in Colombo—linear and shallow plan forms are more common in the stock.
Table 3.
Fenestration details of road facing façades and percentage distribution within the stock.
Table 4.
Prevalent orientations of front façade facing the road and mean building energy index (BEI).
Table 4.
Prevalent orientations of front façade facing the road and mean building energy index (BEI).
| Façade Orientation | Percentage Distribution | Mean BEI kWh/m2/a |
|---|
| East–west | 41.4% | 211.6 |
| North–south | 13.8% | 200.2 |
| Northeast–Southwest | 25.6% | 200.1 |
| Northwest–Southeast | 19.2% | 205.7 |
Table 5.
Summative results of the analysis showing a nexus between BEIs, window-to-wall ratios (WWRs), and orientations.
Table 6.
Summative results of the nexus between aspect ratios, BEIs, WWRs, and orientations of buildings on the North–South and East–West axes.
Table 6.
Summative results of the nexus between aspect ratios, BEIs, WWRs, and orientations of buildings on the North–South and East–West axes.
| Orientation and Plan Form | WWR and Aspect Ratio in Three BEI ranges in East and West Orientations |
|---|
 | Lower Range
100–150 kWh/m2/a | Average Range
150–250 kWh/m2/a | Critical Range
Above 250 kWh/m2/a |
| WWR Glazing exposure | WWR Glazing exposure | WWR Glazing exposure |
| E | W | N | S | E | W | N | S | E | W | N | S |
| 0.36 | 0.49 | 0.11 | 0.08 | 0.76 | 0.63 | 0.13 | 0.02 | 0.81 | 0.63 | 0.14 | 0.06 |
Aspect Ratio along NS axis
(Length/width) 0.70 | Aspect Ratio along NS
(Length/width) 0.30 | Aspect Ratio along NS
(Length/width) 0.26 |
| Average no of floors 5 | Average no of floors 6 | Average no of floors 6 |
Average BEI
133.45 kWh/m2/a | Average BEI
204.29 kWh/m2/a | Average BEI
272.34 kWh/m2/a |
| WWR and Aspect Ratio in three BEI ranges in North and South orientations |
| WWR Glazing exposure | WWR Glazing exposure | WWR Glazing exposure |
| E | W | N | S | E | W | N | S | E | W | N | S |
| 0.03 | 0.18 | 0.32 | 0.53 | 0.42 | 0.47 | 0.20 | 0.34 | 0.76 | 0.68 | 0.91 | 0.64 |
Aspect Ratio along EW axis
(Length/width) 1.49 | Aspect Ratio along EW axis
(Length/width) 3.22 | Aspect Ratio along EW axis
(Length/width) 4.4 |
| Average no of floors 5 | Average no of floors 6 | Average no of floors 6 |
Average BEI
122.71 kWh/m2/a | Average BEI
170.94 kWh/m2/a | Average BEI
202.31 kWh/m2/a |
Table 7.
Plan form and physical characteristics of two investigated buildings in Phase II and I.
Table 7.
Plan form and physical characteristics of two investigated buildings in Phase II and I.
| Building “B”—Shallow Plan Form | Building “A”—Shallow Plan Form |
 |  |
| Common thermal performance characteristics of both buildings are listed below |
| Orientation: longer axis along east–west facing north and south with nearly 60% glass on north |
| Set point temperature: 24 °C degrees during office hours from 08.00 am to 18.00 pm |
| Occupant population 6 persons/20 m2 approximately—occupancy increases with visitors in the morning |
| Wall and slab construction—cement and lime plastered brick and concrete |
| Average U-value of external envelope: 0.22 W/m2 K |
| Front façade is facing east with glazing properties of 5.0 w/m2/k |
| Solid to void ratio is nearly 40:60—fully packed floor plates with no voids between floors |
| Occupied hours: 8 am to 6 pm on weekdays (weekends nonfunctional and A/C is off) |
| Lifts and service spaces are on the south orientation on floors |
© 2019 by the author. Licensee MDPI, Basel, Switzerland. This article is an open access article distributed under the terms and conditions of the Creative Commons Attribution (CC BY) license (http://creativecommons.org/licenses/by/4.0/).


