Abstract
The article presents a comparative analysis carried out using three methods, determining the heat transfer coefficient U for a ceramic product modified with a phase change material (PCM). The purpose of the article is to determine the convergence of the resulting thermal characteristics, obtained using the experimental method, numerical simulation, and standard calculation method according to the requirements of PN-EN ISO 6946. The heat transfer coefficient is one of the basic parameters characterizing the thermal insulation of a building partition. Most often, for the thermal characteristics of the partition, we obtain from the manufacturer the value of the thermal conductivity coefficient λ for individual homogeneous materials or the heat transfer coefficient U for the finished (prefabricated) partition. In the case of a designed composite element modified with a phase change material or other material, it is not possible to obtain direct information on the above parameter. In such a case, one of the methods presented in this article should be used to determine the U factor. The U factor in all analyses was determined in stationary conditions. Research has shown a significant convergence of the resulting value of the heat transfer coefficient obtained by the assumed methods. Thanks to obtaining similar values, it is possible to continue tests of thermal characteristics of partitions by means of numerical simulation, limiting the number of experimental tests (due to the longer test time required) in assumed different partition configurations, in stationary and dynamic conditions.
1. Introduction
Increasing energy consumption around the world associated with the development of civilization and the simultaneous depletion of conventional energy sources is leading to technological solutions being carried out in many countries that reduce energy consumption in various sectors, including construction. Currently, scientific research is carried out in numerous research centers around the world to obtain material and technological solutions that enable ensuring adequate thermal comfort in rooms during periods of low or high outside air temperatures. At the same time, solutions are being sought associated with the possibility of using energy from renewable sources, and in the case of building partitions, thermal energy from the conversion of solar energy. To improve thermal comfort in the rooms of buildings, phase change material is increasingly used, which, thanks to the heat storage capabilities, reduces temperature fluctuations on the interior surface of the partition. This material is utilized through its application in passive or active systems to reduce the energy consumption needed to cool or heat rooms in a building. Phase change material (PCM) is used in passive systems by placing it in various building components. The purpose of this solution is to accumulate thermal energy from various sources, and then utilizing this energy in the direction of lower temperatures. Wall partitions are most often used regardless of the structural design of the building, but it is also placed in floors [1] and in roof elements [2,3]. The method of applying the phase change material depends on the type of PCM and its location. In concrete elements, it is most often used in microcapsule form. PCM is added to the concrete mix, from which concrete wall elements are prepared [4,5] and the samples were used to determine the thermal characteristics of composites [6]. The article [6] characterized the heat flow through the tested samples with various amounts of PCM in the sample and heat capacity, using various experimental and computational methods. The same authors in article [7] determined the thermophysical properties of PCM-concrete brick, proposing a new method for determining the thermal conductivity and specific heat of the tested composite.
Ceramic components are among the construction products that use phase change material. One of the methods of modification of these elements is the filling of existing gaps in finished masonry with phase change material [8,9,10]. Another method is a separate PCM layer, located on the inside or outside of the ceramic partition [11,12] or between the partition layers [13]. Research is also carried out on the modification of phase change material for products used as indoor interior cladding [14,15,16]. The purpose of this modification is to absorb excess heat energy inside the room, originating, inter alia, from solar radiation energy passing through significant glazed surfaces of the building or the operation of devices inside the room. Regardless of the location of the PCM and the partition structure in which the phase change material was used, research confirms the beneficial effect of this material on the stabilization of temperatures on the internal surface of the partition, in the period of significant temperature fluctuations and overheating of rooms.
When designing modified elements or multilayer building partitions, there is a problem with the characteristics of the basic thermal parameters for these composites. For prefabricated elements prepared by the manufacturer, we most often obtain basic physical and mechanical properties (parameters). While the element or partition is composed of various materials, obtaining thermal parameters requires the use of available research methods: experimental, computational or computer simulations. In many research centers, research is carried out using single methods or using several methods simultaneously and comparing them with each other. Using the experimental method, tests can be carried out for a single building component or a modified multilayer building partition. These tests are carried out in laboratory conditions [17,18,19] or in (outdoor) field conditions, using natural climatic conditions [20,21,22,23]. In the article [17], the authors conducted tests on a PCM modified wall in a laboratory chamber in order to determine the influence of temperatures on the effective thermal conductivity of this partition. These tests were carried out in a steady state and a good relationship between thermal conductivity and rising temperature was demonstrated. In the remaining articles [18,19], thermal parameters of building components were also characterized. To analyze the results of laboratory tests, available statistical programs can also be used [24,25]. Thanks to such research, more information about the physical and mechanical parameters of newly designed composites or modified building partitions can be obtained.
In the case of tests carried out in external conditions, a longer period of time is required in order to determine the influence of external factors on the analyzed partition. Computer methods (numerical simulations or computational methods) are also used for the thermal characteristics of building elements or partitions [26,27,28]. In this case, the most commonly known parameters characterizing a given material and real values determining local climatic conditions are used for the analysis. A large number of articles [8,9,29,30,31] present the results of the designed elements, obtained on the basis of two research methods: experimental and computer simulation. By comparing the two methods, it is possible to verify experimental results with theoretical results. If similar values of the above methods are obtained, it is possible to continue the theoretical analysis of other solutions of a given problem, with a limited number of experimental tests. Therefore, an important research issue in the characteristics of modified components or building partitions is comparative analysis with available research methods.
2. Materials and Methods
2.1. Materials
Ceramic elements measuring 248 × 262 × 249 mm were used in the tests. The block has four rows of slots with dimensions of 38.5 × 123.0 mm and 38.5 × 92.5 mm. These slots were filled with RT25HC phase change material in selected rows of the ceramic element. The phase change material used in the tests was closed in tight polyethylene covers (bags) in order to protect it against outflow during the phase transformation of the material (Figure 1). The remaining slots were filled with brick dust.
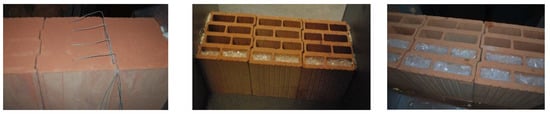
Figure 1.
Modified ceramic airbricks without and with one row and two rows of gaps with phase change material.
Three variants of ceramic element modification were adopted:
- -
- variant I (V1)—no PCM, all slots filled with brick dust;
- -
- variant II (V2)—one row of slots filled with PCM, located on the outside air side, and the other slots filled with brick dust;
- -
- variant II (V3)—two rows of slots filled with PCM, located on the outside air side, and the other slots filled with brick dust;
The above PCM layer system was assumed due to the continuation of research using a modified masonry element in collector and accumulation walls. The location of the phase change material from the outside will also allow the use of solar radiation energy in the tested partitions. At the same time, filling with brick dust will increase the accumulation of thermal energy obtained from solar radiation and will allow a better flow of thermal energy toward the indoor air.
Table 1 below presents selected parameters characterizing individual elements of the ceramic composite.

Table 1.
Selected parameters characterizing individual elements of the ceramic composite.
The parameters characterizing brick dust presented in Table 1 were made by the authors in the laboratory of the Rzeszów University of Technology.
2.2. Methods
Three methods were used to determine the heat transfer coefficient U:
- Experimental method (EM), in which the tests were carried out in a laboratory test chamber;
- Standardized calculation method (SCM), in which a spreadsheet was used to calculate the building component;
- Numerical simulation method (NSM), in which the ADINA computer program was used for thermal characteristics.
- In each of the above methods, the heat transfer coefficient U was determined for three variants V1, V2, and V3.
2.2.1. Experimental Method
Experimental tests were carried out in a laboratory test chamber. The chamber consists of two smaller chambers: a warm and a cold part each with dimensions of 2.40 × 2.60 × 2.50 m. Between the chambers there is a cassette, in which individual test compartments have been placed (Figure 2). The tests were carried out in steady conditions. In the warm chamber, a constant temperature of 20 °C was adopted, while in the cold chamber, a constant temperature of 0 °C was maintained.
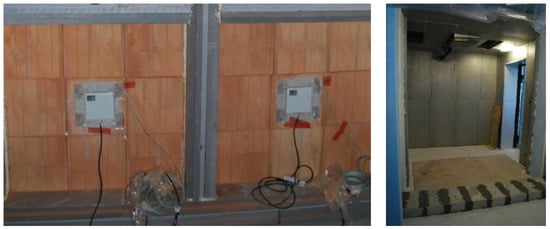
Figure 2.
View of the partitions made of modified ceramic elements and the interior of the cold chamber—the preparatory stage.
Temperature sensors and a heat density flow sensor are placed in each test partition, according to the diagram in Figure 3. Heat fluxes were measured on the internal surface with the FQAD18T digital sensors.
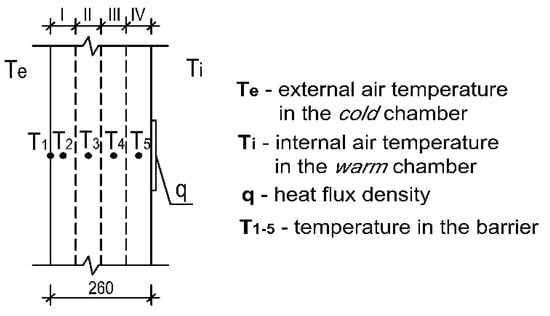
Figure 3.
Diagram of the partition with temperature and heat flux density sensors.
The sensors being part of the measuring apparatus and used for the research method are CE-certified and were calibrated in relation to the testing equipment. The data logger automatically recognized which sensor had been connected and then the appropriate measuring range was selected and appropriate units assigned. The sensor itself was connected to the tested smoothed surface with a layer of thermal grease, which ensured the continuity of heat flow. Disturbances of the measured stream value resulting from the influence of boundary restrictions and other external factors were minimized by:
- temperature stabilization in the chambers (warm and cold),
- placing the heat flow sensor in the central part of the tested surface,
- using a perforated metal curtain, whose task was to limit the forced air movement in the chambers (warm and cold).
After stabilizing the temperature in the modified partitions, measurements of temperature and heat flux density values began, with data being recorded for every 5 minutes over a period of three days. To determine the heat transfer coefficient U for individually tested partitions, the values of heat flux density measured on the ceramic surface from the side of the heat chamber were used. Temperature values inside the partition served as a control for temperature stabilization during heat flow through the partition. However, the temperature values measured on the surface of the partition were used to determine the thermal resistance of the component (Rλ). In future considerations, obtained in the framework of this study, the temperature values inside the partition will be used to analyze temperature distributions during dynamic phase transitions in PCM.
The recorded data for each wall variant are compiled separately in the Statistica program sheet. The trend estimation using a moving average was made using the module available in the Statistica program → Advanced Linear and Non-Linear Models → Time Series and Forecasting → Time Series Analysis. After obtaining the final results determining the value of the heat flux density for the tested partitions, the final heat transfer coefficient U was determined for the PCM modified ceramic components.
2.2.2. Standard Calculation Method
The heat transfer coefficient of the building component U (W/m2K) is calculated according to the formula:
The total thermal resistance, RT, of a flat building component consisting of thermally homogeneous layers perpendicular to the heat flux is calculated according to the formula:
where:
- Rsi—heat transfer resistance on the inner surface;
- R1, R2, …, Rn—calculated thermal resistance of each layer;
- Rse—calculated thermal resistance of each layer.
For calculating the thermal resistance of a hollow brick, a method of calculating the thermal resistance of building components consisting of homogeneous and thermally heterogeneous layers taken from PN-EN ISO 6946: 2008 [32] was used. This method can be used if the ratio of the upper limit of thermal resistance to its lower limit does not exceed 1.5. The maximum relative error e, calculated as a percentage using this method is:
The total thermal resistance of the component, RT, consisting of thermally homogeneous and heterogeneous layers parallel to the heat input surface, is calculated as the arithmetic mean of the upper and lower thermal resistance limits according to the formula:
where:
- —upper limit of total thermal resistance;
- —lower limit of total thermal resistance.
The upper and lower limits were calculated by dividing the component into m-slices (from “a” to “g”) and j-layers (from “1” to “9”) in such a way that it was divided into “m*j” parts (7*9 = 63 parts), thermally homogeneous.
For this purpose, the plane of the building component was determined as the surface on which the heat flux flows perpendicularly. Cuts were made perpendicular and parallel to the plane of the component in all places where there was a change of material, obtaining slices (sections) and layers, respectively. The analyzed component (hollow block) cut into slices and layers is shown in Figure 4.
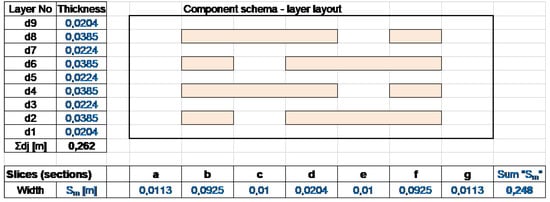
Figure 4.
Layout diagram of the ceramic component layer filled with phase change material and brick dust.
Slices (sections) “m” (m = a, b, c, d, e, f, g) perpendicular to the plane of the component have widths Sm and relative surface areas fm.
Layers “j” (j = 1, 2, 3, …, 9) parallel to the plane of the component are dj thick.
The “mj” part has the thermal conductivity coefficient λmj, thickness dj, width Sm, relative surface area fm, and thermal resistance Rmj.
The component width S is the sum of the slice widths and is:
The length (height) of the component L results from the height of the slotted hollow block: .
The total surface area of the component is equal to:
However, the surface areas of the slices were calculated according to the formula:
The relative surface areas of the slices are proportional to the total surface area of the component, calculated as:
The sum of the relative areas of the slices is:
The upper limit of the total thermal resistance () was calculated according to the formula:
where:
- RTa, RTb, …, RTg—total thermal resistance of subsequent sections;
- fa, fb, …, fg—relative areas of successive slices.
Lower limit of the total thermal resistance ()
The bottom limit of the total thermal resistance is determined assuming that all surfaces parallel to the component surface are isothermal.
The equivalent thermal resistance Rj for each thermally heterogeneous layer was calculated from the formula:
The bottom limit of the total thermal resistance was determined from the formula:
So, if we know the total thermal resistance, RT, of a flat building component, we can calculate its thermal resistance and then the equivalent thermal conductivity coefficient λequivalent of the component according to the formula:
The thermal resistance of the component, ΣR, from surface to surface (component’s thermal conductivity) is calculated without the heat transfer resistance according to the formula:
where:
- Σdj—sum of layer thicknesses (total thickness of the building component).
2.2.3. Numerical Simulation Method
As part of the numerical simulation, an analysis of the composite partition structure was performed using the finite element method (FEM). ADINA software was used to prepare the numerical model. The ADINA CFD module is dedicated to conducting numerical simulations of heat flow processes through elements of a complex structure. This module was used to analyze heat flow and determine the temperature distribution in the structure of the analyzed element. Material characteristics were adopted according to Table 1. The cross-sectional geometry was adopted according to Figure 5.
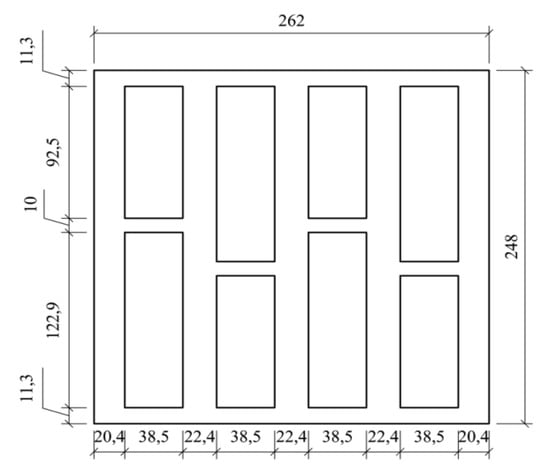
Figure 5.
Cross-sectional geometry of the composite element under study.
A three-dimensional model was used to build the structure of the tested component. One structure geometry was built for three calculation variants V1 (Figure 6a), V2 (Figure 6b), and V3 (Figure 6c). Individual computational cases were varied due to filling the slots of the ceramic block and the created models were discretized (Figure 6).
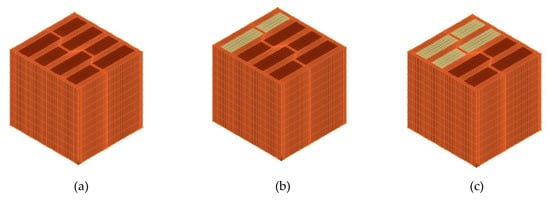
Figure 6.
View of the model after discretization—(a) option 1; (b) option 2; (c) option 3.
Stationary conditions were assumed for each of the three model variants created. An outside air temperature of 0 °C and an indoor air temperature of 20 °C were adopted. Boundary conditions resulting from the assumed air temperature on both sides were determined. Using the Special Boundary Condition (SBC) function, radiation and convection conditions were defined on the outer and inner surface of the partition. For each variant, calculations were made for two values of the emissivity of the ceramic body: 0.85 and 0.95. In order to stabilize the results, calculations were made for a time interval of 360,000 s (100 h).
The results were analyzed for the obtained values of the heat flux density flowing through the tested element. The distribution of values obtained for the entire model was exported to a spreadsheet. On this basis, the average value of the heat flux on the internal surface of the component was determined. To determine the average value, the results gathered from 616 nodes located on the inner surface were used.
In the analysis presented, the phase change material (PCM) was in the low temperature zone (on the outside of the partition) due to the stationary nature of the temperature load and therefore did not undergo any phase change. However, in the simulation model, the material was modeled as phase change; solidification and melting point as well as latent heat value were given in the material parameters. The numerical model took into consideration the process of dynamic loading; therefore, in the case of the temperature being above the melting point, the phase change along with absorbing the energy needed to liquefy PCM would occur in the structure of the phase change material. Similarly, during PCM solidification, the model takes into account the heat emission by this material.
3. Results and Discussion
After obtaining results from experimental research, computational calculation and computer simulation, the selected thermal parameters for the ceramic component were calculated in the assumed variants. Then, the thermal resistance values of the Rλ component and the heat transfer coefficient U were compared from three methods and for variants V1, V2, and V3.
3.1. Experimental Method
After testing in the laboratory chamber for the assumed three variants of partitions modified with phase change material, an analysis of the results in the Statistica program was carried out in the module: Advanced Linear and Non-Linear Models → Time Series and Forecasting → Time Series Analysis.
From the data obtained, the resulting series was converted (smoothed) to a straight (unweighted) 12-point moving average. Then, the trend was estimated by an analytical method by selecting the “Line Graphs” (Variables) option in the Statistica program. The resulting charts of the transformed series together with the formulas of linear functions for all variants are presented in Figure 7.
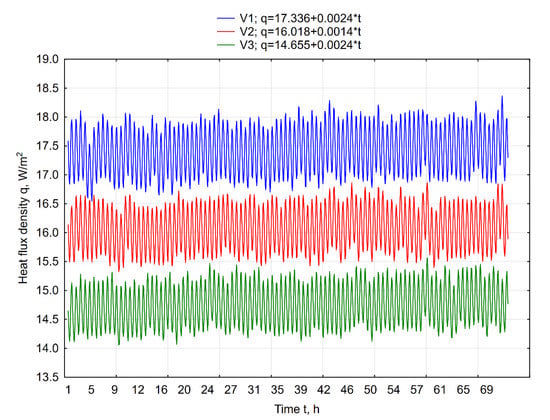
Figure 7.
Charts of transformed time series for three partition variants.
The steady trend observed for all variants allows the use of average values of heat flux for the calculation in the method analyzed. The average values of the parameter (before and after conversion of the series) along with the standard deviation and the number of observations are summarized in Table 2.
Table 2.
Descriptive statistics for three partition variants before and after transformation of the series.
The obtained values of heat flux density q before and after transformation of the series are characterized by similar values for all variants. For calculating the thermal resistance of the Rλ component and the equilibrium thermal conductivity coefficient λ, the average values of temperatures recorded on the partition surface from the warm and cold chambers’ sides were adopted. These values show smaller temperature fluctuations than the air temperatures measured in the chambers (impact of refrigeration and heating devices in the chambers). The value of the temperature difference on the partition surfaces and the final results for both parameters are presented in Table 3.
Table 3.
Thermal parameters of the ceramic composite in the experimental method (EM).
3.2. Standard Calculation Method
Table 4 presents the thermal parameters of the ceramic composite characterizing individual variants.
Table 4.
Thermal parameters of the ceramic composite in the standardized calculation method (SCM).
The thermal parameters of the ceramic composite presented in Table 2 were calculated using a calculation program.
3.3. Numerical Simulation Method
As a result of the simulation calculations carried out, the distribution of the temperature field in the model and the value of heat flux flowing through the considered element were obtained for three assumed variants. The results regarding the heat flux in graphic form are presented in Figure 8. In order to correctly assess the obtained results, a uniform range of results in graphic form was adopted for all variants (Figure 8d).
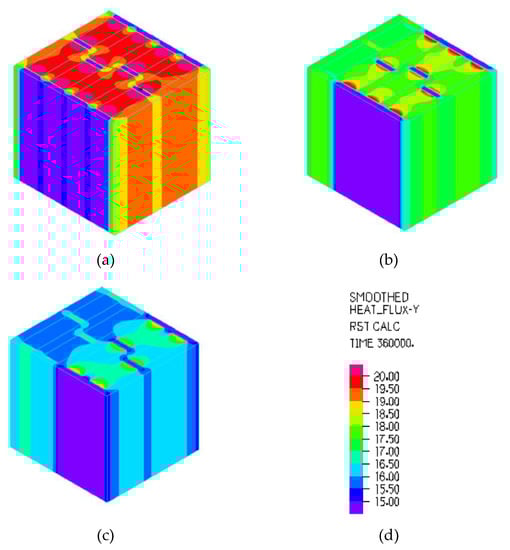
Figure 8.
Density of the heat flow flowing through the component for the assumed emission factor = 0.85. (a) variant 1, (b) variant 2, (c) variant 3, and (d) range of results in graphic form.
The results obtained from the calculations in numerical form were exported to a spreadsheet. On the basis of averaging the results obtained on the internal surface in 616 nodes (Figure 9), the average value of heat flux density q passing through this surface was determined.
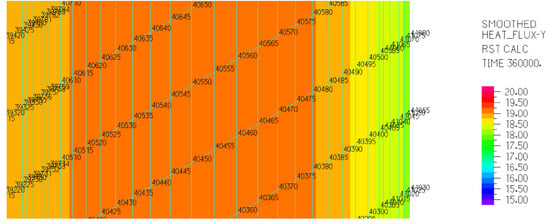
Figure 9.
View of the nodes on the inner surface of the element.
On its basis, the average value of the total thermal resistance of the element was determined according to the formula (12):
and the average value of the heat transfer coefficient U according to formula (1). The results for three material variants (V1, V2, and V3) and two variants of the emission factor for ceramic bodies (0.85 and 0.95) are presented in Table 5.
Table 5.
Results obtained by the numerical simulation method (NSM).
3.4. Thermal Parameters of the Building Component Determined by Three Methods
Assuming the values of heat transfer resistance on the inner surface Rsi and heat transfer resistance on the outer surface Rse, in accordance with the standard [32], the total thermal resistance RT and the heat transfer coefficient U for all methods and variants were determined and compared. The values are summarized in Table 6.
Table 6.
Thermal parameters of the ceramic composite in all methods.
Based on the results obtained, the maximum relative error e was determined for the thermal resistance RT and heat transfer coefficient U according to the following formulas:
The results are shown in Table 7.
Table 7.
Maximum and minimum values obtained with three methods and relative errors resulting from these values.
4. Conclusions
The results obtained show that the application of each of the three methods presented gives results convergent with the other methods. The differences in the value of thermal resistance and heat transfer coefficient for the analyzed component determined by three methods do not exceed 2%, which indicates a high convergence of results. This is the basis for the following conclusions:
- The calculations carried out indicate that the use of one of the three proposed methods for determining the thermal resistance of complex building structures allows obtaining results with an accuracy not exceeding the measurement errors of standard devices used to determine this value (5–6%).
- The standard method and numerical simulations can be used as part of checking the correctness of experimental tests.
- The convergence of the results obtained indicates the possibility of practical replacement of long-term experimental tests with simulation methods, which can be used to select the correct structural solutions from a group of many conceptual solutions.
- The use of the standard method or numerical simulation to determine the thermal parameters of complex building partitions allows cost reduction with respect to conducting experimental tests.
- The presented methods may be applied to other composite materials. However, the assessment of their effectiveness would require further experiments.
Author Contributions
Conceptualization, J.K., P.M., and A.S.; methodology, B.D., J.K., P.M., and A.S.; software, J.K., B.D., P.M., and A.S.; validation, B.D., J.K., P.M., A.S., and L.L.; formal analysis, J.K., P.M., and A.S.; investigation, J.K., P.M., and A.S.; resources, J.K., P.M., and A.S.; data curation, J.K., P.M., and A.S.; Writing—Original draft preparation, J.K., P.M., and A.S.; writing—review and editing, L.L.; visualization, J.K., P.M., A.S., and B.D.; supervision, L.L.; project administration, L.L.; funding acquisition, L.L.
Funding
This research received no external funding
Conflicts of Interest
The authors declare no conflict of interest. The funders had no role in the design of the study; in the collection, analyses, or interpretation of data; in the writing of the manuscript, or in the decision to publish the results.
References
- Entrop, A.G.; Brouwers, H.J.H.; Reinders, A.H.M.E. Experimental research on the use of micro-encapsulated Phase Change Materials to store solar energy in concrete floors and to save energy in Dutch houses. Sol. Energy 2011, 85, 1007–1020. [Google Scholar] [CrossRef]
- Alawadhi, E.M.; Hashem, J.A. Building roof with conical holes containing PCM to reduce the cooling load: Numerical study. Energy Convers. Manag. 2011, 52, 2958–2964. [Google Scholar] [CrossRef]
- Elarga, H.; Fantucci, S.; Serra, V.; Zecchin, R.; Benini, E. Experimental and numerical analyses on thermal performance of different typologies of PCMs integrated in the roof space. Energy Build. 2017, 150, 546–557. [Google Scholar] [CrossRef]
- Cabeza, L.F.; Castellon, C.; Nogues, M.; Medrano, M.; Leppers, R.; Zubillaga, O. Use of microencapsulated PCM in concrete walls for energy savings. Energy Build. 2007, 39, 113–119. [Google Scholar] [CrossRef]
- Wang, X.; Yu, H.; Li, L.; Zhao, M. Experimental assessment on the use of phase change materials (PCMs)-bricks in the exterior wall of a full-scale room. Energy Convers. Manag. 2016, 120, 81–89. [Google Scholar] [CrossRef]
- Pomianowski, M.; Heiselberg, P.; Jensen, R.L.; Cheng, R.; Zhang, Y. A new experimental method to determine specific heat capacity of inhomogeneous concrete material with incorporated microencapsulated-PCM. Cement. Concr. Res. 2014, 55, 22–34. [Google Scholar] [CrossRef]
- Cheng, R.; Pomianowski, M.; Wang, X.; Heiselberg, P.; Zhang, Y. A new method to determine thermophysical properties of PCM-concrete brick. Appl. Energy 2013, 112, 988–998. [Google Scholar] [CrossRef]
- Silva, T.; Vicente, R.; Soares, N.; Ferreira, V. Experimental testing and numerical modelling of masonry wall solution with PCM incorporation: A passive construction solution. Energy Build. 2012, 49, 235–245. [Google Scholar] [CrossRef]
- Necib, H.; Settou, N.; Saifi, N.; Damene, D. Experimental and numerical study of a usual brick filled with PCM to improve the thermal inertia of buildings. Energy Procedia 2013, 36, 766–775. [Google Scholar] [CrossRef]
- Saxena, R.; Rakshit, D.; Kaushik, S.C. Phase change material (PCM) incorporated bricks for energy conservation in composite climate: A sustainable building solution. Sol. Energy 2019, 183, 276–284. [Google Scholar] [CrossRef]
- Kong, X.; Lu, S.; Huang, J.; Cai, Z.; Wei, S. Experimental research on the use of phase change materials in perforated brick rooms for cooling storage. Energy Build. 2013, 62, 597–604. [Google Scholar] [CrossRef]
- He, W.; Yu, C.; Yang, J.; Yu, B.; Hu, Z.; Shen, D.; Liu, X.; Qin, M.; Chen, H. Experimental study on the performance of a novel RC-PCM-wall. Energy Build. 2019, 199, 297–310. [Google Scholar] [CrossRef]
- Castell, A.; Martorell, I.; Medrano, M.; Perez, G.; Cabeza, L.F. Experimental study of using PCM in brick constructive solutions for passive cooling. Energy Build. 2010, 42, 534–540. [Google Scholar] [CrossRef]
- Lichołai, L.; Dębska, B.; Krasoń, J. Assessment of the applicability of a phase change material in horizontal building partitions. IOP Conf. Ser. Earth Environ. Sci. 2019, 214, 012042. [Google Scholar] [CrossRef]
- Errebaia, F.B.; Chikh, S.; Derradji, L. Experimental and numerical investigation for improving the thermal performance of a microencapsulated phase change material plasterboard. Energy Convers. Manag. 2018, 174, 309–321. [Google Scholar] [CrossRef]
- Kusamaa, Y.; Ishidoyaba, Y. Thermal effects of a novel phase change material (PCM) plaster under different insulation and heating scenarios. Energy Build. 2017, 141, 226–237. [Google Scholar] [CrossRef]
- Wang, X.; Yu, H.; Li, L.; Zhao, M. Research on temperature dependent effective thermal conductivity ofcomposite-phase change materials (PCMs) wall based on steady-state method in a thermal chamber. Energy Build. 2016, 126, 408–414. [Google Scholar] [CrossRef]
- Esteves, L.P.; Magalhães, A.; Ferreira, V.; Pinho, C. Evolution of global heat transfer coefficient on PCM energy storage cycles. Energy Procedia 2017, 136, 188–195. [Google Scholar] [CrossRef]
- Trgala, K.; Pavelek, M.; Wimmer, R. Energy performance of five different building envelope structures using a modified Guarded Hot Box apparatus—Comparative analysis. Energy Build. 2019, 195, 116–125. [Google Scholar] [CrossRef]
- Li, L.; Yu, H.; Liu, R. Research on composite-phase change materials (PCMs)-bricks in the west wall of room-scale cubicle: Mid-season and summer day cases. Build. Environ. 2017, 123, 494–503. [Google Scholar] [CrossRef]
- Lee, K.O.; Medina, M.A.; Sun, X.; Jin, X. Thermal performance of phase change materials (PCM)-enhanced cellulose insulation in passive solar residential building walls. Sol. Energy 2018, 163, 113–121. [Google Scholar] [CrossRef]
- Miąsik, P.; Krasoń, J. Thermal functioning of a transparent barrier equipped with a system of external thermal insulation shields. E3S Web Conf. 2018, 49, 00071. [Google Scholar] [CrossRef]
- Ramakrishnan, S.; Sanjayan, J.; Wang, X. Experimental Research on Using Form-stable PCM-Integrated Cementitious Composite for Reducing Overheating in Buildings. Buildings 2019, 9, 57. [Google Scholar] [CrossRef]
- Debska, B.; Lichołai, L.; Krasoń, J. Selected properties of epoxy mortars with perlite aggregate. J. Ecol. Eng. 2017, 18, 246–255. [Google Scholar] [CrossRef]
- Debska, B.; Lichołai, L. Long-term chemical resistance of ecological epoxy polymer composites. J. Ecol. Eng. 2018, 19, 204–212. [Google Scholar] [CrossRef]
- Heim, D. Isothermal storage of solar energy in building construction. Renew. Energy 2010, 35, 788–796. [Google Scholar] [CrossRef]
- Lichołai, L.; Miąsik, P.; Starakiewicz, A.; Krasoń, J. Analysis of the thermal characteristics of anti-icing driveway plates. IOP Conf. Ser. Earth Environ. Sci. 2019, 214, 012040. [Google Scholar] [CrossRef]
- Miąsik, P.; Lichołai, L. The influence of a thermal bridge in the corner of the walls on the possibility of water vapour condensation. E3S Web Conf. 2018, 49, 00072. [Google Scholar] [CrossRef]
- Dębska, B.; Lichołai, L.; Miąsik, P. Assessment of the Applicability of Sustainable Epoxy Composites Containing Waste Rubber Aggregates in Buildings. Buildings 2019, 9, 31. [Google Scholar] [CrossRef]
- Xie, J.; Wang, W.; Sang, P.; Liu, J. Experimental and numerical study of thermal performance of the PCM wall with solar radiation. Constr. Build. Mater. 2018, 177, 443–456. [Google Scholar] [CrossRef]
- Mehdaoui, F.; Hazami, M.; Messaouda, A.; Taghouti, H.; Guizania, A. Thermal testing and numerical simulation of PCM wall integrated inside a test cell on a small scale and subjected to the thermal stresses. Renew. Energy 2019, 135, 597–607. [Google Scholar] [CrossRef]
- PN-EN ISO. 6946:2017-10 Building Components and Building Elements–Thermal Resistance and Thermal Transmittance–Calculation Method; ISO: Warsaw, Poland, 2017. [Google Scholar]


© 2019 by the authors. Licensee MDPI, Basel, Switzerland. This article is an open access article distributed under the terms and conditions of the Creative Commons Attribution (CC BY) license (http://creativecommons.org/licenses/by/4.0/).