Article

The Influence of Geo-Hazard Effects on the Physical Vulnerability Assessment of the Built Heritage: An Application in a District of Naples

by
Nicola Chieffo
1,* and
Antonio Formisano
2
1
Department of Civil Engineering, Faculty of Engineering, Politehnica University of Timisoara, Traian Lalescu Street, 300223 Timisoara, Romania
2
Department of Structures for Engineering and Architecture, School of Polytechnic and Basic Sciences, University of Naples “Federico II”, P. le V. Tecchio 80, 80125 Napoli, Italy
*
Author to whom correspondence should be addressed.
Buildings 2019, 9(1), 26; https://doi.org/10.3390/buildings9010026
Submission received: 27 December 2018 / Revised: 11 January 2019 / Accepted: 16 January 2019 / Published: 21 January 2019

Abstract

:
The proposed study aims at analysing a sub-urban sector in the historic centre of Qualiano, located in the province of Naples (Italy), in order to assess the seismic vulnerability of the main typology classes (masonry and reinforced concrete) in the study area and the consequent expected damage scenarios. The typological and structural characterisation of the investigated area is done through the CARTIS form developed by the PLINIVS research centre together with the Italian Civil Protection Department. Subsequently, the vulnerability simulation analysis is carried out by means of a quick methodology integrated into a GIS tool in order to identify the structural units (S.U.) most susceptible at damage under seismic events. Furthermore, in order to take into account the possible damage scenarios, a parametric analysis is performed using a seismic attenuation law in order to obtain the maximization of the expected urban losses. Finally, the site and topographical local conditions, which negatively influence the severity of the seismic damage on the structures, have been taken into account in order to more correctly foresee the expected damage of the inspected sub-urban sector to be used for appropriate seismic risk mitigation plans.

1. Introduction

The seismic risk assessment of urbanized areas involves a multi-level analysis that is based on the combination of three main factors, such as, Hazard (H), Exposure (E), and Vulnerability (V) [1]. Within this approach devoted to the seismic risk assessment, the large-scale vulnerability of building samples assumes a noteworthy importance, as it is one of the main factors that is responsible for structural damages due to possible seismic events [2]. In fact, the rigorous assessment of the vulnerability of existing buildings and the implementation of appropriate solutions to mitigate the earthquake induced effects aims at reducing the levels of physical damage and socio-economic losses impact of the future seismic events. Risk management of urban areas is normally carried out without an adequate spatial planning tool. In fact, the high population density and the absence of adequate renovation interventions on buildings are factors that negatively influence the global vulnerability of entire urban centres with disastrous consequences in the case of seismic events [3]. As a result of this condition, the main cause of huge social losses, observed during the past earthquakes, is due to the collapse of buildings. However, the general concept of risk, independent from the considered natural phenomena, can be understood as the achievement of a level of “expected losses”, social and economic, into a given area [4]. It is, therefore, important to know the urban heterogeneity and the global socio-economic level to guarantee the development of policies and programs that prevent and reduce urban vulnerability in relation to the number of inhabitants and their exposure to natural phenomena. In this context, it seems evident that the loss concept is commonly identified as costs that should be sustained in order to restore the system original configuration.
The assessment of large-scale seismic vulnerability, therefore, would allow for both estimating the potential future losses due to the occurrence of earthquakes that can affect a particular region and supporting the technicians to implement risk mitigation plans. This kind of approach was first proposed by the Italian National Group for the Defence against Earthquakes (GNDT), which took the profit of post-earthquake damage observations of masonry buildings in Italy [5]. This method considered buildings as isolated structures [6], thus neglecting the aggregated configuration, where the interactions and the connections among adjacent constructions modify their seismic behaviour. Therefore, this analysis approach has been subsequently modified in order to consider any mutual interactions of buildings placed in aggregate due to earthquakes [7]. This procedure was then developed for several case studies in Europe [8,9,10].
Observational models have the peculiarity to be easily implemented into the macroseismic method [11] for the evaluation of the expected damage in a generic urbanized area according to the European macroseismic scale EMS-98 [12].
In the large-scale risk assessment, it is very important to take into account the selection of seismogenic zones, which are commonly referred to a scenario analysis, in order to have a realistic distribution of site effects on the entire territory. The geo-morphological effects have an important role on the seismic vulnerability investigation, since they significantly influence the behaviour of buildings due to the local amplification effects, an intrinsic feature of the site of interest. Generally, the expected risk is represented in terms of macroseismic intensity and empirical correlations between the surface geology and the seismic intensity, based on the post-event observations, are proposed. In fact, simplified methodologies are implemented for the estimation of site effects [13,14] and their influence on the seismic vulnerability impact scenarios. These studies are mainly based on the macroseismic approach, since the macroseismic intensity is the main parameter linking the direct effects of the earthquake to the consequent damage. The methodology that was proposed by Giovinazzi and Lagomarsino [15] allows for estimating the macroseismic intensity increase as a function of amplification factors, defined for different class of buildings and soil conditions. Therefore, according to the macroseismic approach [12], the soil conditions are taken into consideration within the vulnerability index and the risk is then evaluated in terms of macroseismic intensity as compared to the rigid soil requirement.
Based on these premises, the present work proposes a large-scale vulnerability study of a sub-urban sector of the historical centre of Qualiano, in the district of Naples, focusing the attention on the geo-hazard effects that are induced by local site phenomena. This is due to the fact that Qualiano rises on deposits of lapilli characterising the ground, which is classified as a category C. More in detail, the study aims at estimating the amplification of macroseismic intensity and, subsequently, of the seismic vulnerability of the inspected area in order to correctly estimate the expected damage scenarios.

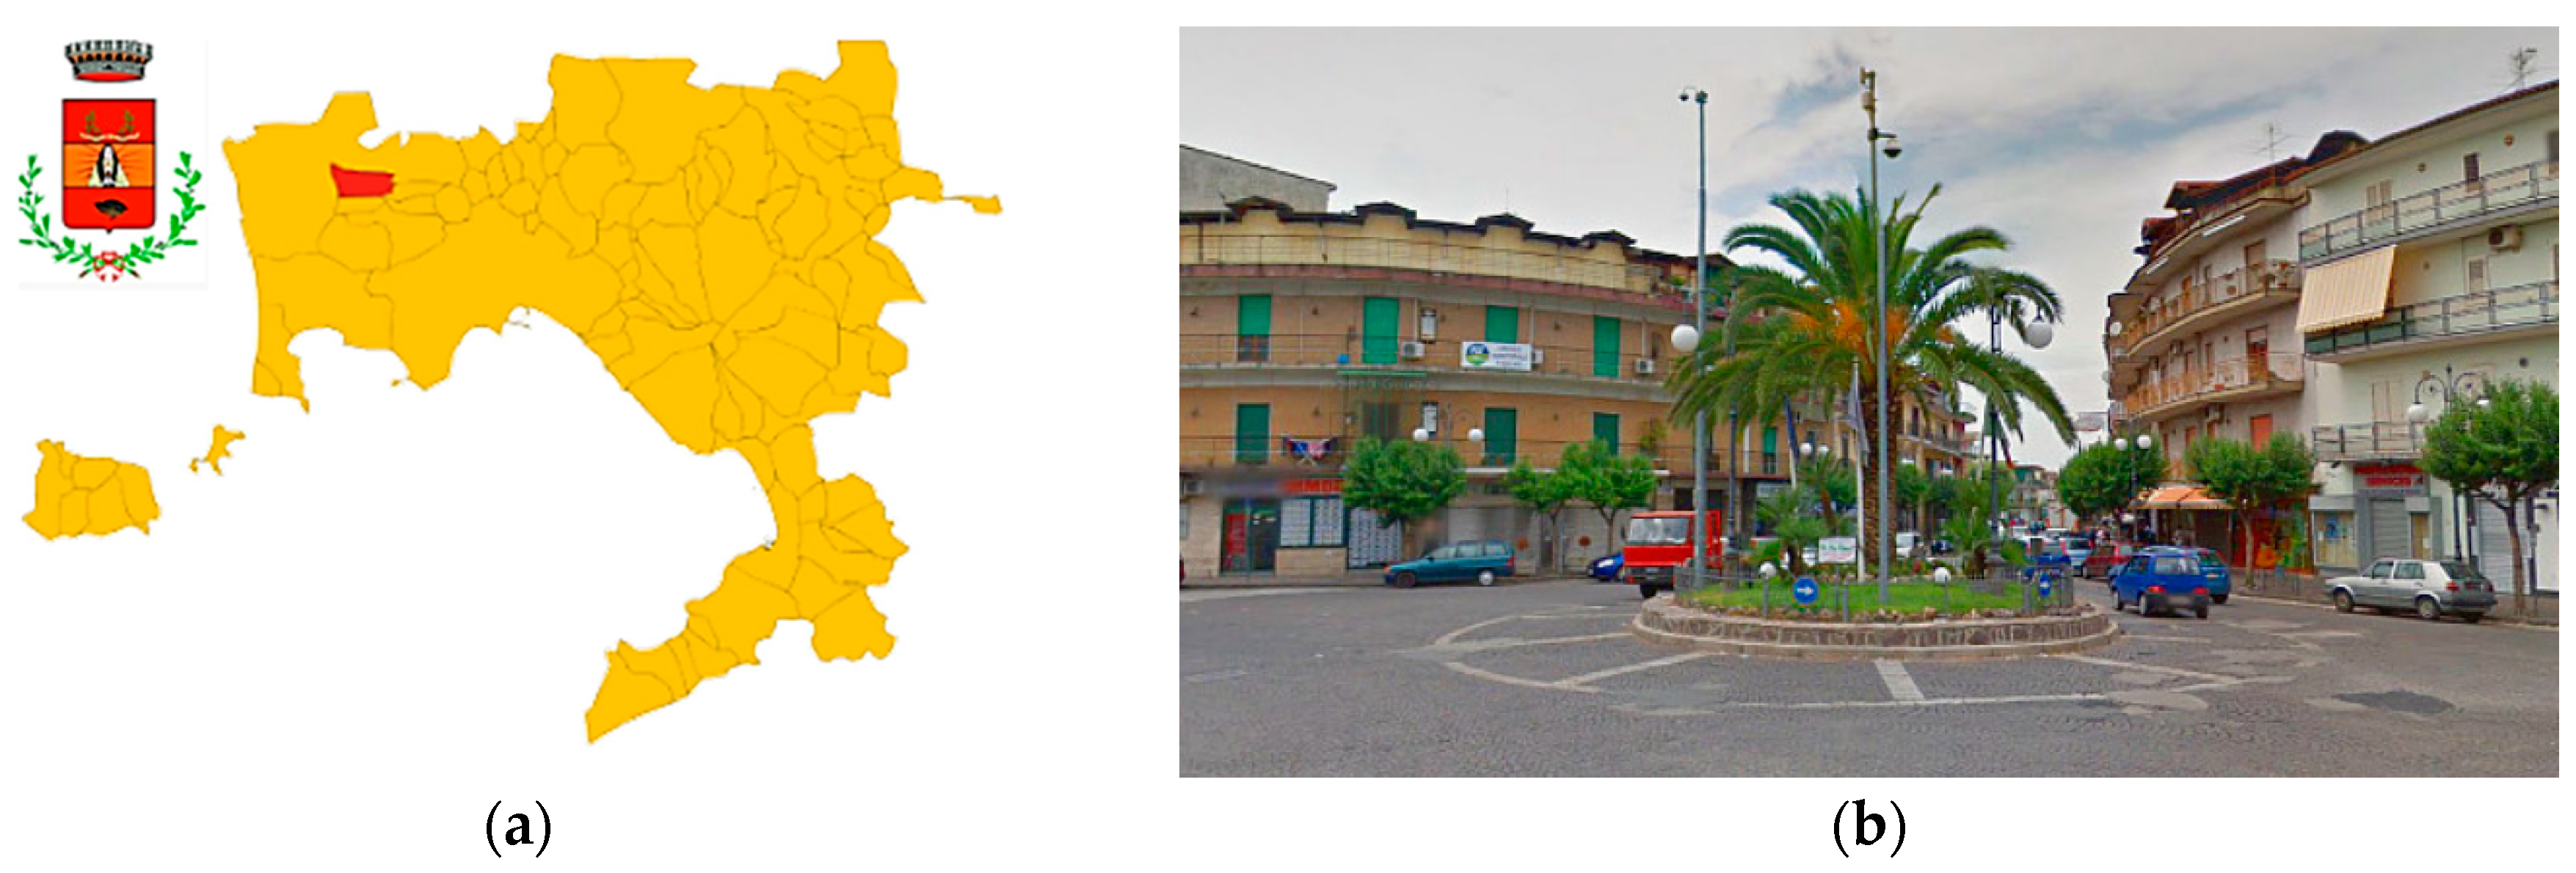
2. The Historical Centre of Qualiano

2.1. Historical News

Qualiano, Figure 1, is a municipality with 25.704 inhabitants in the metropolitan area of Naples in Campania. The name derives from Caloianum, as can be seen from the first complete list of all the houses in the kingdom of Naples. The historical information on the origin of Qualiano are corroborated by numerous archaeological discoveries that allowed to suppose, without doubts, the role and function of the Roman village of Collana, which was dominated first by Greek colonies and then by Roman people.
Recent archaeological finds also suggest that Qualiano was one of the most favourite centres of Roman patricians for the healthy climate and the flourishing vegetation. This was also narrated by the historian Titus Livio, who described the natural riches of the entire Agro-Giuglianese territory. In fact numerous remains of the Roman empire, such as marble statues, opus reticulatum masonry, consisting of diamond-shaped tuff bricks placed around a core of opus caementicium (the former concrete), opus latericium masonry, which is coarse-laid brickwork used to face a core of opus caementicium, coloured mosaic floors dated from the end of the 1st century BC to the beginning of the 1st century AD, huge clay vases for storing foodstuffs (wheat, barley, etc.), and a rectangular water-filled cistern with a vaulted roof [16], were found.
Already in the fourth century, Qualiano recorded the presence of the Samnite people, while the formation of an agricultural centre or village (fagus) dated back to the III century BC, with the presence of the Oscan-Samnite people. The highest importance and urban growth of Qualiano occurred in the fourth or fifth century AD during the period of Roman decadence. The historical periods from the Angevin-Aragonese kingdom to the Spanish one (1500 and 1600) affected the modest agglomeration of Qualiano, while from the urban point of view the second Bourbon period (1815–1860) had a considerable importance.
Currently, Qualiano belongs the giuglianese area with the municipalities of Villaricca, Calvizzano, Giugliano in Campania, Marano di Napoli, and Mugnano di Napoli.

2.2. Typological and Structural Characterisation of Samples of Buildings: The CARTIS Form

The CARTIS form [17] was developed by the PLINIVS research centre of the University of Naples “Federico II” in collaboration with the Italian Civil Protection Department (DPC) during the ReLUIS 2014–2016 project—“Development of a systematic methodology for the assessment of exposure on a territorial scale based on the typological characteristics/structural of buildings”.
The CARTIS form aimed at detecting the prevalent ordinary building typologies in municipal or sub-municipal areas, called urban sectors, characterised by typological and structural homogeneity. The form refers only to ordinary buildings, mainly houses (multi-storey buildings) made of masonry and reinforced concrete (RC). Therefore, from the typological characterisation, monumental buildings (religious buildings, historic buildings, etc.), special structures (industrial warehouses, shopping centres, etc.), and strategic ones (hospitals, schools, etc.), whose characteristics are not comparable to ordinary buildings, have been excluded. The preliminary phase requires the identification of the homogeneous urban sector, appropriately bounded on the map and progressively numbered with respect to other sectors [18].
The form is divided into four sections: section 0 for the identification of the municipality and the sectors identified therein; section 1 for the identification of each of the predominant typologies characterizing the generic sub-sector of the assigned municipality; section 2 for the identification of general characteristics of each typology of constructions; section 3 for the characterization of structural elements of all individuated construction typologies.
It is worth noting that the structural-typological characterisation of the built-up represents a useful tool for improving the inventory of building distributions on the national territory for the large scale seismic vulnerability assessment by means of any specific approach. The overlapping of the basic cartography with the elaborations related to the urban habitat chronological development or, in the absence of it, with the comparison between cadastral maps of different epochs, allow for knowing the phases of the city growth. From these elaborations, it is possible to identify the historical areas of Qualiano, which is those built before the seismic classification of the municipality (occurred after 1980) and the urbanised areas with recent buildings. Based on the aforementioned items, the municipality of Qualiano has been subdivided into four sectors. The first, C01, is the historical centre, the second C02, is the first urban expansion, the third, C03, is made of suburbs, and finally, the fourth, C04, is an agricultural/industrial area (Figure 2).
The study is herein conducted on the C01 sector (Figure 3), where two types of masonry structures, URM1 and URM2, and one kind of reinforced concrete buildings, RC, are identified according to the acronyms of structural typologies given by the CARTIS form.
The buildings of the URM1 typological class are placed in the heart of the historical centre of Qualiano, which collects all of the constructions built before 1860 and are generally composed of two floors.
From the technological point of view, these buildings have a tuff masonry structure with an average thickness of 0.80 m and direct masonry foundations. The lack of connections at corners among perimeter walls orthogonal to each other does not guarantee a global behaviour of the structure. The horizontal structures are characterised by timber floors and unusable roofs. Similarly, URM2 buildings have two floors above ground with inter-storey heights of 3.50 m. They have a tuff masonry structure with thicknesses of 0.80 m, reinforced concrete horizontal structures, and direct and continuous foundations. The arrangement of the openings on the façade is regular and buildings have a good conservation state.
Finally, the recently constructed reinforced concrete buildings consist of four floors with inverse beams foundations. Cladding walls are made of brick masonry with thickness of 0.30 m.
Subsequently, the acronyms proposed by the BTM (Building Typology Matrix) [19] have been used to indicate the typological classes of the CARTIS form, see Figure 4. In particular, the classes URM1 and URM2 correspond to M1.2 (tuff masonry stones with timber floors, 28%) and M3.4 (tuff masonry stones with reinforced concrete floors, 60%), respectively. Furthermore, RC1 is associated to the RC class (reinforced concrete frames, 12%). The representation on the Qualiano’s map of the inspected building typological classes is done using the QGIS tool [20].

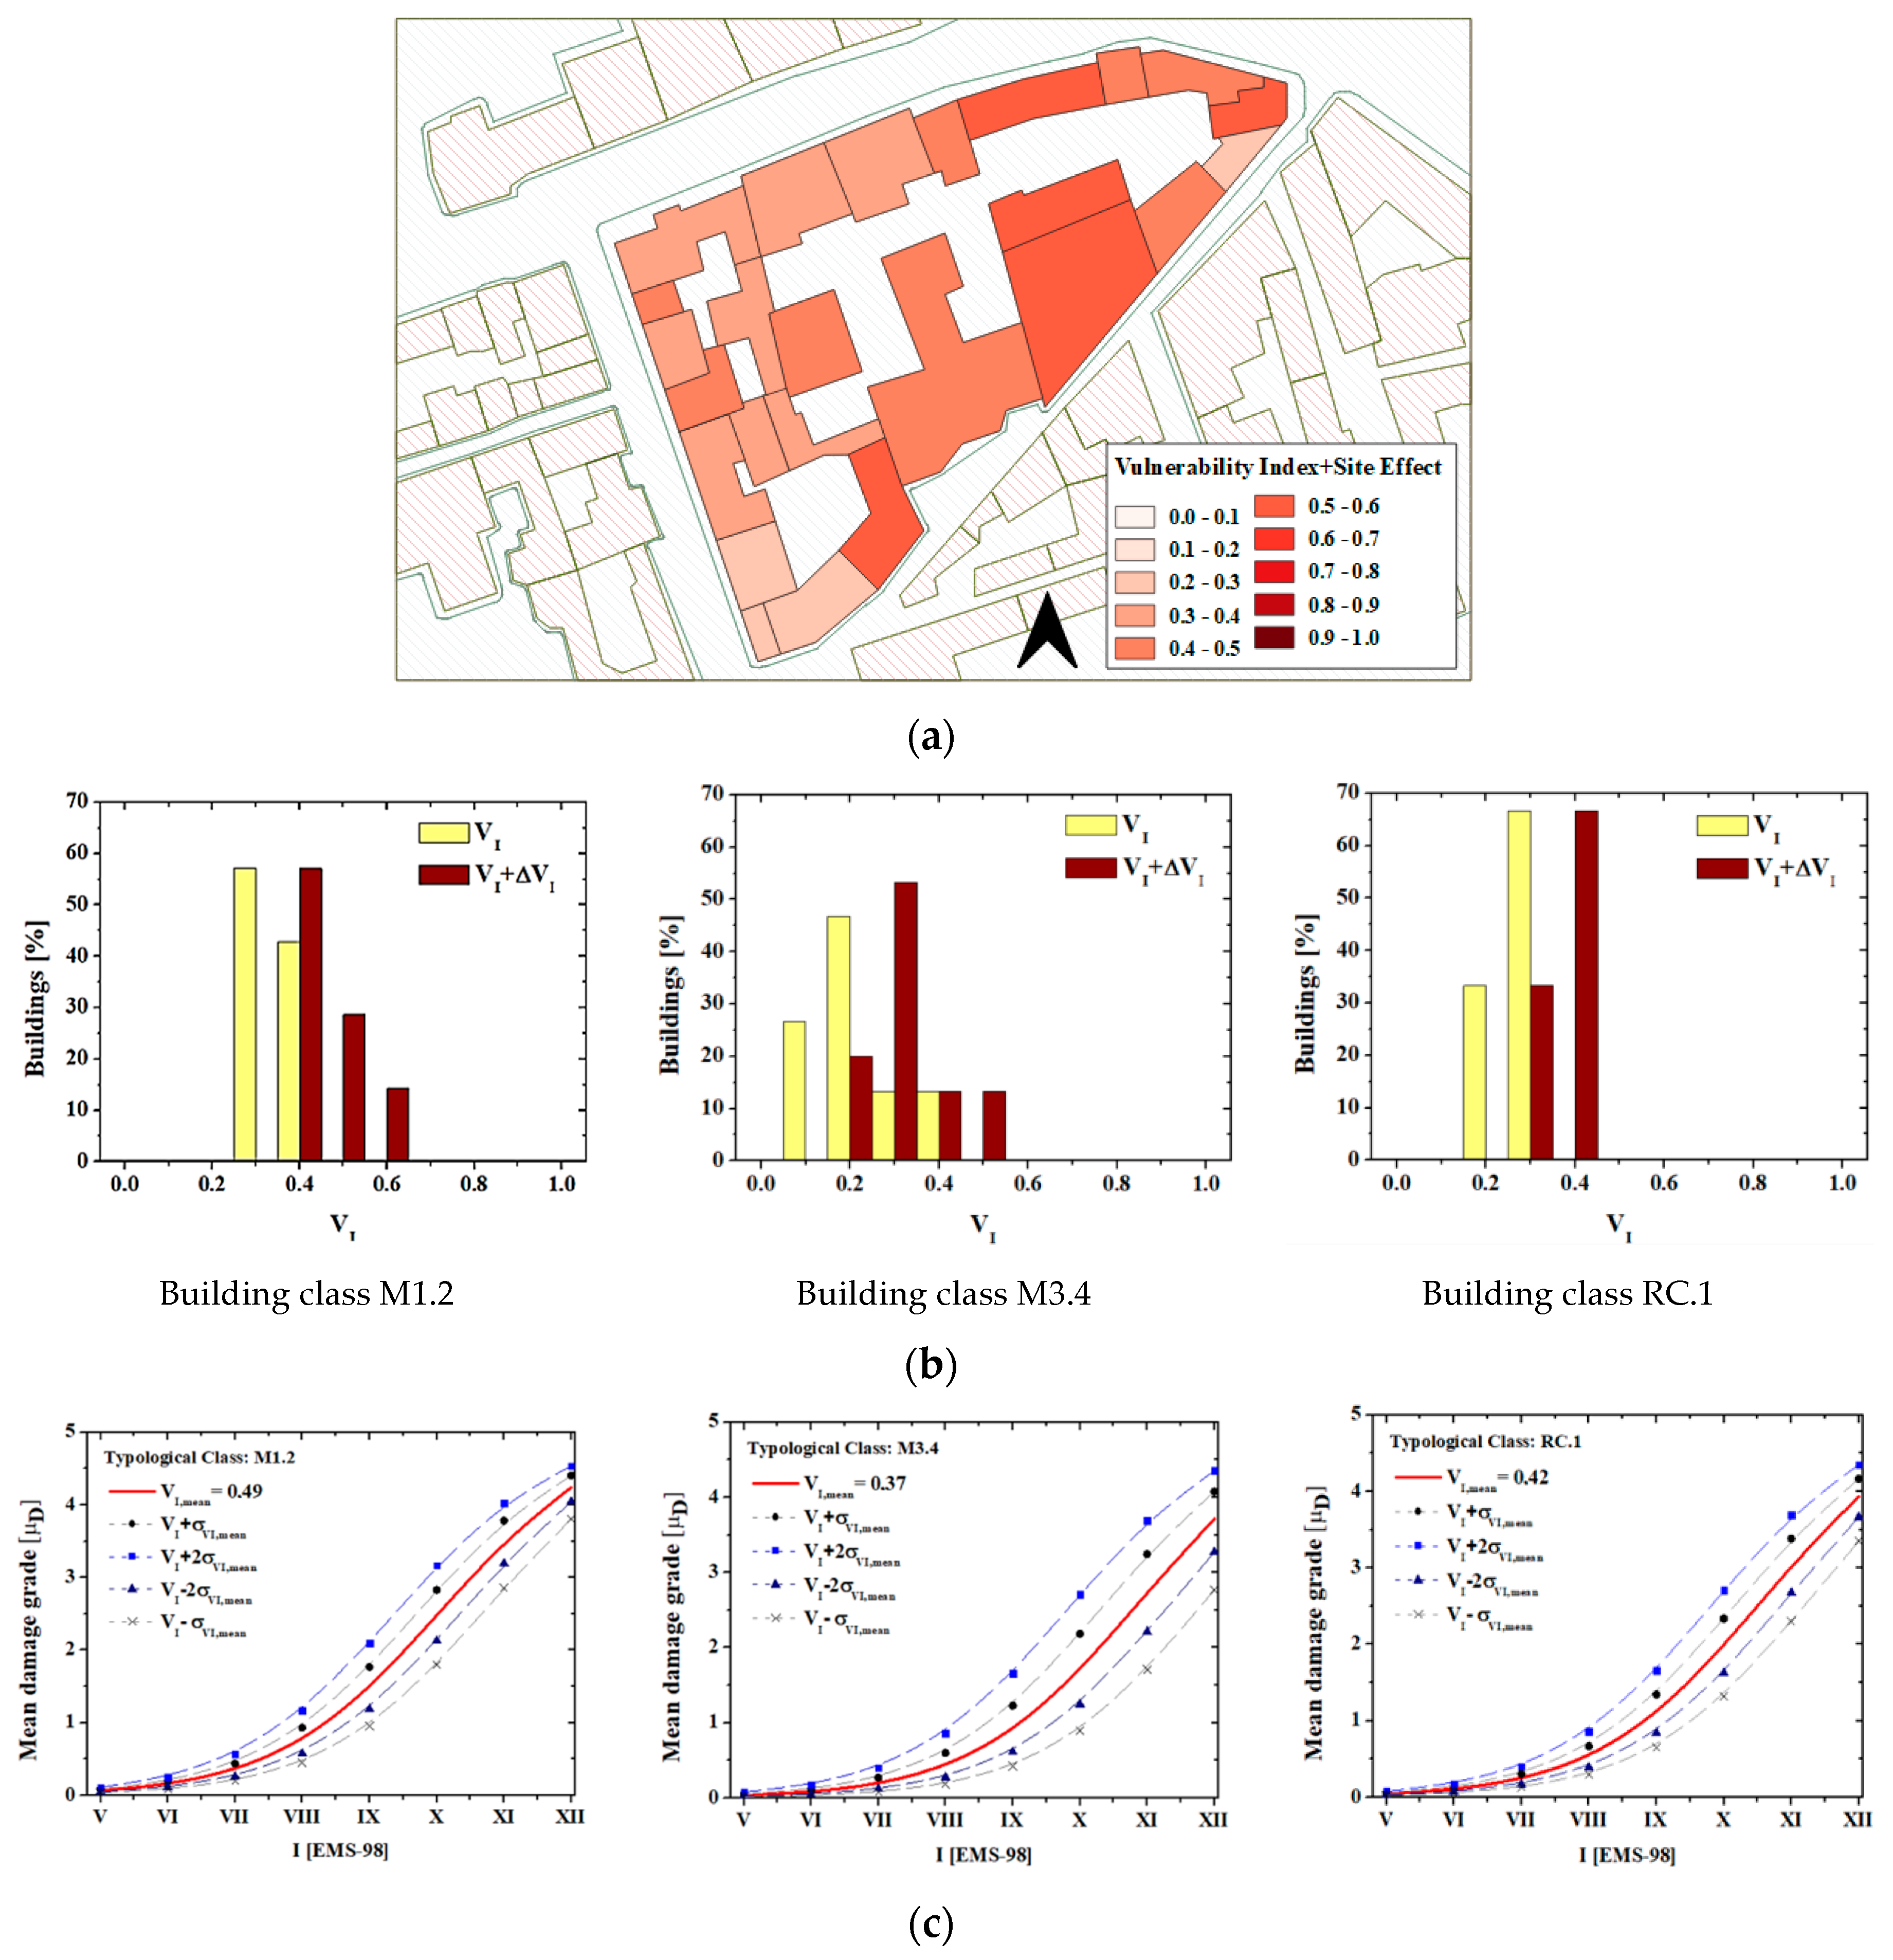
2.3. Seismic Vulnerability Assessment

In order to implement a rapid seismic assessment procedure for the examined urban sector the proposed new vulnerability form for aggregates depicted in Table 1 is used [21].
This new form is based on the vulnerability index method that was initially proposed by Benedetti and Petrini [6], which was widely used in the past as a rapid technique to investigate the vulnerability of isolated buildings under earthquakes. The basic vulnerability assessment method, composed of ten parameters, was adopted with some minor adjustments by the Italian Group Against Earthquakes as the first screening tool for assessing the vulnerability of masonry and RC buildings.
The first ten parameters of the above mentioned form refer to the main geometrical and mechanical parameters of buildings, as well as to the significant peculiarities of structural systems in the seismic area, such as type and distribution of seismic-resistant elements, foundation category, regularity, floor and roof types, structural detailing, and conservation state.
However, in order to consider the structural interactions among adjacent buildings, which were not considered in the original method, the development of a new form was mandatory. The new investigation form appropriately conceived for building aggregates is obtained by adding to the ten basic parameters of the original form five new parameters taking into account the effects of mutual interaction among the aggregated structural units under seismic actions. The added parameters, partially derived from previous studies found in literature [22], are detailed as follows:
Parameter 11: Presence of adjacent buildings with different height
The in-elevation interaction among adjacent buildings has a not negligible effect on the seismic response of structural units (S.U.) The optimal condition is given by adjoining buildings having the same height (class A), due to the action of mutual confinement. In addition, a building adjacent to higher buildings (from one or both sides, class B) may incur less damage than one adjacent to buildings with less height (classes C and D).
Parameter 12: Position of the building in the aggregate
This parameter aims to take into account the in-plane interaction among S.U. In particular, the isolated building case corresponds to the class D, while the intermediate, corner, and heading conditions are related to the classes A, B, and C, respectively. It is worth noticing that the inclusion in aggregate, independently from the position of the structural unit, gives rise to the seismic vulnerability reduction.
Parameter 13: Number of staggered floors
In case of earthquakes staggered floors are responsible for the pounding effects on masonry walls of adjacent S.U., which can trigger out-of-plane mechanisms. The best situation is the absence of staggered floors (class A), whereas the presence of one (class B), two (class C), or more than two (class D) staggered floors increases the vulnerability.
Parameter 14: Structural or typological heterogeneity among adjacent S.U.
This parameter refers to the possibility that adjacent buildings can be made of different constructive technologies or have structural heterogeneity. In case of buildings of the same masonry type, the vulnerability remains unchanged with respect to the isolated building case (class C). Instead, the case of structural heterogeneity (i.e. a masonry S.U. near to a RC structure) is the most favourable condition in the case of seismic events. Finally, S.U. can be placed close to another unit that is made of masonry stones with worse (class B) or better mechanical properties (class D).
Parameter 15: Percentage difference of opening areas among adjacent facades
This parameter influences the seismic response of S.U., since it is responsible for the distribution of horizontal actions among façades of adjacent buildings. Other than the case of no difference of opening areas (class A), it is possible to observe situations where the S.U. is between other buildings with minor (classes B and C) or major (class D) percentage of windows and doors.
Conceptually, the methodology is based on the evaluation of a vulnerability index, IV, for each S.U. as the weighted sum of the 15 parameters listed in Table 1.
The estimated parameters, are distributed in four classes of increasing vulnerability, (A, B, C, and D), characterised by a score, Si, and an associated weight, Wi, varying from a minimum of 0.25 (less important parameters), up to a maximum of 1.20 (most important parameters). Further information how scores and classes were determined are found in [7,21,22].
Therefore, the vulnerability index, IV, can be calculated, as follows:
I V = i = 1 15 S i × W i
In order to facilitate its use and interpretation, the vulnerability index value can be normalised in the range (0–1) by means of Equation (2), where it is indicated with the notation VI.
V I = [ I V ( i = 1 15 S min × W i ) | i = 1 15 [ ( S max × W i ) ( S min × W i ) ] | ]
As illustrated in Figure 5, the application of this procedure to the selected sub-urban sector has allowed to evaluate the seismic vulnerability of masonry and RC buildings located there.
From the application of the vulnerability assessment methodology, it can be seen that, in the study area, the distribution of the vulnerability indexes is heterogeneous with average values of 0.38, 0.26, and 0.30 for typological classes M1.2, M3.4, and RC.1, respectively. The standard deviation (σi) associated to the vulnerability index distributions for the analysed typological classes M1.2, M3.4, and RC.1 are respectively σM1.2 = 0.05 σM3.4 = 0.08, and σRC.1 = 0.06.
The synthetic representation of the statistical data takes place while considering the distribution of the total frequencies of the vulnerability indexes that are presented in Figure 5b. It can be noted that 56% of buildings belonging to typological class M1.2 have a vulnerability index of 0.30, while only 44% of them have an index of 0.40. Similarly, for the class M3.4, 45% of buildings have a vulnerability index of 0.20, whereas only a lower percentage of buildings (about 13%) have vulnerability indexes of 0.30 and 0.40. Finally, referring to the RC.1 class, it is possible to notice a vulnerability index of 0.30 for most of the buildings (about 2/3 of the building sample).

2.4. Damage Probability Matrices (DPM) and Vulnerability Curves

The Damage Probability Matrices (DPM) express the occurrence probability of a certain damage level for different typological classes that were subjected to dissimilar seismic intensity levels according to the EMS-98 scale [23]. Methodologically, they can be generated on the basis of a generic damage scale expressed in terms of costs (such as the ratio between the repairing cost and the reconstruction one), which can be understood both in phenomenological terms and according to a qualitative estimate of the different damage degree that buildings may suffer in the case of seismic events [24].
From a practical point of view, the DPM can be implemented after the binomial coefficients are known. In the case under study, DPM of investigated typological classes are plotted in Figure 6.
In this figure, it is apparent that the binomial distribution has the highest coefficients for the damage degree D0 and intensity IEMS-98 = V. When the seismic intensity increases up to IEMS-98 = XII, the binomial distribution function has a maximum corresponding to the damage grade D4 (partial collapse) for the class type M1.2 with a probability of damage of 40%. Such a probability tends to decrease for the other two typological classes under the same intensity earthquake. It is also important to note that the class type RC.1, if compared to the other typological classes, exhibits an intermediate damage grade D5 (global collapse) due to in-plane and in-elevation irregularities.
The average vulnerability curves [25] are obtained to estimate the propensity of damage of the analysed structural classes. More in detail, these curves express the probability P[SL|IEMS-98] that a building reaches a certain limit state “LS” at a given intensity “IEMS-98” according to the European macroseismic scale (EMS-98).
In particular, as mathematically expressed by Equation (3), the vulnerability curves depend on three variables: the vulnerability index (VI), the seismic hazard, expressed in terms of macroseismic intensity (IEMS-98), and a ductility factor Q, ranging from 1.0 to 4.0, which describes the ductility of the typological classes. In the case under study, according to [26,27], a ductility factor Q of 2.3 is considered.
μ D = 2.5 [ 1 + t a n h ( I E M S - 98 + 6.25 × V I 13.1 Q ) ]
Recalling the Equation (2), it is also possible to derive vulnerability curves using the mean value and the upper and lower bound ranges of the vulnerability index distribution for different scenarios (VIVI,Mean; VIVI,Mean; VI +2σVI,Mean; VI +2σVI,Mean). Such a result is presented in Figure 7a–c, respectively, for typological classes M1.2, M3.4, and RC.1.

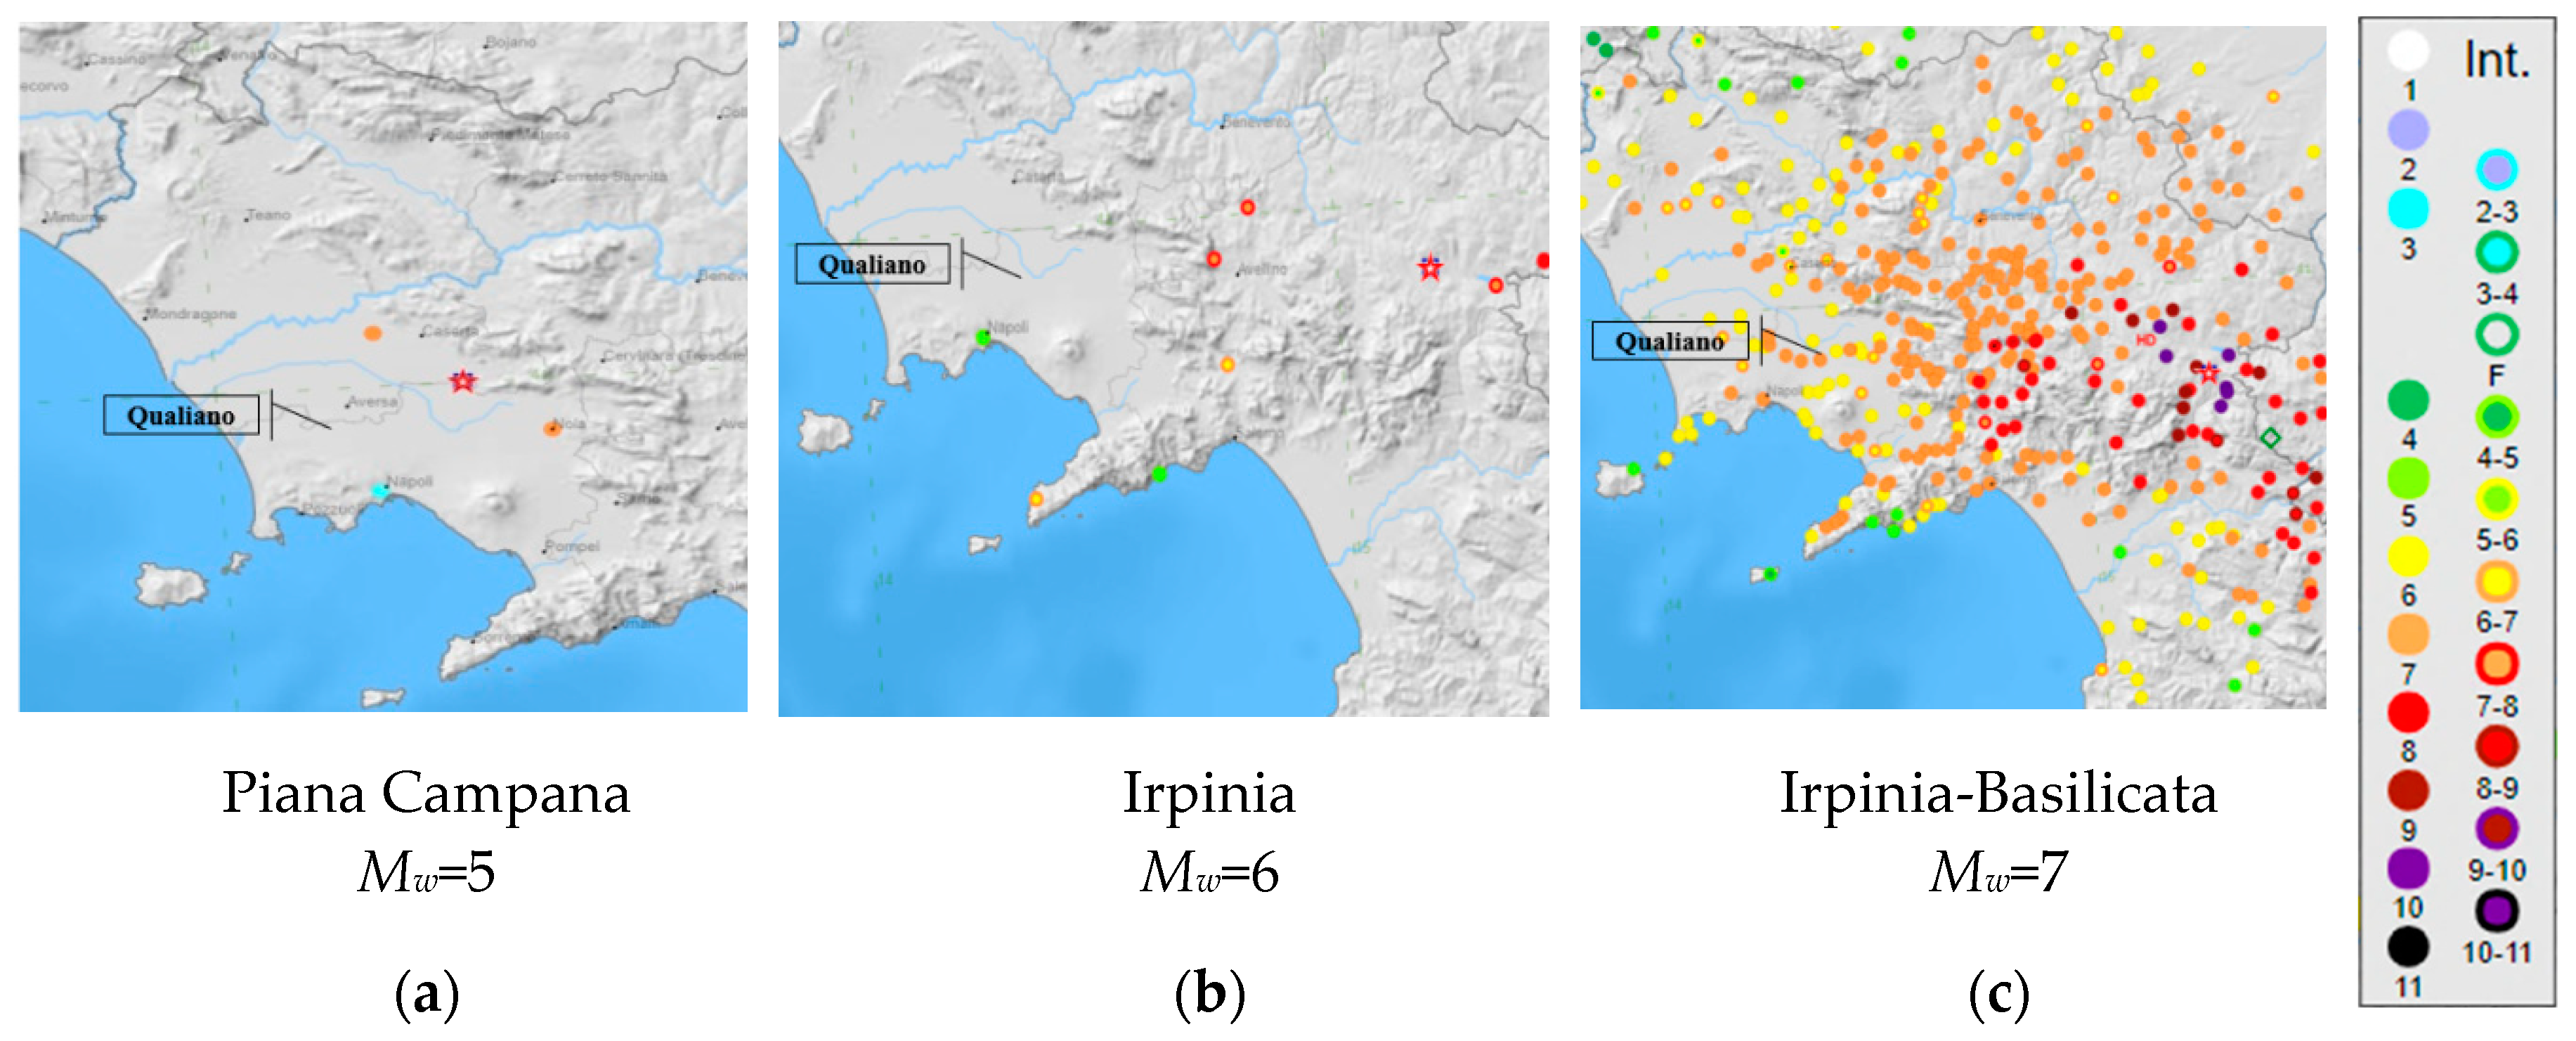
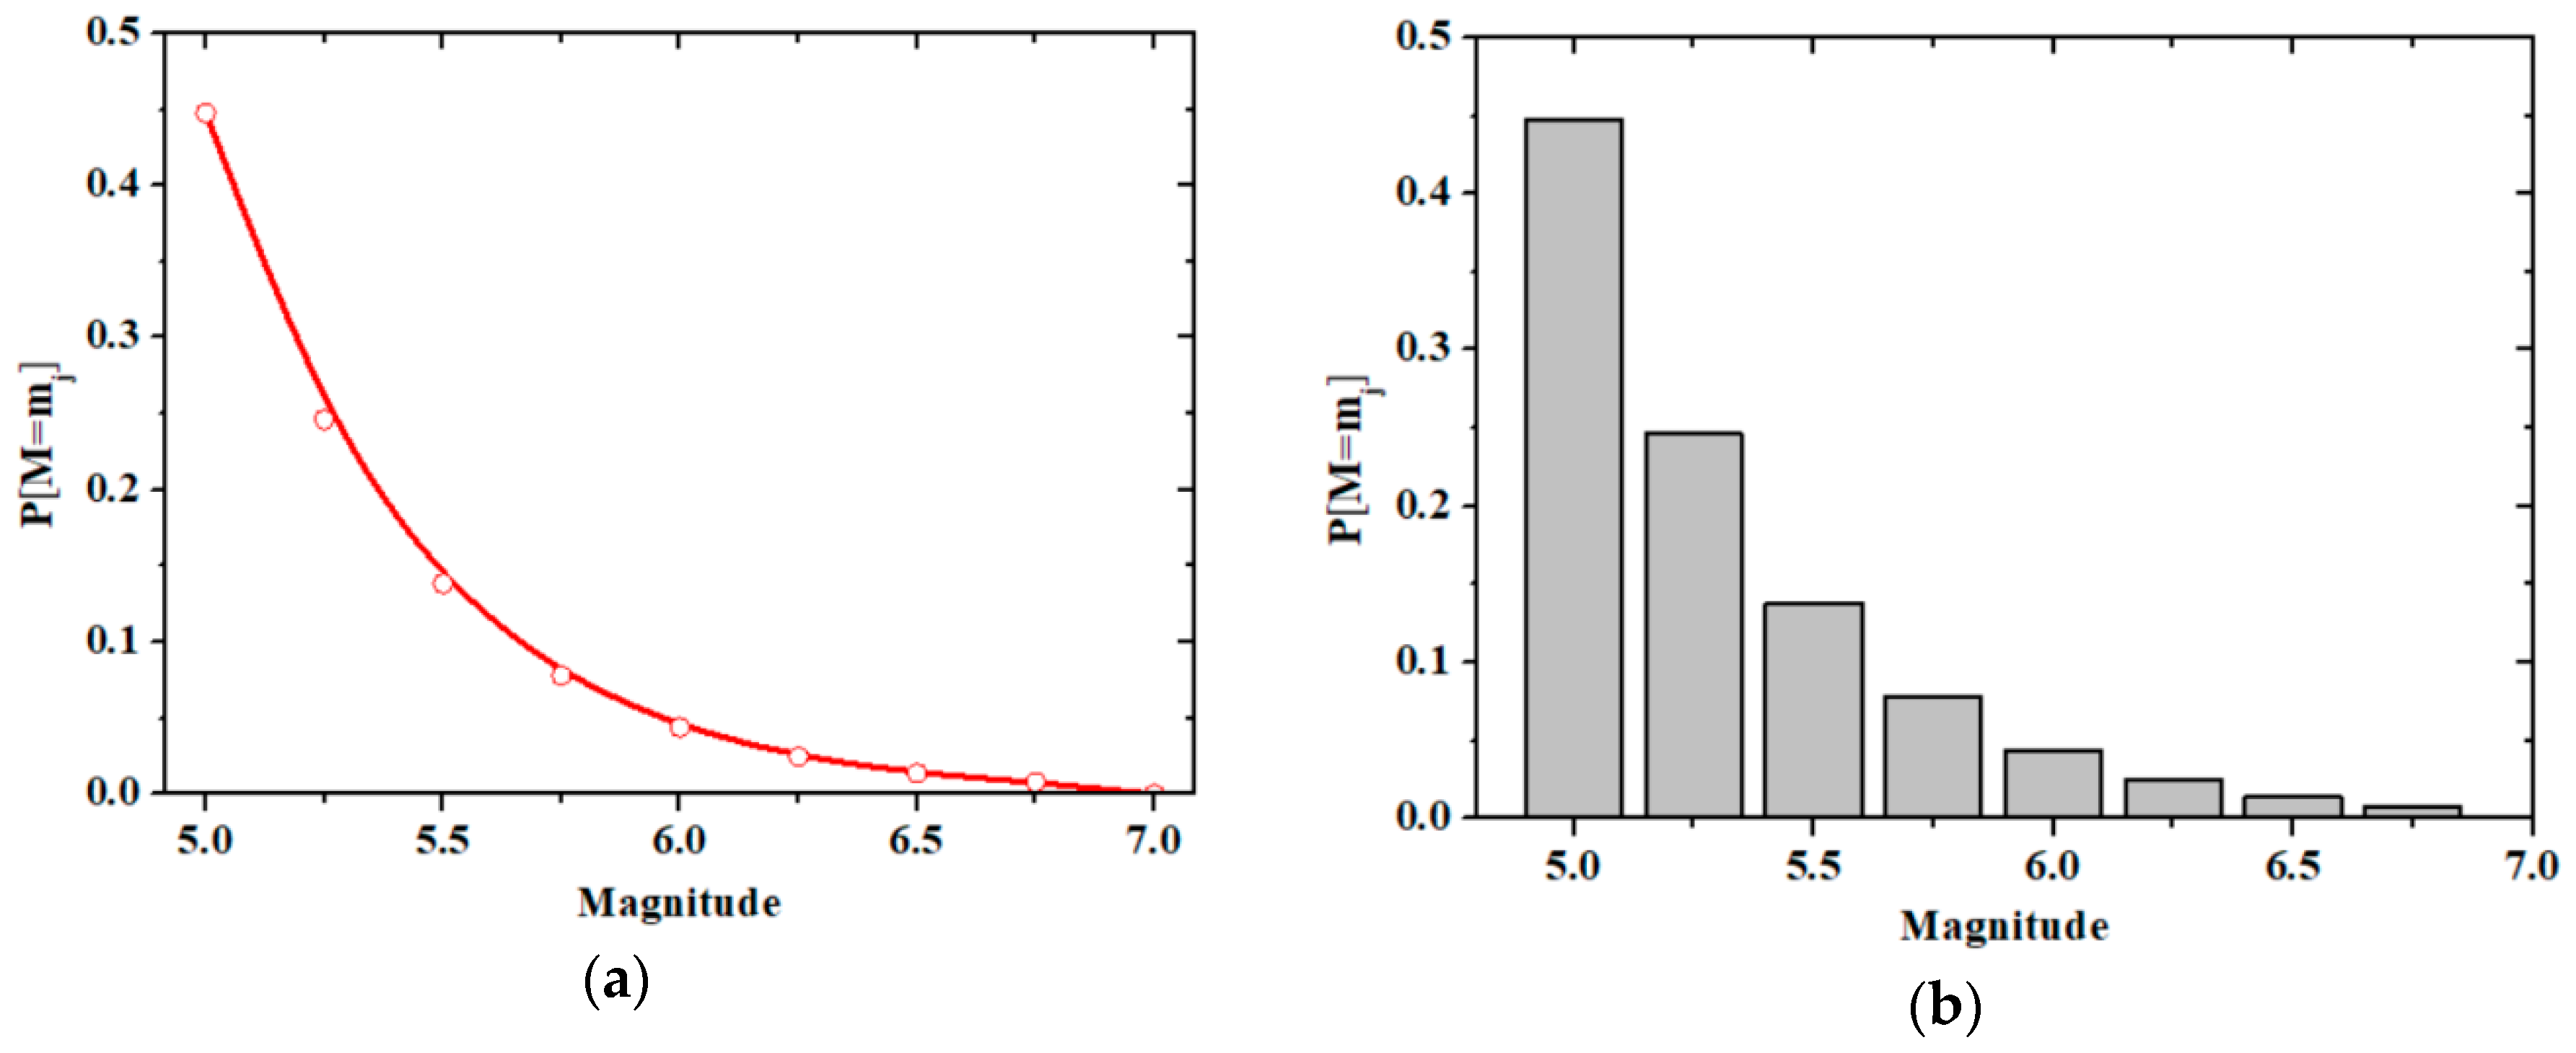
3. The Damage Scenarios Analysis

The concept of “risk” is generally understood as the economic, social, and environmental consequences that a disastrous event can cause in a given period of time. A prediction of the possible damage scenarios induced by natural events is a useful tool for the quantitative definition of expected losses and for the early implementation of mitigation measures. In this context, the damage analysis allows for an accurate management of the seismic emergency focusing the attention on the urban areas at risk [28]. The severity of the seismic damage is herein analysed by means of a careful parametric analysis. In fact, it should be considered that, during the earthquake, the sample of buildings would be subjected to damages proportional to the seismic motion severity. Using the Gutenberg-Richter law [29], it is possible to predict from the theoretical point of view the possible seismic intensities deriving from magnitudes that can occur in a specific area. To this purpose, the historical earthquakes in the examined area have been taken from the Italian Macroseismic Database DBMI-15 (National Institute of Geophysics and Volcanology) [30]. In particular, the seismic events of Piana Campana (1805), Irpinia (1692), and Irpinia-Basilicata (1980), which gave rise to moment magnitudes of 5, 6, and 7, respectively, have been selected (Figure 8). The selection of these magnitude sets has allowed for plotting the expected damage scenarios.
In Figure 8c, it is worth noting how the Irpinia–Basilicata earthquake generated in the study area a maximum macroseismic intensity, I, equal to VII. Moreover, the municipality of Qualiano is part of the seismogenic zone ZS9-928 (Ischia-Vesuvius) characterised by high values of the expected magnitude. Nevertheless, the cumulative distribution function, FM (m), for the earthquake magnitudes has been considered according to the following equation:
F M ( m ) = 1 10 b ( m m min ) 1 10 b ( m max m min ) ,   m min < m < m max
where the constant b is generally equal to 1, and mmin and mmax represent, respectively, the lower and upper limit of the selected magnitude.
The occurrence probabilities of these discrete set of magnitudes, which can be considered as the unique reliable values, are computed using Equation (5) and they are shown in Figure 9.
P [ M = m j ] = F M ( m j + 1 ) F M ( m )
The discrete probability distribution shows that, for a moment magnitude Mw = 5.0, a probability of occurrence of 43% is attained. Instead, the occurrence probability of earthquakes with magnitudes Mw > 5.0 tends to gradually decrease, since these seismic events are very rare.
Aiming at predicting the ground shaking at a site, it is also necessary to model the distribution of distances from the source to the site of interest. For a given earthquake source, it is generally assumed that earthquakes will occur with equal probability at any location on the fault [31].
Given that locations are uniformly distributed, it is generally simple to identify the distribution of source-to-site distances using only the source geometry. The source produces earthquakes randomly and with equal likelihood anywhere within 100 km of the site: the source may be larger, but it is typically truncated at some distance beyond which earthquakes are not expected to cause damage at the site.
From the above considerations, epicentre distances of 5, 10, and 15 km have been considered in order to maximize the expected impact. The attenuation relationship of seismic effects proposed by Esteva [32], as reported in Equation (6), is adopted as follows:
I E M S - 98 = 1.45 M w 2.46 ln ( D ) + 8.166
where Mw is the moment magnitude and D is the epicentre distance expressed in kilometres. The correlation obtained between moment magnitude, Mw, and macroseismic intensity, IEMS-98, for different epicentre distances are summarized in Table 2.
As it is seen from the data reported in Table 2, when Mw = 5.0 the macroseismic intensity tends to decrease for increasing site-source distances. Contrary, it is worth noting that, for magnitudes 6.0 (detected in 1980 earthquake) and 7.0 (highest grade recorded in the Campania region), the maximum macroseismic intensity, IEMS-98 = XII, is reached and it remains as constant independently from the site-source distance considered. Furthermore, referring to the damage parameter μD, representative of the damage thresholds of the EMS-98 scale, it is possible to obtain nine damage scenarios, as presented in Figure 10, deriving from the combination of the epicentre distances and the magnitudes considered [33].
From the previous figure, it is evident that the damage level does not depend on the site-source distance for magnitudes of 6 and 7, since the occurred macroseismic intensity is always the same. On the other hand, when Mw = 5, there is a substantial reduction of damage passing from D = 5 to D = 15 km. In particular, for an epicentre distance D = 5 km and moment magnitude Mw = 5.0, it is expected that most of the buildings reach damage thresholds D2 (substantial damage). Instead, when the site-source distance growths up to 10 Km, the most recurrent damage level is D1 (moderate damage). The same result is also attained when D = 15 Km, but in this case, contrarily to the previous situation, also buildings without damages (D0 level) are noticed. Differently, with moment magnitude of 6 or 7, independent from the distance value considered, the damage levels D3 (significant damage) and D4 (partial collapse) are expected.
Figure 11 shows the damage distribution obtained for the above described combinations. As it is observed, for Mw = 5.0 and D = 5 km, it is expected that 50% of the buildings reach damage level D2, 36% of the sample reach damage D3 and only 14% reach damage D1.
For the same epicentre distance, if the magnitude tend to increase either to 6 or 7 most of the buildings, 60% of the sample, reach the stationary damage D3, whereas 40% of buildings attain the damage D4.

4. Geotechnical Hazard Amplification

4.1. The Period-Dependence Site Effect and Local Hazard Amplification

The macroseismic intensity, even though it is a discrete quantity, is the main parameter for correlating the seismic input to the damage deriving from the earthquake impact. Furthermore, as previously analysed, a scenario analysis aims at estimating the global damage level at the territorial scale [34], instead of predicting the response of a given structure at a specific site. However, geotechnical-site characterisation should be considered for more accurate vulnerability and damage distributions. Soil conditions are taken into account in order to incorporate local effects within the vulnerability index method, so that the risk is assessed through macroseismic intensity as compared to rigid soil conditions.
In any case, the study proposed in [35] showed that the macroseismic intensity increase is required by local phenomena, which produce dynamic amplification in terms of vulnerability index modifiers. The macroseismic intensity increment that is induced by geological site phenomena is derived from the period-amplification effects dependence. In particular, referring to a generic elastic spectrum according to the Italian design code [36], a local amplification factor (fag) can be defined, as follows:
f a g = S a e ( T ) K S a e ( T ) R
Being Sae(T)K the maximum acceleration, Sae, of the elastic spectrum evaluated for a generic class of soil, K, and Sae(T)R the elastic response spectrum at the bedrock. Therefore, this ratio indicates the local amplification effect due to the generic soil type with respect to the rigid soil condition.
Subsequently, from the knowledge of the amplification factor, fag, it is possible to estimate the increment of seismic intensity, ΔI, by means of the following equation:
Δ I = ln ( f a g ) ln C 2
where the coefficient C2, estimated equal to 1.82, measures the increase of the seismic acceleration, ag, with the intensity, I, according to the correlation law proposed in [37].
Besides, the increase of the seismic vulnerability, ΔV (vulnerability modifier), is evaluated by means of the following relationship:
Δ V = Δ I 6.25
Finally, the main vibration period associated to the inspected sample of building is calculated according to the simplified formulation envisaged by [36], as follows:
T 1 = α H β
where H is the total height of buildings express in metres, the coefficient α is equal to 0.05 and 0.075 for masonry and RC buildings, respectively, and β = 0.75 for both building types. Thus, based on these assumptions, the vibration period of masonry buildings is 0.22 seconds, whereas that of RC buildings is 0.48 seconds.

4.2. Evaluation of Site Effect Condition and Seismic Vulnerability Scenarios

The Municipality of Qualiano has an extension of 7.3 Km2 and it is located in the centre of the Campana Plain, geologically modified by the intense activity of the Campi Flegrei volcano. Its stratigraphy is mainly composed of celandite deposits mixed with pumiceous lapilli, having black slag, and Campano yellow tuff in the basal area. The geological analyses carried out in [38] using the Multichannel Analysis of Surface Waves (MASW) technique classify the soil as “Category C”, that is coarsely thick-grained deposits with thickness exceeding 30 m and shear wave values, VS30, of 341 ms−1, according to the NTC18 [36] (Figure 12).
The assessment of the vulnerability increase is based on the possible effects induced by vertical and horizontal seismic actions. To this purpose, it is necessary to use, based on the indications that are given in Section 4.1, the local amplification coefficient fag, as reported in Table 3, where it is noticed that only horizontal accelerations are increased due to local site conditions.
Furthermore, the seismic intensity increase (∆I), appropriately defined by Equation (8), is used in order to redefine the macroseismic intensity values, previously defined in Section 3, corresponding to the set of magnitudes that were considered at different epicentre distances (Table 4).
From the results obtained, it is apparent that there is an average increase of 4% of the seismic intensity as compared to the case without site effects.
Analogously, a seismic vulnerability modifier ( Δ V I ) can be introduced to take into account the sum of the effects induced by vertical and horizontal seismic action components calculated for soil category C. This seismic behaviour modifier is defined through the following equation:
Δ V I = i [ Δ V V + Δ V H ]
Therefore, the global vulnerability of the inspected buildings is calculated as the sum of the local effects contribution and the normalized vulnerability index properly achieved from the building aggregates form:
V I ¯ = i [ Δ V V + Δ V H ] + V I = Δ V I + V I
The spatial distribution of vulnerabilities with the relative frequencies is indicated in Figure 13.
The vulnerability distribution due to site effects (Figure 13a,b) shows a vulnerability increment of 29% for the building class M1.2, of 42% for the M3.4 class and of 36% for the RC.1 class. The standard deviations (σi) that are associated to the vulnerability index distributions for the examined building classes are σM1.2 = 0.05, σM3.4 = 0.08, and σRC.1 = 0.06. In Figure 13c, the mean vulnerability curves, assuming the local amplification effects, are shown. In this figure, it is noted that there is an increase of the expected damage, which reaches a level D4 for the class M1.2 and a level included in the range D3÷D4 for both classes M3.4 and RC.1.
Subsequently, in order to predict the damage distribution, the correlation between macroseismic intensity and the seismic acceleration, ag, i.e. the most used physical parameter of the ground motion, is considered as follows [37]:
log a g = C 1 I E M S 98 C 2 [ g ]
where the correlation coefficients, C1 and C2, are 0.602 and 7.073, respectively. The used correlation law is graphically shown in Figure 14.
The non-linear law reported in the previous figure shows that ag growths in exponential way with the increase of the macroseismic intensity, IEMS-98. In particular, ag increases from a minimum of 0.025 g for intensity equal to V to a maximum of 1g for intensity slightly less than XII.
The damage distributions, expressed in terms of the expected accelerations for the typological classes analysed, are reported in Figure 15.
The damage distributions show rather heterogeneous results mainly due to different types of buildings examined. It is worth noting that, for ag equal to 0.2 g, moderate damage condition (D1) is expected with an average occurrence probability of 40% for all building classes. Furthermore, when ag increases up to a maximum of 1 g, the collapse condition (D5) is expected for the class M1.2 (occurrence probability of 43%), while the partial collapse (D4) is recorded for both typological classes M3.4 and RC.1 (average probability of occurrence of 36%).

5. Conclusions

The study has analysed the seismic vulnerability of a historic sub-urban sector of Qualiano (district of Naples), having a medium to high seismicity with expected PGA values included in the range (0.15g–0.25g), using a parametric-probabilistic approach.
The inspected area is characterised by a structural heterogeneity mainly due to the different constructive techniques that occurred over the years. The characterisation of the building typological classes that are located in the investigated sub-urban sector has been done through the CARTIS form. This form has allowed for grouping buildings into given classes that, due to their construction and manufacturing features, have been considered as homogeneous. Therefore, from the in-situ survey, it has been noticed that in the examined sector buildings are made of tuff masonry structures with different floor types (timber—URM1 class—and reinforced concrete—URM2 class) and reinforced concrete ones (RC class). Subsequently, the URM1, URM2, and RC classes have been named as M1.2, M3.4, and RC.1, according to the acronyms proposed by the Building Typology Matrix of the EMS-98 scale.
Subsequently, the seismic vulnerability of the inspected area has been estimated through a survey form appropriately conceived for building aggregates. The spatial distribution of the vulnerability has been developed by means of the QGIS tool, which provides an average global vulnerability of the examined sub-sector equal to 32%. Subsequently, in order to evaluate the susceptibility at damage of the building sample, the medium vulnerability curves of building classes have been considered. Accordingly, varying the macroseismic intensity of possible earthquakes according to the EMS-98 scale, the expected damages have been estimated for different scenarios using the Gutenberg–Richter law. In particular, by means of this law, it has been possible to determine the discrete distribution of the magnitudes (Mw), selected in the range (5–7), and the relative occurrence probability. In particular, it has been noted that events with moment magnitude greater than 5.0 have a low occurrence probability.
The damage scenarios have been considered using the attenuation law in terms of seismic intensity proposed by Esteva, which proposed a direct correlation between the moment magnitude and the epicentre distance. The results obtained have shown that, for Mw = 5.0 the macroseismic intensity tends to decrease when the site-source distance increases. Contrary, for magnitudes 6.0 (detected in 1980 earthquake) and 7.0 (highest grade recorded in the Campania region) the maximum macroseismic intensity, IEMS-98 = XII, is reached and it remains as constant independently from the site-source distance considered.
On the other hand, with reference to the likely damages in the investigated urban sub-sector, it has been observed that, for moderate values of seismic intensity (IEMS-98 < X), the probable damages are moderate, but for higher values of seismic intensity (X < IEMS-98 < XII), significant damages and partial collapses of the analysed building sample should occur. Moreover, the analysis results have shown that M1.2 class buildings are those that are affected by the highest damage level.
Finally, the vulnerability increase induced by site effects has been taken into account in order to properly evaluate the seismic risk of the investigated area for developing possible interventions to reduce the building vulnerability and to safeguard the people live. Therefore, an amplification factor of 1.50 for the horizontal design spectrum has been considered to take into account the site effects of the recorded ground type with reference to the rigid soil condition. The influence of the geological conditions on the vulnerability analysis results has been shown in terms of variation of the expected damage distribution. Thus, it has been detected that local effects provides an increment of 66% of the seismic intensity, while a global vulnerability increment of 36% has been recorded for the investigated typological classes with respect to the case when the site effects are neglected.
Finally, the damage distribution in the building sample under different seismic accelerations has been carried out while taking into account the vulnerability increase due to local amplification effects. From the obtained results, it has been seen that for ag equal to 0.2 g, moderate damage condition (D1) is expected with an average occurrence probability of 40% for all building classes. Furthermore, when ag increases up to a maximum of 1 g, the collapse condition (D5) is expected for the class M1.2 (occurrence probability of 43%), while the partial collapse (D4) is recorded for both typological classes M3.4 and RC.1 (average probability of occurrence of 36%).
From the achieved results it has been noticed that site effects play an important role in the vulnerability and risk assessment of urban areas especially under low grade earthquakes. Neglecting these factors induces considerable inaccuracies in the estimation of the expected seismic damage of buildings of historical centres.
In conclusion, the analysis on the inspected sub-sector, which can be considered as representative of the totality of buildings within the municipality, can be understood as a “pilot research work”, providing insights that can be extended to the whole urban centre. However, as future research work, the proposed analysis methodology will be applied to the whole area of the Qualiano’s historical centre in order to validate the results on the pilot area.

Author Contributions

Methodology, A.F.; Investigation, N.C.; Data Curation, N.C. and A.F..; Writing-Original Draft Preparation, N.C.; Writing-Review & Editing, A.F.

Funding

This research did not receive any external funding.

Conflicts of Interest

The authors declare no conflict of interest.

References

  1. Maio, R.; Ferreira, T.M.; Vicente, R.; Estêvão, J. Seismic vulnerability assessment of historical urban centres: Case study of the old city centre of Faro, Portugal. J. Risk Res. 2016, 19, 551–580. [Google Scholar] [CrossRef]
  2. Vicente, R.; Parodi, S.; Lagomarsino, S.; Varum, H.; Silva, J.A.R.M. Seismic vulnerability and risk assessment: Case study of the historic city centre of Coimbra, Portugal. Bull. Earthq. Eng. 2011, 9, 1067–1096. [Google Scholar] [CrossRef]
  3. Kircher, C.A.; Whitman, R.V.; Holmes, W.T. HAZUS Earthquake Loss Estimation Methods. Nat. Hazards Rev. 2006, 7. [Google Scholar] [CrossRef]
  4. Porter, K.A.; Beck, J.L.; Shaikhutdinov, R. Simplified estimation of economic seismic risk for buildings. Earthq. Spectra 2004, 20, 1239–1263. [Google Scholar] [CrossRef]
  5. National Group for Protection from Earthquake GNDT. Manuale per il Rilevamento deLla vulnerabilità Sismica Degli Edifici, Istruzioni per la Compilazione Della Scheda di 2° Livello; National Group for Protection against Earthquakes GNDT: Roma, Italy, 1993. [Google Scholar]
  6. Benedetti, D.; Petrini, V. Sulla vulnerabilità si sismica di edifici in muratura: Un metodo di valutazione. L’Industria delle Costr. 1984, 149, 64–72. [Google Scholar]
  7. Formisano, A.; Florio, G.; Landolfo, R.; Mazzolani, F.M. Numerical calibration of an easy method for seismic behaviour assessment on large scale of masonry building aggregates. Adv. Eng. Softw. 2015, 80, 116–138. [Google Scholar] [CrossRef]
  8. Ferreira, T.M.; Maio, R.; Vicente, R. Analysis of the impact of large scale seismic retrofitting strategies through the application of a vulnerability-based approach on traditional masonry buildings. Earthq. Eng. Eng. Vib. 2017, 16, 329–348. [Google Scholar] [CrossRef]
  9. Formisano, A.; Chieffo, N.; Mosoarca, M. Seismic vulnerability and damage speedy estimation of an urban sector within the municipality of San Potito Sannitico (Caserta, Italy). Open Civ. Eng. J. 2017, 17, 1106–1121. [Google Scholar] [CrossRef]
  10. Formisano, A. Theoretical and Numerical Seismic Analysis of Masonry Building Aggregates: Case Studies in San Pio Delle Camere (L’Aquila, Italy). J. Earthq. Eng. 2017, 21, 227–245. [Google Scholar] [CrossRef]
  11. Giovinazzi, S.; Lagomarsino, S. A Method for the Vulnerability Analysis of Built-up areas. In Proceedings of the International Conference on Earthquake Loss Estimation and Risk Reduction, Bucharest, Romania, 24–26 October 2002. [Google Scholar]
  12. Lagomarsino, S.; Giovinazzi, S. Macroseismic and mechanical models for the vulnerability and damage assessment of current buildings. Bull. Earthq. Eng. 2006, 4, 415–443. [Google Scholar] [CrossRef]
  13. Faccioli, E.; Pessina, V.; Calvi, G.M.; Borzi, B. A study on damage scenarios for residential buildings in Catania city. J. Seismol. 1999, 3, 327–343. [Google Scholar] [CrossRef]
  14. Ambraseys, N.; Douglas, J. Near-field horizontal and vertical earthquake ground motions. Soil Dyn. Earthq. Eng. 2003, 23, 1–18. [Google Scholar] [CrossRef] [Green Version]
  15. Giovinazzi, S.; Balbi, A.; Lagomarsino, S. Un modello di vulnerabilità per gli edifici nei centri storici. In Proceedings of the XI ANIDIS, Congr. Naz. Ingegneria Sismica Ital., Genova, Italy, 25–29 January 2004. [Google Scholar]
  16. Sabatino, G. Ipotesi Storico-Urbanistiche Sull’origine e Sullo Sviluppo Della Città di Qualiano; Istituto di Studi Atellani: Casoria, Naples, Italy, 1986. [Google Scholar]
  17. Zuccaro, G.; Della Bella, M.; Papa, F. Caratterizzazione tipologico strutturali a scala nazionale. In Proceedings of the 9th National Conference ANIDIS, L’ingegneria Sismica in Italia, Torino, Italy, 20–23 September 1999. [Google Scholar]
  18. Cacace, F.; Zuccaro, G.; De Gregorio, D.; Perelli, F.L. Building Inventory at National scale by evaluation of seismic vulnerability classes distribution based on Census data analysis: BINC procedure. Int. J. Disaster Risk Reduct. 2018, 28, 384–393. [Google Scholar] [CrossRef]
  19. Mouroux, P.; Le Brun, B. Presentation of RISK-UE project. Bull. Earthq. Eng. 2006, 4, 323–339. [Google Scholar] [CrossRef]
  20. QGIS Development Team. QGIS Geographic Information System. Open Source Geospatial Foundation Project. 2014. Available online: http://qgis.osgeo.org (accessed on 26 November 2018).
  21. Formisano, A.; Mazzolani, F.M.; Florio, G.; Landolfo, R. A quick methodology for seismic vulnerability assessment of historical masonry aggregates. In Proceedings of the COST Action C26 Urban Habitat Constr. under Catastrophic Events, Naples, Italy, 16–18 September 2010. [Google Scholar]
  22. Formisano, A.; Florio, G.; Landolfo, R.; Mazzolani, F.M. Numerical calibration of a simplified procedure for the seismic behaviour assessment of masonry building aggregates. In Proceedings of the 13th International Conference on Civil, Structural and Environmental Engineering Computing, Chania, Crete, Greece, 6–9 September 2011. [Google Scholar]
  23. Grünthal, G. (Ed.) Chaiers du Centre Européen de Géodynamique et de Séismologie: Volume 15—European Macroseismic Scale 1998; European Center for Geodynamics and Seismology: Luxembourg, 1998; ISBN 2879770084. [Google Scholar]
  24. Goretti, A. The Italian contribution to the USGS PAGER project. In Proceedings of the 14th World Conference on Earthquake Engineering, Beijing, China, 12–17 October 2008. [Google Scholar]
  25. Vicente, R.; Ferreira, T.M.; Maio, R. Seismic Risk at the Urban Scale: Assessment, Mapping and Planning. Procedia Econ. Financ. 2014, 18, 71–80. [Google Scholar] [CrossRef] [Green Version]
  26. Giovinazzi, S.; Lagomarsino, S.; Pampanin, S. Vulnerability Methods and Damage Scenario for Seismic Risk Analysis as Support to Retrofit Strategies: An European Perspective. In Proceedings of the NZSEE Conference, Napier, New Zealand, 8–10 March 2006. [Google Scholar]
  27. Lagomarsino, S. On the vulnerability assessment of monumental buildings. Bull. Earthq. Eng. 2006, 4, 445–463. [Google Scholar] [CrossRef]
  28. Uva, G.; Sanjust, C.A.; Casolo, S.; Mezzina, M. ANTAEUS Project for the Regional Vulnerability Assessment of the Current Building Stock in Historical Centers. Int. J. Archit. Herit. 2016, 10. [Google Scholar] [CrossRef]
  29. Wesnousky, S.G. The Gutenberg-Richter or characteristic earthquake distribution, which is it? Bull. Seismol. Soc. Am. 1994, 84, 1940–1959. [Google Scholar]
  30. National Institute of Geophysics and Volcanology (INGV). Macroseismic Italian Database DBMI-15 release 1.5. 2015. Available online: emidius.mi.ingv.it/CPTI15-DBMI15/ (accessed on 26 November 2018). (In Italian).
  31. Lin, T.; Baker, J. Probabilistic seismic hazard deaggregation of ground motion prediction models. In Proceedings of the 5th International Conference Earthquake Geotechnical Engineering, Santiago, Chile, 10–13 January 2011. [Google Scholar]
  32. Jaimes, M.A.; Reinoso, E.; Esteva, L. Risk analysis for structures exposed to several multi-hazard sources. J. Earthq. Eng. 2015, 19, 297–312. [Google Scholar] [CrossRef]
  33. Formisano, A.; Chieffo, N. Expected seismic risk in a district of the Sant’Antimo’s historical centre. Trends Civ. Eng. its Archit. 2018, 2, 1–15. [Google Scholar]
  34. Formisano, A. Local- and global-scale seismic analyses of historical masonry compounds in San Pio delle Camere (L’Aquila, Italy). Nat. Hazards 2017, 86, 465–487. [Google Scholar] [CrossRef]
  35. Giovinazzi, S. Geotechnical hazard representation for seismic risk analysis. Bull. N. Zeal. Soc. Earthq. Eng. 2009, 42, 221–234. [Google Scholar]
  36. Ministerial Decree, D.M. Updating of Technical Standards for Construction. 2018. Available online: http://www.gazzettaufficiale.it/eli/gu/2018/02/20/42/so/8/sg/pdf (accessed on 27 September 2018).
  37. Guagenti, E.; Petrini, V. The Case of Old Buildings: Towards a New Law—Intensity Damage. In Proceedings of the 12th Italian Conference on Earthquake Engineering, ANIDIS, Italian National Association of Earthquake Engineering, Pisa, Italy, 10–14 June 1989. (In Italian). [Google Scholar]
  38. Piano Urbanistico Comunale (P.U.C). 2018. Available online: http://www.comune.qualiano.na.it (accessed on 26 November 2018).
Figure 1. (a) Geographical location of Qualiano in the Campania region of Italy; and, (b) street view of one of the main city square.
Buildings 09 00026 g001
Figure 2. The main urban sectors of Qualiano.
Buildings 09 00026 g002
Figure 3. (a) Bird-eye view and (b) numbering of buildings in the selected sub-sector of the C01 sector.
Buildings 09 00026 g003
Figure 4. The main typological classes of the examined sub-sector.
Buildings 09 00026 g004
Figure 5. Vulnerability analysis results: (a) index distribution; (b) vulnerability frequencies for each typological classes.
Buildings 09 00026 g005
Figure 6. Damage Probability Matrices (DPM) for (a) M1.2, (b) M3.4 and (c) RC.1 typological classes.
Buildings 09 00026 g006
Figure 7. Mean vulnerability curves for building samples of (a) M1.2, (b) M3.4, and (c) RC.1 typological classes.
Buildings 09 00026 g007
Figure 8. Historical earthquakes selected for the case study area [30]. (a) Piana Campana; (b) Irpinia; (c) Irpinia-Basilicata.
Buildings 09 00026 g008
Figure 9. Magnitude distribution for a specific source with a truncated Gutenberg-Richter law: (a) continuous probability density function; (b) discrete probability density function.
Buildings 09 00026 g009
Figure 10. Damage scenarios of the investigated area within the historical centre of Qualiano.
Buildings 09 00026 g010
Figure 11. Damage distribution for different epicentre distance and moment magnitude combinations.
Buildings 09 00026 g011
Figure 12. Distribution of shear waves: (a) Multichannel Analysis of Surface Waves (MASW) test result; and, (b) median value of shear velocity waves.
Buildings 09 00026 g012
Figure 13. Vulnerability distribution in the inspected area (a), corresponding vulnerability frequencies (b) and mean vulnerability curves of building classes (c).
Buildings 09 00026 g013
Figure 14. Correlation between macroseismic intensity IEMS-98 and ag.
Buildings 09 00026 g014
Figure 15. Expected damage distributions for the analysed typological classes at different values of ag. (a) M1.2; (b) M3.4; (c) RC.1.
Buildings 09 00026 g015aBuildings 09 00026 g015b
Table 1. The new vulnerability form for building aggregates.
ParametersClass Score, SiWeight, Wi
ABCD
1. Organization of vertical structures0520451.00
2. Nature of vertical structures0525450.25
3. Location of the building and type of foundation0525450.75
4. Distribution of plan resisting elements0525451.50
5. In-plane regularity0525450.50
6. Vertical regularity0525450.50–1.00
7. Type of floor0515450.75–1.00
8. Roofing01525450.75
9. Details0025450.25
10. Physical conditions0525451.00
11. Presence of adjacent building with different height−20015451.00
12. Position of the building in the aggregate−45−25−1501.50
13. Number of staggered floors01525450.50
14. Structural or typological heterogeneity among adjacent S.U.−15−100451.20
15. Percentage difference of opening areas among adjacent facades−20025451.00
Table 2. Correlation between moment magnitude, Mw, and macroseismic intensities, IEMS-98, for different epicentre distances.
Magnitude, MwMacroseismic Intensity, IEMS-98
D = 5 [Km]D = 10 [Km]D = 15 [Km]
5.0XIXIX
6.0XIIXIIXII
7.0XIIXIIXII
Table 3. Amplification factors due to site effects.
Elastic SpectrumSa [T1]C [g]Sa [T1]A [g]fag
Vertical Spectrum0.120.121.0
Horizontal Spectrum0.520.351.5
Table 4. Macroseismic intensity increase, ΔI, for different scenarios.
Magnitude, MwIncrease ΔIIncreased Macroseismic Intensity, IEMS-98 + ΔI
D = 5 [Km]D = 10 [Km]D = 15 [Km]
5.00.66XIIXIX
6.0XIIXIIXII
7.0XIIXIIXII

