Abstract
Traditionally, the emissions embodied in construction materials have not been considered important; however, they are becoming crucial due to the short time-frame in which the emissions should be reduced. Moreover, evaluating the environmental burden of construction materials has proven problematic and the reliability of the reported impact estimates is questionable. More reliable information from the construction sector is thus urgently needed to back and guide decision-making. Currently, the building sector environmental impact assessments predominantly employ commercial software with environmental impact databases and report results without knowledge about the impact of the software/database choice on the results. In this study, estimates for the embodied environmental impacts of residential construction from the two most widely used life cycle assessment (LCA) database-software combinations, ecoinvent with SimaPro software and GaBi, are compared to recognize the uniformities and inconsistencies. The impacts caused by two residential buildings of different types, a concrete-element multi-story residential building and a detached wooden house, both located in Finland, were assessed, including all building systems with a high level of detail. Based on the ReCiPe Midpoint method, fifteen impact categories were estimated and compared. The results confirm that the tool choice significantly affects the outcome. For the whole building, the difference is significant, around 15%, even in the most widely assessed category of Climate Change, and yields results that lean in different directions for the two cases. In the others, the estimates are entirely different, 40% or more in the majority of the categories and up to several thousand percentages of difference. The main conclusion is that extensive work is still urgently needed to improve the reliability of LCA tools in the building sector in order to provide reliable and trustworthy information for policy-making.
1. Introduction
The carrying capacity of our planet is limited, and the overexploitation of resources is close to causing permanent damage to the livability of the planet [1,2]. The development and operation of the built environment could play a key role in mitigation efforts. However, the transition towards more sustainable settlements requires massive use of materials and energy, be it new energy-efficient buildings or supporting infrastructures. The emissions embodied in construction materials have traditionally not been considered of high importance, but because the turn-over of the building stock is very slow and the construction of energy-efficient buildings causes more greenhouse gas (GHG) emissions than conventional buildings, the embodied emissions are actually becoming crucial due to the short time-frame in which the emissions should be reduced [3,4,5,6,7]. Tightening energy efficiency requirements in several countries also increase the relative importance of the emissions embodied in the materials.
Life cycle assessment (LCA) is a tool that can be used to evaluate the environmental load of a product, process, or activity throughout its life cycle and it has also been widely utilized, e.g., in the building sector [8], electronic devices [9], food industry [10,11,12], and waste management systems [13]. Because LCA is a data-intensive method, the availability of reliable data is a fundamental issue for the assessment [8,14].
Recently, Säynäjoki et al. [8], in a comprehensive building sector review, revealed that in general there is a huge variation in the published results which is not explicable by building characteristics but rather by the subjective choices of the LCA practitioner. One key issue, they suggest, is the choice of the LCA tool used for the assessment. Until now, comparison studies of these LCA tools have been conducted mostly on a general database level, e.g., [15], and for industry sectors other than the building industry, e.g., [16,17,18,19]. In the building sector, Takano et al. [20] compared three different LCA tools concentrating only on GHGs. Martínez-Rocamora et al. [21] conducted a broad review of the LCA databases for construction materials, but their concentration did not possess output uniformity, even though they show examples of variation in the energy and GHG estimates. However, no study has yet used actual contemporary buildings and compared them comprehensively, including all building systems, with the outputs produced by different LCA tools with different databases in different impact categories on the level of whole buildings. At the same time, there is a push among the LCA community towards reporting more impact categories utilizing broad impact scope methods such as ReCiPe [22], which has also been used in the building sector recently [23,24,25].
The aim of this study was to test the uniformity of the two most widely used LCA database-software combinations (see the review of Säynäjoki et al., [8]), called tools herein, ecoinvent with SimaPro software [26] and GaBi software-database [27], in providing estimates for the embodied environmental impacts of residential construction. Two different types of residential buildings, a concrete-element multi-story residential building and a detached wooden house, both located in Finland, were assessed to compare the estimates with buildings constructed from predominantly different materials. The buildings were not compared to one another, but the impact estimates from the two tools for each one were compared separately. The assessments were conducted in the manner of a typical practitioner, using the tool as it is without adjustments or localization, to see how significant the discrepancies potentially are in building assessments with different tools. The ReCiPe method [28] was selected due it having been recommended by the LCA community for several impact categories [29]. It has also been promoted for the quality of consistency between the midpoint and the endpoint methods [24].
It was observed that the LCA tool choice significantly affected the assessment outcome for virtually all building systems and key material categories, indicating that even when assessing many main materials, the two tools are not uniform. Outside Climate Change, the results are actually totally different. The main discrepancy source is presumably the databases in the two tools, but the software also carries some potential sources for discrepancies. The results suggest that work is urgently needed to improve the consistency of LCA databases in the building sector for LCA studies which utilize them to provide reliable information for policy-making. Currently, it seems advisable to only report Climate Change, or at least use results for other impact categories with high caution. Endpoint and single-score indicators should not be used for decision-making based on the results of this study.
The next section presents an overview of the previous comparison literature, followed by the method and case presentation sections, results, and discussion.
2. Previous LCA Comparison Studies
Previous studies have been conducted for solid waste management systems [16,17], for the packaging industry [18], for the process of desalination [19], for wine production [30], for consumer electronics [9,31], for animal production [11], for biofuel production [32] and as general comparisons [15,33,34,35]. In the building sector, several studies have compared the results on the environmental impacts of construction materials from different perspectives [14,20,21,36,37].
Forsberg and Malmborg [38] characterized five tools of The Environmental Load Profile (ELP), Eco-Quantum, BEE 1.0, BEAT 2000, and EcoEffect, in terms of the investigated dimensions: type of environmental parameters, overall purpose, system boundaries, specific objective/primary type of building, presentation of results, and the top-level aggregation of results. The authors conclude that the environmental parameters considered in all the tools are within the range of parameters normally accounted for while performing life cycle inventories. Additionally, they noted that Eco-Quantum and BEAT 2000 can present top aggregated data for building materials, construction elements, and the whole building, while BEE 1.0 presents the results only for the whole building. More recently, Silvestre et al. [35] reviewed several generic and country-specific or European average LCA datasets for construction products and then characterized them based on the methodologies, availability of data, amount of available data, type of LCA data, possibility of data contextualization by the LCA practitioner, and data verification and validation. Peereboom et al. [14] compared the results of six LCA inventory datasets for a cradle-to-gate LCA of polyvinyl chloride (PVC) and reported significant differences in the findings. Such findings emphasize the need for appropriate and explicitly described datasets and the necessity of sensitivity analyses. In 2012, Liu and Muller [39] examined the LCA literature applied in the aluminum industry to identify the strengths and weaknesses of the methodology in quantifying environmental profiles. The various studies have produced significantly different results, and the authors conclude that the variation relates not only to real-world differences (e.g., temporal and geographical characteristics) but also partly to data uncertainties and methodological choices.
Takano et al. [20] considered five databases (GaBi, ecoinvent, IBO, CFP, and Synergia) to assess the GHG emissions from the main materials of three concept buildings built for research purposes. The assessment results demonstrated a similar trend between the buildings for all the databases, but the numerical differences between the databases were quite large and the differences originated from multiple data elements. Similarly, Moncaster and Song [40] reviewed the existing European and UK standards, methodologies, databases, and software tools for the estimation of the embodied energy and carbon emissions of buildings. They detected a wide range for the data stored in the databases due to the use of diverse product data, different LCA methodologies, and different boundaries.
In 2015, Lasvaux et al. [41] assessed the numerical and methodological differences of two existing LCA databases, the ecoinvent generic database and one Environmental Product Declaration (EPD) database developed in France, for 28 building materials using Life Cycle Impact Assessment indicators of the EN 15804 standard. While indicators correlated with fossil fuel consumption, such as the abiotic depletion potential (ADP), the global warming potential (GWP), and the primary energy demand, exhibited only a deviation of approximately 25%, other indicators, such as the photochemical ozone formation (POCP), radioactive waste, and ADP elements, were found to be more variable between EPD and generic data (sometimes by more than 100%). The authors concluded that, depending on the type of environmental indicators, current generic and EPD databases can present very different values at the database scale.
Martínez-Rocamora et al. [21] collected data for building materials from 10 LCA databases in 2016. The databases were compared based on their methodology, documentation, data quality, and comprehensiveness. Despite the existence of a considerable number of databases, only a few contained data on construction materials. The comparative analysis showed that the GaBi database and ecoinvent stand out for their integrity, usability, and dedicated resources, but the study did not give numerical estimates of the variation between the databases.
Sinha et al. [36] compared a simplified environmental load profile of building structures (ELP-s) with the two leading commercial LCA software programs, GaBi and SimaPro, based on two reference buildings: (i) a concrete and (ii) a wooden building. The results showed that the estimated energy footprint obtained using ELP-s was close in value to that produced by GaBi and SimaPro, but that the carbon footprint was much lower with ELP-s. The great deviation in the carbon footprint can be explained by the lower intensity of GHG emissions per unit energy in Sweden compared with the world average or European average.
Speck et al. [37] applied the same two LCA databases (SimaPro/ecoinvent and GaBi) for simplified systems of creation and disposal of 1 kg each of four basic materials (aluminum, corrugated board, glass, and polyethylene terephthalate) to determine whether there were significant differences in the results. Data files and impact assessment methodologies (Impact 2002+, ReCiPe, and TRACI 2) were identical. Differences in reported impacts of greater than 20% for at least one of the four materials were found for 9 of the 15 categories in Impact 2002+, 7 of the 18 categories in ReCiPe, and four of the nine categories in TRACI2. In all the examined cases, a difference in the characterization factors used by the two programs was the cause of the differing results.
Overall, the previous literature has suggested significantly different LCA results across all construction and building sectors. From the perspective of our study, the factors identified in these studies to explain the wide results range can be summarized in the following four points:
- Differences in the software/databases, such as different characterization factors, data sources, and locations for case data and assessment scope differences.
- Lack of transparency and accuracy in the definition of the goal and scope of the study, as well as the absence of essential sensitivity and uncertainty analyses.
- Wrong contextualization due to lack of expertise, or too light contextualization, such as energy-mix adjustment [36,42].
- Lack of regular updating of the databases [38,40] and a verification procedure for the data [43].
So far, however, there are no LCA tool comparison studies with actual existing buildings in the building sector literature. Thus, no estimates exist on how significant the differences in the estimates given by different tools are when assessing the different environmental impacts caused by a specific building.
3. Methods and Research Process
3.1. LCA
This study followed the ISO 14040:2006 standard for conducting an LCA [44] except for a sensitivity analysis, which was omitted due to added complexity and low added value with regards to the aim of this study. LCA aims to capture all the direct and indirect environmental impacts related to the production, transport, use, and end-of-life of a product, service or process [45,46]. LCA has become the main method of environmental assessments in the building sector (see e.g., the review of Säynäjoki et al. [8]). There are two main approaches to LCA: process LCA and input-output LCA, and their combinations are called hybrid LCAs (e.g., [47,48]). Of these, process LCA is the method employed in this study, mainly because it is predominantly held as the more accurate approach of the two for the quality of tracking the actual processes and material and energy flows related to the production and delivery chain and the use and end-of-life of the studied object [8], whereas input–output LCA operates typically with monetary flows. However, input–output LCA, due to the monetary flow basis, inherently includes a more comprehensive system boundary than process LCA, particularly in including capital goods and overheads (e.g., [47]). Hybrid methods can thus achieve both qualities of high accuracy and comprehensive coverage [48,49,50,51]. However, since process LCA is still the most widely utilized approach in the building sector [8], the method chosen for this study is justified.
3.2. Utilized LCA Tools
Two of the most widely utilized LCA software-database combinations in the building sector, SimaPro/ecoinvent [26] and GaBi [27], were utilized in the assessments. The software provides the user interface, the environmental information database, and the options for the impact assessment method for the LCA practitioner. In SimaPro, several databases are available, the most widely utilized of which in the building sector is ecoinvent [8]. GaBi includes its own building and construction sector database, and both software packages provide several impact assessment method options. The GaBi version used was 6.4.1.20 (Compilation), with database version 6.108. The SimaPro version 8.0.5.13 with the ecoinvent 3.0 database was employed. Only the existing processes were used and no tailoring according to the actual life cycles of different materials was done. An attributional approach with no credits for the end-of-life use was selected to capture the impacts induced at the time of construction, or until the beginning of the use phase.
3.3. Life Cycle Impact Assessment Method
The ReCiPe method [28] was utilized in the impact assessment with both GaBi and SimaPro/ecoinvent. In particular, of the ReCiPe Midpoint method (e.g., [24]), fifteen categories were included in the study. The reason for choosing the Midpoint method was that when stepping into the endpoint method or even into using a single-score indicator, there is a high variation in the understanding of how to assess the different impact categories [22]. Furthermore, comparisons on individual impact categories like those conducted in this study can only be done on the Midpoint level.
3.4. Goal and Scope Definition
The main objective of the study was to compare the estimates from two LCA tools for the embodied environmental impacts of materials used in two actual buildings; a concrete-frame multi-story residential building and a detached wooden house. All building systems were included and assessed with a high level of detail following Heinonen et al. [23] who depicted how the cutoff errors in certain impact categories can be tens of percentages for many commonly omitted parts like the electrical system or fixed furniture.
In the ReCiPe method, there are 18 impact categories [28]. However, GaBi doesn’t provide information for three of these: Agricultural land occupation, Urban land occupation, and Natural land transformation. Thus, fifteen impact categories were covered in the analysis: Climate Change (kg CO2 eq), Ozone Depletion (g CFC-11 eq), Terrestrial Acidification (kg SO2 eq), Freshwater Eutrophication (g P eq), Marine Eutrophication (kg N eq), Human Toxicity (kg 1-DB eq), Photochemical Oxidant Formation (kg NMVOC), Particulate Matter Formation (kg PM10 eq), Terrestrial Ecotoxicity (kg 1,4-DB eq), Freshwater Ecotoxicity (kg 1,4-DB eq), Marine Ecotoxicity (kg 1,4-DB eq), Ionizing Radiation (kg U235 eq), Water Depletion (m3), Metal Depletion (kg Fe eq), and Fossil Depletion (kg oil eq). The functional unit utilized in this study was one square meter of gross floor area in both case studies.
3.5. System Boundaries
Pre-use life cycle stages according to the standard EN 15804 [52] were included in the study. For the concrete building, the system boundary included the modules A1–A5: A1 “raw material supply”, A2 “processing phase transport”, A3 “production of construction materials”, A4 “transportation to the construction site” and A5 “construction site activities”. Due to data limitations for the wooden house, the system boundary only covers three modules of A1–A3.
3.6. Case Studies
Two case buildings located in Southern Finland and representing current typical residential construction in Finland were selected for the study. Below, the buildings are presented including information about the utilized construction materials.
3.6.1. Multi-story Concrete Element Apartment Building, Pyry
The first building is a typical contemporary concrete element low-energy apartment building, built in the new residential area of Härmälänranta in Tampere, Finland, in 2012. The building, named Pyry, has 28 apartments and altogether 3085 m2 of gross floor area. Following the Finnish Building Classification System Talo2000 (Building2000) [53], the building includes eight systems. In this study, materials used in all except the first system (which covers earth and groundwork) are included, (see Heinonen et al. [23] for a detailed description). Table 1 presents the eight building systems split according to the main materials in each system.

Table 1.
The eight main building systems of Pyry and the main materials in each system (modified from a table published in Heinonen et al. [23]).
The bill of quantities was provided by the contracting company Skanska, following the Finnish Building Classification System Talo2000 (Building2000) [53], including the distribution of approximately 700 items. Some material quantities were calculated based on building drawings (see Heinonen et al. [23] for details).
The current study encompasses close to 100% of all the construction materials and construction site energy and materials, and the assessment has been updated. Only the items not listed in the bill of quantities fall outside of the scope of this study, like screws and nails, plus the site preparation and the external environment: site clearing, excavation, and driveways and parking lot. All waste from the site was incinerated for energy, which was also excluded from the assessment.
3.6.2. Detached Wooden House, KÄPYLÄ 149E
The detached wooden house is called KÄPYLÄ 149E and has been designed by Design Talo [54], which provided the bill of quantities. The house is currently being built in Espoo Finland. It has two floors and a gross floor area of 149 m2 (each floor about 75 m2). The analysis covered the materials utilized in all parts of the primary and secondary structure of the wooden low-energy detached house; foundation, frame and roof structure, cladding, roof equipment, rainwater system, walls, floors, exterior and interior cover materials, all insulation materials, electrical system, heating, ventilation and air conditioning (HVAC), and complementary work such as windows and external doors. The internal doors and finishes such as the sauna, partition walls, painting, home appliances, and fixed inventory are not included. Installation tools like screws, tapes, and similar objects with no major influence were not assessed. Table 2 presents the eight building systems split of KÄPYLÄ along with the main materials in each system.
Table 2.
The eight main building systems of KÄPYLÄ and the main materials in each system.
The life-cycle inventory data for analysis is taken from the bill of quantities provided by the company. These quantities were converted to the different utilized materials according to descriptions and drawings provided by the company. As with Pyry, some material quantities, such as electrical and plumbing systems, were added to the list of materials based on the material requirement calculations of the authors. In the assessment, it was not always possible to find the exact material or product in the databases. In such a case, the material that was the best fit to the inventory data was selected.
3.7. Assessment
The assessment with both SimaPro and GaBi was conducted following a typical approach; by selecting the best matching sectors from the two databases for each material/building component without any adjustments to take into account the actual production location. While a good LCA practice would call for this localization or contextualization [36,42], it commonly is not done and would be extremely difficult to do for impact categories other than for GHGs due to the high workload and weak data availability. Thus, the assessments conducted in this study represent well the prevailing code of conduct in the field of building LCAs. Next, in Section 4.1, we present first the overall assessment results and then in Section 4.2. we look deeper into them using the above-described split of eight main building systems, and finally, in Section 4.3, we show the distributions based on key material categories. In Section 4.3, we also discuss the issue of some of the reference material differences in the two databases, and all the sector choices with reference location information are given in the Supplementary Information (SI), Tables S1 and S2.
4. Results
4.1. Building Level Result Comparison
Overall, the estimates in the different impact categories vary hugely between the two tools. There is some consistency though, as the differences somewhat follow the same pattern for the two case buildings, as depicted in Figure 1a,b showing GaBi estimates when SimaPro is set as 100 for each impact category. However, despite the similar overall pattern, the estimates in the different impact categories are predominantly still far apart, as shown in Table 3. Furthermore, for uniformity between the two tools, Figure 1a,b should show a steady line of bars near the 100 level. For both cases, only Climate Change gets consistently relative similar estimates by the two tools, although the GaBi result for Pyry is still 16% below the estimate from SimaPro/coinvent and 13% higher for KÄPYLÄ.
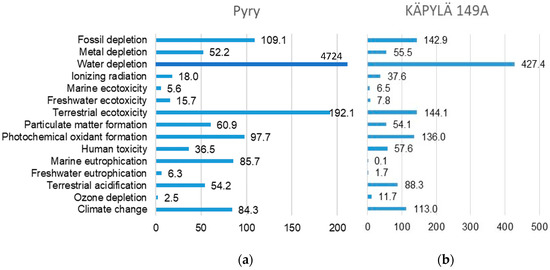
Figure 1.
(a,b): Assessment results for Pyry and KÄPYLÄ, GaBi estimates when SimaPro = 100.
Table 3.
Assessment results per square meter from GaBi and SimaPro in absolute and relative terms in the fifteen impact categories.
Interestingly, the GaBi assessment returned overall lower estimates, often significantly lower, as depicted in Figure 1. For Pyry, the estimates were lower in all categories, except in Terrestrial Ecotoxicity, Water Depletion, and Fossil Depletion. From this perspective, the two tools give relatively similar results. For KÄPYLÄ, the same three categories have higher estimates, plus Photochemical Oxidant Formation and Climate Change, which have only slightly lower estimates from GaBi for Pyry. Table 3 presents the absolute results per square meter for the two buildings. In the next section, we look at the results for the different building systems showing that the similarities detected here are mostly just a result of building system-level differences and thus cancel out each other.
4.2. Impacts by Building Systems
Figure 2 reveals the breakdowns of fifteen environmental impacts of Pyry by the building systems shown in Table 1 and Table 2. It appears that the relatively similar overall results shown in Table 3 for Marine Eutrophication and Fossil Depletion impact is due to building-system-level differences canceling out each other. Generally, there is little consistency between the tools, except for GaBi returning lower values. For Climate Change, the category for which the highest consistency was expected, the main difference with Pyry related to the most concrete and steel-intensive system, Frame and Roof Structures, and could be particularly traced down to a much higher coinvent intensity for reinforcing steel. With KÄPYLÄ, see Figure 3, the estimates by GaBi and SimaPro/coinvent are comparable for most of the building systems, and the relative difference is not more than 20% except for Complementary Works. The main overall difference relates to the Climate Change impact of windows.
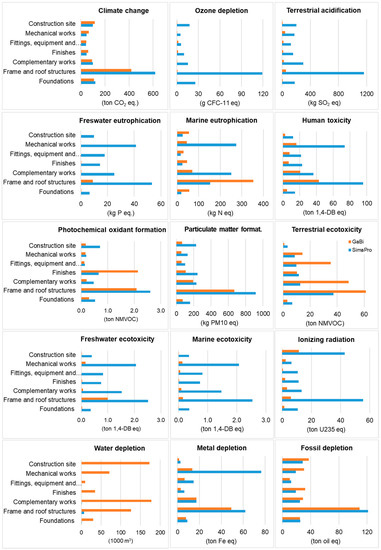
Figure 2.
Breakdowns of 15 environmental impacts of Pyry by building system.
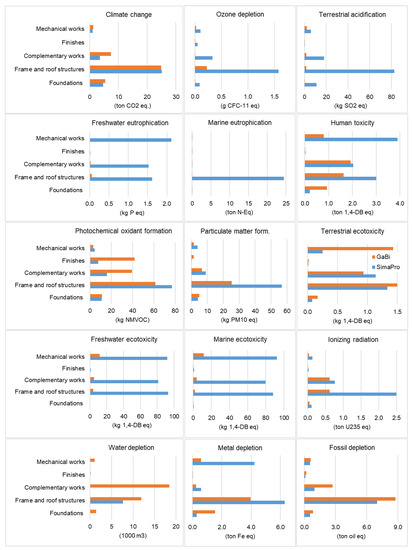
Figure 3.
Breakdowns of 15 environmental impacts of KÄPYLÄ by building system.
For Ozone Depletion, Terrestrial Acidification, Freshwater Eutrophication, Marine Ecotoxicity, and Ionizing Radiation, the two tools give estimates of completely different magnitudes. For Human Toxicity, the relative split is similar for Pyry, but GaBi systematically returns four-fold lower results. For KÄPYLÄ, the same is not true, indicating that it is only with some materials that there is any consistency.
In some categories, the result variation can be traced down to suspiciously different impact intensities in the two software packages. For example, for MDF material in Marine Eutrophication, the intensities are 0.53 kg N eq/m3 in GaBi and 18,911.44 kg N eq/m3 in SimaPro, and for Electricity (Finnish grid mix) the Water Depletion intensities are 1.74 in SimaPro and 878 × 10−4 in GaBi (m3).
In all the other impact categories the differences relate to practically each system group.
4.3. Impacts by Materials
Another perspective to the uniformity of the results provided by the two LCA tools is achieved by looking at the output based on material types. Following Heinonen et al. [23] we separate seven material type categories: Concrete and Cement Products, Steel and Other Metals, Wood, Plastic and Oil Products, Glass, Bricks and Tiles, and Other, plus Fuels and On-Site Energy and Transport for Pyry. This analysis reveals if the result discrepancies detected on the whole-building level and on the building-system level actually derive from individual materials, or if discrepancies exist through all main materials.
It is detected that there is little uniformity in the results for different material groups. Even for the most basic material categories, Concrete and Cement Products and Steel and Other Metals, the results for different impact categories vary significantly. This can be seen in Table 4 and Table 5, in which the rows show the impact categories and the results for both GaBi and Simapro/ecoinvent in each impact category. The columns show the seven material categories, Energy and Fuels, and Transport. The significant inconsistency between the two tools for the different material groups means that instead of certain individual key materials being the reason for the overall output differences, the results produced by the two tools are significantly different throughout all the materials. When looking at the two tables by rows, meaning the weights of different material groups within each impact category, again only the Climate Change impact category and the closely related Fossil Depletion show uniformity.
Table 4.
Comparison for Pyry of the importance of different material categories, Transport and On-Site Energy in the 15 impact categories between SimaPro/ecoinvent and GaBi. The weight of each category shown in %.
Table 5.
Comparison for KÄPYLÄ of the importance of different material categories in the 15 impact categories between SimaPro/ecoinvent and GaBi. Weight of each category shown in %.
The considerable differences in the results are partially due to the fact that, despite careful selection of the most compatible material from the database, the reference materials are not always exactly the same (see full sector selection tables for both case studies in Tables S1 and S2). More importantly, however, the production processes and potentially the characterization factors are different in GaBi and SimaPro/ecoinvent, resulting in different intensities for the reference materials even in such cases where the material is the same. As examples, the intensity of Water Depletion for traditional concrete (Concrete, normal, at plant) in ecoinvent is 3.52 m3/m3 and 70 m3/m3 (Ready-mix concrete C30_37 (EN15804 A1–A3)) in GaBi when converted to the same unit, and in Freshwater Eutrophication 0.0052 gPe/kg for reinforcing steel (Steel rebar, blast furnace and electric arc furnace route, production mix, at plant) in ecoinvent and 0.0013 gPe/kg (Steel rebar) in GaBi. In Marine Eutrophication, the huge difference for fiberboard, an important material in the KÄPYLÄ house, explains the totally different distribution in Table 5. In SimaPro/ecoinvent the intensity is 1.89 tNe/m3 (Medium density fiberboard) whereas in GaBi the intensity is 0.53 kgNe/m3 (medium-density wood fiberboard). The differences in these magnitudes can be found throughout the utilized sectors.
Tables S1 and S2 specify the reference country for each material. One of the potential contributors to the differences between the estimated impacts from two LCA databases relates to the differences in the reference country and, particularly, the energy mix for electricity generation in the reference countries. However, it is virtually impossible currently for the LCA practitioner to localize/contextualize an assessment for impact categories other than Climate Change, and thus this is typically not done—often not even for Climate Change.
5. Discussion
Considering the gap in the literature for a comparative analysis of full-scale case studies in the building sector, this study was set to investigate the impact of assessment tool choice on the results when assessing the pre-use phase emissions of two recently built typical residential buildings in Finland; a multi-story residential building and a detached wooden house. The two most widely used LCA databases with the typical software to run them, SimaPro/ecoinvent and GaBi, were selected for the comparison. Both buildings were assessed as if both tools were used independently of each other; using the best fitting sectors/processes case by case. Only the existing processes were used with both tools. Two perspectives were analyzed; key building systems and key material categories.
The results indicate that the two assessment tools return mostly completely different estimates at the level of the whole building, but also for each building system and material category separately, in virtually all impact categories. Nonetheless, in both cases, the similarity in the estimates concerning Climate Change impacts was significant, as was expected; the estimate with GaBi was 16% lower than that obtained with SimaPro for the Pyry apartment and 13% higher for the KÄPYLÄ house. The consistency in the results for Climate Change was previously observed by Takano et al. [20].
The main contribution of this study is in showing the huge estimated discrepancies for all the 15 ReCiPe impact categories available in both SimaPro/ecoinvent and GaBi in the building context. No such previous comparisons have been done and thus no previous benchmarks exist. At the same time, it has been highlighted that there is a gap in the building sector literature in reporting impact categories other than Climate Change [55]. An even more direct push towards such reporting has been advocated as well [22]. Based on this study, however, it seems advisable for practitioners to report only Climate Change, or at least use the results very carefully for any other impact categories. It is also advisable not to use the endpoint indicators or the single-score indicator in ReCiPe for decision-making. This study does not provide support for choosing between the two tools since based on the results it is impossible to compare which one returns more accurate results, or if either one does. The results carry further practical value as well. For example, in decision-making informed with data from LCA, the decision-maker should understand that all LCA results should come from the same database for the results to be comparable between cases, for example when asking for tenders.
The current study was conducted in the manner of a typical practitioner, using only the existing processes from the two LCA tools, without modifying the processes according to the actual production and delivery chain of each material or building item. This leads to a potentially significant error source, as the processes included in the two tools do not (and cannot) represent “general conditions”, but those particular for a certain process. Different energy systems, transport distances and modes, steps in the production and delivery chain, among other factors, can lead to significant differences in the impact estimate for a certain process even when there are no errors [15] and the impact assessment methods are compatible. This approach was still selected for this study as it is the main way of conducting LCAs in the building sector [8]. Also, when looking at the different impact categories and the push towards including multiple impact categories, data for contextualizing an assessment is rarely available for impact categories other than Climate Change and Energy. Some examples of sectors with different reference countries and large unit impact differences in the Climate Change category are Silicone compound and Timber pine from Germany, which are based on a GaBi database and have twice the impact of silicone products from Europe and Sawn timber from Switzerland, estimated by SimaPro/ecoinvent. Furthermore, the impacts of wooden window frame from Europe and brass from Switzerland estimated by SimaPro/ecoinvent are more than three times the impact of wooden window frames from Germany and brass components (EU27 average) estimated by GaBi. We only looked at Climate Change since the results, in general, indicate that with other impact categories the differences relate much more to issues other than these contextual differences.
There are many other reasons that may explain the considerable differences between the results obtained from GaBi and SimaPro. One of the main reasons relates to methodological issues, such as a lack of transparency and accuracy in the definition of the goal and scope of the study, as well as the absence of essential sensitivity and uncertainty analyses. Despite careful selection of the most compatible materials from the database, the reference materials are not the same, but more importantly, the production processes are different in GaBi and SimaPro, resulting in different intensities for the reference materials. According to Baitz et al. [42], another key factor is the wrong contextualization due to a lack of expertise. The authors argue that one of the main contributors relates to the differences in the reference country and, particularly, the energy mix for electricity generation in the reference countries. However, realistic contextualization requires more than just an adjustment of the energy mixes. It is necessary to collect detailed information on the elements used in various building systems and then try to select the material from LCA databases that is the most suitable.
As was shown in Section 2, various studies have produced significantly different results across all sectors. Thus, as suggested by Anand and Amor [43], a key challenge is to develop a benchmark or a verification procedure in order to compare LCA results. Finally, the efforts towards regularly updating the database and development of freely available tools with high-quality data should be encouraged [38,40].
There are significant uncertainties in the presented study which should be kept in mind when interpreting the findings. First, only two cases were included, which means that the generalizability is low, but according to the case study method philosophy, even one case is enough to identify potential issues and hypothesizing theories [56]. Moreover, if similar findings are reached in new case studies, a theory becomes stronger and stronger. In our study, we purposefully selected two completely different types of buildings to see if findings were similar or not, and based on the results we received, it seems that the inconsistencies between the two compared tools expand beyond a single building type. Secondly, the results are not exactly the emissions embodied in the two case buildings. Since no localization was done, the actual production conditions, technologies, and the resulting emissions can be different from those in the employed databases even though the two buildings are newly built and both represent typical contemporary residential construction in Finland. However, this is the common way of conducting an LCA study in the building sector and is thus valid for comparison as in this study. Table S1 shows the locations where the database sectors apply, or across which area they represent the average.
Since the aim of the study was to test the output uniformity of the two selected tools, we did not present an in-depth analysis of the roots of the discrepancies. In Section 4.3, we showed some examples of how there are significant differences in the contents of the two databases. The sources can be divided into two; differences in the LCA information for the same materials in the two databases, and differences in the best available material sector available in the databases in comparison to the actual material used in the building. While this is the most important source, the software themselves for various reasons might not have produced exactly the same output even if the databases were equal. It is also possible that the details of the impact assessment methods, for example the characterization factors, are not the same for each impact category, particularly in the categories in which new information can lead to significant sudden changes [57]. The next step in studying the discrepancies in the building context should include a detailed analysis of the root sources for the discrepancies found.
6. Conclusions
This study has demonstrated with two actual buildings how the estimates from the two most widely utilized LCA tools are incompatible for all studied impact categories other than Climate Change. The main conclusion is that without further development of the assessment methods and the databases, the results should not be utilized to support decision-making, except for Climate Change results. Similarly, it is not encouraged to use endpoint indicators or single-score indicators at all if the different impacts cannot be localized/contextualized according to the actual production and delivery chains of different components. Even then, it should be carefully tested if the outcome is similar for different buildings and when the processes are adjusted to the actual production places and technologies, transport distances, etc.
At the same time, ReCiPe has been said to reflect the current opinion of the LCA community about what and how to report [22], but in the light of this study there seem to be severe problems in how to interpret the findings in the building sector. Related to this issue, ReCiPe has also been promoted for its quality of accommodating the endpoint, said to be consistent with the midpoint, and single-score assessments [24]. However, calculating the endpoint and single-score results with the two LCA tools could potentially lead to very different outcomes, it appears.
Additionally, there are several limitations associated with process LCA. The main deficiency of the method is the inherent truncation or cutoff error [47] due to the boundary selection. Not all the upstream processes can be tracked and included, and particularly, the shared processes are often left out, especially those related to capital goods like production facilities. Thus, even when the scope is claimed as comprehensive, excluding only negligible processes, the actual cutoff error can be of a magnitude of tens of percentages [47,58,59], and in this regard, the published LCA studies carry relatively low transparency [8]. Säynäjoki et al. [59] show how important the cutoff error can be even when not considering the capital goods (like production facilities and machinery) and other shared processes. The problem is that in any certain assessment, the magnitude of the cutoff error is very difficult to assess, particularly when assessing a wide variety of different impact categories. Finally, the materials and products in the available databases can, in fact, be quite different from the assessment object, both due to different production conditions but also the material not being exactly the same as utilized in the case building. Heinonen et al. [23] and Säynäjoki et al. [8] bring up the question of the “first tier truncation”, meaning that when only the materials for a certain building component, such as a window or an elevator, are assessed, the assessment omits all the emissions from the final processing stages when the materials are processed and assembled into the final product.
The next step in gaining a better understanding of the sources of the huge variations in the building-level results, as depicted by this study, would be to look into the sectors with the largest intensity differences in the two databases. Learning about the sources would give important information for both LCA practitioners and policy-makers in the building sector. The “first tier truncation” should also be studied further in the context of buildings which include numerous pre-fabricated products, which in the current LCA practice are mainly included only as material quantities. One potential way forward could be the utilization of a hybrid LCA approach to overcome the truncation error and get more accurate estimates of the actual emissions embodied in buildings [48,49,50,51]. Thus far, the available tools don’t include as wide a variety of impact categories as process LCA databases, but in light of this study, the reliability of the results in categories other than Climate Change is low in any case.
Supplementary Materials
The following are available online at https://www.mdpi.com/2075-5309/9/1/20/s1, Table S1: KÄPYLÄ 149A GaBi and SimaPro sector choices, Table S2: Pyry GaBi and SimaPro sector choices.
Author Contributions
Conceptualization, J.H., N.E. and B.M.; Methodology, N.E.; Software, N.E.; Validation, J.H., B.M., S.J. and A.S.; Formal Analysis, N.E.; Investigation, N.E.; Resources, J.L.; Writing-Original Draft Preparation, N.E.; Writing-Review & Editing, J.H., B.M., S.J. and A.S.; Visualization, J.H.; Supervision, J.H. and B.M.; Project Administration, J.H.; Funding Acquisition, J.H.
Funding
This research was funded by Landsvirkjun (The National Power Company in Iceland).
Conflicts of Interest
The authors declare no conflict of interest.
References
- Rockström, J.; Steffen, W.; Noone, K.; Persson, Å.; Chapin, F.S.; Lambin, E.; Lenton, T.M.; Scheffer, M.; Folke, C.; Schellnhuber, H.J.; Nykvist, B.; et al. Planetary boundaries: Exploring the safe operating space for humanity. Ecol. Soc. 2009, 14. [Google Scholar] [CrossRef]
- Steffen, W.; Richardson, K.; Rockström, J.; Cornell, S.; Fetzer, I.; Bennett, E.; Biggs, R.; Carpenter, S. Planetary boundaries: Guiding human development on a changing planet. Science 2015, 348, 1217. [Google Scholar] [CrossRef] [PubMed]
- Säynäjoki, A.; Heinonen, J.; Junnila, S. A scenario analysis of the life cycle greenhouse gas emissions of a new residential area. Environ. Res. Lett. 2012, 7, 34037. [Google Scholar] [CrossRef]
- Blengini, A.B.; Di Carlo, T. Energy-saving policies and low-energy residential buildings: An LCA case study to support decision makers in Piedmont (Italy). Int. J. Life Cycle Assess. 2010, 15, 652–665. [Google Scholar] [CrossRef]
- Chastas, P.; Theodosiou, T.; Bikas, D. Embodied energy in residential buildings - towards the nearly zero energy building: A literature review. Build. Environ. 2016, 105, 267–282. [Google Scholar] [CrossRef]
- Stephan, A.; Crawford, R.; de Myttenaere, K. A comprehensive assessment of the life cycle energy demand of passive houses. Appl. Energy 2013, 112, 23–34. [Google Scholar] [CrossRef]
- Crawford, R.H.; Bartak, E.L.; Stephan, A.; Jensen, C.A. Evaluating the life cycle energy benefits of energy efficiency regulations for buildings. Renew. Sustain. Energy Rev. 2016, 63, 435–451. [Google Scholar] [CrossRef]
- Säynäjoki, A.; Heinonen, J.; Junnila, S.; Horvath, A. Can life-cycle assessment produce reliable policy guidelines in the building sector? Environ. Res. Lett. 2017, 12, 13001. [Google Scholar] [CrossRef]
- Arushanyan, Y.; Ekener-Petersen, E.; Finnveden, G. Lessons learned - Review of LCAs for ICT products and services. Comput. Ind. 2014, 65, 211–234. [Google Scholar] [CrossRef]
- Amani, P.; Schiefer, G. Review on suitability of available LCIA methodologies for assessing environmental impact of the food sector. Int. J. Food Syst. Dyn. 2011, 2, 194–206. [Google Scholar]
- De Boer, I.J.M. Environmental impact assessment of conventional and organic milk production. Livest. Prod. Sci. 2003, 80, 69–77. [Google Scholar] [CrossRef]
- Roy, P.; Nei, D.; Orikasa, T.; Xu, Q.; Okadome, H.; Nakamura, N.; Shiina, T. A review of life cycle assessment (LCA) on some food products. J. Food Eng. 2009, 90, 1–10. [Google Scholar] [CrossRef]
- Nyland, C.A.; Modahl, I.S.; Raadal, H.L.; Hanssen, O.J. Application of LCA as a decision-making tool for waste management systems. Int. J. Life Cycle Assess. 2003, 8, 331–336. [Google Scholar] [CrossRef]
- Peereboom, E.C.; Kleijn, R.; Lemkowitz, S.; Lundie, S. Influence of Inventory Data Sets on Life-Cycle Assessment Results: A Case Study on PVC. J. Ind. Ecol. 1999, 2, 109–130. [Google Scholar] [CrossRef]
- Herrmann, I.T.; Moltesen, A. Does it matter which Life Cycle Assessment (LCA) tool you choose?—A comparative assessment of SimaPro and GaBi. J. Clean. Prod. 2015, 86, 163–169. [Google Scholar] [CrossRef]
- Brogaard, L.K.; Damgaard, A.; Jensen, M.B.; Barlaz, M.; Christensen, T.H. Evaluation of life cycle inventory data for recycling systems. Resour. Conserv. Recycl. 2014, 87, 30–45. [Google Scholar] [CrossRef]
- Laurent, A.; Clavreul, J.; Bernstad, A.; Bakas, I.; Niero, M.; Gentil, E.; Christensen, T.H.; Hauschild, M.Z. Review of LCA studies of solid waste management systems—Part II: Methodological guidance for a better practice. Waste Manag. 2014, 34, 589–606. [Google Scholar] [CrossRef]
- Verghese, K.; Lewis, H.; Fitzpatrick, L. Selecting and Applying Tools. In Packaging for Sustainability; Springer: London, UK, 2012; pp. 251–283. [Google Scholar] [CrossRef]
- Zhou, J.; Chang, V.W.C.; Fane, A.G. Life Cycle Assessment for desalination: A review on methodology feasibility and reliability. Water Res. 2014, 61, 210–223. [Google Scholar] [CrossRef]
- Takano, A.; Winter, S.; Hughes, M.; Linkosalmi, L. Comparison of life cycle assessment databases: A case study on building assessment. Build. Environ. 2014, 79, 20–30. [Google Scholar] [CrossRef]
- Martínez-Rocamora, A.; Solís-Guzmán, J.; Marrero, M. LCA databases focused on construction materials: A review. Renew. Sustain. Energy Rev. 2016, 58, 565–573. [Google Scholar] [CrossRef]
- Dahlbo, H.; Koskela, S.; Pihkola, H.; Nors, M.; Federley, M.; Seppälä, J. Comparison of different normalised LCIA results and their feasibility in communication. Int. J. Life Cycle Assess. 2013, 18, 850–860. [Google Scholar] [CrossRef]
- Heinonen, J.; Saynajoki, A.; Junnonen, J.M.; Poyry, A.; Junnila, S. Pre-use phase LCA of a multi-story residential building: Can greenhouse gas emissions be used as a more general environmental performance indicator? Build. Environ. 2016, 95, 116–125. [Google Scholar] [CrossRef]
- Dong, Y.; Ng, S. Comparing the midpoint and endpoint approaches based on ReCiPe. A study of commercial buildings in Hong Kong. Int. J. Life Cycle Assess. 2014, 19, 1409–1423. [Google Scholar] [CrossRef]
- Dong, Y.H.; Ng, S.T. A life cycle assessment model for evaluating the environmental impacts of building construction in Hong Kong. Build. Environ. 2015, 89, 183–191. [Google Scholar] [CrossRef]
- PRé Consultants, 2012. SimaPro. Available online: https://www.pre-sustainability.com/ (accessed on 10 March 2018).
- PE-international, 2015. GaBi: Product Sustainability Software. Version 6.0. Available online: http://www.gabi-software.com (accessed on 10 March 2018).
- Goedkoop, M.; Heijungs, R.; Huijbregts, M.; De Schryver, A.; Struijs, J.; ZelmR, V. ReCiPe 2008. A Life Cycle Impact Assessment Method Which Comprises Harmonised Category Indicators at the Midpoint and the Endpoint Level. May 2013. Available online: https://www.researchgate.net/publication/302559709_ReCiPE_2008_A_life_cycle_impact_assessment_method_which_comprises_harmonised_category_indicators_at_the_midpoint_and_the_endpoint_level (accessed on 10 January 2019).
- European Commission-Joint Research Centre-Institute for Environment and Sustainability: International Reference Life Cycle Data System (ILCD) Handbook-Recommendations for Life Cycle Impact Assessment in the European Context; First Edition November 2011. EUR 24571 EN; Publications Office of the European Union: Luxemburg, 2011.
- Rugani, B.; Vazquez-Rowe, I.; Benedetto, G.; Benetto, E. A comprehensive review of carbon footprint analysis as an extended environmental indicator in the wine sector. J. Clean. Prod. 2013, 54, 61–77. [Google Scholar] [CrossRef]
- Andrae, A.S.G.; Andersen, O. Life cycle assessments of consumer electronics—Are they consistent? Int. J. Life Cycle Assess. 2010, 15, 827–836. [Google Scholar] [CrossRef]
- Shonnard, D.R.; Klemetsrud, B.; Sacramento-Rivero, J.; Navarro-Pineda, F.; Hilbert, J.; Handler, R.; Suppen, N.; Donovan, R.P. A Review of Environmental Life Cycle Assessments of Liquid Transportation Biofuels in the Pan American Region. Environ. Manag. 2015, 56, 1356–1376. [Google Scholar] [CrossRef]
- Rice, G.; Clift, R.; Burns, R. Comparison of currently available European LCA software. Int. J. Life Cycle Assess. 1997, 2, 53–59. [Google Scholar] [CrossRef]
- Ren, Z.M.; Su, D.Z. Comparison of Different Life Cycle Impact Assessment Software Tools. Key Eng. Mater. 2013, 572, 44–49. [Google Scholar] [CrossRef]
- Silvestre, J.D.; Lasvaux, S.; Hodková, J.; de Brito, J.; Pinheiro, M.D. Native LCA—A systematic approach for the selection of environmental datasets as generic data: Application to construction products in a national context. Int. J. Life Cycle Assess. 2015, 20, 731–750. [Google Scholar] [CrossRef]
- Sinha, R.; Lennartsson, M.; Frostell, B. Environmental footprint assessment of building structures: A comparative study. Build. Environ. 2016, 104, 162–171. [Google Scholar] [CrossRef]
- Speck, R.; Selke, S.; Auras, R.; Fitzsimmons, J. Life Cycle Assessment Software: Selection Can Impact Results. J. Ind. Ecol. 2016, 20, 18–28. [Google Scholar] [CrossRef]
- Forsberg, A.; Von Malmborg, F. Tools for Environmental Assessment of the Built Environment. Build. Environ. 2004, 39, 223–228. [Google Scholar] [CrossRef]
- Liu, G.; Muller, D.B. Addressing sustainability in the aluminum industry: A critical review of life cycle assessments. J. Clean. Prod. 2012, 35, 108–117. [Google Scholar] [CrossRef]
- Moncaster, A.M.; Song, J.-Y. A comparative review of existing data and methodologies for calculating embodied energy and carbon of buildings. Int. J. Sustain. Build. Technol. 2012, 3, 26–36. [Google Scholar] [CrossRef]
- Lasvaux, S.; Habert, G.; Peuportier, B.; Chevalier, J. Comparison of generic and product-specific Life Cycle Assessment databases: Application to construction materials used in building LCA studies. Int. J. Life Cycle Assess. 2015, 20, 1473–1490. [Google Scholar] [CrossRef]
- Baitz, M.; Albrecht, S.; Brauner, E.; Broadbent, C.; Castellan, G.; Conrath, P.; Fava, J.; Finkbeiner, M.; Fischer, M.; Fullana, I.; et al. LCA’s theory and practice: Like ebony and ivory living in perfect harmony? Int. J. Life Cycle Assess. 2013, 18, 5–13. [Google Scholar] [CrossRef]
- Anand, C.K.; Amor, B. Recent developments, future challenges and new research directions in LCA of buildings: A critical review. Renew. Sustain. Energy Rev. 2017, 67, 408–416. [Google Scholar] [CrossRef]
- ISO. ISO 14040. In Environmental Management-Life Cycle Assessment-Principles and Framework; ISO: Geneva, Switzerland, 2006. [Google Scholar] [CrossRef]
- Crawford, R. Life Cycle Assessment in the Built Environment; Spon Press: London, UK, 2011. [Google Scholar]
- Klöpffer, W. Life Cycle Assessment: From the Beginning to the Current State. Environ. Sci. Pollut. Res. 1997, 4, 223–228. [Google Scholar] [CrossRef]
- Suh, S.; Lenzen, M.; Treloar, G.J.; Hondo, H.; Horvath, A.; Huppes, G.; Jolliet, O.; Klann, U.; Krewitt, W.; Moriguchi, Y.; et al. System boundary selection in life-cycle inventories using hybrid approaches. Environ. Sci. Technol. 2004, 38, 657–664. [Google Scholar] [CrossRef]
- Crawford, R.H.; Bontinck, P.-A.; Stephan, A.; Wiedmann, T.; Yu, M. Hybrid life cycle inventory methods—A review. J. Clean. Prod. 2018, 172, 1273–1288. [Google Scholar] [CrossRef]
- Pomponi, F.; Lenzen, M. Hybrid life cycle assessment (LCA) will likely yield more accurate results than process-based LCA. J. Clean. Prod. 2018, 176, 210–215. [Google Scholar] [CrossRef]
- Stephan, A.; Crawford, R.H.; Bontinck, P.-A. A model for streamlining and automating path exchange hybrid life cycle assessment. Int. J. Life Cycle Assess. 2018. [Google Scholar] [CrossRef]
- Majeau-Bettez, G.; Strømman, A.H.; Hertwich, E.G. Evaluation of process- and input-output-based life cycle inventory data with regard to truncation and aggregation issues. Environ. Sci. Technol. 2011, 45, 10170–10177. [Google Scholar] [CrossRef] [PubMed]
- U.S. Green Building Council. EN 15804:2012+A1 Sustainability of Construction Works. Environmental Product Declarations. In Core Rules for the Product Category of Construction Products; U.S. Green Building Council: Atlanta, GA, USA, 2012. [Google Scholar]
- The Building Information Foundation RTS. Classification of Building Materials; Rakennustieto Publishing: Helsinki, Finland, 2015. [Google Scholar]
- Design Talo, 2017. KÄPYLÄ 149E [WWW Document]. Available online: https://designtalo.fi/ (accessed on 3 May 2017).
- Khasreen, M.M.; Banfill, P.F.G.; Menzies, G.F. Life-cycle assessment and the environmental impact of buildings: A review. Sustainability 2009, 1, 674–701. [Google Scholar] [CrossRef]
- Eisenhardt, K.; Graebner, M. Theory Building from Cases: Opportunities and Challenges. Acad. Manag. J. 2007, 50, 25–32. [Google Scholar] [CrossRef]
- Laurent, A.; Olsen, S.I.; Hauschild, M.Z. Normalization in EDIP97 and EDIP2003: Updated European inventory for 2004 and guidance towards a consistent use in practice. Int. J. Life Cycle Assess. 2011, 16, 401–409. [Google Scholar] [CrossRef]
- Lenzen, M.; Dey, C.J. Economic, energy and greenhouse emissions impacts of some consumer choice, technology and government outlay options. Energy Econ. 2002, 24, 377–403. [Google Scholar] [CrossRef]
- Säynäjoki, A.; Heinonen, J.; Junnonen, J.-M.; Junnila, S. Input–output and process LCAs in the building sector: Are the results compatible with each other? Carbon Manag. 2017, 8, 155–166. [Google Scholar]


© 2019 by the authors. Licensee MDPI, Basel, Switzerland. This article is an open access article distributed under the terms and conditions of the Creative Commons Attribution (CC BY) license (http://creativecommons.org/licenses/by/4.0/).