Article

Evaluating the Impact of the Morphological Transformation of Urban Sites on the Urban Thermal Microenvironment

1
School of Architecture and Urban Planning, Huazhong University of Science and Technology, Wuhan 430074, China
2
Green Architecture Research Center, School of Architecture and Urban Planning, Huazhong University of Science and Technology, Luoyu Road 1037, Wuhan 430074, China
*
Author to whom correspondence should be addressed.
Buildings 2018, 8(12), 182; https://doi.org/10.3390/buildings8120182
Submission received: 13 October 2018 / Revised: 10 December 2018 / Accepted: 10 December 2018 / Published: 18 December 2018

Abstract

:
Tropical cities currently face issues of climate change resulting from rapid urbanization and the impact of urban morphological transformations on the microclimate. The analysis of urban physical forms and patterns is a realisticmethodfor quantifying these impacts. This work examined the impact of morphological transformations of an urban site in Wuhan, China, on the microthermal environment at different time periods. We also quantified and compared the impact of four urban site morphologies on ambient air temperature. The morphological changes of the study site were inferred from Google Earth images acquired at different time points in 2006 and 2013. ENVI-met simulation software was used to compare the changes in temperature at the selected site by specific date. The year- and time-based analysis of existing urban morphologies and their impact on the microurban thermal environment shows that the overall minimum and maximum values of morning and afternoon ambient air temperature are nearly the same for the 2013 and 2006 morphologies. The maximum temperature difference was observed in the afternoon (14:00), with an average difference of approximately 2 °C in the east. The findings of this research could provide a useful guide for optimizing the transformation of urban site planning and design and a suitable method for assessing the impact of built-up areas on the environment.

1. Introduction

1.1. Background

The greater part of the global population currently live in urban regions; currently, 75% of the world’s population live in industrialized nations [1]. Rapid urbanization during the 21st Century has negatively affected microclimatic conditions and increased air temperature in urban areas [2]. Progressive changes in urban morphological characteristics, specifically the replacement of natural surfaces with rough materials such as concrete and asphalt, have resulted in the storage and re-emittance of solar radiation in urban spaces. Consequently, air temperatures in urban microenvironments have increased [3,4]. The microclimates of cities and urban areas in developing countries are greatly affected by constant urbanization [5]. The rate of urban expansion in tropical developing countries is constantly increasing, with an average expected increment of 1 million people per year [6].
In urban areas, the gradual loss of vegetation and green areas has decreased the cool air surrounding vegetated areas due to evapotranspiration [7]. The increase in air temperature affects thermal comfort in outdoor environments [8]. Guaranteed thermal comfort in outdoor environments is necessary for the performance of daily human activities. Climatic conditions that are unsuitable for humans affect the social and economic aspects of urban areas. Given that the heat island effect, which increases ambient air temperature (Tair), influences human thermal comfort and health conditions [9,10], it must be reduced through the appropriate use of urban spaces and materials [11]. Many mitigation strategies can be usedto solve the heat island effect. These strategies includethe use of materials with high albedo coefficients and surfaces with evapotranspiration properties and the planting of vegetation and trees [12,13]. Several modeling studies have been conducted on the cooling effects of green roofs in urban areas [14]. These studies aimed to verify whether the adopted approach can control the microclimatic impacts of the thermophysical properties of surface materials. Thus, they required advanced tools and software to assess the microclimatic factors of a particular site. A number of studies on the urban impacts on climate have been reported in climatology [15].

1.2. Microclimatic Approach

Outdoor urban spaces must provide thermally comfortable conditions [16]. In the past few years, city planners, urban designers, and engineers have begun to use the microclimatic approach to develop sites with high thermal comfort. Given the complexity of microclimates, investigating them requires the physical modeling of outdoor urban environments, which include factors that influence each other. Physical experiments on microclimates are expensive in terms of time and resources. Therefore, three-dimensional (3D) modeling simulations are the most suitable measures for predicting and improving the microclimatic characteristics of urban and outdoor spaces [16,17,18]. Microclimate simulation software, which assesses surface–plant–air interactions and their impacts on the microclimates of different urban morphologies, have received increasing research interest [19]. Adaptation and quantification strategies for microclimate improvement, such as the planning, design, and installation of urban green spaces, have recently gained scientific attention [20,21].

1.3. ENVI-Met Modeling

Several studies have used ENVI-met models to evaluate the effects of urban characteristics on microclimates [22]. The present study aims to investigate the microclimatic impacts of the morphological transformation of urban areas. We analyzed the microclimatic effect of an existing urban site and the feasibility of replacing existing building roofs with green roofs to ameliorate high ambient air temperature (Tair). Specifically, the impact of urban site transformation on outside ambient air temperature (Tair) is examined by using ENVI-met software. ENVI-met is one of the most commonly usedprogramsforassessing the impact of urban morphology on environmental variables and microclimate [23,24]. It requires a model and input parameters to ensure proper simulation of real phenomena. Therefore, this work focuses on the accurate evaluation of the urban morphological impact on microclimate at a specific day and time by using input parameters derived from the climatic data of the region. Previous studies have used the ENVI-met differentiation model to investigate the potential of neighborhood green spaces to reduce surface temperatures [17]. The ENVI-met model allows comparisons at the block or neighborhood scale and can develop vegetation profiles that are specific to a local climate [25]. The present study aims to investigate microclimate amelioration at a specific urban site and focuses on the impacts of urban morphological transformation on the surrounding thermal environment. Furthermore, the effects of two proposed green roof types on Tair are observed. The results of this research are expected to provide valuable knowledge for future green space strategies that can be implemented at sites with characteristics and climatic conditions similar to those of the study site.

1.4. Study Area

We take Wuhan, the capital of Hubei Province, as the study area. Its geological position is 113°41′–115°05′E and 29°58′–31°22′N. It is located in the hinterlands of China, at the intersection of the Changjiang (Yangtze) and Hanshui Rivers (Figure 1). Wuhan City has 13 districts, and we selected Wuchang District to illustrate the climactic impacts of rapid changes in urban characteristics.

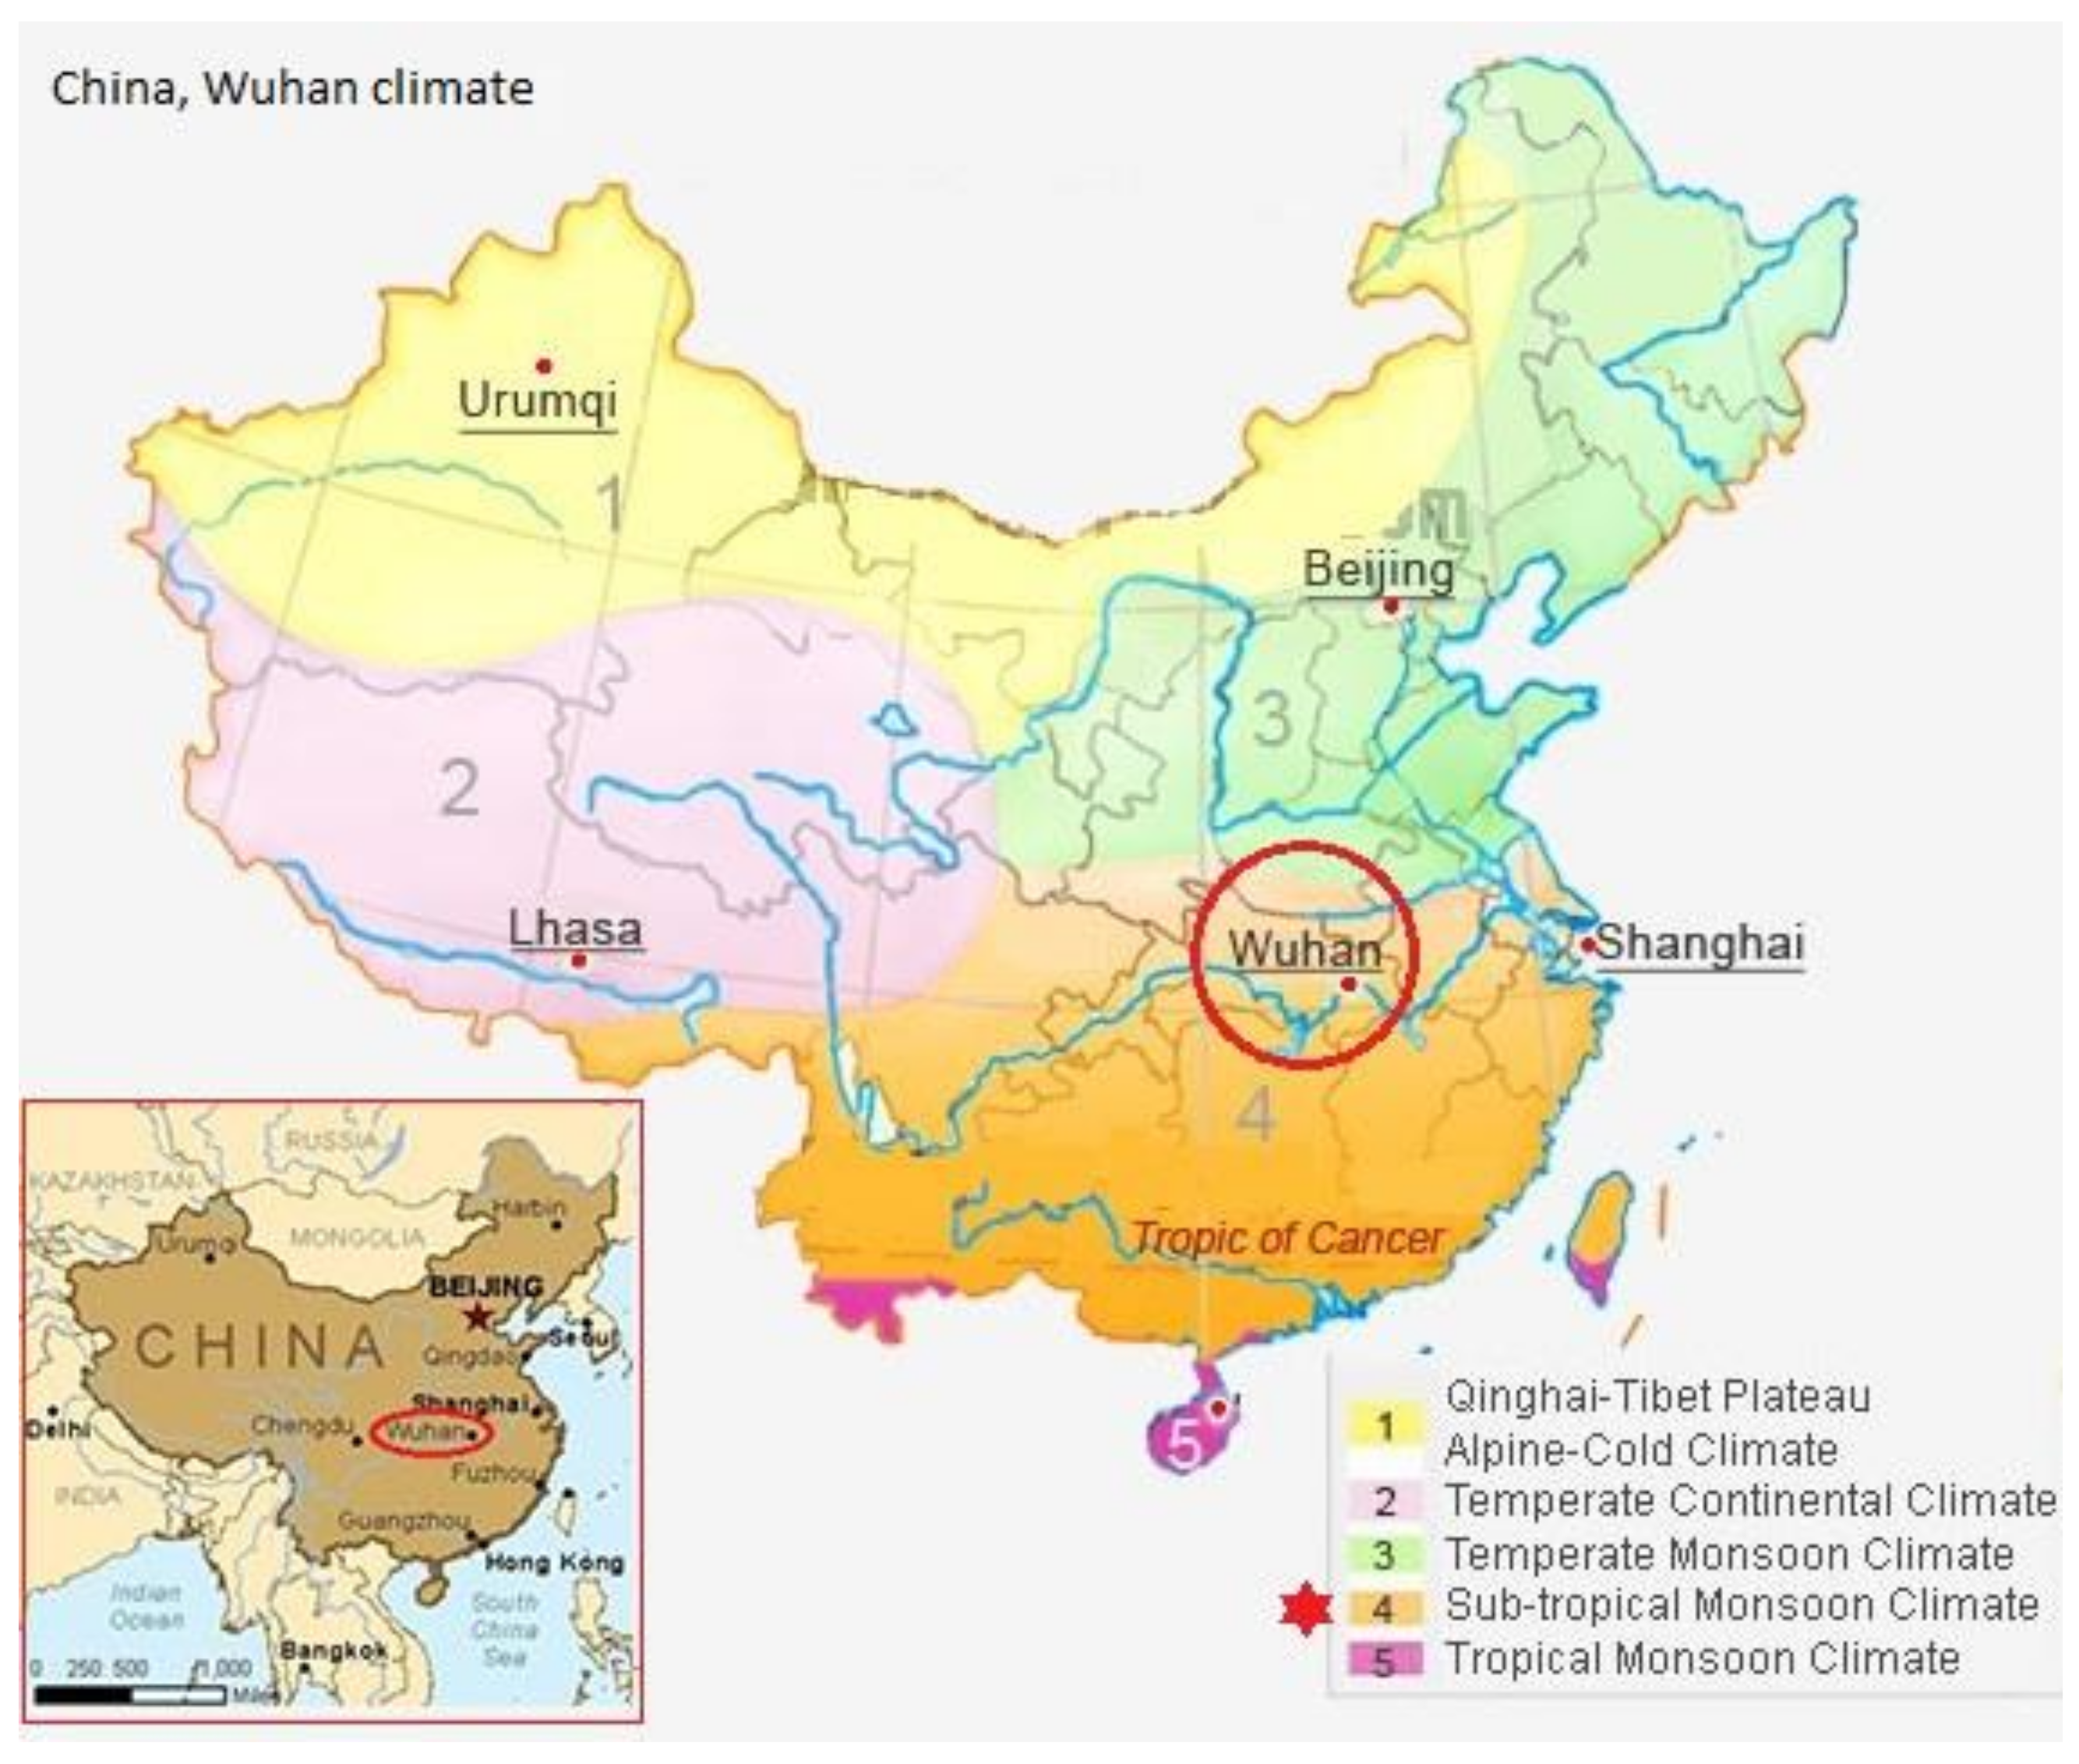
1.5. Climate of Wuhan

Wuhan has a semitropical-like climate, with four clear seasons and abundant precipitation, mostly in June, July, and August. The summers are hot, oppressive, wet, and mostly cloudy, and the winters are very cold and mostly clear. The temperature typically varies from 1 to 33 °C and is rarely below −2 °C or above 36 °C [26]. Meteorological data obtained from weather websites are given in Table 1. The simulated climate information has a spatial resolution of around 30 km and might not reflect all local weather results, for example, thunderstorms, local winds, and tornadoes. The climatic data and geographical coordinates of research are the basis of 30.583° latitude and 114.267° longitude. Moreover, within 3 km in Wuhan,87% of the land is covered by artificial surfaces and 11% is water [27].

2. Research Method

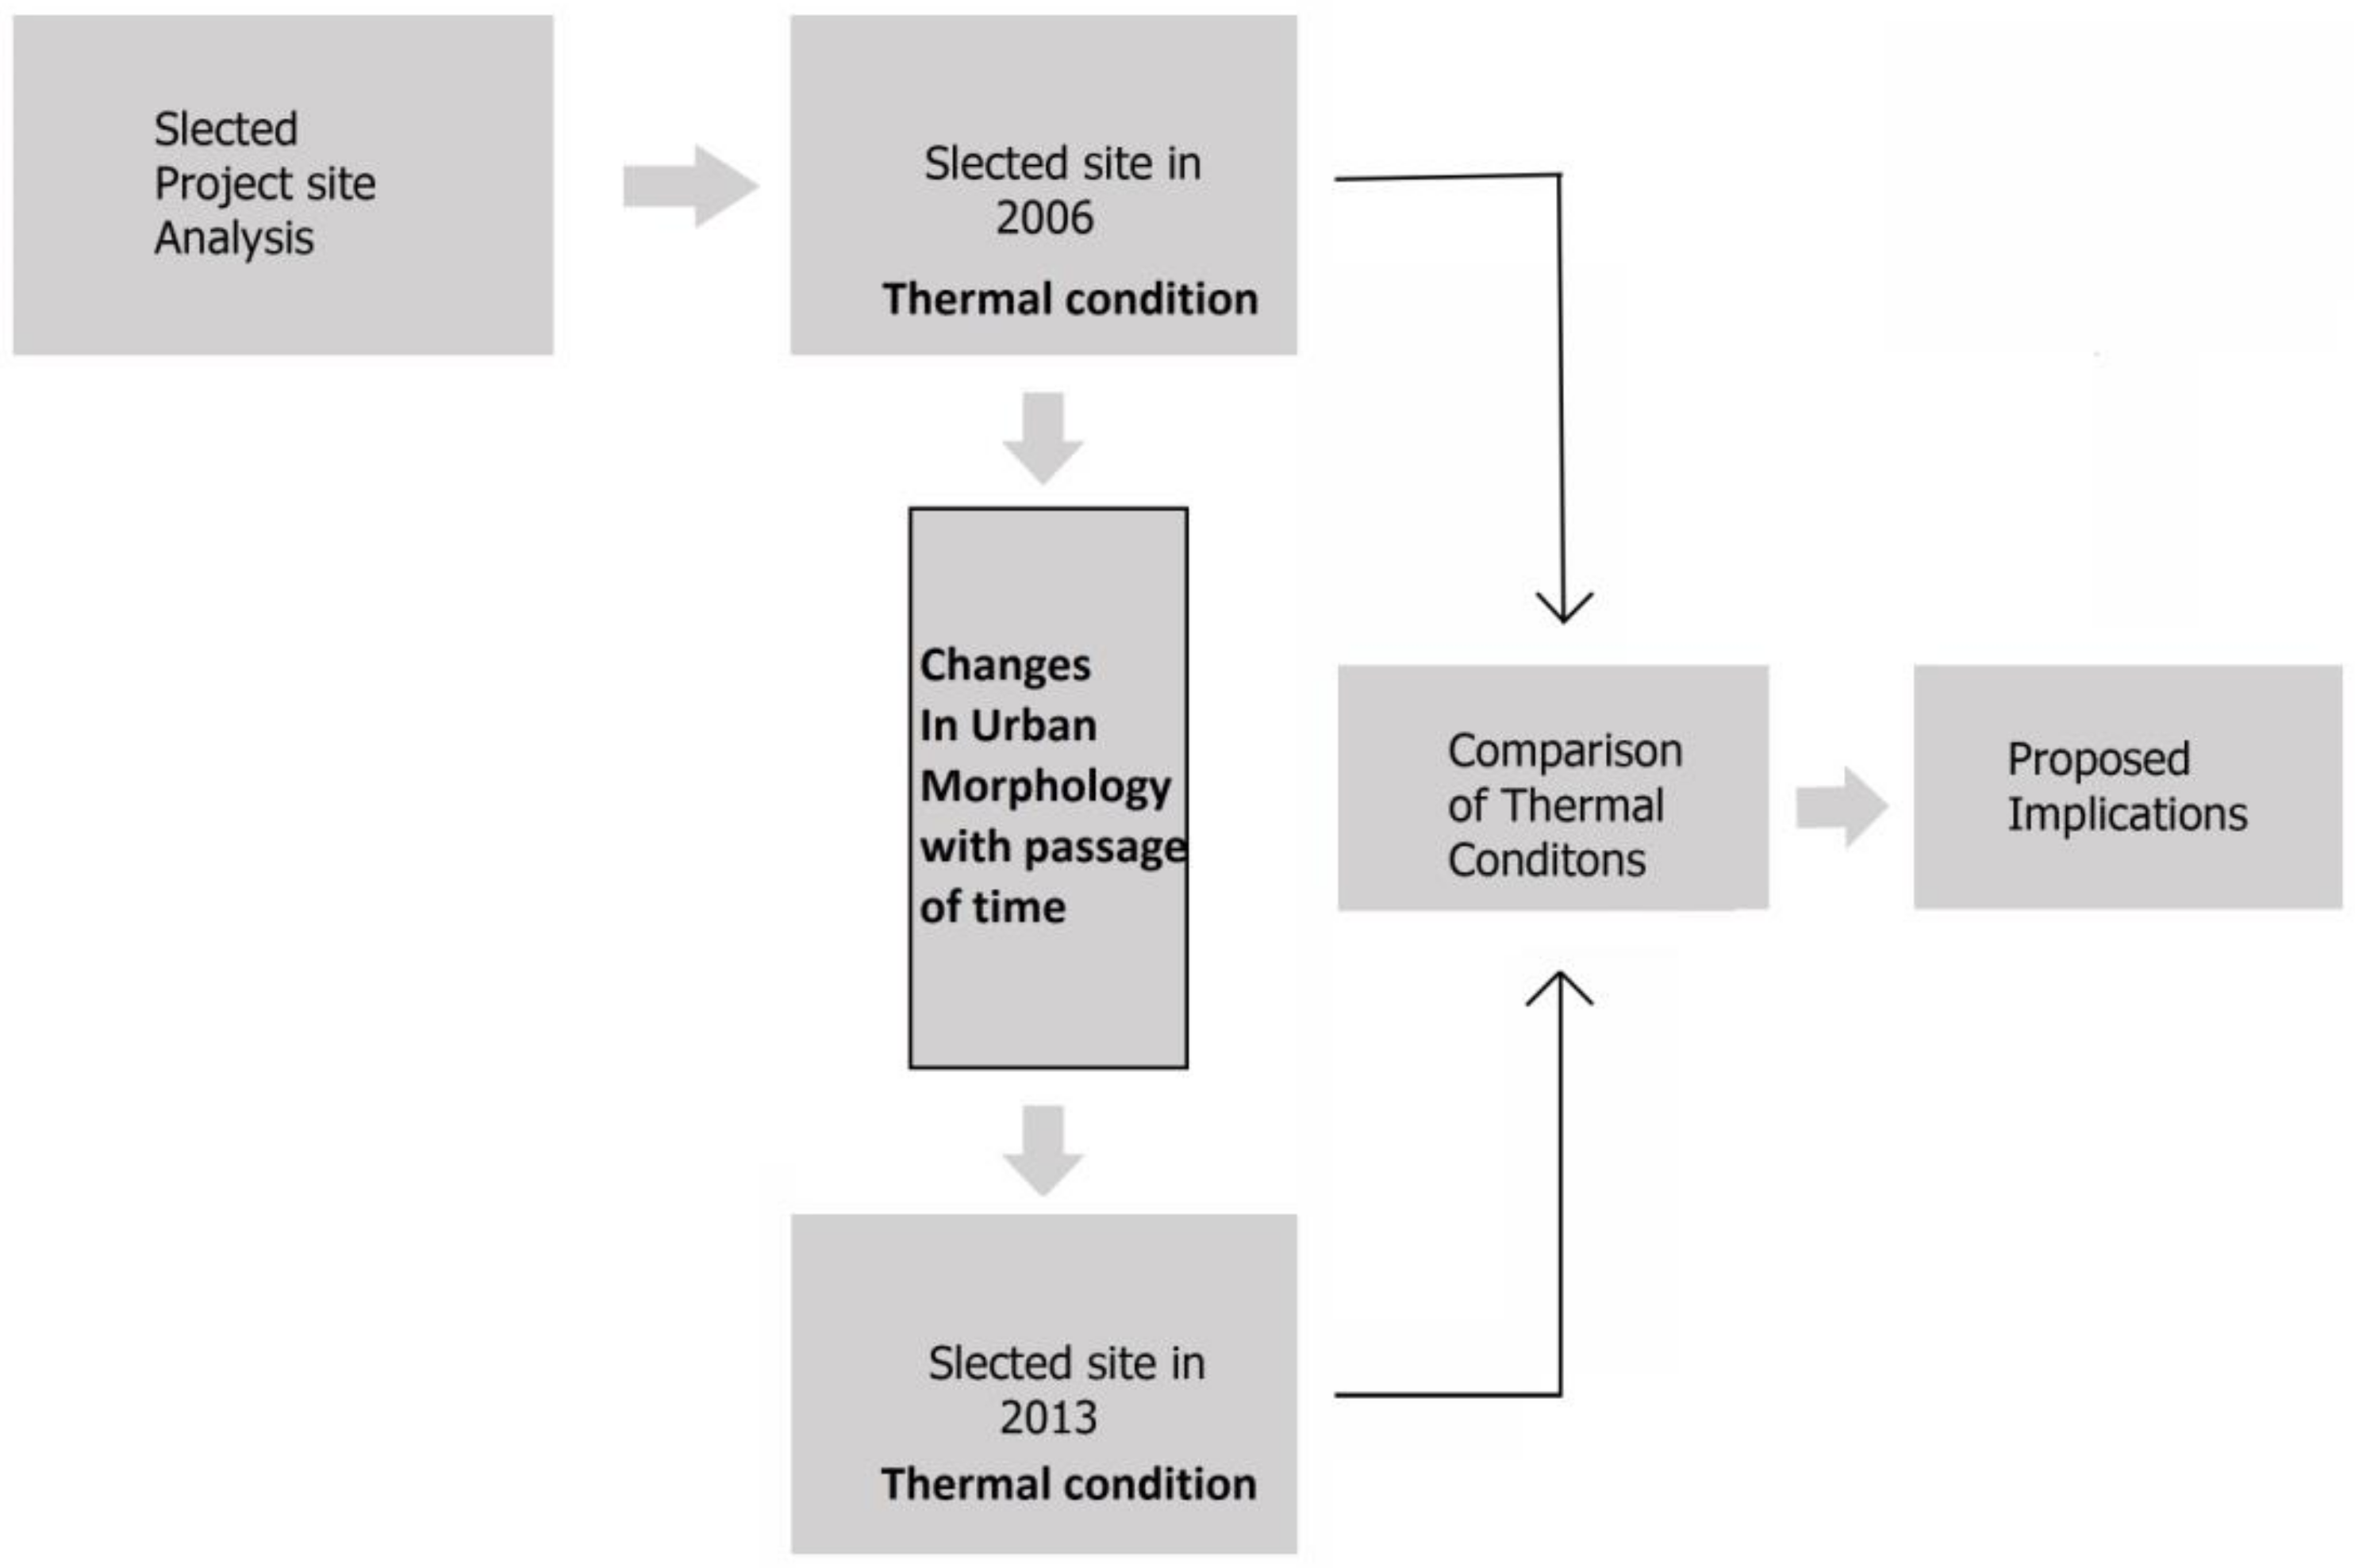
2.1. Study Flow Steps

First, an urban site undergoing morphological transformation was selected as the study area. The 2006 morphology of the site was selected for microclimatic analysis. To identify morphological changes, Google Earth images of the study site atdifferent periods were retrieved. The morphological transformations from 2006 to 2013 were considered. ENVI-met software was used to assess and compare the thermo-climatic impacts of the morphological changes of the study site under the same climatic conditions. The simulations for Tair evaluation under previous and present conditions were obtained on 30 July using ENVI-met (Leonardo) results. Finally, the proposed green strategies for the 2013 building typology were used to determine the thermal difference and microclimatic impacts contributed by existing concrete roofs. The effects on the amelioration of Tair at the same day and time by the proposed strategies were also simulated. The study included the following steps, as shown in Figure 2.

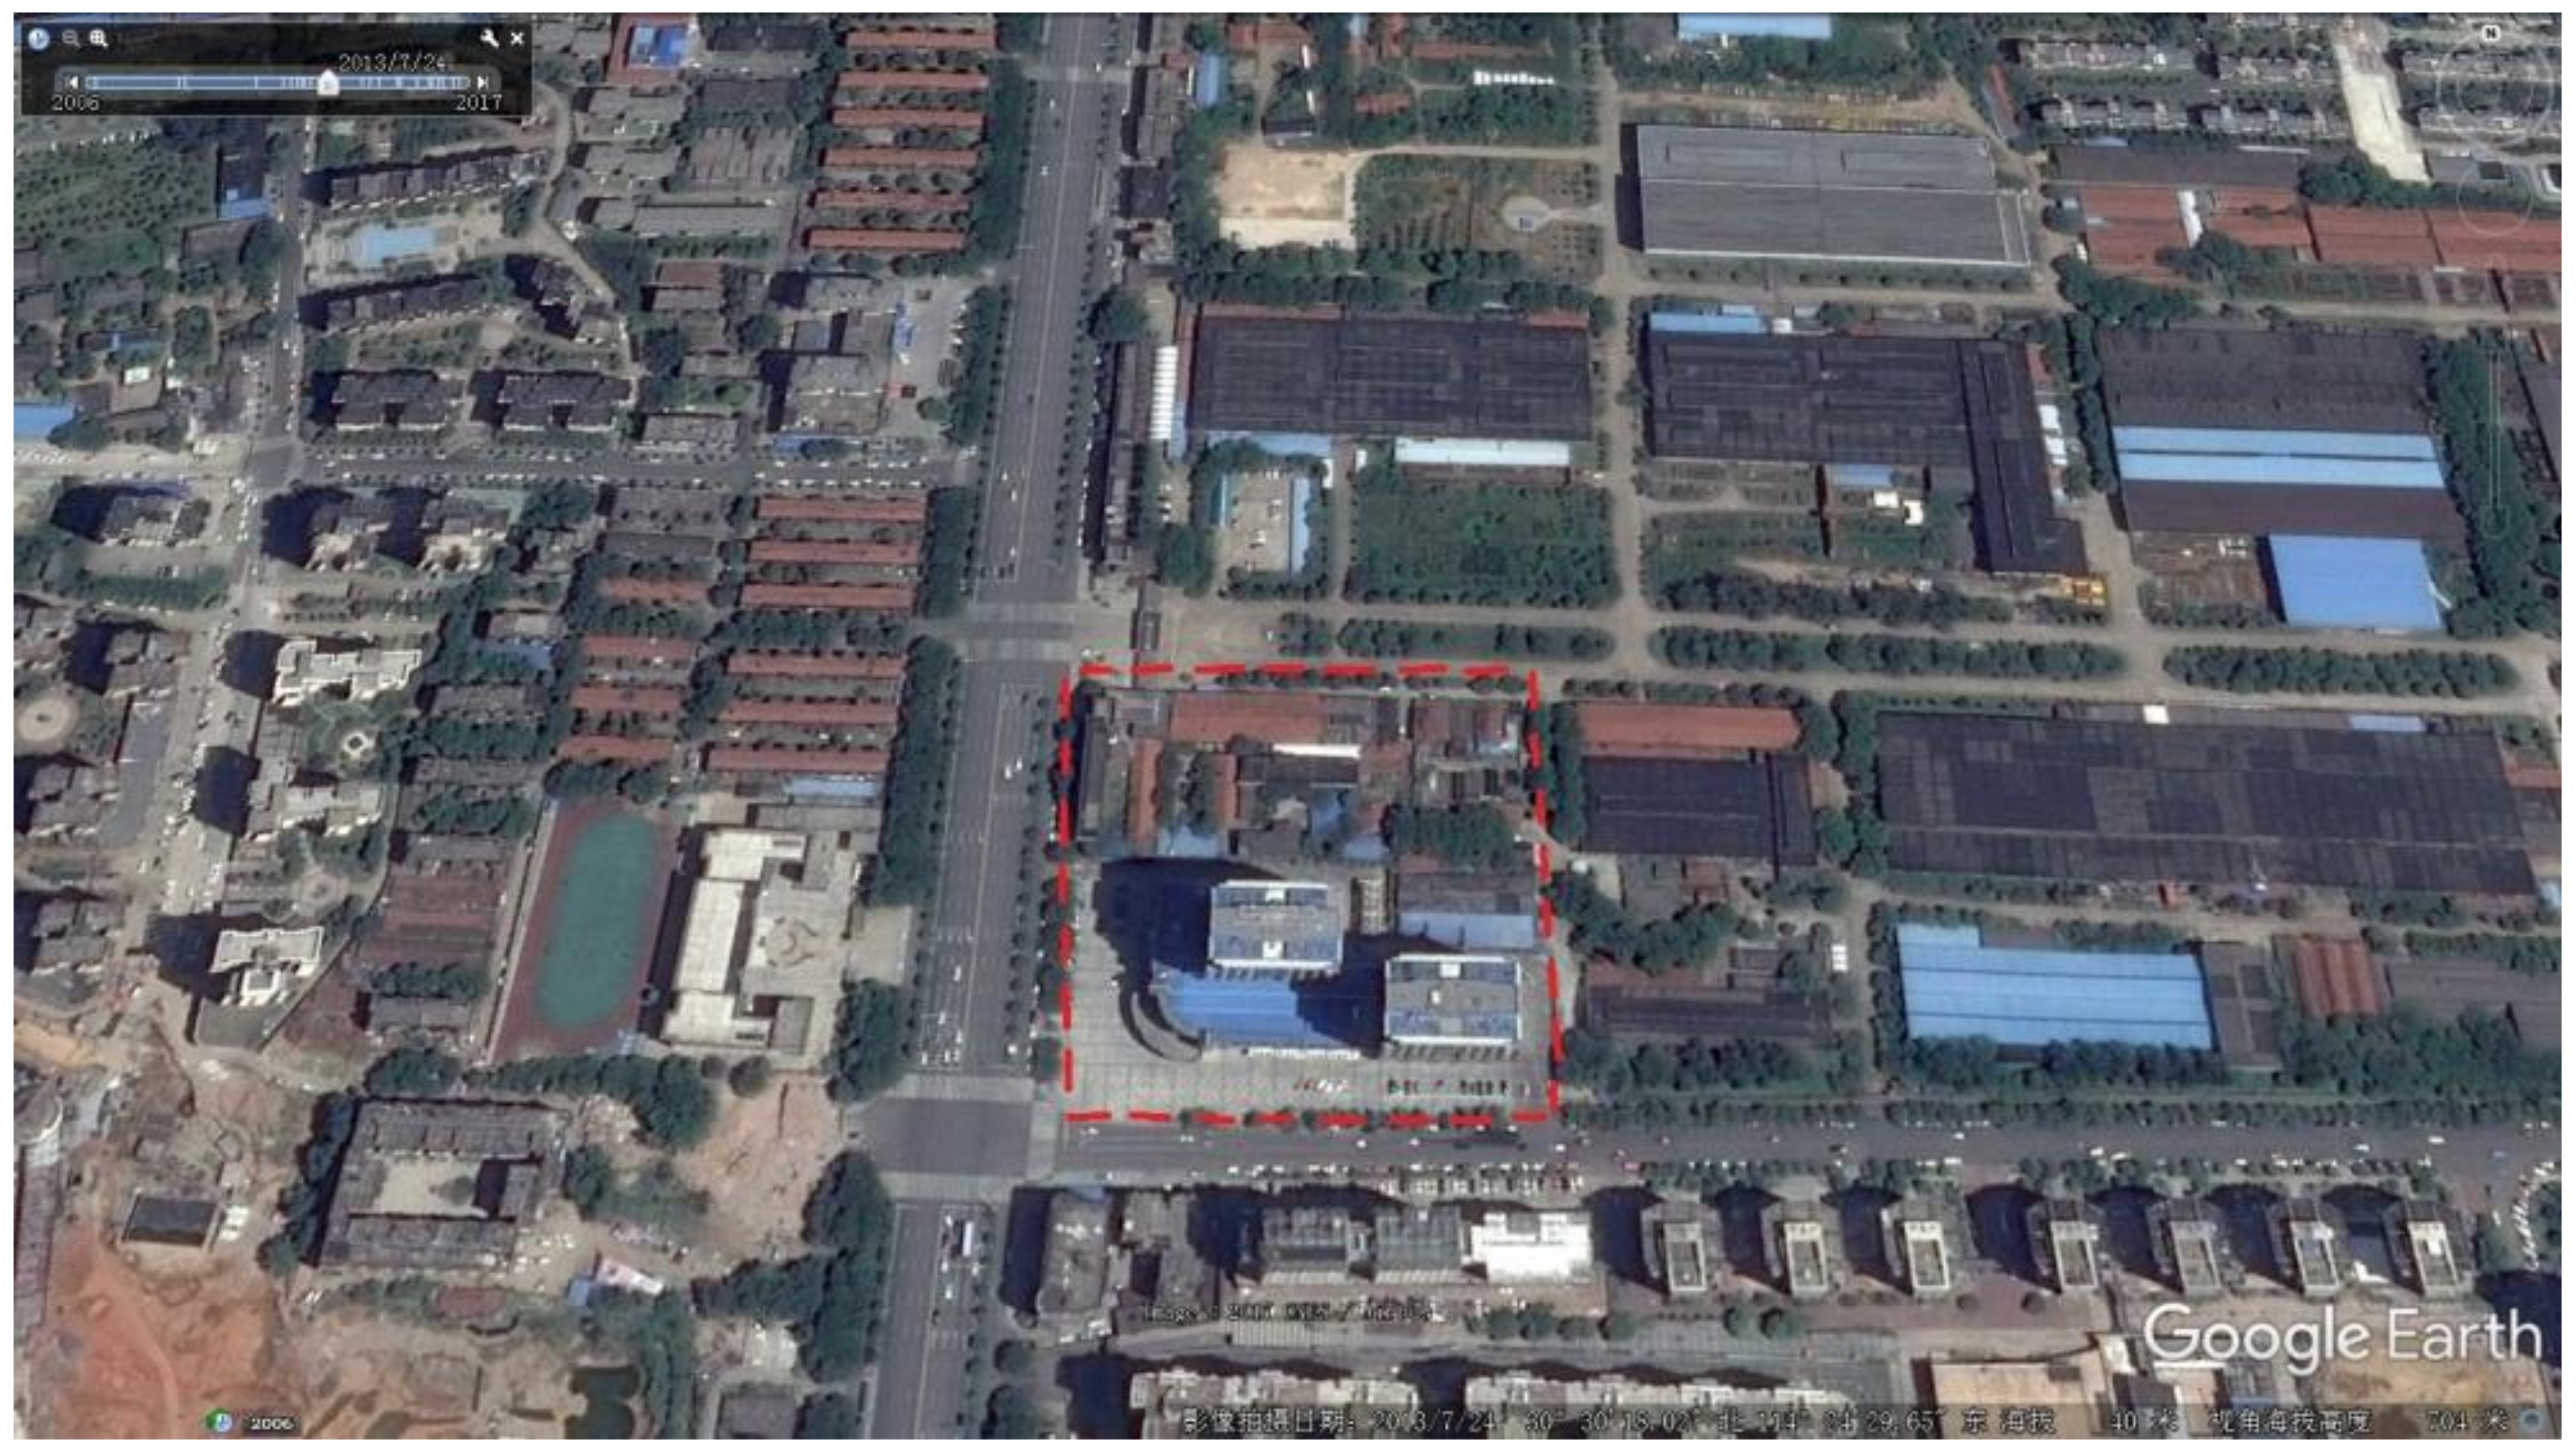
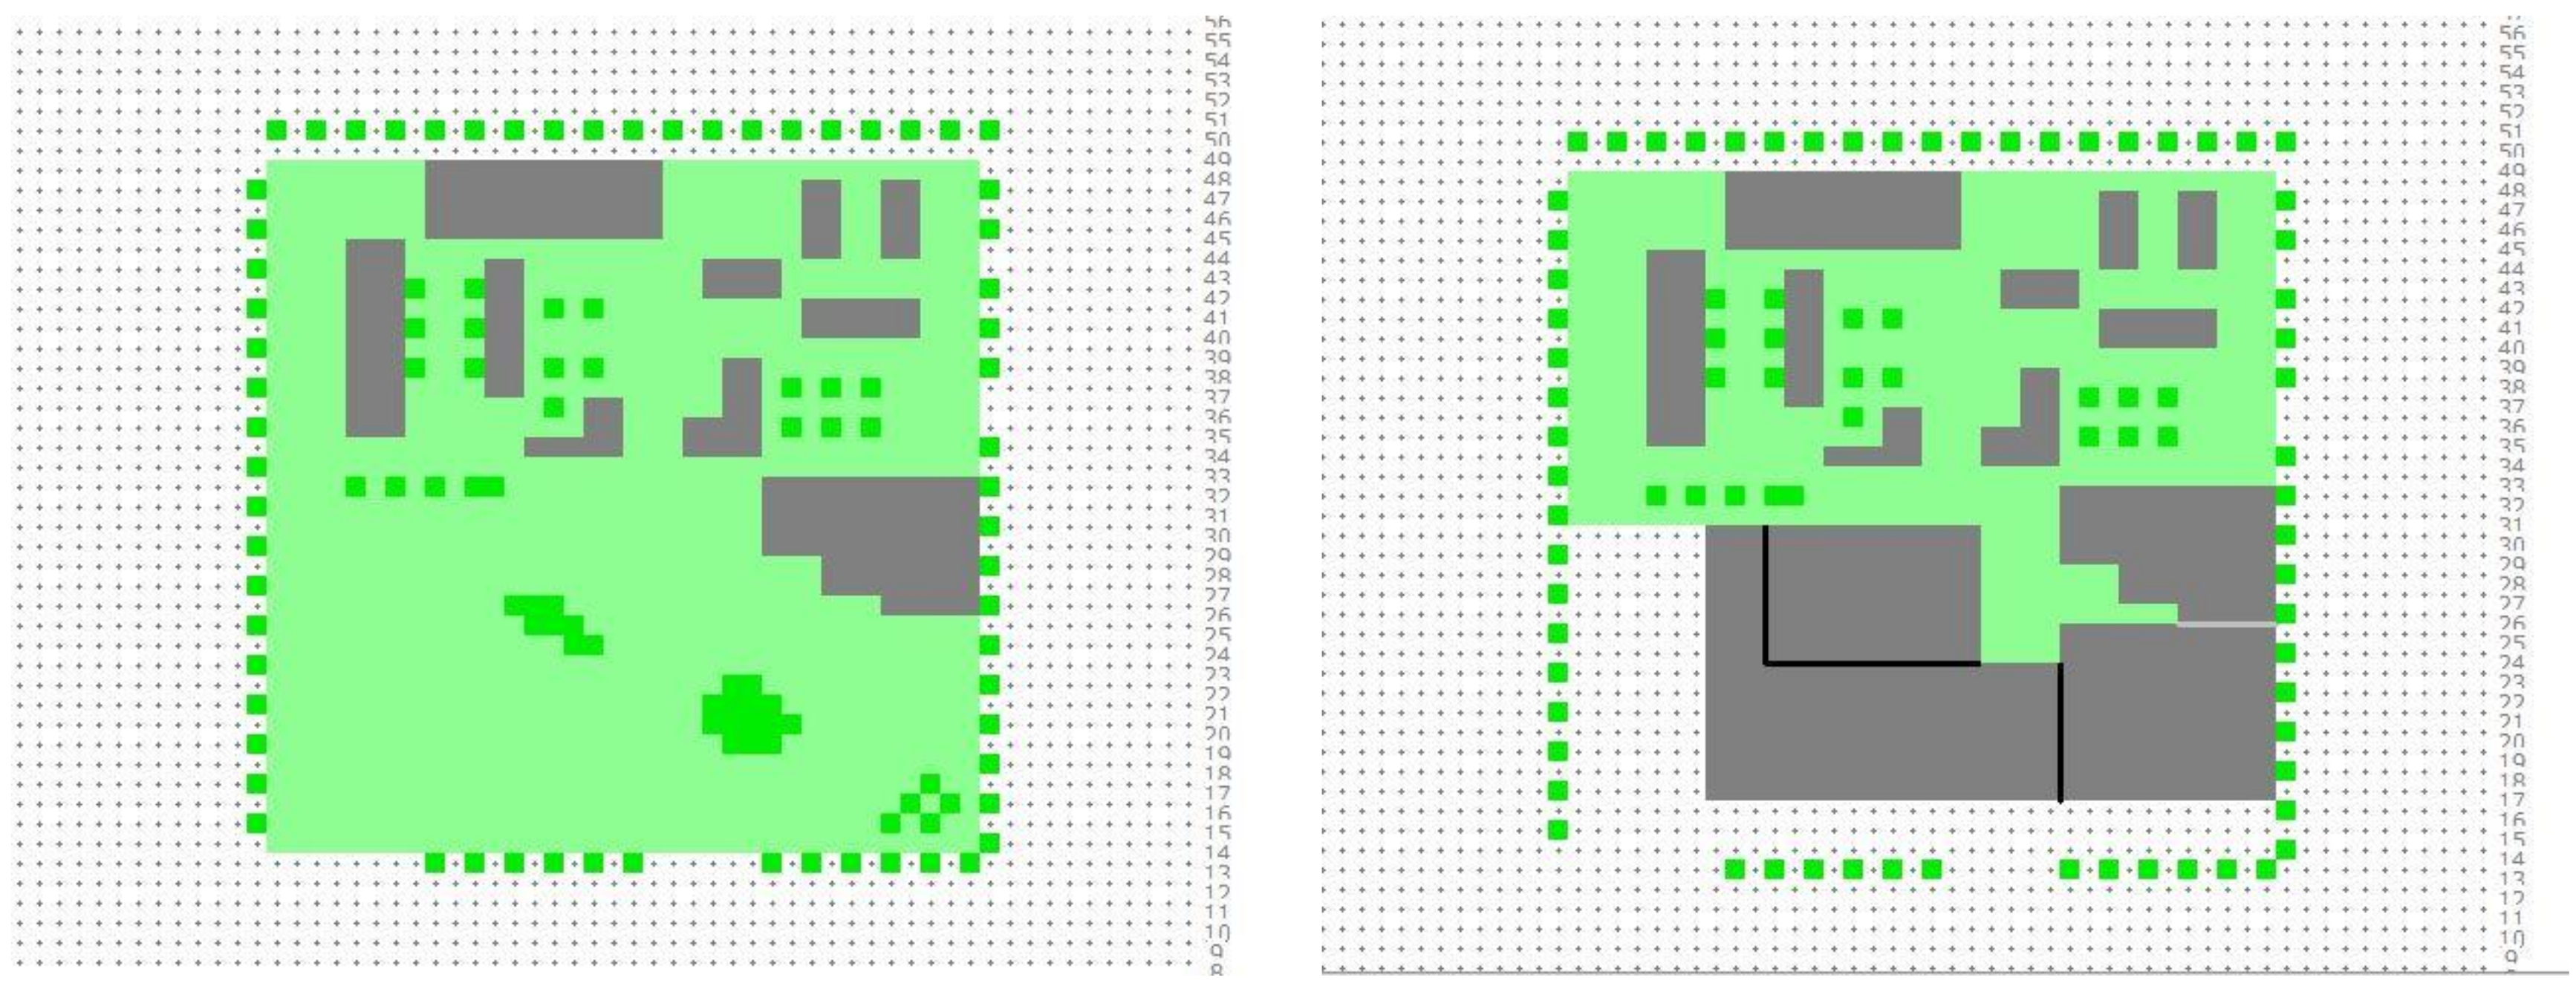
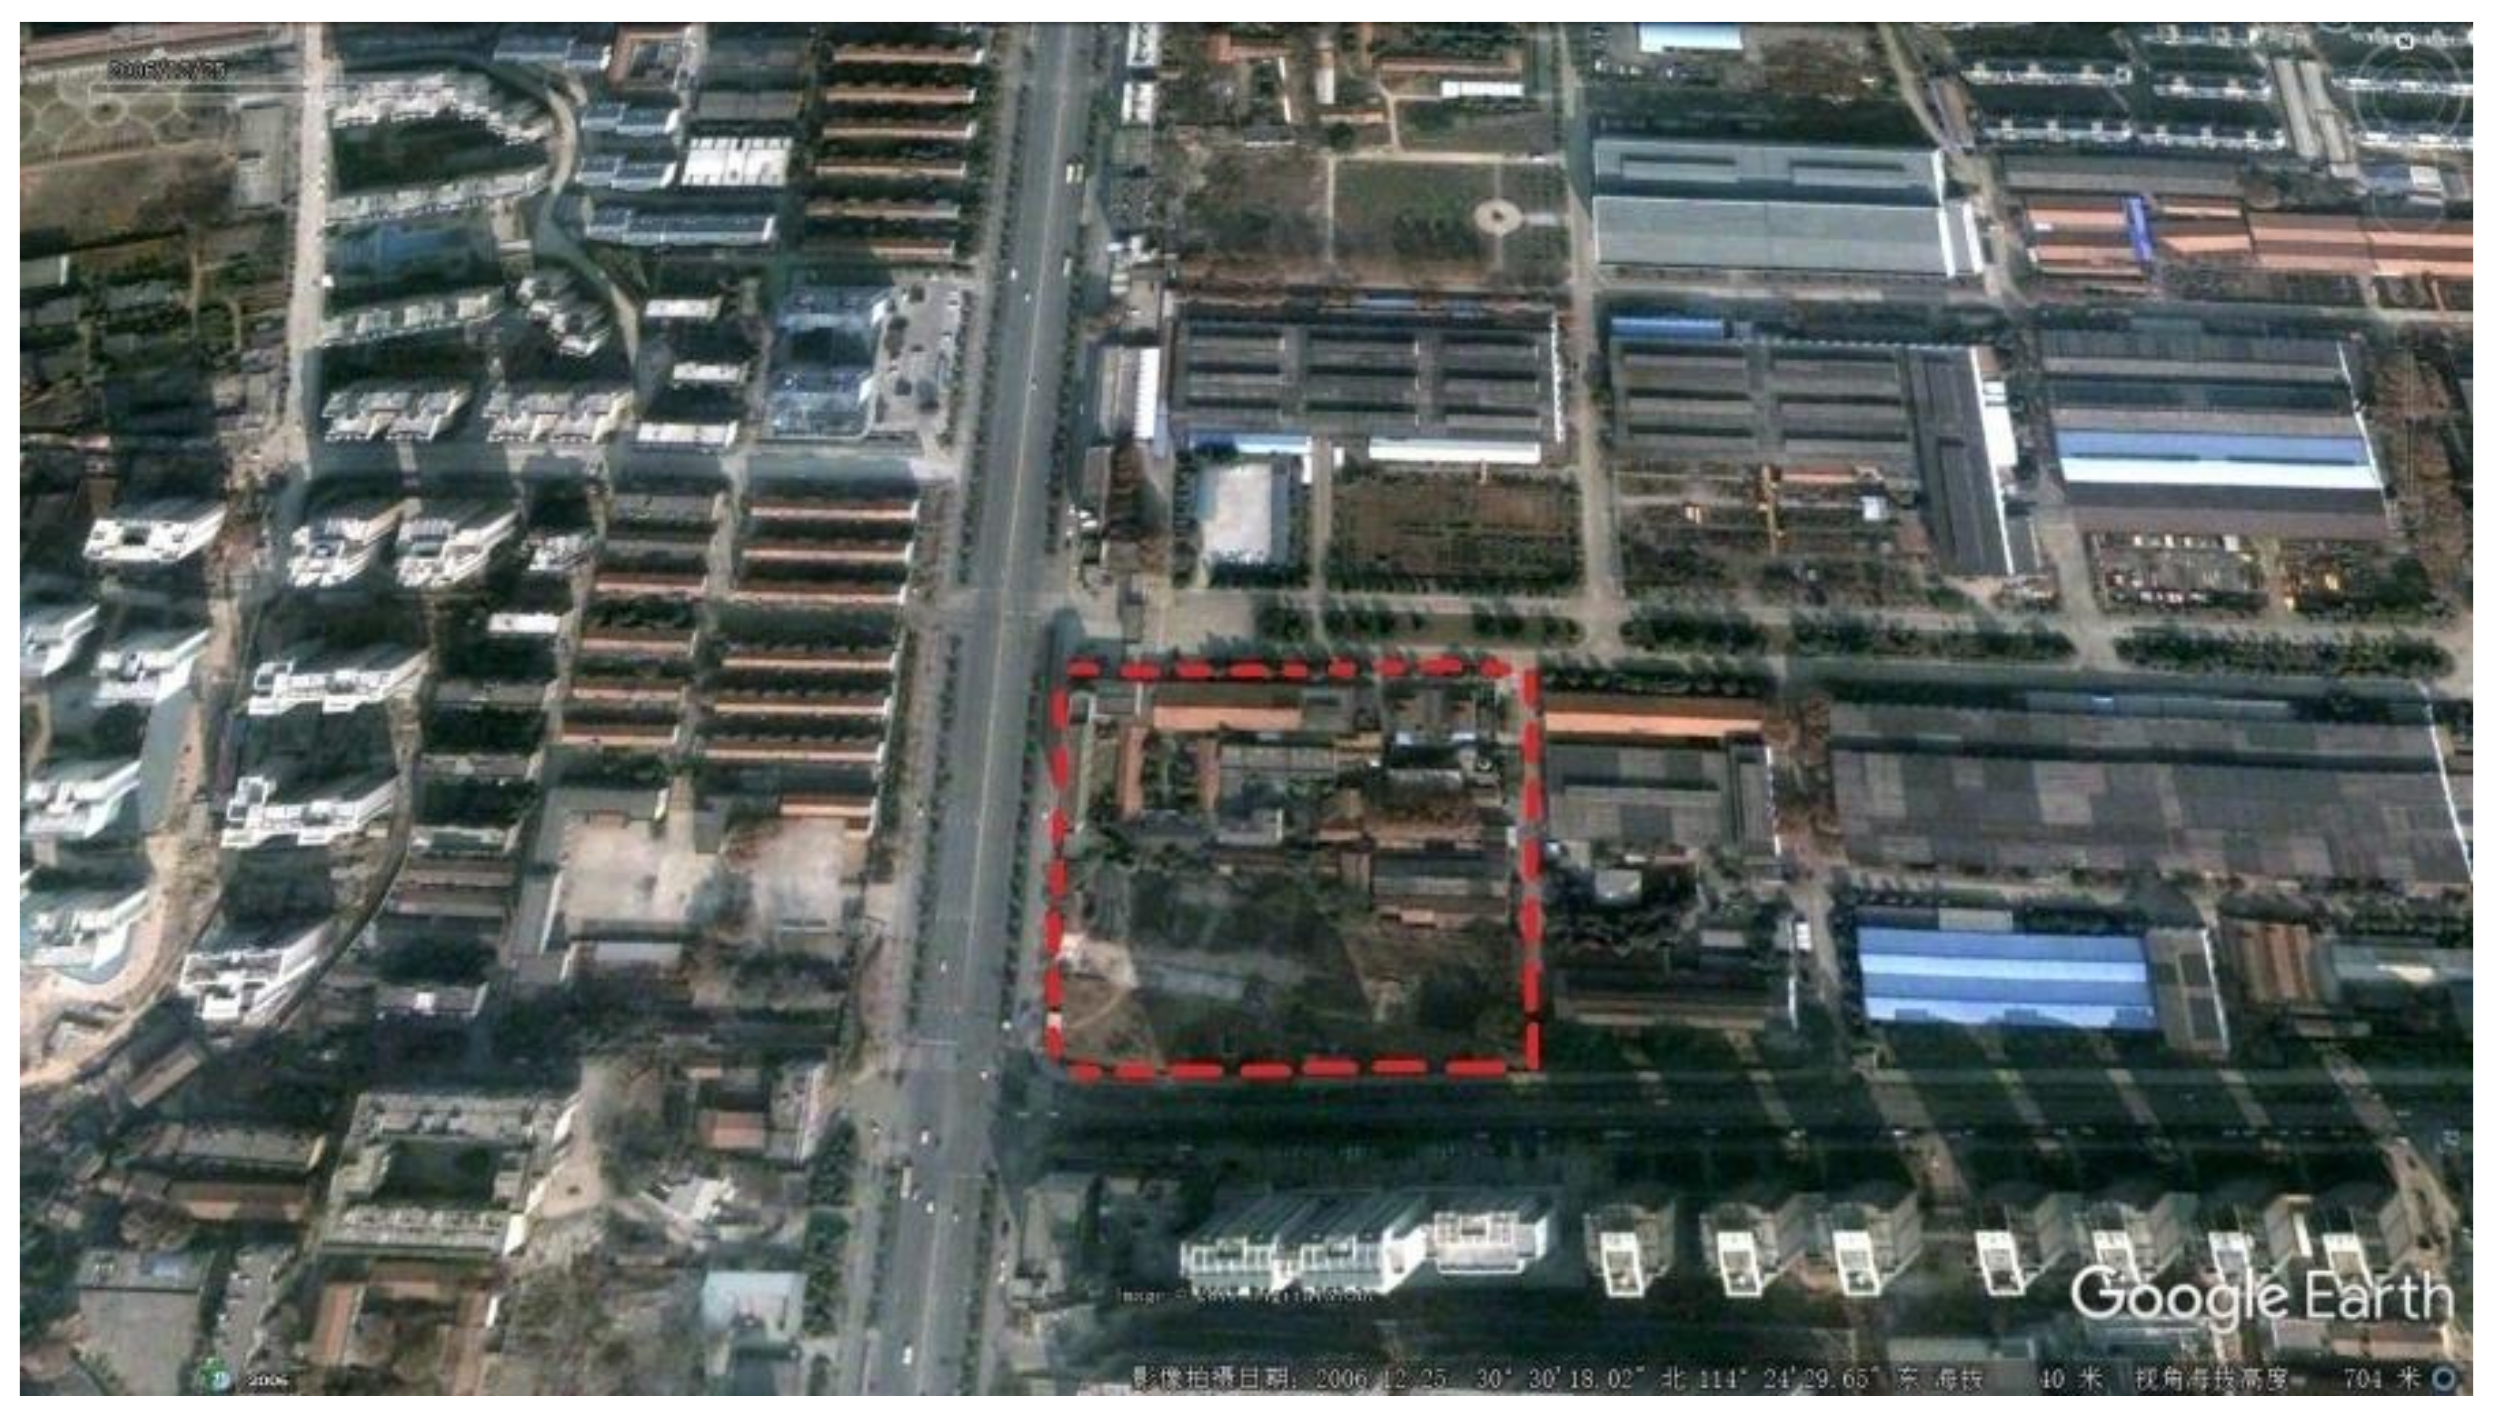
2.2. Project Site Analysis

In this work, Hongshang was selected as the reference area to represent highly congested and densely populated areas in Wuchang District, Wuhan. Google Earth images of the selected site at different periods were retrieved to identify the morphological changes.
2006
The initial study was based on the 2006 morphology of the study site. In 2006, the site had an area of approximately 250 m × 180 m (45,000 m2). The basic layout consisted of one-and two-floored buildings and vegetation, as shown in Figure 3. Building lengths and widths were inferred from Google Earth images. The height of building blocks was calculated by setting 3m as the average height of one floor. The width and length of building blocks were approximated as close as possible to those of actual buildings on the study site.
2013
The second analysis is by 2013 morphology and the changes that occurred at that specific site with the passage of time. The study analysis was on Google Earth images, which showed great changes to the site regarding construction and covered area and the removal of vegetation and trees (Figure 4). The initial covered area of the 2006 morphology was 43%, and the green covered area was 57% of the total area. The green cover ratio was 1.32.
On the other hand, the total covered area in the 2013 morphology was 81%, and the green covered area was 19% of the total area. The green covered ratio was 0.23. The green cover ratio decreased due to the construction of new buildings on the site’s green area. The new buildings were typical Chinese typology with two distinct levels, commercial up to six floors and the rest of the floors with offices and commercial flats. The first level was up to 18m high, considering it was six-floor building and the taller portion was 36m (12 floors). The original of the taller towers was more than 36m but was reduced to 12 floors due to limitations of the software (provided in the student version) and also for accurate simulation results.
2013 Proposed Morphology
The third analysis was conducted with the 2013 morphology and the proposed green strategies. The addition of green roofs was proposed to increase the green ratio of the existing morphology. The total area of added green roofs was 22,210 m2. This addition increased the cover ratio from 0.23 to 0.8. A graphical illustration of the selected sites showing the previous, present, and proposed vegetation covers, as well as the paved area, was generated using ENVI-met, provided below. The basic information of the selected site is presented in Table 2.

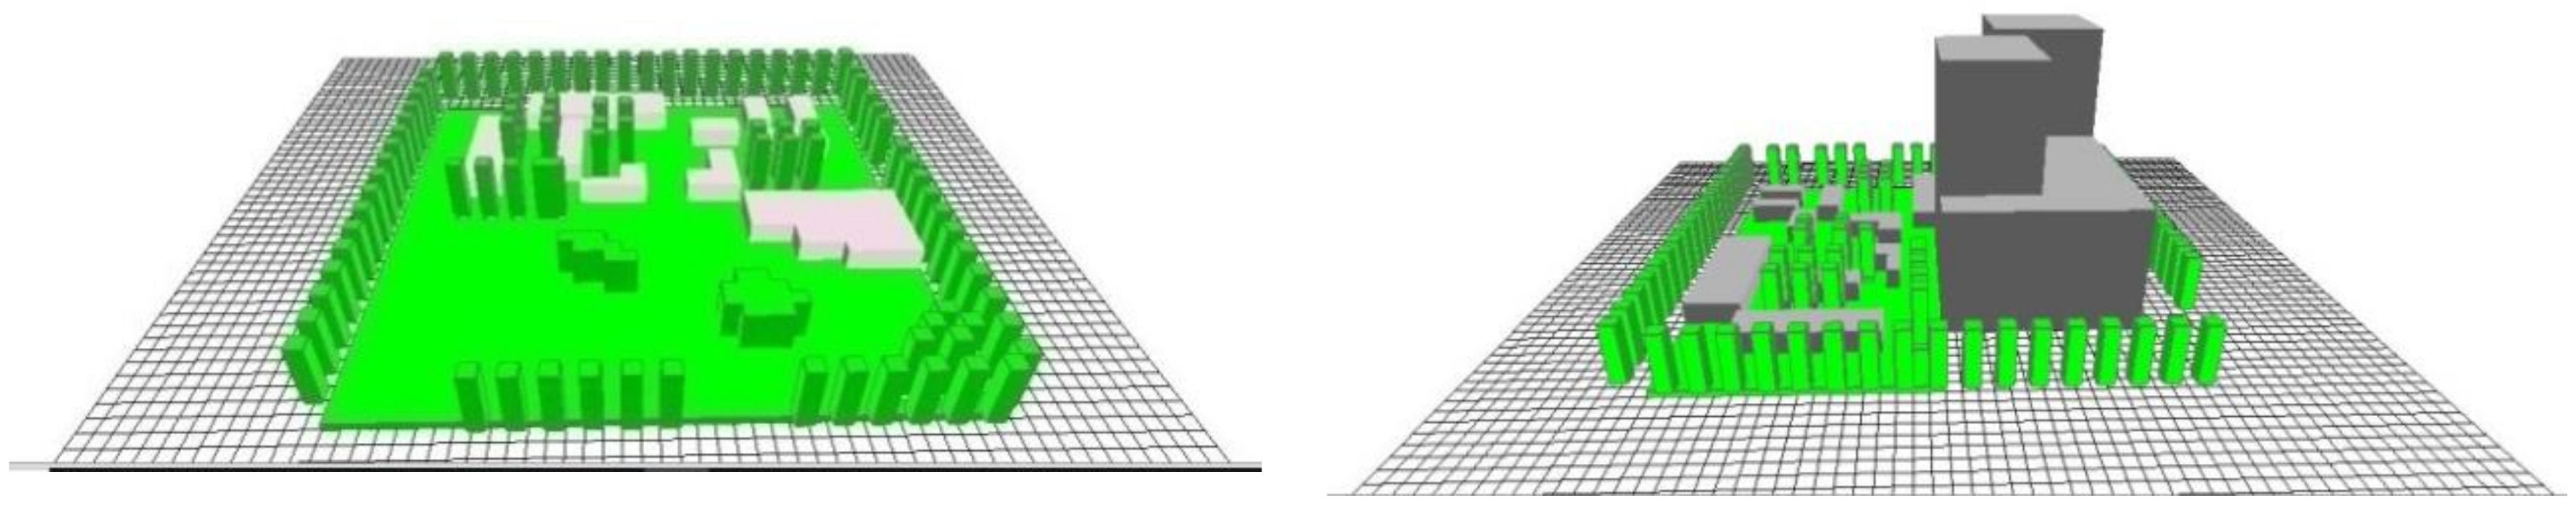
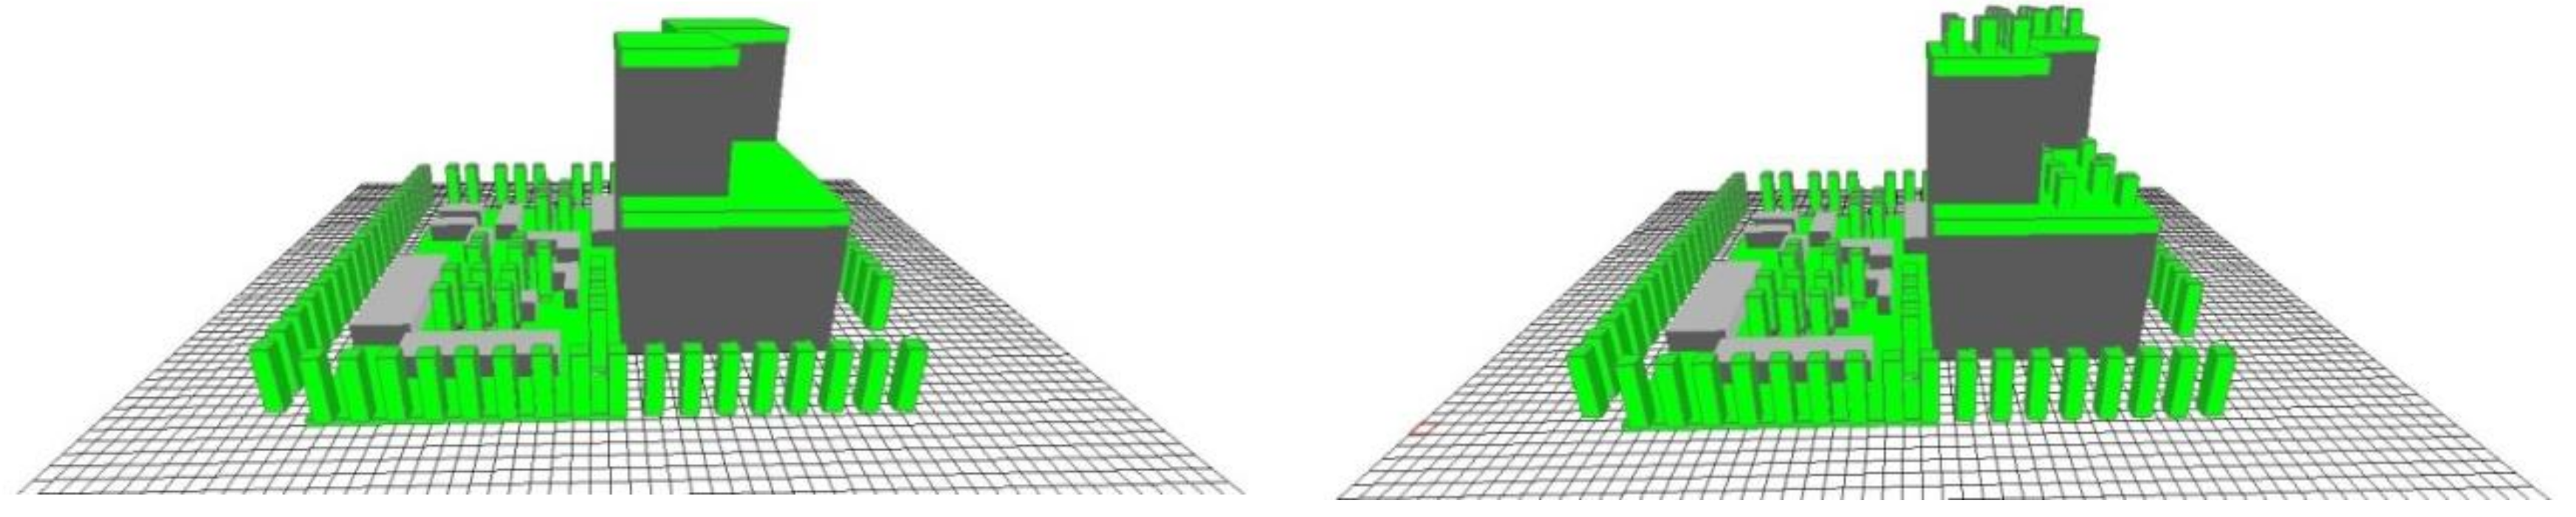
2.3. Project Site Modeling in ENVI-Met

The investigated area was modeled using images retrieved from Google Earth. The model was designed to obtain a reliable visual representation of the dimensions of buildings and streets in the study area. Some limitations and simplifications were imposed on the model design and input data to reduce the number of required simulations. The two-dimensional (2D) layouts of the 2006 and 2013 morphologies were generated by ENVI-met for the comparison of potential Tair differences (Figure 5). The 2006 morphology was compared with the 2013 morphology to determine the increase in Tair that resulted from the construction of new buildings. Two pairs of models were used in this particular project. The first (2006 and 2013 morphologies) models the reconstruction of the selected area in Wuhan, and the second (grass and tree roof morphologies) analyzes the area under two types of green roof environmental design parameters.
The proposed models were constructed in ENVI-met on the basis of two important green strategies for mitigating microclimatic impact. The first strategy involves the addition of grass-planted roofs to new buildings, and the second involves tree-planted roofs. These strategies were selected in reference to the literature on green roofs and their importance in tropical regions. To determine the current microclimatic condition of the selected area, simulation of Tair measurements for the 2006 and 2013 3D models was performed on 30 July 2017. The ENVI-met compare option was used to compare the differences in Tair values under the same humidity level with a 4h day time interval. Newly constructed buildings with grass-or tree-planted roofs were simulated to identify the ameliorating impacts of vegetation on microclimatic conditions.

2.4. ENVI-Met Simulation Configuration

The features of the constructed 3D ENVI-met models of the selected site include building blocks, roads, and streets. These features were transformed into cells of preferred dimensions. First, existing urban elements such as buildings, vegetation, soil, and pavement were defined in an input model. Cell dimension selection requires compromise among model accuracy, maximum cell number, and simulation time. For example, small cell dimensions are associated with increased accuracy but longer simulation time. ENVI-met allows the option (while designing models and simulating) of selecting cell dimensions of 60 × 60 × 30 (x, y, z), 100 × 100 × 30 (x, y, z), or 180 × 180 × 30 (x, y, z). To obtain the optimal resolution and building block layout and street measurements similar to those at the actual site, a cell size of 2 m × 2 m was selected.
Then, simulations were conducted under different configuration file settings, such as different parameters and output folder names and timings. The same process was repeated to model the morphologies with tree-and grass-planted roofs. The latest version of ENVI-met 4.3.0, which was released in November 2017, was used for the simulation of morphologies on 30 July 2017, the longest typical summer day, with clear sky conditions. Relative humidity data were obtained from a previous work [27]. Simulations were performed for 12 h with a time step of 1 h and the following meteorological parameters:
The selected area was 250 m × 180 m. Thus, the model must have a cell size of 180 × 180 × 30. Building lengths and widths were thesame as those inferred from Google Earth images (Figure 3 and Figure 4). Building block heights were calculated using 3 m as the common height of one floor. Thus, the number of floors in a specific building was multiplied by 3. The width and length of the building blocks were set to be as close as possible to those of actual buildings in the study site, with the limitation of 2 m × 2 m cells. Wind speed at 10 m distance was set to 3 m/s for all cases, with 78% relative humidity (according to local weather station data). The construction material values of walls and roofs were set to 0.4 and 0.3, respectively. Grass and tree heights were approximately 0.2 and 3 m, respectively. The standard thermal properties of materials were used in both models. Models were simulated with the same types of ground surface and materials.
The types of ground surfaces and vegetation covers for all simulated models were the same because they were located in the same area. Simulation C included grass-planted roofs, and simulation D included grass- and tree-planted roofs). Trees were simulated with heights of 4–6 m. The use of tall tree covers with high densities is unsuitable for rooftops in tropical areas because they obstruct wind and have low climatic impact. Tree placement was decided in reference to previous literature to allow maximum wind flow. All model initialization parameters are shown in Table 3.

2.5. Project Simulation Categories

ENVI-met 4.3.0 is environmental simulation software that considers climate change adaptation and human comfort and health (ENVI-MET, 2017). Other climate simulators include ECOTECT and DIVA for RHINO. ENVI-met was used in this work because it is a comprehensive simulator that can simultaneously simulate a large number of climatic factors. It is a freeware tool that is commonly used to calculate thermal comfort [28].
The new version of ENVI-met tool (Leonardo) has been used to generate 3D microclimate models in many research studies on the urban heat island effect and mitigation strategies [29,30]. To quantify the impact of the 2006 morphology accurately, the overall simulation of the 2013 morphology and strategies that ameliorate high microclimate Tair were divided into four steps:
  • Simulation Case A: thermal impact of the 2006 site morphology.
  • Simulation Case B: thermal impact of the 2013 site morphology.
  • Simulation Case C: thermal impact of the complete replacement of concrete roofs of new building blocks with grass-planted roofs.
  • Simulation Case D: thermal impact of the complete replacement of concrete roofs with tree-planted roofs.

2.6. Calibration of All Simulation Models

For simulation using ENVI-met, climatic data from the Wuhan weather website must be input and calibrated [26]. The values of Tair and relative humidity extracted from the calibration point should show the same results as the climatic data of Wuhan for July. The input data to be calibrated included cloud composition, shortwave adjustment factor, specific humidity at 2500 mg/kg, and initial Tair. The wind data for Wuhan revealed three major wind directions: east, north, and south. In July, the most common wind direction is southeast. The easterly wind direction is also close to the prevalent south direction. The southeasterly wind direction was selected because of its impact on the majority of the site. Solar radiation values and day lengths were initially determined. In July, the average day length is 14 h, but 12 h was considered sufficient for simulation. Specific humidity at 2500 mg/kg was set to 78% because the average relative humidity in July is 78%, and specific humidity at 2500 mg/kg was 19g water/kg air, which was equivalent to the ground-level relative humidity of approximately 78%. The final parameter to be calibrated was the initial Tair. The initial temperature is the temperature at 06:00 or the hour when the simulations were initiated. The initial Tair must be calibrated to a value that is likely different from the actual Tair at 06:00 because the day temperature curve generated by ENVI-met usually does not fit the actual day temperature curve. Therefore, the Tair at 08:00 was matched to climatic data. Soil, grass, and tree types were calibrated in accordance with previous studies [26]. The same data must be calibrated for all simulation models.

2.7. Implied Green Roof Analysis

Urban areas are warmer than suburban areas. The addition of vegetation to urban areas would change temperatures by few degrees, thus improving comfort in the outdoor environment [31]. Two types of roof surfaces were implemented on new buildings within the existing site. First, the grass-planted roof structure was simulated, and its thermal impact was tested. Second, the tree-planted roof structure was simulated, and its thermal impact was tested. The 3D models of these experimental designs areshown in Figure 6. The ENVI-met compare option wasused to identify the absolute differences in Tair contributed by grass- or tree-planted roofs. The ENVI-met default values of specific humidity and roughness length were adopted for both simulations.
Figure 7 shows the different types of trees that affect the microclimate in the selected location. These trees have extensive or dense canopies that provide shade. Tall, big trees that cannot be planted on building rooftops were ignored. The types of trees for planting on roofs were selected from a standard list of trees and entered into ENVI-met. Grass, asphalt, and concrete were selected as ground cover, given their ubiquity.

2.8. Climate Measurements

Actual site climate measurements of Tair and relative humidity were not conducted for the following reasons: First, the specific site is private property, climatic measurements are costly, and resources as well as permissions from government authorities are required. Second, understanding the morphological changes is beyond the scope of this study. Furthermore, green roofs currently do not exist on the site. Therefore, the validation of climatic measurements is based on the analysis of weather data from a website.
All surfaces in the models were modeled and simulated with the same materials and thermophysical properties. The thermophysical values of materials, such as those of concrete (920 J/kgK, 2159 kg/m3 density, and 0.45 albedo), were obtained from China National Thermal Design Code. The impacts of different surface materials on Tair are more evident under clear sky and light wind conditions than under other conditions. Therefore, the weather data of July 30 were used to predict the spatial distribution of Tair in ENVI-met simulations. The average wind speed was 3 m/s, the wind direction was from west to east, and a relative humidity of 78%was used [27].
Simulation data at 14:00, 18:00, and 08:00 were selected for comparison. Buildings in simulations B, C, and D were simulated with the same height, and increases in height factor and their influence on temperature wereignored. Then, the influence of grass and tree roofs on Tair was determined under the same humidity and materials as those in the 2013 model to quantify the exact impact of each material at the same site during the experimental period. Similar weather conditions were applied throughout the experimental simulation to enable the comparison of all four simulation results. The absolute temperature values at different locations were compared through the comparison option to identify the absolute air difference at specific locations.

3. Numerical Simulation Output Data Analysis

3.1. Min and Max Tair Values of Different Urban Morphologies

The ENVI-met microclimatic output data for outside ambient temperature at different times of the day were analyzed, and Figure 8, Figure 9, Figure 10 and Figure 11 show the minimum and maximum Tair values in the morning (10:00), afternoon (14:00), and evening (18:00).

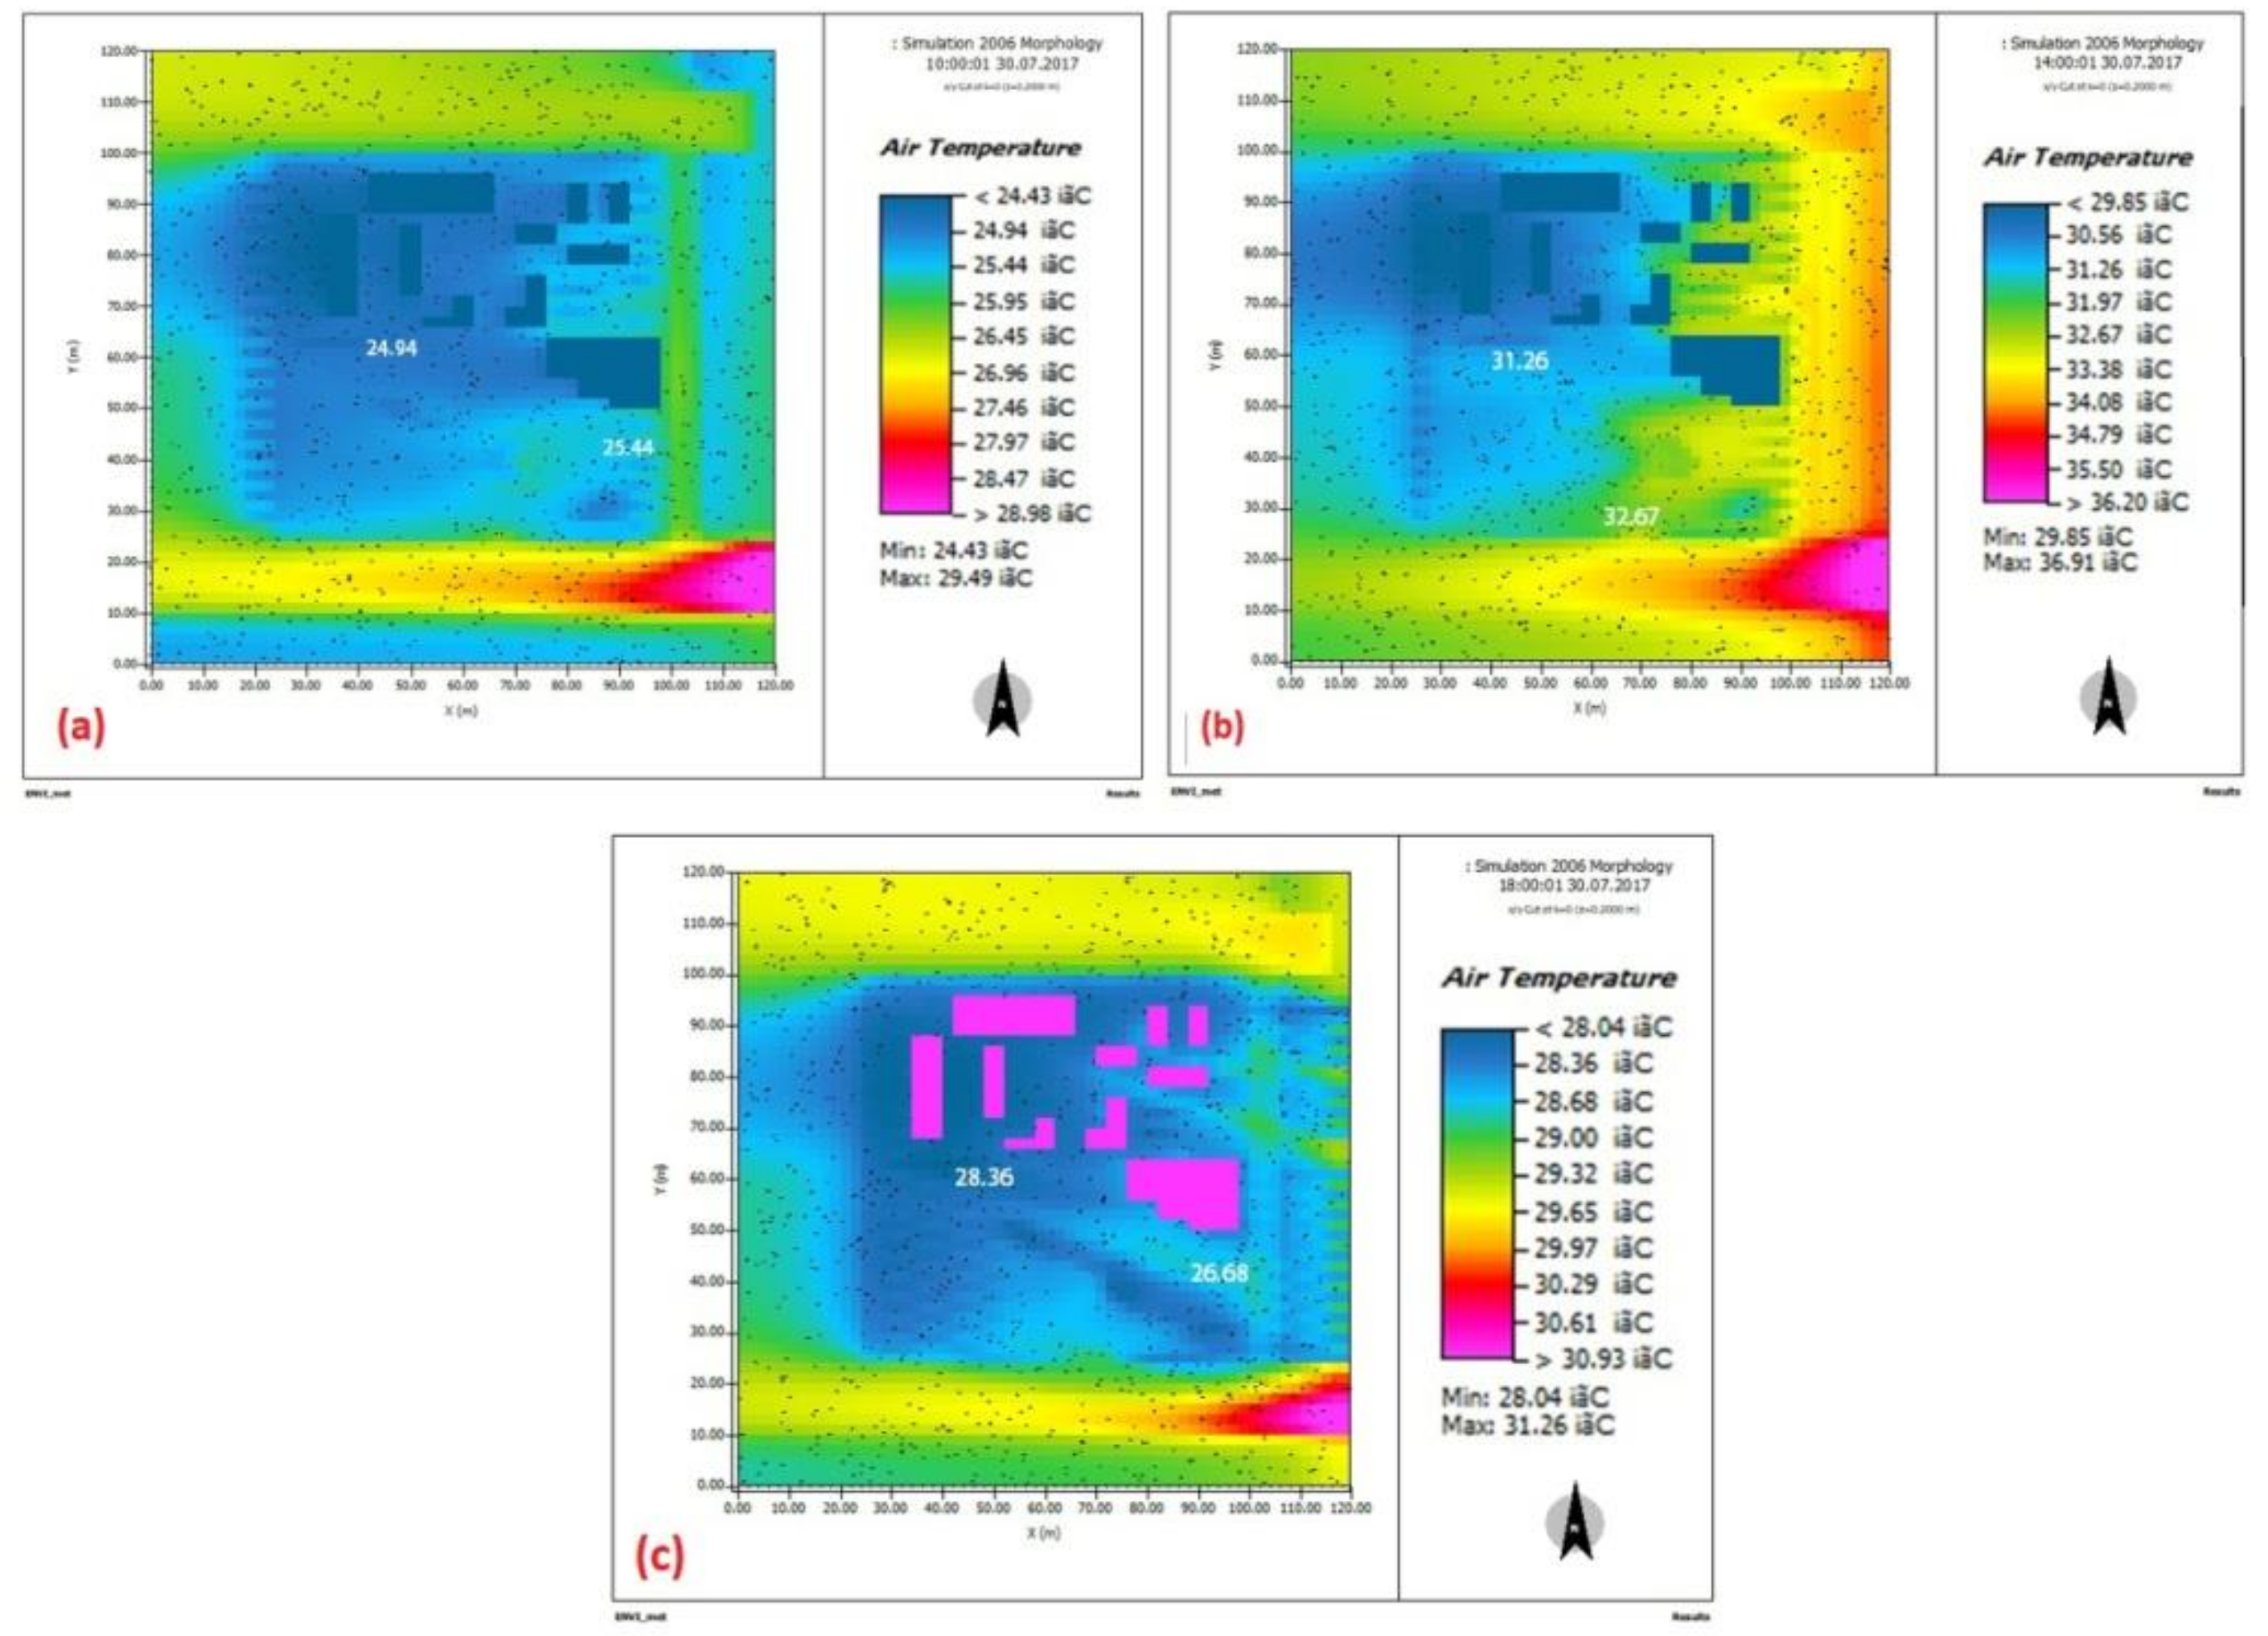
3.1.1. Simulation A (Tair Results for the 2006 Morphology)

In this scenario, the overall minimum Tair was 24.4 °C in the morning and the maximum was 36.9 °C in the afternoon.

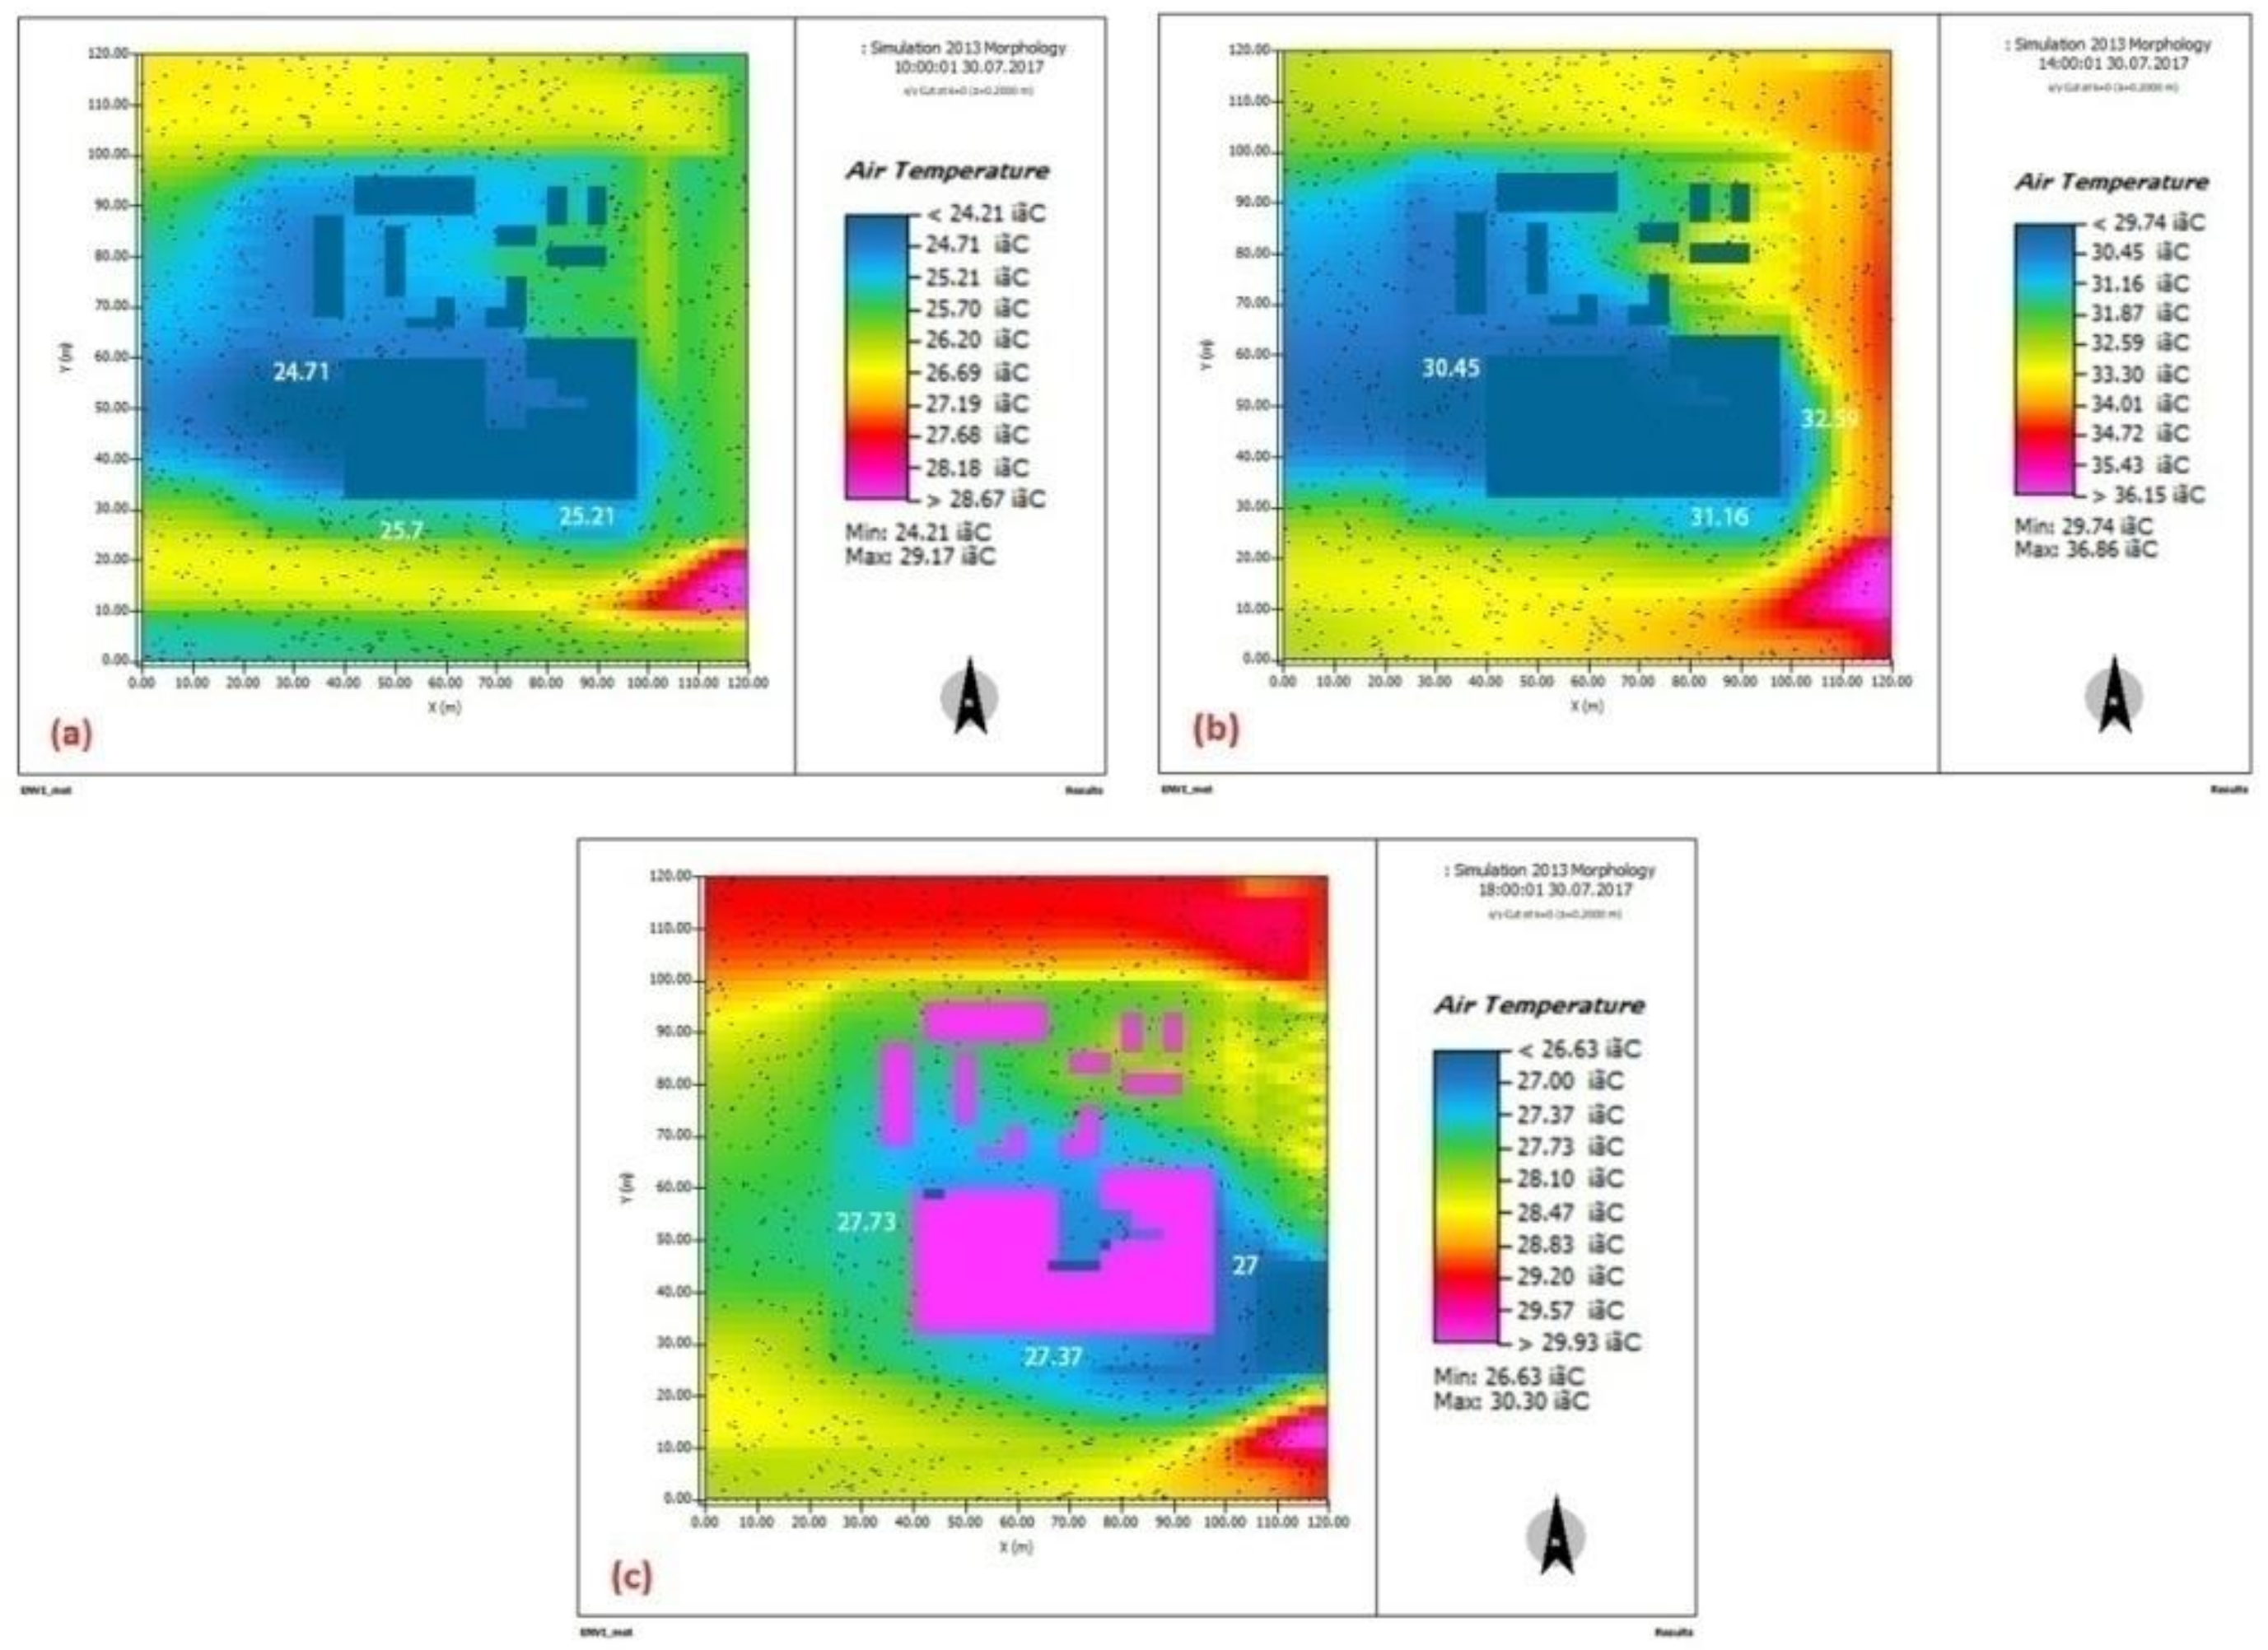
3.1.2. Simulation B (Tair Results for the 2013 Morphology)

In the second scenario, the overall minimum Tair was 24.2 °C in the morningandthe maximum was 36.9 °C in the afternoon.

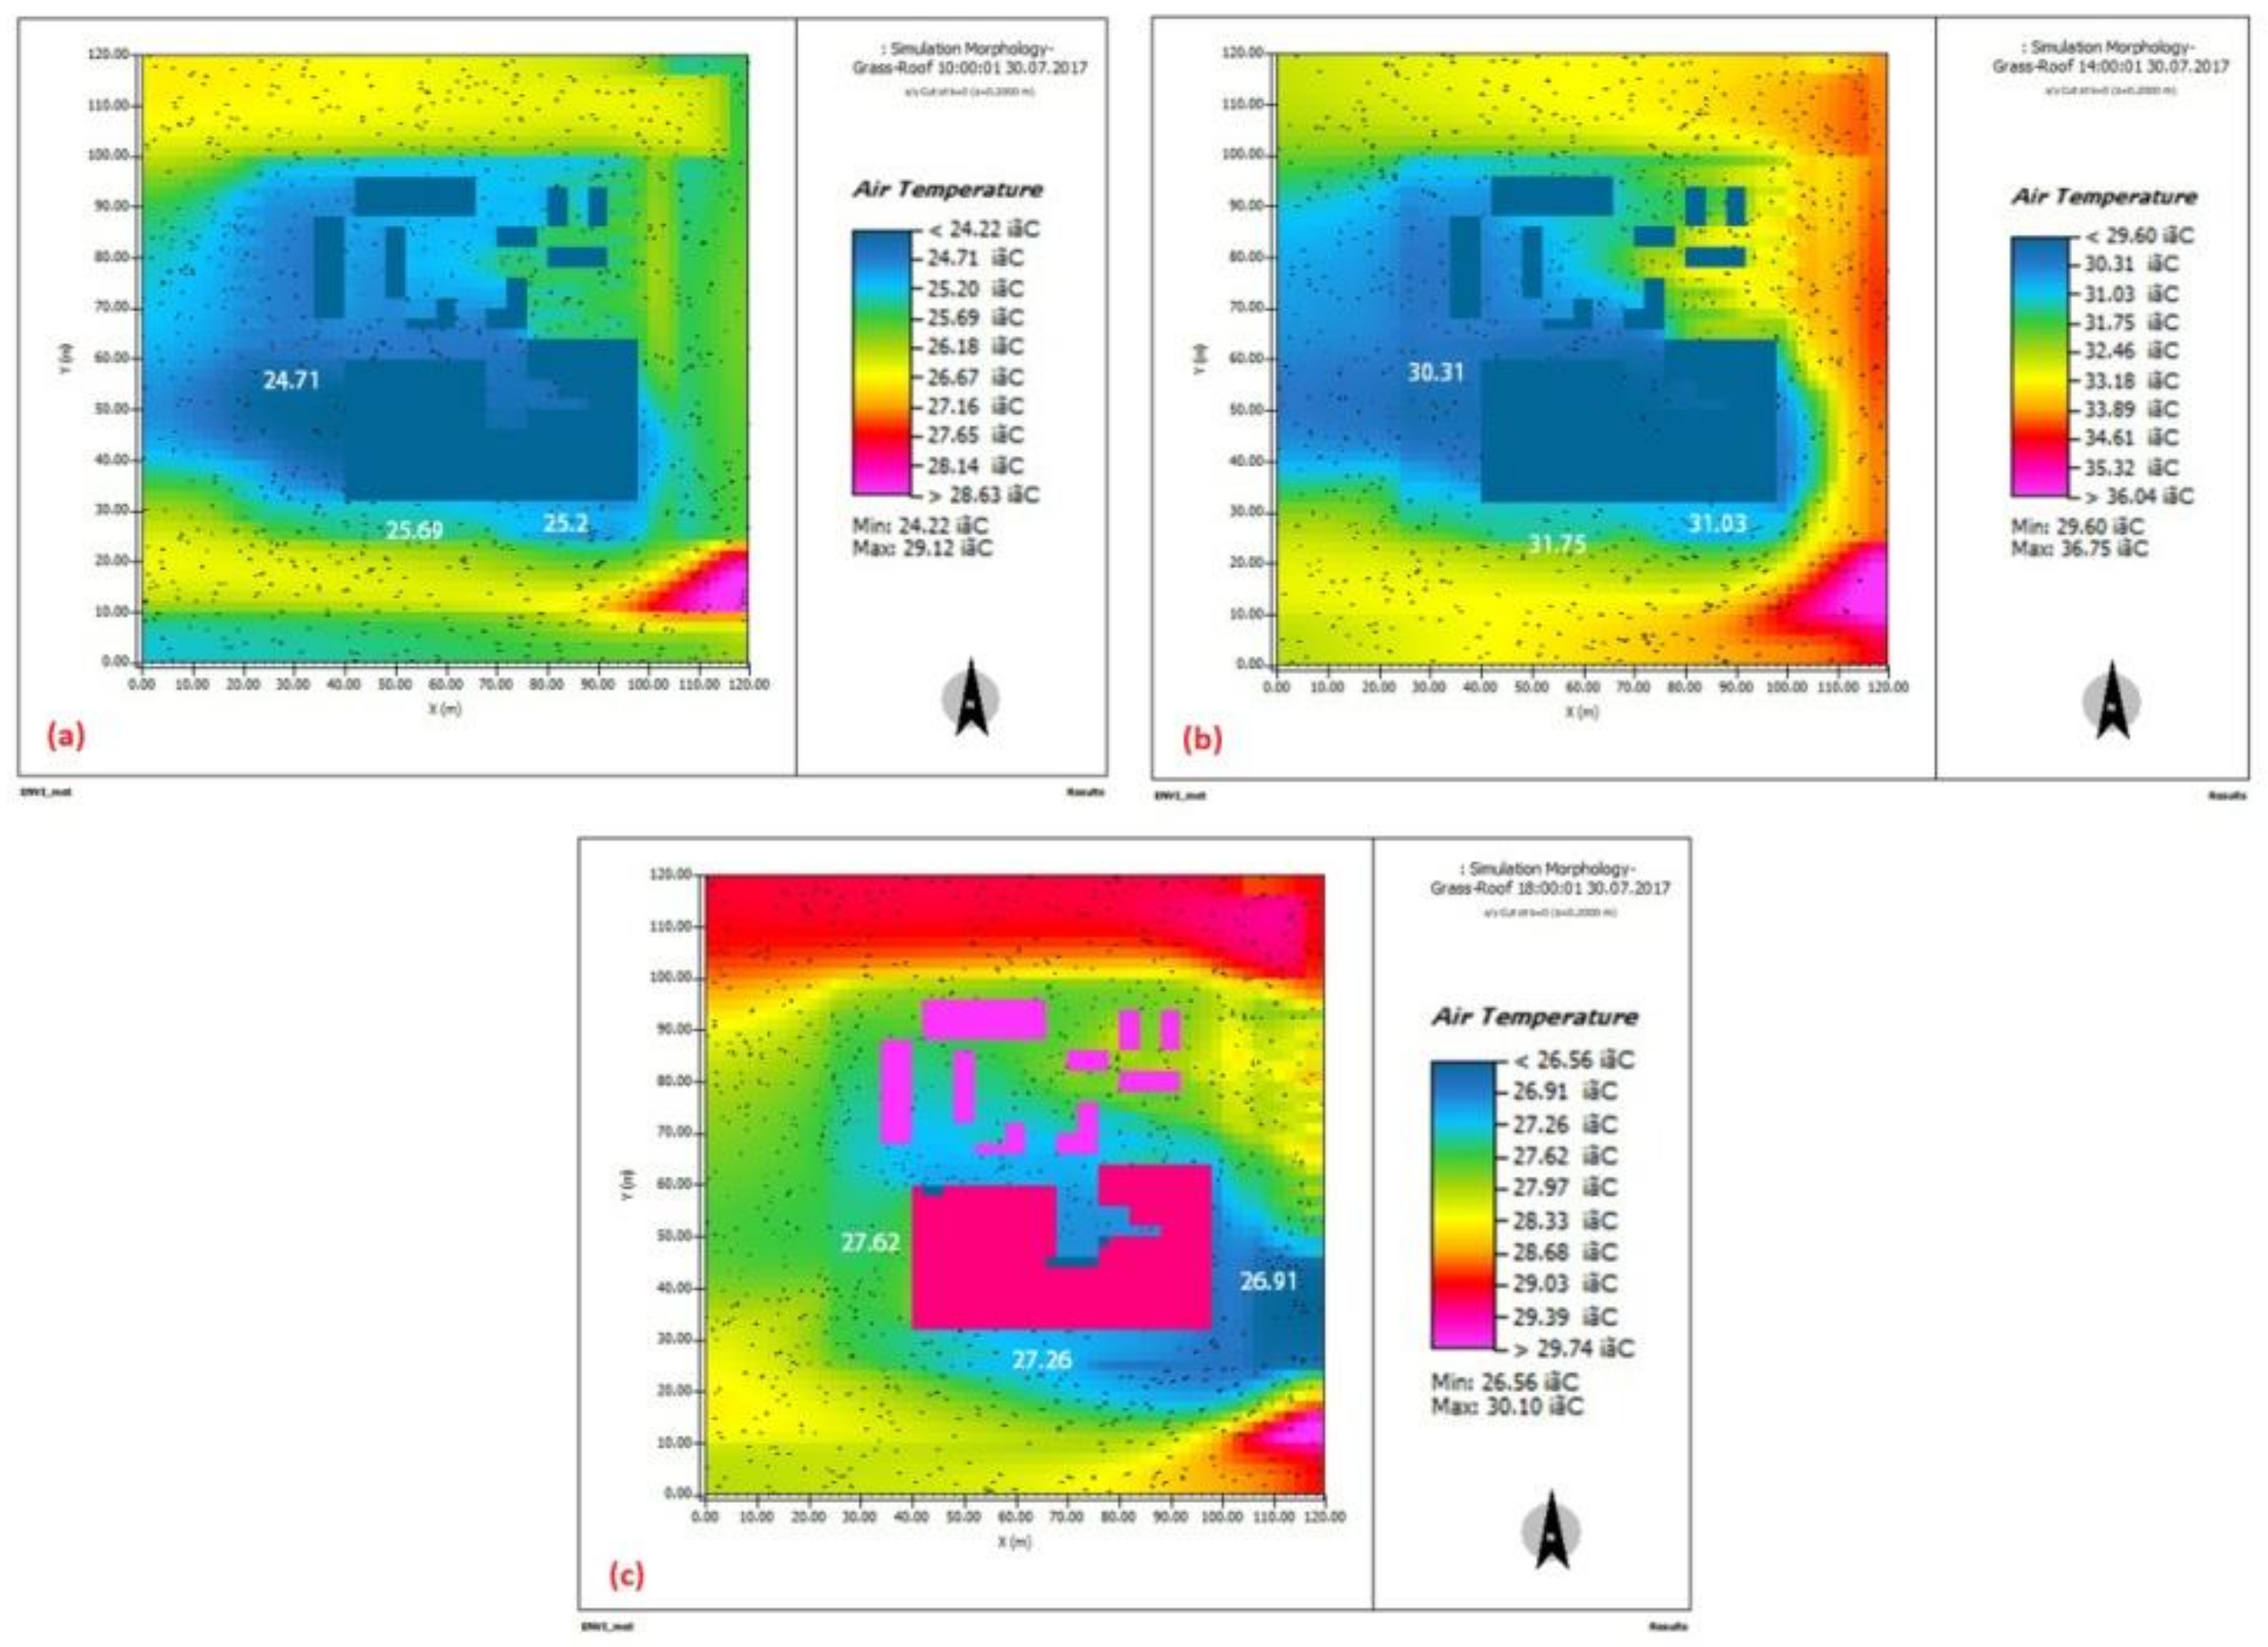
3.1.3. Simulation C (Tair Results for the 2013 Grass Roof Morphology)

In the third scenario (2013 grass-planted roof morphology), the overall minimum Tair was 24.2 °C in the morning and the maximum was 36.7 °C in the afternoon.

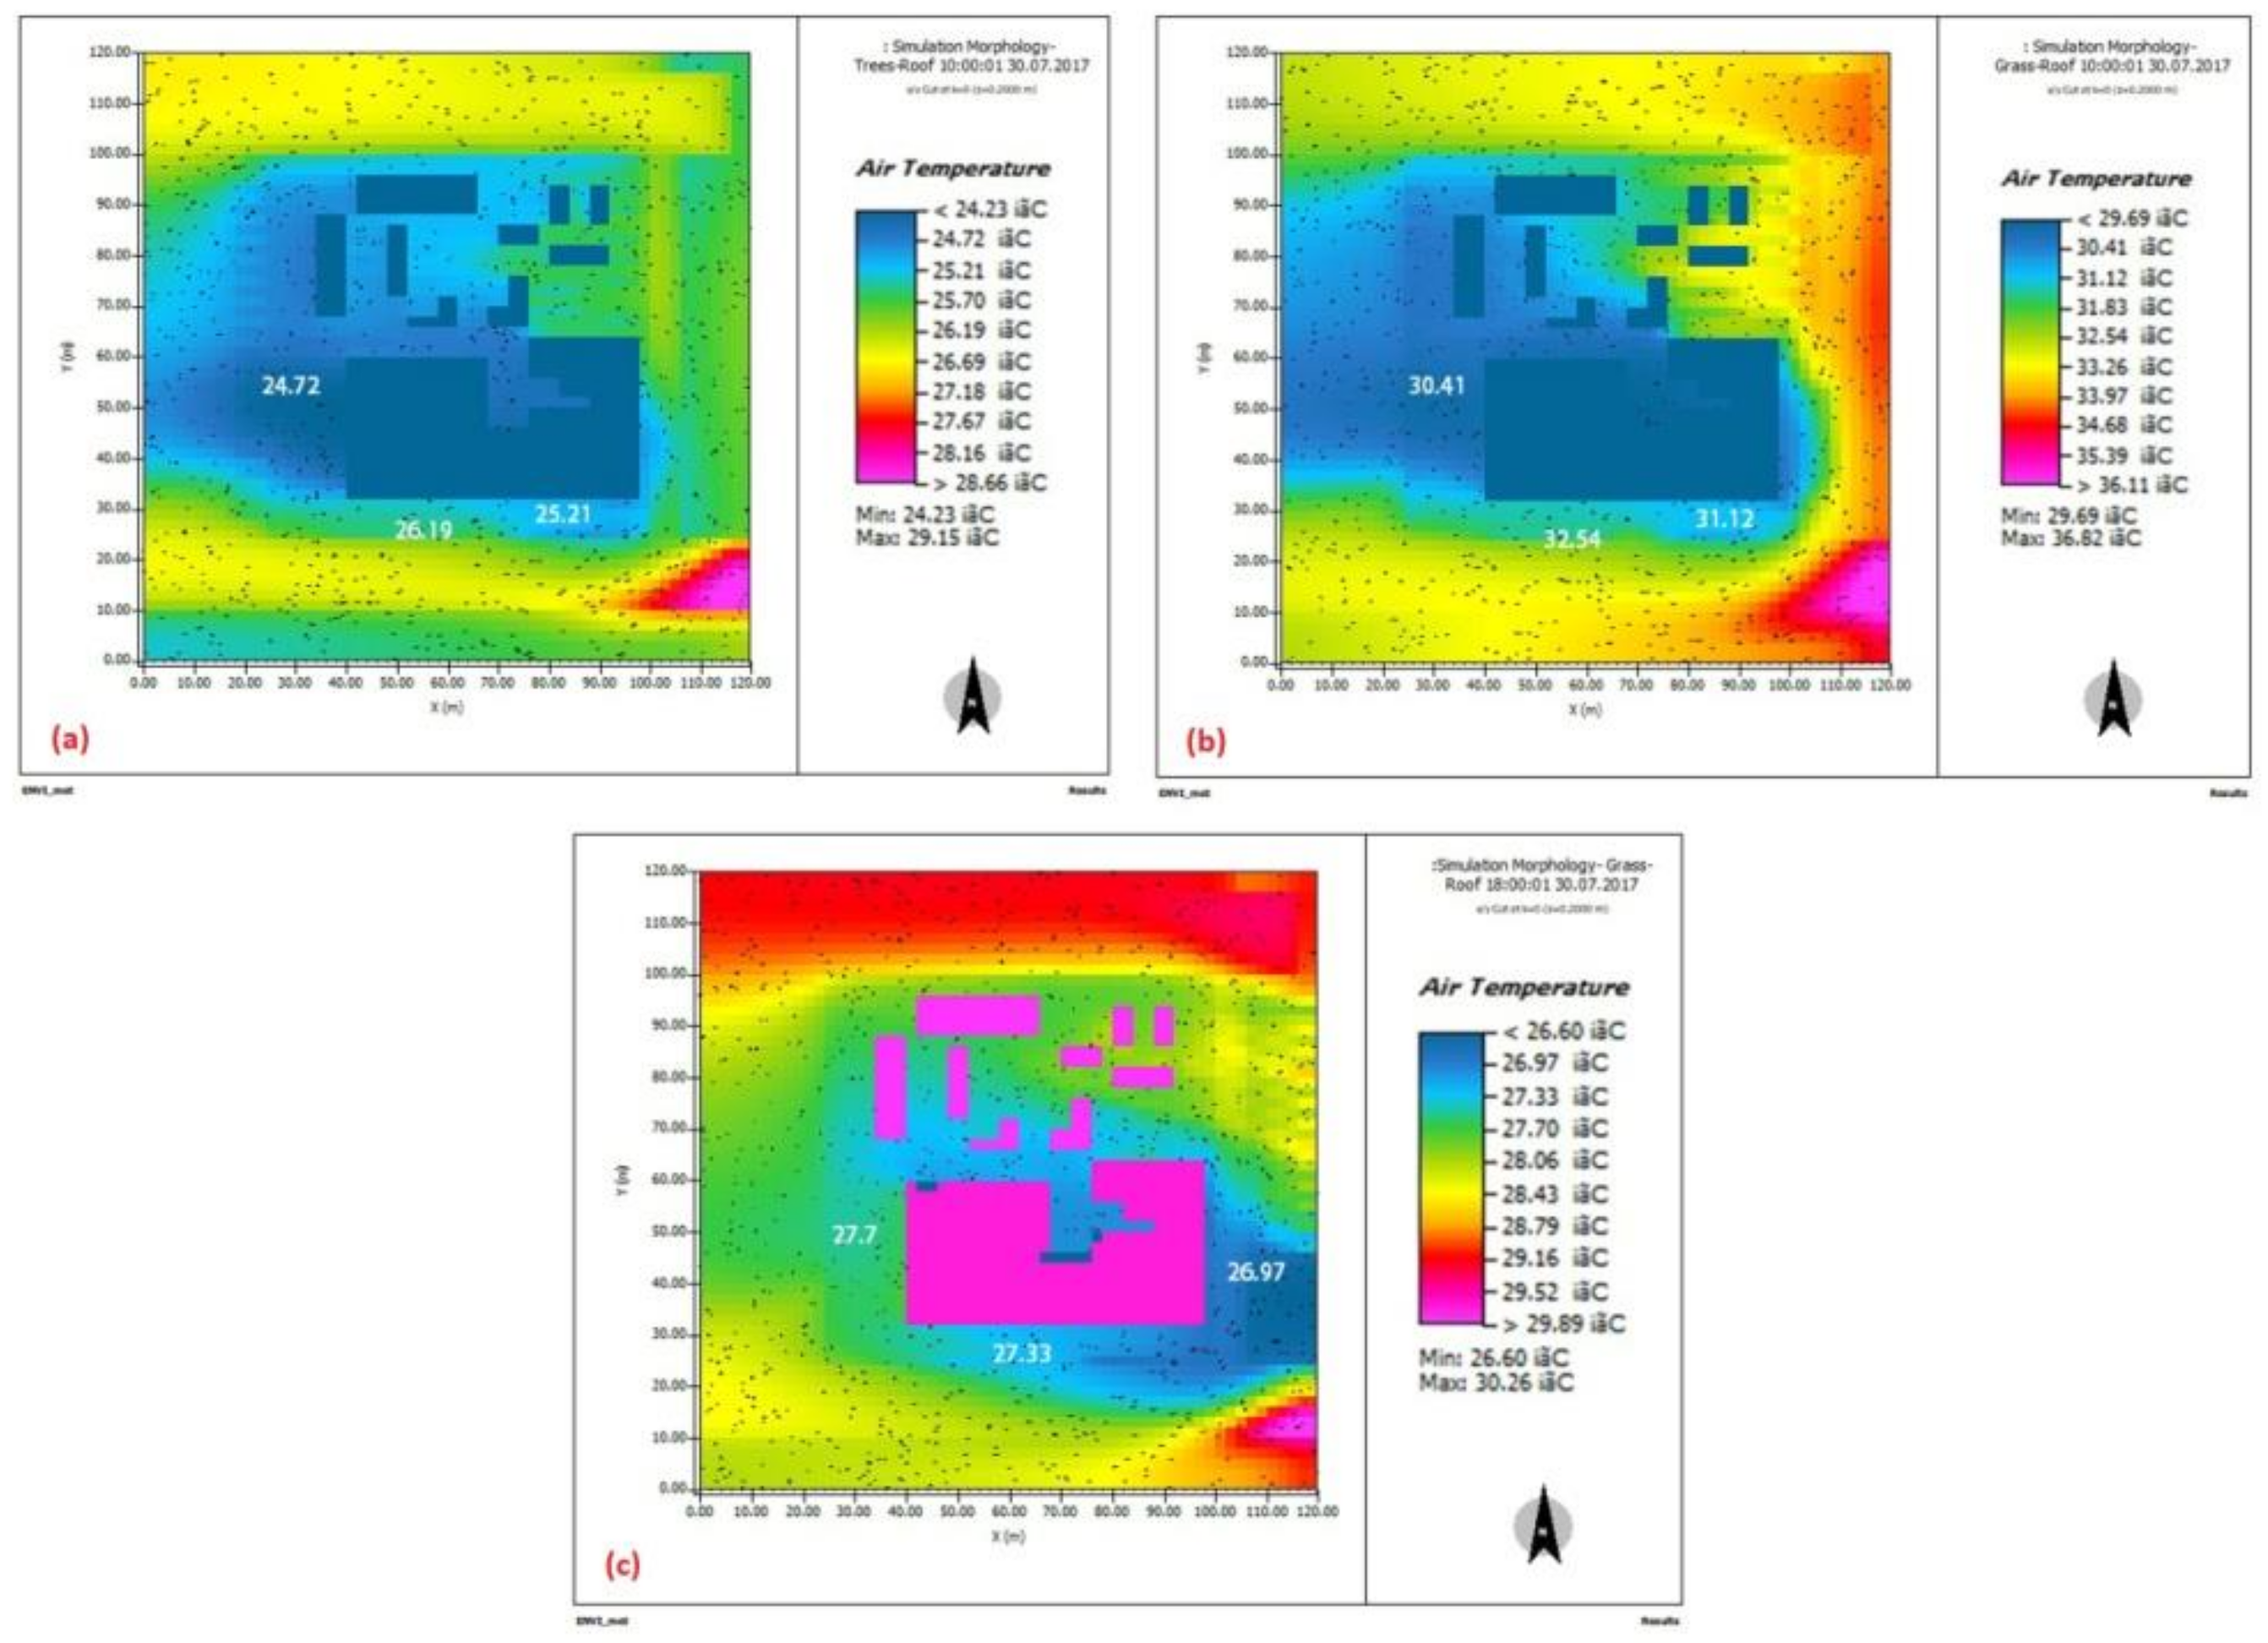
3.1.4. Simulation D (Tair Results for the Grass/Tree Roof Morphology)

In the fourth scenario (2013 grass/tree-planted roof morphology), the overall minimum temperature Tair was 24.2 °C in the morning and the maximum was 36.8 °C in the afternoon.
A discussion of the comparison of Tair values under different urban morphologies at different times of the day is presented in the subsequent section.

3.2. Difference in Tair at Specific Times under Different Morphologies

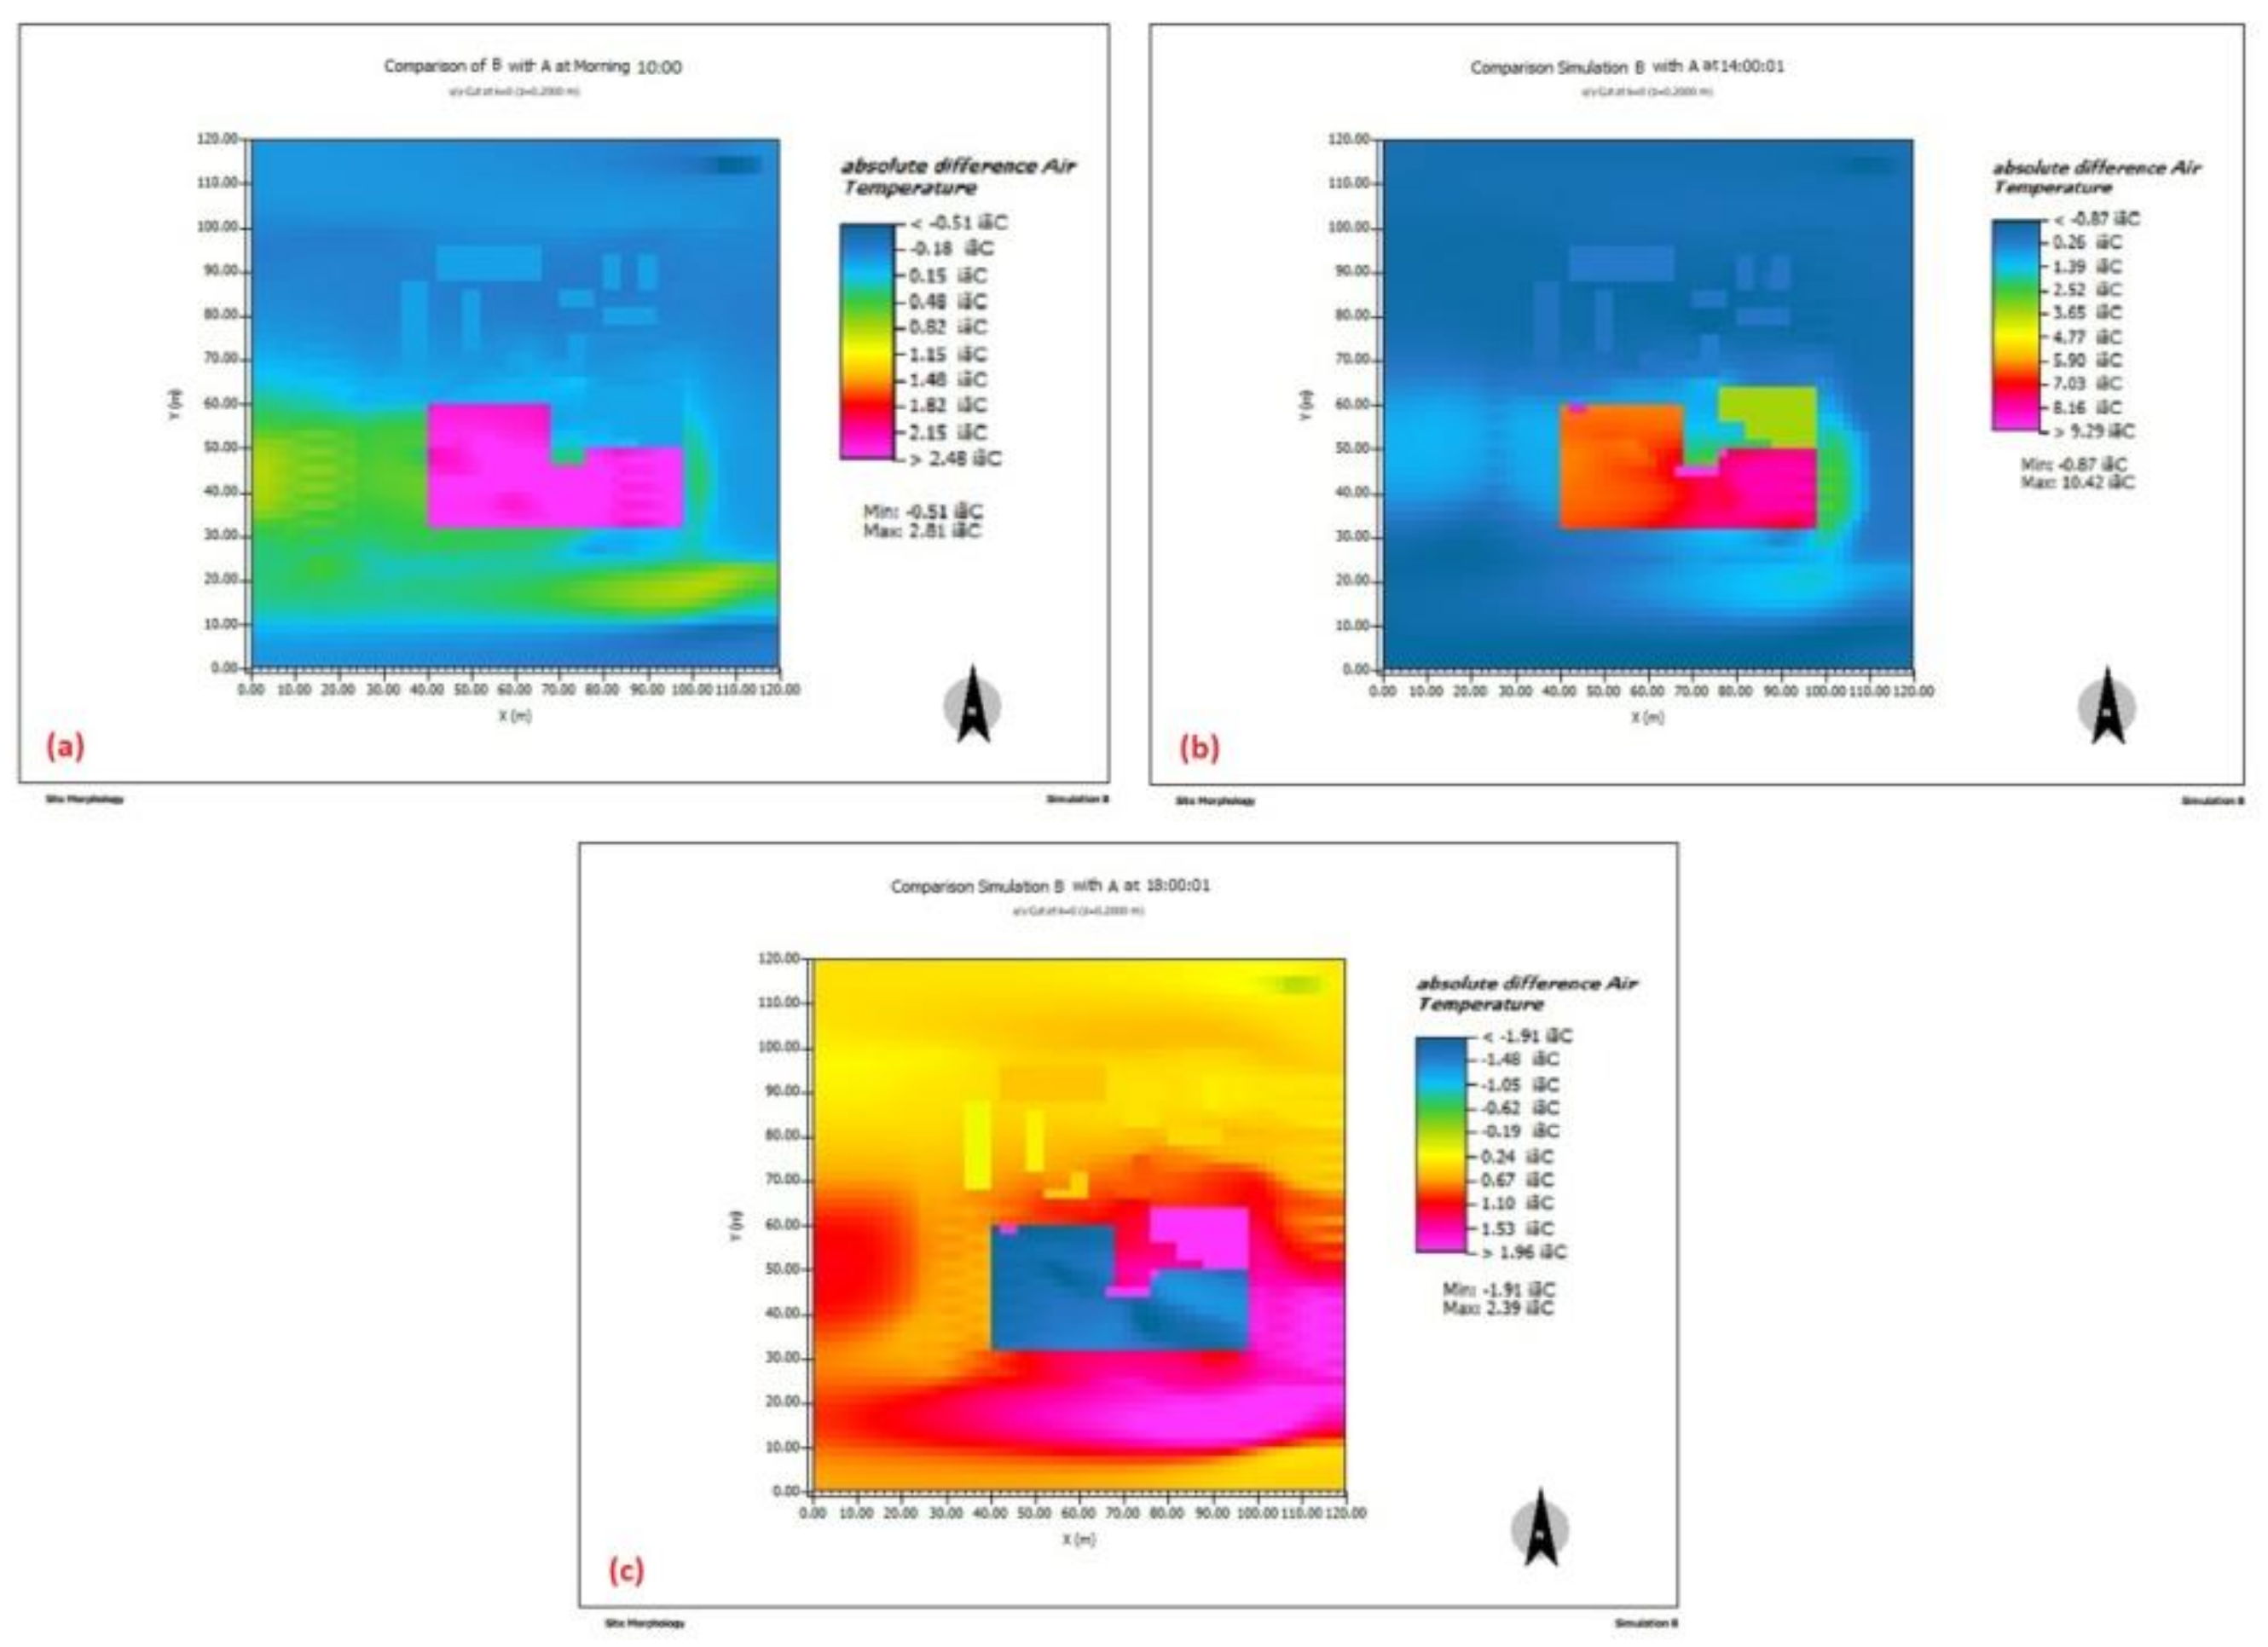
3.2.1. Comparison of Simulations B and A

The results from microclimatic simulations B and A are compared to determine thermal changes at the selected site.
  • Morning results
In the 2006 and 2013 morphologies, the average Tair values at areas with vegetation and trees ranged from 24 to 25 °C. The comparison points are presented in Figure 8a and Figure 9a. The negligible changes in Tair values may be attributed to the shading effect, especially at the western side of the study area, and minimal solar gains during the morning.
  • Afternoon results
In the 2006 morphology, average Tair values in areas with vegetation and trees were 31–33 °C. However, after the construction of new building blocks, average Tair values ranged from 30 to 32 °C, as shown in Figure 8b and Figure 9b. Shading effects accounted for variations in temperature during the afternoon. Tall buildings decreased Tair values.
  • Evening results
In the 2006 morphology, average Tair value in specific areas with vegetation and trees was 28 °C. However, after the construction of new building blocks, average Tair values decreased to 27 °C, and to less than 27 °C in areas such as the eastside of new building blocks (Figure 8c and Figure 9c).
The overall minimum and maximum Tair values in the morning and afternoon are almost the same for the 2013 and 2006 morphologies. The evening minimum and maximum Tair values of the 2013 morphology are less than that of the 2006 morphology. The shading effect of the new building blocks did not increase the maximum evening Tair value.

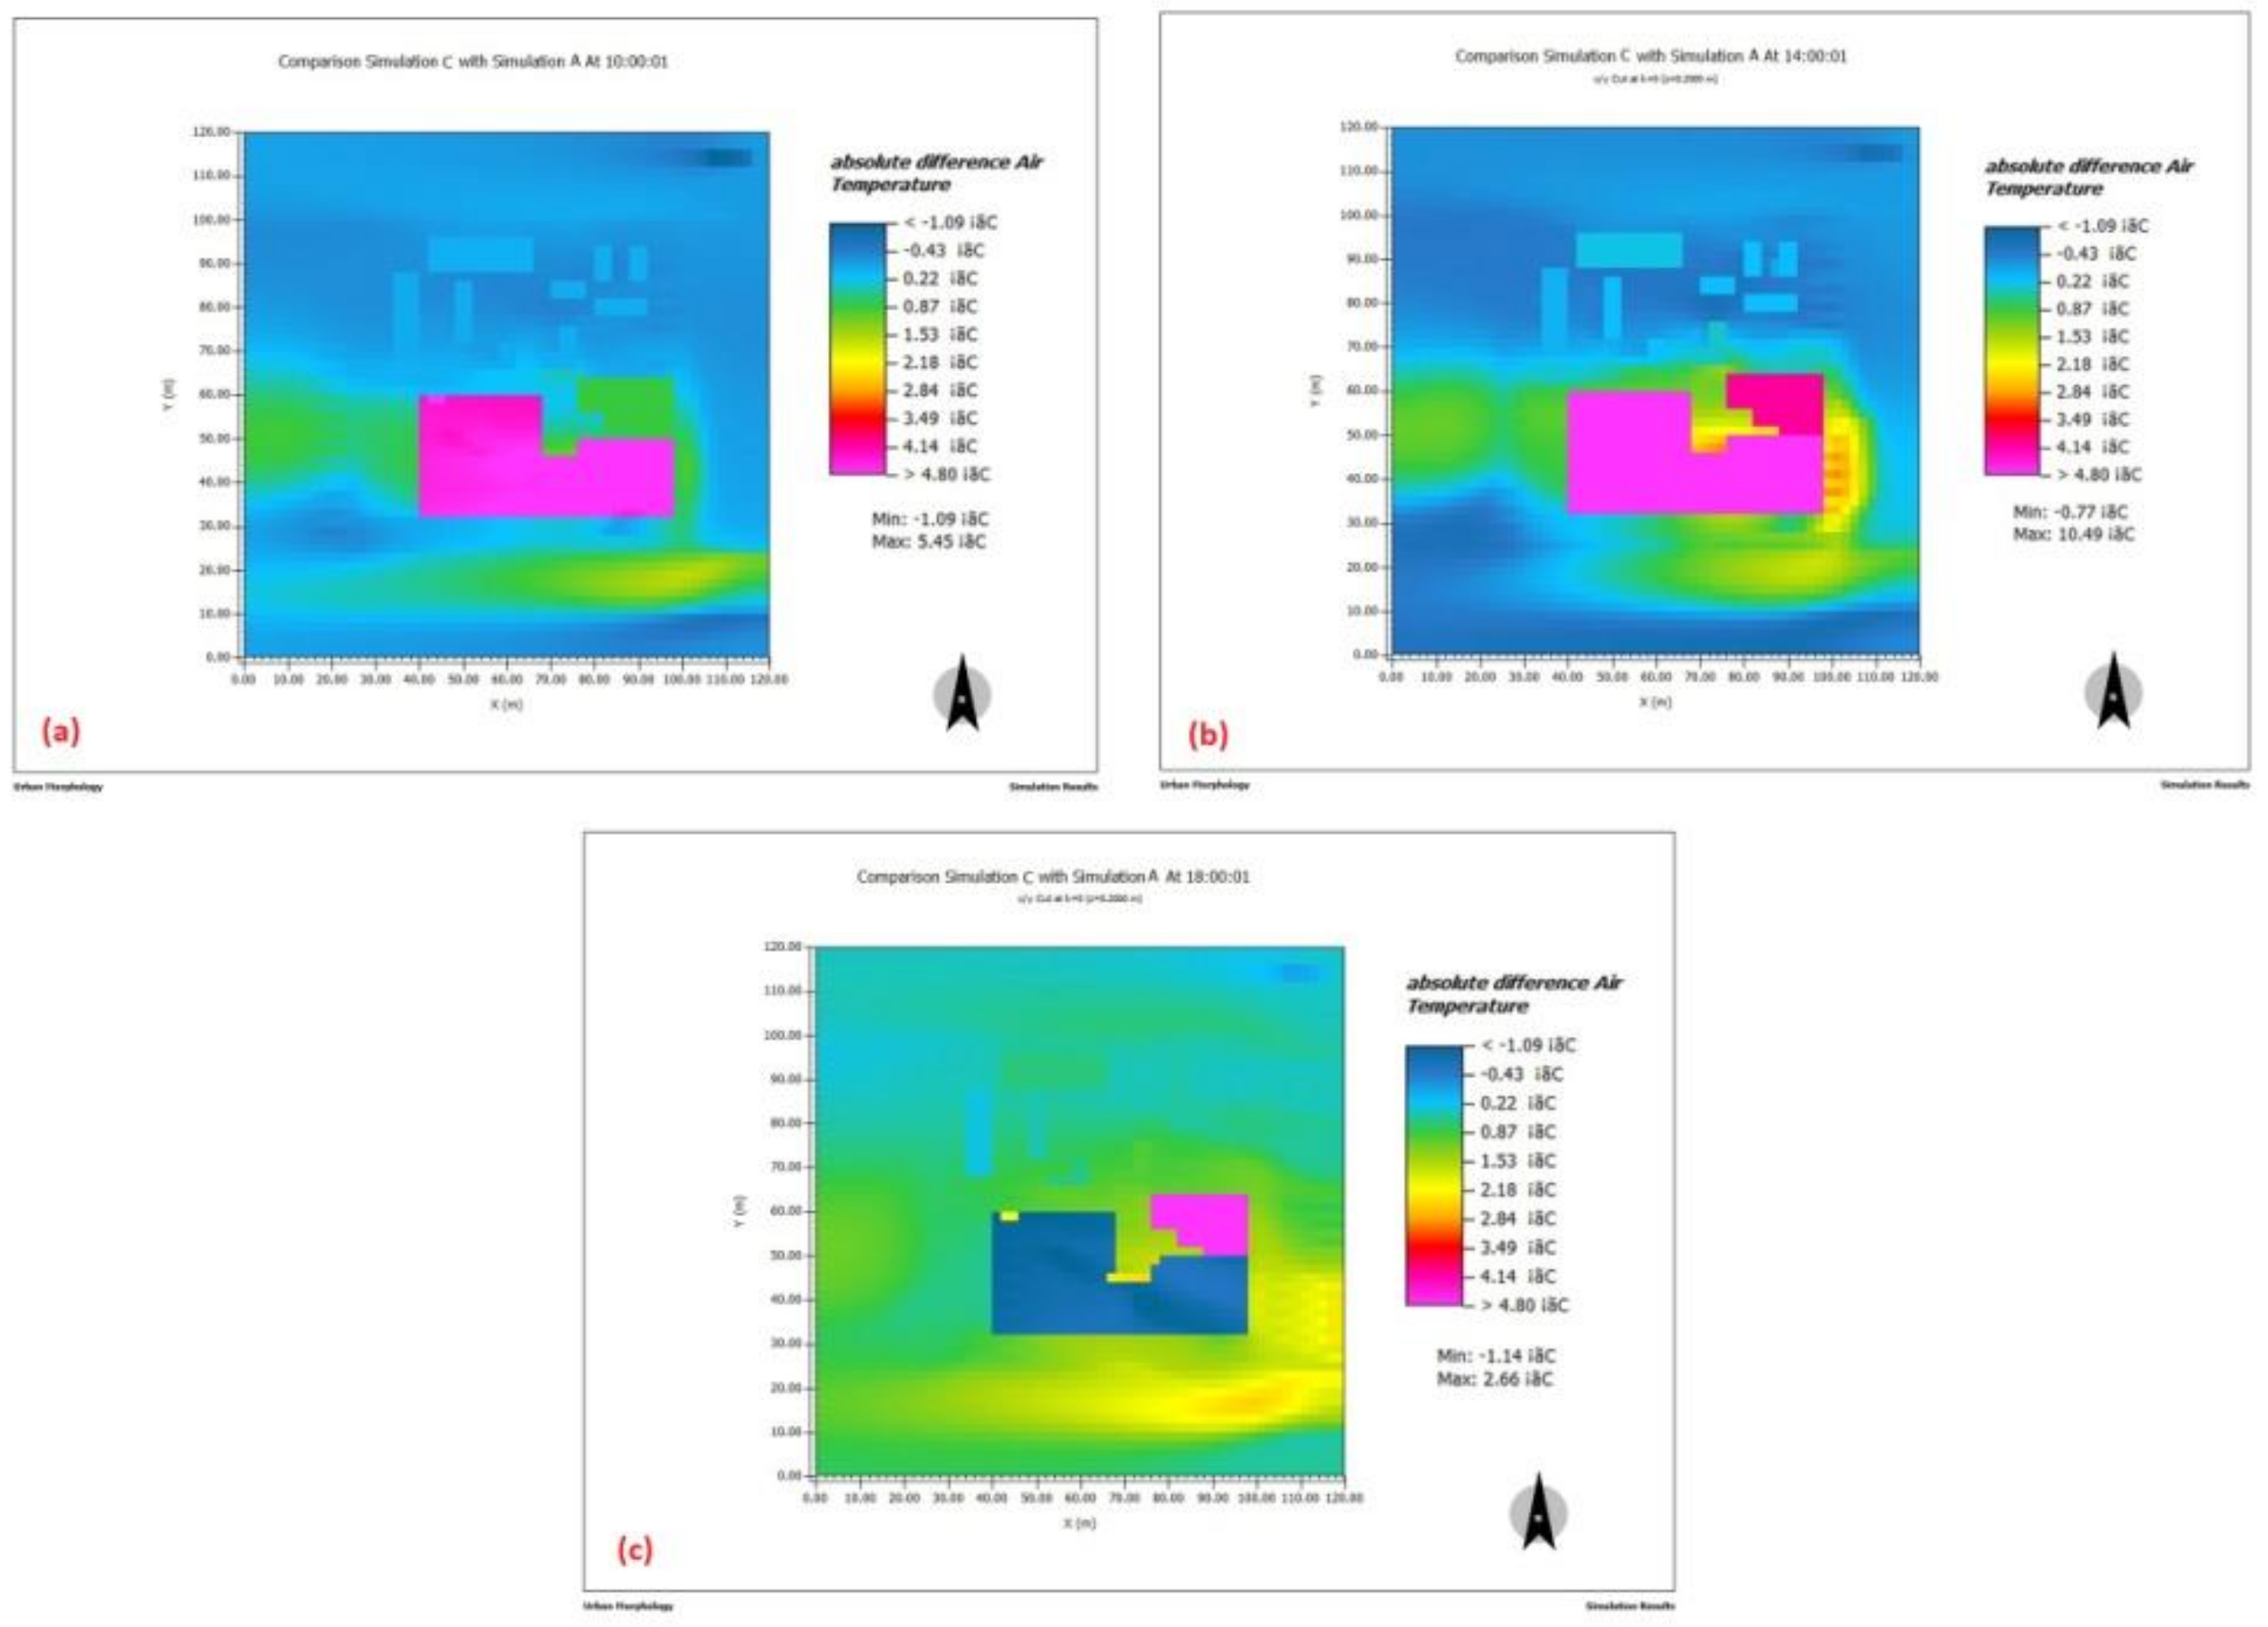
3.2.2. Comparison of Simulations C and A

The results from the simulations of scenarios C and A were compared to identify thermal changes at the selected site.
  • Morning results
In the 2006 morphology, the average values of Tair for specific areas with vegetation and trees fell in the range of 24–25 °C. However, after the construction of new building blocks with grass-planted roofs, the average Tair did not increase from 24 to 25 °C, as shown in Figure 8a and Figure 10a. The effect of the new building blocks on increased ambient temperature was less pronounced during the morning than at other times.
  • Afternoon results
In the 2006 morphology, the average values of Tair for specific areas with vegetation and trees fell in the range of 31–33 °C. After the construction of new building blocks with green roofs, the average values of Tair changed to 30 and 31 °C, as shown in Figure 8b and Figure 10b. Therefore, green roofs may potentially affect Tair values at the peak hour.
  • Evening results
In the 2006 morphology, the average value of Tair for specific areas with vegetation and trees was 28 °C. After the construction of new building blocks with green roofs, the average values of Tair decreased to 26 °C, and to less than 26 °C in some areas, such as the eastside of new building blocks. Thus, grass-planted roofs decreased the average values of Tair during the evening, as shown in Figure 8c and Figure 10c.
The overall minimum and maximum Tair values during mornings and afternoons are the same for the 2013 and 2006 morphologies. However, the evening Tair values of the 2013 morphology with grass-planted roofs were less than those of the 2006 morphology and almost the same as those of the 2013 morphology without green roofs. Therefore, grass-planted roofs mitigated the decreases in minimum and maximum Tair values during the afternoon.

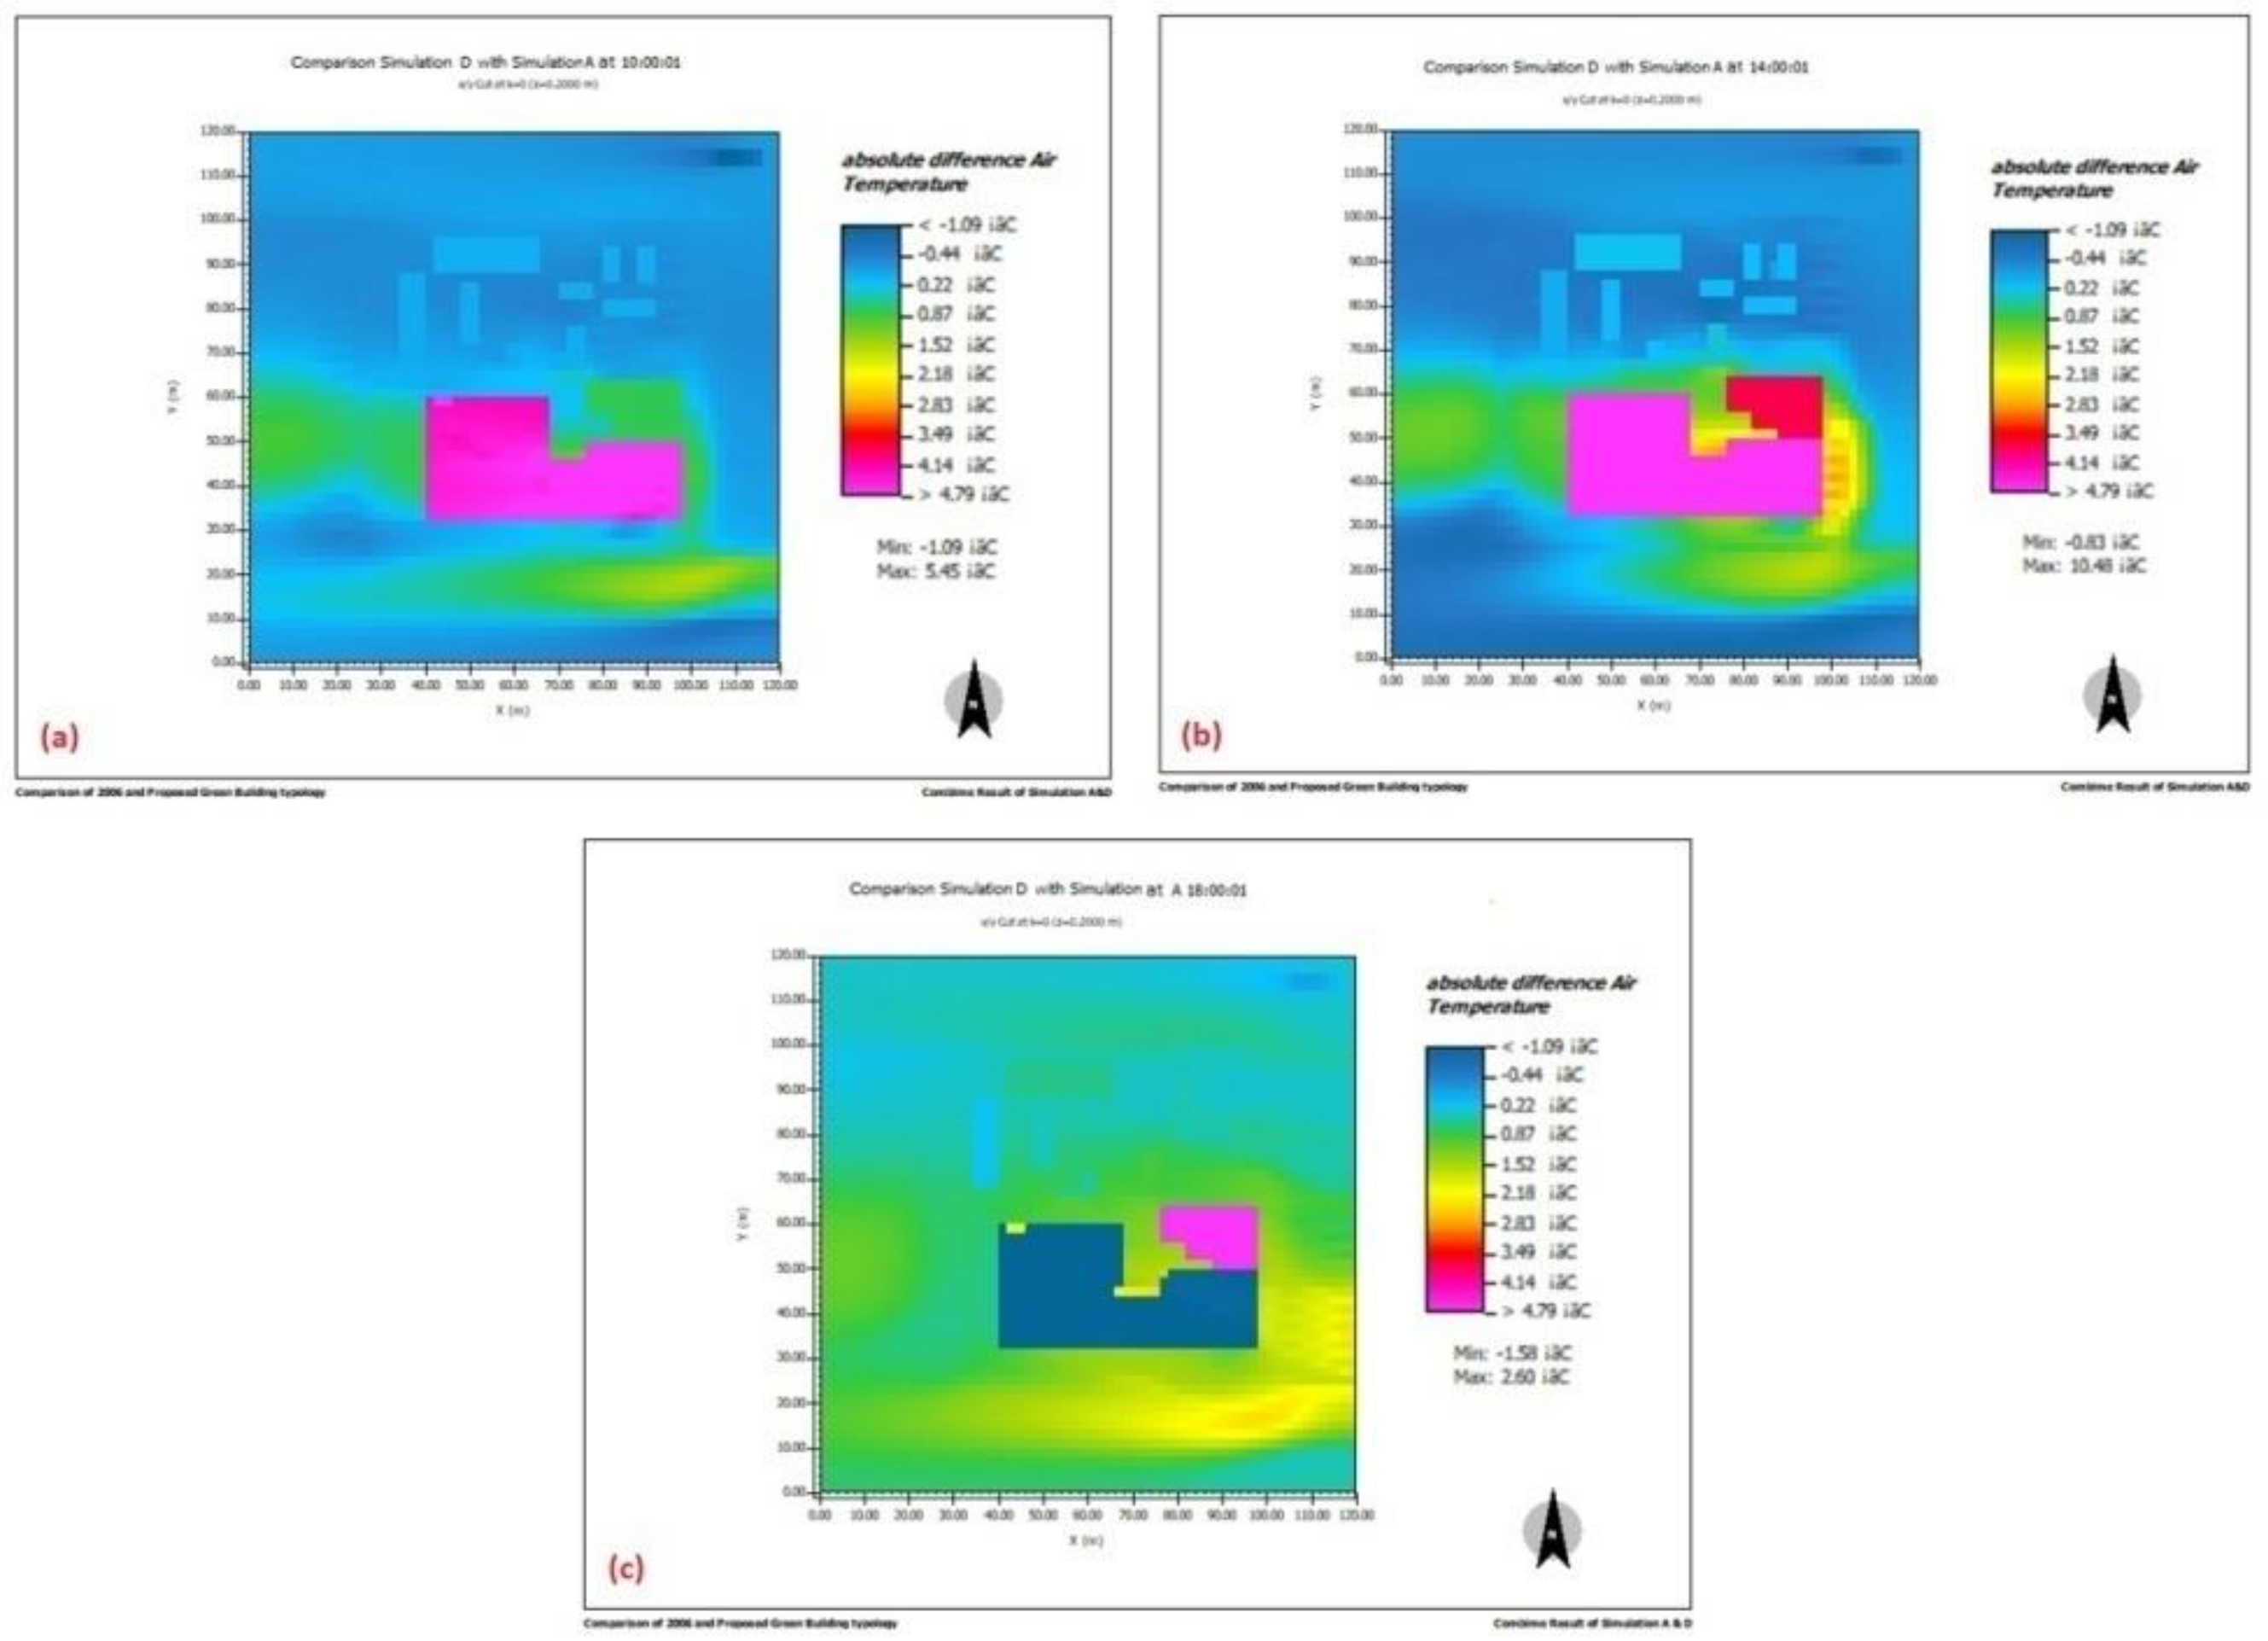
3.2.3. Comparison of Simulations D and A

The results for simulation scenarios D and A are compared to identify thermal changes at the selected site.
  • Morning results
In the 2006 morphology, average Tair values in areas with vegetation and trees fell in the range of 24–25 °C and did not increase after the construction of new building blocks with grass- and tree-planted roofs. Thus, the grass and tree roofs maintained Tair values at levels equivalent to those of the 2006 morphology, as shown in Figure 8a and Figure 11a.
  • Afternoon results
In the 2006 morphology, average Tair values in areas with vegetation and trees fell in the range of 31–33 °C and varied from 30 to 31 °C after the construction of new building blocks. Thus, the new building blocks, especially those facing west, decreased Tair values, as shown in Figure 8b and Figure 11b. The shading effect also contributed to the decrease in Tair values in the surrounding area.
  • Evening results
In the 2006 morphology, the average Tair value in the area with vegetation and trees was 28 °C and decreased to 26 °C after the construction of new buildings with tree-planted roofs. Thus, tree-planted roofs decreased the evening Tair values of specific sites, as shown in Figure 8c and Figure 11c. The shading effect of tall building blocks also contributed to the negligible increase in ambient temperature. In particular, buildings on the east side, where the ambient temperature was 26 °C, exerted a strong shading effect.
The overall minimum and maximum Tair values during mornings and afternoons were the same for the 2013 and 2006 morphologies. However, the evening temperature of the 2013 morphology with tree-planted roofs was less than that of the 2006 morphology Therefore, tree-planted roofs mitigated the decreases in minimum and maximum Tair values during the afternoon.

3.3. Tair Difference at Specific Times and Directions

The simulation results for scenarios A, B, C, and D were compared to identify thermal changes associated with urban morphology at specific locations.

3.3.1. Comparison of Simulations B and A

Figure 12 represents the comparison between the morning, afternoon, and evening Tair values for simulations B and A (2006 and 2013 morphologies) in a specific direction.
In the morning (Figure 12a), the maximum Tair difference was observed in the west and southwest, whereas the minimum was observed in the north. In the south, Tair increased as a result of road surface material characteristics (asphalt).
In the afternoon (Figure 12b), the maximum Tair difference was observed in the east, whereas the minimum difference was observed in theremaining directions. In the east, Tair values at the corners of building blocks increased, but they did not increase overall.
In the evening (Figure 12c), the maximum Tair difference was measured in the east and southeast, whereas the minimum was observed in the west. The difference likely increased in the south because of the effects of the road surface material (asphalt).
Table 4 shows that the maximum Tair difference was observedin the afternoon (14:00), with an average difference of approximately 2 °C in the east. Thermal comfort must be ensured during the afternoon and in the east. The minimum Tair difference in the morning was 0.3 °C in the east and south. In the 2013 morphology, the heat island effect was less intense during the morning in the east and south.

3.3.2. Comparison of Simulations C and A

Figure 13 represents the differences in Tair at three time points in various directions under scenarios A and C.
In the morning (Figure 13a), the maximum Tair difference was observed in the east and west, whereas the minimum difference was observed in the north and south. The values in the east and west were the same.
In the afternoon (Figure 13b), the maximum Tair difference was observed in the east and west and may be attributed to the solar angle, whereas the minimum difference was observed in the north and west and may be attributed to the duration of sun exposure.
In the evening (Figure 13c), the maximum Tair difference was observed in the east and west and may be attributed to the solar angle, whereas the minimum difference was observed in the north and west and may be attributed to characteristics of the asphalt road surface.
Table 5 shows that the maximum Tair difference was measured in the afternoon (14:00) and the evening, with an average difference of approximately 2 °C in the east. The minimum Tair was 0.3 °C in the north in the morning.

3.3.3. Comparison of Simulations D and A

Figure 14 presents differences in Tair at three time points in various directions under scenarios A and D.
In the morning (Figure 14a), the maximum Tair difference was observed in the east and west and may be attributed to solar angle. Nevertheless, the east side was affected by shading. The minimum difference was observed in the south and north.
In the afternoon (Figure 14b), the maximum Tair difference was observed in the east and was attributed to the duration of sun exposure and solar orientation. The minimum difference was observed in the north and west.
In the evening (Figure 14c), the maximum Tair difference was observed in the east and south and was attributed to the duration of sun exposure and solar orientation. The minimum difference was observed in the north and west.
Table 6 shows that the maximum Tair difference was measured in the afternoon (14:00) and the evening, with an average difference of approximately 2 °C in the east. The minimum difference was 0.3 °C in the north in the morning.

4. Discussion

4.1. Simulations B and A

The overall minimum and maximum values of air temperature for the 2013 morphology in the morning and afternoon were almost the same as the 2006 morphology. On the other hand, the evening minimum and maximum Tair for the 2013 morphology were less than those of the 2006 morphology. This means the new building blocks did not increase the maximum evening Tair.
Morning, afternoon, and evening Tair values varied at specific locations. Compared with the 2006 morphology, the 2013 morphology had a greater influence on Tair values at specific sites but not on the overall minimum and maximum values because of the additional building blocks at specific locations. The maximum Tair difference was measured in the afternoon (14:00), with an average difference of approximately 2 °C in the east. The minimum value was 0.3 °C and was observed in the morning in the east and south because of the impact of solar radiation.

4.2. Simulations C and A

The overall minimum and maximum values of air temperature for the 2013 morphology (grass roof) in the morning and afternoon were the same as the 2006 morphology; however, the evening temperature was less than that of the 2006 morphology and almost thesame as that of the 2013 morphology. Therefore, no decrease occurred in the afternoon peak temperature due to grass roofs with regard to overall minimum and maximum air temperature.
Morning, afternoon, and evening Tair values varied at locations near the new building blocks. The maximum difference was measured in the evening (18:00), with an average difference of approximately 1.8 °C in the east and south. Thus, the impact of grass roofs was less than that of concrete roofs at specific locations and directions. The minimum Tair value was 0.3 °C, observed in the morning in the north. Thus, the minimum Tair value of the new building blocks with grass-planted roofs was the same as that with concrete roofs. However, in all directions, the effect of concrete roofs on minimum Tair was less than that of the 2006 morphology.

4.3. Simulations D and A

The overall minimum and maximum values of air temperature for the 2013 morphology (grass/tree roofs) in the morning and afternoon were the same as those in the 2006 morphology; however, the evening temperature was less than that of the 2006 morphology and almost the same as that of the 2013 morphology. Therefore, no temperature decrease occurred in the afternoon peak temperature due to grass/tree roofs.
Morning, afternoon, and evening Tair values varied at different locations of new building blocks. The maximum Tair difference was measured in the afternoon (14:00) and evening (18:00), with an average difference of approximately 1.8 °C in the east and in southeast, respectively. Thus, the impact of tree-planted roofs on Tair was greater than that of the concrete roof. The minimum Tair value was 0.3 °C and was observed in the morning in the north. Similarly, the minimum value at the peak hour (14:00) was the same as that under the grass-planted roof but less than that under the concrete roof. The maximum Tair values under grass- or tree-planted roofs did not vary but were less than those under the grass-planted roofs in all directions at the peak hour. Therefore, tree-planted roofs drastically reduce outdoor temperatures and should be implemented.

4.4. All Simulations

In all simulations, morphologies with grass and tree-planted roofs provided minimum morning Tair values. Morphologies with grass-planted roofs, followed by those with tree-planted roofs, yielded minimum afternoon and evening Tair values. Furthermore, these morphologies provided maximum morning Tair values. Maximum afternoon Tair values were observed in the morphologies with grass-planted roofs, followed by those with tree roofs. Finally, maximum evening Tair values were observed in the morphologies with grass-planted roofs, followed by those with tree-planted roofs. The results of simulations A and D were less than those of other scenarios. Solar radiation intensity accounted for the negligible differences in morning and evening Tair values under all simulations. The decrease in evening Tair values may be attributed to regional climate. In tropical and subtropical regions, temperatures drastically drop during the evening and night. In tropical regions, the nighttime thermal performance of concrete roofs is better than that of other roof types [32].
The addition of tree-planted roofs, not building height, likely accounted for the decrease in afternoon Tair values. ENVI-met simultaneously calculates the maximum and minimum temperatures of a site. The simulation results show that the Tair values of the newly constructed building area were reduced in the morning and those with tree-planted roofs or areas with vegetation dropped in the evening. Accounting for positive and negative Tair values during the measurement period revealed consistency between theresults for the tree- and grass-planted roofs.
The temperature-mitigating effect of grass roofs was less than that of tree-planted roofs. Nevertheless, grass-planted roofs have the potential to reduce temperatures and influence the thermal condition of the surrounding environment. In other words, green roofs may reduce the urban heat island effect by reducing Tair values. Thus, the implementation of large-scale cooling surfaces as roofing may lower temperatures in urban areas [33]. Similarly, the duration of direct sun exposure and the mean radiant temperature affect urban thermal comfort under the influence of urban layouts [34]. Other studies have also evaluated the importance of green roofs under different climatic conditions [34,35]. The morning, afternoon, and evening Tair values of the morphologies with grass-planted and concrete roofs varied. This result confirms that green roofs affect the urban microclimate. Hybrid strategies, such as combined vegetation, green roofs, and high-albedo materials, provide an average cooling effect of 1.1 °C [34].

5. Conclusions

In this study, the impacts of urban morphological transformation on the thermal microenvironment were investigated, and some important simulation tools that can be used to analyze these impacts were highlighted. The results of this study show that quantitative measurement of the urban microclimate is a valid method for understanding the microclimatic effects of urbanization.
Considerable effort has been devoted to mitigating the negative microclimatic impacts of the rapid urbanization of tropical cities. However, simulations that quantify the effects at specific periods, hours, and directions are rarely performed. Comparing models and actual data for Tair at specific times and periods can provide guidelines for landscape and urban designers. The four morphologies investigated in this study provided different Tair values under specific microclimatic conditions. The present work quantified the impact of urban morphological transformation on the thermal environment at specific times and directions and determined the microclimatic impact of green roofs. New tall building blocks in urban areas will not increase morning and afternoon ambient temperature, and the evening temperature will drop. At specific directions, maximum difference in Tair was measured in the east. No decrease occurred in afternoon peak temperature due to grassroofs with regard to the overall minimum and maximum air temperature. The investigated conditions and the proposed green roofing strategies on a typical summer day were simulated using ENVI-met. Under all simulation conditions, Tair values in the morning were lower than those in the afternoon and evening.
Tair prediction through ENVI-met is a reasonable approach for the quantification of urban microclimates. The simulation results suggest that the ENVI-met model can predict the main spatial distributions of ambient Tair and confirm that the effects of concrete roofs on urban microclimates are more intense than those of grass- and tree-planted roofs. The results also indicate that replacing existing roof structures with green roofs can reduce Tair values by 1–2 °C at specific times and locations. Therefore, both green roofing strategies have potential impacts on urban Tair values. Nevertheless, the differences in minimum and maximum Tair values in the morning, afternoon, and evening under all simulated morphologies are negligible. The results of this study may help guide institutions, decision makers, and industries in the implementation of green building and environmental initiatives. This research also provides a new method for analyzing urban morphology in tropical regions and evaluating urban microclimate mitigation strategies.

Author Contributions

For research articles with several authors, a short paragraph specifying their individual contributions must be provided. The following statements should be used “conceptualization, S.A. and B.L.; methodology, S.A.; software, S.A.; validation, B.L., S.A. and Z.Z.; formal analysis, S.A.; investigation, S.A.; resources, B.L.; data curation, S.A.; writing—original draft preparation, S.A.; writing—review and editing, S.A.; visualization, S.A.; supervision, B.L.; project administration, S.A.; funding acquisition, B.L.”, please turn to the CRediT taxonomy for the term explanation. Authorship must be limited to those who have contributed substantially to the work reported.

Funding

This research was funded by NSFC, grant number 51538004 and the APC was funded by HEC.

Conflicts of Interest

The authors declare no conflict of interest.

References

  1. Gribble, J.N. World Population Data Sheet 2012; Population Reference Bureau: Washington, DC, USA, 2012. [Google Scholar]
  2. Karteris, M.; Theodoridou, I.; Mallinis, G.; Tsiros, E.; Karteris, A. Towards a green sustainable strategy for Mediterranean cities: Assessing the benefits of large-scale green roof simple mentation in Thessaloniki, Northern Greece, using environmental modelling, GIS and very high spatial resolution remote sensing data. Renew. Sustain. Energy Rev. 2016, 58, 510–525. [Google Scholar] [CrossRef]
  3. Rizwan, A.M.; Dennis, L.Y.; Chunho, L. Are view on the generation, determination and mitigation of Urban Heat Island. J. Environ. Sci. 2008, 20, 120–128. [Google Scholar] [CrossRef]
  4. Gago, E.J.; Roldan, J.; Pacheco-Torres, R.; Ordóñez, J. The city and urban heat islands: Are view of strategies to mitigate adverse effects. Renew. Sustain. Energy Rev. 2013, 25, 749–758. [Google Scholar] [CrossRef]
  5. Dugord, P.-A.; Lauf, S.; Schuster, C.; Kleinschmit, B. Land use patterns, temperature distribution, and potential heat stress risk– The case study Berlin, Germany. Comput. Environ. Urban Syst. 2014, 48, 86–98. [Google Scholar] [CrossRef]
  6. Li, J.; Jiang, Y. Calculation and Empirical Analysis on the Contributions of R & D Spending and Patents to China’s Economic Growth. Theor. Econ. Lett. 2016, 6, 1256. [Google Scholar]
  7. Taha, H. Urban climate sand heat islands: Albedo, evapotranspiration, and anthropogenic heat. Energy Build. 1997, 25, 99–103. [Google Scholar] [CrossRef]
  8. Allegrini, J.; Dorer, V.; Carmeliet, J. Influence of the urban microclimate in street canyons on the energy demand for space cooling and heating of buildings. Energy Build. 2012, 55, 823–832. [Google Scholar] [CrossRef]
  9. Horikoshi, T.; Tsuchikawa, T.; Kobayashi, Y. Changes of landscape and dwellings with wind breaks caused by urbanization in Central Japan. Energy Build. 1990, 15, 305–313. [Google Scholar] [CrossRef]
  10. Xiong, J.; Lian, Z.; Zhou, X.; You, J.; Lin, Y. Potential indicators for the effect of temperature steps on human health and thermal comfort. Energy Build. 2016, 113, 87–98. [Google Scholar] [CrossRef]
  11. Ahmed, K.S. Comfort in urban spaces: Defining the boundaries of outdoor thermal comfort for the tropical urban environments. Energy Build. 2003, 35, 103–110. [Google Scholar] [CrossRef]
  12. Rosenfeld, A.H.; Akbari, H.; Romm, J.J.; Pomerantz, M. Cool communities: Strategies for heat island mitigation and smog reduction. Energy Build. 1998, 28, 51–62. [Google Scholar] [CrossRef]
  13. Klemm, W.; Heusinkveld, B.G.; Lenzholzer, S.; Jacobs, M.H.; Van Hove, B. Psychological and physical impact of urban green spaces on outdoor thermal comfort during summer time in The Netherlands. Build. Environ. 2015, 83, 120–128. [Google Scholar] [CrossRef]
  14. Gill, S.E.; Handley, J.F.; Ennos, A.R.; Pauleit, S. Adapting cities for climate change: The role of the green infrastructure. Built Environ. 2007, 33, 115–133. [Google Scholar] [CrossRef]
  15. Oke, T.R. The distinction between canopy and boundary-layer urban heat islands. Atmosphere 1976, 14, 268–277. [Google Scholar] [CrossRef]
  16. Arnfield, A.J. Two decades of urban climate research: Are view of turbulence, exchanges of energy and water, and the urban heat island. Int. J. Climatol. 2003, 23, 1–26. [Google Scholar] [CrossRef]
  17. Bruse, M.; Fleer, H. Simulating surface–plant–air interactions inside urban environments with a three dimensional numerical model. Environ. Model. Softw. 1998, 13, 373–384. [Google Scholar] [CrossRef]
  18. Neuenschwander, N.; Hayek, U.W.; Grêt-Regamey, A. Integrating an urban green space typology into procedural 3D visualization for collaborative planning. Comput. Environ. Urban Syst. 2014, 48, 99–110. [Google Scholar] [CrossRef]
  19. Salata, F.; Golasi, I.; De Lieto Vollaro, R.; De Lieto Vollaro, A. Urban microclimate and outdoor thermal comfort. A proper procedure to fit ENVI-met simulation outputs to experimental data. Sustain. Cities Soc. 2016, 26, 318–343. [Google Scholar] [CrossRef]
  20. Gómez, F.; Gil, L.; Jabaloyes, J. Experimental investigation on the thermal comfort in the city: Relationship with the green areas, interaction with the urban microclimate. Build. Environ. 2004, 39, 1077–1086. [Google Scholar] [CrossRef]
  21. Oliveira, S.; Andrade, H.; Vaz, T. The cooling effect of green spaces as a contribution to the mitigation of urban heat: A case study in Lisbon. Build. Environ. 2011, 46, 2186–2194. [Google Scholar] [CrossRef]
  22. Krüger, E.; Minella, F.; Rasia, F. Impact of urban geometry on outdoor thermal comfort and air quality from field measurements in Curitiba, Brazil. Build. Environ. 2011, 46, 621–634. [Google Scholar] [CrossRef]
  23. Chen, L.; Ng, E. Outdoor thermal comfort and outdoor activities: A review of research in the past decade. Cities 2012, 29, 118–125. [Google Scholar] [CrossRef]
  24. Yang, X.; Zhao, L.; Bruse, M.; Meng, Q. An integrated simulation method for building energy performance assessment in urban environments. Energy Build. 2012, 54, 243–251. [Google Scholar] [CrossRef]
  25. Skelhorn, C.; Lindley, S.; Levermore, G. The impact of vegetation types on air and surface temperatures in a temperate city: A fine scale assessment in Manchester, UK. Landsc. Urban Plan. 2014, 121, 129–140. [Google Scholar] [CrossRef]
  26. weatherspark.com. Available online: https://weatherspark.com/y/128408/Average-Weather-in-Wuhan-China-Year-Round (accessed on 30 July 2017).
  27. www.meteoblue.com. 2006–2018. Available online: https://www.meteoblue.com/en/weather/forecast/week/beijing_china_1816670 (accessed on 30 July 2017).
  28. Landborn, A.; Von Dardel, S. Climate Smart Fortaleza; Division of Water Resources Engineering; Lund University: Lund, Sweden, 2015. [Google Scholar]
  29. Chow, W.T.; Brazel, A.J. Assessing xeriscaping as a sustainable heat island mitigation approach for a desert city. Build. Environ. 2012, 47, 170–181. [Google Scholar] [CrossRef]
  30. Taleghani, M.; Kleerekoper, L.; Tenpierik, M.; Van den Dobbelsteen, A. Outdoor thermal comfort within five different urban forms in the Netherlands. Build. Environ. 2015, 83, 65–78. [Google Scholar] [CrossRef]
  31. Emmanuel, M.R. An Urban Approach to Climate-Sensitive Design: Strategies for the Tropics; Taylor & Francis: New York, NY, USA, 2005. [Google Scholar]
  32. Takakura, T.; Kitade, S.; Goto, E. Cooling effect of greenery cover over a building. Energy Build. 2000, 31, 1–6. [Google Scholar] [CrossRef]
  33. Tsoka, S.; Tsikaloudaki, K.; Theodosiou, T. Urban space’s morphology and microclimatic analysis: A study for a typical urban district in the Mediterranean city of Thessaloniki, Greece. Energy Build. 2017, 156, 96–108. [Google Scholar] [CrossRef]
  34. Razzaghmanesh, M.; Beecham, S.; Salemi, T. The role of green roofs in mitigating Urban Heat Island effects in the metropolitan area of Adelaide, South Australia. Urban For. Urban Green. 2016, 15, 89–102. [Google Scholar] [CrossRef]
  35. Lobaccaro, G.; Acero, J.A. Comparative analysis of green actions to improve outdoor thermal comfort inside typical urban street canyons. Urban Clim. 2015, 14, 251–267. [Google Scholar] [CrossRef]
Figure 1. Map of China; Wuhan location and climate.
Buildings 08 00182 g001
Figure 2. Flow diagram of the study method.
Buildings 08 00182 g002
Figure 3. 2006 site morphology.
Buildings 08 00182 g003
Figure 4. 2013 site morphology.
Buildings 08 00182 g004
Figure 5. 2006 site morphology (left) and 2013 site morphology (right).
Buildings 08 00182 g005
Figure 6. 2006 3D morphology (left) and 2013 3D morphology (right) in ENVI-met.
Buildings 08 00182 g006
Figure 7. 2013 3D morphology of grass-planted roof (left) and 2013 3D morphology of grass-/tree-planted roof (right) in ENVI-met.
Buildings 08 00182 g007
Figure 8. ENVI-met simulation outputs for Tair at (a) 10:00; (b) 14:00; and (c) 18:00.
Buildings 08 00182 g008
Figure 9. ENVI-met simulation outputs for Tair at (a) 10:00; (b) 14:00; and (c) 18:00.
Buildings 08 00182 g009
Figure 10. ENVI-met simulation outputs for Tair at (a) 10:00; (b) 14:00; and (c) 18:00.
Buildings 08 00182 g010
Figure 11. ENVI-met simulation outputs for Tair at (a) 10:00; (b) 14:00; and (c) 18:00.
Buildings 08 00182 g011
Figure 12. Comparison of Tair differences in the(a) morning; (b) afternoon; and (c) evening.
Buildings 08 00182 g012
Figure 13. Comparison of differences in Tair in the (a) morning; (b) afternoon; and (c) evening.
Buildings 08 00182 g013
Figure 14. Comparison of differences in Tair in the(a) morning; (b) afternoon; and (c) evening.
Buildings 08 00182 g014
Table 1. Weather data of all simulations.
Air TemperatureHumidityWind Characteristics
In Wuhan City, the summer daily average temperatures reach 28 °C. In July, the daily maximum temperature increases by about 3 °C, from 30 to 33 °C, and rarely falls below 25 °C orexceeds 36 °C. The average daily maximum temperature is 33 °C on 31 July. On 30 July, the hottest day of the season, temperatures typically range from 27 to 33 °C. In July, comfortable temperatures occur between 04:00 and 08:00. The temperature increases after 08:00 and peaks after 12:00. The maximum temperature occurs at 12:00 and lasts until 20:00.The humidity comfort level is based on dew points. In tropical areas such as Wuhan, dew points tend to change slowly; a muggy day is usually followed by a muggy night despite decreased temperature at night. The average relative humidity is 78%. The muggy period lasts for about 5 months, from April to October. The days with the highest and lowest relative humidity values were observed in July and November, respectively. For reference, 14 July is the muggiest day of the year with 100% muggy condition.In Wuhan, the average wind speed is mostly constant within the range 3.2m/s (6.3 knots) to 3.5m/s (6.8 knots) at an average 3.3 m/s throughout the month. Wind mainly originates from the east during March–April (3.3 weeks) and August–September (1.5weeks). The peak percentage (57%) of wind flow is from the south, measured on 15 July. Given that the simulation was conducted on 31 July, the second dominant wind direction (east) was selected to account for the presence of large buildings on the south side of the site.
The average wind speed from May to August is 3.34m/s (6.7 knots) from the south. Hourly average wind vector (speed and direction) was measured at 10 m above the ground. Dominant average hourly wind direction varies throughout the year.
Table 2. Basic information of the selected site.
SiteSimulation ASimulation BSimulation CSimulation D
Total area45,000 m245,000 m245,000 m245,000 m2
Covered area19,350 m236,450 m236,450 m236,450 m2
Green area25,650 m28550 m222,210 m222,210 m2
Green covered ratio1.320.230.860.86
Table 3. Initial parameters of all simulations.
Main DataInput
Start simulation on day (dd.mm.yyyy)30.07.2017
Start simulation time (hh:mm:ss)06:00:00
Total simulation time in hours12.00
Wind speed in 10m in m/s3.13
Wind direction (90°:N; 0°:E; 90°:S; 180°:W)90
Initial temperature in °C21
Specific humidity in 2500 m (g water/kg air)19
Relative humidity in 2m (%)78
Roughness length (at reference point)0.01
Table 4. Differences in Tair at three time points in various directions under scenarios A and B.
DirectionsMorning (10:00) RangesAfternoon (14:00) RangesEvening (18:00) Ranges
East0.15–0.48(0.31)1.39–2.52(1.95)1.10–1.53(1.31)
West0.48−0.82(0.65)0.26–1.39(0.82)0.24–0.67(0.45)
North0.18–0.15(0.16)0.26–1.39(0.82)0.67–1.10(0.88)
South0.15–0.48(0.31)0.26–1.39(0.82)1.10–1.53(1.31)
Table 5. Differences in Tair at three time points under scenarios A and C.
DirectionsMorning (10:00) RangesAfternoon (14:00) RangesEvening (18:00) Ranges
East0.22–0.87(0.54)1.53–2.18(1.8)1.5–2.18(1.85)
West0.22–0.87(0.54)0.22–0.87(0.54)0.87–1.53(1.2)
North0.43–0.22(0.32)0.22–0.87(0.54)0.87–1.53(1.2)
South0.87–1.53(1.2)0.87–1.53(1.2)1.53–2.18(1.85)
Table 6. Differences in Tair at three time points in various directions under scenarios A and D.
DirectionsMorning (10:00) RangesAfternoon (14:00) RangesEvening (18:00) Ranges
East0.2–0.87(0.54)1.52–2.18(1.85)1.5–2.18(1.85)
West0.2–0.87(0.54)0.22–0.87(0.54)0.22–0.87(0.54)
North0.44–0.22(0.33)0.22–0.87(0.54)0.87–1.52(1.63)
South0.87–1.52(1.19)0.87–1.52(1.19)1.52–2.18(1.85)

