1. Introduction
In the future, the European energy system is expected to exhibit an increasing share of fluctuating renewable energy sources [
1]. This requires the management of multiple advanced energy conversion and storage technologies operating across different energy carriers to optimize the rational conversion of bio and fossil resources through dedicated multi-energy-systems. This is best understood with the concept of an energy hub, firstly introduced by Geidl et al. [
2] and further expanded by multiple researchers [
3,
4,
5]. On an urban scale, possible environomic (i.e., thermodynamic, economic, and environmental) advantages of energy hubs with respect to conventional centralized energy systems were described by several researchers. For example, Chicco and Mancarella [
6] as well as Koirala et al. [
7] highlight the possibility to deliver more environmentally friendly energy services at lower costs, both for the system, due to the potential for grid stabilization, as well as for the individual customer, due to the possibility of benefiting from varying market prices. However, due to the increased complexity of such systems, one needs to incorporate a more holistic perspective when assessing the economic benefits [
8,
9]. As a consequence, there is a lack of studies assessing multiple economic value streams of a distributed energy system simultaneously.
The local management of the energy supply, demand, and storage is expected to provoke a fundamental reorganization of the power sector, yielding new emerging business opportunities [
10]. Amongst others, the market valorization of the flexibility offered by the combination of smart grids and distributed generation is considered as a promising new business opportunity. Already in 2013, Mancarella and Chicco [
11] described the benefits emerging from the ability of multi-energy-systems to shift loads from one energy carrier to another and store energy in various forms and exploit such flexibility on ancillary services markets. As a consequence, for example, research was performed to estimate the value of the flexibility of multiple aggregated prosumers for the spot market under given bidding rules [
12]. Other studies have dealt with the development of control schemes to optimize local energy management considering possibilities for market participation [
13,
14], stochastic market prices [
15], and locally distributed intelligence for grid congestion and management [
16]. All of these studies indicate a large potential of the local flexibility. Still lacking, however, is an assessment of the monetary value of local energy systems flexibility considering simultaneous participation in both the spot and reserve electricity markets.
Some researchers have identified the cost of locally produced flexibility to be much larger than the one in spot- and reserve markets [
17]. However, they (a) didn’t study the possible revenue out of the flexibility which is already present but only emerges by understanding the energy system as an energy hub and (b) didn’t explicitly list the specifications of the technologies in detail, such as for example the assumed number of cycles for the battery. Other studies highlight regulatory and market limitations for making economic benefits from distributed flexibility aggregators but generally agree on the importance of incorporating distributed flexibility into future energy systems [
18]. Besides this, Ottesen et al. [
19] have already described and investigated the best decision rules and the impact of incomplete knowledge on the total profitability for a flexibility aggregator when operating simultaneously on reserve markets and spot markets. However, they were only considering the tertiary, and not, additionally, the secondary, reserve markets and were estimating the profitability for only eight weeks, while this study covers a whole year.
This work is the first to assess the maximal potential valorization of the flexibility associated with Local Energy Management solutions at the district level in various electricity markets both simultaneously and separately over a whole year. It may serve as a stepping stone for further researchers to investigate the maximum profitability in other cases and show ways to exploit this potential. As shown, the existing literature focuses on the valorization of the local flexibility only with respect to selected markets. The novel contribution provided by the present study relates to the original approach of considering the options of valorizing the available local energy management flexibilities on both the spot and two-reserve electricity markets simultaneously. The research presented in this paper builds on the presented previous studies which have already highlighted, described, and partly characterized the potential profitability of local-scale multi-energy systems for the provision of ancillary services. However, no study to date has investigated the optimal local energy management in multi-energy systems by considering the possibility of simultaneous participation in multiple markets.
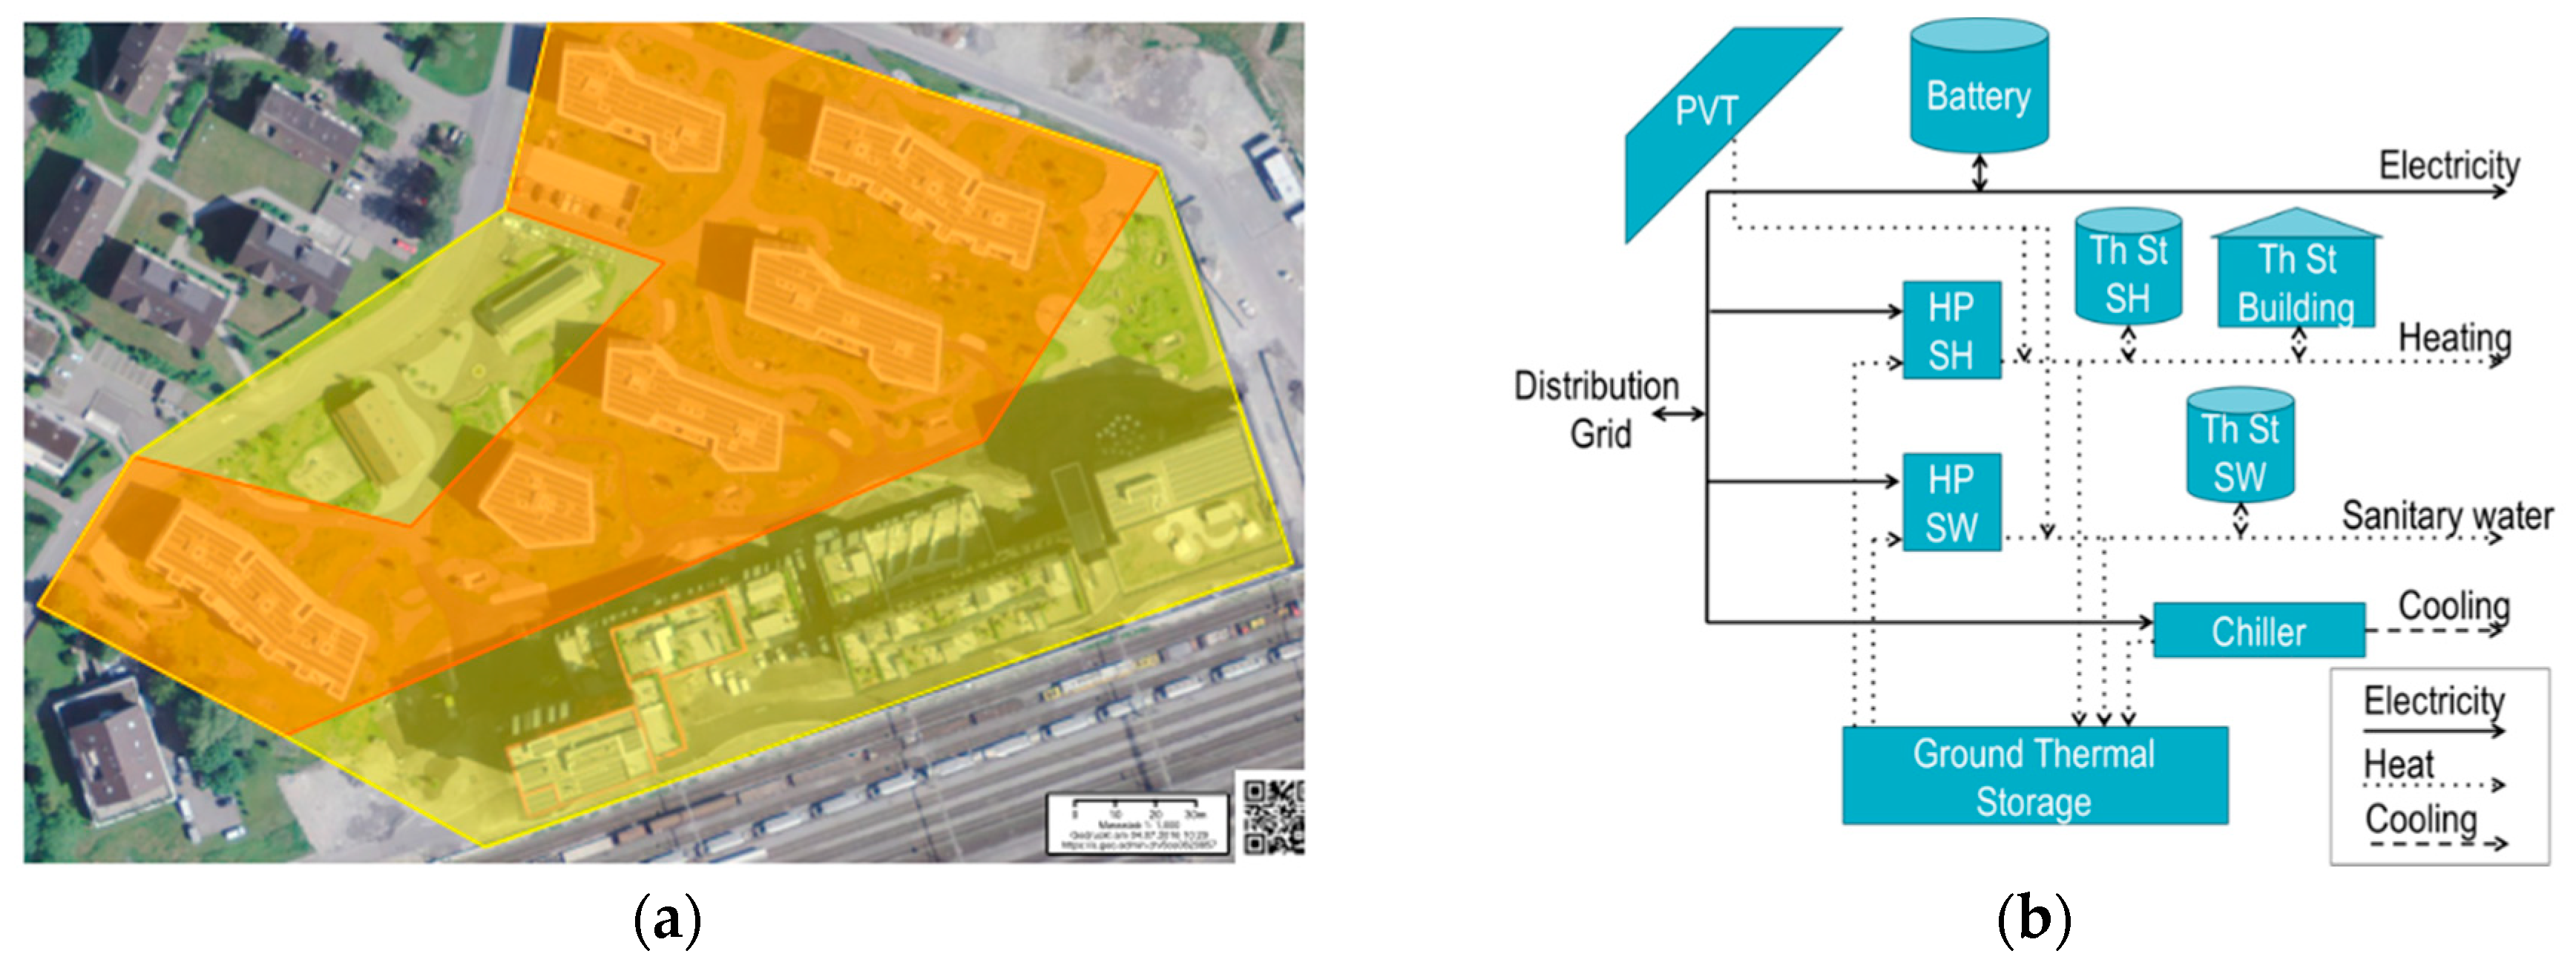
The innovative approach applied in this study builds upon the development of an optimization algorithm that provides the optimal management of the available flexible demand, production, and storage capacities in order to maximize the revenues and the cost savings obtainable from trading at the same time on both the spot and multiple-reserve electricity markets. The study shows the potential based on the measured demand and production data of a newly built suburban residential district located in Central Switzerland and assesses the revenue potential ex-post. The district consists of six multi-family residential buildings and relies on the interaction of electricity and thermal networks, including renewable production through photovoltaic and solar thermal panels, as well as several thermal storage options.
In addition, the option of including batteries has been considered. We pose the hypothesis that providing flexibility to various markets is expected to affect battery cycling, which is limited by the products’ characteristics. For stationary lithium-ion batteries, a lifetime of 10 years and an average number of 10,000 cycles is guaranteed, with the batteries health largely depending on its operation in optimal conditions [
20,
21]. Among the factors most affecting the degradation of a battery are the current, the depth of discharge, the state of charge, and the temperature [
22]. As the optimizer does not affect temperature, this is considered to be outside of the system boundaries. In commercially available solutions the battery management systems ensure that the battery is not run outside its technical specification. However, even when operated within a technically safe operating range, the optimal State of Charge (SoC) limits, with respect to minimal battery degradation, have been reported as between 20% and 85% SoC [
23]. Electricity cycled either below or above the recommended SoC-levels accelerates battery degradation. As the optimizer impacts the amount of electricity stored at low and high states of charge, we assess the amount of energy cycled in total and, particularly, outside these recommended boundaries. As a consequence, our simple battery degradation model is similar to the one applied in [
17], which is based on the number of full cycles; however, we expanded it by explicitly considering at which SoC the charging and discharging occurs.
The paper is organized as follows. In
Section 2, the use-case district and the applied optimization algorithm are described. In
Section 3, the results of the analysis are presented and discussed. Finally, conclusions are drawn in
Section 4.
3. Results and Discussion
This section presents the results of the optimization. In
Section 3.1, the baseline scenario is presented, which reflects the existing infrastructure in the district (with the exception of free cooling, as mentioned in
Section 2). Secondly, in
Section 3.2, sensitivity analyses aiming to assess the role of the different available thermal storage options are presented. Thirdly, in
Section 3.3, the scenario including batteries is considered. Fourthly, in
Section 3.4, the impact of trading the flexibility on both the spot and reserve markets is presented for both scenarios. Finally, the impact on the battery is discussed in both scenarios.
3.1. Baseline Scenario
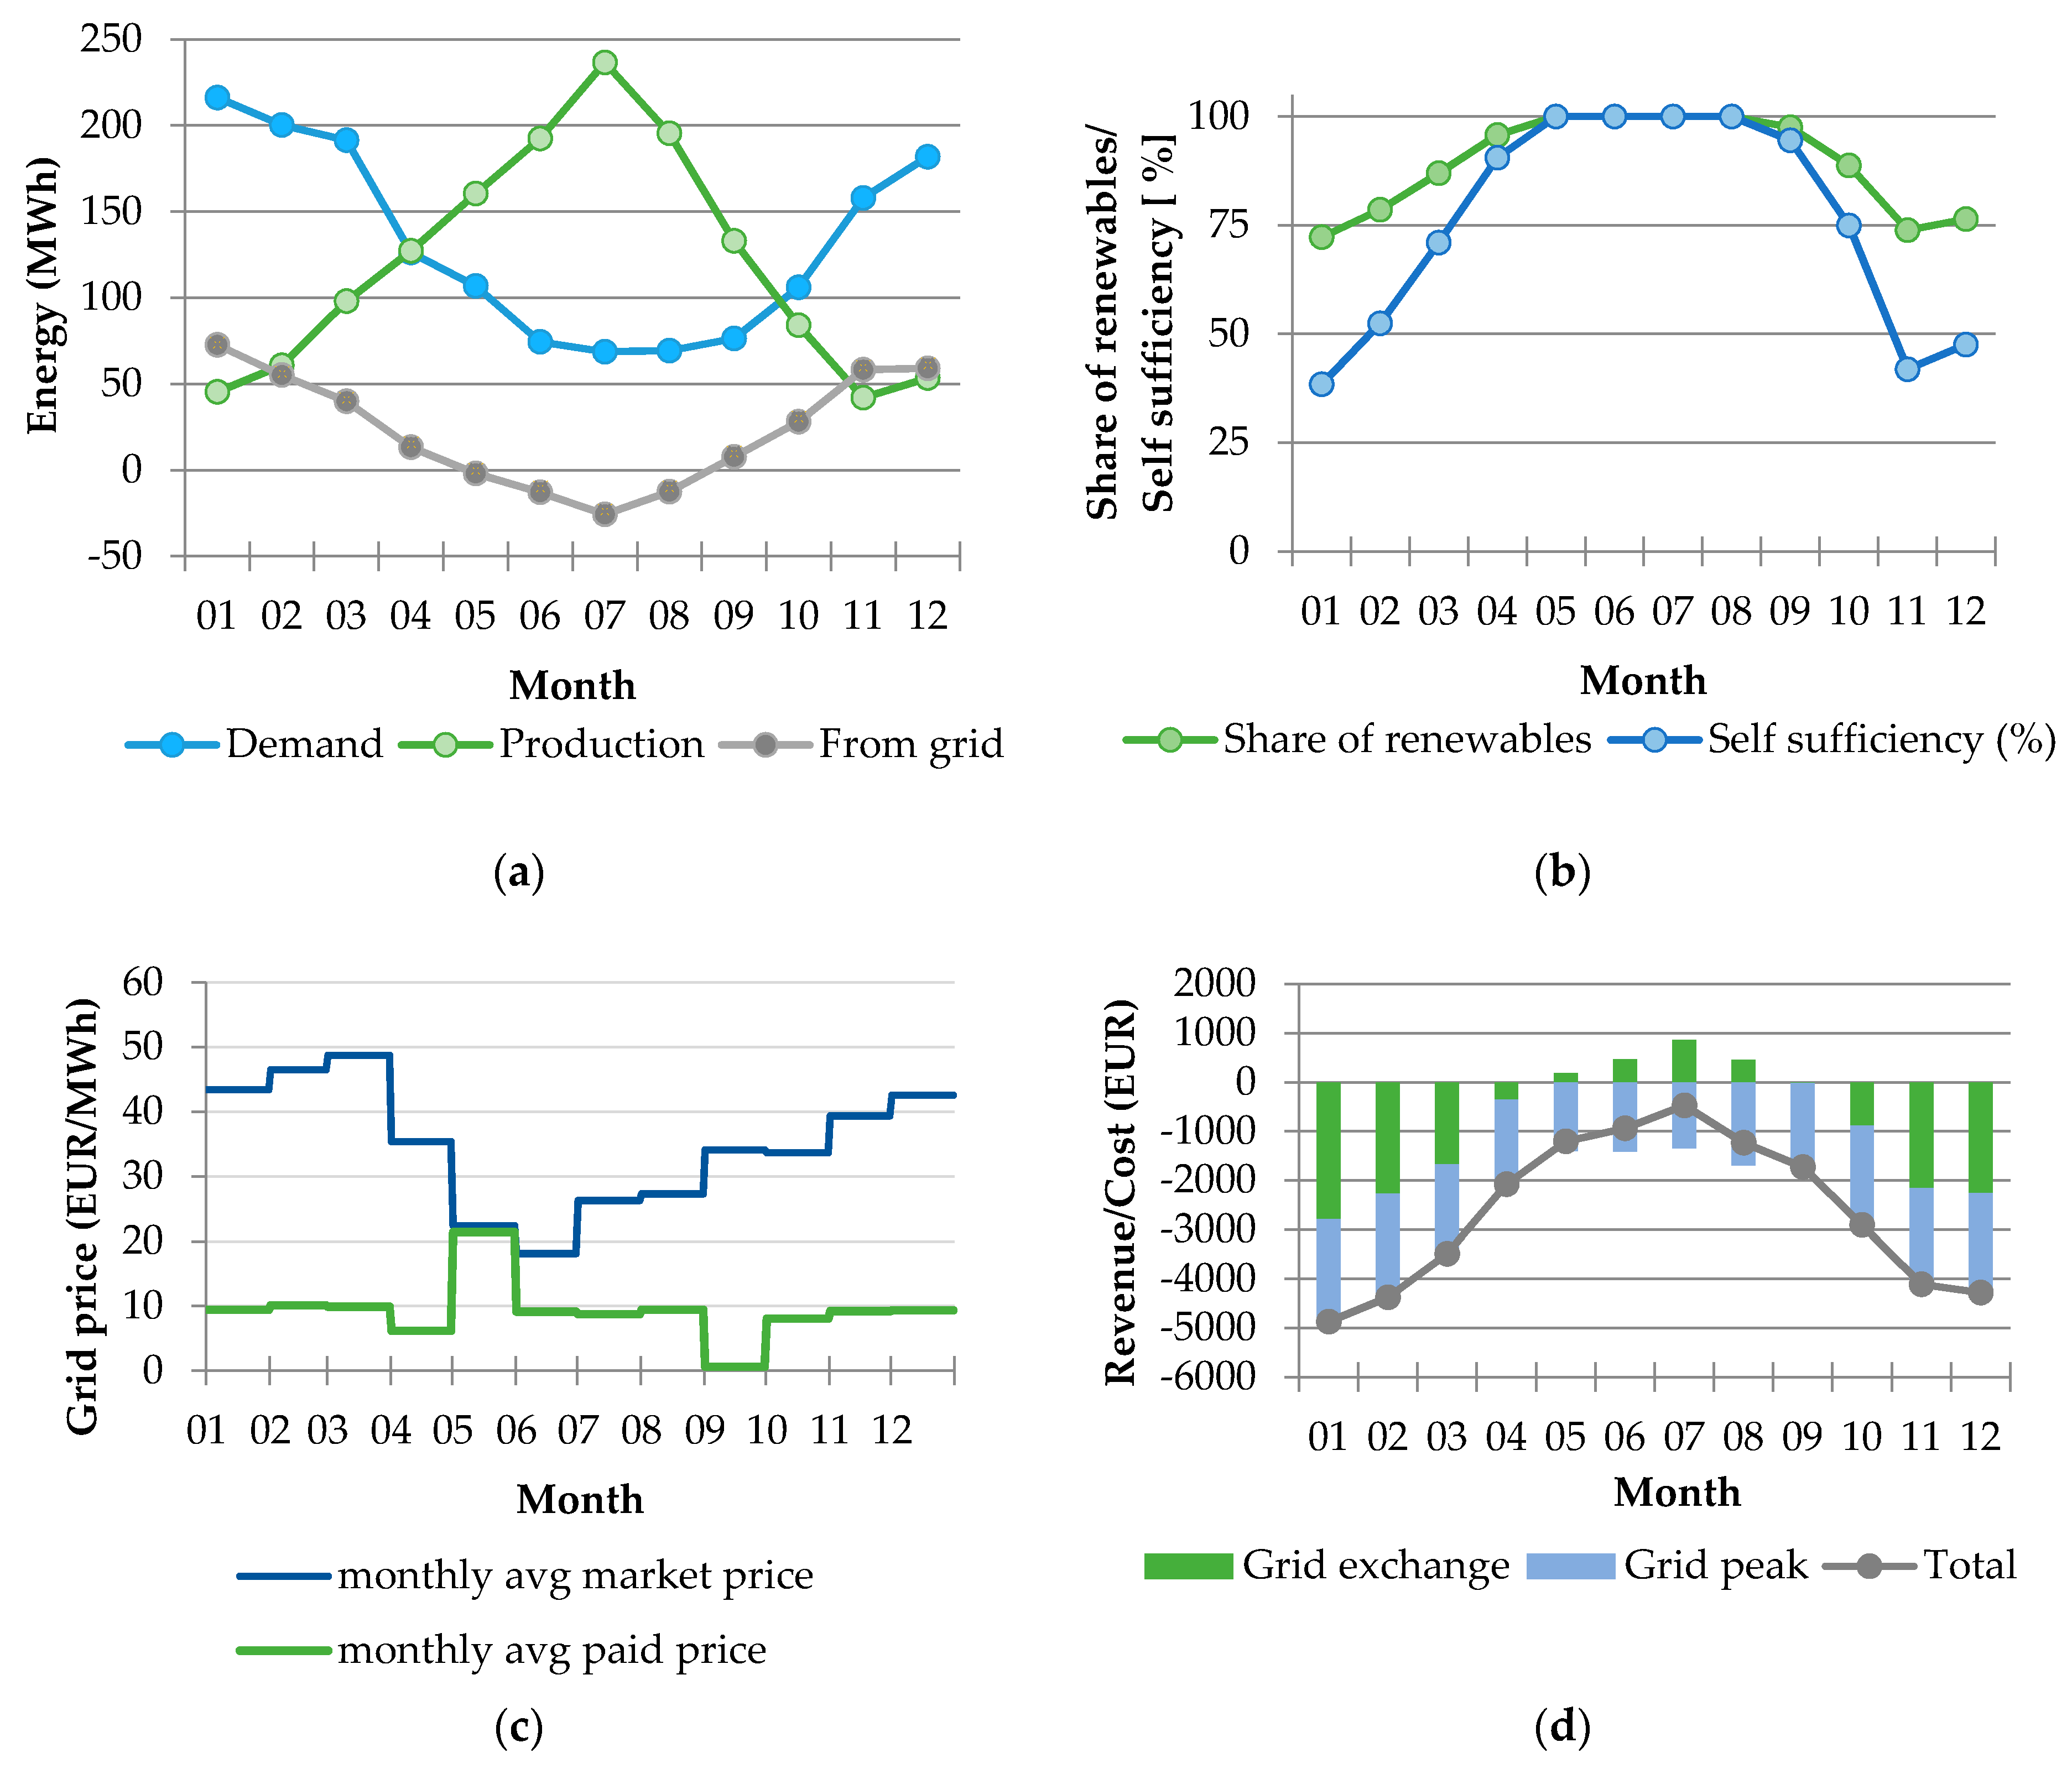
The monthly total primary energy exchanges related to the baseline scenario are summarized in
Figure 2a. The overall primary energy demand is about 50% lower during summertime than in wintertime. Local renewable energy (electricity and thermal energy from PV and PVT) is mostly produced in summertime. As a consequence, electricity is imported from the grid in wintertime and exported in summertime.
In
Figure 2b, the split between local vs. imported and renewable vs. non-renewable resources is presented. The self-sufficiency and the share of renewables reach, in a monthly average, 100% in summertime, when the PVT production is at its maximum level and there is no SH demand. In wintertime, the share of renewables decreases to a minimum of 75%, while self-sufficiency goes down to 40%. This difference between the two indices is due to the fraction of renewable energy imported from the grid in wintertime (i.e., 55% of the grid electricity mix). Considering the average over the year of the monthly averages, the system achieves a share of 92% renewables and a self-sufficiency of 83%.
Figure 2c compares the average monthly market price and the average market price paid by the district. The applied optimization approach enables the minimization of the costs; in every month of the year, the average paid electricity price is lower than the average market price.
Figure 2d presents the monthly distribution of revenues and costs related to the grid exchange, including, the revenue/costs streams associated with trading on the spot market (i.e., grid exchange), and the cost associated to the monthly maximum power taken from the grid (i.e., grid peak). Grid peak costs vary by about 35% between the maximum cost in January and the minimum cost in July. The electricity trading activity with the grid provides a positive cash flow from May to September. However, even in the summer months, it does not compensate for the grid peak costs and overall in every month, the costs are higher than the benefits. The annual cumulative cost/revenues balance amounts to a cost of about 31,000€.
3.2. The Influence of Thermal Energy Storages
Sensitivity analyses have been run to investigate the different contribution of each available thermal storage option, namely, the sanitary water storage, the space heating storage (including the building thermal capacity), and the ground storage. Individual optimizations have been run, excluding one thermal storage option at a time. The resulting yearly profit, share of renewables, and self-sufficiency analyses results are shown in
Table 2.
The analyses show that excluding a single thermal storage option does not significantly impact the overall results. This indicates that the other thermal storages compensate the removal of a single thermal storage. When the SH storage is excluded, the use of the ground storage option is significantly higher (about 40% more). Despite the fact that the ground storage is a relatively less efficient storage option with respect to the SH storage, the impact on the overall profit, self-sufficiency, and share of renewables is marginal. A significant impact on the results is detected only when excluding all thermal storage options. In this latter scenario, the overall annual cost increases by about 29%, and the annual self-sufficiency decreases of about 2%.
In general, the performed sensitivity analyses enable to conclude that the flexibility associated with the thermal storage options in residential newly built districts—such as the case study here investigated—, if valorized in the electricity spot market, can generate additional revenues reducing the yearly total expenses of about 30%.
3.3. Scenario with Batteries
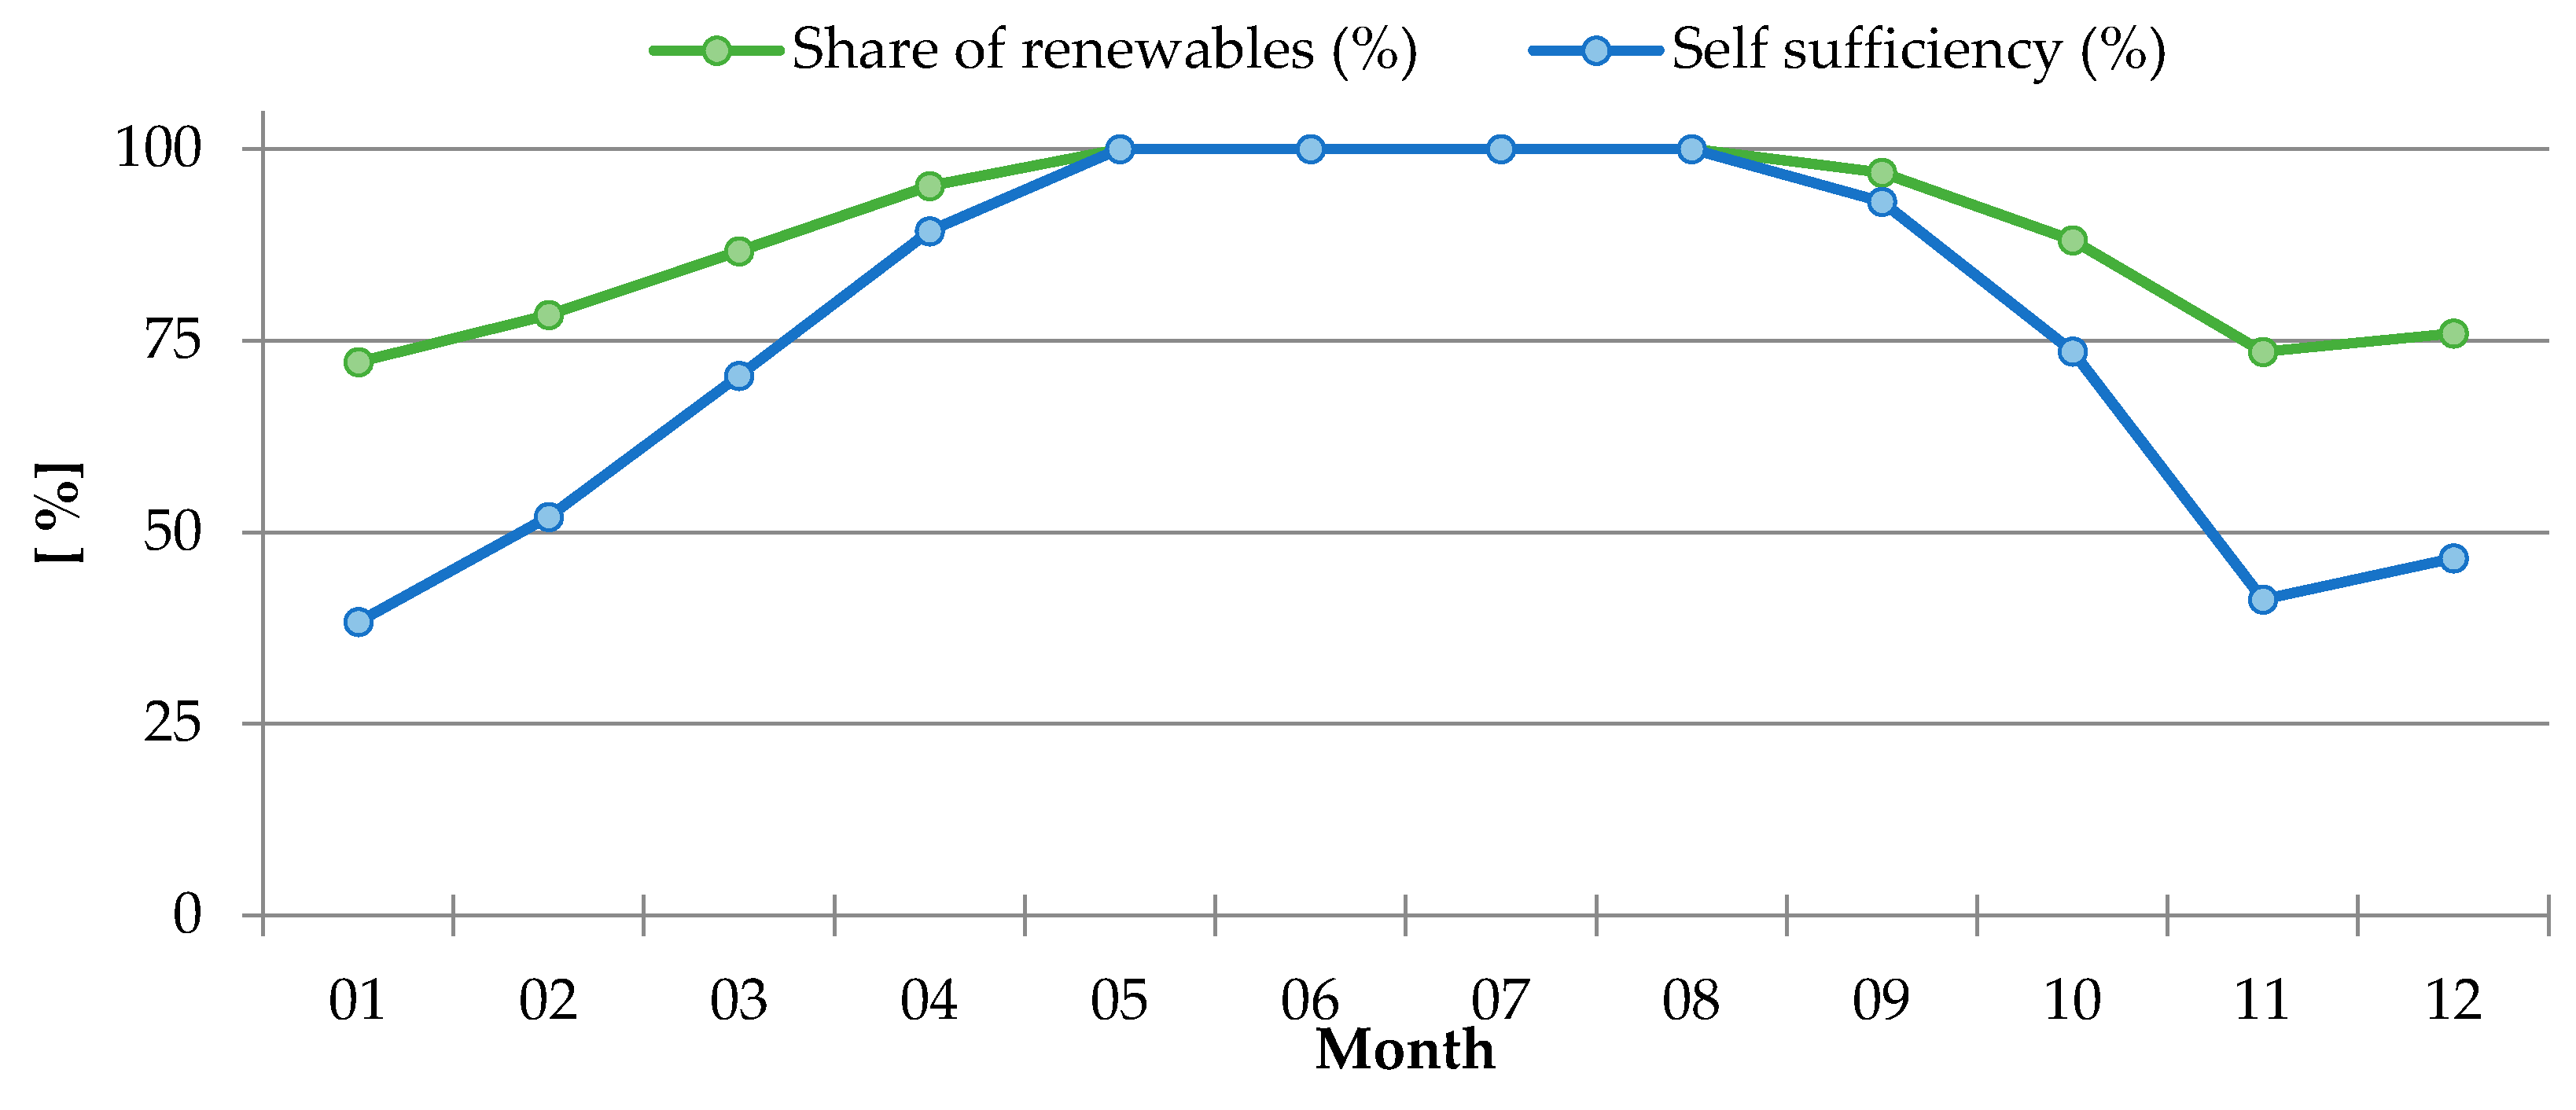
The influence of including batteries as an electricity storage option has also been investigated. With respect to the baseline scenario, 40 kWh of battery capacity has been included in each building model for a total district battery capacity of 240 kWh. The optimization results referring to this scenario are presented in Figures 4 and 5.
Energy production and demand profiles have been kept unchanged with respect to the baseline scenario. A small, yet noticeable and interesting difference between the baseline and the battery scenarios appears with regard to the amount of electricity exchanged with the grid; about 7% more electricity is exchanged with the grid over the time horizon of the model. This is coherent with the fact that the optimizer favors the electricity exchanges with the grid and uses the batteries to take advantage of the electricity price variation in the spot market. This leads to the surprising result, shown in
Figure 3 and
Table 3, where the annual share of renewables and the self-sufficiency levels are slightly lower in the battery scenario than in the baseline scenario. This is explicable considering that, due to the selected optimization objective—the maximization of the profitability—the optimizer operates the battery to maximize the profit from the electricity trading. The side effects of such an operating strategy are higher energy losses in the batteries and, therefore, a higher positive net import of electricity from the grid.
Figure 4 presents the monthly revenues/costs balance for the battery scenario. With respect to the baseline scenario, shown in
Figure 2d, the profit advantage related to the batteries is significant. The monthly cost/revenues balance is positive from May to August. Overall, during the course of a year, the batteries enable a cost reduction of approximately 43%. However, the cumulative annual operative income stays negative. Considering the current market cost of batteries for residential applications, which in Switzerland is about 1000€ per installed kWh, the cost difference between the baseline and battery scenarios would amortize the batteries’ cost in about 15 years [
20,
21].
3.4. The Contribution of the Reserve Market
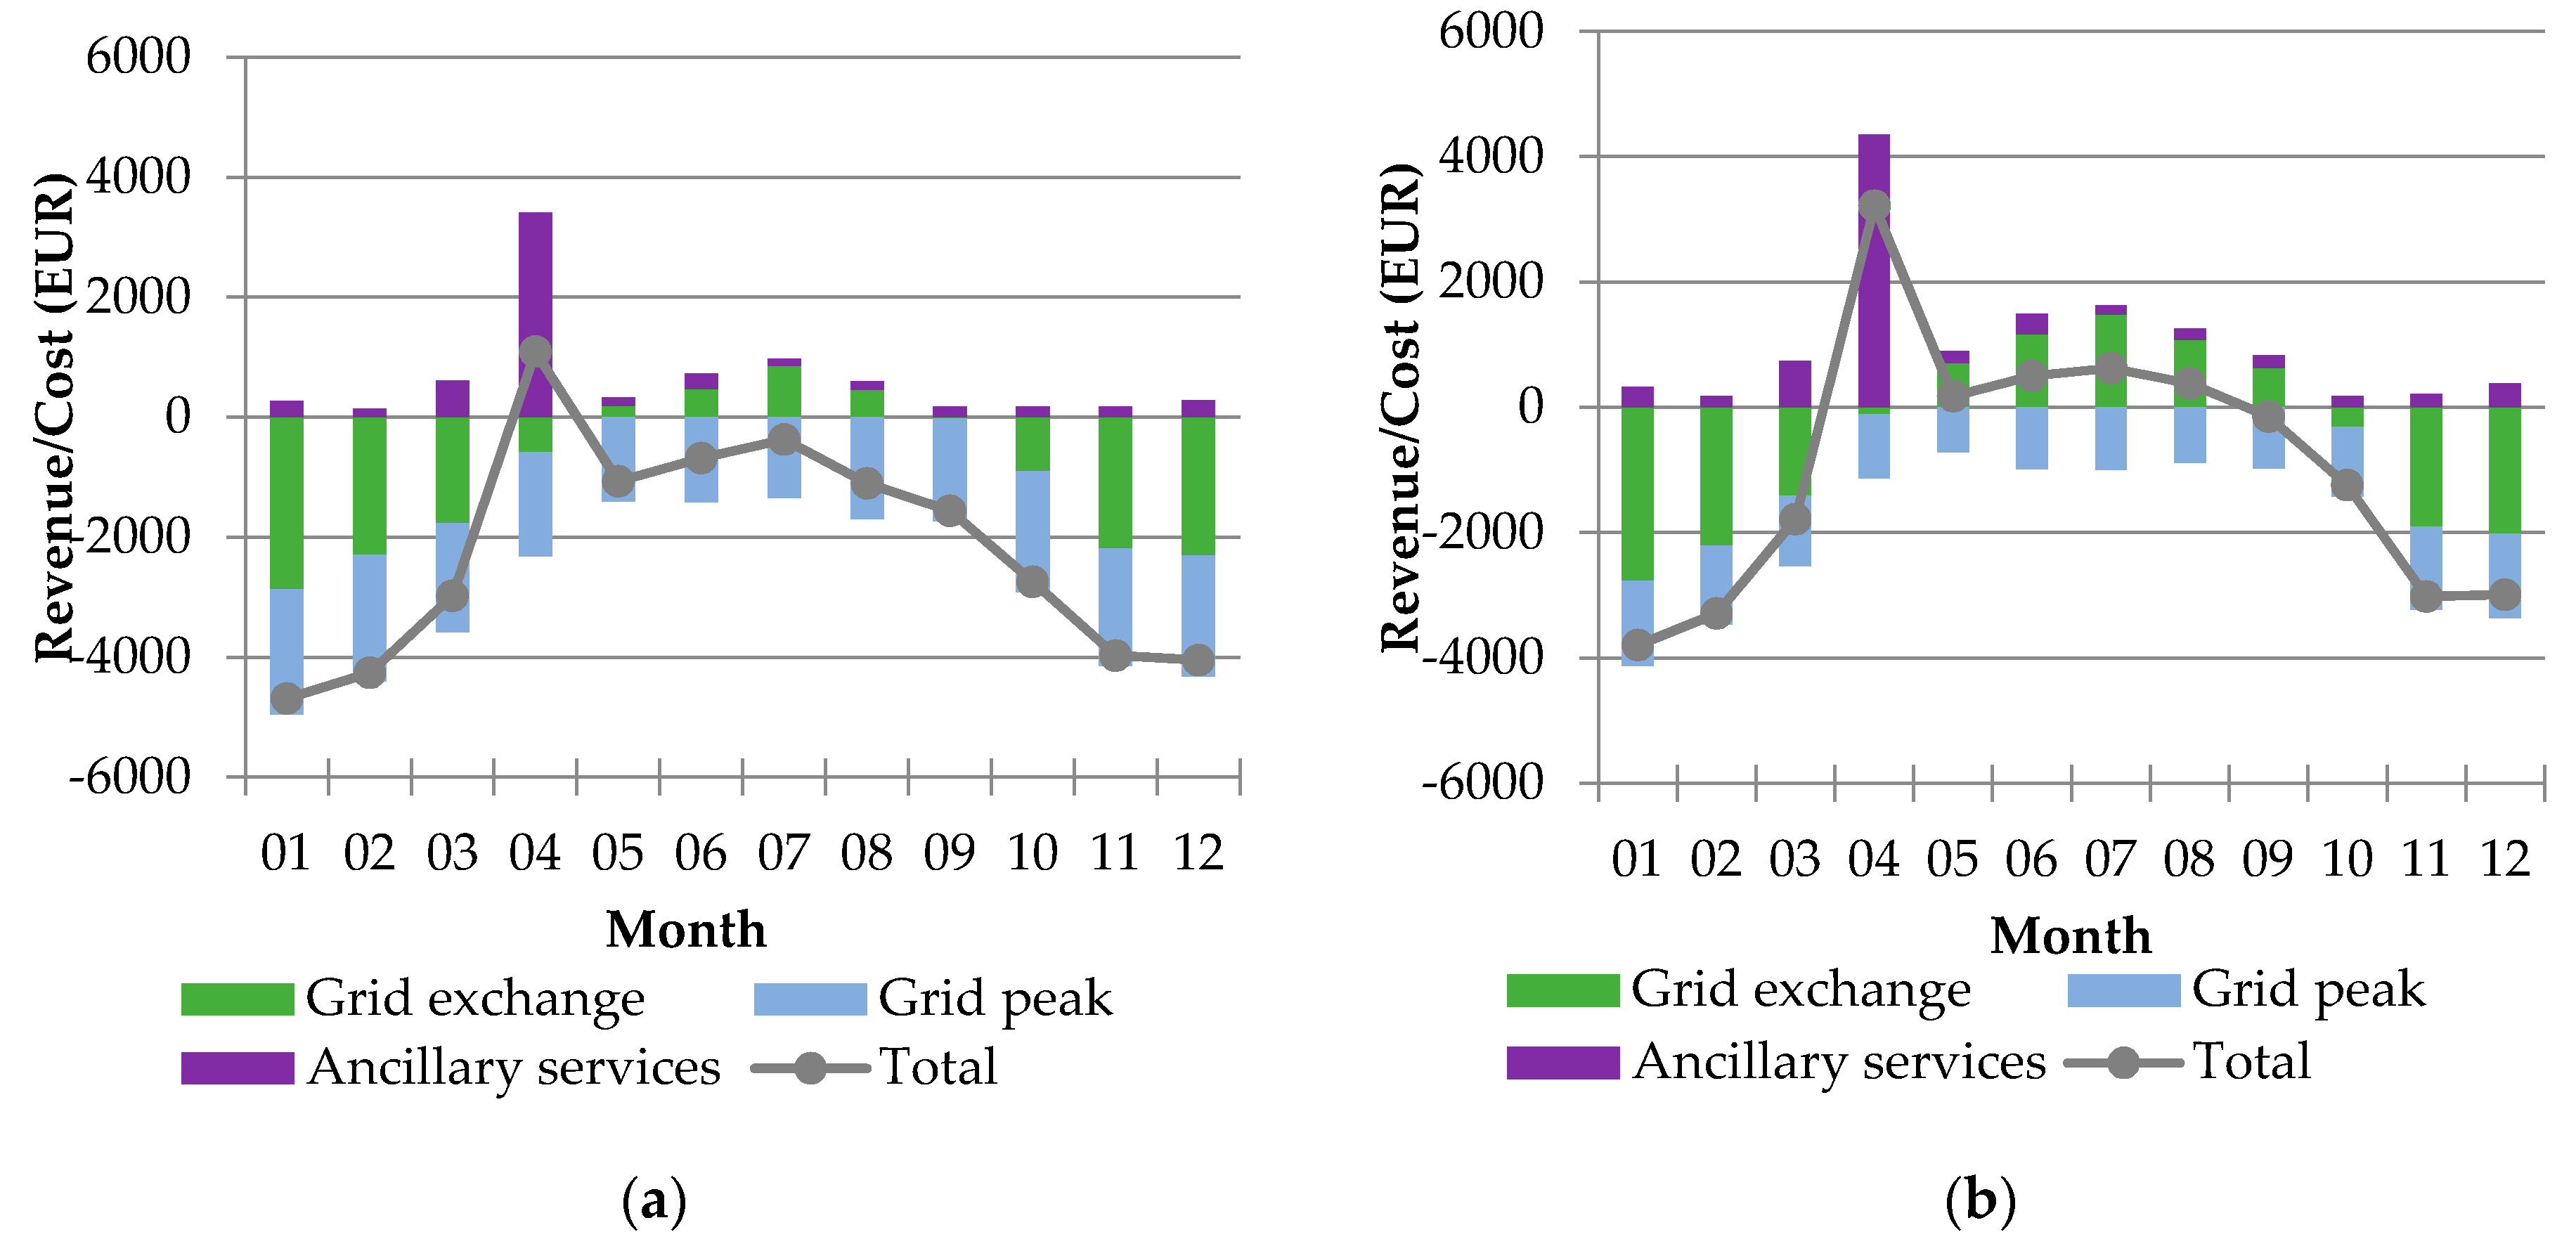
In this section, the impact of trading the available flexibility on both the spot- and reserve electricity markets is analyzed. The optimizer has the option to trade the flexibility either in the reserve or in the spot market or to define an optimal repartition between the two options. The overall results of all the different scenarios analyzed are summarized in
Table 4.
Figure 5a shows the yearly distribution of costs and revenues obtained from the optimization of the baseline scenario. The total yearly costs/revenues balance remains negative with a total cost of about 26,000€. The ancillary services provided to the reserve market reduce the costs by 16% with respect to the spot-market-only equivalent scenario. The reserve market revenues are uniformly distributed throughout the year, except for a very high positive peak in April 2013 in which market prices have been particularly favorable in the reserve market.
In
Figure 5b, the yearly revenues/costs balance is presented for the battery scenario. Integrating the batteries into the existing infrastructure and trading the flexibility on both the spot and reserve markets would reduce costs by about 47% with respect to the corresponding baseline scenario. In this more favorable scenario, the payback time of the batteries decreases to about 10 years, which is the guaranteed lifetime of current, commercially available products [
29]. This is in contrast to another study [
17], which indicated that a battery is economically not viable for providing flexibility to different markets. The different results can be explained by this other study considering only a single market and not considering the integration of the battery within an energy hub.
Finally, in order to investigate the interaction between electricity and thermal storage, an optimization including the batteries and excluding all thermal storage options has been performed. The overall results of this optimization are presented in
Table 4. The analysis shows that, with respect to an ideal scenario excluding both storage options (baseline scenario w/o thermal storage), the electricity storage achieved costs savings of approximately 47% (battery scenario w/o thermal storage), while the thermal storage reduced costs by approximately 35% (baseline scenario). However, the thermal storage enables a higher self-sufficiency and share of renewables levels to be achieved. It is interesting to note that the combination of electricity and thermal storage options (battery scenario) lowered costs less (72%) than the hypothetical case where the battery-only and thermal storage-only optimal costs/revenues balances are summed (82%).
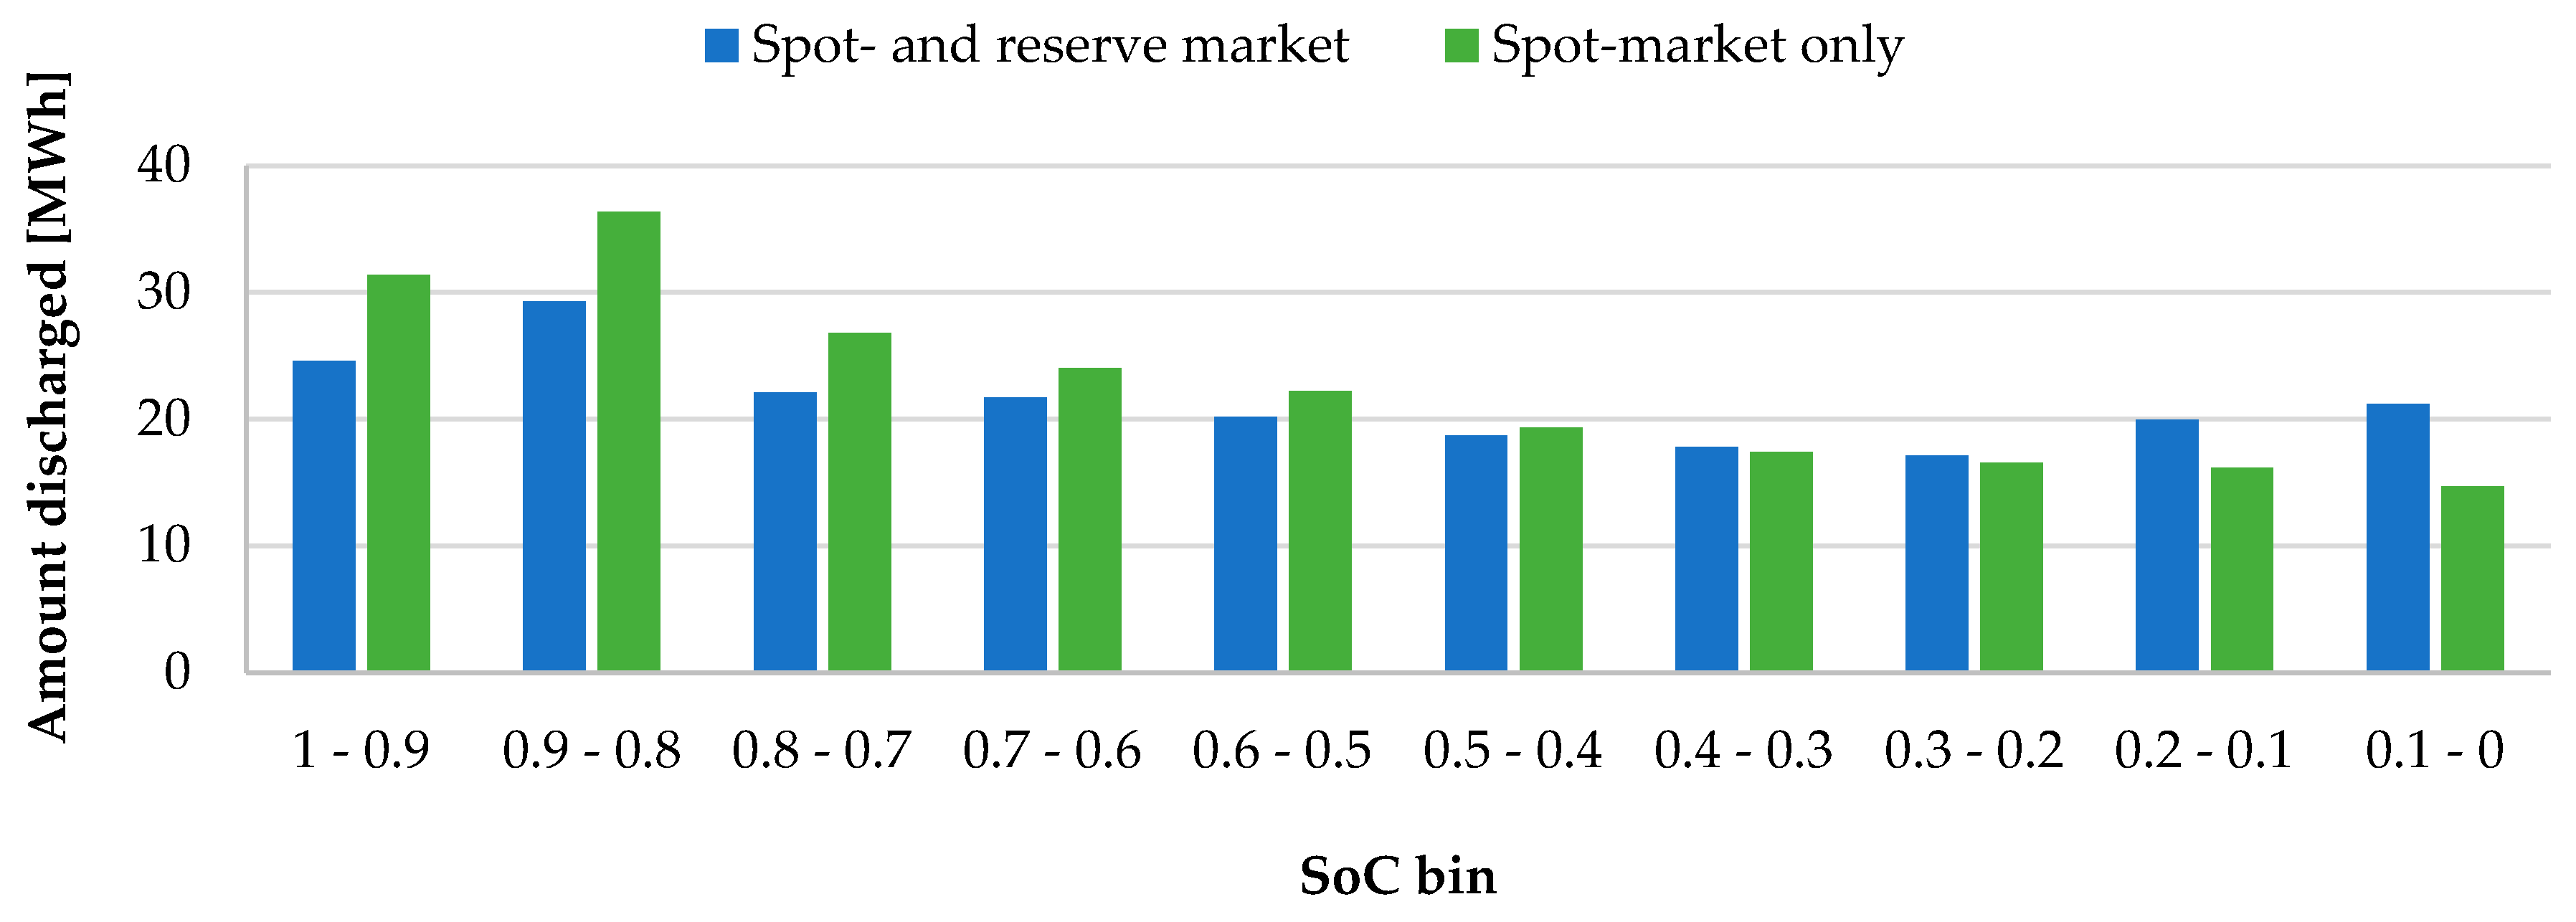
3.5. Battery Operation
Battery cycling for discharging at a different SoC for both scenarios is depicted in
Figure 6. Each bar in
Figure 6 represents the amount of electricity discharged within a specific range of the SoC. For example, the leftmost two bars represent the amount of electricity discharged when the battery SoC was between 100% and 90%. It is sufficient to just look at the discharged volume, as the charging and discharging volume are approximately balanced over the course of a year. The SoC at the end of the year was different only by about 60 kWh. In other words, each discharged MWh of electricity at a given SoC first needs to be charged at this SoC. To then roughly assess the degradation, it is sufficient to sum the discharged (or charged) kWh outside of the SoC limits recommended in the literature [
23].
Table 5 presents the battery energy flows for operation of the district on the spot market only and the spot- and reserve markets.
As can be seen from
Table 5, the battery undergoes a similar amount of full cycles operating on the spot- or on the spot- and regulating market. Operating on the spot- and reserve market, the average number of battery load cycles per day is 2.5, which is 5% lower than in the corresponding scenario that considers only the spot market. Similarly, the overall charged/discharged electricity below or above the recommended SoC level of 85%, that would result in accelerated battery degradation, is about 160 MWh for both operation modes (with each 80 MWh charged and discharged, as shown in
Figure 6). Operating on the spot market only, 39% of the total 80 MWh cycled outside of from the literature-recommended SoC-limits are charged and discharged below a SoC of 20%. Operating on the spot- and reserve market, increase this value to 51%, indicating that the battery stays more often empty in order to be able to profit from negative tertiary regulating services. As a consequence, participating in both the reserve and spot markets does not seem to inflict increased battery degradation when compared to operation in the spot market only.
3.6. Limitations
The presented numbers reflect an ex-post analysis of the maximum revenue potential. Further studies would need to apply a rolling horizon approach in order to better account for uncertainties. However, this would require a second tool, that is able to predict demand, supply, and market prices for the area of study. As indicated by Ottesen et al. [
19], imperfect information about the future could lower the revenues by as much as 30%. In their study, the algorithm had difficulties regarding the prediction of future peak prices and was choosing strategies which are more flexible to avoid risks, which lowered the profitability. As a consequence, the total revenue depends on the quality of the predictions and the bidding strategy of the algorithm. However, in this study, we assessed the maximum revenue potential, which might help to guide further work on this topic and indicate the worthiness to invest time and resources in further tools.
Currently, the costs of battery degradation are not accounted for in the optimization. In future versions of the optimizer, the degradation of the battery could be incorporated to better account for the trade-offs under different optimization objectives and conditions. Additionally, the usable capacity of the battery is assumed to stay the same over the whole period of investigation. As we took manufacturer-guaranteed values, we deem this approach to be viable; however, future work could include more sophisticated battery degradation models. However, further research is needed to better estimate the likely impact of the operation and configuration of an energy hub on the battery. Nevertheless, we have shown, that the degradation is not greatly influenced by operating the energy hub either purely in the spot market or in the spot- and reserve markets. Hence, we consider the conclusions drawn to be robust in this respect.
4. Conclusions
The present work provides insights into the potential valorization of the flexibility associated with Local Energy Management solutions at the district level in the electricity markets. Based on measured demand and production data, estimations were made on the achievable profit by trading the flexibility associated with a newly built suburban residential district on the spot- and reserve electricity markets. The district energy infrastructure relies on an energy hub integrating electrical and thermal networks and including renewable production through photovoltaic and solar thermal panels, as well as several thermal storage options. Furthermore, the option of including an electricity storage has also been analyzed. An optimization algorithm has been applied to ex-post simulate the optimal management of the available flexible demand, production, and storage capacities in order to maximize the revenue/cost savings obtainable from the spot- and reserve electricity markets.
The results showed that in our case study, the grid exchange and peak load costs can be minimized through optimal management of the energy conversion and storage systems. Sensitivity analyses have been performed to investigate the role of the different thermal and electricity storage options. By valorizing the spot market, the thermal storage options’ flexibility generates revenues reducing the yearly total expenses by about 28%. Including the option of trading on the reserve market decreases the costs by an additional 16%. As a consequence, this study definitely indicates the considerable value of the flexibility present in a building. However, harvesting this potential involves considering legal requirements, establishing decision rules for market bidding, prognosing market prices, as well as accurate estimations of local demand and supply. As we have shown the potential to be considerable but limited, we recommend future investigations to focus on cases which already now feature multi-energy systems that make use of their inherent flexibility.
The results showed that complementing the existing energy infrastructure with batteries would decrease the costs by about 43% if trading only on the spot market. When also including the option to trade on the reserve market, the costs decrease by an additional 20%. In this last, most favorable scenario, the revenues created by the batteries would amortize their current market price in about 10 years, whilst not showing indications of an increased battery degradation rate. As a consequence, the maximum revenue that can possibly be generated by letting a battery storage system operate on both the spot and reserve markets only allows for payback of the acquisition and installation costs of the battery. Considering the lower revenues generated with a rolling horizon approach, additional costs due to maintenance, and the costs for capital, the economic viability is currently questionable. However, falling battery prices and government incentives might make such an investment economically profitable. In addition to other arguments, such as a contribution to the energy turnaround, this, as of today, convinces certain customers.


