1. Introduction
Studies show that, in recent decades, temperatures have increased and we are facing the heat island phenomenon [
1,
2,
3]. This heat has a negative impact on the thermal comfort of residents [
4,
5,
6]. Iran is a large country with different climates [
7] which lead to variations in the formation of vernacular architecture in different parts of the country [
8]. Open spaces in residential complexes play an important role in improving the space quality and providing thermal comfort for inhabitants [
9,
10]. Open spaces connect the indoors, the outdoors, and the courtyard, as the main outdoor space is a factor of connection with nature [
11]. Traditional houses in Iran are generally divided into two categories: introverted and extroverted houses [
12]. The design is based on the presence or absence of a yard. The courtyard as a design solution serves to control temperature and energy consumption rates in the buildings in various climatic conditions [
13,
14,
15,
16].
The courtyard is considered the main space and the heart of the house in warm and dry climates [
17]. It is built in a way that is deemed most compatible with the environment. It acts as a microclimate and temperature regulator, and its spatial structure includes social and environmental performance [
18,
19,
20,
21].
Among the studies performed in this regard, a few have surveyed optimized courtyards aiming to secure thermal comfort in the warm and dry climate of Isfahan [
22]. In the historic houses of Iran and, especially in Isfahan, many examples of the central courtyard are seen in the spatial structure of houses [
23] which are due to the climatic conditions of the area. But lack of sufficient knowledge about the optimum physical features of the courtyard leads architects to design deficient courtyards especially in terms of outdoor thermal comfort. Thus, the present study aims to carry out a quantitative and qualitative survey of the variables affecting the courtyards’ design as a microclimate moderator in residential blocks in the city of Isfahan and in ensuring the improvement of their thermal comfort through the simulation method. To do so, an optimized model of the courtyard is offered according to the effective performance in improving the environmental conditions of open spaces in Isfahan’s houses based on regional climatic conditions.
Therefore, the factors that are effective in the courtyards’ design and improvement of the thermal functioning conditions therein will be determined in the present study using the ENVI-met 3.1 software. In this way, in the study, the first step will explain the factors affecting the thermal structure of the central courtyards in terms of outdoor thermal comfort. In the next step, the validity of simulation software is compared by comparing field and simulation results. In the final step, simulation of the hypothetical courtyard is performed based on the determined factors, and the optimal values are extracted and explained.
2. Literature Review
In order to understand the climatic functions of courtyards and their application in architecture today, the role of courtyards in climate and change in their environments has been studied. In previous studies, the role of various physical factors on the environmental conditions in courtyards was investigated. It should be noted that most of these studies are carried out by measuring environmental factors and most of these studies were carried out in a static manner.
Therefore in these studies, the extent of the effect of physical factors on environmental factors cannot be established. In addition, in many studies, only one aspect of the physical aspect was investigated, and an integrated study was rarely carried out. Therefore, the aggregation of physical factors affecting the micro-climate of the courtyard is the most significant part of the literature review section of this paper. So, the first step is to scrutinize the performance of the central courtyard in promoting environmental quality in terms of micro-climate in previous studies, and in the next step, previous studies on physical factors affecting the level of thermal comfort are reviewed.
2.1. Courtyard Functions
The history of courtyard use and its application goes back thousands of years and extends across different parts of the world [
24]. Courtyard houses existed in the oldest civilizations, such as Iran and China, as far back as 3000 BC [
25].
Courtyard design elements such as shape, size, proportions, details, and surrounding walls differ due to climatic characteristics and performance. These differences arise from factors such as cultural, economic, social and environmental factors [
26]. The geometry of the building, premises, surrounding areas, orientation, wind direction [
27], the position of the sun, shade performance and sun absorption [
19] have a significant impact on the environmental conditions of the courtyard. The height of the walls enclosing the courtyard [
24,
28,
29], reflection of the surfaces [
21,
30,
31], and vegetation [
32,
33,
34,
35,
36,
37,
38], are other effective factors relating to the improvement of a courtyard’s characteristics.
A courtyard’s geometry plays a considerable role in its thermal functioning. The ratios of the height to the length and width, shape, geometry, size, area, number of floors, orientation and use of natural elements such as shading are among the factors that have a significant effect on the optimal design of the courtyard [
39,
40,
41,
42]. Courtyards with stretched and deep forms cause a reduction in energy consumption and courtyards with lower depth are predominantly used in cold weather, due to the higher rate of solar radiation absorption, which brings about a reduction of thermal energy consumption in winter [
16]. Courtyards’ physical aspects have been evaluated and analyzed in different studies for different climates. In
Table 1, studies related to the physical aspects of courtyard in different climates are cited with their study area.
2.2. Physical Factors
2.2.1. Orientation
The orientation of buildings and the determination of an appropriate direction for the courtyard are among the other effective factors playing a part in the optimization of courtyard functioning. The orientation and the height of the perimeter walls surrounding the courtyard have substantial effects on the thermal conditions of the courtyard and the adjacent spaces [
28]. The optimum orientation differs in accordance with the various climatic conditions and the need for the varying extents of radiation absorption and reception of heat from the sun, as well as the degree to which a building needs to be shaded or needs to receive optimal levels of wind [
47]. Orientation has a direct relationship with the wind speed and ventilation, such that the wind direction and speed cause a reduction in the temperature from 275.15 K to 276.15 K [
24].
Zamani et al. [
48] in another article, investigated the effect of a building’s orientation on the extent to which thermal energy is received as well as the effective internal heat, by carrying out simulations in three traditional houses in Isfahan. The results indicated that the northern view offers ideal climatic conditions with the highest amount of radiation and the lowest temperature. It was also found that the highest level of courtyard efficiency was obtained when the building stretched east to west and the width of the building was allocated along the eastern and western wings [
48].
2.2.2. Vegetation
The use of plants and proper vegetative cover can improve a courtyard’s functional conditions in residential buildings. The green areas and the vegetative cover bring a reduction in the energy consumption, besides improving the psychological health conditions by reducing the temperature and the creation of shaded areas [
49]. The existence of greenery influences the temperature, relative humidity, wind orientation and transpiration [
47]. Taleghani et al. [
50] discovered that vegetative cover plays a predominant role in reducing the temperature in areas featuring higher temperatures and lower relative humidity levels. Moreover, it exerts a considerable effect on the mean radiation temperature and PMV (predicted mean vote), and concomitantly lowers the chilling load consumption rate.
The shade created by trees is found to have a high influence on the amount of solar radiation absorption and reduction of the temperature, as well as a general cooling effect on the surrounding environment. The quality of the shade generated by trees depends on the height and type of the trees, and on the density of the leaves [
51].
Shahidan et al. [
52] investigated the physical characteristics of trees and the effect that these characteristics have on the shade that trees provide. This research made use of field studies and simulations to evaluate the physical features of trees, including the type of tree, the volume of leaves and phyllotaxy. A temperature difference of about 275.85 K was reported compared with the extant conditions. The findings demonstrated that the trees’ physical characteristics play a significant role in absorbing solar radiation. The reflection degree and evaporation and transpiration were proved to be of great help in the reduction of temperature and the augmentation of relative humidity. Srivanit and Hokao, (2013) studied the importance of greenery and vegetative cover as a method of reducing the temperature, especially along the sidewalks. The study used ENVI-met to evaluate two solutions for the change in vegetative cover, including the addition of greenery, and the creation of a green roof. The results indicated that with a 20% increase in the level of greenery, the maximum obtainable temperature decrease reaches 275.42 K, and in the case of both methods being applied, the mean and maximal reductions in the temperature are 273.39 K and 275.44 K, respectively [
53]. Vegetative cover can act as a barrier to the penetration of sun radiation; therefore, it may hinder the extreme absorption of solar radiation, leading to a decrease in the ambient temperature and the peripheral spaces via evaporation and respiration [
52].
Santos et al. [
54] have evaluated the effect of present and future urban scenarios in Lisbon’s Avenidas Novas neighborhood. The results of this study indicate that:
Thermal comfort in this context in the morning and afternoon is mostly affected by the presence of new green areas foreseen by the urban project.
A reduction of up to 3 degrees in the morning (9 h) and up to 3 degrees in the afternoon (15 h).
The thermal characteristics of Lisbon and its future plan were simulated and described via ENVI-met software and suggested further simulation of this type.
2.2.3. Albedo
Considering optimum use of masonry and taking the reflection rates into consideration [
55,
56], the use of masonry with high thermal-functioning capabilities [
31] is an effective method for creating conditions of thermal comfort. The ratio of return of light unique to every material can be of great help in the determination of the absorption rate and/or sun radiation on various surfaces. In general, bright surfaces absorb lower rates of radiation and are less likely to preserve the day temperature. Materials with high reflection rates cause a reduction in the environmental temperature and the various surfaces’ temperature via convection [
56]. Benrazavi et al. [
57] investigated the effect of various material types commonly used for floors on the surface temperature in equatorial climates. Some information regarding the materials causing higher reductions in the ambient temperature was provided therein. Taleghani et al. [
38] in a study undertaken in Portland State University in the temperate climate of Oregon, USA, dealt with the materials’ reflection rate measurement and evaluated the reflection rate effect on the degree to which the temperature variations may change. They concluded that bright materials with a 0.9 reflection rate bring about a global temperature increase of 274.05 K and a mean radiation temperature increase of about 276.06 K as compared with dark materials, which caused increases in global temperature and mean radiation temperature by 273.52 K and 274.45 K, respectively.
2.3. The Computational Simulation
The simulation method was advanced by designers to predict their sketches and ideas and avoid further drawbacks [
58,
59]. The final approach is on the basis of computational simulation using software. The general procedure is to input the environmental parameters as well as trees, buildings, cloud cover etc. Consequently, the software will approximate the thermal condition of the study area introduced in the preferred thermal index [
60]. Increasing the number of environmental factors requires sophisticated calculations. Matzarakis et al. at 2007 introduced freeware, namely “Rayman”, to calculate the mean radiant temperature (Tmrt) as the main indicator of heat stress. SVF (sky view factor) can be calculated through simple fish-eye photo and as well as three main thermal indexes including SET (standard effective temperature), PET (physiological equivalent temperature), and PMV [
61].
This software has been used in many studies and the accuracy of its output was proven [
62,
63,
64,
65]. ParaGen has been used by Turrin et al. to scrutinize the passive thermal control of the sheltered environment in a semi-outdoor setting [
66]. Furthermore, other software were introduced in order to predicate the outdoor and semi-outdoor conditions including ENVI-met [
67]; SOLWEING [
68] and Town Scope [
69].
2.4. Simulation Usage at the Early Stage of Design
The assessment of outdoor comfort is a multifaceted issue that should be considered in all its aspects. Studies that have been conducted have often been the subject of evaluation of one particular factor. Therefore, these studies are one-dimensional in which the results are not generalizable. Therefore, changing the modality of studies from a static to dynamic mode has been a concern for researchers in this field. Recently, simulation tools have been developed to address this research disadvantage. Simulation enables researchers to examine the impact of several factors simultaneously. The most important advantage of using simulation is modelling different modes. Using this method, designers and researchers can check their design and schemes before construction, examine their weaknesses and strengths, and choose the most optimal option. In the table below, the review of studies of earlier stage consideration through a simulation method is presented. In the last decade, the simulation method is progressively replacing traditional methods at an early stage of design. Some related studies are cited in
Table 2 with their study area.
3. Materials and Method
3.1. Procedure of Study
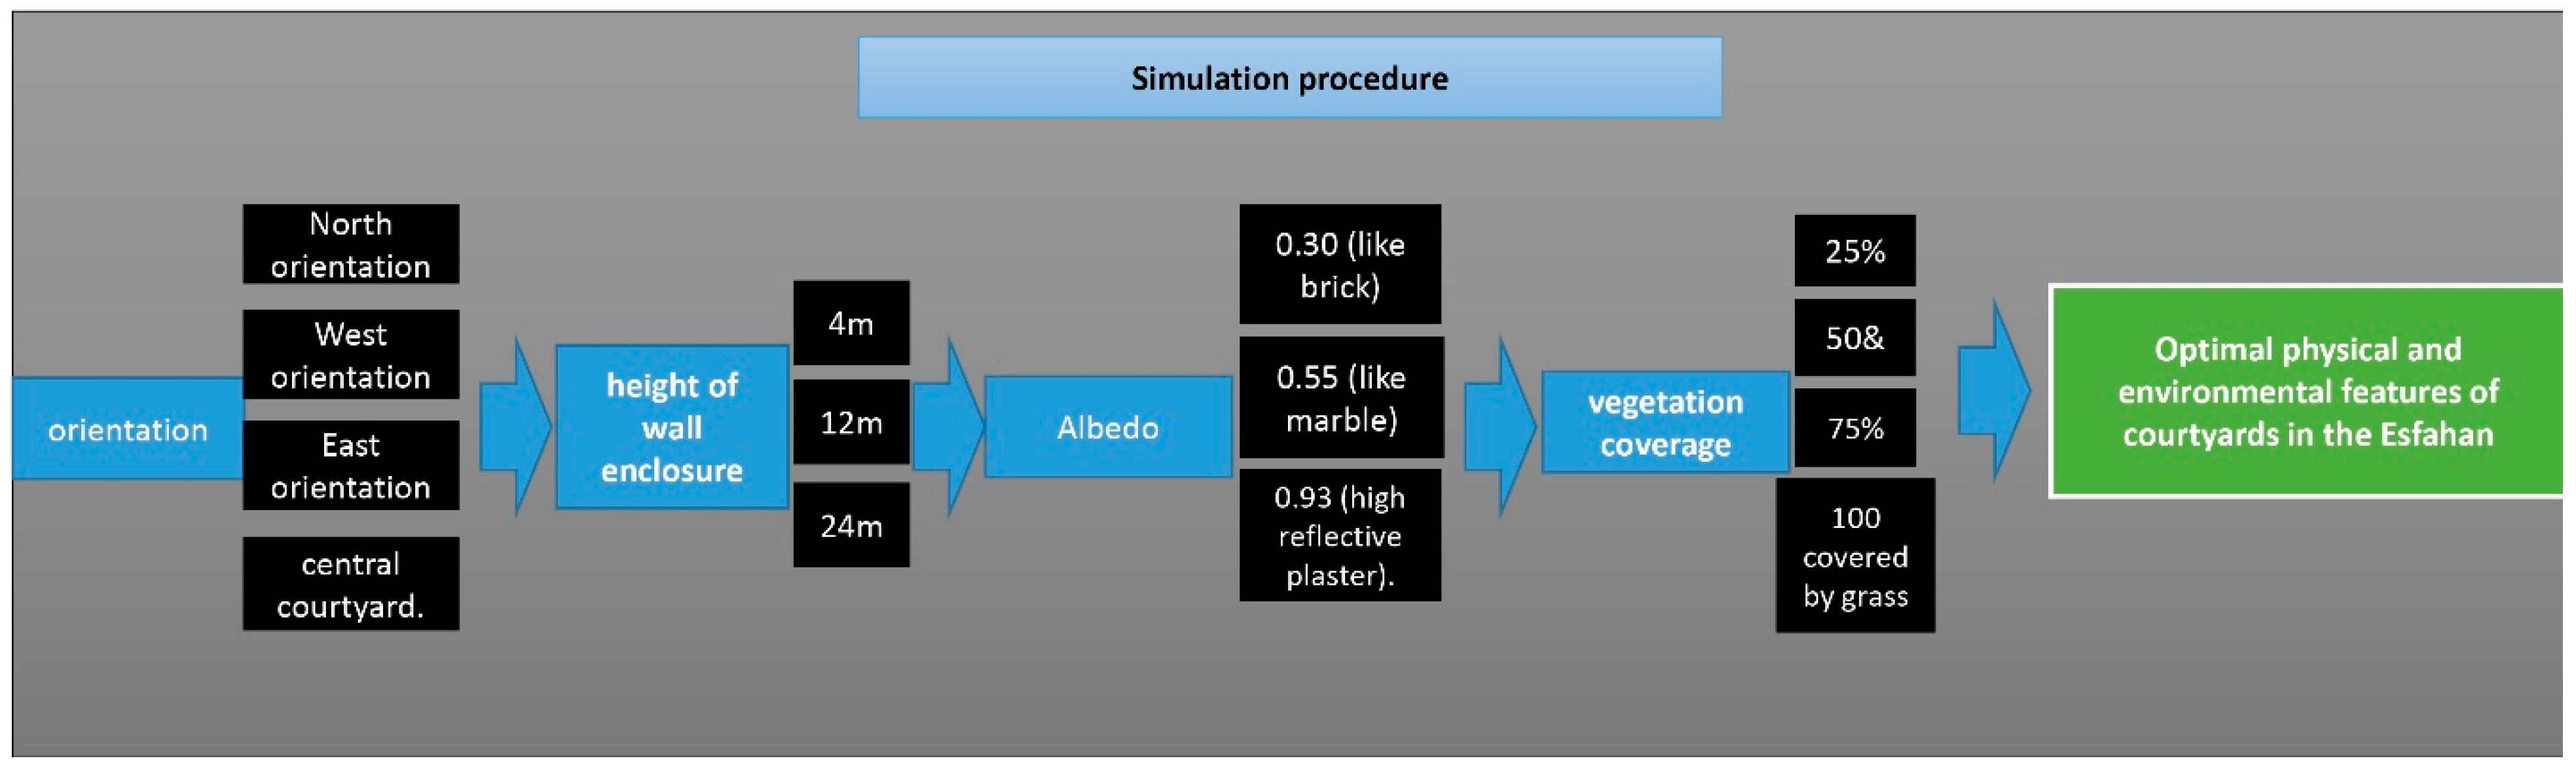
According to the literature review, most of the studies have been carried out in a static manner and variation of the variable cannot be predicted in these studies; thus, in order to examine the variables and the schemes, the following steps and scenarios are introduced:
For the purposes this study, four effective aspects of the courtyard were selected (as listed below) and simulated in terms of thermal features:
Orientation
Height of walls
Albedo
Green spaces
The aforementioned variables were examined via the Lutron LM-8000 Datalogger to measure the environmental parameters in four traditional and one modern courtyard to illustrate the deficiency of the courtyards in terms of optimum physical features. All the measured and simulated variables are described in the following sections.
3.1.1. Orientation
The ENVI-met 3.1 was used to examine the aforementioned parameters with steady-state algorithms.
Accordingly, the orientation has 4 main sectors, including:
North orientation
East orientation
West orientation
Central courtyard
Orientation is a one of the most challenging issues in the environmental design. The accurate orientation of the courtyard will reduce the disturbing radiation and windspeed. It can make a great contribution to achieve thermal comfort in an outdoor setting. This part of the study will determine the suitable orientation and rest of the simulation will run on the optimum orientation.
3.1.2. Height of Walls
As next step, the enclosure condition of the wall will be examined through 3 simulation steps including:
One-story courtyard (4 m)
Three-story courtyard (12 m)
Six-story courtyard (24 m)
The height of the optimum courtyard will be determined in the step known as “wall enclosure”. The percentage of shaded open space is mainly affected by the wall’s height and it affects Tmrt directly. That is why it is one of the most critical issues in the simulation process.
3.1.3. Albedo
When it comes to the material of the façade, albedo is important; due to its effect on the surface temperature and pedestrians. Three different types of material are considered for examination including low reflection materials like brick and dark concrete, mid-range reflection like marble and finally high reflection materials like white plaster and glossy surfaces. Their albedos are listed respectively:
3.1.4. Green Spaces
As the final step of the simulation, greenery requires study in depth due to its cooling and shading effects on the surrounding environment. Therefore, in this step, four different levels of green space are assumed.
100% covered by grass (the ground)
25% greenery with grass below
50% greenery with grass below
75% greenery with grass below
According to the steps described, the procedure is depicted integrally in
Figure 1, and it shows how an optimal courtyard in terms of the outdoor thermal condition should be designed.
General Assumptions of blocks in the simulation are listed below:
Flat ground.
Box-shaped buildings.
Cubic grid with a horizontal resolution of 1 m higher resolution is enabled only for the vertical axis.
Empirical initial boundary conditions, found by trial and error, in order to attain good agreement with average measurement data.
Constant wind profile during all simulation times.
Buildings have constant indoor temperature and no heat storage.
1D soil model considering a five-level profile of humidity and temperature.
Stomata, the interaction of humidity and radiation in soil and air.
One of the advantages of using ENVI-met is calculating accurate mean radiant temperature in complex environments [
78,
79,
80]. This program simulated the microclimates’ data (e.g., Tmrt, Ta (Air temperature), RH (Relative Humidity), WS (Wind Speed) etc.) and the output was “measured” in points at a height of 1.4 m at different points of the center of the courtyards. The ENVI-met calculated predicted mean vote as an outdoor thermal index to measure the comfort condition [
81,
82,
83] of the pedestrians in the courtyards. The PMV index was originally formulated for indoor thermal comfort; however, it has also recently been applied to outdoor conditions. This parameter is calculated using the Fanger equation modified for outdoor thermal comfort conditions [
29,
40].
3.2. The Climate of Isfahan, Iran
Isfahan is the capital city of Isfahan province in Iran, located around 340 KM (211 miles) south of Tehran. Isfahan had a population of 3,793,104 in the former (2011) census of Iran, the second most populous metropolitan area in Iran after Tehran. The climate of Isfahan is reported as hot and arid in the summer (Isfahanmet.ir, 2017). Average data of Isfahan has been reported in
Table 3. In
Table 3 all the longstanding (1951–2010) environmental parameters have been described monthly.
A large area of Isfahan province has a dry climate, which is the least handicapped area of annual rainfall in many parts of the province, and there is a high normal annual temperature in a wide range of Isfahan province. According to the physiological equivalent temperature thermal index (explained in detail in
Figure 2), April, September and May, 29.4%, 21.4% and 20.2% are more comfortable in terms of outdoor thermal comfort.
Monthly analysis of outdoor thermal comfort conditions was carried out using the PET thermal index.
Based on the PET thermal index, only 19.35% of the days of the summer season are in the comfort range on the PET thermal index scale.
3.3. Selection of a Typical Day for the Simulation
The hottest day has been chosen for simulation purposes in many studies as a reference day [
35,
37,
40,
75,
84,
85]. The assumption is that when the outputs of the simulated environment are appropriate for the hottest day or the most critical conditions, then it will just as applicable for the other hot days; thus, the hottest day of summer of 2015 is selected for the simulation. A critical day, in terms of air temperature, is selected in order to determine the optimal thermal characteristic of the courtyard for the hottest day of the year to achieve and recommend the optimal physical features of the courtyard in the hot and arid climate of Isfahan for the remaining days of the summer.
The Meteorological Department of Iran reported (Isahanmet.ir, 2015) 30 June as the hottest day of 2015 in Isfahan.
Therefore, this day was selected as the reference day for the simulation. Accordingly, this study selected 30 June, which was an average hot and sunny day with a low temperature of 296.15 K at 06:00 and a high temperature of 312.15 K at 15:00. The required environmental parameters including air temperature, pressure, dew point and wind speed are from the official environmental department of Iran and are reported in
Table 4.
3.4. Characteristics of the Courtyard Model
Some environmental parameters are required for the simulation process. Therefore, fundamental input parameters, including the building, soil and meteorological data incorporated into the ENVI-met model, are given in
Table 5. The sample courtyard was considered with plan dimensions of 30*30 m. These dimensions were derived from the average dimensions of Isfahan traditional houses including the dimension and height, known as the wall enclosure. Consequently, the plan dimension of the courtyard was considered to be 30*30 m. When it comes to the height, three different scenarios as common construction heights were considered as seen in the list below:
As a final variable, greenery was simulated with 4 different scenarios:
Grass covered
25% tree covered
50% tree covered
75% tree covered
These percentages were selected based on the greenery rate of the traditional courtyards in Isfahan covering 0% to 75%.
3.5. Introducing Simulation Features
ENVI-Met
The ENVI-met 3.1 urban microclimate was selected to simulate the atmospheric parameters (ENVI-met.com, 2014). ENVI-met is freeware software that recently has been used by researchers to simulate the effect of urban vegetation on the microclimate [
86,
87,
88,
89]. ENVI-met carries out detailed calculations relating to shortwave and long-wave radiation fluxes with respect to shading, reflection and radiation from building systems and the vegetation, and it considers the evapotranspiration and sensible heat flux from the vegetation into the air, including full simulation of all physical plant parameters. ENVI-met has a typical spatial resolution ranging from 0.5 to 10 m, and a temporal resolution of 10 s. A simulation should typically be carried out for at least six hours, but a 24-h period is more usual. The optimal time to start a simulation is at night or sunrise so that the simulation can follow the daily increase in solar radiation. ENVI-met requires an area input file with the three-dimensional geometry and a configuration file with the initialization input parameters [
90]. The input parameter for vegetation in the ENVI-met model is that of LAD (leaf area density) (m
2 m
−3) and consists of 10 LAD values for each plant. The LAD values are, in turn, retrieved from a leaf area index. The physiological properties of the plants in ENVI-met characterize parameters such as moisture absorption by roots, stomatal resistance, and the albedo of leaves [
91].
The second interface is the configuration editor, where databases for soil types, humidity, temperature, temporal input, etc. are entered. The third one is the modeling area, where additional parameters are present and the modeling process takes place. The output data can be interpreted and visualized in LEONARDO (as a visualization tool for ENVI-met). It is also possible to edit the data to other programs since the program structure is public [
92].
3.6. Three-Dimensional Tree Canopy Structure
In the ENVI-met model, plants are considered as a one-dimensional permeable column which is subdivided into multiple LAD layers, expressed as m
2 m
−3 [
93]. To account for the effect of greenery on atmospheric procedures, all predictive equations in the model are extended into the vegetation layers using source/sink terms describing heat, humidity and momentum exchanges [
93,
94].
Within ENVI-met, vertical LAD profiles are normalized from z/h = 0.1 (LAD1) to z/h = 1 (LAD10), where z is the height of the LAD entry and h is the total plant height (m). Each vertical profile thus consisted of 10 different horizontal LAD layers. For the theoretical tree crown representation, we used 8 unique vertical LAD profiles to be able to adjust the tree crown dimensions in relation to the distance to the center of the crown. The applied LAD values (0.1–1.15 m
2 m
−3) were based on standard deciduous LAD values provided in the local ENVI-met
® database consisting of 27 different plant structures [
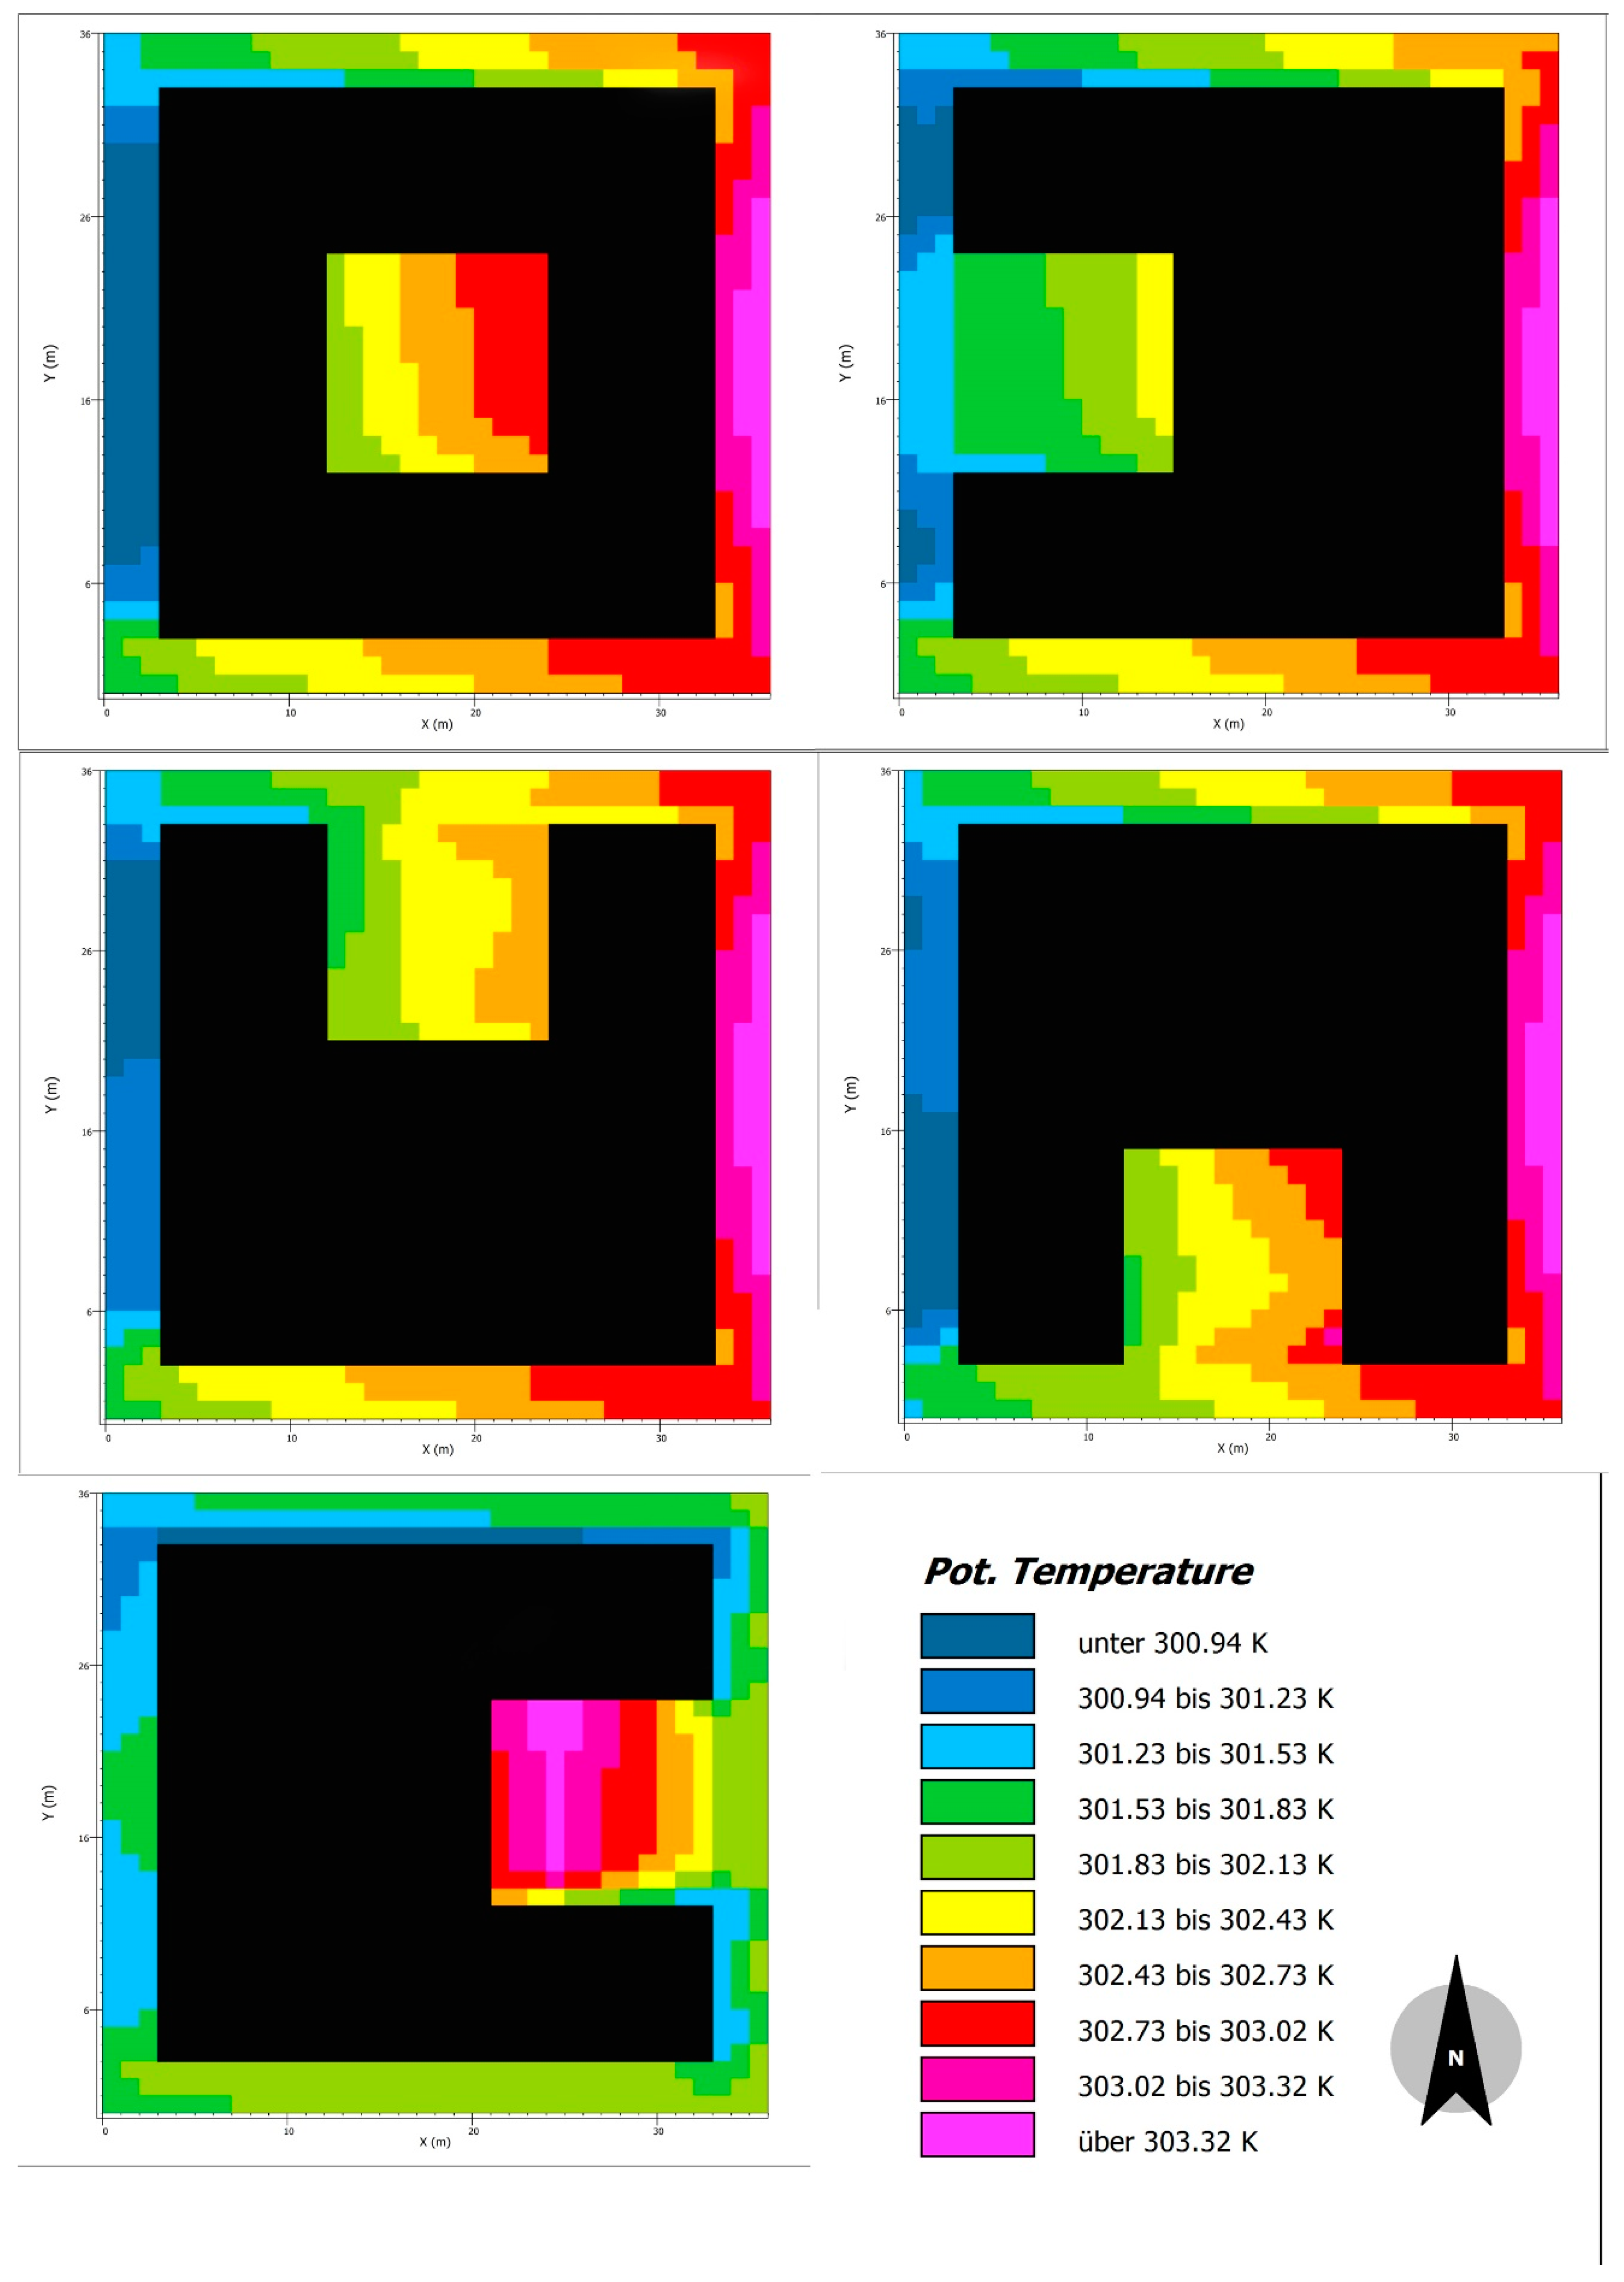
91]. Therefore, in this particular study, 3 m dense trees with the ID = B1 (tree 3 m dense, distinct crown layer) with grass below was used in order to achieve more accurate results based on the actual trees (as described in
Figure 3) which are used in traditional courtyards in Isfahan. Therefore, the related simulation parameters are described in
Table 6 with the ID and description of trees in the ENVI-met.
3.7. Reliability of ENVI-Met 3.1
In order to achieve reliable simulation results, the ENVI-met software needs to be calibrated to the local context. In some studies, the ENVI-met is validated by the comparison of the measured and simulated data in quite a detailed manner [
95,
96,
97]. Therefore, for calibration purposes, the investigation made a comparison of the measured and simulated data on particular summer days of 2014. The process of the measurement, simulation, and their comparison is described in
Figure 4.
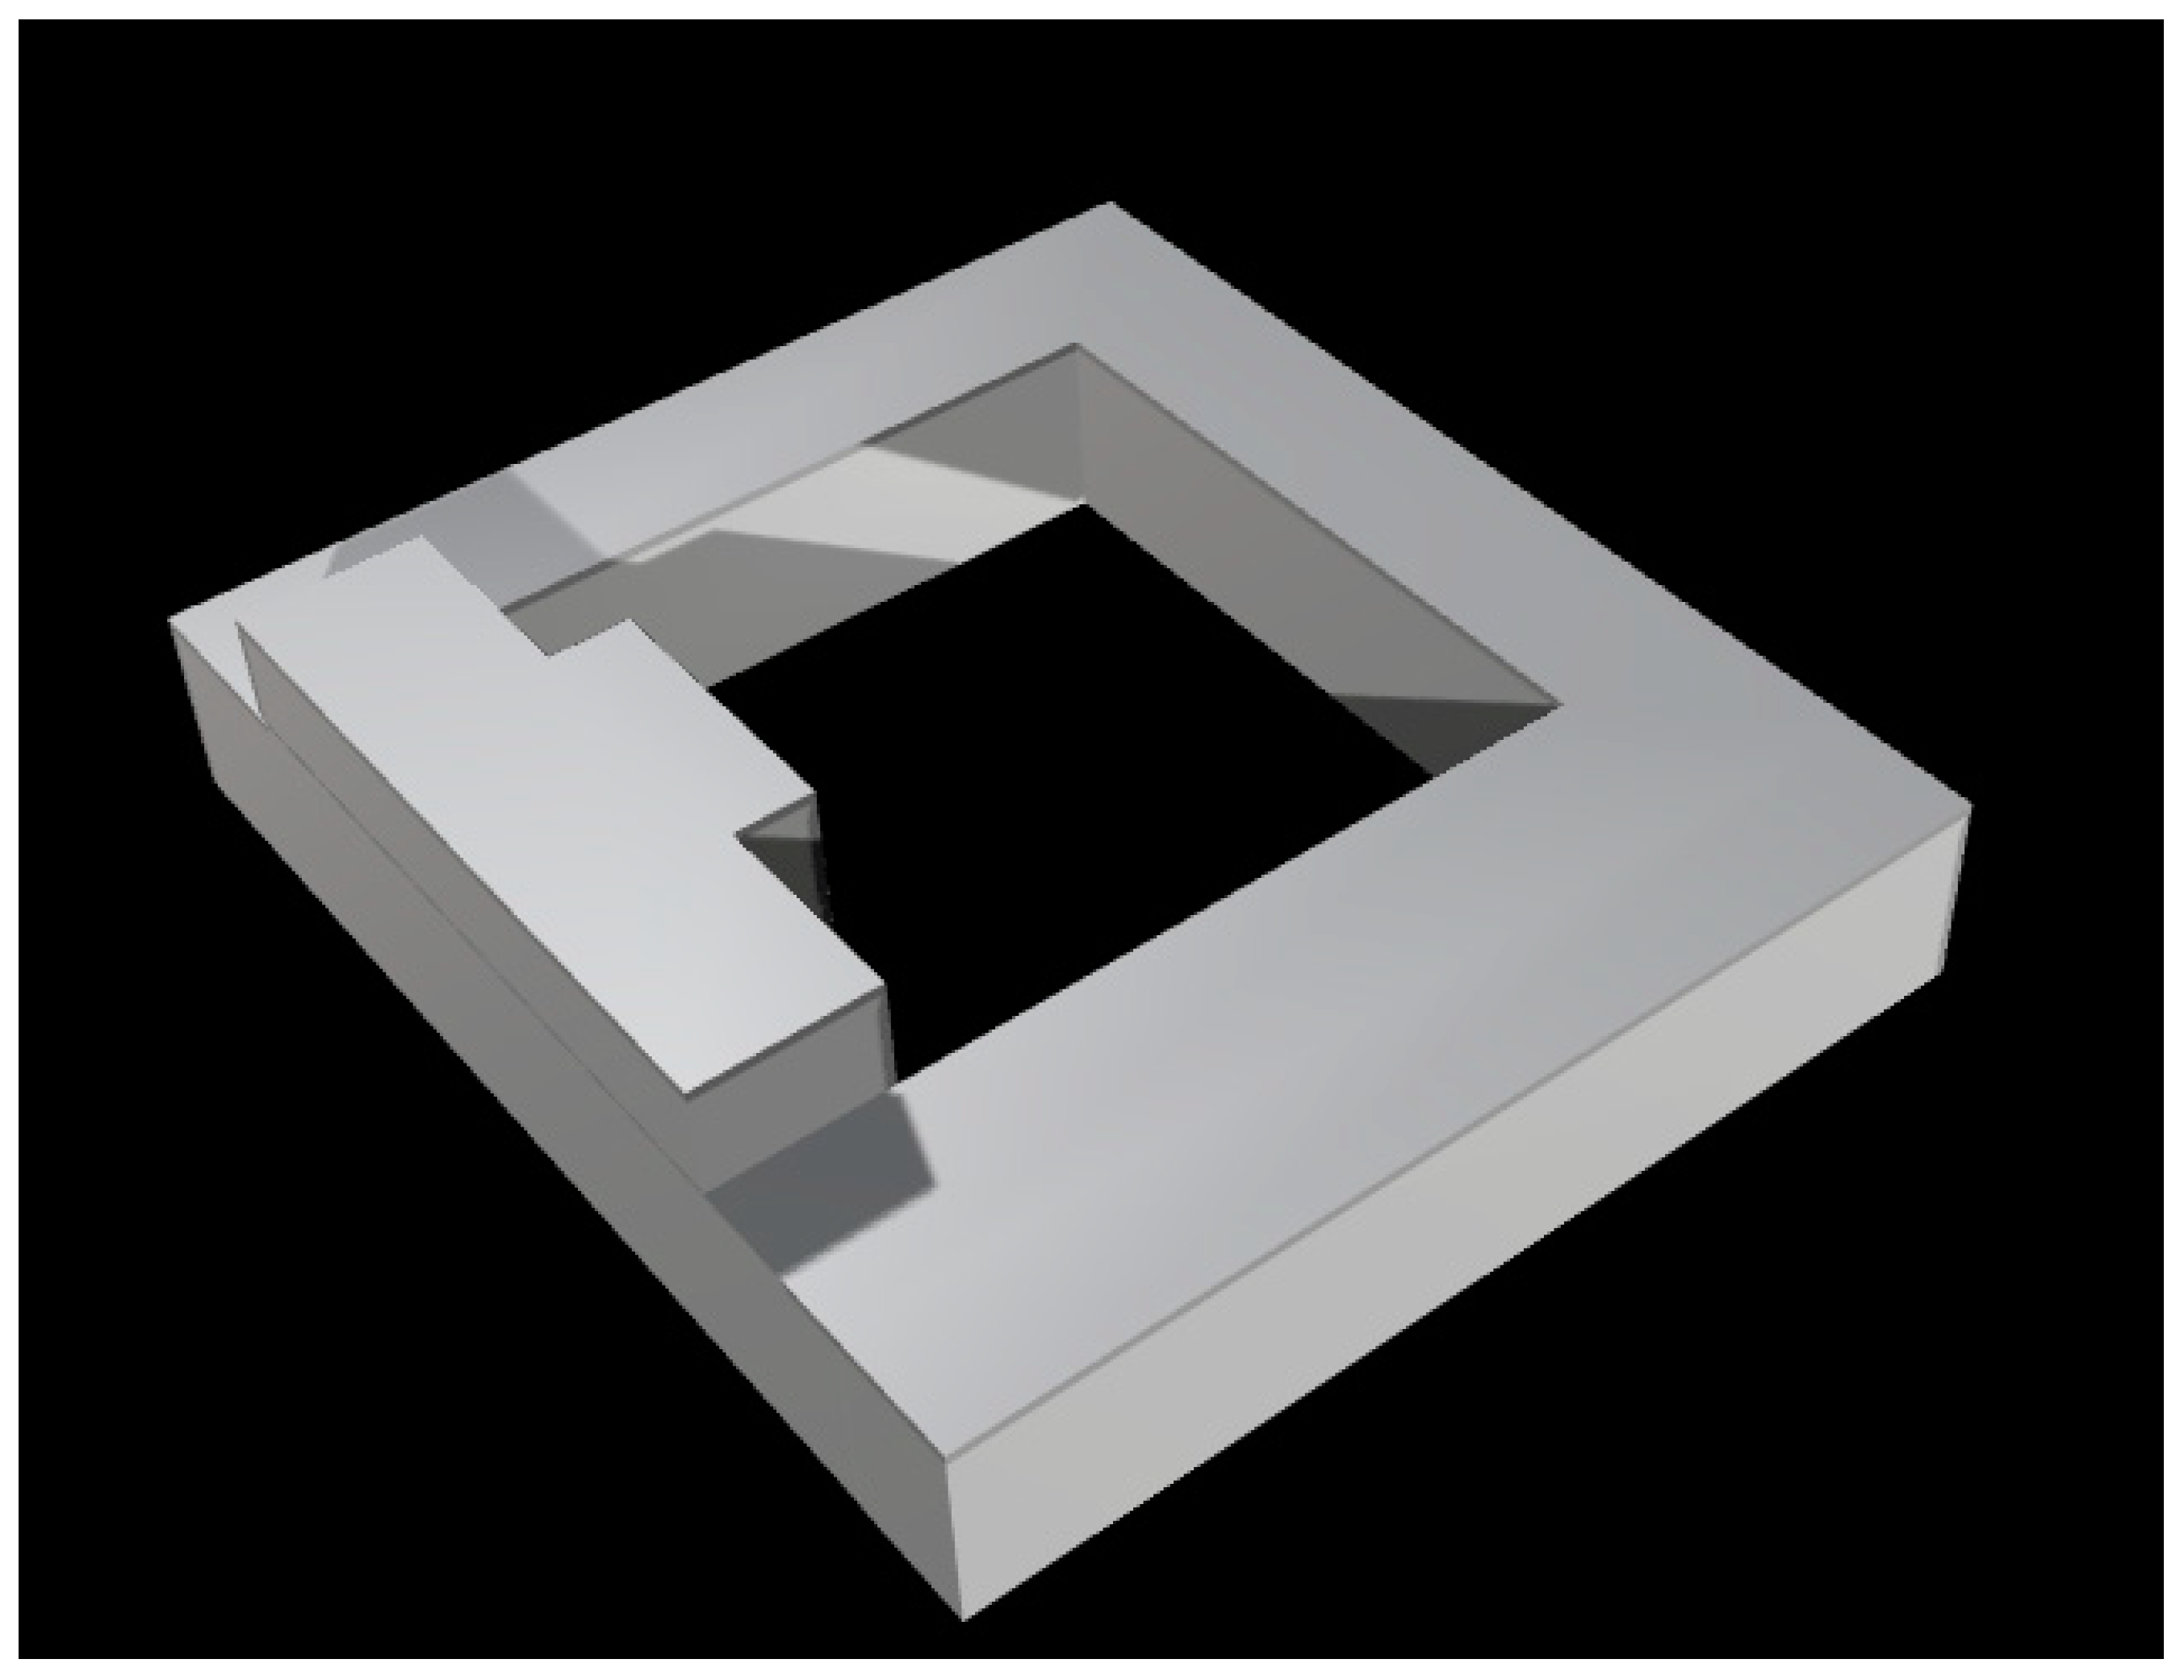
There are numerous traditional courtyards in Isfahan and most of them are removed from the urban heat island of the city and are located in the old region of the city with fewer traffic jams and subsequent pollution. Therefore, it is estimated that the simulated results and the measured data should become much more correlated. The measurements were carried out using a Javaheraha traditional house (as shown layout in
Figure 5) to assess the reliability and calibration factor for ENVI-met for the climate of Isfahan. The effective factors of thermal comfort such as air temperature (as the main and most sensible factor) will be simulated to calibrate the simulation software [
29,
75].
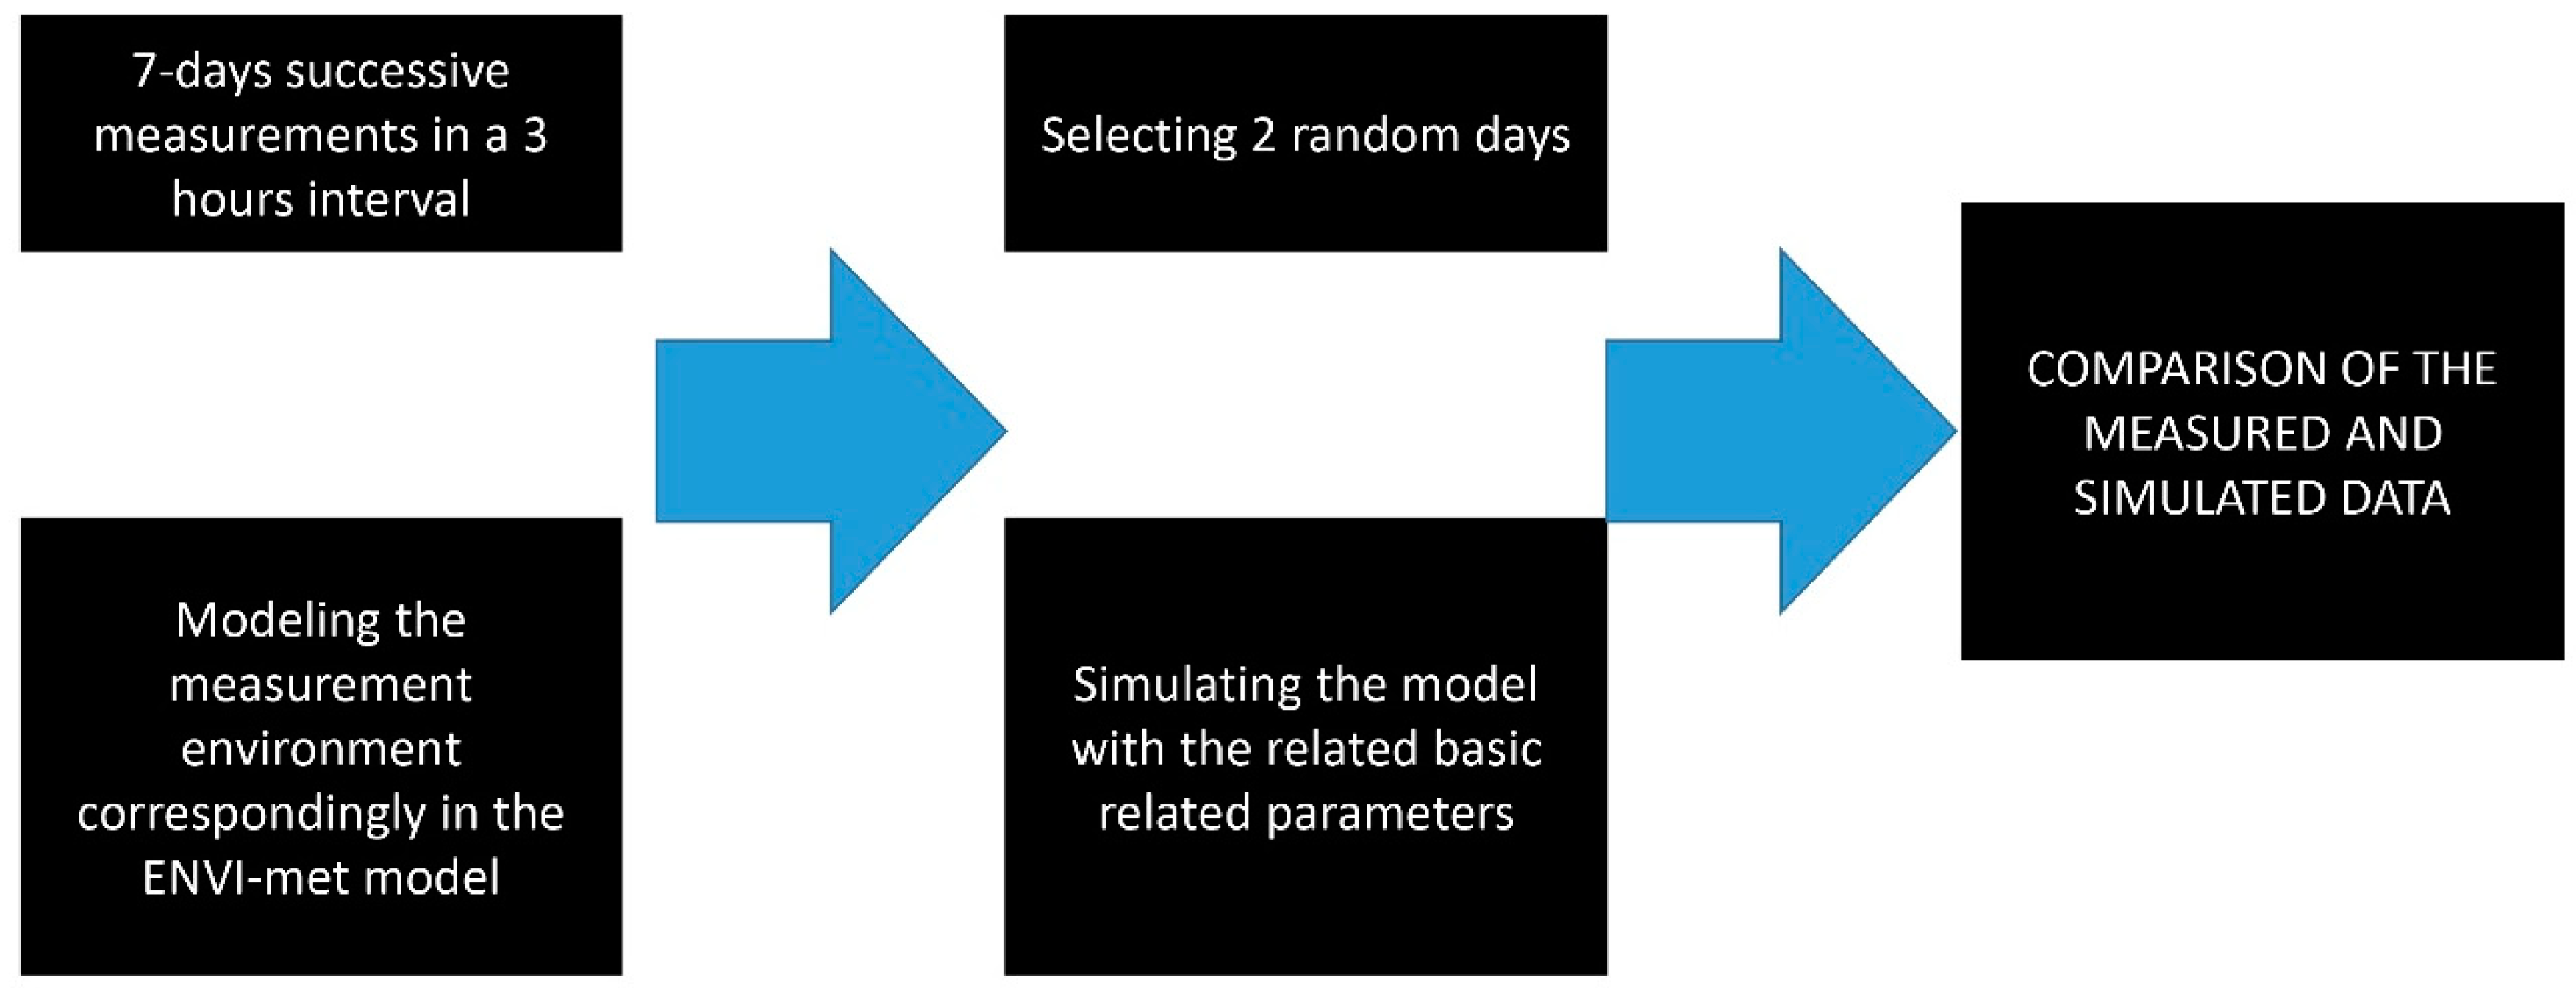
In order to access accurate results, air temperature sensors were protected by a white shield to avoid a radiation effect on the sensor. The measurement was carried out for seven days in June of 2014 and among these, two days were selected randomly to be simulated. The simulation was carried out for 24 h (21:00–21:00) over three hourly intervals. The similarity of the simulated and measured days in terms of thermal conditions and sustainability of the climatic conditions during the hot summer days ensures that more days resemble each other in terms of environmental parameters which makes the validation process more reliable.
The measurement was done by a data logger, namely Lutron LM-800. Random days were the 15 and 19 June 2014. The data were measured in the center of Javaheriha courtyard at a height of 1.4 m. Initial data for simulation were retrieved from the local weather station. Accordingly, simulation for validation process requires some environmental parameters as input configuration file which are described in
Table 7.
The Javaheriha house has been modeled with its neighborhood to reach more accurate results in terms of the effect of neighboring effect. Air temperature as the main parameter of output of the simulation process is described and compared in
Table 8 and
Table 9 for the first and second days. As expected, the air temperatures resemble each other during many hours of the days especially at the beginning and end of the simulation hours. To demonstrate how the measurement and simulated data are correlated, the R-correlation coefficient is needed to show their statistical correlation. This method is a valid statistical method in environmental studies and recently it has been used in different work [
35,
98,
99,
100].
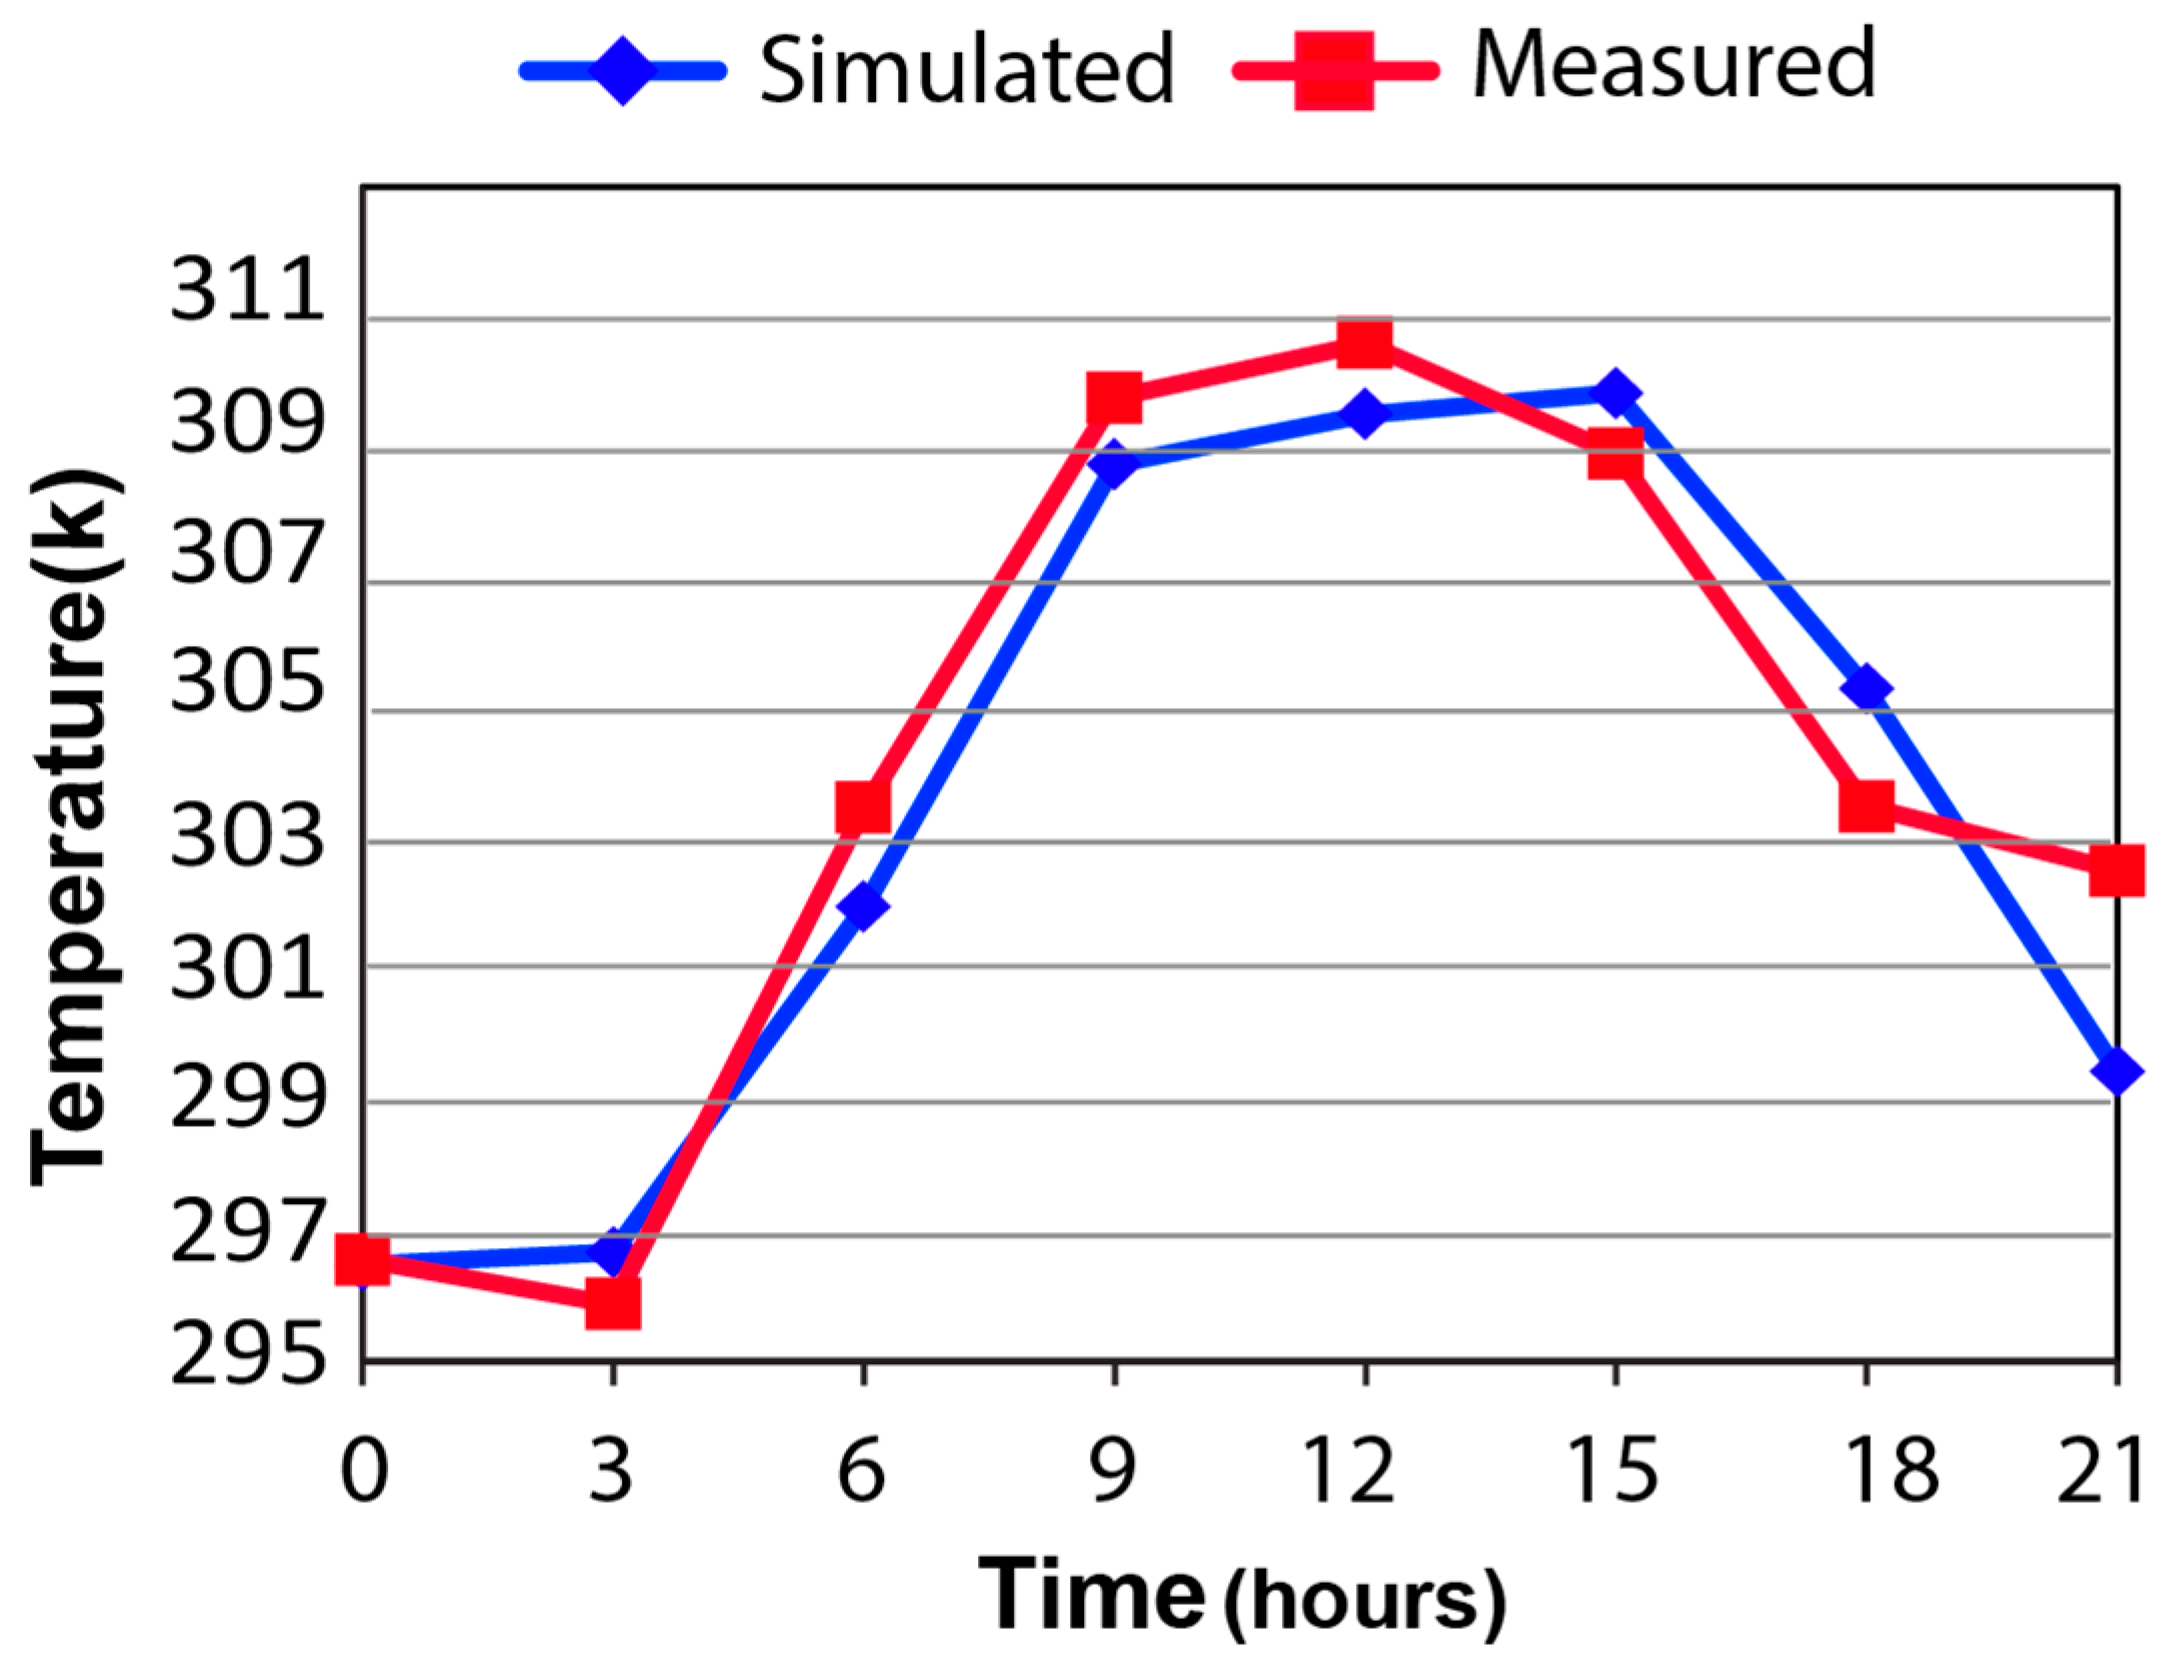
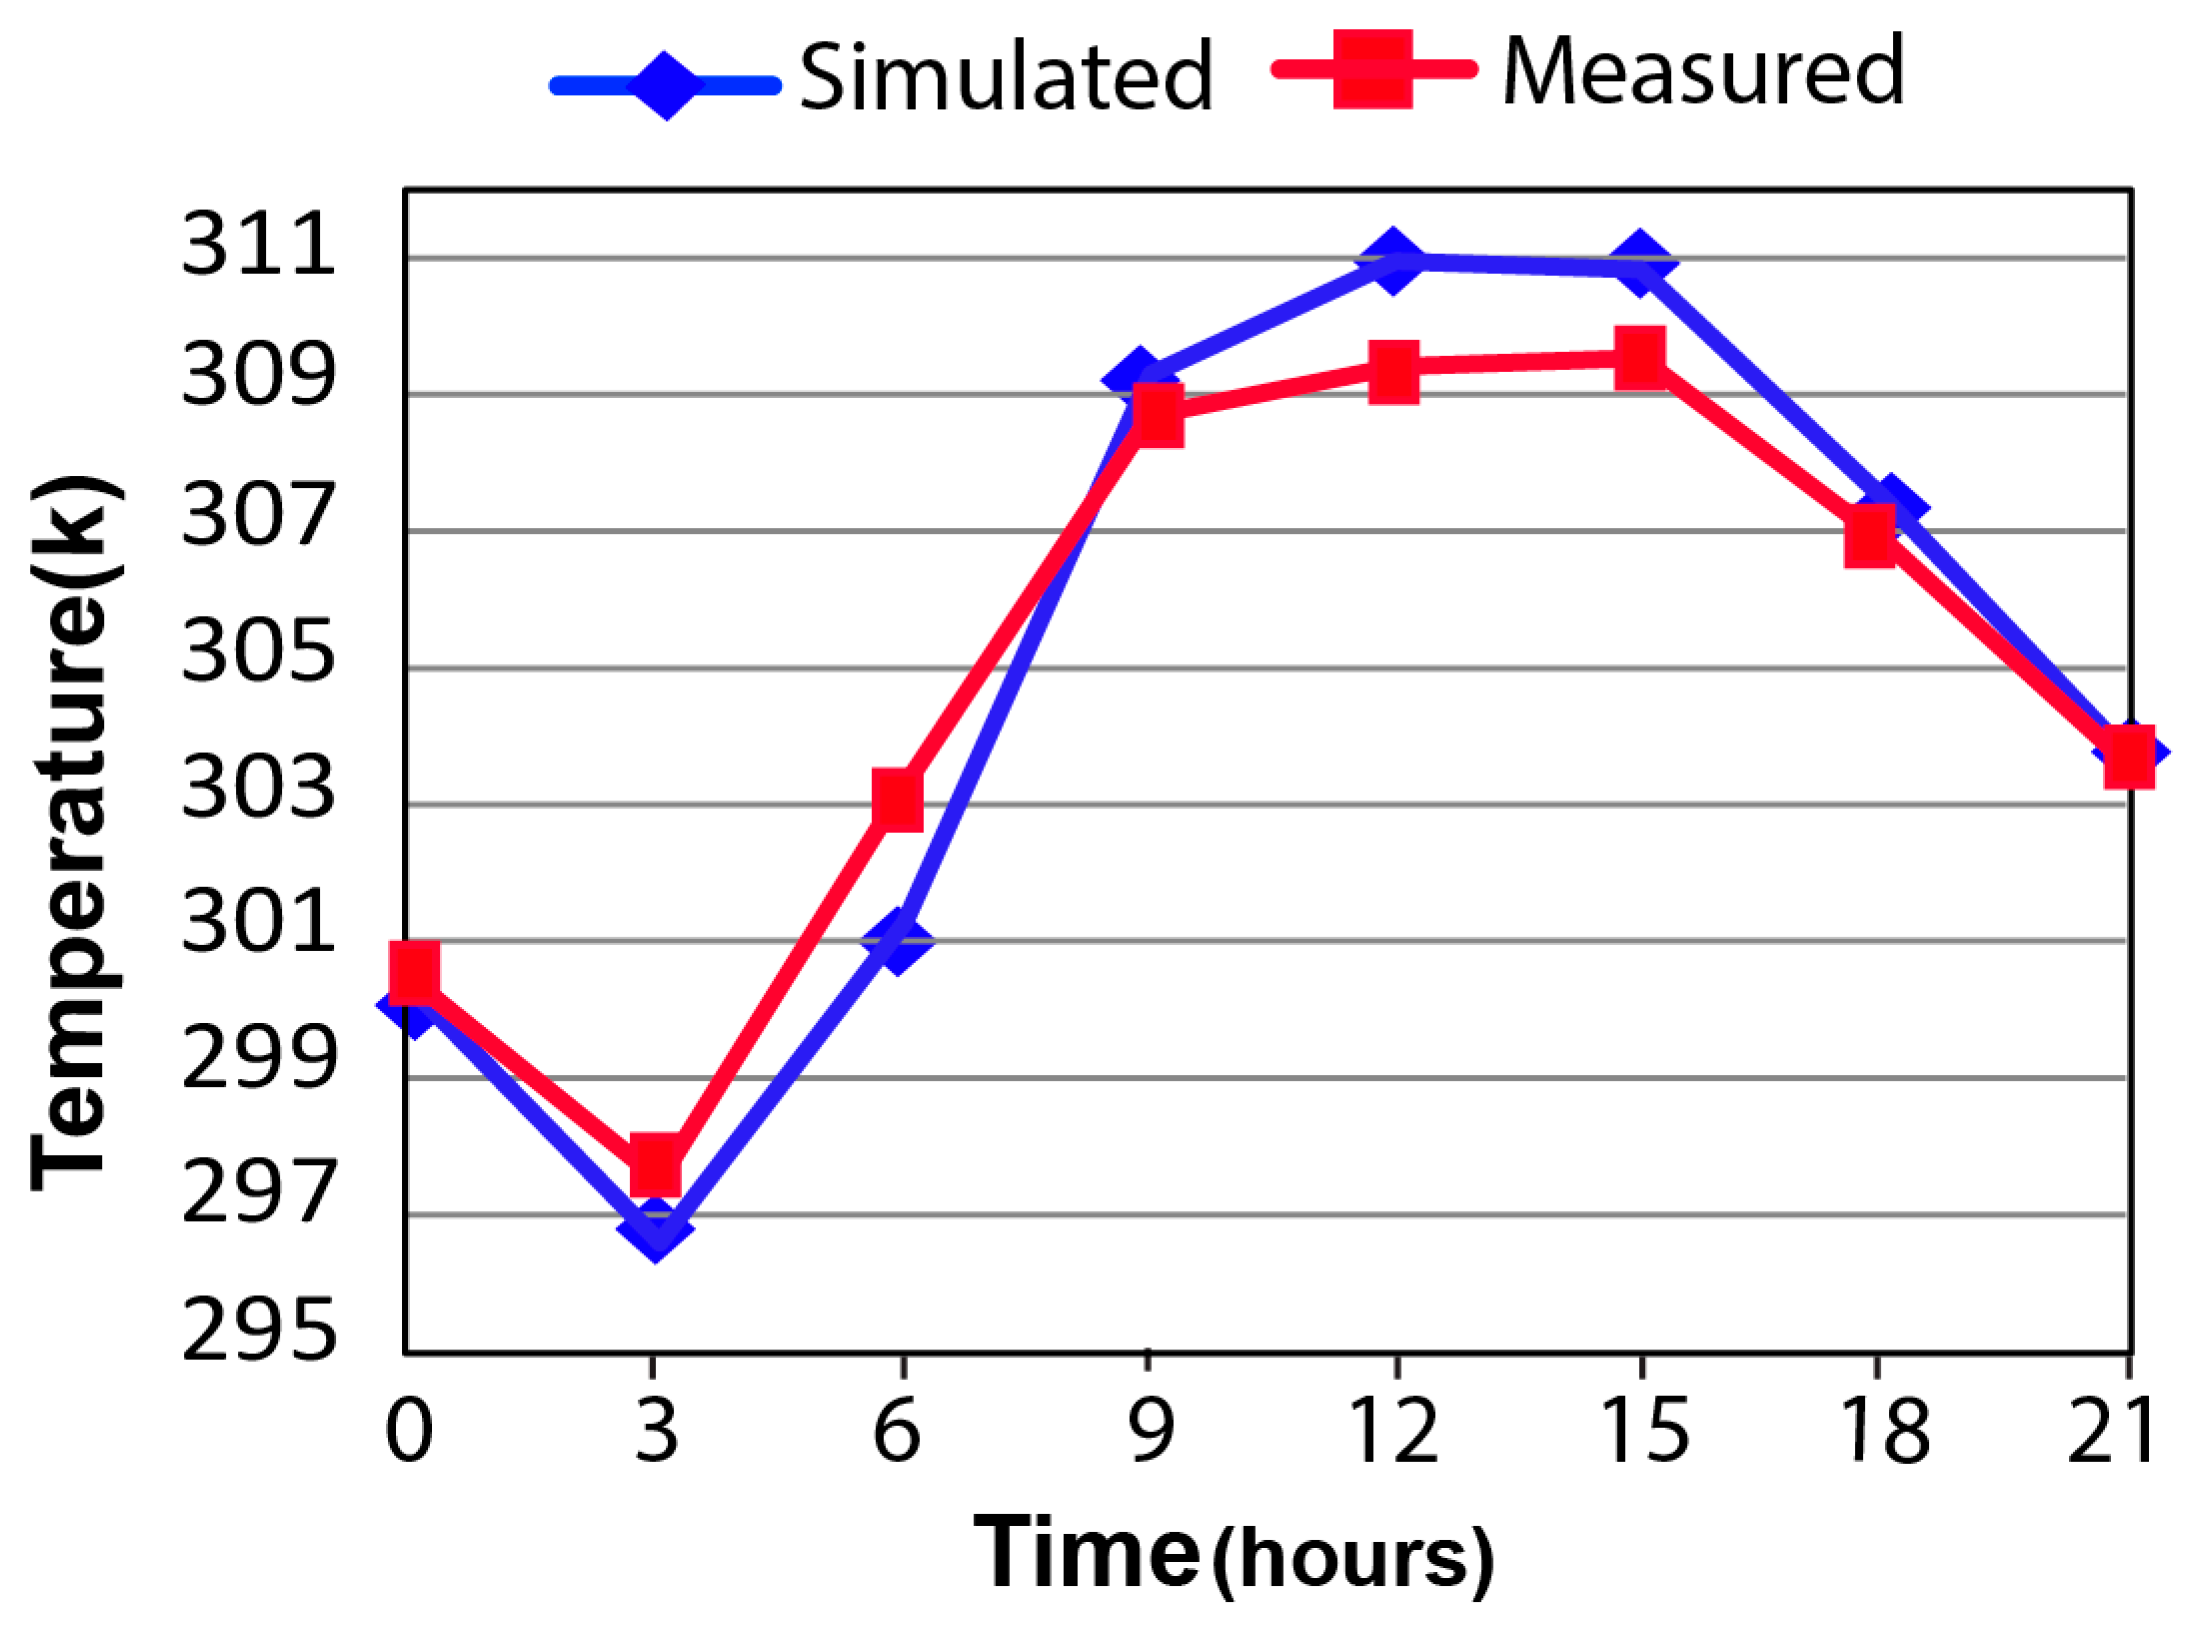
As the next step in the validation progress, the simulation results and field measurement data were compared statistically throughout three hourly intervals. The measured and simulated temperatures during the aforementioned days for selected random days are compared in
Figure 6 and
Figure 7.
The measured and simulated data and their correlation calculation is the final step of the validation progress. Thus, in order to calculate the statistical correlation between field measurement data and the simulated data, SPSS analytical software is used to calculate the R-correlation value. Comparison of the measured air temperature in two random days and their correlation with the simulated data shows that on the first day, the results of the simulation illustrate more than 90% correlation (R = 0.92). This is also true for the second random day (19th) and the R-value is 0.95 and it means that there is 95% correlation between the measured data and the simulation results.
4. Discussion and Analysis
According to the methodology section, the hottest summer day is chosen as the reference day for simulation. The critical day and the critical conditions for simulation are intended to simulate the characteristics of the optimal courtyard according to the critical environmental parameters. Therefore, it is clear that when the outdoor comfort is provided during critical conditions, it will also perform just as well during more favorable conditions, and the conditions of this day can be applied to other days.
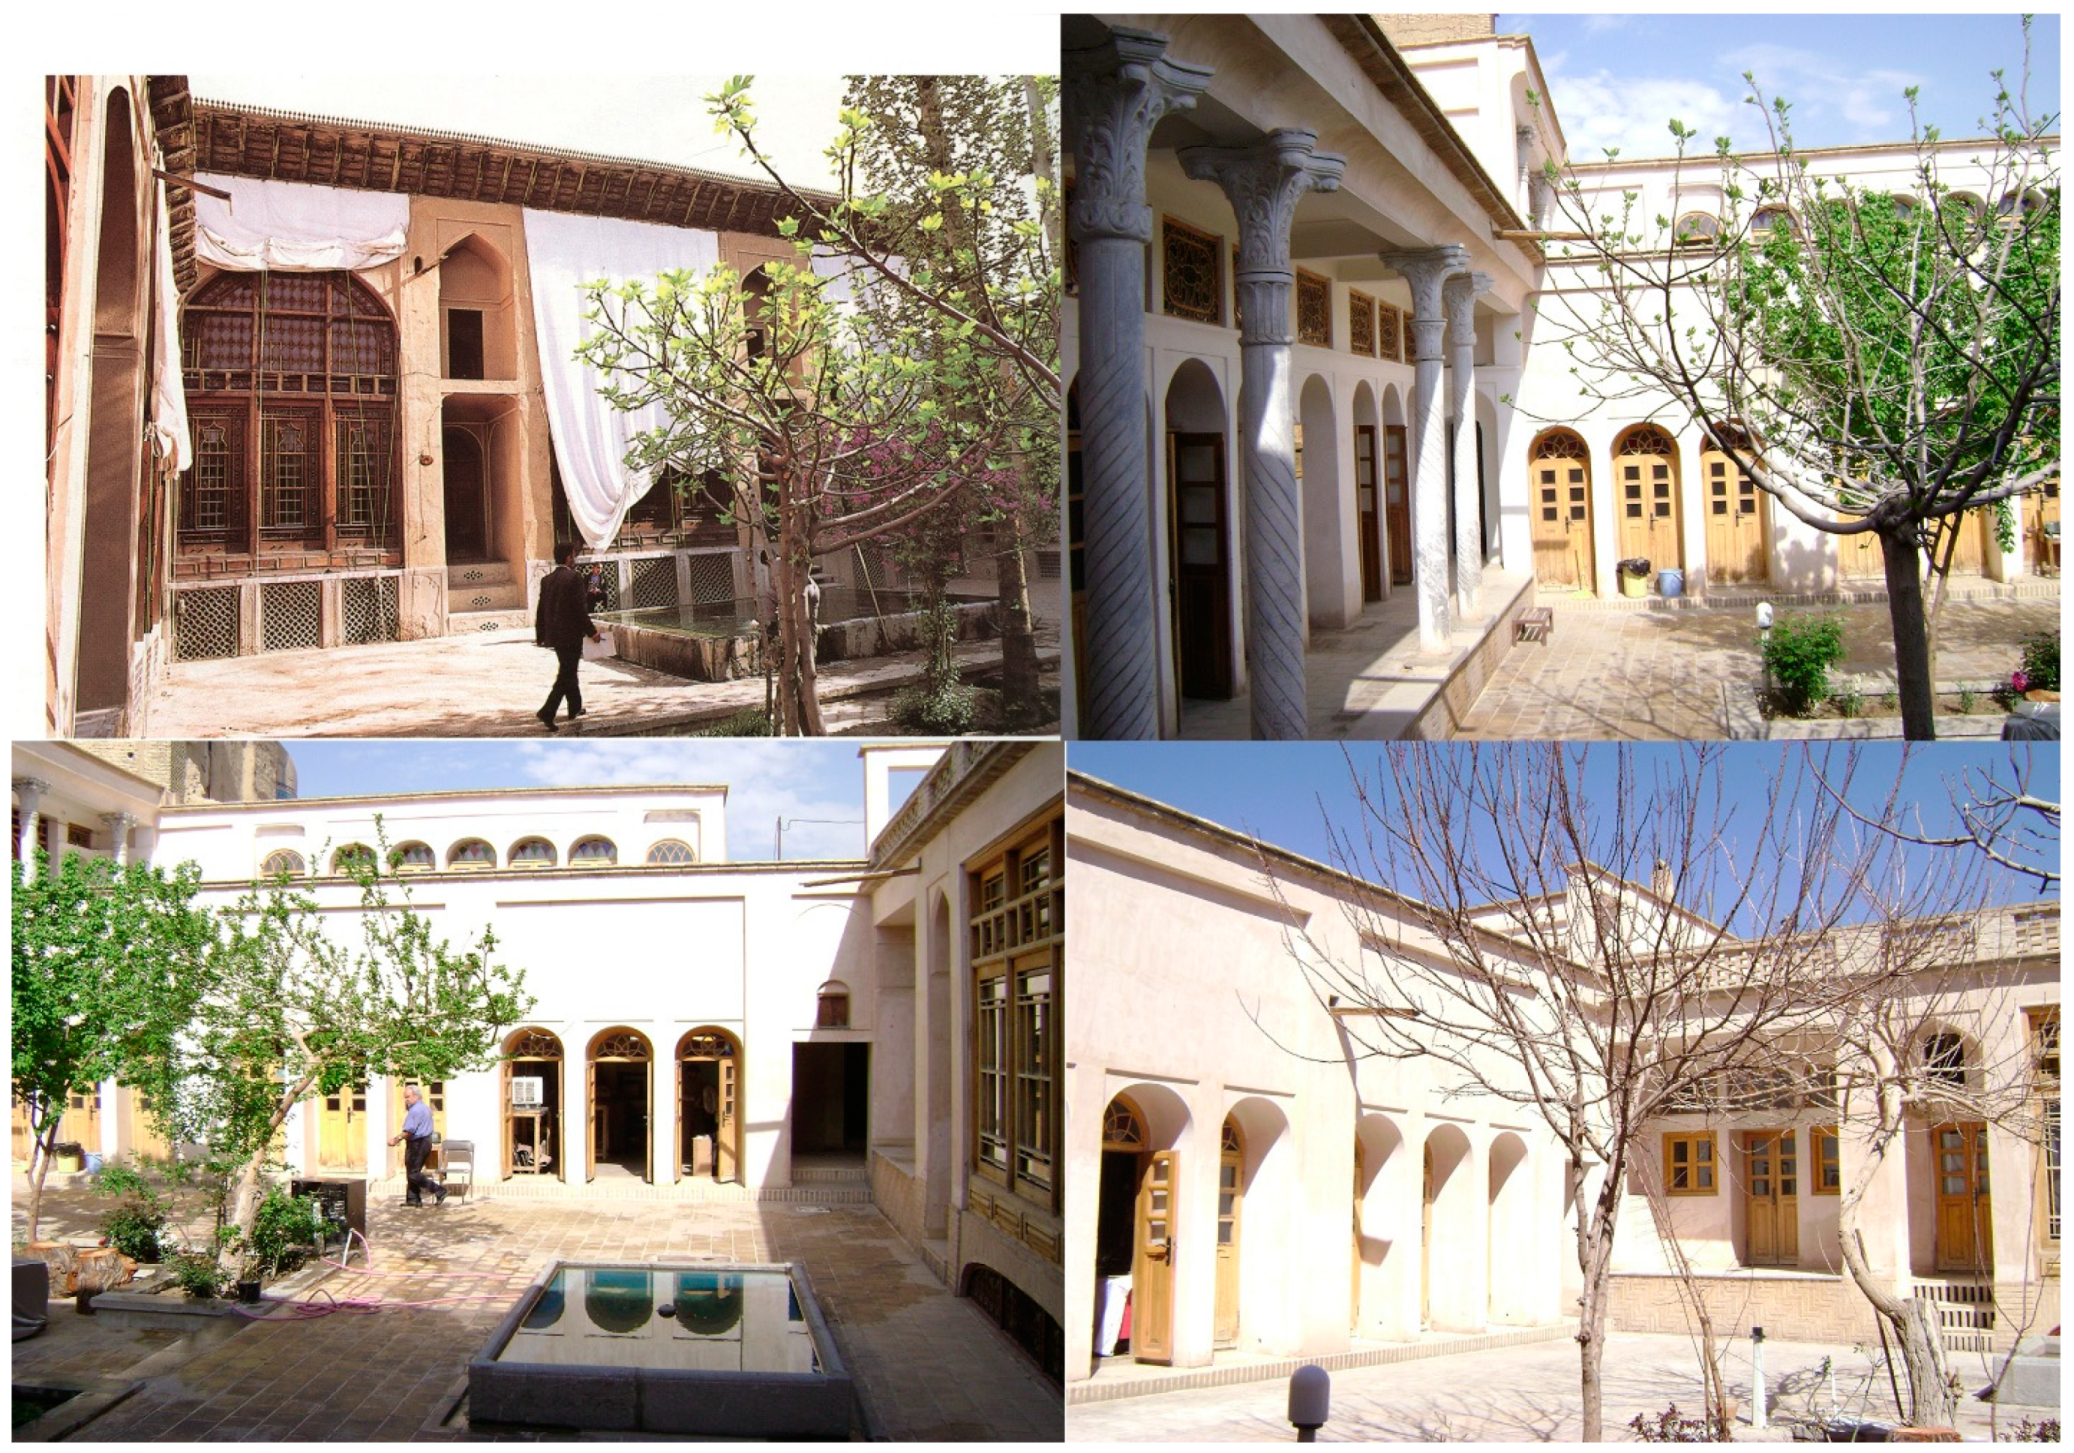
4.1. Physical Features of the Traditional Courtyards of Isfahan
In this section, four traditional and two modern courtyards of Isfahan were selected to be assessed in terms of physical features and environmental factors:
Orientation
Height of walls
Albedo of materials
Green spaces
For this study, five courtyards were selected to be investigated:
Javaheri house
David and Sikias house
Sheikh Al-Islam house
Qazviniha house
Zeitoun complex
The aforementioned courtyard was examined through an experimental method via Lutron LM-8000 Data logger Ta9, RH10, and WS11. All data were measured at the height 1.6 m. According to
Table 10, four variables including orientation, height, the albedo of façade and ratio of vegetation to the total area of the courtyard were considered. All the measurements were carried out simultaneously on 15 July 2015, at 3:00 pm.
According to
Table 11, Javaheri house has a high albedo material and has less greenery and experiences a high air temperature, wind speed and low relative humidity. Qazvinha house with low albedo materials (0.35) and high enclosure of walls with a height of 8.75 m experiences the lowest air temperature among the traditional courtyards. When it comes to the Zeitoun residential complex (modern courtyard), it has high green spaces in its open spaces with relatively low albedo materials (0.46) and a high enclosure of wall with a height of 12.22 m to experience the coolest environment among all courtyards. None of the aforementioned courtyards have the optimum physical features, and ascertaining the optimum variables is the main question that will be answered in the following sections.
4.2. Effect of the Orientation
Orientation should be considered seriously at the early stage of design strategies. So, in the first step of the simulation, according to
Figure 8, four main orientations were examined to reach the optimum orientation.
North orientation
West orientation
East orientation
Central courtyard.
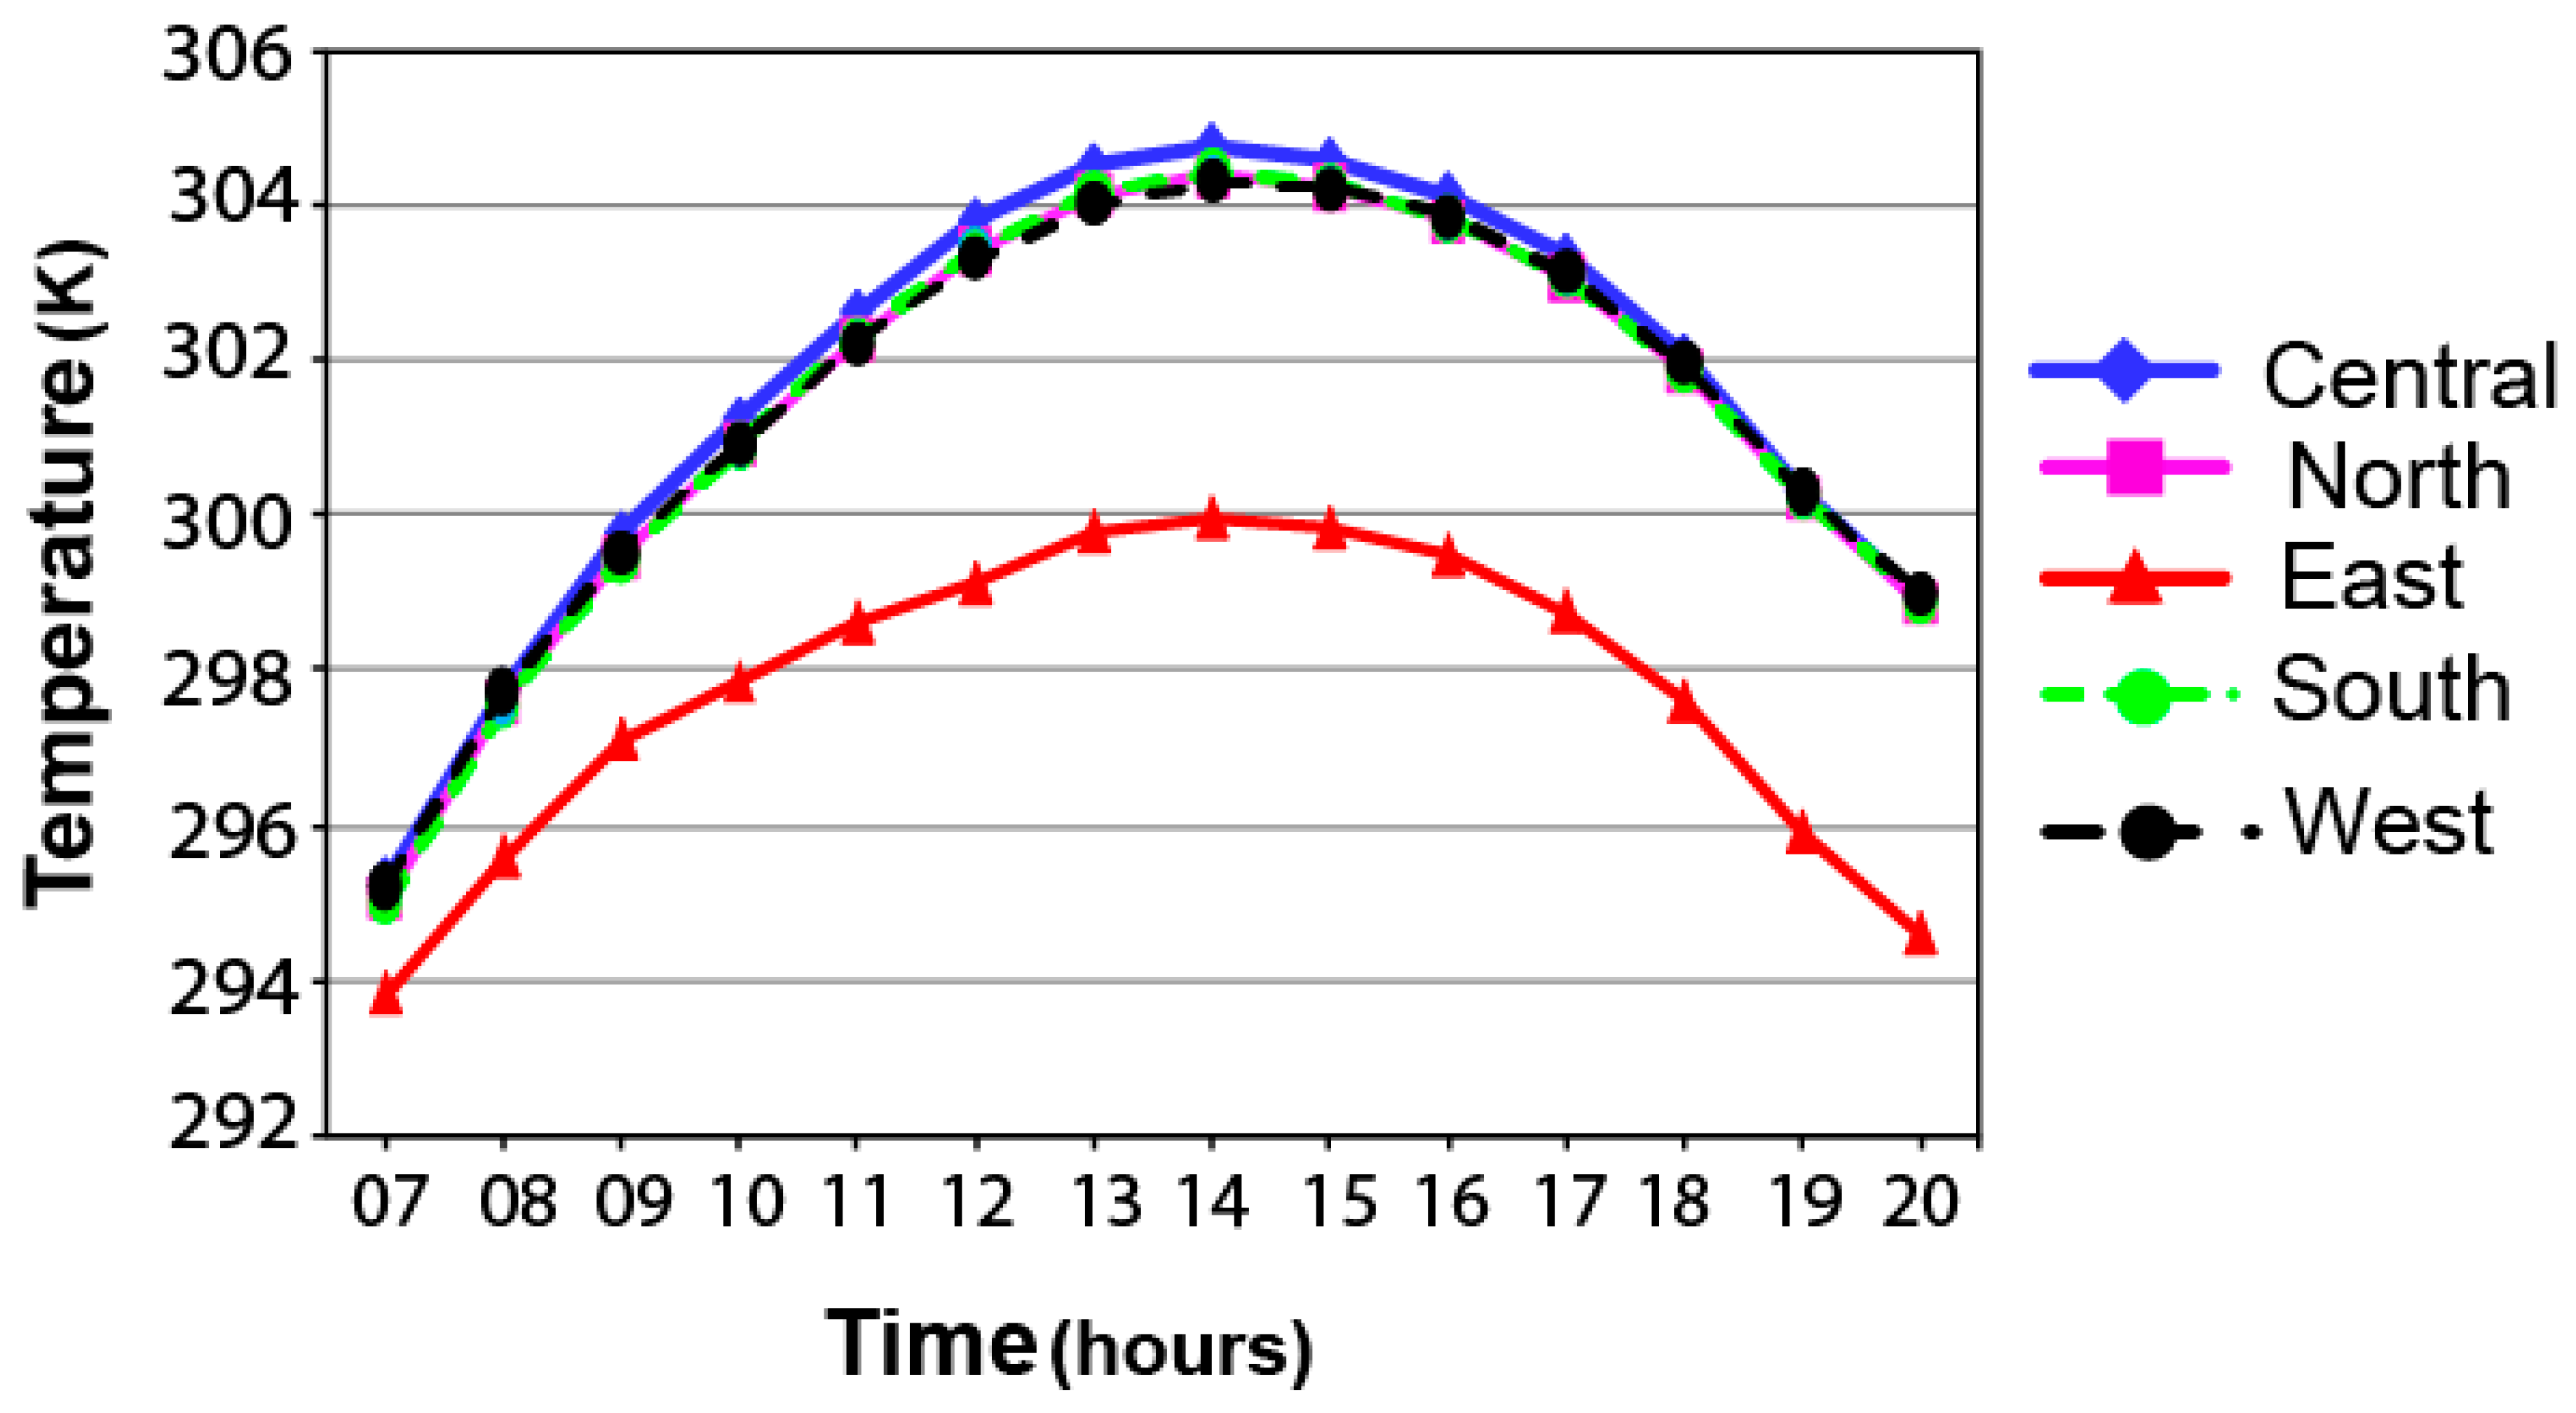
The effect of orientation in order to influence the microclimate factors, such as air temperature, mean radiant temperature, wind velocity, and relative humidity, are measured in the center of the courtyard with a height of 1.6 m. Based on the results of the simulation, the relative humidity and Tmrt values of simulated models are approximately equal (relative humidity and Tmrt of the four models are almost equal), but the models (four conditions of simulation) have different Ta (each model has its own different Ta). Comparison of the Ta of the models in
Figure 9 illustrates that the east and north courtyards have cooler Ta and the east courtyard has the coolest Ta. Early in the morning of the reference day, the Ta of all models is in the equal range but the east model is 2 K cooler. From 10:00 to 17:00, the east courtyard is 5 K lower than all others; after 17:00, the difference becomes 4 K.
Among the other models, the north courtyard is slightly cooler and the west one is the hottest compared to the others. Early in the morning, the courtyard that faces the north has 0.24 K lower Ta, but in all hours of the day, the Ta differences are less than 1 K.
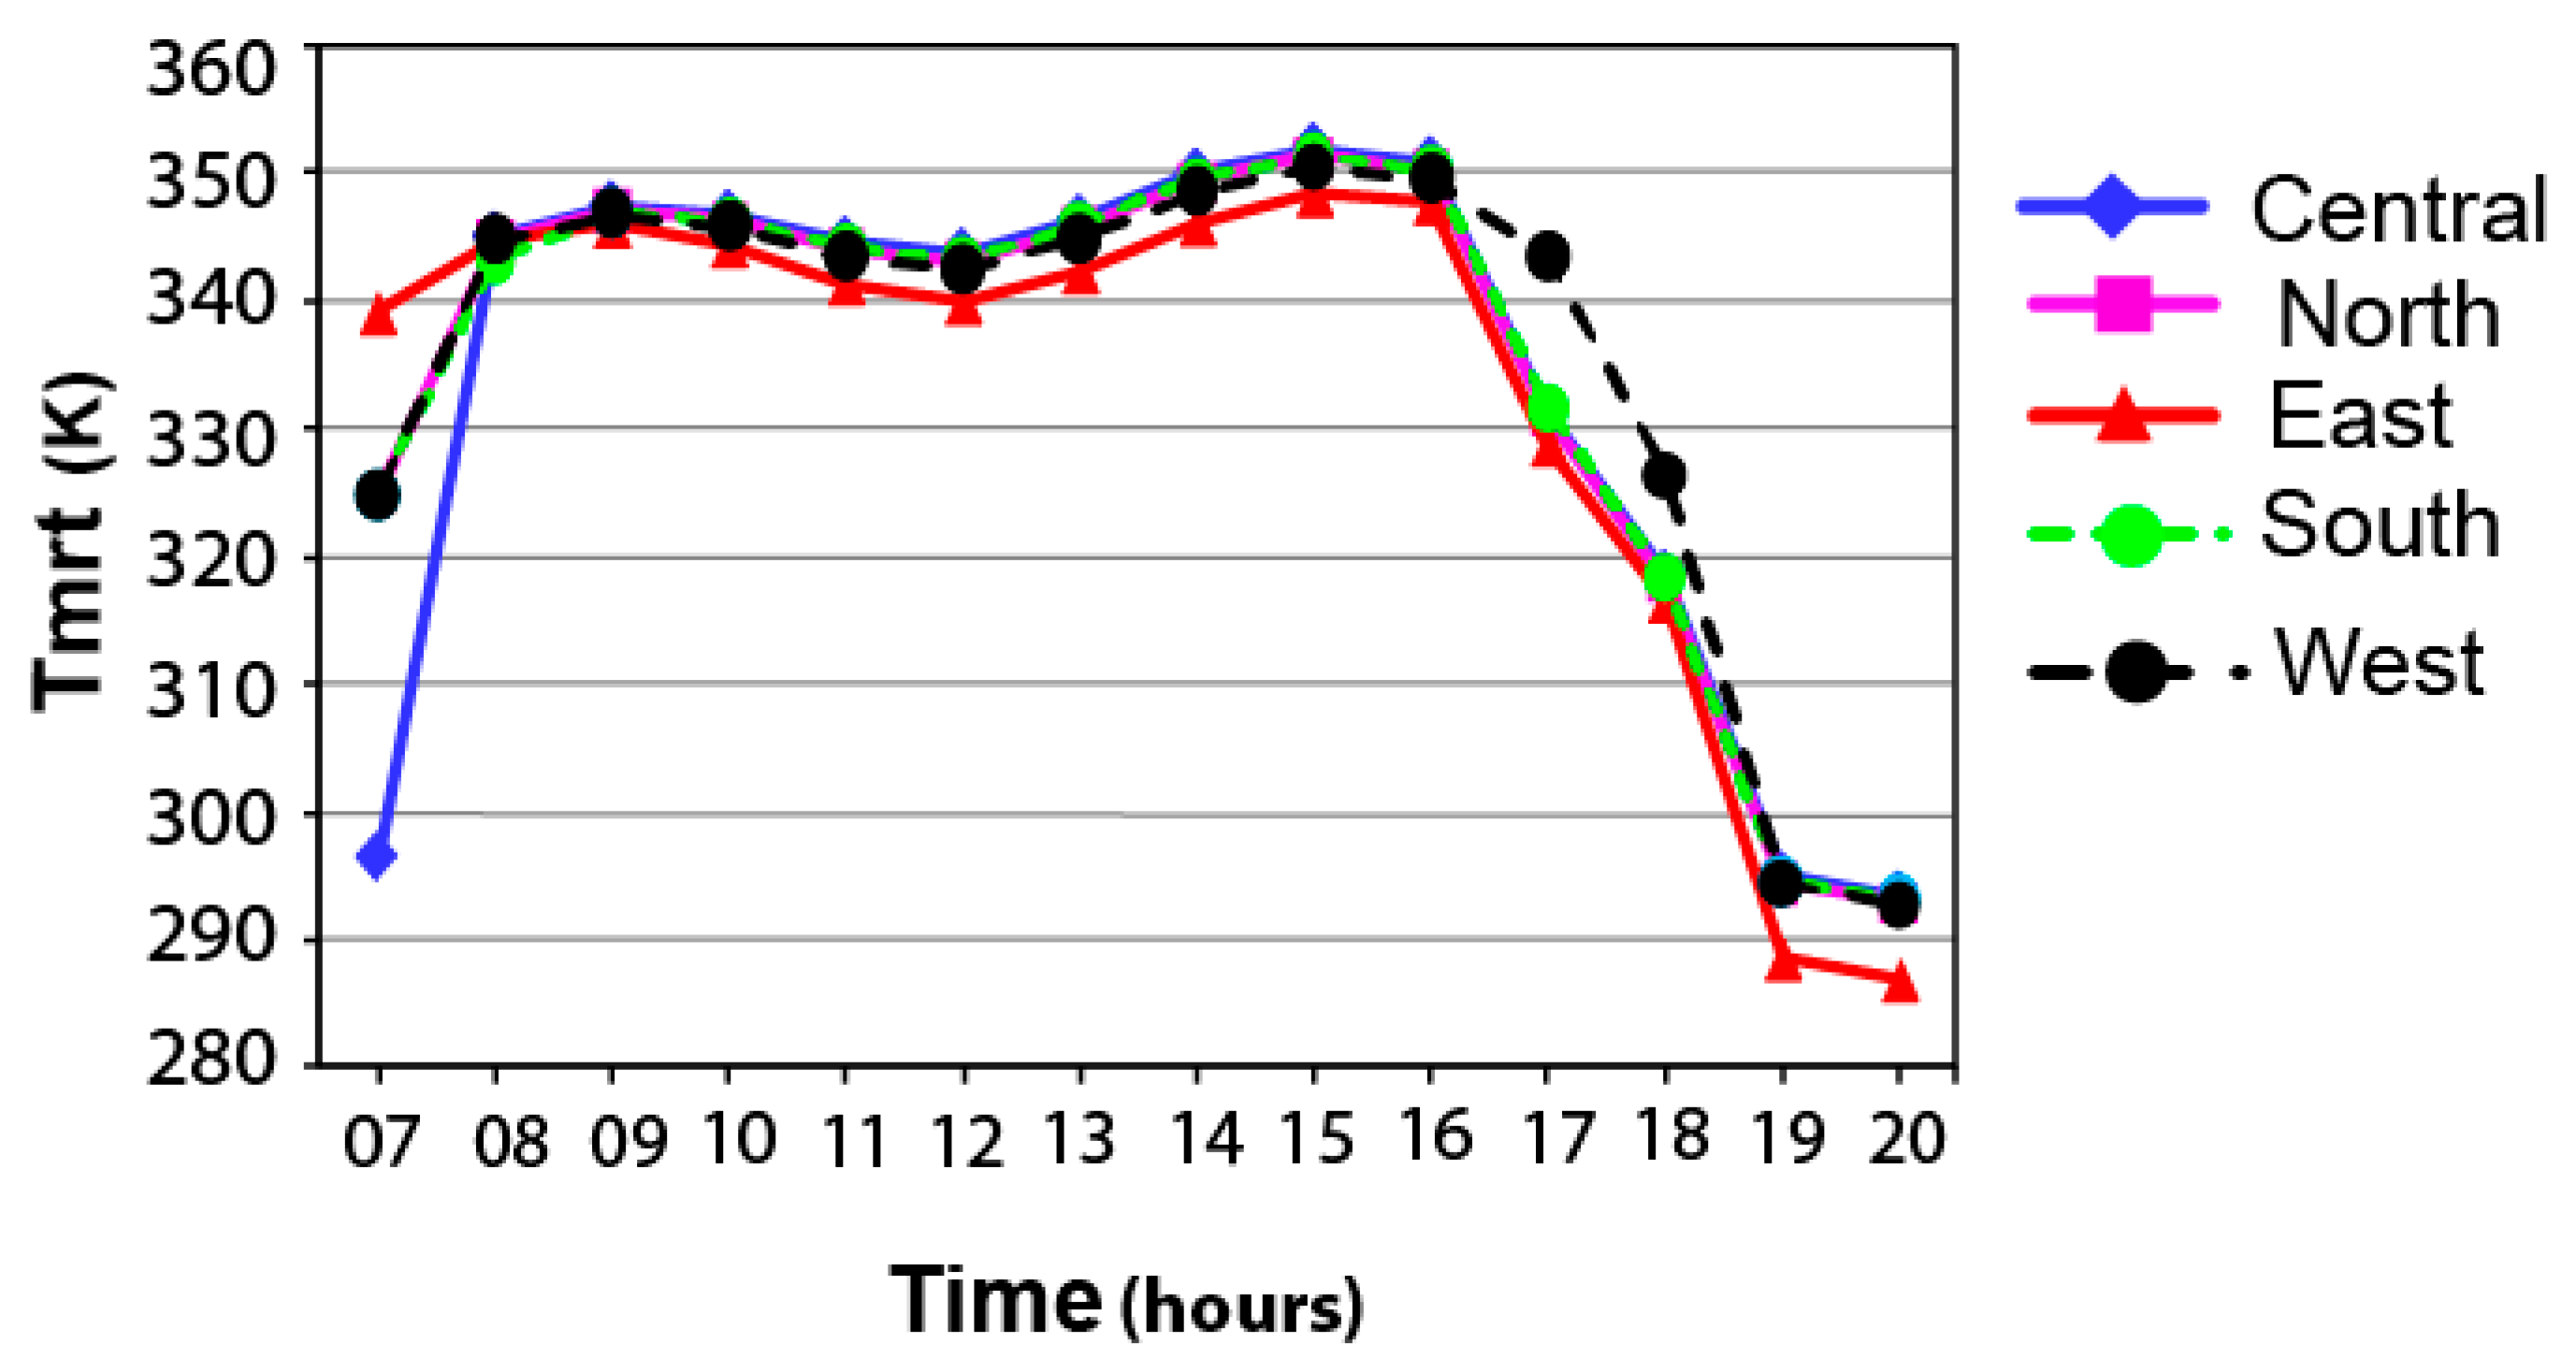
The mean radiant temperature of the courtyards show slight differences. Based on
Figure 10, the central model has a lower Tmrt compared to the others early in the morning, but by sunrise, based on the Ta of all the models, the courtyards facing east and north have the lowest temperatures.
The outdoor thermal comfort and the PMV thermal index in the critical hours from 13:00 to 16:00 illustrate that all courtyards are thermally uncomfortable in the PMV thermal index. The long duration of solar radiation rays with less shaded places in the courtyards leads to heat-stressed conditions outdoors. Only in the early hours of the morning and the late hours of the simulation are some points in the shaded places within the comfort range of the PMV scale. According to
Figure 9 and
Figure 11, only the east and north courtyards have better conditions, but all models are within the uncomfortable range. Therefore, the results of this section show that courtyards of a short height that see direct solar radiation cannot have a thermally comfortable environment.
Avoiding sun radiation is a matter of greatly reducing the Tmrt, as it is obvious that the radiant temperature has a direct impact on the outdoor thermal sensation. Therefore, the proper geometry for the remaining simulation steps, is geometry that receives the lowest amount of radiation.
Due to the low air temperature in the eastern courtyard, the difference between the thermal index and the radiant temperature (as the most important indices in thermal stress) is not observed among the models. Therefore, in order to reduce the amount of received radiation, even in the morning, the yard is proposed on the north orientation.
4.3. Increasing the Height of Wall Enclosure
In the next step of the simulation, the height of the models is increased to 12 and 24 m (3-story and 6-story courtyards) to examine the effect of the height of the enclosure walls.
According to
Figure 12, the height variations were implemented on the courtyard model facing north as this model has a slightly cooler environment. At noon, due to clear sky conditions and approximately vertical sun radiation, the environment is prone to be in a heat stress condition. Therefore, blocking solar radiation can help to create a more comfortable environment. The results of the simulation point out that increasing the height of the wall enclosures in courtyards decreases the Ta. Comparing the Ta of walls of 4, 12 and 24 m shows that from 7:00 to 17:00, the courtyard with 24-m-high walls has a lower temperature.
Overall, as the decreasing sky view factor (SVF) duration of receiving direct solar radiation is limited by walls, by increasing the height (decreasing SVF), courtyards get lower temperature duration early morning and critical hours of the day and higher temperature in the late hours of day and night time. Because of the heat reflux (due to the albedo of the materials) of the walls, by increasing the height of the walls, the amount of reflected radiation increases. Therefore, in the late hours of the day, all spaces of the courtyard are shaded. In this situation, more enclosed spaces are prone to receive more reflection. So, in the late hours of the day (after 17:00), the courtyards with higher walls have higher Ta. Therefore, it is important to assess the albedo of the wall materials in terms of the amount of reflected radiation.
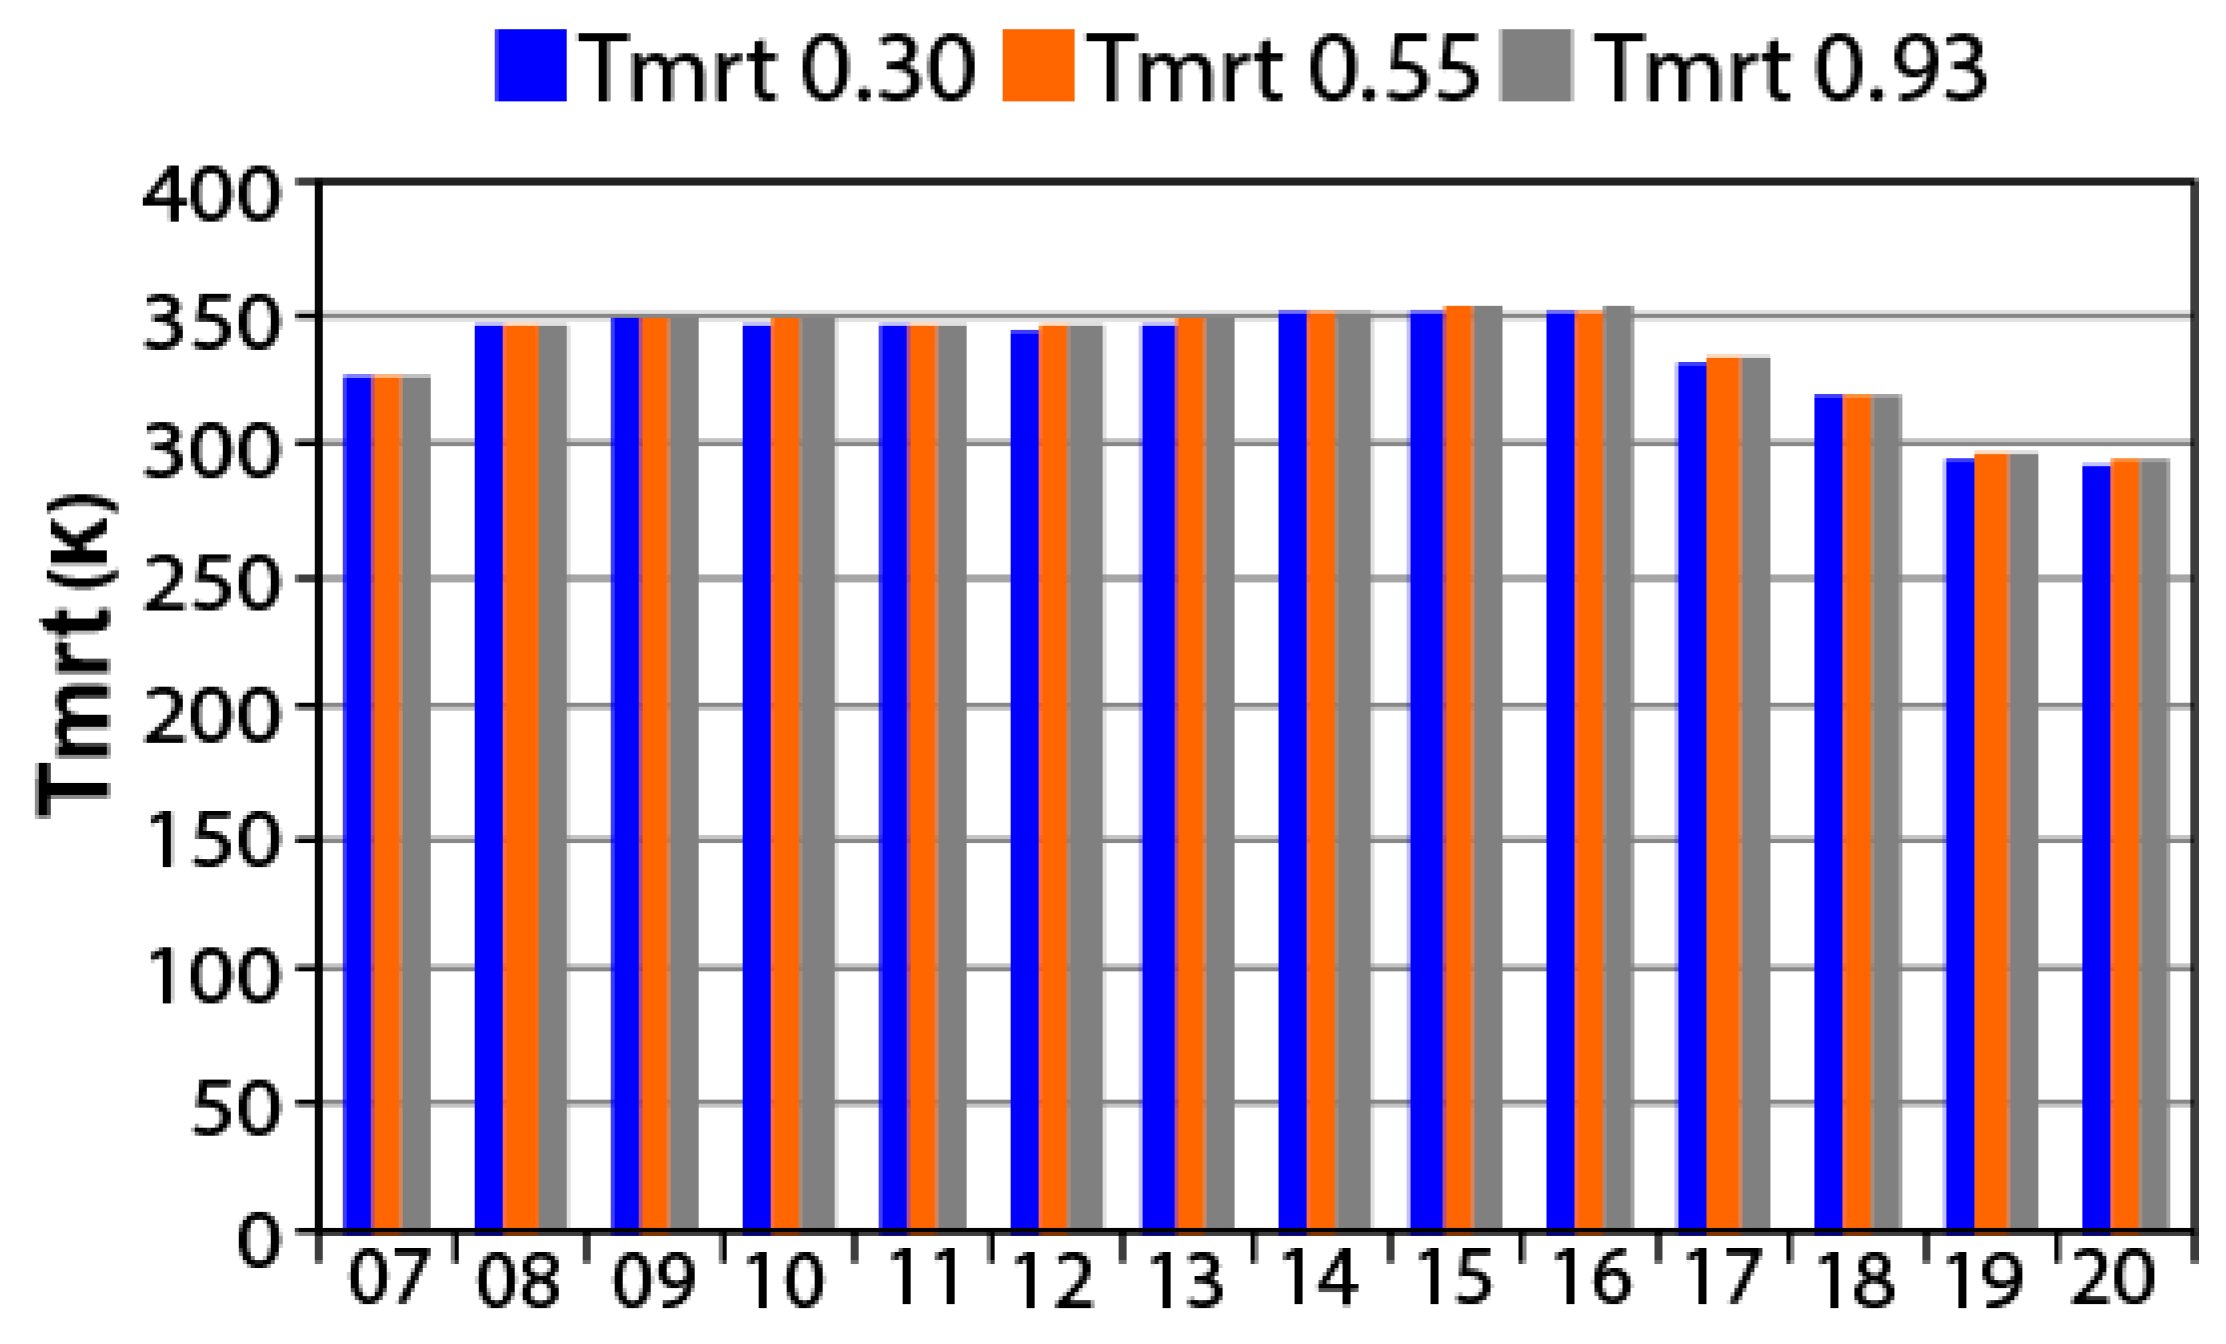
4.4. Effect of Albedo of Materials
In order to examine the effect of the different albedo of materials and arrive at the optimum amount of albedo, three different levels of albedo were selected.
It is important to note that the reflection of the pavement proposed is a fixed value through the simulation process; therefore, by changing the amount of the albedo of the façade’s materials, the amount of albedo of pavement is a fixed value and its effect is fixed and is a unique value in all cases.
0.3 (for example, brick)
0.55 (for example, marble)
0.93 (for example, high-reflective plaster).
The result of the simulation shows that the 0.3 model has a slightly lower air temperature. From 7:00 to 8:00, the 0.3 model (for example, brick) has a 0.79 K cooler environment in comparison with the other models.
According to
Figure 13, the 0.3 model has a cooler environment in the remaining hours of the reference day. After 17:00, the differences in Ta among the models increase. At 17:00, the difference between the hottest models (0.55) and the coolest one (0.3) is 0.76 K; accordingly, the differences are higher than in the previous hours. At 6:00, the difference between the hottest model (0.93) and the coolest one (0.3) is more than 1 K. In this manner, at 20:00, the difference between the models is 1.47 K.
The Tmrt, as an indicator of heat stress, should be compared to get an accurate result in order to choose the optimum material in terms of a suitable albedo. Comparing the Tmrt of the models revealed that, based on the Ta of the models, the 0.3 model has a cooler environment in terms of mean radiant temperature. The degree of reflection of the materials can directly affect the thermal sensation. It would be more important in creating a cooler environment in the daytime and a warmer environment at night. With increases in the time of day and the amount of sun, the total amount of radiation in both diffuse and direct conditions increases. In the second hour of the simulation, the differences between the maximum Tmrt and the minimum Tmrt is greater than 1 K. The differences in the Tmrt increase as time increases. After 11:00, this difference becomes greater than 2 K. The maximum difference is seen at 14:00 (2.05 K). After 17:00, due to the sunset and the low angle of the sun, the total amount of radiation starts to decrease with more speed than in the earlier hours. Based on
Figure 14, three late hours are the coolest hours of the day. It can be concluded that the 0.3 model has the optimum albedo of the materials required for creating a cooler environment in terms of both Ta and Tmrt.
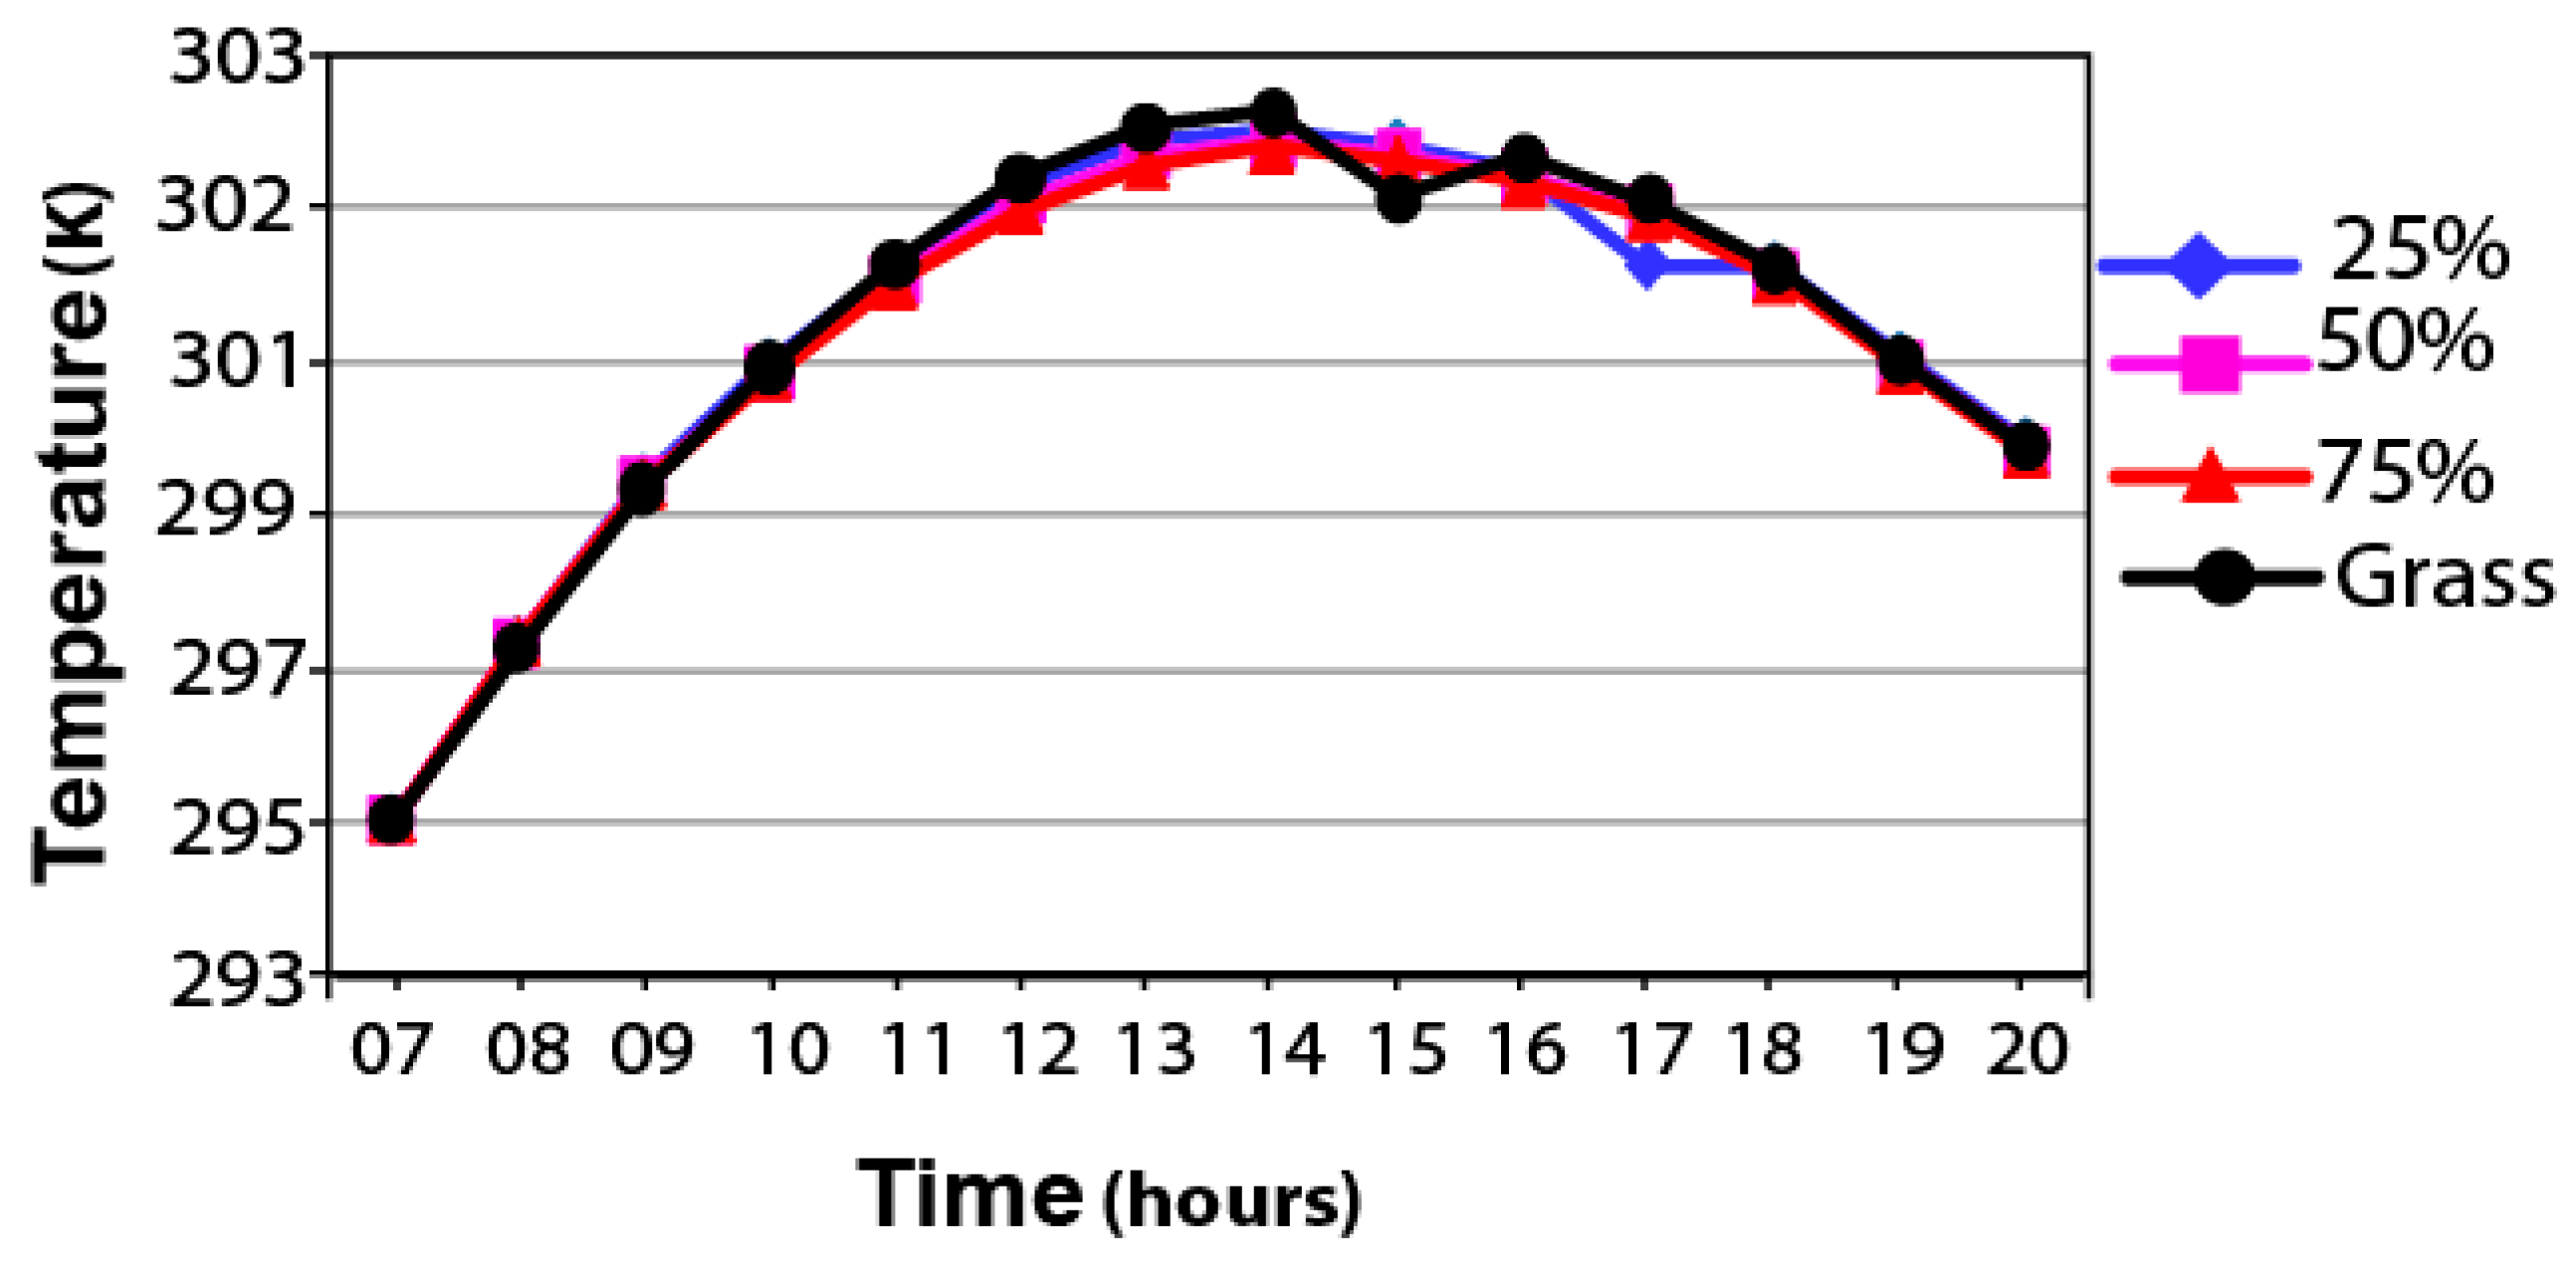
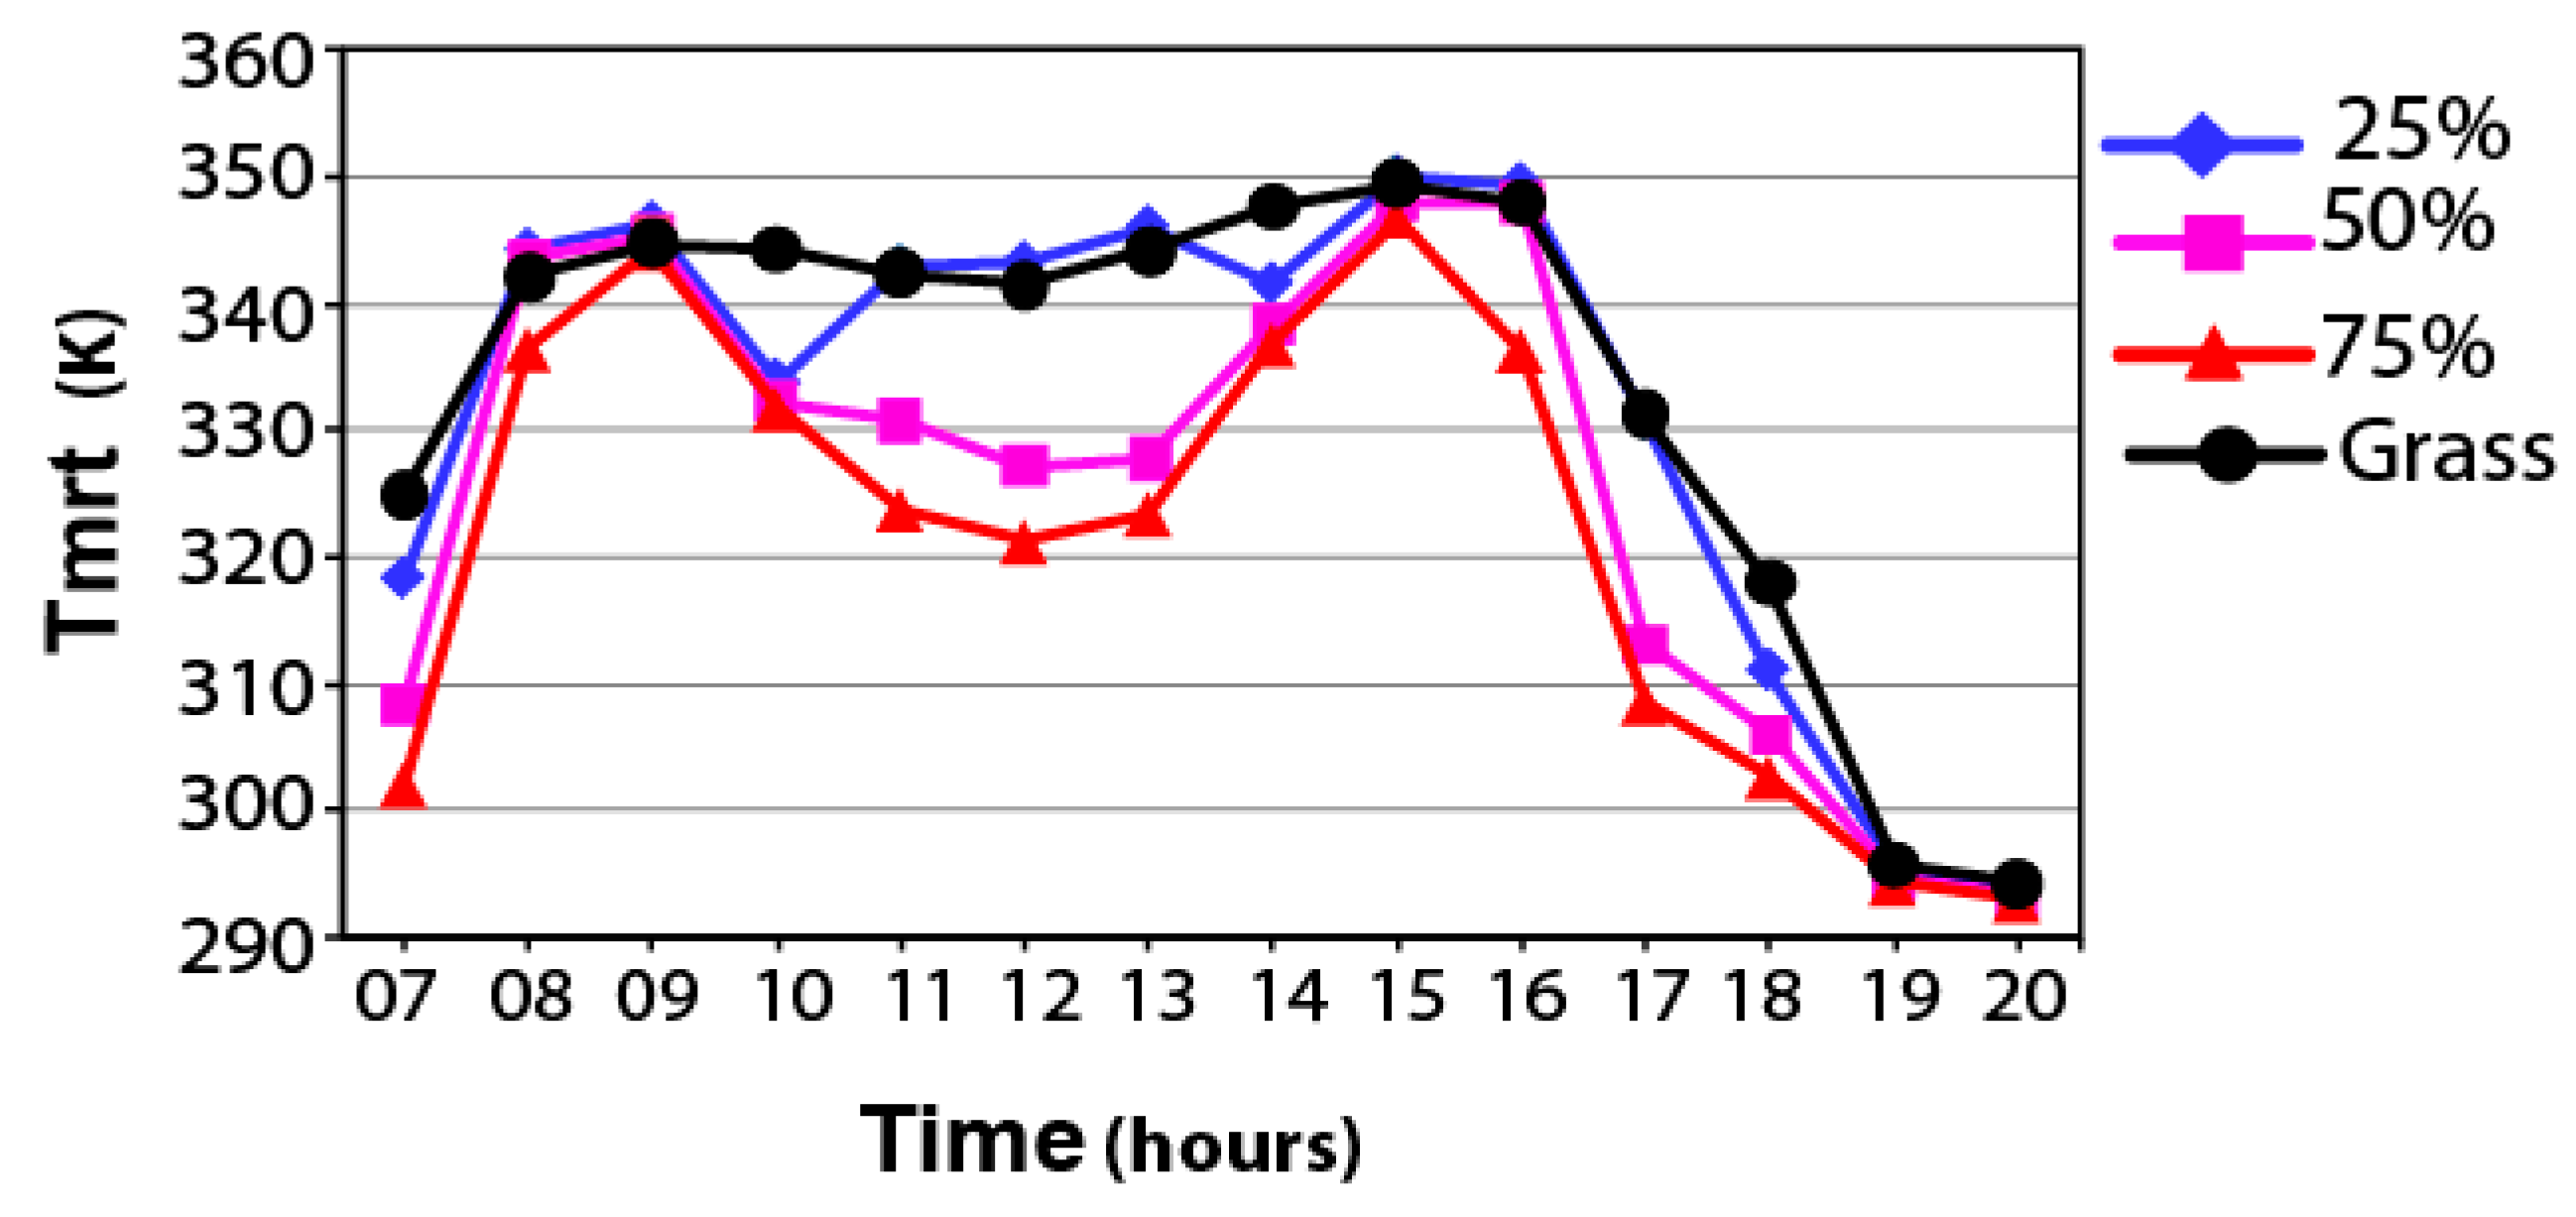
4.5. Effect of Vegetation Coverage
The final step of the simulation is to finalize the optimum physical features of the courtyard to create a sustainable environment in terms of thermal comfort in the hot and arid climates of Isfahan. In order to determine the best percentage of vegetative cover, the following four simulation conditions were selected:
This step of the simulation is scrutinized in terms of Ta and Tmrt. Based on
Figure 15, the air temperature of all four models is about 295 K. In all hours but 15:00 and 18:00, the Ta of all models are in the equal range. But in the hours mentioned, the grass-covered 25% model has a slightly warmer environment. These models follow logical behavior. It is necessary to note that the humidity and evapotranspiration have an effect on the wet bulb temperature, not dry bulb temperature, and its enthalpy value is fixed in evapotranspiration process; therefore, it is expected that air temperature (dry bulb temperature) will be steady and fixed.
This step of the simulation is scrutinized in terms of Ta and Tmrt. The air temperature of all four models is about 295 K. In all hours but 15:00 and 18:00, the Ta of all models are in the equal range. But in the hours mentioned, the grass-covered 25% model has a slightly warmer environment.
All four lines of the chart grow slowly by sunrise and decrease by sunset. But the chart shows different behavior for the Tmrt values. According to
Figure 16, in the early hours of the day, the 75% model has a cooler environment of about 15 K in comparison with the hottest one (grass-covered model). After 9:00, the grass-covered 25% model gets warmer by 50 K and the 75% model gets cooler until 15:00. At 15:00, all four models have approximately equal Tmrt. After 15:00, all models start to have a cooler environment in terms of total Tmrt. Accordingly, the 50% and 75% models emitted more radiation fluxes and received less diffuse and direct radiation. Because of the low angle of the sun in the four late hours of the reference day, all four simulation conditions have similar amounts of Tmrt. Therefore, more greenery creates a cooler environment in terms of the mean radiant temperature. With the presence of more shaded areas, the total amount of diffuse and direct radiation decreases at noon. Consequently, the 75% model has a cooler environment during the hottest hours of the day. Thereby more than 50% of the courtyard should be covered trees and greenery.
5. Conclusions
Open spaces and their thermal conditions by and large depend on physical features. Courtyards in traditional Iranian architecture as an open space for homes are well suited for the level of outdoor thermal comfort. Courtyards are mainly used in hot and arid climates. The lack of sufficient scientific studies about the physical features of courtyards makes the modern courtyard less effective in terms of thermal comfort. Therefore, an accurate simulation method was carried out to develop an understanding of the local thermal characteristics of the courtyards in the climate of Isfahan. Four fundamental items are listed below:
Effect of orientation
Effect of the height of wall enclosure
Effect of the albedo of materials
Effect of vegetable coverage
Based on the results of this paper, the range of the simulation parameters was determined and an attempt was made to apply a practical range of parameters.
Initially, four different conditions of orientation were examined. It was concluded that the northern courtyard has better environmental parameters to create a comfortable environment. Among other models, the north and east courtyards were slightly cooler than the others.
The findings of this section demonstrate that short-height courtyards with direct solar radiation cannot achieve a comfortable environment; therefore, in order to avoid solar direct radiation even in the early hours of the morning, a north orientation is chosen for the next steps of the simulation.
The effect of the different heights of the enclosure walls was examined. The results demonstrate that, by increasing the height of the walls, the noontime temperature decreases and the nighttime air temperature is higher than in the courtyards with lower walls. Therefore, a high wall enclosure is recommended in Isfahan’s hot and arid climate.
The sky view factor (SVF) has a direct relation to the height of the walls of the central courtyard. Reducing this factor leads to stabilization of the temperature in the late hours of the day.
Therefore, as the decreasing SVF duration of receiving direct solar radiation is limited by walls, by increasing the height (decreasing SVF), courtyards gain lower temperature duration in the early morning and critical hours of the day and higher temperatures in the late hours of day and night time. Because of the heat reflux (due to the albedo of the materials) of the walls, by increasing the height of the walls, the amount of reflected radiation increases.
So, in the late hours of the day (after 17:00), the courtyards with higher walls have higher Ta. Therefore, it is important to assess the albedo of the wall materials in terms of the amount of reflected radiation.
To examine the radiation effect on human thermal sensation, three common material categories were considered. Regarding this point that thermal stress conditions occur in the mid-hours of the day (13–16 h), the high-albedo materials reflect more sun rays to the environment, thus making pedestrians more prone to being in the heat stress range. Therefore, low-albedo materials like brick are recommended for the hot and arid climate of Isfahan.
The result of the simulation shows that the 0.3 model has a slightly lower air temperature. From 7:00 to 8:00, the 0.3 model (for example, brick) has a 0.79 K cooler environment in comparison with the other models.
As a final step, four conditions of green spaces were simulated and the results of the simulation show that more green spaces create a more comfortable environment.
The results show that more greenery creates a cooler environment in terms of the mean radiant temperature. With the presence of more shaded areas, the total amount of diffuse and direct radiation decreases at noon. Consequently, the 75% model has a cooler environment during the hottest hours of the day. Hereby more than 50% of the courtyard should be covered trees and greenery.
It is necessary to point out that more green spaces have less ventilation; therefore, in order to reach an optimum level of thermal comfort, 50% greenery is recommended.
In this paper, the thermal characteristics of the courtyard in the hot and arid climate of Isfahan were simulated using some practical physical features of the courtyard. Therefore, it is recommended that more research should be carried out in other cities and climates, and with reference to other physical features.


