Article

Managing Measurement Uncertainty in Building Acoustics

Construction Technologies Institute, National Research Council of Italy, via Lombardia 49, 20098 San Giuliano Milanese (MI), Italy
*
Author to whom correspondence should be addressed.
Buildings 2015, 5(4), 1389-1413; https://doi.org/10.3390/buildings5041389
Submission received: 30 October 2015 / Revised: 4 December 2015 / Accepted: 14 December 2015 / Published: 18 December 2015
(This article belongs to the Special Issue Selected Papers on Building and Architectural Acoustics from ICSV22)

Abstract

:
In general, uncertainties should preferably be determined following the principles laid down in ISO/IEC Guide 98-3, the Guide to the expression of uncertainty in measurement (GUM:1995). According to current knowledge, it seems impossible to formulate these models for the different quantities in building acoustics. Therefore, the concepts of repeatability and reproducibility are necessary to determine the uncertainty of building acoustics measurements. This study shows the uncertainty of field measurements of a lightweight wall, a heavyweight floor, a façade with a single glazing window and a façade with double glazing window that were analyzed by a Round Robin Test (RRT), conducted in a full-scale experimental building at ITC-CNR (Construction Technologies Institute of the National Research Council of Italy). The single number quantities and their uncertainties were evaluated in both narrow and enlarged range and it was shown that including or excluding the low frequencies leads to very significant differences, except in the case of the sound insulation of façades with single glazing window. The results obtained in these RRTs were compared with other results from literature, which confirm the increase of the uncertainty of single number quantities due to the low frequencies extension. Having stated the measurement uncertainty for a single measurement, in building acoustics, it is also very important to deal with sampling for the purposes of classification of buildings or building units. Therefore, this study also shows an application of the sampling included in the Italian Standard on the acoustic classification of building units on a serial type building consisting of 47 building units. It was found that the greatest variability is observed in the façade and it depends on both the great variability of window’s typologies and on workmanship. Finally, it is suggested how to manage the uncertainty in building acoustics, both for one single measurement and a campaign of measurements to determine the acoustic classification of buildings or building units.

1. Introduction

This paper is a revised and expanded version of the paper “Uncertainty in Building Acoustics” [1] presented at the 22nd International Congress on Sound and Vibration ICSV22.
When reporting the result of the measurement of a physical quantity, it is compulsory that some quantitative indications of the quality of the result be given so that those who use it can assess its reliability. Without such indications, measurement results cannot be compared, either with one another or with reference values given in a specification or standard. It is therefore necessary, in order to characterize the quality of the result of a measurement, to evaluate and to express its uncertainty. Generally, it is widely recognized that, when all of the known or suspected components of error have been evaluated and the appropriate corrections have been applied, an uncertainty about the correctness of the stated result still remains; that is, a doubt about how well the result of the measurement represents the value of the quantity being measured.
The word “uncertainty” means doubt, and thus in its broadest sense “uncertainty of measurement” means doubt about the validity of the result of a measurement. The formal definition of the term “uncertainty of measurement” developed in the Guide to the expression of uncertainty in measurement (GUM) [2] is as follows. Uncertainty (of measurement): parameter, associated with the result of a measurement, that characterizes the dispersion of the values that could reasonably be attributed to the measurand.
This definition of uncertainty of measurement is an operational definition that focuses on the measurement result and its evaluated uncertainty. However, it is not inconsistent with other concepts of uncertainty of measurement, such as a measure of the possible error in the estimated value of the measurand as provided by the result of a measurement; or an estimate characterizing the range of values within which the true value of a measurand lies. Although these two traditional concepts are ideally valid, they focus on unknowable quantities: the “error” of the result of a measurement and the “true value” of the measurand (in contrast to its estimated value), respectively.

2. The Uncertainty in Terms of Repeatability, Reproducibility and in Situ Standard Deviation

Tests performed on samples made of materials presumed to be the same, in identical conditions, generally do not give the same results. This condition is due to inevitable errors (systematic and random) in test procedures, caused by the difficulties in controlling the several factors that influence the test. To determine the accuracy of a measurement method, both accuracy and precision should be considered; in particular, the latter indicates the correlation between the test results.
Precision is a general term for the variability between repeated tests. Two measures of precision, termed repeatability and reproducibility, have proved necessary and, for many practical cases, sufficient for describing the variability of a test method. Repeatability refers to tests performed on the same test object with the same method under conditions that are as constant as possible, with the tests performed during a short interval of time, in one laboratory by one operator using the same equipment. On the other hand, reproducibility refers to tests performed on identical test items with the same method, in widely varying conditions, in different laboratories with different operators and different equipment. Thus, repeatability and reproducibility are two extremes, the first measuring the minimum and the latter the maximum variability in results.
The building acoustic quantities include airborne sound insulation of internal partitions, airborne sound insulation of façades, impact sound insulation of floors and sound pressure level from service equipment in buildings. The quantities that have to be measured and their measurement methods, for all aspect involved, are described in the international standard series EN ISO 10140 [3] for laboratory measurements and in the international standard series ISO 16283 [4] for field measurements. The accuracy of these measurement method depends on several factors that influence the test, such as acoustic instrumentation, acoustic method (microphones and sources position), context (regular rooms or semi-open space, of any size), constructive details of the building (that could have effect on acoustic measures) and workmanship, and, concerning sound levels, influence of instrumentation working conditions (repeat configuration). Detailed information for each of these factors is hardly available. Both random and systematic errors affect the acoustic measurements results. The random effects can be determined by repeated independent measurements in essentially identical conditions. The systematic effects, however, are not easy to determine, but, as a general rule, they can be determined thanks to comparative measurements to be executed in different test facilities (for laboratory measurements) or carried out by different laboratories (for field measurements), and the knowledge of the random errors in those conditions. Therefore, it is necessary to refer to the concepts of repeatability and reproducibility, which provide a simple means for the expression of the precision of a test method and of the measurements performed according to the test method.
The best methodology to study the repeatability and reproducibility of building acoustic measurements is to carry out an Inter-Laboratory Test (ILT), or a Round Robin Test (RRT), tests consisting of independent measurements executed several times by different operators. Due to the particular nature of the sample in building acoustics, in addition to repeatability and reproducibility standard deviations, another standard deviation is defined, the in situ standard deviation (defined, for the first time, in ISO 12999-1 [5]), which could be useful to estimate. The in situ standard deviation is a particular kind of reproducibility standard deviation that is measured in the same location on the same object. In fact, in the case of RRT field measurements, when different operators, with their own equipment, perform measurements on a particular building element, both the location and the object under test are the same. Therefore, location is the only difference between reproducibility and in situ standard deviation: for the in situ standard deviation, the location is exactly the same as is the test object, while in the case of reproducibility standard deviation the locations are different and the test object can be either the same test object or identical test objects tested in the different locations. The in situ standard deviation, therefore, corresponds to a reproducibility standard deviation of the same object in the same location.

2.1. Round Robin Test

Generally, cooperative tests (ILT or RRT) assess the uncertainty of measurement methods using a reference value. One of the main aspects of these tests is the determination of this reference and its uncertainty. A reliable, low-uncertainty reference value is required in order to minimize the uncertainty of a cooperative test. Due to the typology of the sample test in acoustic measurements, a reference value does not exist; therefore an estimated value is used. The best measuring reference is the mean value. A RRT of sound insulation field measurements of building elements was carried out as part of a research sponsored by the Lombardy Region [6,7,8]; this study was based on the cooperation of three different bodies: a research body, ITC-CNR (Construction Technologies Institute of the National Research Council of Italy); a university laboratory, DISAT (Department of Earth and Environmental Sciences of the University of Milano-Bicocca); and a control organization, ARPA-Lombardy (Regional Agency for environmental protection) and it was coordinated by ITC-CNR. In the first approach to the problem [6], the analysis was centered on the single number values of the Italian regulation [9] and on the narrow frequency range (from 100 to 3150 Hz). In later studies [7,8], the analysis considered all the possible descriptors of the different European national legislations and was extended to the enlarged frequencies range (from 50 to 5000 Hz). Another study on the uncertainty of façade sound insulation [10] was carried out at the initiative of the Building Acoustics Group (GAE) of the Italian Acoustic Association (AIA). This study was focused on the low frequencies (from 50 to 80 Hz), in particular on the comparison between the procedure stated in ISO 140-5 [11] and the new low frequency procedure stated in ISO 16283 [4]. The main results of these studies are summarized in the following section.

2.1.1. Airborne Sound Insulation

Notwithstanding the importance of the uncertainty of the measurement method in building acoustics, the uncertainty of field measurements was not comprehensively investigated. There are only few examples in the literature [12,13] compared to those of laboratory tests [14,15,16,17,18]. The studies regarding laboratory tests conclude that the main influences are caused by the laboratory geometry and materials, the flanking transmissions, the type of border material, and the different test opening dimensions [15,16].
Nine teams coordinated by ITC-CNR were involved in the study about the uncertainty of airborne sound insulation [7]; each of them has replicated the tests five times, including the reverberation time.
No deviations occurred from the test procedure laid down in ISO 140-4 [19] but, repeating the measurements several times, the parameters left open in the measurement procedure were represented as best as possible. In particular, the set of microphone positions and source positions were selected anew, more or less randomly, for each repeated measurement. The measurands were a floor without floating floor (surface mass of 550 kg/m2 and surface of about 19 m2) and a lightweight wooden partition wall (surface mass of 30 kg/m2 and surface of about 8.5 m2). Considering the goal of European harmonization of acoustic parameters [20], the differences between the various descriptors (R’, Dn and DnT) were analyzed in terms of average, maximum and minimum values, and in terms of standard deviation of repeatability and reproducibility (in situ standard deviation, referring to ISO 12999-1 [5], where the reproducibility standard deviation of the same element is measured in the same location).
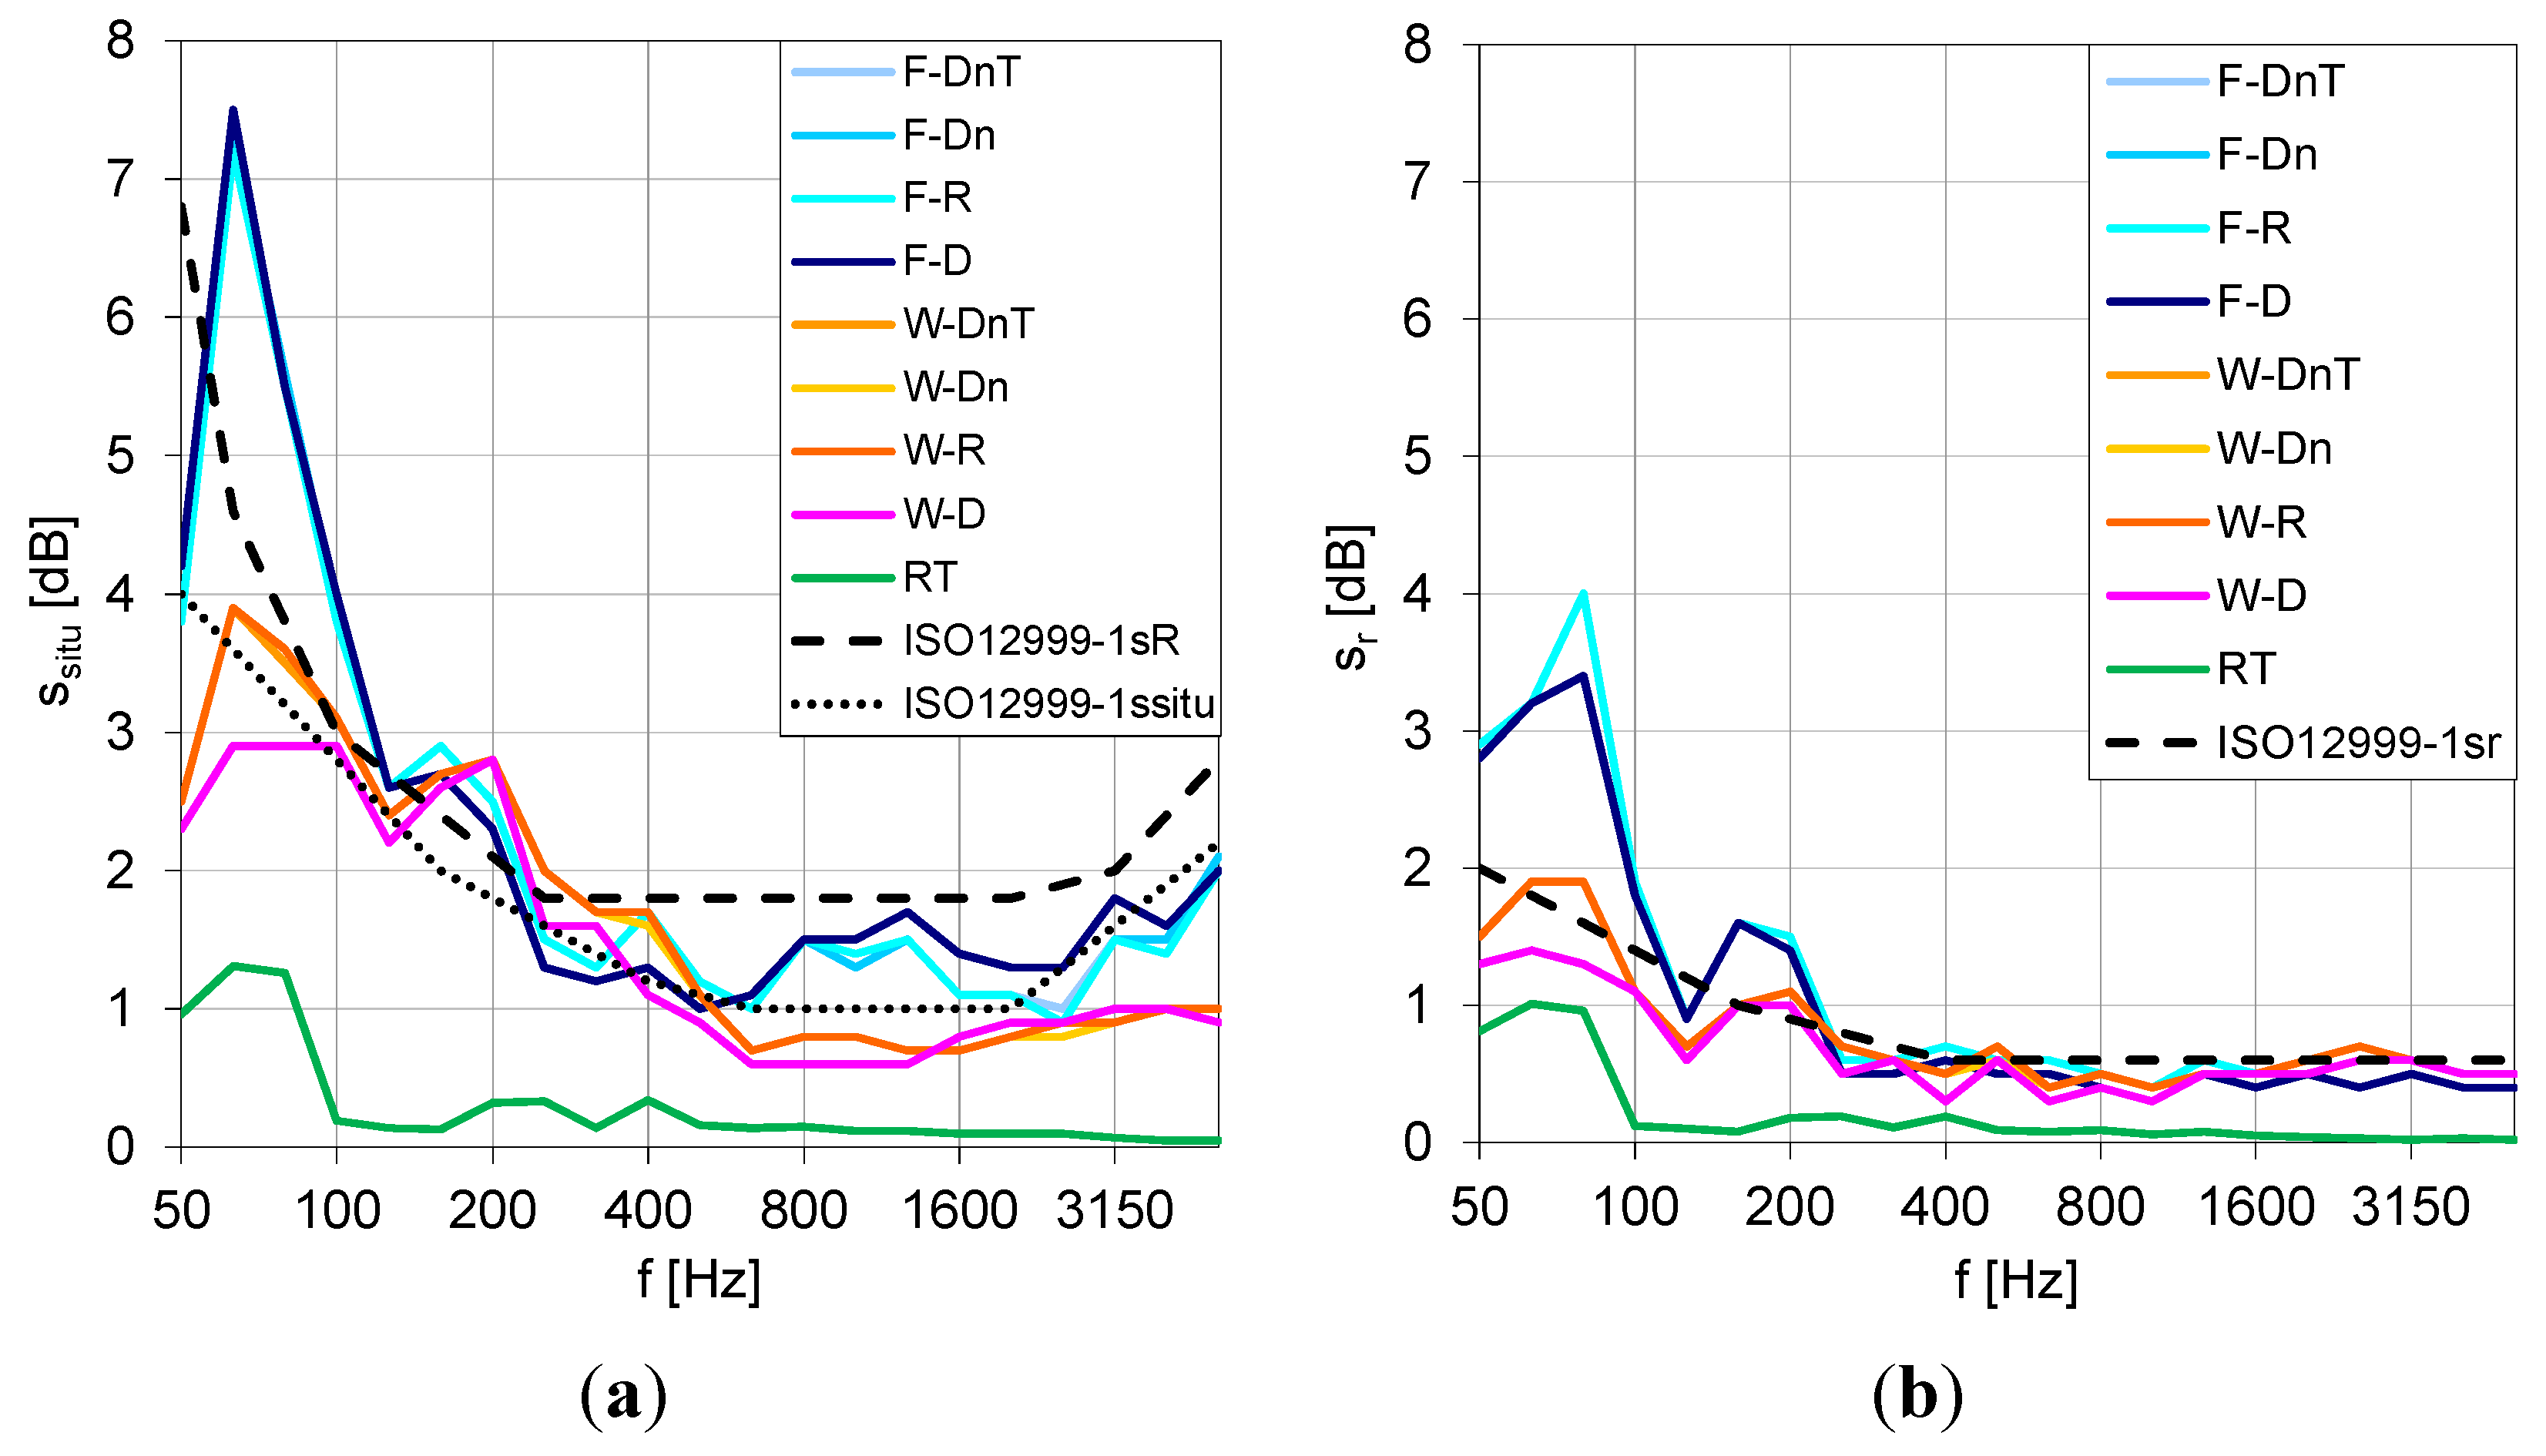
Figure 1 shows the standard deviations of repeatability sr and in situ reproducibility standard deviation ssitu of all analyzed quantities. The descriptors extension at low frequencies (from 50 to 80 Hz) (LF) was also analyzed. From the graphs of Figure 1, it is evident that the uncertainty at LF is much greater than the uncertainty in the narrow frequencies range from 100 to 5000 Hz. From the comparison of the RRT ssitu values with the values of the ISO 12999-1 [5] for situations A (sR) and B (ssitu) (see Figure 1), it was found that the values of situation B underestimate the uncertainty of in situ measurements in particular at low-medium frequencies. Moreover, the values of ssitu [7] obtained are higher also than the sR values, in particular for the floor at low-medium frequencies from 80 to 200 Hz, and for the wall from 160 to 250 Hz.
Figure 1. ssitu (a) and sr (b) of floor (F) and wall (W) of R’, Dn, DnT, D and RT [7], with the comparison with the reproducibility, in situ (a) and repeatability (b) standard deviation of ISO 12999-1 [5].
Buildings 05 01389 g001
The results of SNQ calculations are shown in Table 1. Two different ways to determine the SNQs have been considered for the above-mentioned study [7]. The former is to determine SNQ according to ISO 717-1 [21] by shifting the reference curve (value in the range from 100 to 3150) in steps of 1 dB toward the measured curve, until the mean unfavorable deviation is as large as possible but not more than 32 dB; all the laboratories involved in the RRT have followed this procedure. The latter is to determine SNQ plus the spectrum adaptation terms C and Ctr according to ISO 717-1 [21] both in the narrow frequency range from 100 to 3150 Hz, and in the enlarged frequency range from 50 to 5000 Hz; in both cases rounded to integer and with 1 decimal place (subscript 01), using Equation (1) [21]. The SNQs plus the spectrum adaptation terms were determined using a 0.1 dB resolution, following from the work of Wittstock [22], to obtain more accurate data for the analysis of standard deviation than the 1 dB resolution.
X A j = 10 lg i 10 ( L i j X i ) / 10 = X w + C j [ d B ]
where j is the index of the spectrum No. 1 to calculate C or No. 2 to calculate Ctr according to ISO 717-1 [21]; i is the index of frequencies; Lij is the level indicated in ISO 717-1 [21] at frequency i for spectrum j; Xi is one of the quantities considered, Ri, Dni or DnTi; at frequency i for the spectrum j; Xw is the single number; and Cj is the spectrum adaptation term C or Ctr if calculated with spectrum No. 1 or No. 2, respectively.
Table 1. sr and ssitu of SNQs of floor (F) and wall (W) in narrow (100–3150 Hz) and enlarged (50–5000 Hz) range [7].
Narrow Range 100–3150 HzEnlarged Range 50–5000 Hz
XX + CX + CtrX01 + CX01 + CtrX01 + CX01 + Ctr
ssituF-DnT1.31.31.51.31.51.42.8
F-Dn1.21.21.51.31.41.42.8
F-R’1.21.21.51.31.51.42.7
W-DnT0.70.91.20.91.20.81.4
W-Dn0.90.91.30.81.20.81.4
W-R’0.80.91.30.91.20.81.4
srF-DnT0.70.60.60.50.70.61.3
F-Dn0.50.50.70.50.70.61.3
F-R’0.50.60.90.50.70.61.3
W-DnT0.20.20.30.20.20.20.3
W-Dn0.30.30.30.20.20.20.4
W-R’0.20.20.40.20.20.20.4
The internal partitions considered in this RRT were a lightweight wall and a heavy floor. It was demonstrated that the uncertainties of lightweight samples are lower than the uncertainties of heavy types of construction; therefore it will be important for datasets of different constructions to be considered separately. A similar difference between the uncertainty of heavy and lightweight test samples was shown by Dijckmans and Vermeir [23] who made a numerical investigation of the repeatability and reproducibility of laboratory sound insulation measurements by investigating both the pressure method and the intensity method. Dijckmans and Vermeir [23] found that for large, heavy test elements, like concrete walls, the reproducibility in the lowest frequency bands is not improved by using the intensity method, while, for double plasterboard walls, the theoretical uncertainty is decreased by 1 dB by using the intensity method.
The results of Table 1 show that the one-third-octave band uncertainty at LF slightly affects the SNQs in the enlarged range plus C spectrum adaptation term but greatly affects (almost double than the narrow range standard deviation) the SNQs in the enlarged range plus Ctr spectrum adaptation term. This is mainly due to the fact that the spectrum adaptation term Ctr considers predominantly the low-medium frequencies noise components.
In their recent study on the correlations and implications of SNQ for rating airborne sound insulation in the frequency range 50 Hz to 5 kHz, Garg and Maij [24] showed that Rtraffic (as defined in ISO CD 16717-1 [25] and corresponding to Rw + Ctr50–5000) is highly sensitive to low frequency sound insulation as compared to the current SNQ and Rliving (as defined in ISO CD 16717-1 [25] and corresponding to Rw + C50–5000). Finally, the measurement uncertainty in the low frequency range (due to the presence of the normal modes of vibration, that imply that at the first three one-third-octave bands the measured levels can be strongly influenced by the measurement position) is too high to justify the decision to perform field measurements down to low frequencies, and therefore the scientific evidence for including the low frequency range should be significantly improved. Moreover, the fact that the higher uncertainty at LF is not well represented in the SNQs uncertainty confirms that further studies are needed to better understand all the implications of the inclusions of LF in the SNQs, from both a physical point of view and from a legislation point of view. Garg and Maij [24] found interconversion equations applicable for sandwich gypsum constructions and roof constructions. They stressed the fact that testing of sound transmission loss characteristics in the extended frequency range of 50 Hz to 5 kHz also implies the need to reformulate the sound regulation requirements in buildings including the low frequency spectrum adaptation terms.
Some recent studies [26,27,28,29] on the uncertainty of SNQs extended to the low frequencies range show an increase in the SNQs uncertainty due to the LF extension, confirming the results found in this RRT. Mahn and Pearse [26] studied the effect on uncertainty of expanding the frequency range included in the calculation of the single number ratings, using laboratory measurements of 200 lightweight walls as data. They found that the uncertainty of the single number ratings is highly dependent on the shape of the sound reduction index curve. The uncertainty obtained for Rliving (Rw + C in the enlarged frequency range) was greater than that of the traditional weighted sound reduction index for 98% of the 200 lightweight building elements included in the evaluation.
Hongisto et al. [27] focused their study on the two most important SNQs proposed by ISO CD 16717-1 [25]; that is, Rtraffic (Rw + Ctr in the enlarged frequency range) and Rliving (Rw + C in the enlarged frequency range), and how their reproducibility values differ from the reproducibility values of their counterparts Rw + Ctr and Rw. They found that the reproducibility values of the proposed single-number quantities (50–5000 Hz; Rliving, Rtraffic) are larger than the reproducibility values of the present SNQs (100–3150 Hz; Rw, Rw + Ctr) with sound insulation measurements made with the pressure method; with the sound intensity method, the reproducibility values increased very little.
Machimbarrena et al. [28] presented an alternative procedure, aiming at evaluating the need of performing individual uncertainty calculations and the effect of extending the frequency range used to calculate sound insulation single number quantities. For this purpose they performed calculation in a set of 2081 field airborne sound insulation measurements on 22 different types of separating walls partitions of in situ airborne sound insulation measurements. The results of Machimbarrena et al. [26] show that the frequency range used for the evaluation affects the uncertainty of the single number quantity. In almost all the cases shown in their paper, the uncertainty is increased when the frequency range is extended.
António and Mateus [29] studied the influence of low frequency bands on airborne and impact sound insulation single numbers for typical Portuguese buildings. They found that the uncertainty is higher for the DnT,w + Ctr descriptor than for DnT,w + C, confirming what was found in this RRT. They also found that when the low frequency bands are included in the calculation, the uncertainty of the descriptor increases on average and this increase is more evident when the adaptation term is for a spectrum of traffic noise.

2.1.2. Façade Sound Insulation

The uncertainty of field measurements, in particular façade sound insulation, has not been comprehensively investigated. There is only one example in the literature of a Round Robin Test conducted on a window of a façade [12].
In the study about the uncertainty of façade sound insulation [8], the measurand was a prefabricated concrete façade with a 4 mm single glazing wood-aluminum frame window with a MDF (Medium Density Fiberboard) shutter box. The façade is situated at first floor level. Nine teams coordinated by ITC-CNR were involved in this study; each of them has replicated the tests five times, including the reverberation time. One laboratory showed a significant presence of stragglers and outliers. After a statistical examination of this result, the laboratory was excluded. In fact, it turned out that the random effect estimated for laboratory was, in absolute value, the highest value [8]: the Grubbs test [30,31] for one outlier identified the laboratory as the first outlier. Therefore here are the eight reported laboratories results.
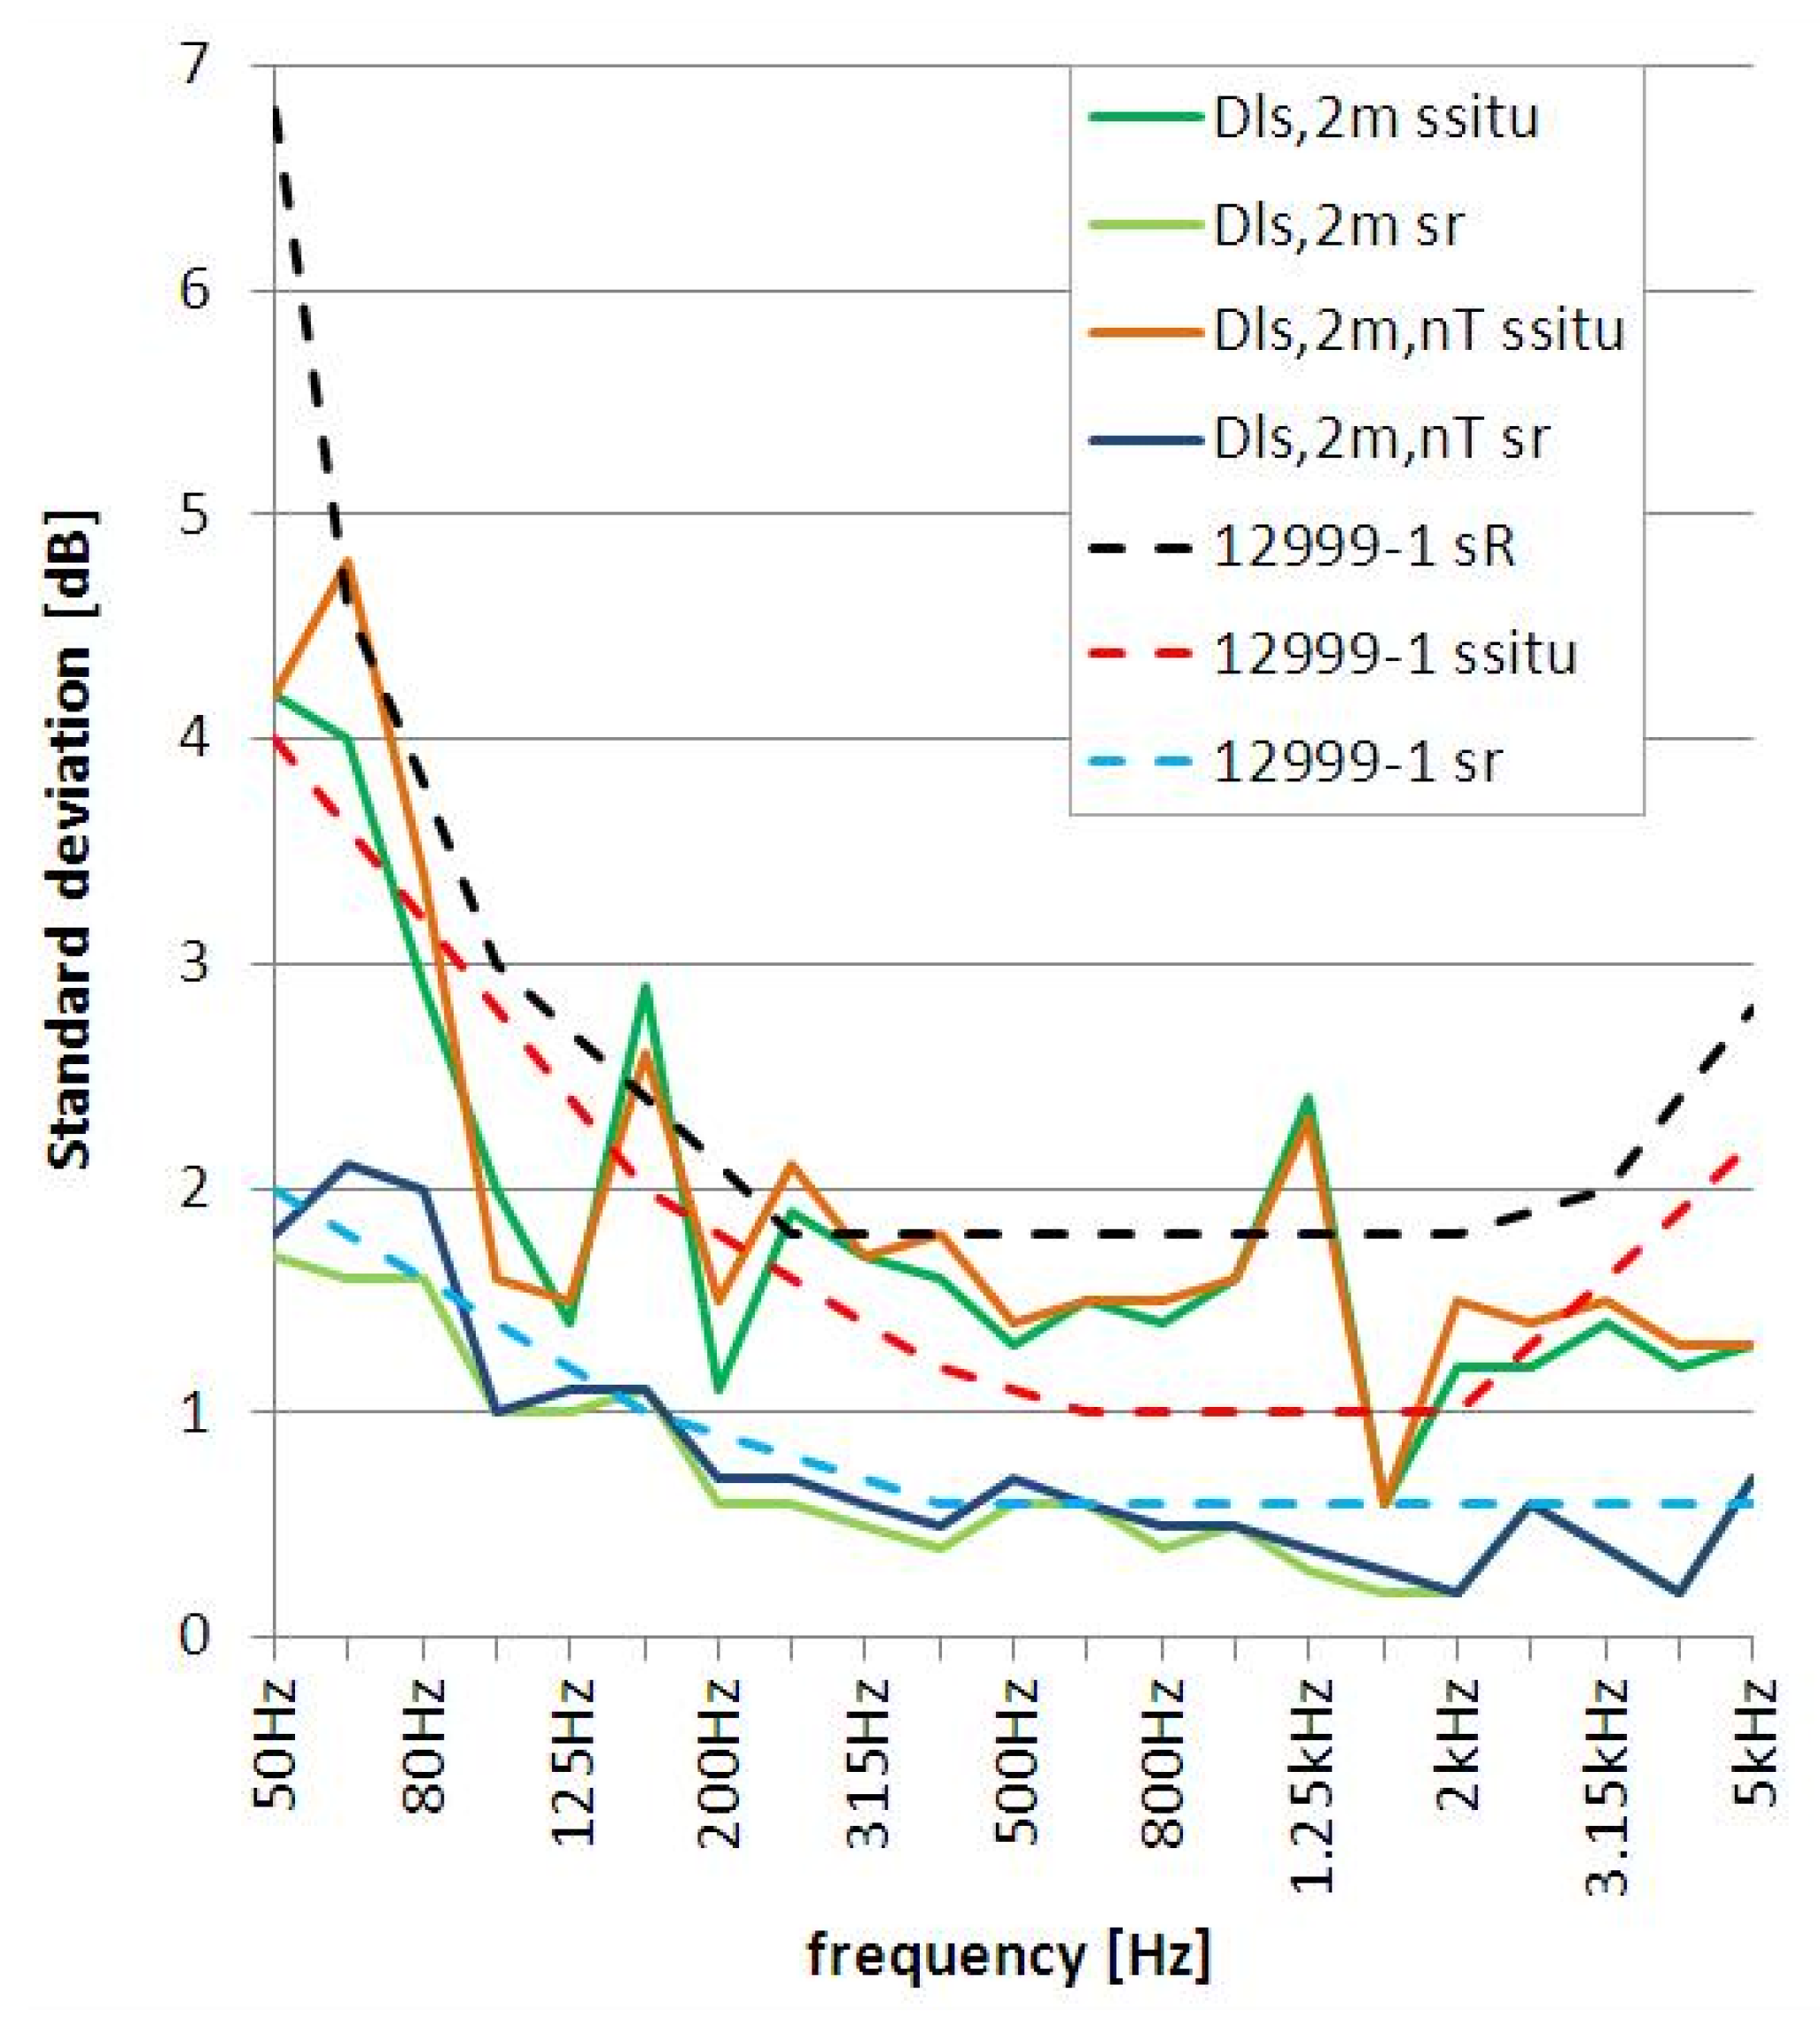
In this study, the highest values of sr and ssitu were found at the frequencies of 50, 63 and 80 Hz. That paper [8] also underlined that the uncertainties in Dls,2m,nT are heavily contaminated by the inappropriateness of the reverberation time correction at low-frequencies and a comparison between the uncertainties of the standardized level difference Dls,2m,nT and the level difference Dls,2m shows the magnitude of the reverberation time at low frequencies (see Figure 2). This influence is noticeable in particular at 63 Hz and at 80 Hz, while at 50 Hz the uncertainties of Dls,2m,nT and Dls,2m are coincident.
Figure 2. Comparison between the in situ and repeatability standard deviation of Dls,2m,nT and Dls,2m [8] and the reproducibility, in situ and repeatability standard deviation of ISO 12999-1 [5].
Buildings 05 01389 g002
The variations between laboratories at low frequencies are still very high even if the reverberation time correction is not included in the calculation (i.e., just considering Dls,2m), which implies that for the sound pressure level measurements the low frequencies also have a high uncertainty. The ssitu and sr behavior of Dls,2m is similar to the behavior of the uncertainties of ISO12999-1 [5], which increase steadily and rapidly below 100 Hz. Thus the trend of the standard deviation curve at low frequencies of in situ reproducibility and repeatability standard deviation calculated from the RRT study is attributable to the reverberation time measurements.
In Table 2 are shown the SNQs uncertainties, in terms of repeatability and in situ standard deviations. The SNQs were determined according to ISO 717-1 [21] shifting the reference curve both in steps of 1 dB and 0.1 dB (subscript 01), toward the measured curve, until the mean unfavorable deviation is as large as possible, but not more than 32 dB; all the laboratories involved in the RRT have followed this procedure. The shift in increments of 0.1 dB was evaluated because the 2013 update of the ISO 717-1 [21] provides for increments of 0.1 dB for the expression of uncertainty. The SNQs plus spectrum adaptation terms C and Ctr according to ISO 717-1 [21] in the extended range (from 50 to 5000 Hz), both at integer and with one decimal place (subscript 01) were calculated using Equation (1).
Table 2. ssitu and sr of SNQs, calculated as one of the levels j of RRT [8].
Frequency RangeSNQsssitusr
narrow range 100–3150 HzDls,2m,nT,w0.80.3
Dls,2m,nT,w + C1.00.4
Dls,2m,nT,w + Ctr1.10.3
Dls,2m,nT,w010.90.3
Dls,2m,nT,w01 + C1.00.2
Dls,2m,nT,w01 + Ctr1.10.3
enlarged range 50–5000 HzDls,2m,nT,w01 + C0.90.2
Dls,2m,nT,w01 + Ctr1.10.3
In the study about the airborne sound insulation [7], it was found that the extension at low frequencies range increases the uncertainty of the SNQs. In the case of the façade, calculating the SNQs uncertainty handling the SNQs values as a level of the RRT itself (see Table 2), no significant differences are observed whether including or excluding the low frequencies. In this case, the low frequency uncertainty is not well reflected in the SNQs uncertainty. Considering the extension to low frequencies, the suitability of the reference spectra for rating airborne sound insulation should be validated.
On this topic, Masovic et al. [32] made a study on the suitability of ISO CD 16717-1 [25] reference spectra for rating airborne sound insulation. The ISO CD 16717-1 [25] spectra living and traffic correspond to the reference spectra C (50–5000 Hz) and Ctr (50–5000 Hz) of ISO 717-1 [21], respectively. Masovic et al. [32] demonstrated, with an extensive noise monitoring in a number of dwellings recordings of 38 potentially disturbing activities, that the reference spectrum for living noise (Lliving), should be redefined to better match the typical spectrum of noise in dwellings because it seems to be rather high at lower frequencies, especially below 100 Hz. Moreover, in the case of noise generated by sources of music with strong bass content the reference spectrum for traffic noise (Ltraffic) seems to be more appropriate above 100 Hz than Lliving. This could suggest one of the reasons why the low frequencies uncertainty is not adequately reflected by the SNQs uncertainty extended to low frequencies and should be considered deeper before deciding to perform measurements down to LF range.
Therefore, considering this kind of façade (prefabricated concrete façade with a single glazing window and with a shutter box) including the low frequencies range in the façade sound insulation measurements, brings no obvious advantage, but rather the disadvantage of complicating and lengthening the measurement. In literature, there are some studies (e.g., Rindel [33] and Park and Bradley [34]) on the annoyance of noise from neighborhood at low frequencies that stress the importance of investigating the LF noise; nevertheless, at present time, effective protection systems against low frequency noise are still an open challenge both for researchers and components manufacturers, as underlined by Prato and Schiavi [35]. Hongisto et al. [27] suggested that scientifically valid socio-acoustic evidence for the need to include the frequency range 50–80 Hz should be significantly improved before deciding that the low frequency measurements are included in the calculation of the SNQs. Last but not least, if LF measurements are aimed at the protection against LF noise, the fact that the high uncertainty of the one-third octave LF band affects the reliability of the performance of the test element implies that the potential effectiveness of the protection system against low frequency noise is not quantifiable.
A prefabricated concrete façade with a PVC frame with double glazing 4/12/4 window was tested in the further RRT study concerning façade sound insulation uncertainty [10], focused on the new low frequencies measurement procedure stated in ISO/DIS 16283-3 [36], that will soon replace the standard ISO 140-5 [11]. Ten teams, coordinated by ITC-CNR were involved in this RRT, each of them operating with its own equipment and replicates the tests 5 times, including the new low frequencies procedure (explained below) and the reverberation time measurements. All teams performed measurements following the global loudspeaker method, which yields the level difference of a façade in a given place with respect to a position 2 m in front of the façade. All teams positioned the outside microphone 2 m in front of the façade, and the loudspeaker on the ground, with the angle of sound incidence equal to 45° ± 5°; as positioned directly in front of the façade by some teams, and in a lateral position by other teams. The statistical analysis of the data provides a three-step procedure for the identification of stragglers and outliers. Following this procedure, two teams were identified as outliers and excluded because they showed a significant presence of stragglers and outliers starting from 500 Hz to 3150 Hz [
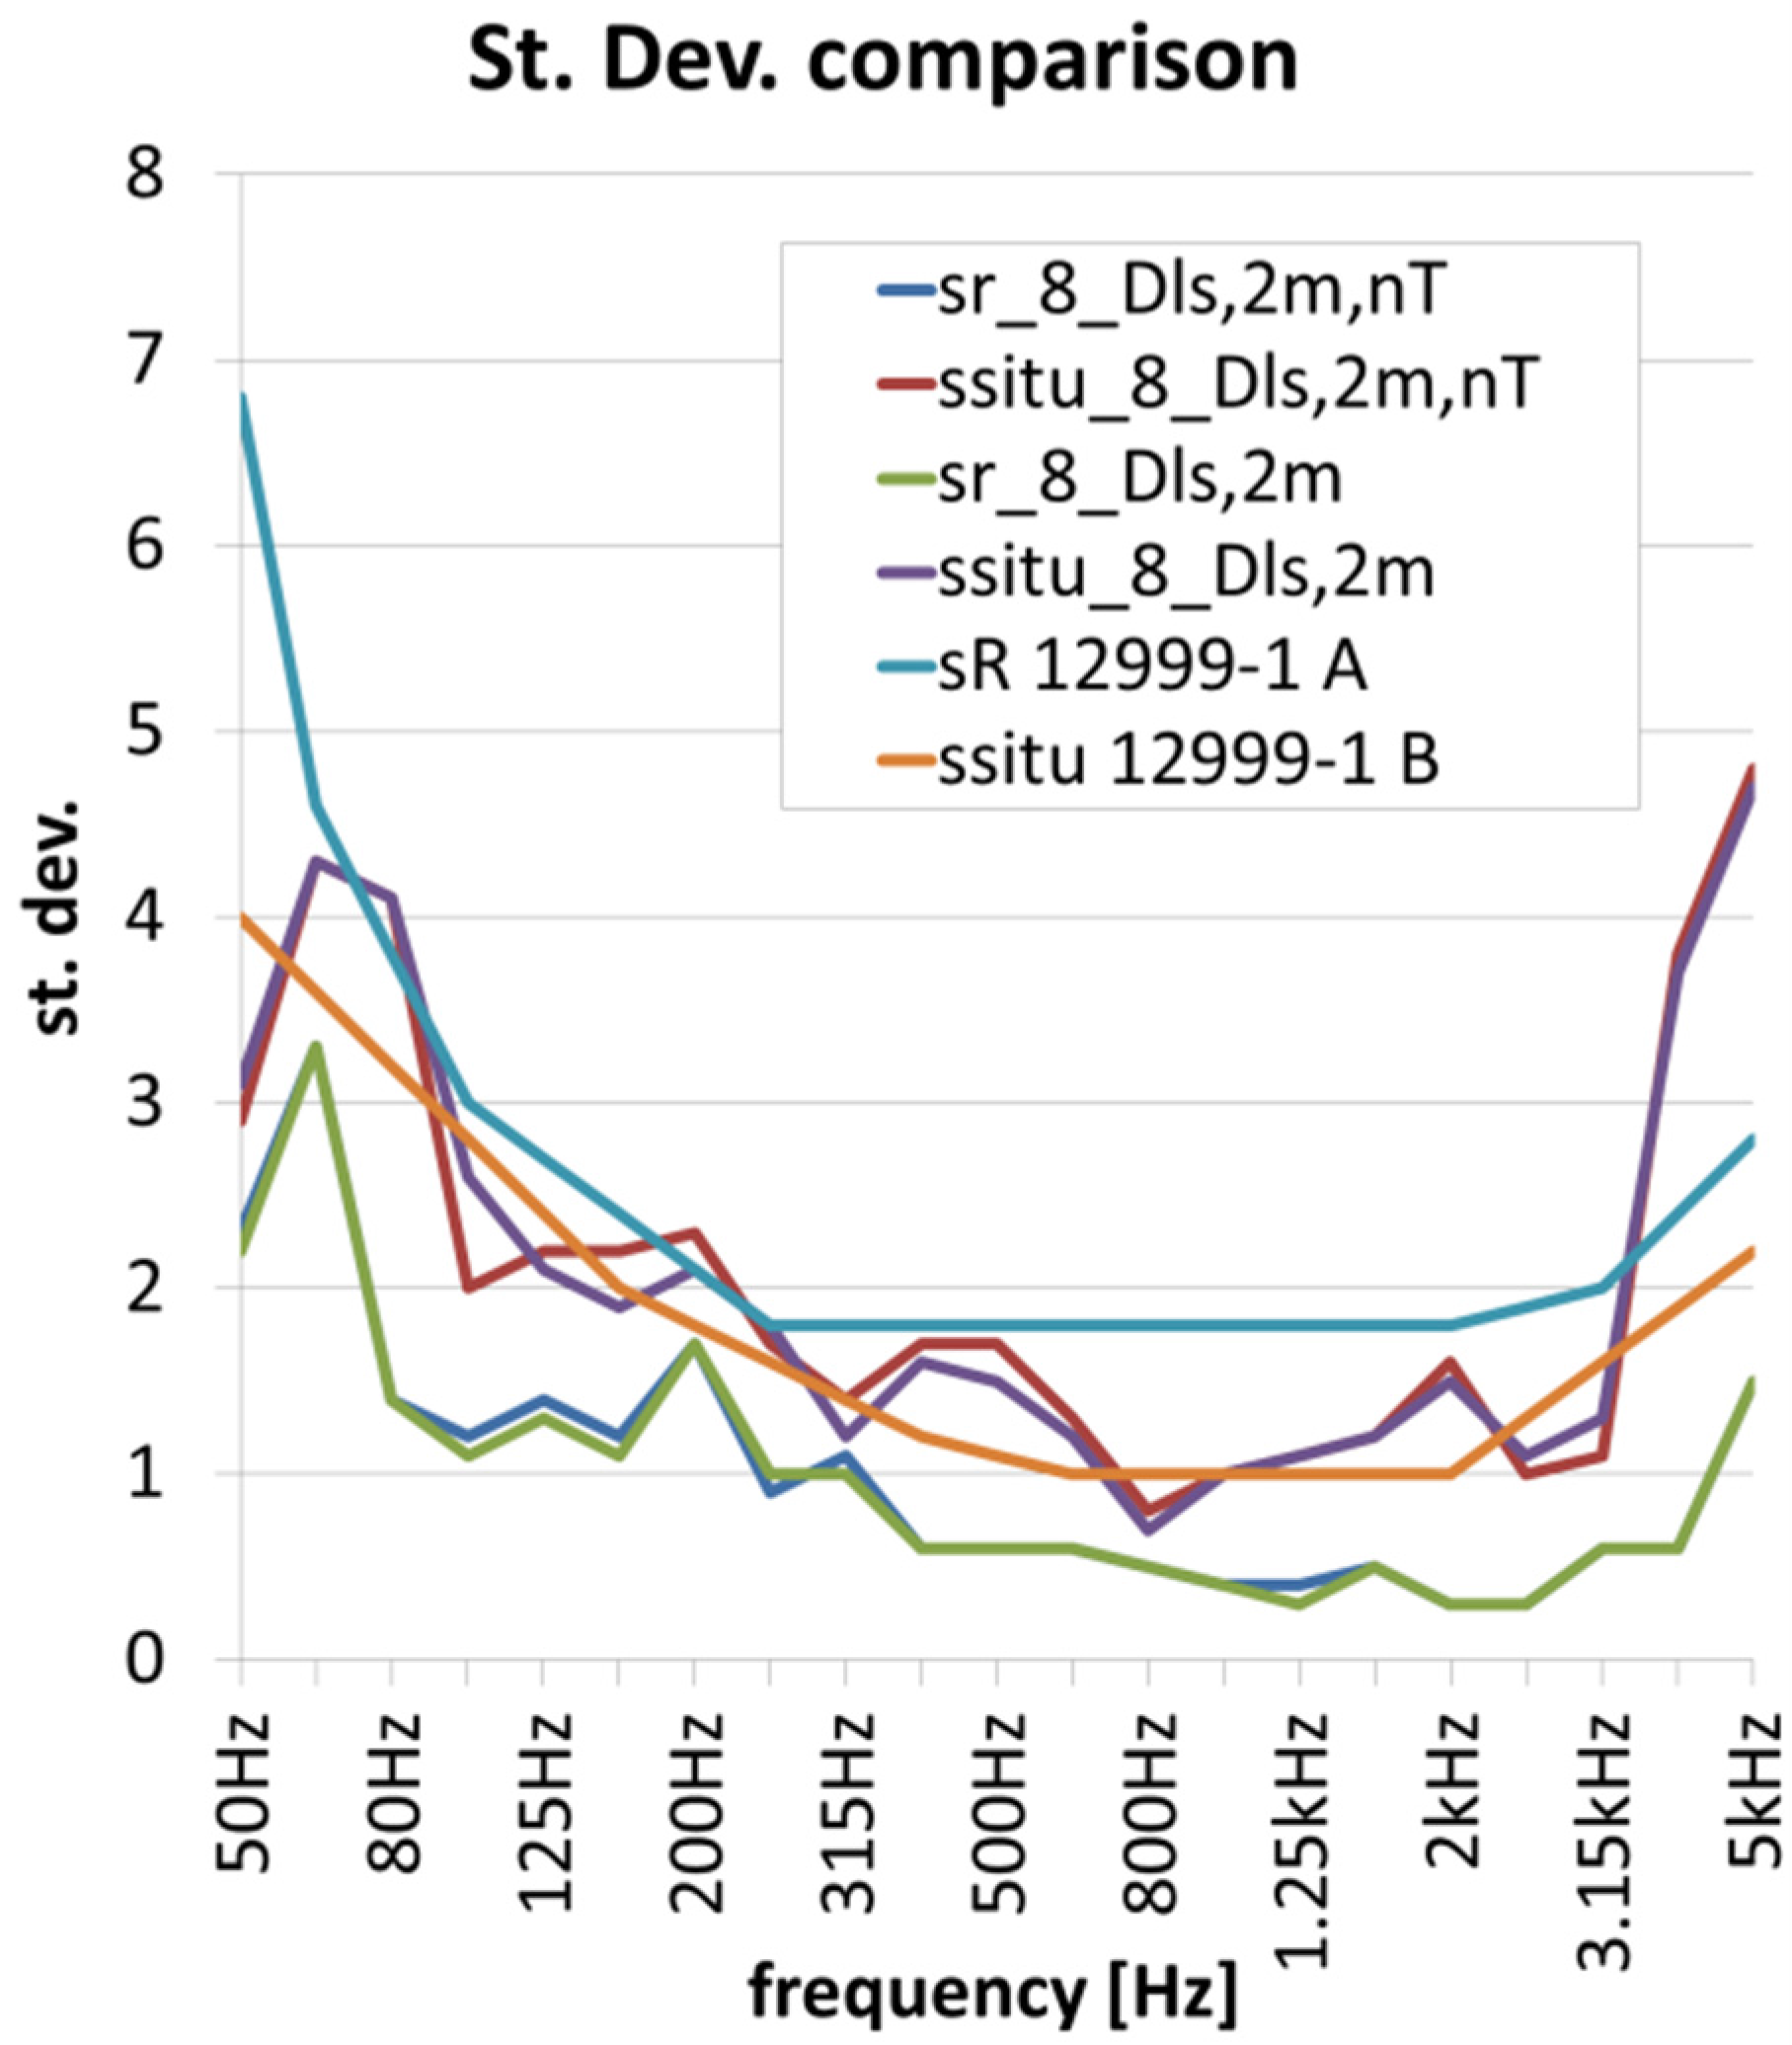
10]. The comparison of standard deviation values, repeatability and in situ standard deviation, from RRT (calculated for both Dls,2m,nT and Dls,2m) and from ISO 12999-1 [5] are plotted in Figure 3.
Regarding the low frequency range (from 50 to 80 Hz), the reasons for the high values of sr and ssitu can be sought in the presence of the normal modes of vibration, in fact at the first three one-third- octave bands (50, 63 and 80 Hz), the measured levels can be strongly influenced by the measurement position.
At low frequencies, the ssitu and sr behavior of both Dls,2m,nT and Dls,2m is not similar to the behavior of the uncertainties of ISO 12999-1 [5], in terms of reproducibility sR and in situ standard deviation, which increase steadily and rapidly below 100 Hz, as it can be seen in graphs of Figure 3. Contrary to what was found in the previous RRT [8], this difference is not attributable to the reverberation time measurements. This different behavior could be attributable to the differences of the façade test samples: the façade of the previous RRT [8] is a prefabricated concrete façade with a 4 mm single glazing wood-aluminum frame window with a MDF shutter box; the façade of the second study is a prefabricated concrete façade with a PVC frame with double glazing 4/12/4 window. Also the loudspeaker position could be relevant and its influence is under investigation.
Figure 3. Comparison of standard deviation values from RRT (calculated for both Dls,2m,nT and Dls,2m) and from ISO 12999-1 [10].
Buildings 05 01389 g003
With respect to the high frequency range, in particular at 4000 and 5000 Hz, the RRT and ISO 12999-1 [5] standard deviations values show the same behavior, i.e., an increase with frequency, but the RRT ssitu values are higher than the ISO 12999-1 [5] values. Moreover the RRT ssitu values are higher than the low frequency ssitu values of both RRT and ISO 12999-1 [5]. This is probably due to the different positions of the loudspeaker with respect to the façade [10] and it is still under investigation. In the previous RRT [8], where all the teams involved placed the loudspeaker in the same position (directly in front of the façade), the high frequency uncertainty was lower, in particular lower than ISO 12999-1 [5] values and much lower than the low frequencies uncertainty.
In the first RRT on façade sound insulation [8] a behavior similar to the behavior found by Lang [12] in the Austrian RRT was observed, where the RRT values exceed the values of the ISO 140-2 [37] (the standard on acoustics measurement uncertainty available at the time of Lang’s RRT) in the range of mass-spring-mass resonance frequency and in the range of the coincidence frequency of the double glazing. Lang suggests that such behavior may be caused by the difficulty of arranging the loudspeaker at an angle of incidence of 45°.
The first RRT [8] faced no difficulty with the arrangement of the loudspeaker at an angle of incidence of 45°. Such behavior is thus exclusively attributable to the nature (i.e., critical frequencies) of the measurand itself. However, the uncertainty dependence from the loudspeaker position could be found at high frequencies as shown in the second RRT [10] and, as already said, it must be more deeply investigated. Berardi et al. [38] and Berardi [39] considered the position of the loudspeaker as a variable, but its influence on the high frequencies was not comprehensively evaluated.
In this RRT [10] all the participating laboratories repeated the measurements with the low-frequency procedure included in the upcoming standard ISO 16283-3 (ISO/DIS 16283-3 [36]). In his recent paper Hopkins [40] gives the background to the revision of the ISO 140 standards relating to field measurement of airborne, impact and façade sound insulation that form the new ISO 16283 series. The low-frequency procedure was first studied and proposed by Hopkins and Turner [41] in a work about the airborne sound insulation between rooms. For each of the 50, 63 and 80 Hz bands, they proposed that the average low frequency sound pressure level in the room, LLF, be calculated from LISO140-4 (the average sound pressure level in a room measured according to the normative guidance in ISO 140-4) and Lcorner (the corner sound pressure level measured according to the normative guidance in ISO 16283-1) according to:
L L F = 10 lg [ 2 ( 10 0.1 L I S O 140 4 ) + 10 0.1 L c o r n e r 3 ] [ d B ]
The low-frequency (LF) procedure is mandatory in case of room volume lower than 25 m3. As the volume of the receiving room in this RRT is 40 m3, it was possible to compare the results of the two procedures: the LF procedure and the default procedure. The results of this comparison, for the LF range are shown in Table 3. The results refer both to 8 and to 10 teams, as the two outlier teams that are excluded from the calculation of standard deviation for the all frequencies considered (from 50 to 5000 Hz), can be included in the evaluation of the LF standard deviation because these teams showed a significant presence of stragglers and outliers starting from 500 Hz to 3150 Hz.
Table 3. Low frequency sr and ssitu values for the two measurement methods (default and LF) for both 8 and 10 teams [10].
Standard Deviations50 Hz63 Hz80 Hz
DefaultLFDefaultLFDefaultLF
sr_102.7 dB2.5 dB3.1 dB4.5 dB1.4 dB2.3 dB
ssitu_103.1 dB3.1 dB4.8 dB5.5 dB4.0 dB4.1 dB
sr_82.3 dB2.3 dB3.3 dB5.0 dB1.4 dB2.5 dB
ssitu_82.9 dB3.2 dB4.3 dB5.2 dB4.1 dB4.2 dB
With the low-frequency procedure there is an increase of the uncertainty, particularly noticeable at 63 Hz: the repeatability standard deviation increases by about 1.5 dB while the in situ standard deviation increases by about 1 dB. The results shown in Table 3 indicate that the low-frequency measurement procedure does increase the uncertainty. This cannot be attributed to the operators whose experience is well proven; this aspect is still under investigation.
To deal with the measurement issue in the low frequency domain, Prato and Schiavi [35] and Prato et al. [42] suggest the modal approach. At frequencies below 100 Hz, the acoustic field is non-diffuse, as it is characterized by large fluctuations of sound pressure levels in space and frequency domains. Because of the inhomogeneity of the acoustic field, Prato et al. [42] suggest to move from a statistical approach typical of diffuse sound field (average sound energy) to a discrete one, focused at highest noise and annoyance points, i.e., the points of highest sound pressure level in space (corners) and frequency (resonance modes): the so-called modal approach.
In this RRT [10], it was found that the differences between including and excluding low frequencies are a little higher for SNQ plus Ctr when using standard measurement procedure and are very high for SNQ plus Ctr when using the LF measurement procedure, as shown by comparing Table 4 (SNQs without LF) and Table 5 (SNQs with LF), contrary to what was found in the previous RRT [8] that showed that the differences between including or not the low frequencies were practically negligible.
Table 4. Standard uncertainties of SNQs without low frequencies for the 8 teams [10].
Descriptor (SNQs)sr (dB)ssitu (dB)
Dls,2m,nT,w0.40.7
Dls,2m,nT,w + C(100–3150)0.60.8
Dls,2m,nT,w + Ctr(100–3150)0.81.0
Dls,2m,nT,w010.30.7
Dls,2m,nT,w01 + C(100–3150)0.50.8
Dls,2m,nT,w01 + Ctr(100–3150)0.71.0
Dls,2m,nT,w01 + C(100–5000)0.61.2
Dls,2m,nT,w01 + Ctr(100–5000)0.71.0
Table 5. Standard uncertainties of SNQs with low frequencies for the 8 teams [10].
Descriptor (SNQs)sr (dB)ssitu (dB)
DefaultLFDefaultLF
Dls,2m,nT,w01 + C(50–3150)0.50.60.81.0
Dls,2m,nT,w01 + Ctr(50–3150)0.81.91.02.1
Dls,2m,nT,w01 + C(50–5000)0.60.61.21.3
Dls,2m,nT,w01 + Ctr(50–5000)0.81.91.02.1
This different behavior could be attributable to the differences of the façade test samples: the façade of the previous RRT [8] is a prefabricated concrete façade with a 4 mm single glazing wood-aluminum frame window with a MDF shutter box; the façade of the second study is a prefabricated concrete façade with a PVC frame with double glazing 4/12/4 window.
In fact, from the experience derived from many measurements of façade sound insulation [43,44], the lower the insulation of a window, the lower the spectrum adaptation term Ctr and vice versa, the higher the window insulation, the higher Ctr. For this reason, in the case of the previous RRT [8] (a façade with low insulation window) the difference between Dls,2m,nT,w and Dls,2m,nT,w + Ctr averages, was not a large one, only 1.5 dB, while in the case of the present study (a façade with higher insulation window), the difference between the average values of Dls,2m,nT,w and of Dls,2m,nT,w + Ctr,50–5000 is 5.3 dB for default measurements and 6.8 dB for the low-frequency method.

3. How to Manage the Cooperative Tests Uncertainty

As stated in the introduction, current knowledge in building acoustics suggests that the best methodology to study the measurements uncertainty is to carry out an Inter-Laboratory Test or a Round Robin Test. Therefore the results of ILTs and RRTs are very important to know the uncertainty magnitude that is reasonably expected for a measurement result. However, even if an ILT or RRT gives the uncertainty of a measurement method, the uncertainty magnitude depends also on the measurand. An example of the dependence on the method can be drawn from the results of uncertainty of façade sound insulation measurements discussed in Section 2.1.2, where the high frequency uncertainty depends on the loudspeaker position (which is still under study). On the other hand, the uncertainty magnitude also depends on the test sample, as showed in Section 2.1.1 concerning the sound insulation of internal partitions where it was found that the uncertainties of lightweight samples are lower than the uncertainties of heavy types of construction. The dependence on the measurand, in particular for including or not the LF in SNQs, was also found in the case of façade sound insulation uncertainty (see Section 2.1.2) where the comparison of the two RRTs results highlighted that that the differences are attributable to the windows, on which the Ctr coefficient depends: a single glazing window and a double 4/12/4 glazing window.
ISO 12999-1 [5] gives the medium uncertainty on all the ILTs and RRTs considered (and available at the time when the standard draft was being written) in that standard, for airborne sound insulation, without distinction of the type of measurand. At the current level of knowledge and due to the number of cooperative tests available, this seems to be the only way to give an idea of the uncertainty magnitude. The fact that the values of ISO 12999-1 [5] are the best estimates for the uncertainty of sound insulation measurements that can be obtained today, was also underlined by Wittstock [45] in his paper that describes how the average uncertainty values standardized in ISO 12999-1 [5] were derived. Therefore, it is important to keep that standard constantly updated in order to increase the number of available data on which the average uncertainty values could be calculated. This specific standard is inaccurate as far as the façade sound insulation is concerned, because its uncertainty is considered equal to the airborne sound insulation uncertainty; indeed, the façade sound insulation measurement method is extremely different from the airborne sound insulation measurement method for party walls and floors. A priori, the reproducibility standard deviation is higher than the in situ standard deviation because of, as far as reproducibility is concerned, the geometry of the rooms and wall can change, while this is not the case for the in situ standard deviation as defined in Section 2. Because the geometry (i.e., modal behavior) has a large influence at low frequencies, sR is larger than ssitu (cf. Table 6). The use of ssitu is thus only appropriate when the geometry is the same. In the case of façade sound insulation, however, there are no literature data that referred to RRT of the same object in different situations and it will be appropriate in the future that ISO 12999-1 [5] include this difference (i.e., reproducibility and in situ standard deviation for façade sound insulation), considering the following: the measurement method of façade sound insulation is extremely different from the laboratory measurement of airborne sound insulation; the uncertainty at high frequencies (which exceed, in the case of the second façade RRT [10], the sR values of ISO 12999-1 [5] as shown in Figure 3) is mainly dependent on the loudspeaker position (as supposed in the case of the second RRT of Façade [10], as said before), and the RRT [12] values exceed the values of the ISO 140-2 [37] in the range of mass-spring-mass resonance frequency and in the range of the coincidence frequency of the double glazing. At the present state of knowledge, the reproducibility standard deviation values included in ISO 12999-1 [5] seem to be the only available uncertainty that could be used also in the case of façade sound insulation, keeping in mind that the façade sound insulation measurement method is very different.
Table 6. Standard uncertainties for single-number values in accordance with ISO 717-1, as per ISO 12999-1 [5].
DescriptorsR dBssitu dBsr dB
Rw, R’w, Dnw, DnT,w1.20.90.4
(Rw, R’w, Dnw, DnT,w) + C100–31501.30.90.5
(Rw, R’w, Dnw, DnT,w) + C100–50001.30.90.5
(Rw, R’w, Dnw, DnT,w) + C50–31501.31.00.7
(Rw, R’w, Dnw, DnT,w) + C50–5000 1.31.10.7
(Rw, R’w, Dnw, DnT,w) + Ctr,100–31501.51.10.7
(Rw, R’w, Dnw, DnT,w) + Ctr,100–50001.51.10.7
(Rw, R’w, Dnw, DnT,w) + Ctr,50–31501.51.31.0
(Rw, R’w, Dnw, DnT,w) + Ctr,50–50001.51.01.0
Therefore, in the case of a single measurement, the uncertainty that should be associated to this measurement is the reproducibility standard deviation given in ISO 12999-1 [5] multiplied by the appropriate coverage factor to obtain the expanded uncertainty. Now, considering what was stated in the introduction, when reporting the result of the measurement of a physical quantity, it is compulsory that some quantitative indications of the quality of the result be given. Such an indication should be independent on the final use of the results (verification of a requirement or determination of predicted values), and shall be stated as follows, as provided by GUM [2] and ISO 12999-1 [5]:
Y = y ± U
where Y is the measurand; y is the best estimate (obtained through the measurement) of the value attributable to the measurand; and U is the expanded uncertainty, calculated for a given confidence level for the two-sided test, defined as the product of the measurement uncertainty u (which is the reproducibility standard deviation sR) with a coverage factor k.
Therefore, for example, for a single measurement of the airborne sound insulation of a partition floor R’w (C;Ctr) = 53 (−1;−4), considering the values given in ISO 12999-1 (see Table 6), the airborne sound insulation of this partition wall shall be given to one decimal place (R’w = 52.6; C = −1.0; Ctr = −4.1) to state also its uncertainty and should be designated as [5]:
R w ' = ( 52.6 ± 2.4 ) d B ( k = 1.96 , t w o s i d e d )
R w ' + C = ( 51.6 ± 2.6 ) d B ( k = 1.96 , t w o s i d e d )
R w ' + C t r = ( 48.5 ± 2.9 ) d B ( k = 1.96 , t w o s i d e d )
where k = 1.96 corresponds to a confidence level of 95% for a two-sided test.
On the other hand, when a measurement is made in order to verify a requirement, the expanded uncertainty that should be given with the result, should be calculated using a coverage factor for one-sided test, as laid down in ISO 12999-1 [5]. Then the expanded uncertainty should be added to or subtracted from the measurement result to check whether that measurement result is smaller or larger than the requirement, respectively.
The Italian standard on the acoustic classification of building units UNI 11367 [46] first considers the measurement uncertainty from RRTs as a basis for the expanded uncertainty U. When a national regulation has to be met, the choice of the confidence level is very important. The Italian standard on the acoustic classification [46] has faced for the first time the problem related to the confidence level. In the case of measurement uncertainty, the standard recommends to use a coverage factor k for one-sided test equal to 1, which corresponds to an 84% probability; for buildings performances, in fact, in order to meet the limit, it is not realistic to use a 95% or 90% confidence level, which is normally used in other contexts. As the update of the ISO 717-1 [21] allows applying the weighting procedure by 0.1 dB steps for the expression of measurement uncertainty, it could now possible also be to use, in building acoustics, a coverage factor k for one-sided test equal to 1.65 corresponding to a 95% confidence level.
Generally, when measurements are made to verify the acoustic requirements of buildings, one single measurement might not be enough to this end, and therefore more measurements and more results for the same requirement are necessary. In this case, the measurement uncertainty is combined in a certain way with the uncertainty due to the number of tests performed.

4. Sampling

There are two different types of surveys that can be used to analyze the acoustic requirements of building units, or buildings: a census (the entire population is taken into account) or a sample survey (only a part of the elements that make up the population are considered). For building acoustics, a sample survey is the best solution in terms of cost and time. To make meaningful comparisons with both national regulations and acoustic classification, it is therefore necessary to determine the type and amount of the measurements. In order to make any sample survey on certain features (acoustical) of a finite population, it is essential to formulate a strategy of selection, which is closely connected with the purposes, the cost and the execution time of the survey. In addition, the sample obtained from it, is the only valuable information that could be used for the interpretation of the results.
Among the different sampling strategies currently available, the two main ones used in building acoustics, for the time being, are the following: the stratified sampling as adopted by UNI 11367 [46] (see next section) and a sampling procedure taking into account a certain percentage associated with a selection criterion as adopted by UNI 11444 [47] and proposed by ISO/WD 19488 [48]. Only the former strategy (stratified sampling) includes the sampling uncertainty. The strategy of UNI 11444 [47] consists in the selection of a minimum number of Building Units (BUs): not less than 10% of the total amount of BUs composing the building system and not less than 2 BUs, if the total amount is 4, and not less than 3 BUs for building systems up to 30 BUs. These BUs must be the most critical BUs from an acoustic point of view. The selection of the most critical BUs must take into account all the critical acoustic features of the building elements of the BU. The selection criteria for each type of acoustic performance (façade sound insulation, sound insulation of horizontal and vertical partitions, impact sound insulation and equipment noise level) are stated in standard UNI 11444 [47]. This standard does not include the sampling uncertainty but, for each measurement, it includes the measurement uncertainty as stated in UNI 11367 [46].
The standard proposal ISO/WD 19488 [48] considers, as a general principle, that, when verifying the acoustic class of a unit, a sufficient number of measurements of each relevant acoustic characteristic must be performed in order for the result to represent the unit. It also suggests that care should be taken to include the critical site/rooms, e.g., partitions with critical flanking constructions. At the current stage, the proposal includes neither the sampling uncertainty nor the measurement uncertainty, but it considers that compliance is granted if the average results comply with the class limits and no individual result deviates unfavorably by more than 2 dB. Moreover, if classification for different dwellings, rooms or acoustic characteristics varies, the classification assigned is the minimum class obtained.
Considering the pros and cons of these two sampling strategies, the first thing to keep in mind is the scope of the measurements; i.e., to determine a class within the acoustic classification or to verify the legal requirements. In the former case, it is obvious that a value as close as possible to the value of all the elements is suitable. In the latter case, the scope is to identify the worst acoustic performances and to verify if also the critical site/rooms is/are in compliance with the legal requirements.
The stratified sampling strategy allows increasing the efficiency of a sampling plan, without increasing the sample size. With this strategy it is possible to obtain the best representative value of a class to be attributed to the entire building system, as if the entire population were taken into account. Another pro is the stratified sampling uncertainty related to the final result that gives a confidence level, which is important both for the owners and the builders. The con of this strategy is that it requires a large number of measurements (a minimum of three measurements for each homogeneous group).
A strategy that takes into account a certain percentage of the population, including all the critical site/rooms, could not be representative of all situations but would give the worst results and therefore, if this result complies with the legal requirements, the whole building complies with them. On the other hand, not all the critical site/rooms may have been taken into account and therefore the confidence level and the sampling uncertainty to be associated with the results is not known. Moreover, the sampling strategy proposed in ISO/WD 19488 has the obvious drawback that it cannot guarantee to have spotted all critical situations: for example a workmanship failure that cannot be detected by visual inspection can be identified only after the measurements. Thus, a sampling criterion based on generic rules cannot find it. However, the con of this strategy is that in general the number of measurements is limited.

4.1. Stratified Sampling

The stratified sampling is the most direct procedure that allows increasing the efficiency of a sampling plan, since it allows reducing the order of magnitude of the sampling error without increasing the sample size.
Stratification is made possible by means of additional information about one or more characters of the population, which is about the structure of the population itself. This allows, based on informed choice, dividing the population into a number of layers as homogeneous as possible, as meaning that within each layer, the considered character has a lower variability. A simple random sample is extracted from each layer; therefore there are as many simple samples as there are layers. These samples are independent of each other and can have different sample sizes. The stratification, due to the way it is implemented, allows obtaining an improvement in the estimates for the same sample size, or to contain the sample size at the same level of efficiency [49].
Considering the above mentioned advantages offered by the stratified sampling, this latter is the solution adopted by UNI 11367 [46] in the case of classification of serial type buildings.
The part of the Italian standard on the classification of buildings and building units that refers to the stratified sampling procedure can be applied in the case of a serial type building. The stratified sampling procedure is based on the concept of homogeneous group. The population of all the building elements that have to be measured for the acoustic classification has to be divided in the homogeneous groups that are defined in the Italian standard on classification. Referring to UNI 11367 [46], generally, a set of test items can be considered homogeneous and therefore subject to a possible sampling (in reference to a specific requirement), if the following conditions are satisfied: item dimensions (with 20% tolerance); dimensions (with 20% tolerance with respect to the volumes) of both transmitting and receiving rooms where the test item is located; the same test methodology; stratigraphy, materials and surface mass; structural constraints (flanking transmissions); presence of equipment passing through the test item; installation techniques. In this section an example is given with reference to the paper presented by the authors at the 38th National Congress of the Acoustical Society of Italy in 2011 [50], concerning the acoustic classification of a building system of a total volume of about 15,000 m3, consisting of two similar buildings, identified as body A1 and body A2, on three floors, with apartments on the ground floor, first and second floor and, in the body A1, a third floor attic. In total, the building system consists of 47 Building Units (BUs), distributed according to their type: six four-room apartments, eight three-room apartments, 25 two-room apartments and eight studios.
The building system was considered a serial type building system, based on the following considerations: it is possible to identify a typical floor (see Figure 4) in which the distribution of BUs is symmetrical with respect to the stairwells; the two-room apartment type is repeated 25 times; the rooms with the same intended use (bedrooms, living rooms, kitchens, etc.) have the same shape and size.
Figure 4. Typical floor of the building system considered: the BU typologies are highlighted, in green the four-room apartments, in red the two-room apartments and in blue the studio [50].
Buildings 05 01389 g004
For the application of the stratified sampling procedure defined in UNI 11367 [46], it would have been sufficient to use a minimum number of items to be tested equal to at least 10% of the total number of elements of the homogeneous group and not less than three for each homogeneous group. However, in order to obtain the most useful data for a critical examination of the results, the number of items to be tested was higher than the minimum required. In particular, 84% of the vertical partitions were measured. For some requirements, the number of items to be tested of some homogeneous group was equal to two, which is less than the minimum required of three for reasons related to the impossibility to perform further tests (inaccessibility of the rooms). When more measurements than the minimum necessary number were made, in order to simulate the case in which only the minimum sampling number (3) of measurements was performed, the results were reconsidered on the basis of all the combinations without repetition of three elements actually measured and calculating the average. This was done in order to make the choice of the three elements under test as random as possible, and to evaluate the probability of obtaining a specific standard deviation, and a specific class according to the variability and to the randomness of selection of the three elements. The results, obtained on the basis of both the performed measurements and the statistical analysis of the sampling procedure, are as follows. First of all, a methodological indication: a review and a possible redefinition of the homogeneous groups retrospectively (i.e., when the measurement are concluded), this may be useful to formulate an acoustic classification closer to the real situation. This indication comes from the fact that, in the case under study, the values of the impact sound insulation differ greatly and in a systematic manner between the two bodies; the results of body A2 show a worse performance than those of body A1. This difference is due to the installation that, in one case (body A1), was evidently very well done. The influence of workmanship was studied by Craik and Steel [51] who found that workmanship can account for a variation of approximately 2 dB in airborne sound insulation. Within this distinction, the variability of the impact sound insulation values is on the average when compared with the airborne sound insulation of vertical and horizontal partitions.
From the analysis of all the combinations without repetition of the measurements, two possible classifications are found: in one of them, the percentage of BUs of class III (43%) becomes smaller compared to that of class IV, while in the other, the percentage of BUs of class III is rather prevalent (64%); in particular, this is due to the requirement of airborne sound insulation of internal partitions R’w. Actually, the values relating to the airborne sound insulation R’w, for vertical partitions, are in the vast majority of cases very close to the lower limit value (50 dB) of class III; therefore, in the random choice, there is a higher probability that the choice falls on these values straddling the two classes, with the result of moving the larger percentage of BUs from class to class. This analysis makes it clear that it is necessary to adopt, at design level, more conservative design solutions.
Table 7 shows the average, minimum, maximum and standard deviation of the measured performances for each type of technical element; in particular, the variability of the data is described by the standard deviation and it increases with the increase of the latter. The values shown in Table 7 are the net values, as defined in UNI 11367 [46], i.e., the results of a measurement corrected with the measurement uncertainty.
The greatest variability is found for façades; for the building system under classification this is caused mainly by the typical variability of façades, dependent on many types of window frames and the presence of balconies, irrespective of a proper installation and, to a lower extent, also to workmanship.
The lower variability is observed in internal partitions, and in particular floors (horizontal partition), with respect to the sound insulation requirement. The variability of the impact sound insulation is comparable with that of the other requirements. Moreover, the variability of the impact sound insulation for the two bodies separately is comparable, confirming the systematic difference found in body A2.
Table 7. Performances variability of technical elements [50].
Technical ElementFaçadeVertical PartitionsHorizontal PartitionsHorizontal Partitions A1Horizontal Partitions A2
Quantity used in law requirementsD2mnT,wR’wR’wL’nL’n
number of test elements353621910
average39.650.152.657.665.5
standard deviation3.71.871.42.22.6
minimum3047505462
maximum4554556170

4.2. Stratified Sampling Uncertainty

When a sample survey is used to define the classification of building or BUs, it is necessary to consider the uncertainty associated with the sampling procedure. Moreover, considering that each single measurement result that contributes to the value attributed to a certain requirement has its own measurement uncertainty, it becomes necessary to combine these two uncertainties in a certain way.
In the case of UNI 11367 [46] the representative value of a homogeneous group (Equations (9) and (10)), i.e., the arithmetic mean value of the group with the sampling uncertainty with a one-sided coverage factor, already includes the measurement uncertainty. In fact, the arithmetic mean values Xhe and Yhe are calculated from the net values (i.e., the results of the measurement corrected with the measurement uncertainty) of the homogeneous group itself [46,52] as indicated in UNI 11367 [46] as follows:
X h e = c = 1 C h X h c C h
Y h e = c = 1 C h Y h c C h
where Xhc is the net value of a sample of a specific requirement (façade sound insulation or airborne sound insulation of the internal partition), Yhc is the net value of a sample of a specific requirement (impact sound insulation or sound pressure level for service equipment), and Ch is the number of samples within a homogeneous group.
The “representative value” Xh and Yh of each homogeneous group is then obtained as follows [46]:
X h = X h e U s h
Y h = Y h e + U s h
where Ush is the sampling uncertainty equal to the sampling standard deviation ssh times the coverage factor k:
U s h = s s h k
where ssh is the sampling standard deviation, determined with Equations (12) and (13):
s s h X = c = 1 C h ( X h e X h c ) 2 C h 1 ( M h C h ) ( M h 1 )
s s h Y = c = 1 C h ( Y h e Y h c ) 2 C h 1 ( M h C h ) ( M h 1 )
where sshX is the standard deviation referred to the façade sound insulation or to the airborne sound insulation of internal partitions, sshY is the standard deviation referred to the impact sound insulation or to the sound pressure level for service equipment and Mh is the number of all the measurable technical elements within a homogeneous group.

5. Conclusions

This study showed that the measurement uncertainty in building acoustics is very high, in particular if the measurements are extended at low frequencies. Therefore, it is extremely important to define the way to manage measurement uncertainty in building acoustics, depending on the different situations.
In the case of a single measurement, the uncertainty that should be associated with this measurement is the reproducibility standard deviation given in ISO 12999-1 [5] multiplied by the appropriate coverage factor to obtain the expanded uncertainty. Such an indication should be independent of the final use of the results, and shall be stated as the expanded uncertainty with a 95% confidence level for a two-sided test. When the single measurement is made in order to verify a requirement, the expanded uncertainty that should be given with the result, should be calculated using a coverage factor for one-sided test and the confidence level should be set to 95%.
When measurements are made to verify the acoustic requirements or the acoustic classification of building units, or buildings, one single measurement might not be enough to this end, and therefore more measurements and more results for the same requirement are necessary. For building acoustics, a sample survey is the best solution in terms of cost and time. There are two main types of sampling strategies used in building acoustics, for the time being: the stratified sampling as stated in UNI 11367 [46] and a sampling procedure taking into account a certain percentage associated with a selection criterion as adopted UNI 11444 [47] and proposed in ISO/WD 19488 [48]. In the former case, the measurement uncertainty is combined with the sampling uncertainty to obtain a reliable classification for BUs, while in the latter case, the sampling uncertainty is not taken into account because the strategy selection includes all the critical acoustic situations. In UNI 11444 [47], the measurement uncertainty is included for each measurement result, as stated in UNI 11367 [46]. In ISO/WD 19488 [48], if classification for different dwellings, rooms or acoustic characteristics varies, the classification assigned is the minimum class obtained, and therefore all the other BUs complied with that class.
In any case, a measurement, whether single or part of a set of measurements for the sampling, should always be associated with its measurement uncertainty. In the case of sampling, either the sampling uncertainty is considered, obtaining a value representative of all the situations considered, or selection criteria of the most critical cases is taken into account, obtaining a value that is not representative of all the situations but is a precautionary value.

Acknowledgments

We gratefully acknowledge Paolo Cardillo for revising the English text of the manuscript.

Author Contributions

Chiara Scrosati designed and conceived the study, acquired data, analyzed and interpreted data, supervised the RRTs and drafted the manuscript.
Fabio Scamoni revised the manuscript critically for important intellectual content.

Conflicts of Interest

The authors declare no conflict of interest.

References and Notes

  1. Scrosati, C.; Scamoni, F. Measurement uncertainty in building acoustics Invited and peer reviewed paper. In Proceedings of the 22nd International Congress on Sound and Vibration (ICSV22), Florence, Italy, 12–16 July 2015.
  2. ISO/IEC Guide 98-3:2008 The Guide to the Expression of Uncertainty in Measurement (GUM:1995); ISO: Genève, Switzerland, 2008.
  3. ISO 10140 Acoustics—Laboratory Measurement of Sound Insulation of Building Elements; ISO: Genève, Switzerland, 2010.
  4. ISO 16283 Acoustics—Field Measurement of Sound Insulation in Buildings and of Building Elements; ISO: Genève, Switzerland, 2014.
  5. ISO 12999-1:2014 Acoustics—Determination and Application of Measurement Uncertainties in Building Acoustics—Part 1: Sound Insulation; ISO: Genève, Switzerland, 2014.
  6. Scamoni, F.; Scrosati, C.; Mussin, M.; Galbusera, E.; Bassanino, M.; Zambon, G.; Radaelli, S. Repeatability and reproducibility of field measurements in buildings. In Proceedings of the Euronoise 2009, Edinburgh, Scotland, 26–28 October 2009.
  7. Scrosati, C.; Scamoni, F.; Bassanino, M.; Mussin, M.; Zambon, G. Uncertainty analysis by a round robin test of field measurements of sound insulation in buildings: Single numbers and low frequency bands evaluation—Airborne sound insulation. Noise Control Eng. J. 2013, 61, 291–306. [Google Scholar] [CrossRef]
  8. Scrosati, C.; Scamoni, F.; Zambon, G. Uncertainty of façade sound insulation in buildings by a round robin test. Appl. Acoust. 2015, 96, 27–38. [Google Scholar] [CrossRef]
  9. Decree of the President of the Council of Ministers D.P.C.M. Determinazione Dei Requisiti Acustici Passivi Degli Edifici (Determination of Building Passive Acoustic Requirements). In G.U. (Official Journal) General Series n.297; D.P.C.M.: Rome, Italy, 1997. [Google Scholar]
  10. Scrosati, C.; Scamoni, F.; Asdrubali, F.; D’Alessandro, F.; Moretti, E.; Astolfi, A.; Barbaresi, L.; Cellai, G.; Secchi, S.; di Bella, A.; et al. Uncertainty of façade sound insulation measurements obtained by a round robin test: The influence of the low frequencies extension, Invited paper. In Proceedings of the 22nd International Congress on Sound and Vibration (ICSV22), Florence, Italy, 12–16 July 2015.
  11. ISO 140-5:1998 Acoustics—Measurement of Sound Insulation in Buildings and of Building Elements—Part 5: Field Measurements of Airborne Sound Insulation of Façade Elements and Façades; ISO: Genève, Switzerland, 1998.
  12. Lang, J. A round robin on sound insulation in building. Appl. Acoust. 1997, 52, 225–238. [Google Scholar] [CrossRef]
  13. Simmons, C. Uncertainty of measured and calculated sound insulation in buildings—Results of a round robin test. Noise Control Eng. J. 2007, 55, 67–75. [Google Scholar] [CrossRef]
  14. Farina, A.; Fausti, P.; Pompoli, R.; Scamoni, F. Intercomparison of laboratory measurements of airborne sound insulation of partitions. In Proceedings of the 1996 International Congress on Noise Control Engineering, (Internoise’ 96), Liverpool, UK, 30 July–2 August 1996.
  15. Fausti, P.; Pompoli, R.; Smith, R.S. An inter-comparison of laboratory measurements of airborne sound insulation of lightweight plasterboard walls. J. Build. Acoust. 1999, 6, 127–140. [Google Scholar] [CrossRef]
  16. Smith, R.S.; Pompoli, R.; Fausti, P. An Investigation into the reproducibility values of the european inter-laboratory test for lightweight walls. J. Build. Acoust. 1999, 6, 187–210. [Google Scholar] [CrossRef]
  17. Schmitz, A.; Meier, A.; Raabe, G. Inter-laboratory test of sound insulation measurements on heavy walls: Part I—Preliminary test. J. Build. Acoust. 1999, 6, 159–169. [Google Scholar] [CrossRef]
  18. Meier, A.; Schmitz, A.; Raabe, G. Inter-laboratory test of sound insulation measurements on heavy walls: Part II—Results of main test. J. Build. Acoust. 1999, 6, 171–186. [Google Scholar] [CrossRef]
  19. ISO 140-4:1998 Acoustics—Measurement of Sound Insulation in Buildings and of Building Elements—Part 4: Field Measurements of Airborne Sound Insulation between Rooms; ISO: Genève, Switzerland, 1998.
  20. COST Action TU0901 Integrating and Harmonizing Sound Insulation Aspects in Sustainable Urban Housing Constructions. 2009–2013. Available online: http://www.costtu0901.eu/ (accessed on 15 September 2015).
  21. ISO 717-1:2013 Acoustics—Rating of Sound Insulation in Buildings and of Building Elements—Part 1: Airborne Sound Insulation; ISO: Genève, Switzerland, 2013.
  22. Wittstock, V. On the uncertainty of single-number quantities for rating airborne sound insulation. Acta Acust. United Acust. 2007, 93, 375–386. [Google Scholar]
  23. Dijckmans, A.; Vermeir, G. Numerical investigation of the repeatability and reproducibility of laboratory sound insulation measurements. Acta Acust. United Acust. 2013, 99, 421–432. [Google Scholar] [CrossRef]
  24. Garg, N.; Maji, S. On analyzing the correlations and implications of single-number quantities for rating airborne sound insulation in the frequency range 50 Hz to 5 kHz. Build. Acoust. 2015, 22, 29–44. [Google Scholar] [CrossRef]
  25. ISO CD 16717-1:2013 Acoustics—Evaluation of Sound Insulation Spectra by Single-Number Values. Part 1: Airborne Sound Insulation; ISO: Genève, Switzerland, 2013.
  26. Mahn, J.; Pearse, J. The uncertainty of the proposed single number ratings for airborne sound insulation. J Build. Acoust. 2012, 19, 145–172. [Google Scholar] [CrossRef]
  27. Hongisto, V.; Keränen, J.; Kylliäinen, M.; Mahn, J. Reproducibility of the present and the proposed single-number quantities of airborne sound insulation. Acta Acust. United Acust. 2012, 98, 811–819. [Google Scholar] [CrossRef]
  28. Machimbarrena, M.; Monteiro, C.R.A.; Pedersoli, S.; Johansson, R.; Smith, S. Uncertainty determination of in situ airborne sound insulation measurements. Appl. Acoust. 2015, 89, 199–210. [Google Scholar] [CrossRef]
  29. António, J.; Mateus, D. Influence of low frequency bands on airborne and impact sound insulation single numbers for typical Portuguese buildings. Appl. Acoust. 2015, 89, 141–151. [Google Scholar] [CrossRef]
  30. Grubbs, F.E. Procedures for detecting outlying observation in samples. Technometrics 1969, 11, 1–21. [Google Scholar] [CrossRef]
  31. Grubbs, F.E.; Beck, G. Extension of sample sizes and percentage points for significants tests of outlying observations. Technometrics 1972, 14, 847–854. [Google Scholar] [CrossRef]
  32. Masovic, D.B.; Sumarac Pavlovic, D.S.; Mijic, M.M. On the suitability of ISO 16717-1 reference spectra for rating airborne sound insulation. J. Acoust. Soc. Am. 2013, 134, EL420–EL425. [Google Scholar] [CrossRef] [PubMed]
  33. Rindel, J.H. On the influence of low frequencies on the annoyance of noise from neighbours. In Proceedings of the InterNoise 2003, Seogwipo, Korea, 25–28 August 2003.
  34. Park, H.K.; Bradley, J.S. Evaluating standard airborne sound insulation measures in terms of annoyance, loudness, and audibility ratings. J. Acoust. Soc. Am. 2009, 126, 208–219. [Google Scholar] [CrossRef] [PubMed]
  35. Prato, A.; Schiavi, A. Sound insulation of building elements at low frequency: A modal approach. In Proceedings of the Energy Procedia—6th International Building Physics Conference, IBPC 2015, Turin, Italy, 14–17 June 2015.
  36. ISO/DIS 16283-3:2014 Acoustics—Field Measurement of Sound Insulation in Buildings and of Building Elements—Part 3: Façade Sound Insulation; ISO: Genève, Switzerland, 2014.
  37. ISO 140-2:1991. Acoustics—Measurement of Sound Insulation in Buildings and of Building Elements—Part 2: Determination, Verification and Application of Precision Data; ISO: Genève, Switzerland, 1991.
  38. Berardi, U.; Cirillo, E.; Martellotta, F. Interference effects in field measurements of airborne sound insulation of building façades. Noise Control Eng. J. 2011, 59, 165–176. [Google Scholar] [CrossRef]
  39. Berardi, U. The position of the instruments for the sound insulation measurement of building façades: From ISO 140-5 to ISO 16283-3. Noise Control Eng. J. 2013, 61, 70–80. [Google Scholar] [CrossRef]
  40. Hopkins, C. Revision of international standards on field measurements of airborne, impact and facade sound insulation to form the ISO 16283 series. Build. Environ. 2015, 92, 703–712. [Google Scholar] [CrossRef]
  41. Hopkins, C.; Turner, P. Field measurement of airborne sound insulation between rooms with non-diffuse sound fields at low frequencies. Appl. Acoust. 2005, 66, 1339–1382. [Google Scholar] [CrossRef]
  42. Prato, A.; Ruatta, A.; Schiavi, A. Transmission of impact noise at low frequency: A modal approach for impact sound insulation measurement (50–100 Hz). In Proceedings of the 22nd International Congress on Sound and Vibration (ICSV22), Florence, Italy, 12–16 July 2015.
  43. Masovic, D.; Miskinis, K.; Oguc, M.; Scamoni, F.; Scrosati, C. Analysis of façade sound insulation field measurements—Influence of acoustic and non-acoustic parameters. In Proceedings of the INTER-NOISE 2013, Innsbruck, Austria, 15–18 September 2013.
  44. Masovic, D.; Miskinis, K.; Oguc, M.; Scamoni, F.; Scrosati, C. Analysis of façade sound insulation field measurements—Comparison of different performance descriptors and influence of low frequencies extension. In Proceedings of the INTER-NOISE 2013, Innsbruck, Austria, 15–18 September 2013.
  45. Wittstock, V. Determination of measurement uncertainties in building acoustics by interlaboratory tests. Part 1: Airborne sound insulation. Acta Acust. United Acust. 2015, 101, 88–98. [Google Scholar] [CrossRef]
  46. UNI 11367:2010 Building Acoustics—Acoustic Classification of Building Units—Evaluation Procedure and In Situ Measurements; UNI: Milan, Italy, 2010.
  47. UNI 11444:2012 Building Acoustics—Acoustic Classification of Building Units—Guidelines for the Selection of Building Units in not Serial Building Systems; UNI: Milan, Italy, 2012.
  48. ISO/WD 19488:2015 (Rev. 20 July 2015) Acoustics—Acoustic Classification Scheme for Dwellings; ISO: Genève, Switzerland, 2012.
  49. Scrosati, C.; Pontarollo, C.M.; Scamoni, F.; di Bella, A.; Elia, G. Procedure di verifica delle prestazioni acustiche di edifici: Analisi tramite campionamento, (Acoustic performances of buildings: Sampling procedure analysis). In Proceedings of the 37th AIA National Congress, Siracusa, Italy, 26–28 May 2010.
  50. Scamoni, F.; Scrosati, C.; Cera, S. Classificazione acustica in un edificio residenziale a tipologia seriale: Analisi statistica della procedura di campionamento (Acoustic classification of a residential building of serial type: Statistical analysis of sampling procedure). In Proceedings of the 38th AIA National Congress, Rimini, Italy, 8–10 June 2011.
  51. Craik, R.J.M.; Steel, J.A. The effect of workmanship on sound transmission through buildings: Part 1. Airborne sound. Appl. Acoust. 1989, 27, 57–63. [Google Scholar] [CrossRef]
  52. Di Bella, A.; Fausti, P.; Scamoni, F.; Secchi, S. Italian experience on acoustic classification of buildings. In Proceedings of the Internoise 2012, New York, NY, USA, 19–22 August 2012.

