1. Introduction
Thermal comfort studies are usually carried out in buildings that are permanent, or semi-permanently, occupied by the same people, such as dwellings, offices, and classrooms. Not many studies have been done in buildings that are occupied by different users within a day, such as mosques, churches, museums, markets, etc. Since most comfort studies are likely to be conducted in buildings that are used by the same people, there is a need to conduct more studies in these different types of buildings. In line with this, sequential thermal comfort studies have been carried out in three different types of naturally ventilated public buildings, namely Jakarta Cathedral, Bank Mandiri Museum, and Puri Market. The three buildings are separated by about 10 km and all are located in Jakarta.
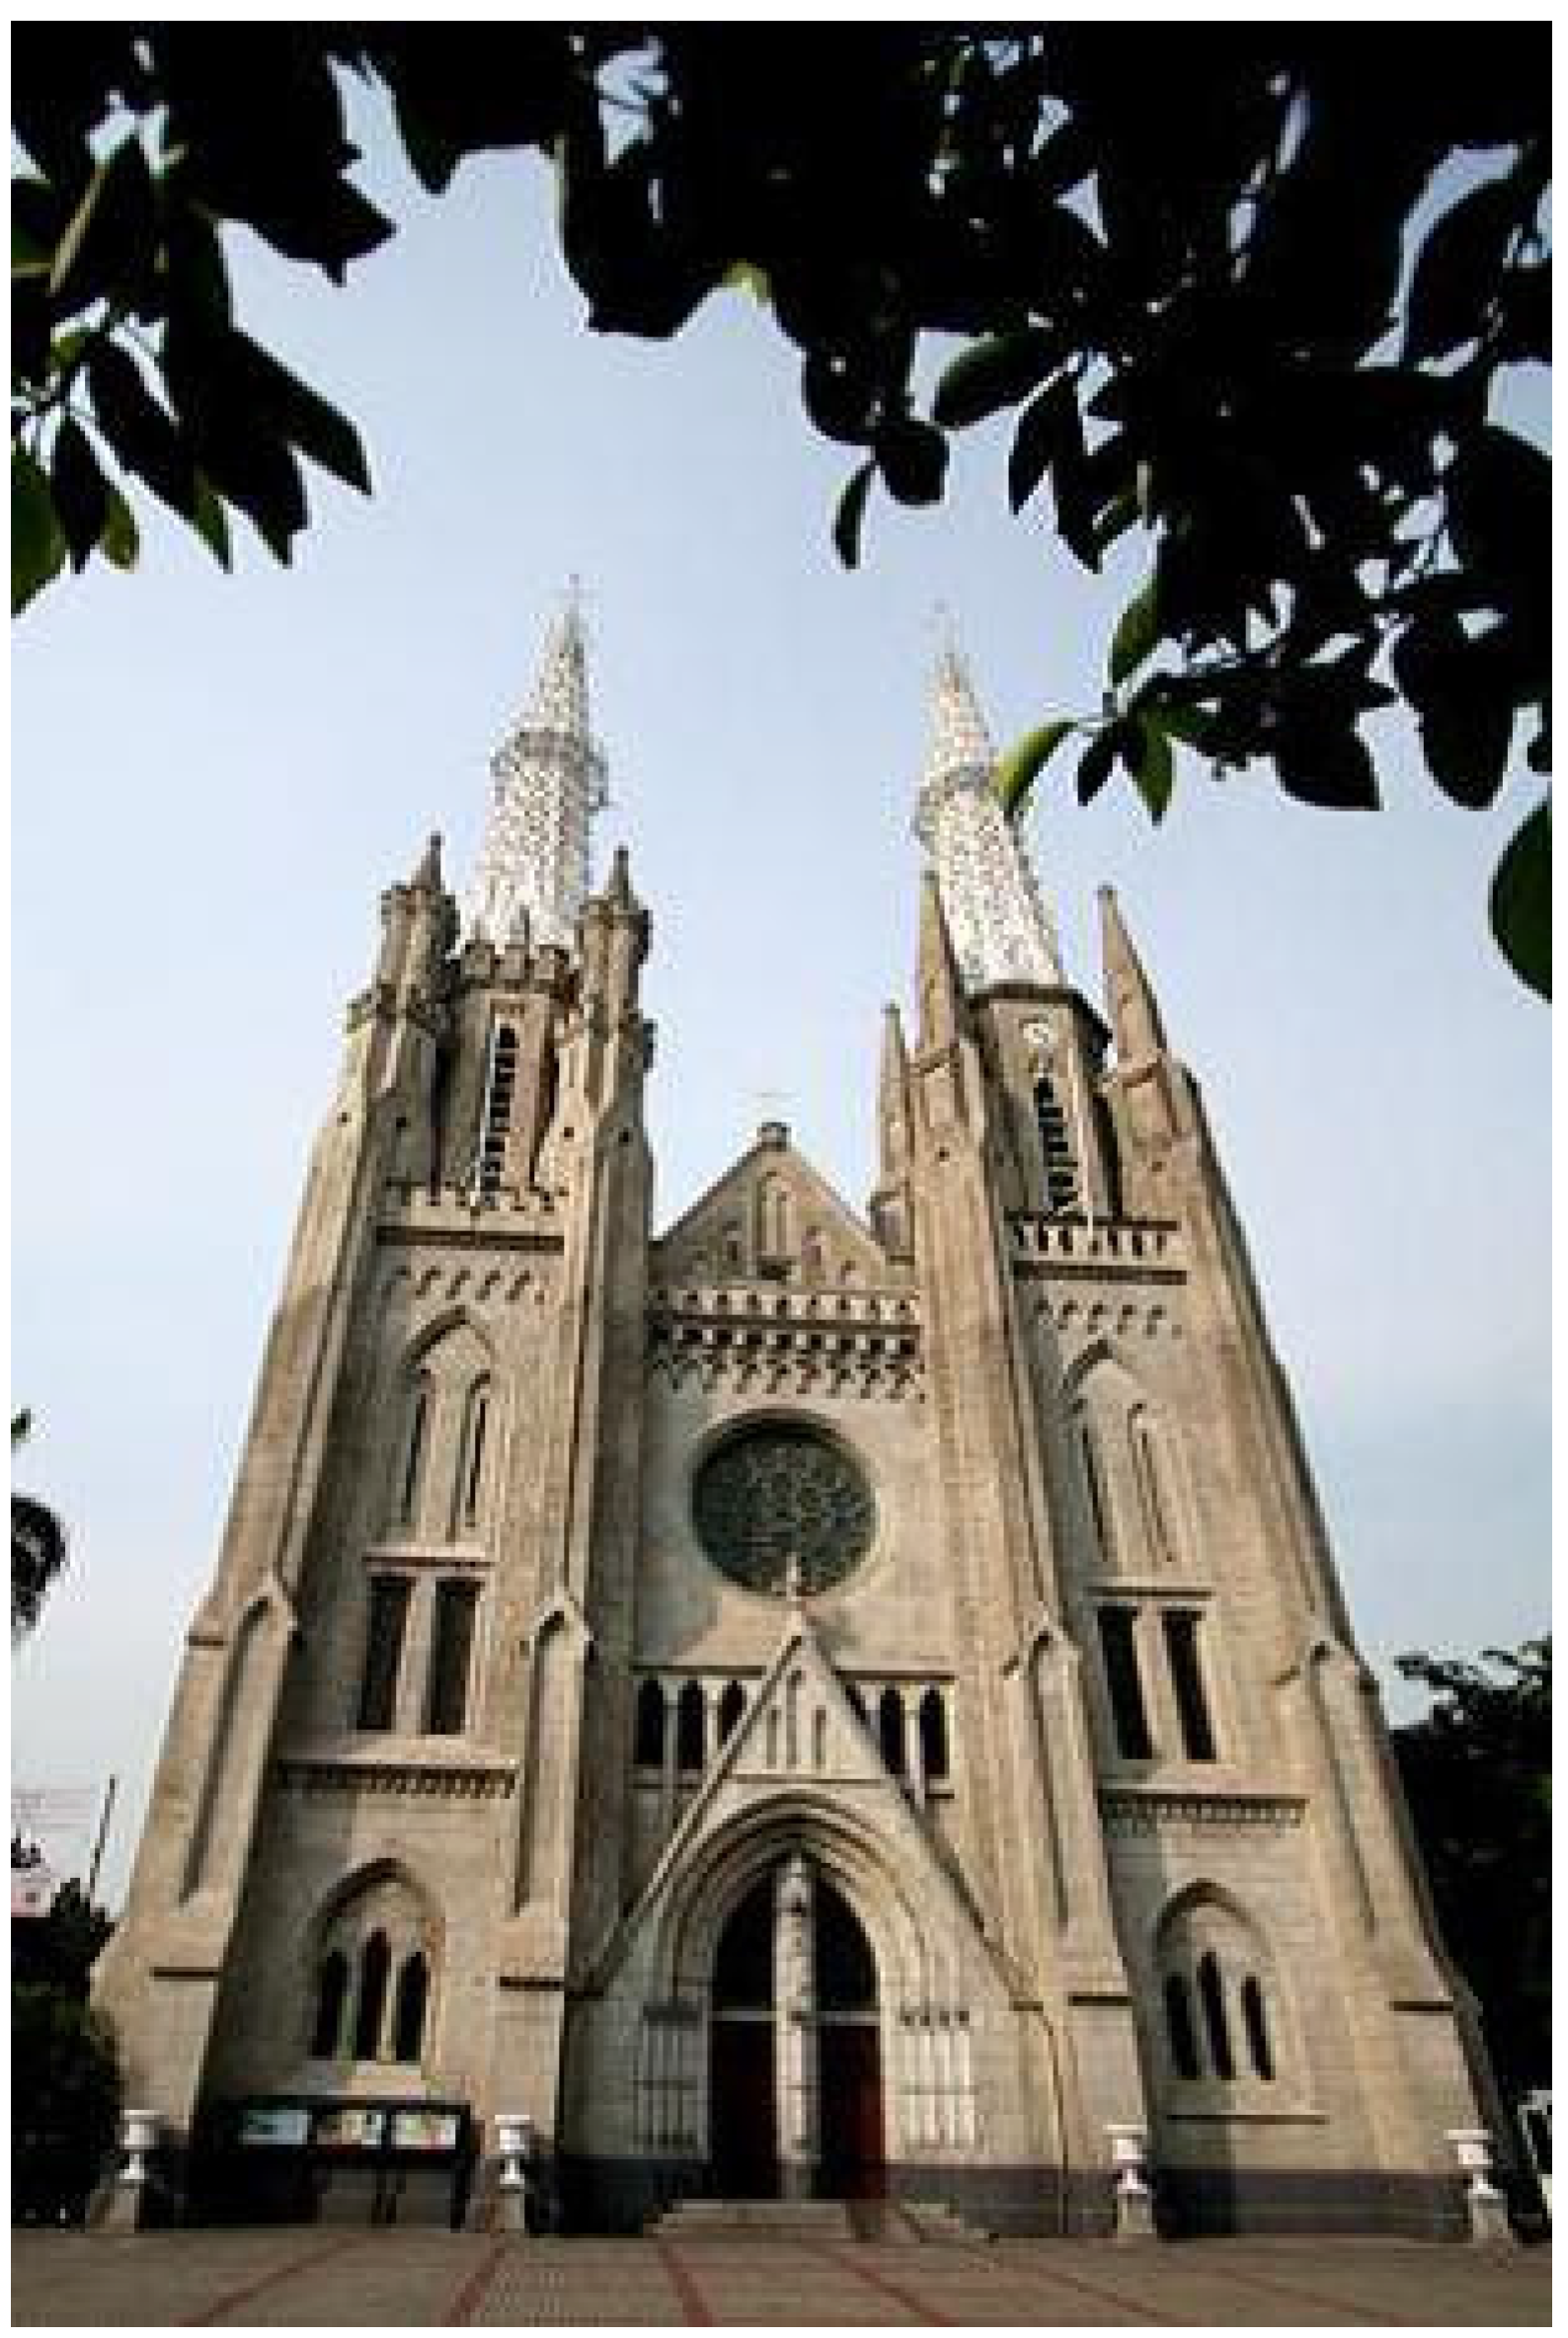
Figure 1 shows the Jakarta central cathedral. The cathedral is an old, historic, and naturally ventilated building, built during the Dutch period in 1901 [
1]. It has a floor size of 60 m × 20 m, with a ceiling height of between 5 and 7 m. This is one of the biggest cathedrals in Indonesia.
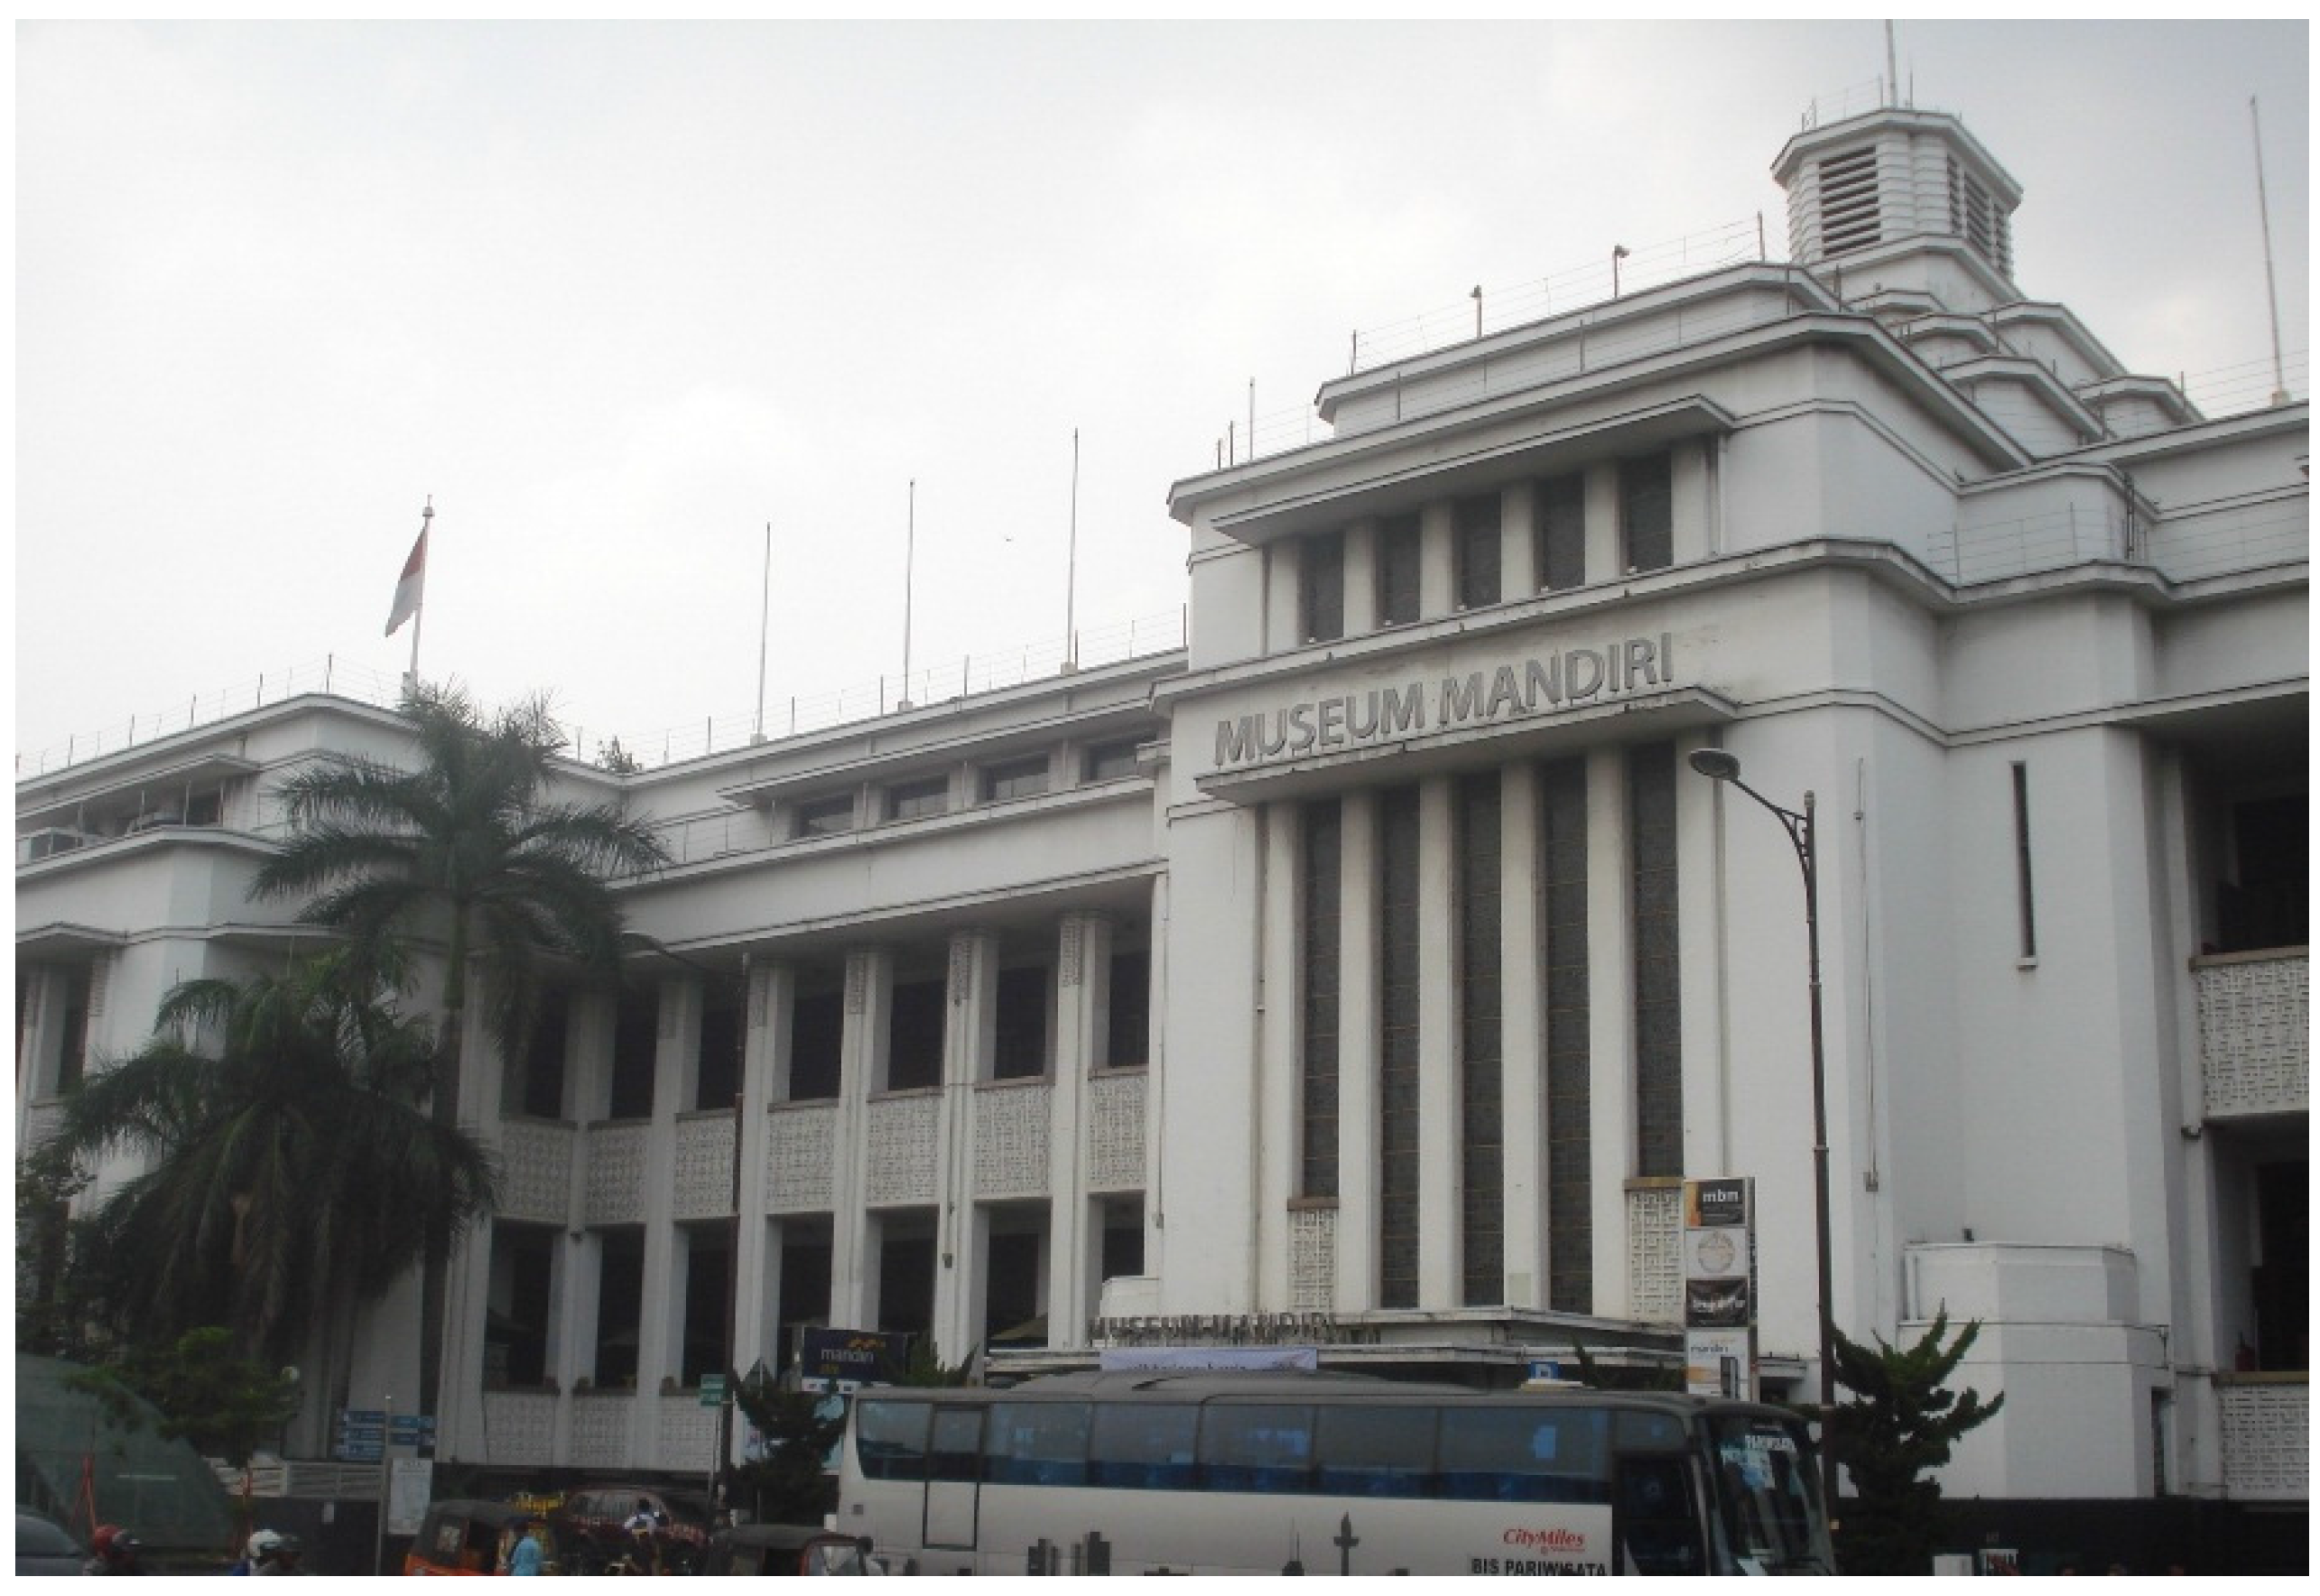
Figure 2 shows the museum of Bank Mandiri. The naturally ventilated building of the Bank Mandiri Museum is also an old, historic building, built by the Dutch in 1929. With a total floor area of 10,039 m
2, this building is used as a banking museum and consists of three floors, including a semi-basement [
2].
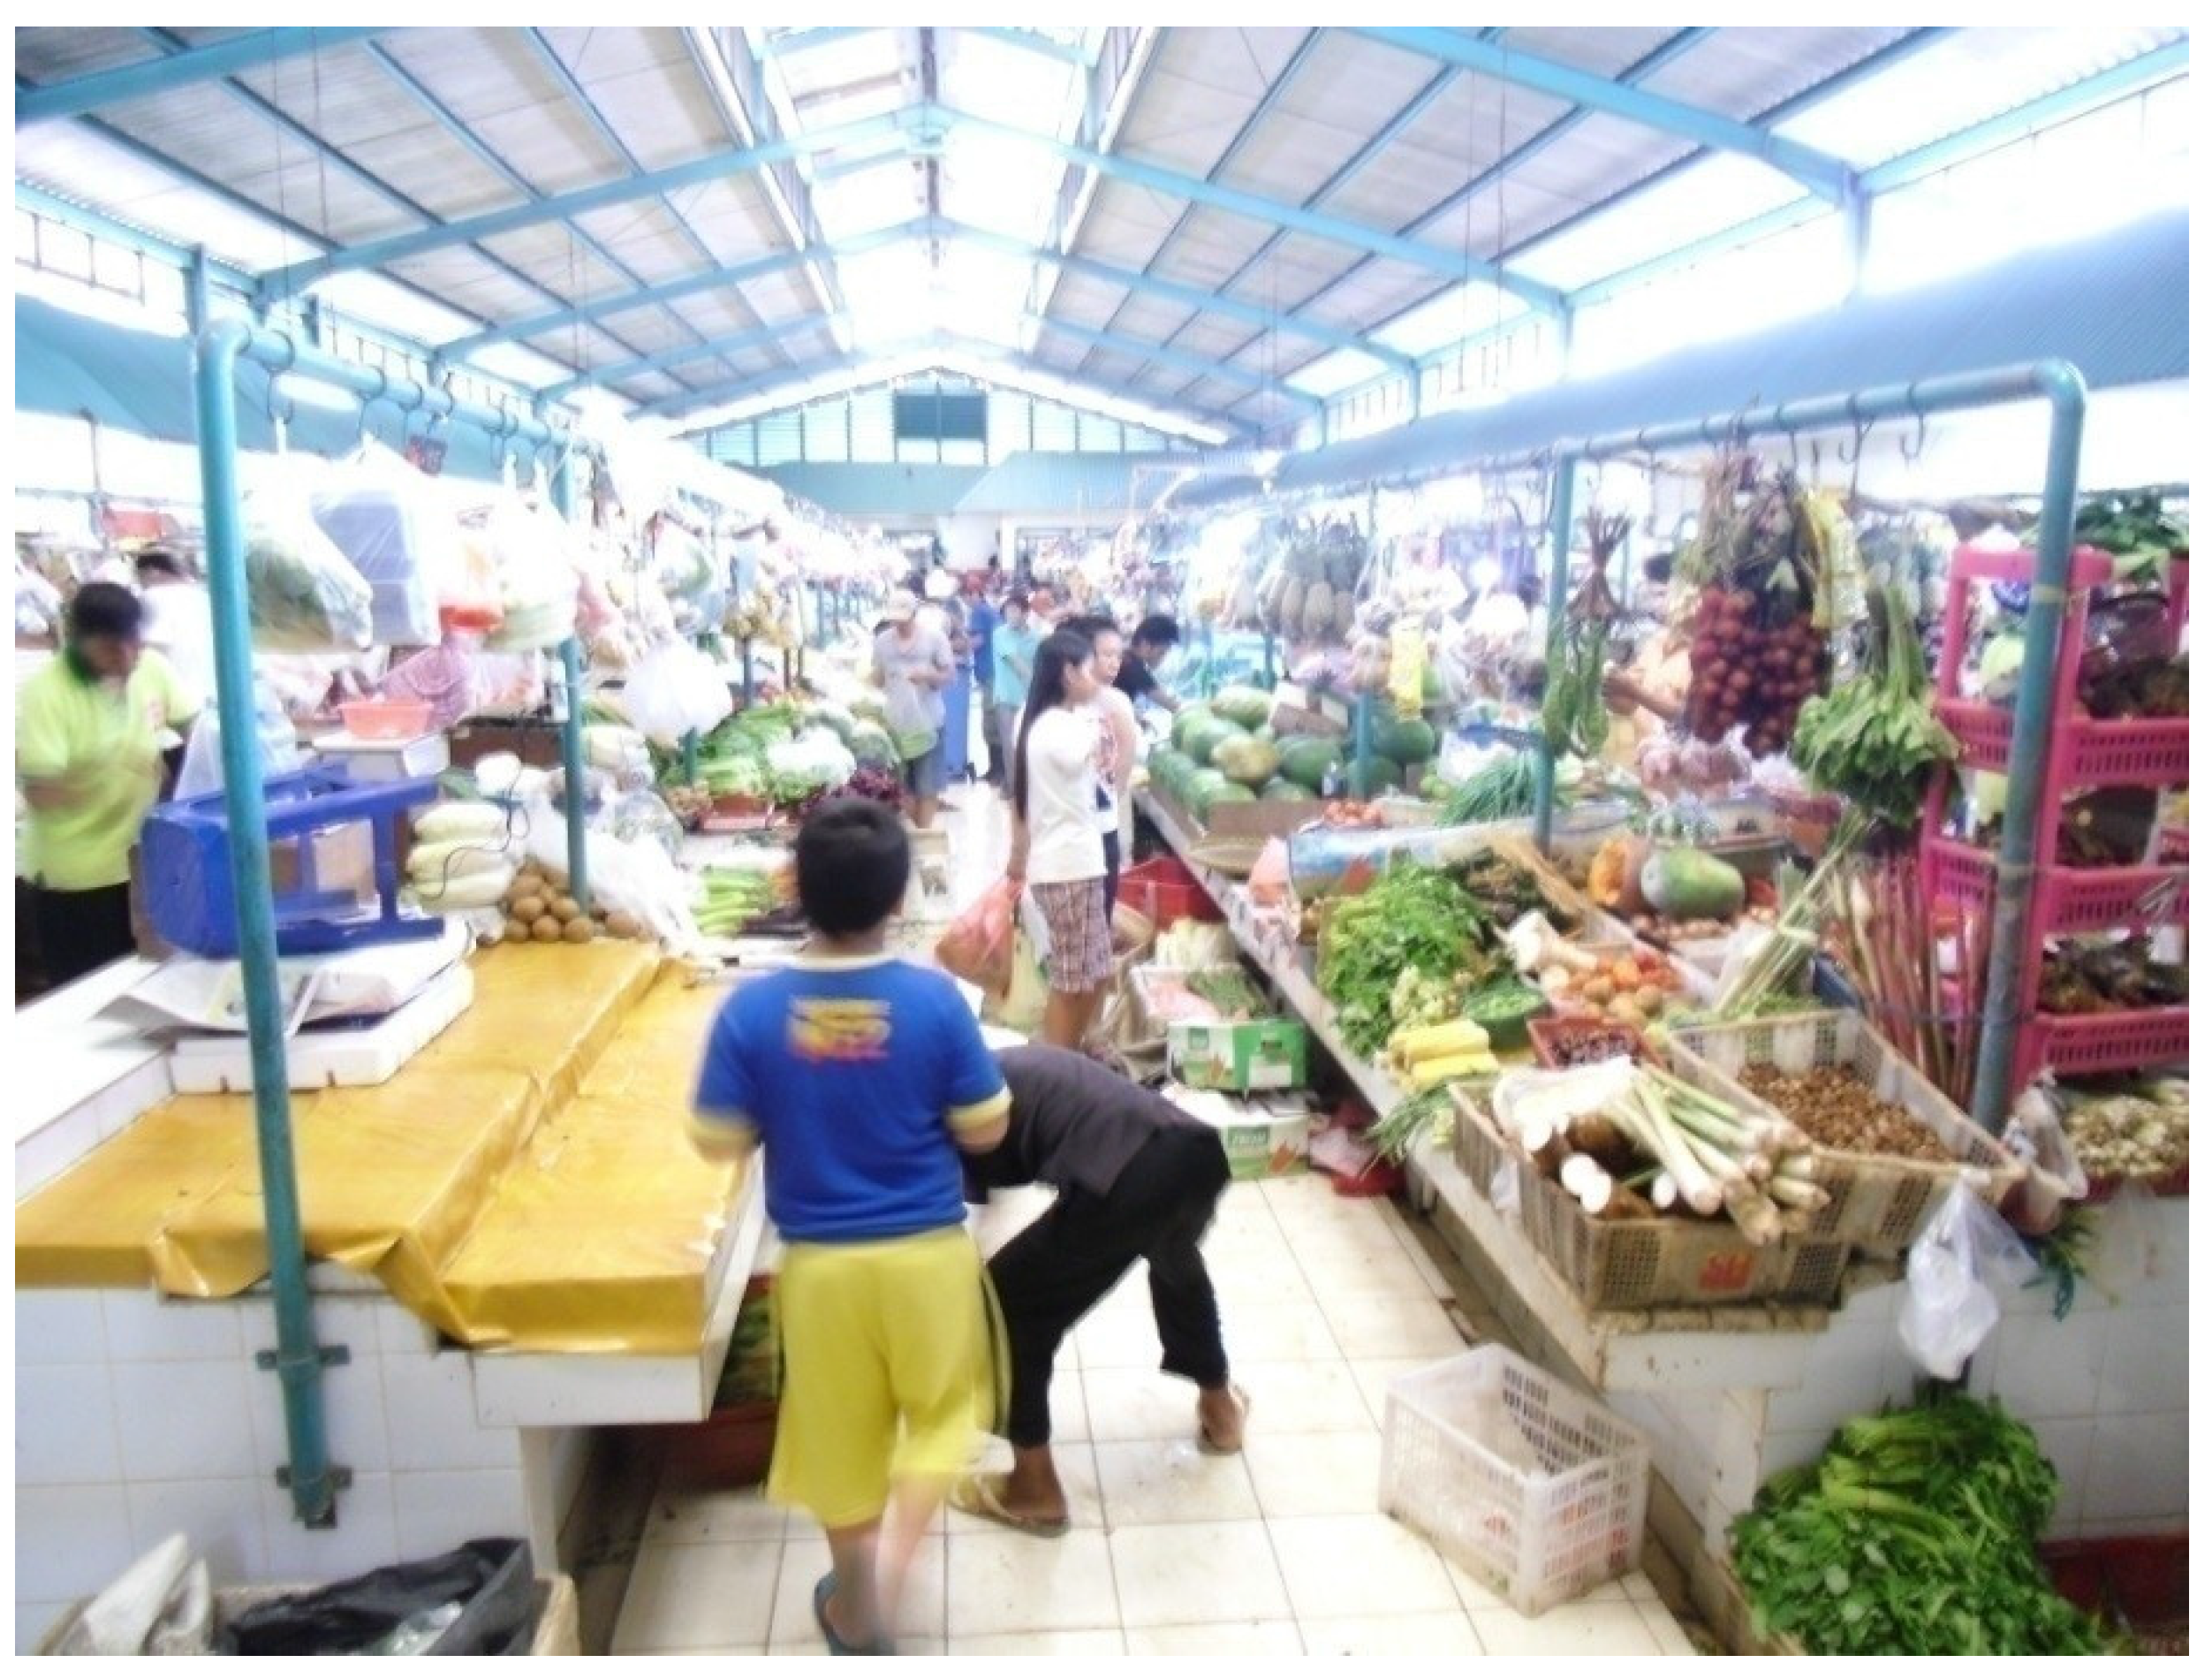
Figure 3 shows the interior of Puri Market. Puri Market was built in 1986 as the development of an old traditional market. This naturally ventilated building, with a floor size of 1200 m
2, is a single-story, roofed market. Significantly, it does not have addition ceilings underneath the roof, as it is commonly constructed in the warm and humid tropical building, to reduce the radiant heat from the roof to the room below. The height between the floor and the roof is between 5 and 6 m. An atrium is provided along the middle of the asbestos pitch roofs to facilitate natural light and ventilation, while windows are provided along the top of the brick walls.
Figure 1.
The Jakarta Central Cathedral.
Figure 1.
The Jakarta Central Cathedral.
Figure 2.
The Bank Mandiri Museum in Jakarta.
Figure 2.
The Bank Mandiri Museum in Jakarta.
Figure 3.
The atmosphere of the Puri Market in Jakarta.
Figure 3.
The atmosphere of the Puri Market in Jakarta.
The basic reasons for comparing these three buildings are, firstly, they are all naturally ventilated; secondly, they are public buildings, which are used by non-regular occupants. The buildings’ occupants use the buildings occasionally, not regularly as is the case for offices, schools and residential buildings. Thirdly, the buildings are used for different types of activities, and the occupants wear slightly different clothing insulations. The question is whether subjects participating in the comfort study of the three buildings would have different comfort temperatures.
All three of these buildings are located in the capital city of Jakarta. This city is located at 6° south latitude, possessing a warm and humid tropical climate, and it has two main seasons throughout the year: a dry and rainy season. The diurnal and annual climatic variations in this city are very small as happens in almost all areas in this type of climate. The difference between average daily maximum and minimum is less than 10 °C [
3]. The hottest times are between 2 p.m. and 3 p.m., while the coolest hours are in the early morning, between 3 a.m. and 4 a.m. The monthly average outdoor temperature and daily temperatures are about the same throughout the year, 28 to 28.5 °C
Ta, although it would be slightly lower (by about 1 to 2 °C) in the rainy season [
4].
A number of thermal comfort studies, which have been carried out in a tropical climate, showed that subject comfort temperatures in naturally ventilated (NV) buildings were higher than in air conditioned (AC) buildings. In a warm climate, people who have been exposed to NV buildings, with higher indoor temperatures than in AC buildings, tend to be comfortable at a higher temperature than those who have been long-exposed to the lower indoor temperature. A comfort study done by Busch in Bangkok, Thailand [
5] showed that subjects in NV buildings were comfortable at a 28.5
°C effective temperature (
ET, a combined effect of air temperature, humidity and air velocity), which was higher than the subjects in AC buildings, who were comfortable at a 24.5
°C
ET. Another study by de Dear
et al. in Singapore [
6] showed that subjects in NV buildings were comfortable at 28.5
°C operative temperature (
To, a combined effect of air temperature, meant radiant temperature and air velocity), while subjects in AC buildings were comfortable at a lower temperature of 24.2
°C
To.
A thermal comfort study done by Yang and Zhang [
7] showed that subjects in NV buildings felt comfortable at 28.3 °C, while those in AC buildings were comfortable at 27.7 °C, which is 0.6 °C lower. Another comfort study done by De Vecchi
et al. [
8] showed that subjects exposed to AC were more intolerant to higher temperatures compared to those who were unexposed. This could suggest that, after being exposed to AC, with a lower temperature, people tend to be comfortable in a lower temperature than those who are not exposed to AC.
In many cases, it was found that, to some extent, the higher the average running temperature experienced by a person, the higher the comfort temperature would be for this person [
9]. Some thermal comfort studies show that comfort temperature is affected by the average running temperature that a person experiences [
10]. Ballantyne’s studies [
11] in Port Moresby, showed that the local tropical people, who had long been exposed to the hot tropical environment, were comfortable at 26.7 °C
Ta, while their fellow Caucasians were comfortable at a lower air temperature of 25 °C
Ta.
Karyono’s study [
12] showed that, on average, comfort temperatures of people in the South-East Asia region were higher than those who live in temperate regions. The long bodily exposure to the high temperatures in the tropics tends to raise the comfort temperatures of the people in these regions, which could be due to bodily adaptation.
The new adaptive American Society of Heating, Refrigerating and Air-Conditioning Engineers (ASHRAE) thermal comfort standard developed by de Dear and Brager, based on the reanalyzing data on thermal comfort studies around the world [
13,
14], shows that comfort temperatures tend to have a correlation with the average monthly temperature at any given location. People living in a higher ambient temperature tend to have a higher comfort temperature than those who live in a lower ambient temperature. Some studies by Humphreys and Nicol [
15] showed that there is a correlation between comfort temperature and the mean outdoor temperature. Humphreys [
16] derived the linear relationship between comfort temperature and mean outdoor temperature for NV buildings as:
where
Tc is the comfort temperature and
To is the mean outdoor temperature. This equation shows that a higher mean outdoor temperature would result in a higher comfort temperature of the people at any given location.
The Japanese government recommends an indoor temperature setting of 28 °C in the hot and humid summer season [
17], which seems very high for people who have adjusted to a low ambient temperature, such as the Japanese.
Although common thermal comfort studies take into account all four physical variables (air temperature,
Ta, radiant or globe temperature,
Tr, air velocity,
Va, and relative humidity,
RH), which are responsible for the thermal sensation, in this study the interest was focused only on
Ta,
Tr,
Va and
RH. This was mainly due to the impossibility to place a globe thermometer in the investigated buildings. Moreover, the SNI 6390:2011 Indonesian Standard states that the designed comfort temperature in a work place is 25.5 °C
Ta with the range of +1.5 °C
Ta, and relative humidity of 60% + 5% [
18].
2. Methodology
There were 219 subjects, consisting of 94 males and 125 females, who participated in this study in the three different NV buildings. In this study, subjects were asked to give their thermal sensations votes (TSVs) based on the ASHRAE seven-point thermal sensation scale [
19]: Cold (−3), Cool (−2), Slightly cool (−1), Neutral (0), Slightly warm (+1), Warm (+2) and Hot (+3), and at the same time, three climatic parameters were recorded: air temperature (
Ta), relative humidity (
RH) and air velocity (
Va). The globe (radiant) temperature was not recorded since bringing this device into the cathedral was not allowed, and it was also not easy to carry this device in crowded environments, such as museum and market.
With this kind of situation, simple climatic parameter measurements were conducted by using smaller-sized equipment: An alcohol thermometer, a digital thermo-hygrometer, and an anemometer. The air temperature was recorded using an alcohol thermometer (resolution 0.1 °C), while the relative humidity (RH) was recorded with a digital thermo-hygrometer (resolution 0.1%), and the air movement was measured using a digital anemometer (resolution 0.01 m/s). Except for the anemometer, the alcohol thermometer and the thermo-hygrometer were checked for calibration by using similar equipment.
Since the researchers were only allowed to bring small equipment to the locations, the placement of the equipment during the measurements very much depended on to the availability of a stable support in the investigated locations. In the cathedral, the equipment was placed on benches, about 0.60 m above the floor, as all the subjects were seated, while in the museum and market, the equipment was placed on benches, about 0.60 m above the floor, for seated subjects, and on a table, about 0.80 m above the floor for standing subjects.
The method used to place the probes on a stable support may not be in complete compliance with ISO 7726 [
20], which requires 0.10 m, 0.60 m and 1.10 m for a seated person, 0.10 m, 1.10 m and 1.70 m for a standing person. However, with such limitations, and, moreover, a number of subjects who participated in this study were relatively short (about 150 cm) (
Table 1), the placement of the equipment at about 80 cm above the floor for standing subjects might be acceptable to some extent.
Measurements were taken as naturally as possible, without disturbing too much of the subjects’ activities. Subjects were asked regarding their age, whether they were under or over 40 years old. In the museum and cathedral, subjects were asked about their height, while, in the market, subjects were asked whether they were under or over 150 cm. All subjects involved in these buildings were asked to indicate their weight. All the measurements took place within a few days, in March and April 2014, between 10 a.m. and 4 p.m. All the measurements were performed naturally, and only people who were willing to participate voluntarily in this study were asked to be involved. Based on the time limitations given by the building managers, and the willingness of subjects to participate in this study, 70, 77 and 72 subjects participated in the cathedral, museum, and market, respectively.
3. Data and Analyses
3.1. Data of Subjects
Most of the subjects in all of the buildings were only available to be interviewed when they were at rest, and not conducting their activities in the buildings. At the cathedral, all of the subjects were seated, relaxing during the interview. In the museum and market, most of the subjects were also seated during the interview and only few of them were standing, at rest. In the cathedral, the metabolic rate of all the subjects was estimated to be 1 met (58 W/m
2, seated, relaxed), while in the museum and market the metabolic rate of the subjects was estimated between 1 met (seated, relaxed) and 1.2 met (70 W/m
2, standing, at rest) [
21,
22]. More subjects were interviewed in a standing position in the market than in the museum.
As a matter of culture, the people attending the cathedral and visiting the museum or the market were not alone, but, rather, with friends. In some cases, a single climatic measurement, such as the air temperature measurement, was not always taken for a single subject, but usually for more than one subject, simultaneously. Therefore, the number of climatic measurements would not necessarily be the same as the number of the subjects’ comfort votes. All the data were tabulated and analyzed by Microsoft Office Excel 2007, while the statistical tests were done with Statistical Package for the Social Sciences (SPSS) version 17.
In the cathedral, there were 70 subjects, consisting of 35 males and 35 females, who participated in this study. In the museum, there were 77 subjects, consisting of 36 males and 41 females, involved as subjects in this study, while, in the market, 72 people, consisting of 32 males and 30 females, participated in this study.
Table 1 shows the statistical data of subjects who participated in this study. In the cathedral, 40 subjects were under 40 years old and 30 subjects were over 40 years of age. In terms of height, the shortest subject was 155 cm and the tallest was 180 cm, with an average of 165.2 cm and a standard deviation (SD) of 6.8 cm. Subjects’ weights were between 46 and 79 kg, with an average of 58.9 kg and a SD of 7.3 kg. The estimated clothing insulation of the subjects was between 0.36 and 0.54 clo (1 clo = 0.155 K·m
2/W).
In the museum, 70 subjects were under 40 years old and 7 subjects were over 40 years of age. In terms of height, the shortest subject was 150 cm and the tallest was 172 cm, with an average of 166 cm and a SD of 4.9 cm. Subjects’ weights were between 40 and 88 kg, with an average of 62.3 kg and a SD of 15.9 kg. The estimated clothing insulation of the subjects was between 0.29 and 0.54 clo.
In the market, 28 subjects were under 40 years old and 49 subjects were over 40 years of age. In terms of height, 64 subjects were under 150 cm and 8 subjects were over 150 cm. In terms of weight, the subjects’ weights were between 45 and 85 kg, with an average of 59.1 kg and a SD of 8.9 kg. The estimated clothing insulation of the subjects was between 0.29 and 0.67 clo.
Table 1.
Statistical data of the subjects in the three naturally ventilated (NV) buildings.
Table 1.
Statistical data of the subjects in the three naturally ventilated (NV) buildings.
| Building | Statistical Parameter | Height (cm) | Weight (kg) | Age | Estimated Clothing Value (clo) |
|---|
| <40 year | ≥40 year |
|---|
| Cathedral | n | 70 | 70 | – | – | – |
| Min | 155 | 46 | – | – | – |
| Mean | 165.2 | 58.9 | 40 subjects | 30 subjects | 0.36–0.54 |
| Max | 180 | 79 | – | – | – |
| SD | 6.76 | 7.3 | – | – | – |
| Museum | n | 77 | 77 | – | – | – |
| Min | 150 | 40 | – | – | – |
| Mean | 166 | 62.3 | 70 subjects | 7 subjects | 0.29−0.54 |
| Max | 172 | 88 | – | – | – |
| SD | 4.9 | 15.9 | – | – | – |
| Market | n | 72 | 72 | – | – | – |
| Min | 64 subjects lower than 150 cm | 45 | – | – | 0.29–0.67 |
| Mean | 8 subjects higher than or the same as 150 cm | 59.1 | 28 subjects | 49 subjects | – |
| Max | – | 85 | – | – | – |
| SD | – | 8.9 | – | – | – |
3.2. Data of Indoor Climatic Parameters and the Distribution of Subjects’ Thermal Sensation
Table 2 shows data of indoor climate, while
Table 3 shows the distribution of the thermal sensation vote (
TSV) in the three buildings.
In the cathedral, the measured indoor air temperatures were between 26.4 and 30.4 °C, with an average of 28.8 °C and a SD of 1.1 °C. The indoor RH ranged between 69% and 80%, with an average of 74.3% and a SD of 2.8%. The indoor air velocity was not measured, although it could be predicted to be very low. Subjects’ thermal votes were distributed in such a way that, out of 70 respondents, 12 respondents (71.1%) were neutral, 50 respondents (71.4%) voted in the warm and hot sides, and only 8 respondents (11.4%) were on the cool sides. This means that, on average, subjects felt uncomfortably warm.
In the museum, the measured indoor air temperatures were between 26.6 and 32.4 °C, with an average of 29.7 °C and a SD of 1.1 °C. The indoor RH ranged between 68% and 82%, with an average of 74.1% and a SD of 3.8%. Measured by an anemometer, the air velocity was between 0 and 0.5 m/s, with an average of 0.1 m/s and a SD of 0.1 m/s. Subjects’ thermal votes were distributed in such a way that, out of 77 respondents, 12 (15.6%) were neutral, 62 (80.5%) of respondents voted were on the warm and hot sides, and only 3 respondents (3.9%) were on the cool sides. This means that, on average, subjects felt uncomfortably warm.
In the market, the measured indoor air temperatures were between 27.8 and 34.7 °C, with an average of 32.2 °C and a SD of 2.5 °C. Due to practical reason, the indoor relative humidity and the air velocity were not measured in this building. Subjects’ thermal votes were distributed in such a way that, out of 72 subjects, 8 (10.4%) were neutral, 62 (80.5%) respondents voted on the warm and hot side, and only 2 votes (2.3%) were on the cool side. This means that, on average, subjects felt uncomfortably warm.
Table 2.
Data of indoor climatic parameters and thermal sensation vote (TSV).
Table 2.
Data of indoor climatic parameters and thermal sensation vote (TSV).
| Building | Statistical Parameter | Air Temperature (°C) | RH (%) | Air Velocity (m/s) |
|---|
| Cathedral | Min | 26.4 | 69 | Not measured |
| Mean | 28.8 | 74.3 |
| Max | 30.4 | 80 |
| SD | 1.13 | 2.8 |
| Museum | Min | 26.6 | 68 | 0 |
| Mean | 29.7 | 74.1 | 0.1 |
| Max | 32.4 | 82 | 0.5 |
| SD | 1.1 | 3.8 | 0.1 |
| Market | Min | 27.8 | Not measured | Not measured |
| Mean | 32.6 |
| Max | 34.7 |
| SD | 2.5 |
Table 3.
Climatic parameters and the distribution of TSV in the three buildings.
Table 3.
Climatic parameters and the distribution of TSV in the three buildings.
| Building | Thermal Sensation Vote (TSV) | No. of Subject |
|---|
| −3 Cold | −2 Cool | −1 Slightly Cool | 0 Neutral/Comfort | +1 Slightly Warm | +2 Warm | +3 Hot | Mean Vote |
|---|
| Cathedral | 0 | 3 | 5 | 12 | 22 | 19 | 9 | 1.1 | 70 |
| Museum | 0 | 0 | 3 | 12 | 31 | 21 | 10 | 1.3 | 77 |
| Market | 0 | 0 | 2 | 8 | 16 | 35 | 11 | 1.6 | 72 |
3.3. Neutral Temperature and Comfort Range
To find the neutral temperature and comfort range of subjects, linear regression analyses were conducted using Microsoft Office Excel 2007, while the statistical test was analyzed by SPSS version 17.
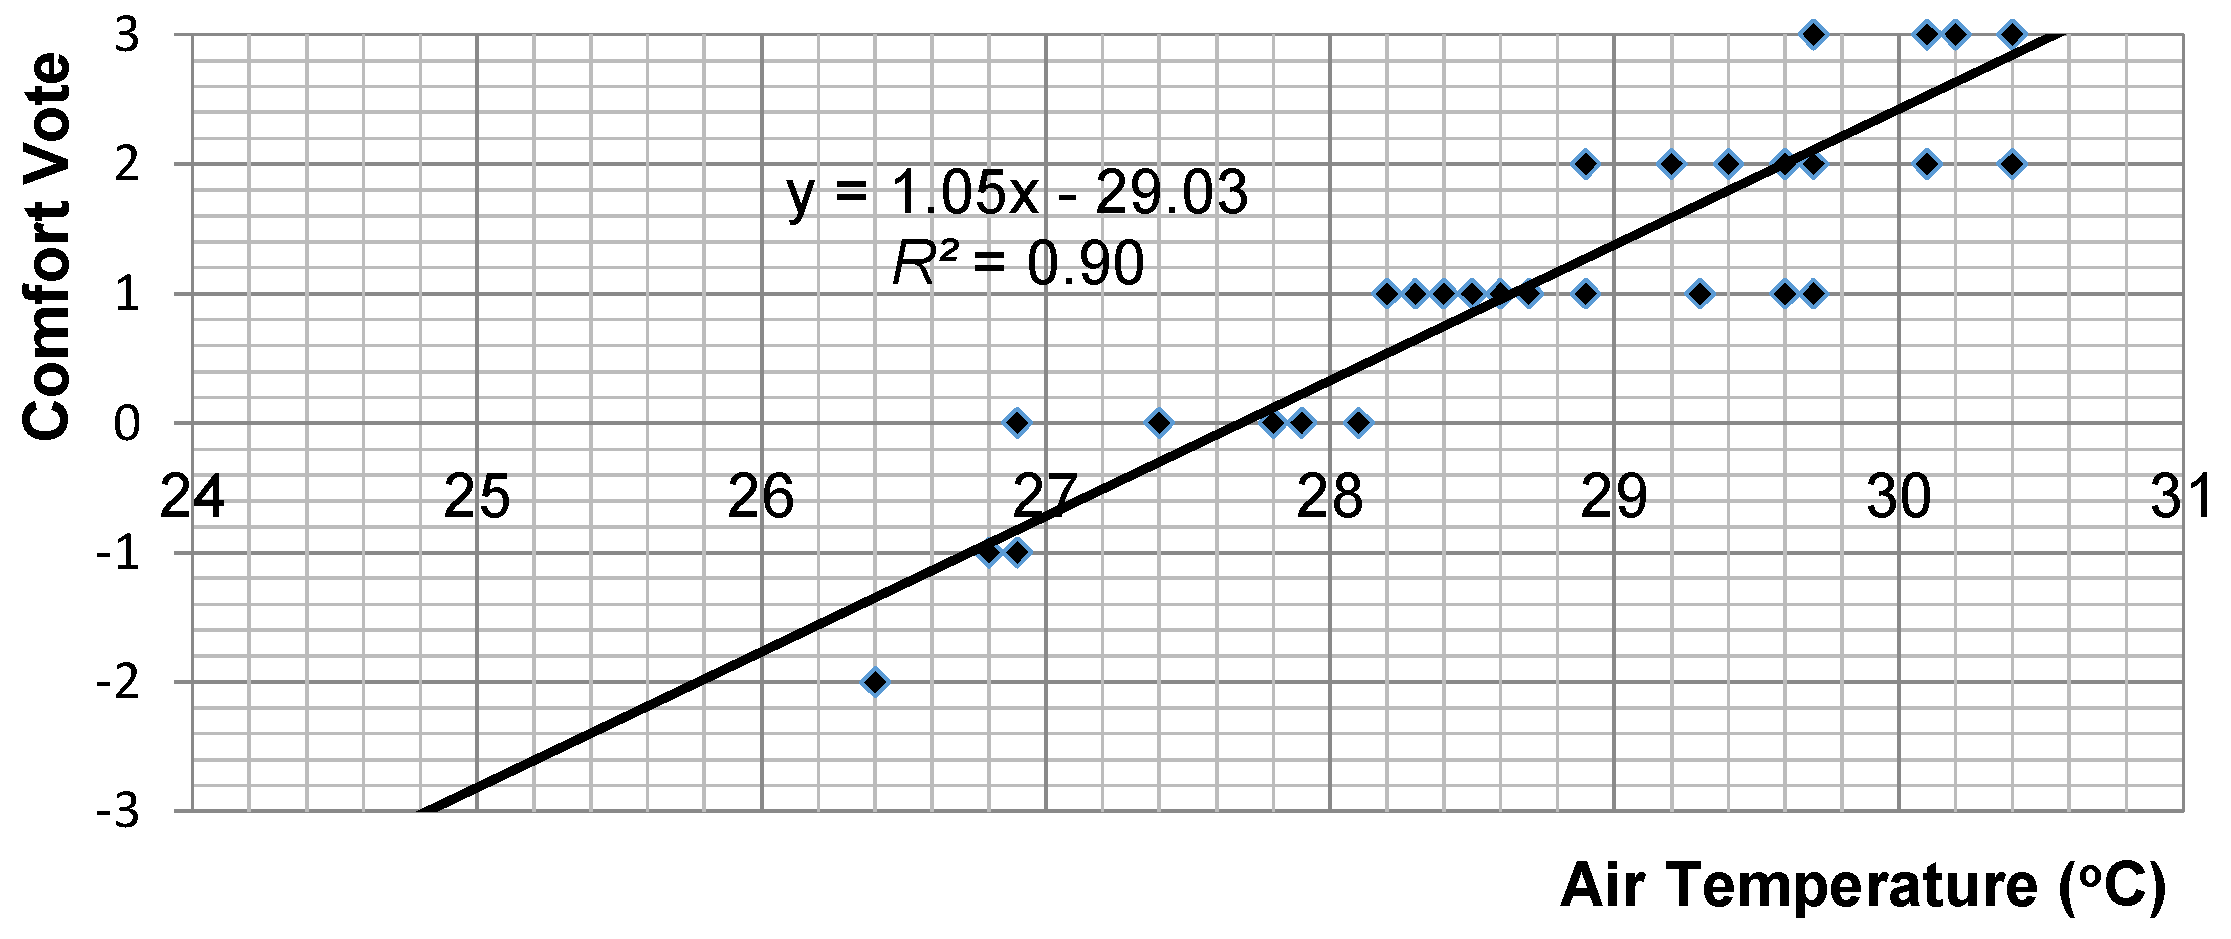
3.3.1. Neutral Temperature and Comfort Range of Subjects in the Cathedral
Figure 4 shows the regression line of thermal sensation votes (
TSV) on air temperature (
Ta) in the cathedral. This regression produces an equation of:
with a coefficient of determination (
R2) of 0.90, the correlation between
TSV and
Ta is significant at a 99% confidence level.
Figure 4.
Regression line of thermal sensation vote on air temperature in the cathedral.
Figure 4.
Regression line of thermal sensation vote on air temperature in the cathedral.
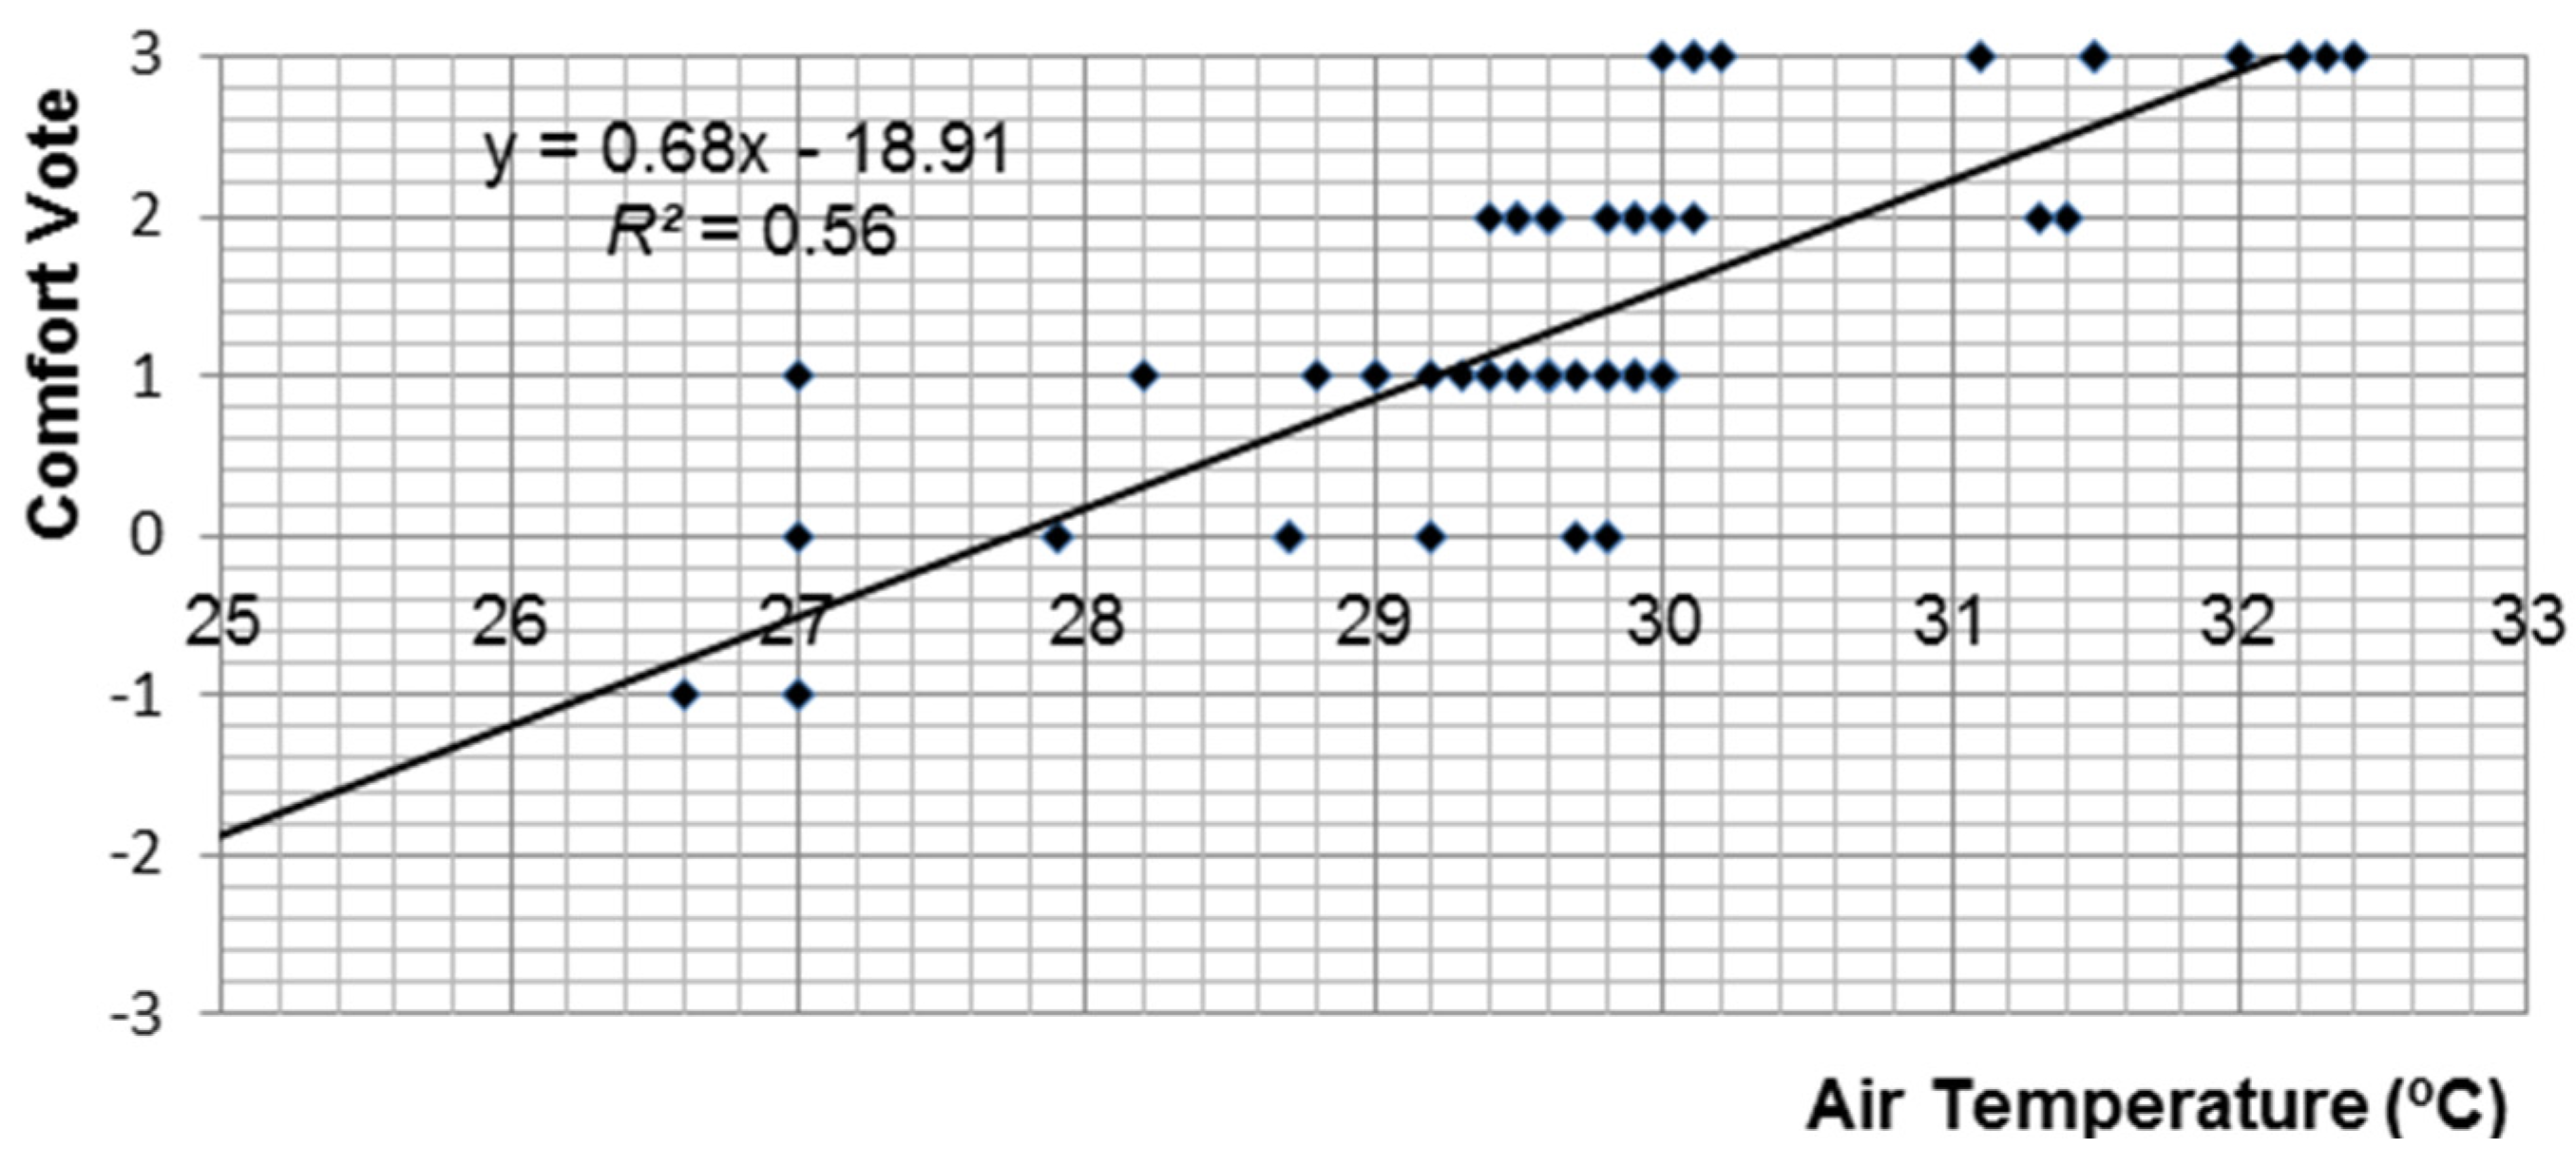
3.3.2. Neutral Temperature and Comfort Range of Subjects in the Museum
Figure 5 shows the regression line of thermal sensation votes (
TSV) on air temperature (
Ta) in the museum. This regression produces an equation of:
with a coefficient of determination (
R2) of 0.56, the correlation between
TSV and
Ta is significant at a 99% confidence level.
Figure 5.
Regression line of thermal sensation vote on air temperature in the museum.
Figure 5.
Regression line of thermal sensation vote on air temperature in the museum.
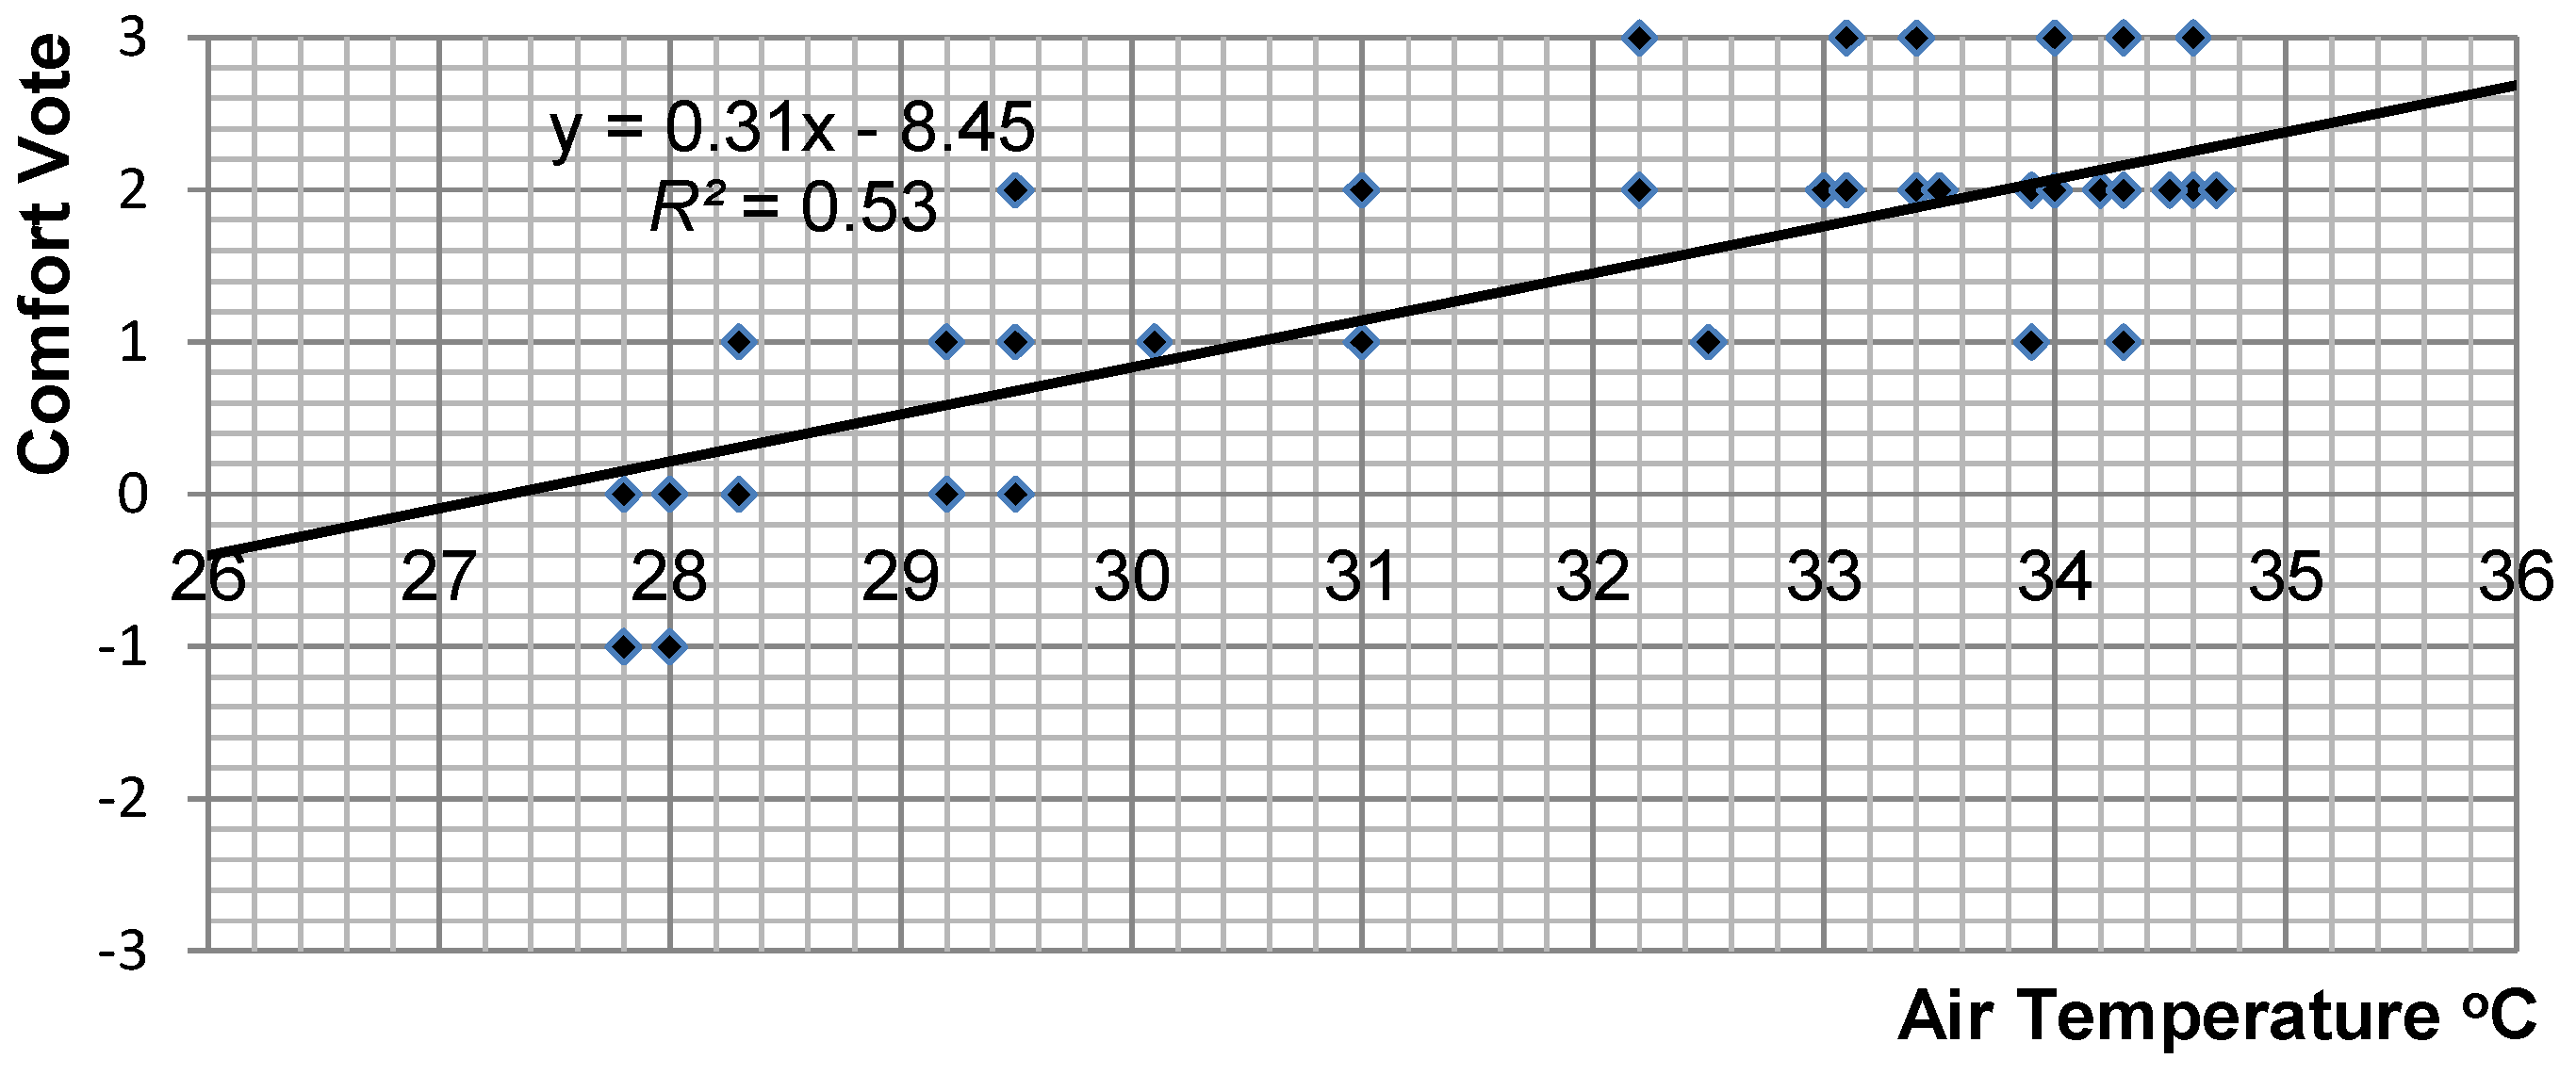
3.3.3. Neutral Temperature and Comfort Range of Subjects in the Market
Figure 6 shows the regression line of thermal sensation votes (
TSV) on air temperature (
Ta) in the market. This regression produces an equation of:
with a coefficient of determination (
R2) of 0.53, the correlation between
TSV and
Ta is significant at a 99% confidence level.
Figure 6.
Regression line of thermal sensation vote on air temperature in the market.
Figure 6.
Regression line of thermal sensation vote on air temperature in the market.
Table 4 shows the neutral (comfort) temperature (
Tn) and comfort range (
Tcr) of subjects in the cathedral, museum, and market. The comfort temperature was calculated based on 95% of subjects’ satisfaction with the thermal environment, while the comfort range was based on 90% of subjects’ satisfaction with the thermal environment.
Table 4.
Neutral temperature (Tn) and comfort range (Tcr) in terms of air temperature.
Table 4.
Neutral temperature (Tn) and comfort range (Tcr) in terms of air temperature.
| Building | Tn (°C, ±95% Comfortable) | Tcr (°C, ±90% Comfortable) | Regression Equation | Coefficient of Determination/Correlation (R2/r) | Significance |
|---|
| Cathedral | 27.7 | 27.2–28.2 | TSV = 1.048Ta – 29.02 | 0.90/0.95 | p < 0.01 |
| Museum | 27.7 | 27–28.4 | TSV = 0.682Ta – 18.90 | 0.56/0.75 | p < 0.01 |
| Market | 27.3 | 25.7–29.7 | TSV = 0.309Ta – 8.45 | 0.53/0.73 | p < 0.01 |
In the cathedral, subjects’ comfort temperature was 27.7 °C Ta, while the Tcr was 27.2–28.2 °C Ta. In the museum, subjects’ comfort temperature was 27.7 °C Ta, while Tcr was 27–28.4 °C Ta, while, in the market, subjects’ comfort temperature was 27.3 °C Ta, while Tcr was 25.7–29.7 °C Ta.
As can be seen from
Table 4, the coefficient of determination (
R2) in the cathedral was 0.90, or the coefficient of correlation (
r) of 0.95, while, in the museum, the coefficient of determination (
R2) was 0.56 or the coefficient of correlation (
r) was 0.75, and, in the market, the coefficient of determination (
R2) was 0.53 or the coefficient of correlation (
r) was 0.73.
In a number of comfort studies in NV buildings, the coefficient of determination (
R2) has usually been quite low, such as in a study by Rijal [
17] in Japan, in which the
R2 of most of the studies were less than 0.5, and by Feriadi [
23] in Indonesia, where
R2 were less than 0.2. However, in this study, the coefficients of determination (
R2) in all three buildings were relatively high, higher than 0.52 compared to some of the previous comfort studies in NV buildings.
Table 5 shows a comparison of comfort temperatures based on some previous comfort studies done in southeast Asian countries, which are expressed in air temperature (
Ta). The comfort temperatures shown in
Table 5 are a mix of studies in NV and AC buildings, as some studies did not distinguish between subjects in NV and AC buildings. However, the table shows that, within a long period of time, between 1937 and 2014, people in the humid tropical region of Southeast Asian countries tend to be comfortable at the air temperature of between 24.1 °C and 30 °C
Ta, whether they are in NV or AC buildings.
These figures show that people who live in this hot tropical region were more comfortable at a higher temperature than those who live in a colder climate, who could be comfortable at temperatures lower than 24 °C
Ta. The mean monthly temperatures of the locations in which the studies took place were between 24 °C
Ta (Bandung) and 30.5 °C
Ta (Port Moresby). In line with Humphreys [
16], that comfort temperature tends to have a correlation with the mean outdoor temperature, people who live in a tropical climate tend to be comfortable at a higher comfort temperature than those who live in temperate or cold climates.
Table 5.
Subjects comfort temperature in some previous comfort studies in Southeast Asian countries expressed in air temperature (Ta).
Table 5.
Subjects comfort temperature in some previous comfort studies in Southeast Asian countries expressed in air temperature (Ta).
| No. | Year of Study | Principal Researcher | Location | Type of Building | Data Collection Technique | Type of Subject | No. of Subject | No. of Comfort Vote | Mean Monthly Temperature (°C Ta) | Comfort Temperature (°C Ta) |
|---|
| 1 | 1937 | Mom [24] | Bandung, Indonesia | Climate Chamber | Transverse | University members | 20 | 20 | 24 | 26.0 |
| 3 | 1952 | Ellis [25] | Singapore | Ship | Longitudinal | Ship’s crews, seamen | - | 5211 | 28 | 30 |
| 4 | 1953 | Ellis [26] | Singapore | House, Office | Longitudinal | Students, naval officers and wives | 118 | 5797 | 28 | 24.5–27.8 |
| 5 | 1967 | Ballantyne [27] | Port Moresby | House | Transverse | Expatriates | 34 | 1992 | 30.5 | 25.0 |
| 6 | 1979 | Ballantyne [11] | Port Moresby | House | Transverse | Local people | 64 | 113 | 30.5 | 26.7 |
| Expatriate | 28 | 64 | 25 |
| 7 | 1990 | de Dear [28] | Singapore 1 | Climate Chamber | Longitudinal | Students | 32 | - | 28 | 25.4 |
| 8 | 1990 | de Dear [29] | Singapore 2 | Climate Chamber | Longitudinal | Students | 98 | 980 | 28 | 27.6–27.9 |
| 9 | 1993 | Karyono [30] | South Jakarta | Offices | Transverse | Office workers | 596 | 596 | 28 | 26.4 |
| 10 | 2005–2006 | Karyono [31] | Bandung, Indonesia | Classroom | Longitudinal | Students | 20 | 200 | 24 | 24.7 |
| 11 | 2013 | Karyono [32] | West Jakarta | Classroom | Longitudinal | Students | 54 | 468 | 28 | 24.1 |
| 12 | 2013 | Karyono [32] | South Jakarta | Classroom | Longitudinal | Students | 36 | 432 | 28 | 24.9 |
4. Discussion
Having comfort temperatures at about 27 °C in all the buildings, there were slightly some variations of comfort ranges. The comfort range of subjects in the cathedral seemed quite narrow, which was 1.0 °C (27.2–28.2 °C). It was found to be slightly wider in the museum, that is, 1.4 °C (27.0–28.4 °C), and much wider in the market, at 4 °C (25.7–29.7 °C). The wider subject comfort range in the market is likely due to a wider range of subject clothing insulation, and also a more varied metabolic rate of the subjects in the market than in the museum and cathedral.
Subjects in the cathedral tended to wear similar clothing ensembles, which were slightly uniform, as the majority of the people who attend mass service are likely to wear formal clothes and to conduct similar activities. People visiting a museum or a market do not need to wear any particular type of clothes, such as those one might wear when they are going to the cathedral, and they would also conduct different activities, which lead to different metabolic rates. As the clothing ensembles, thus, the thermal insulations were varied, and the activities being conducted were also varied, the effect of the changes of temperatures on people would be varied as well, and this is likely to result in the widest comfort range of the subjects.
The clothing insulation values of subjects in the cathedral were between 0.36 and 0.54 clo (
Table 1) and the subjects’ metabolic rate was 1 met (seated, relaxed). While, in the museum and market, the estimated clothing insulation values were 0.29–0.54 clo and 0.29–0.67 clo, respectively, and the metabolic rates of the subjects in these two buildings were between 1 and 1.2 met (seated, relaxed, and standing, at rest).
All of the subjects in the cathedral were seated and relaxed, with an estimated metabolic rate of 1 met, while, in the museum and the market, some subjects were standing and at rest, in addition to the majority who were seated and relaxed. More subjects were standing in the market than in the museum, thus, the average metabolic rate of subjects in the market was slightly higher than in the museum.
The higher subject metabolic rate in the market is likely to affect a slightly lower subject’s comfort temperature in the market (27.3 °C) than comfort temperatures of subjects in the cathedral and museum (27.7 °C). While the wider range of clothing insulation values in the market (0.29–0.67 clo) tends to affect to the wider subjects’ comfort ranges in this building (25.7–29.7 °C) compared to cathedral (27.2–28.2 °C) and museum (27–28.4 °C).
The paired sample correlation between the cathedral and the museum was not significant; however, it was significant compared to the market (95% level of confidence). The t-test of samples between the cathedral and museum were not significant; however, it was significant with the market (95% level of confidence).
Comparing comfort temperatures of subjects in some previous studies in Southeast Asian countries (
Table 5), comfort temperatures of subjects in these three buildings (27.3 °C and 27.7 °C
Ta) were within the range of comfort temperature of subjects in previous studies (between 24.1 °C and 30 °C
Ta). Subjects’ comfort temperatures in this study were higher than comfort temperature of subjects in Bandung (24.7 °C), with a lower monthly average temperature than Jakarta, where this study took place.
The facts show that people living in higher ambient temperatures, such as those in Jakarta, would be comfortable at a higher temperature than those who live in a lower ambient temperature, such as those in Bandung.
Comfort studies done by Shahin in Iran [
33] showed that people were comfortable at 27 °C during the hot season, when the mean outdoor temperature was around 30.2 °C, and that they were comfortable at 21 °C during the cool season, when the mean outdoor temperature was 20.2 °C. A thermal comfort study done during the dry and rainy seasons, by Akande and Adebamowo, in Bauchi, Northern Nigeria (2009) [
34], found that, in the dry season, with a high outdoor temperature, people felt more comfortable at a higher temperature than in the rainy season with a low outdoor temperature. In the dry season, when the average outdoor temperature was 35.7 °C, subjects were comfortable at 28.4 °C, while during the rainy season, when the average outdoor temperature was 22.1 °C, subjects were comfortable at 25.4 °C. These two studies show some agreement with the thermal comfort studies in Indonesia, in which people tended to adapt to their ambient temperatures. The higher the ambient temperature, the higher the comfort temperature of the people would be.
5. Conclusions
The comfort temperature of subjects in the market (27.3 °C Ta) was slightly lower than in the cathedral and museum (27.7 °C Ta). The difference was about 0.4 °C and it is significant at a 95% level of confidence. Other than the variables, such as age, body build, and previous experience in an AC room, the lower comfort temperature of the subjects in the market, rather than the cathedral, is likely to be affected by the higher metabolic rates of subjects (1–1.2 met) compared to those in the cathedral (1 met). The difference in the clothing insulation values, where, in the market, they were estimated between 0.29 to 0.67 clo, and in the cathedral, where they were between 0.36 to 0.54 clo, is unlikely to affect the subjects’ comfort temperature in these two buildings.
The small differences in the subjects’ metabolic rates in the three buildings is unlikely affecting subjects’ comfort temperature in the cathedral and museum; however, it was affecting the subjects’ comfort temperature in the market, which was found to be lower than in the cathedral and market.
Furthermore, the small difference of the clothing insulation and the metabolic rate are likely to affect the width of the subjects’ comfort ranges in all three buildings. The more uniform the clothing insulation values, and the similarity of the metabolic rates of the subjects, the more narrow the subjects’ comfort ranges. Subjects in the cathedral, with an estimated clothing insulation value of 0.36–0.54 clo. and metabolic rate of 1 met (seated, relaxed), were found to have a narrow comfort range of 1 °C (27.2 °C to 28.2 °C Ta), while, in the museum, with an estimated clothing insulation value of 0.29–0.54 clo, and a metabolic rate of 1–1.2 met (seated, relaxed and standing, at rest), it was found that subjects’ comfort range was wider than in the cathedral, at 1.4 °C (27.0 °C to 28.4 °C Ta). In the market, with estimated clothing insulation values of 0.29–0.67 clo, and metabolic rates of 1–1.2 met (seated, relaxed and standing, at rest) it was found that the subjects’ comfort range in this building was even wider than in the cathedral and in the museum, at 4 °C (25.7 to 29.7 °C Ta).
Comfort temperatures of subjects in this study (27.3 °C, 27.7 °C and 27.7 °C Ta) were found to be higher than subjects’ comfort temperatures than in the previous comfort study in Bandung, Indonesia (24.7 °C Ta), which has a lower ambient temperature than Jakarta. It seems likely that the result of this study is supported by the idea that people in the warmer environments tend to be comfortable with higher temperatures than those in the lower temperatures. The comfort temperatures of the subjects in this study (27.7, 27.7 and 27.3 °C) are found to be within the range of comfort temperature, based on previous comfort studies carried out in the southeast Asian countries (between 24.1 °C and 30.0 °C Ta).


