Article

Configuration of Green Spaces for Urban Heat Island Mitigation and Future Building Energy Conservation in Hanoi Master Plan 2030

by
Andhang Rakhmat Trihamdani
1,*,
Han Soo Lee
2,
Tetsu Kubota
3,† and
Tran Thi Thu Phuong
4
1
Graduate School for International Development and Cooperation, Hiroshima University, 1-5-1 Kagamiyama, Higashi-Hiroshima, Hiroshima 739-8529, Japan
2
Graduate School of Science and Engineering, Saitama University, 255 Shimo-Okubo, Sakura-Ku, Saitama City, Saitama 338-8570, Japan
3
Graduate School for International Development and Cooperation, Hiroshima University, 1-5-1 Kagamiyama, Higashi-Hiroshima, Hiroshima 739-8529, Japan
4
Vietnam Institute for Urban and Rural Planning, 10 Hoa Lu Street, Hai Ba Trung District, Hanoi 112022, Vietnam
*
Author to whom correspondence should be addressed.
These authors contributed equally to this work.
Buildings 2015, 5(3), 933-947; https://doi.org/10.3390/buildings5030933
Submission received: 20 June 2015 / Revised: 6 August 2015 / Accepted: 11 August 2015 / Published: 20 August 2015

Abstract

:
The study aims to assess the urban heat island (UHI) effects in the city under the present land use conditions as well as those conditions proposed by the Hanoi Master Plan 2030 through numerical simulation, using Weather Research and Forecasting (WRF). Furthermore, this paper assesses additional land use scenarios with different spatial and green space configurations. The results show that the implementation of the master plan does not significantly affect the peak air temperature in the built-up areas (approximately 1 °C higher at the maximum). However, high temperature areas, with temperature of 40–41 °C, would expand widely over the new built-up areas. On the other hand, the nocturnal air temperature would increase by up to 2–3 °C over the newly expanded built-up areas. The number of hotspots increased further when the strategic green spaces in the master plan were not taken into account. However, the cooling effect of the strategic green spaces did not reach the existing city center sufficiently because the green spaces are located far from the city center. The large and centralized green spaces proposed in the master plan were seen to be insufficient to mitigate UHIs compared to the equally distributed green spaces. Moreover, the greater reduction of hotspot areas by up to 56.5% was seen when the mixed forest is employed as the land cover in the green spaces.

1. Introduction

The emerging economies in Southeast Asia are likely to see serious energy shortages, especially in terms of electricity, due to the recent economic growth. Most of the cities in this region have a hot and humid climate during the summer months, and the growing energy consumption caused by air-conditioning (AC) in buildings is, therefore, a major concern. Meanwhile, these cities are suspected of already experiencing urban heat islands (UHIs) as a result of rapid urbanization. Moreover, these cities tend to propose large-scale master plans and increase their urban population further. This would result in a dramatic change in land use and therefore the urban climate.
Increased urban temperatures have a significant impact on the energy consumption of buildings [1]. UHI negatively affects the indoor thermal environments during the summer months, and therefore encourages the occupants to use more AC to achieve their thermal comfort [2,3]. This situation will be aggravated by increasing demand of AC, thus leads to the further growth of CO2 release [4].
Various mitigation measures to minimize the impact of UHI have been proposed. Moriyama and Tanaka [5] divided the countermeasures for UHIs into two categories, which are those for the urban scale and for building scale, respectively. For the urban scale, the use of green spaces and cool sinks were suggested as the most effective techniques [2]. Maximizing the thermal benefits of the urban green spaces offers a solution for ameliorating the urban climate [6,7,8,9]. For the building scale, it was reported that the use of cool materials not only can decrease the ambient temperature, but also improve the thermal comfort and decrease cooling loads in buildings [10,11]. The cool materials are characterized by high solar reflectance and high infrared emittance. In addition to the traditional cool materials, the retroreflective materials, which have the ability to reflect the incident light back towards its source regardless of the direction of incidence, have recently been proposed [12].
In Hanoi, Vietnam, a long-term urban development plan, namely the Hanoi Master Plan 2030, was implemented in 2011 with the aim to develop the city to be a sustainable capital [13]. One of the key concepts of the master plan is the environmental protection through maintaining the natural environment that results in a series of green networks in the city, consisting of the green belts and the green buffers. Though various environmental issues had been considered in the master plan (e.g., air quality, water pollution, and noise pollution), this assessment does not take into account the impacts of this development on the urban climate of the city in the future. Moreover, the impacts of the mentioned green network on mitigating UHI has not been assessed scientifically in the master plan.
Therefore, the specific objective of this study is to investigate the UHI effects in Hanoi under the present land use condition as well as those conditions proposed in the master plan, focusing on the cooling effect of the proposed green network in the master plan. Furthermore, the new configurations of green network are proposed and the resulting impacts on UHI are also assessed. Numerical simulation, specifically meso-scale urban climate modelling using Weather Research and Forecasting (WRF) is performed for this purpose.

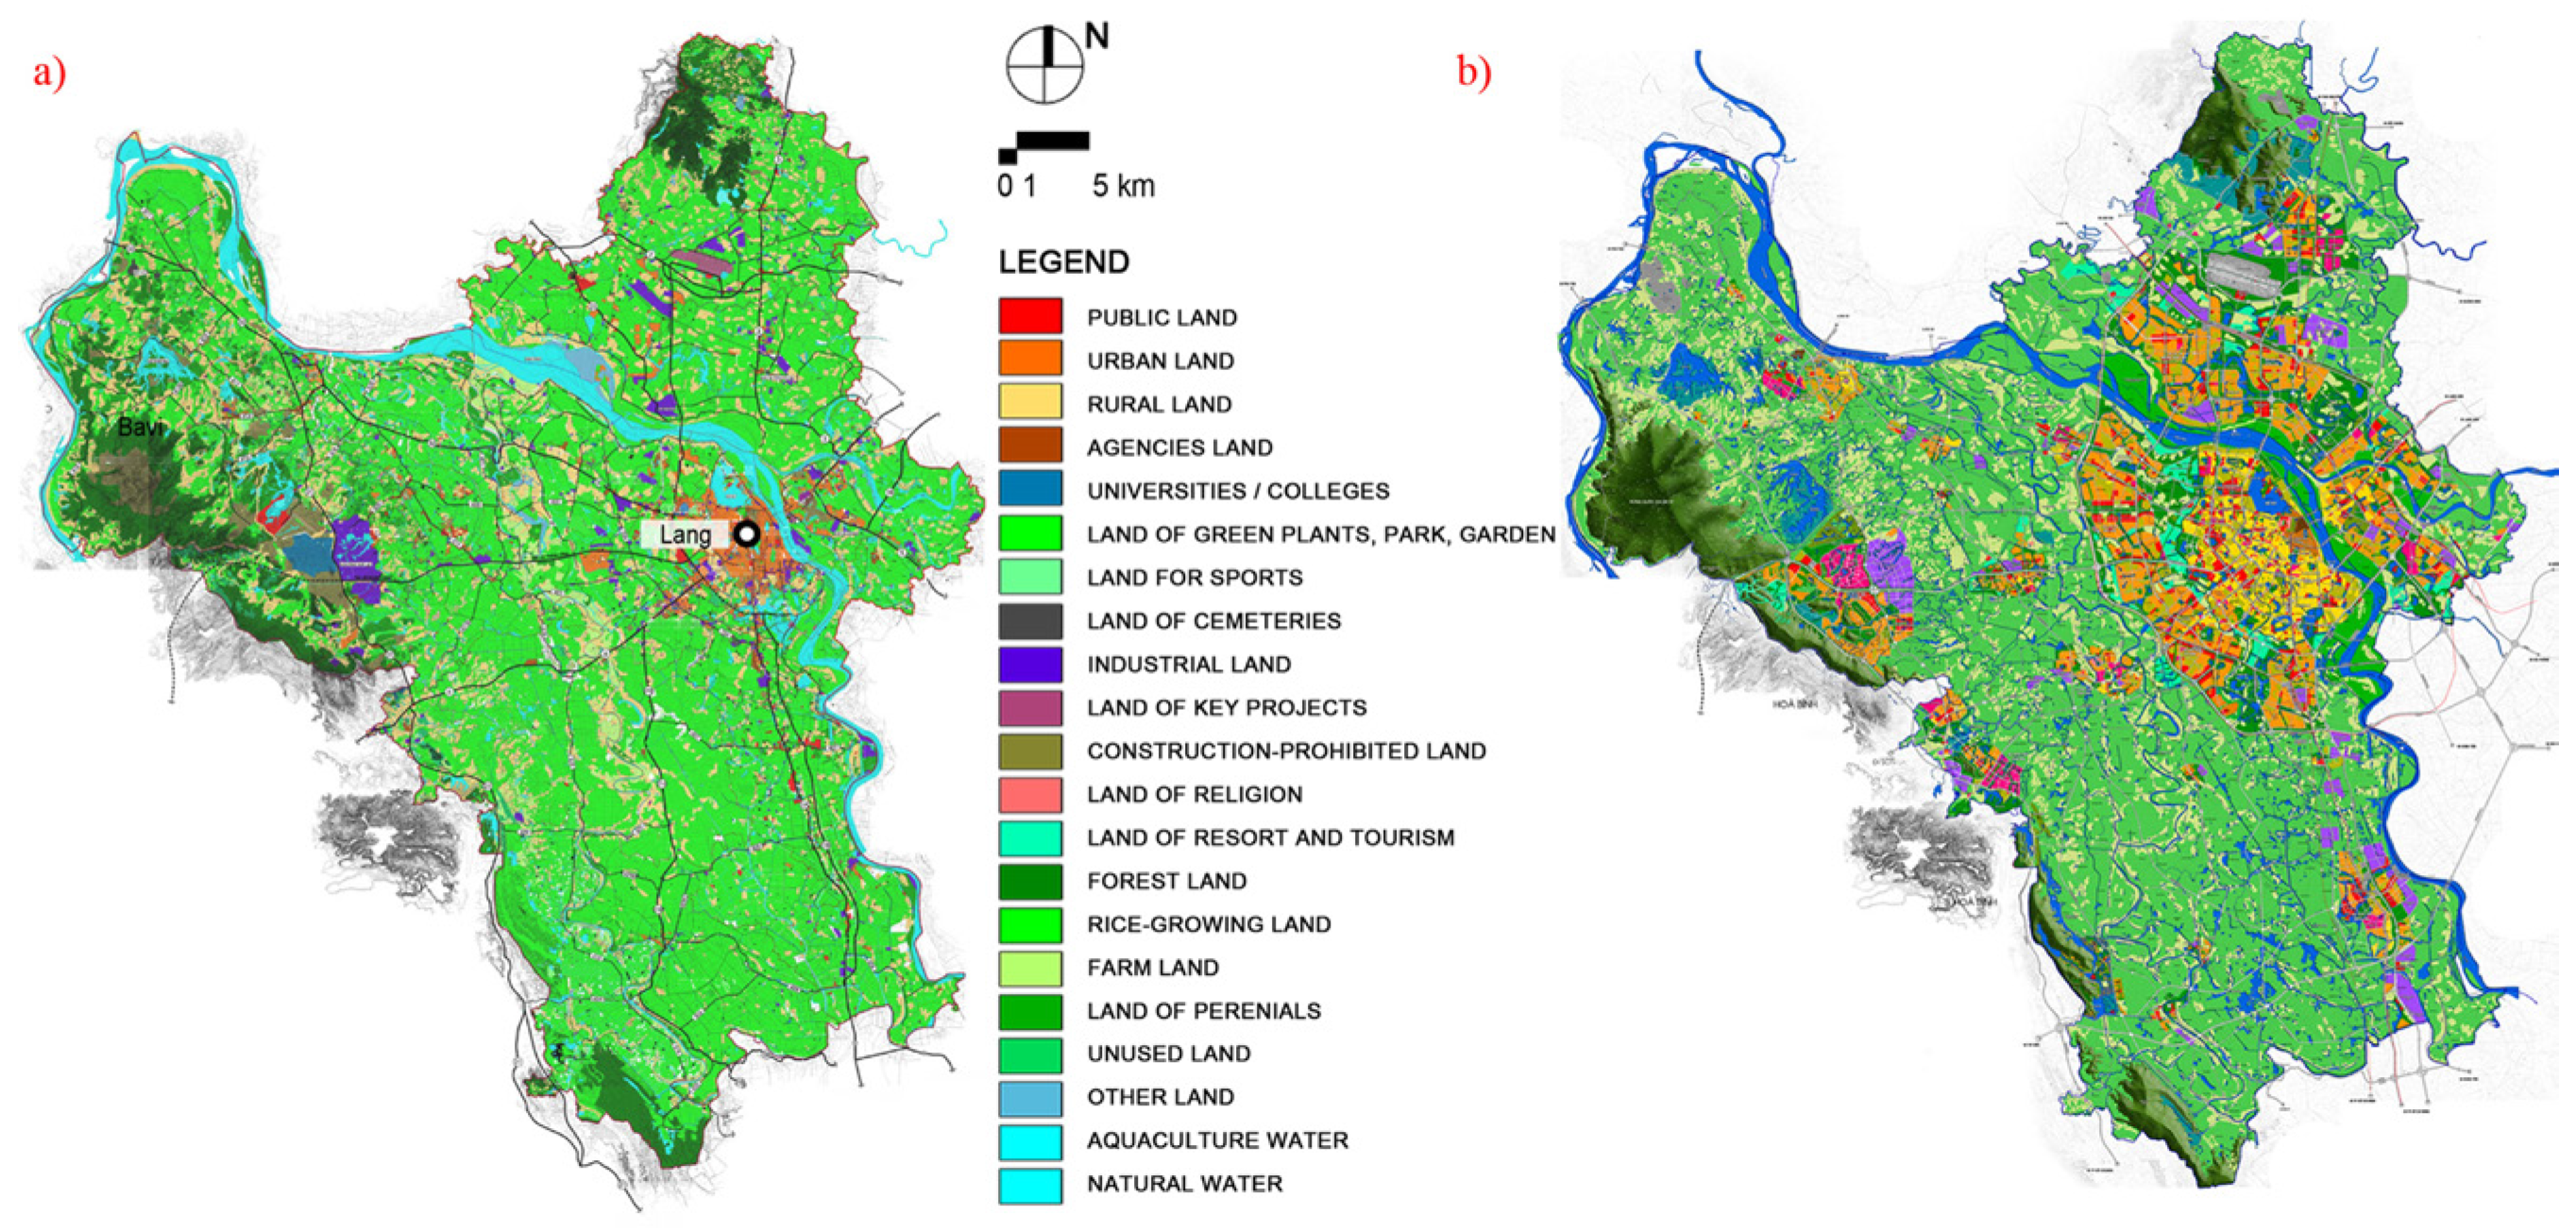
2. The Hanoi Master Plan 2030

The study area, the Hanoi City, located in the northern part of Vietnam is the second largest city of the country. This capital city experiences a tropical monsoon climate with two key seasons which are the hot season (April–October) and cold season (November–March). The southeast monsoon wind prevails during the hot season. The maximum monthly average air temperature was observed in June, which was about 30 °C, while the minimum average value of about 16.5 °C recorded in January [13,14]. The city covers an area of about 3300 km2. The city center is located in the delta area along the Red River, which is about 90 km inland from the coastal line [13].
The capital has become the important attraction for culture, education and economics. As the city grows, the Vietnam government officially implemented the Hanoi Master Plan 2030 in July 2011. In the master plan, the urban population of Hanoi is projected to increase from 6.4 million in 2010 to 9–9.2 million by 2030. The master plan is targeting to become the sustainable capital in the Asian region. In order to achieve that target, the master plan proposed a series of spatial development strategies for the capital city. One of them, as described before, is the environmental protection through the green network consisting of two major green spaces which are the green belts and the green buffers.
As a result, the proportion of green coverage in the master plan would account for about 52% of the total land of the city. Urban green area will reach 8% with the per capita public green area of 16 m2 by 2030. The urban green spaces in the master plan are significantly improved. This development of green space indicates a necessity to develop the effective configuration of green space to overcome the negative impacts of UHIs caused by the dramatic expansion of the city.
Figure 1 shows the land use changes before and after the implementation of the master plan. To meet the demands of expanding urban development, 28% of the natural land will be allocated for the urban construction land. In total, the constructed land will rise sharply by almost three times, from 46,340 ha (14%) to more than 129,500 ha (39%).
Figure 1. Land use and land cover for (a) the current status and (b) the Hanoi Master Plan 2030. Source: Vietnam Institute of Architecture, Urban and Rural Planning (VIAP), 2011.
Buildings 05 00933 g001

3. Methodology

3.1. Weather Research and Forecasting (WRF)

Meteorological modelling is performed to obtain basic weather elements such as air temperature, humidity and surface wind, using WRF [15]. The present study used WRF version 3.5, known as the Advanced Research WRF (ARW), which was developed by the National Center for Atmospheric Research (NCAR). This numerical model is fully compressible and non-hydrostatic form of the governing equations with physical processes such as cumulus scheme, microphysics, planetary boundary layer (PBL) processes and atmospheric radiation processes, incorporated into a number of physics parameterizations. The model has been applied to urban climate [16,17] and extreme weather studies [18,19]. Various researchers have also applied WRF to UHI case studies for evaluating the effects of different land covers [8,20].
The WRF simulations in this study adopt an interactive grid nesting with four domains that have horizontal resolutions of 27, 9, 3 and 1 km for domains 1, 2, 3 and 4, respectively (Figure 2a). The domain 4 covers the whole administrative boundary of the Hanoi City (Figure 2b). The vertical layer was set to be up to 30 sigma levels. The initial and lateral boundary conditions were imposed using 6 hourly National Centers for Environmental Prediction (NCEP) Final Analysis (FNL) Operational Global Analysis data with 1° × 1° latitude-longitude resolution [21]. Parameters include surface pressure, sea level pressure, geopotential height, temperature, sea surface temperature, soil values, ice cover, relative humidity, u- and v-winds, vertical motion, vorticity and ozone.
Figure 2. (a) Computational domains for the Weather Research and Forecasting (WRF) simulation. (b) Domain 4 covers all of Hanoi City (100 × 100 grid points), with 1 km resolution. The green strategy areas are indicated by colors. Green represents the green belts and red is for the green buffers.
Buildings 05 00933 g002

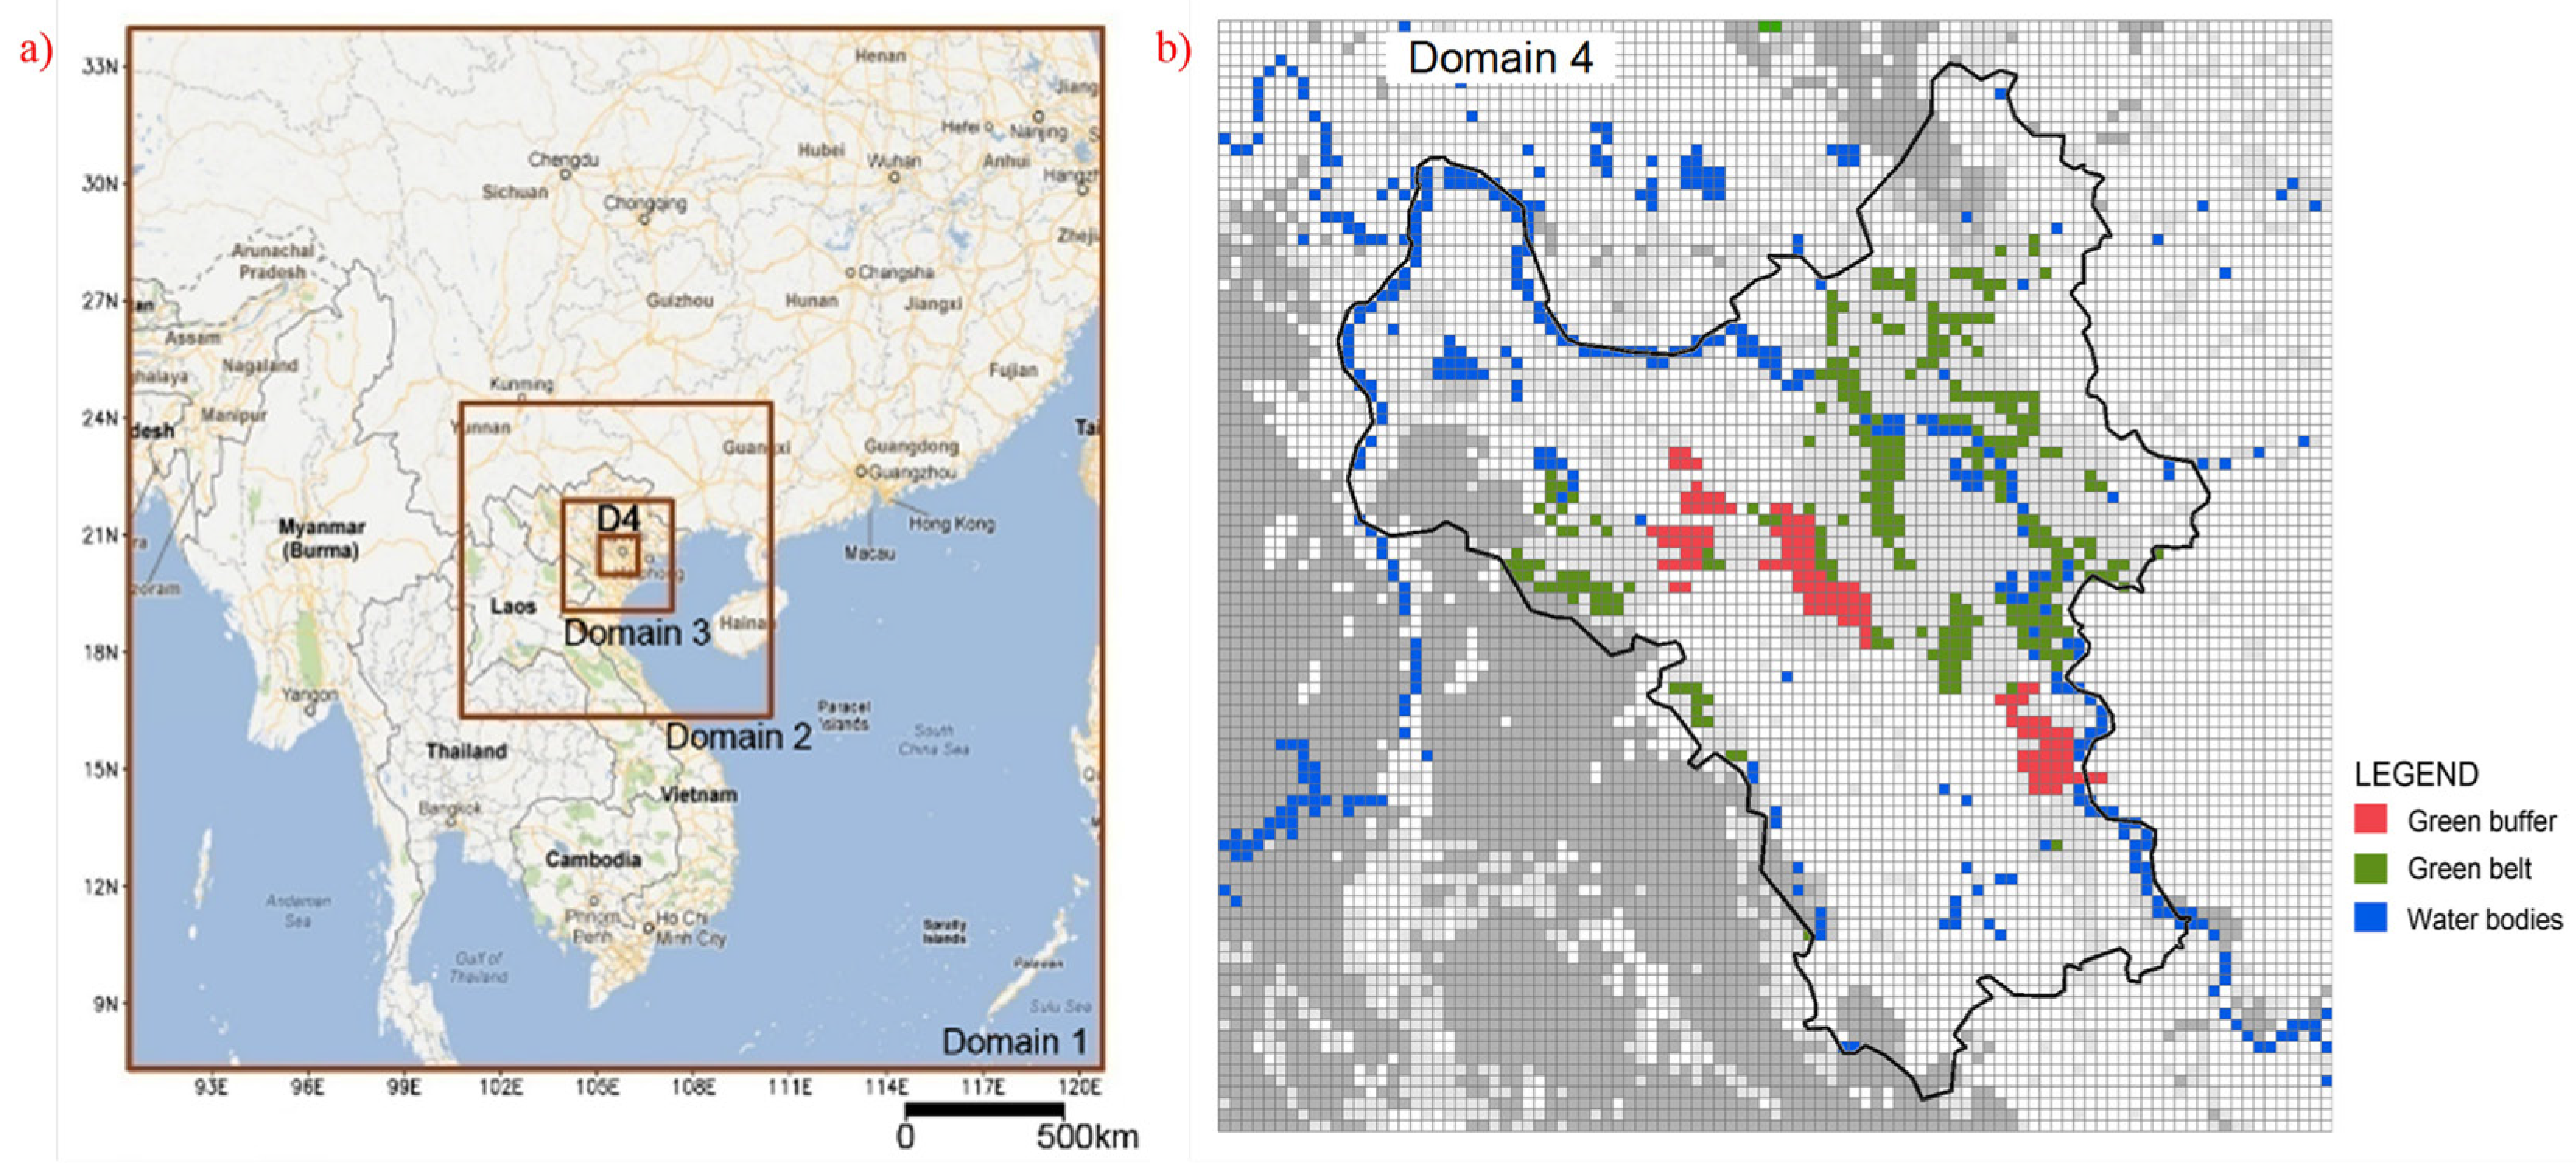
3.2. Simulation Scenarios

As described in the previous section, the Hanoi Master Plan 2030 proposed a large green network consisting of the green belts and the green buffers. The green belts are located inside the urban development area with the aim of improving the micro-climate condition, while the green buffers are the boundary space between the existing urban and expanded urban clusters [13] (see Figure 2b). Both of those green spaces form a large and centralized green areas in the city. To study the effect of those proposed green network on the urban climate, a comparison is performed between the current condition (hereafter referred as U_CUR) and the master plan scenario (hereafter referred as U_HMP). Both of the proposed green spaces are considered in U_HMP. Furthermore, the effectiveness of the proposed green network was evaluated under a scenario when they are not taken into account and converted into the built-up area (hereafter referred to as U_NOGREEN). An UHI mitigation strategy with the improved configuration of green network is proposed (hereafter referred to as U_PARK). In this scenario, the same amount of strategic green areas in the master plan are redistributed to new locations, resulting in checkerboard-shaped medium-size green spaces (equally distributed green spaces). Moreover, the impacts of the vegetation type on the urban climate were also assessed. Instead of using the mixed shrub/grassland in the original master plan, the mixed forest was used as the vegetation cover for the urban green network in the master plan and the equally distributed green network, referred to as U_HMPFOREST and U_PARKFOREST, respectively. Figure 3 presents the spatial distribution of the green spaces for each scenario.
Figure 3. Land use land cover (LULC) of domain 4 for (a) the current condition (U_CUR); (b) the master plan scenario (U_HMP); (c) no green strategy scenario (U_NOGREEN); (d) equally distributed green spaces (U_PARK); (e) the master plan scenario with mixed forest as the land cover of the green spaces (U_HMPFOREST); (f) the equally distributed green spaces scenario with mixed forest as the land cover of the green spaces (U_PARKFOREST).
Buildings 05 00933 g003

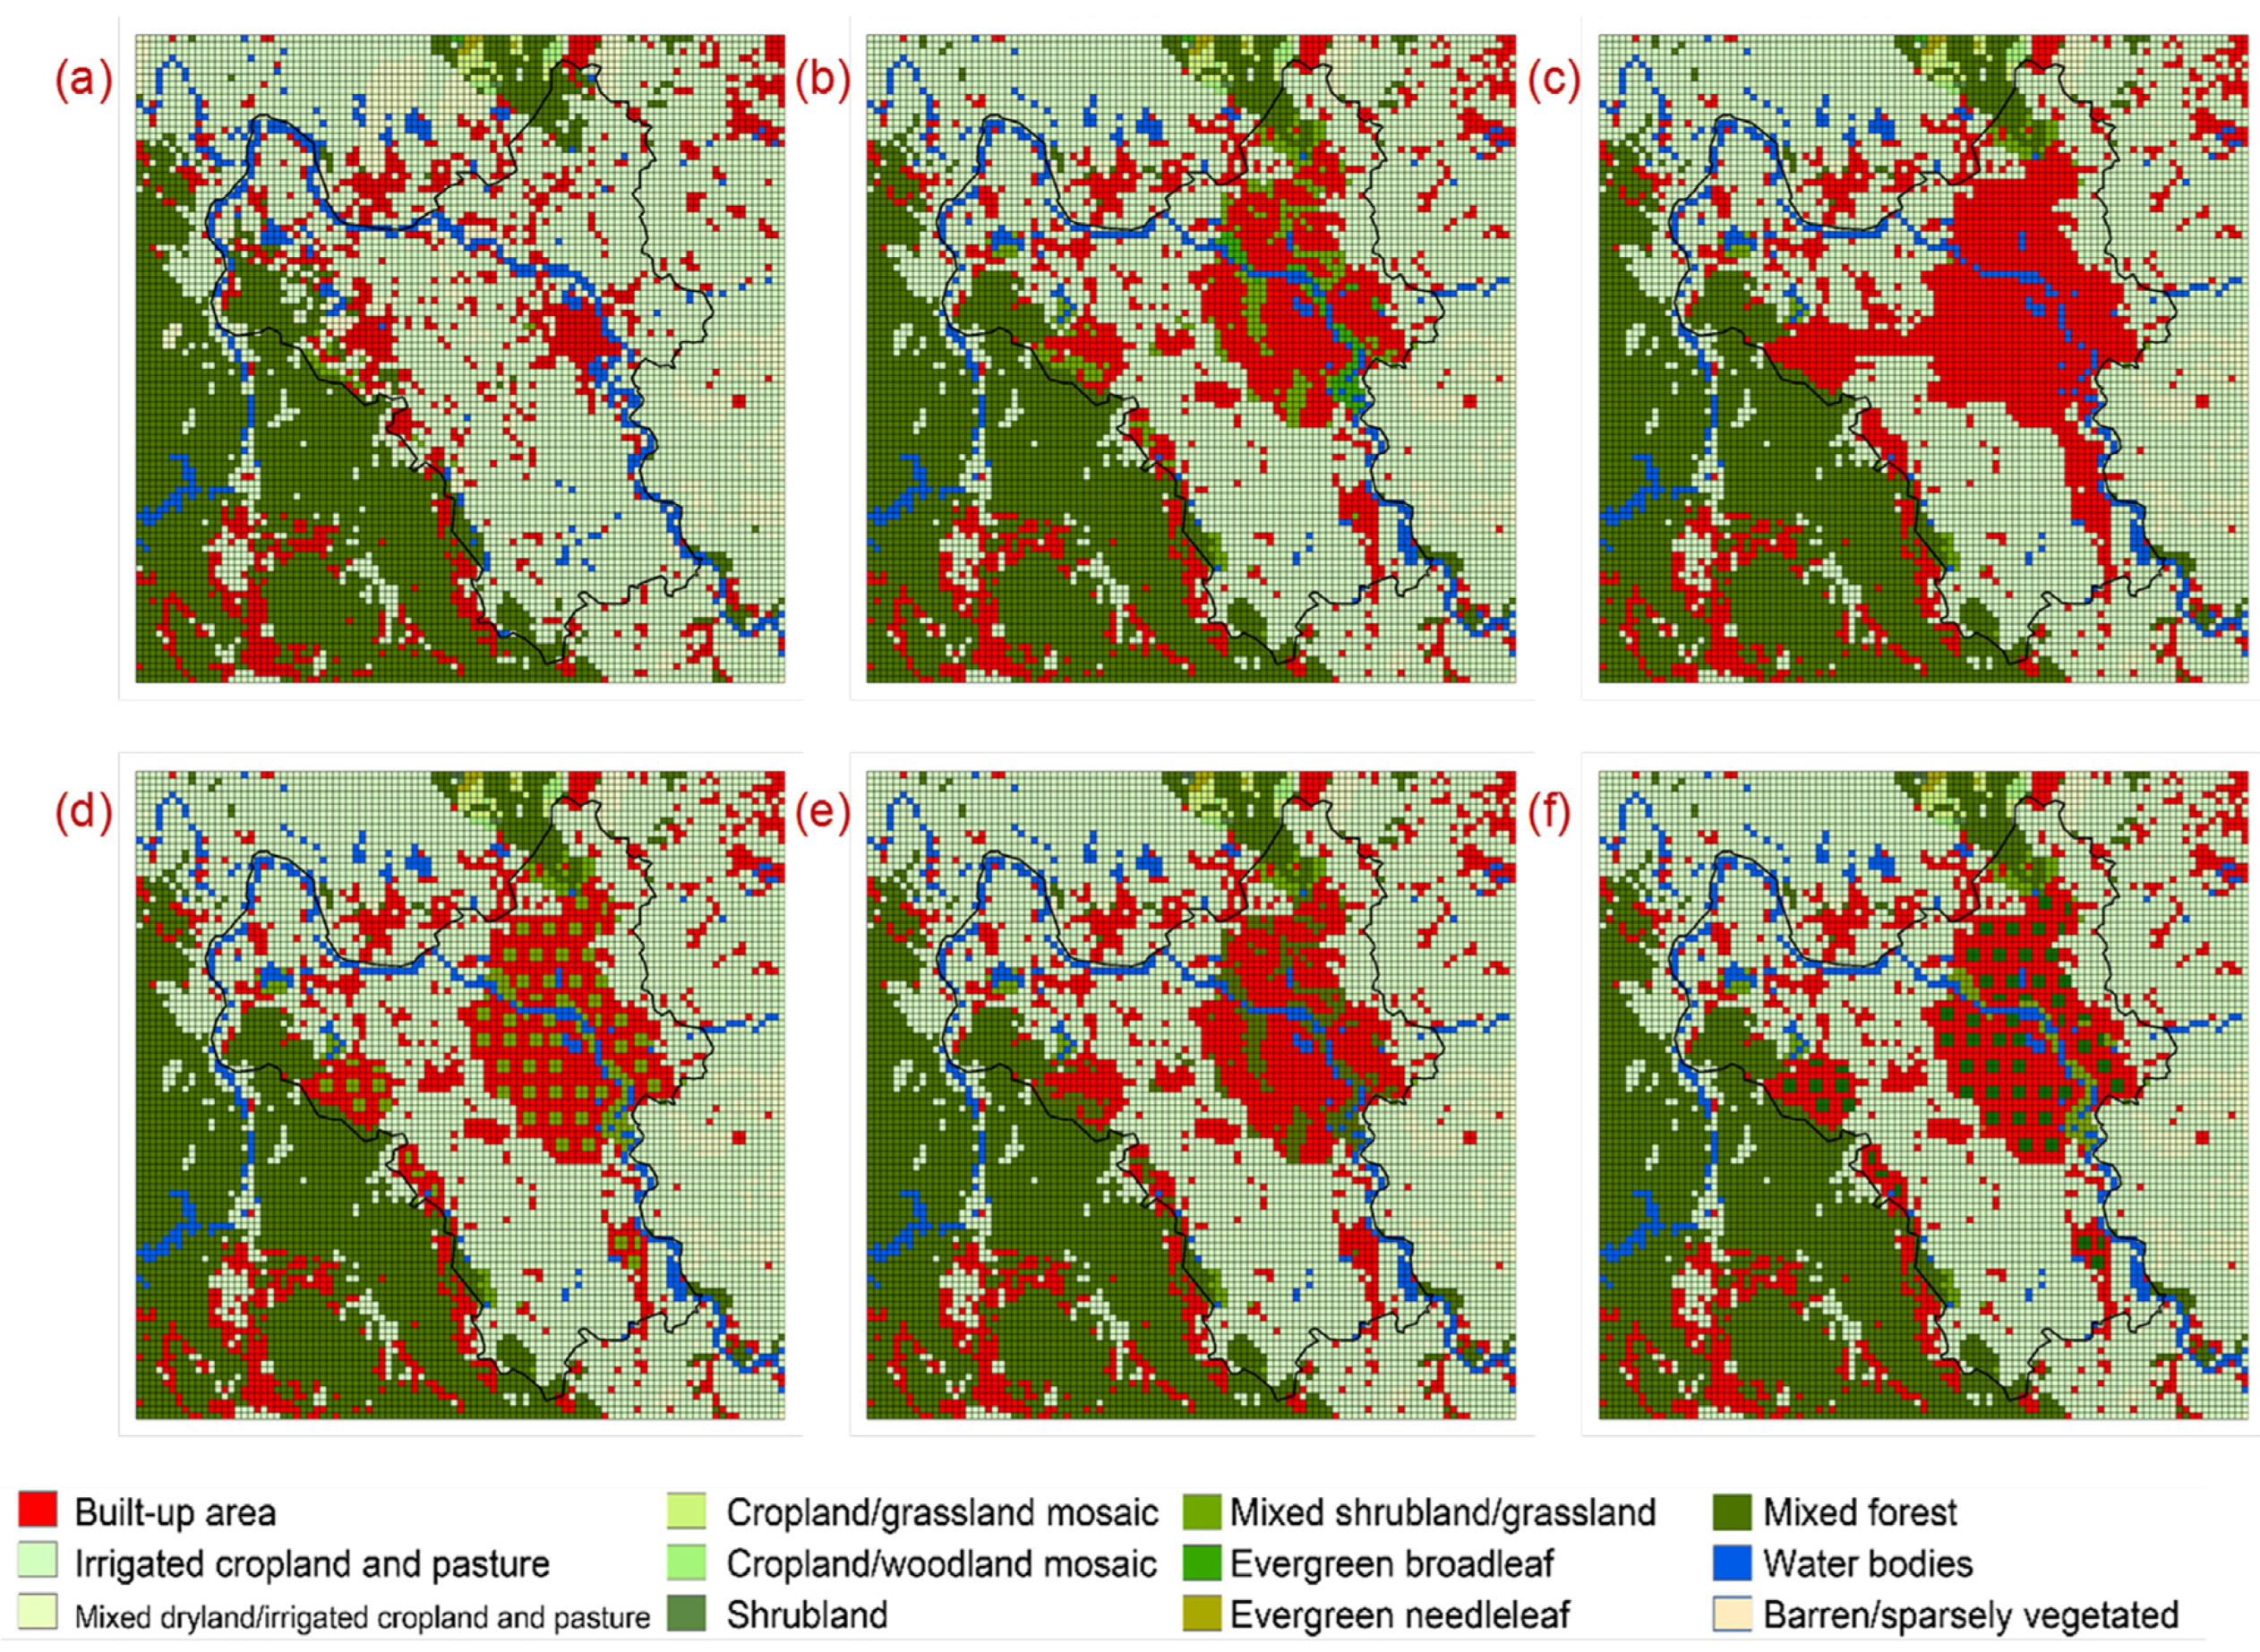
3.3. Land Use Land Cover (LULC) Data

By default, the WRF set the land use categories from United States Geological Survey (USGS) 24-category data for computational processes. The default LULC data were used for domains 1 and 2. For domain 3, Global Land Cover by National Mapping Organization (GLCNMO) version 1 was used. These land cover data were developed by International Steering Committee for Global Mapping (ISCGM) in collaboration with Geospatial Information Authority of Japan (GSI), Chiba University and National Geospatial-Intelligence Agency (NGIA). The GLCNMO Version 1 is available in 30 arcseconds resolution (equivalent to 1 km). Furthermore, the data were validated using the training data from 40 countries. Therefore, these data are considered suitable for the domain 3.
The LULC for domain 4 in U_CUR and U_HMP were combined using Advanced Land Observation Satellite (ALOS) satellite image and the national digital map provided by Vietnam Institute of Urban and Rural Planning (VIUP). The national digital map only covers the land use within the Hanoi administrative area. In order to fill the remaining area, the land cover detected from ALOS AVNIR-2 satellite image was used. Then, the combined LULC map was remapped by extracting the land use data, from a 10 m resolution into 1 km resolution gridded data as the input data for WRF using ArcGIS (Figure 3). The land use map of U_HMP was used as the base map for the U_NOGREEN, U_PARK, U_HMPFOREST and U_PARKFOREST. Then, the urban and green fraction in U_HMP were modified by assigning a particular value for each grid depending on the modified areas in each scenario. For instance, the U_NOGREEN does not consider the green network. Therefore, the land use fraction in the green network is set to be 0.8 and 0.2 for urban and vegetation, respectively. The same value is also assigned for the transformed built-up areas in U_PARK and U_PARKFOREST. While in U_HMPFOREST, the land use in the green network is converted into the mixed forest, with the land use fractions for the built-up and mixed forest are set to be 0.2 and 0.8, respectively. A summary with the basic information for each scenario is given in Table 1.
Table 1. Configuration of the green spaces in domain 4.
SimulationsGreen StrategyConfigurationLand Cover in the Green SpacesUrban FractionVegetation Fraction
U_CURN/AN/AN/A--
U_HMPYesLarge and centralizedMixed shrubland/grassland--
U_NOGREENNoTurned into urban areaBuilt-up0.80.2
U_PARKNoCheckerboard-shapedMixed shrubland/grassland0.20.8
U_HMPFORESTYesLarge and centralizedMixed forest0.20.8
U_PARKFORESTNoCheckerboard-shapedMixed forest0.20.8
N/A: The green strategy is not applicable in the current condition.

3.4. Model Validation

The simulation was conducted for one week from 00:00 UTC 13 to 00:00 UTC 20 June in 2010, which was the hottest period over the year 2000 to 2012. Subsequently, simulation results on 17 June of a typical sunny day is mainly analyzed in the following sections. Figure 4 presents the comparison of air temperature, wind speed and wind direction between the simulated and 3-hourly observation data at Lang station (21.02° N, 105.8° E) located in the Hanoi city center (see Figure 1a). Both of the simulated air temperature (at 2 m above ground surface) and wind speed (at 10 m above ground surface) show good agreement with the observed values with a coefficient of determinant of 0.92 and 0.13, respectively. In addition, the wind rose at 10 m above the ground also show good agreement with the 3-hourly observational value (Figure 4c). The simulation conditions are summarized in Table 2.
Figure 4. Comparison between the observed and simulated value for (a) air temperature; (b) wind speed; (c) wind direction at Lang station located in Hanoi city center.
Buildings 05 00933 g004
Table 2. WRF Simulation Conditions.
ItemsConditions
Simulation period00:00 UTC 1 to 00:00 UTC 30 June in 2010
Vertical grid30 layers
Horizontal grid100 × 100 grids
Meteorological dataNCEP FNL
Land use/land cover (LULC) dataDomain 1 and 2: USGS (default); Domain 3:GLCNMO; Domain 4: ALOS ANVIR-2 and National Digital LULC data
MicrophysicsWSM 3-class
Long-wave radiationRRTM long-wave scheme
Short-wave radiationDudhia short-wave scheme
PBL schemeYonsei University (YSU) Scheme
Cumulus schemeKain-Fritsch scheme
Surface schemeNoah-Land Surface Model (LSM)
Surface layerMonin-Obukhov scheme

4. Results and Discussion

4.1. Urban Climate in Current and Master Plan Condition

Figure 5 and Figure 6 present the spatial patterns of the simulated air temperature at 2 m above the ground surface and the winds at 10 m above the surface for U_CUR, U_HMP, U_NOGREEN and U_GREEN at 1:00 and 16:00 Local Standard Time (LST) on 17 June, respectively. This section compares U_CUR and U_HMP. At night, the highest air temperature is observed not in the city center but in the lee of western mountainous region in both scenarios (Figure 5). This result is partly due to the effect of Foehn wind from Laos [22]. As shown in Figure 5 and Figure 6, westerly or south-westerly winds prevail most of the day in the western mountainous region. While these westerly winds pass over the mountain range situated near the border of the Hanoi region, the air gets drier and the temperature increases rapidly. These westerly winds flow over most parts of the simulated area during the daytime (9:00–17:00) and bring relatively hot and dry air to the city. In contrast, relatively cool south-easterly or southerly winds prevail over plain areas in the east of 105.65° E during the night-time (18:00–8:00) (Figure 5).
Figure 5. Air temperature and wind distribution at 1:00 on 17 June for (a) U_CUR; (b) U_HMP; (c) U_NOGREEN; (d) U_PARK; (e) U_HMPFOREST; (f) U_PARKFOREST.
Buildings 05 00933 g005
In U_CUR, the minimum nocturnal air temperatures in urban and suburban areas are recorded as approximately 31–32 °C, while the air temperature is approximately 32–33 °C in the lee of mountainous areas. The daily peak air temperatures were obtained in most parts of the city around 16:00 in both conditions (Figure 6a,b). Although the peak air temperatures remain almost the same level even after implementing the master plan, the high air temperature areas of 40–41 °C expand widely over the planned built-up areas in U_HMP. At 1:00, the air temperature difference between U_CUR and U_HMP increases by up to 2–3 °C over the expanded built-up areas under the master plan condition. During the daytime, the increase in air temperature over the expanded built-up areas is not significant, which is up to 1 °C, compared to that in the night-time.
Figure 6. Air temperature and wind distribution at 16:00 on 17 June for (a) U_CUR; (b) U_HMP; (c) U_NOGREEN; (d) U_PARK; (e) U_HMPFOREST; (f) U_PARKFOREST.
Buildings 05 00933 g006

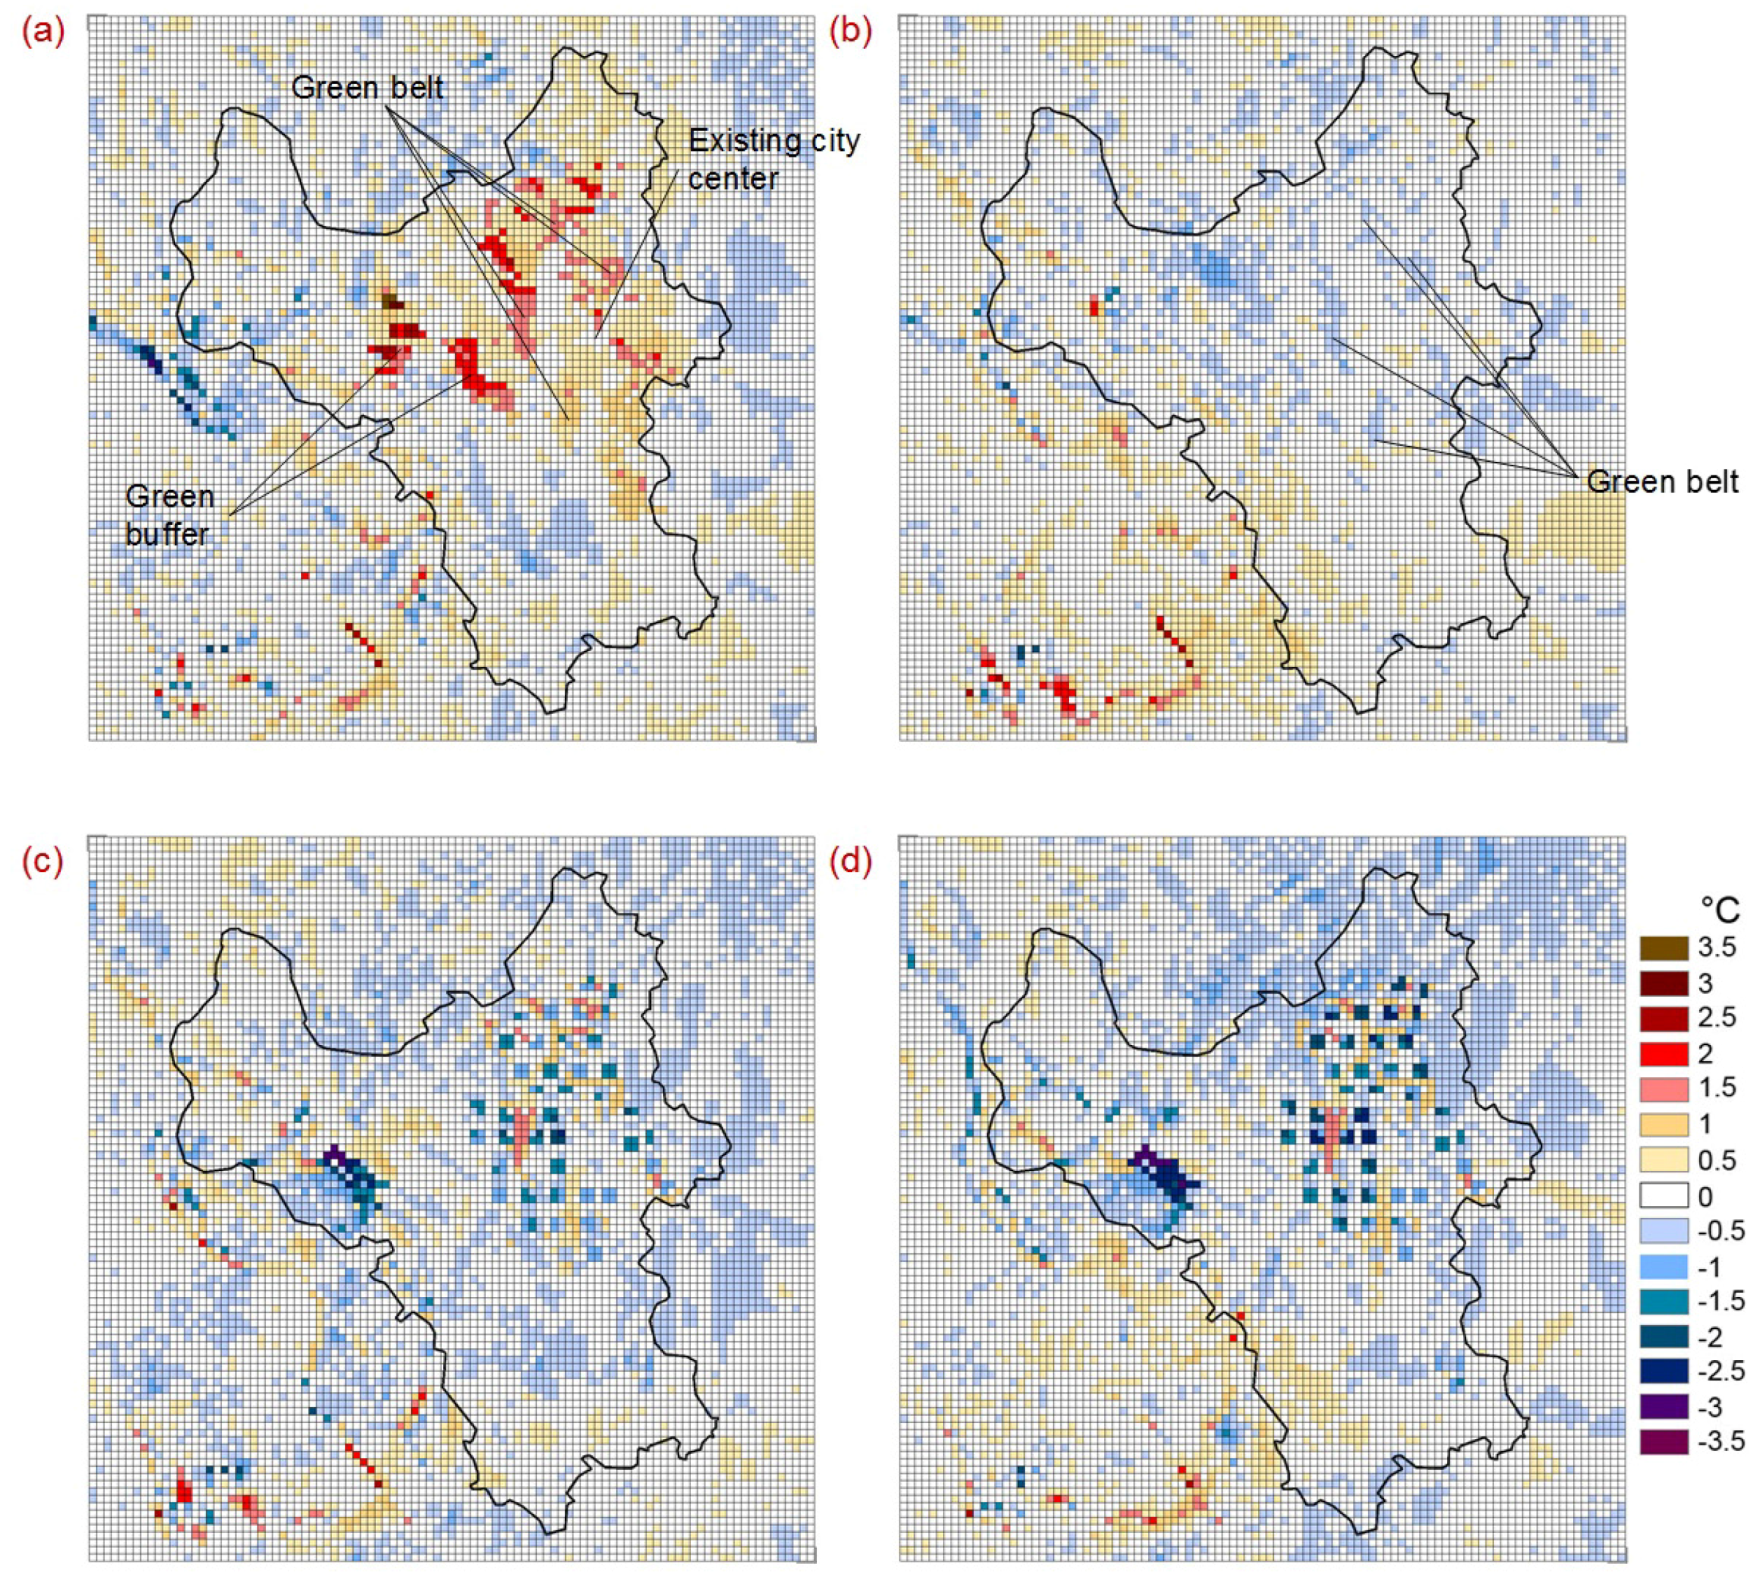
4.2. Master Plan Condition and that without Green Network

In U_NOGREEN, the planned green network is turned into the built-up area. As expected, the high air temperature areas of 33–34 °C are enlarged over the expanded built-up areas at 1:00 (Figure 5c), while the high air temperature areas of 40–41 °C are found over the same areas at 16:00 (Figure 6c). The peak air temperature maintains almost at the same level as the current and master plan condition. However, the hot air temperature areas expand more widely compared to the U_HMP, corresponding to the expanded built-up areas and those transformed from the planned green spaces.
The cooling effect of the southerly winds are seen during the night-time over the region located in the east of 105.65° E. In this region, the southerly winds experience relatively low air temperature of 31–32 °C before entering the built-up area. From this point, the air temperature gradually increases towards the north, resulting in lower air temperature in the southern part of the built-up areas. Moreover, the absence of the green spaces negates the cooling source of the prevailing wind. This results in high air temperature in the built-up areas located in the north of the proposed green spaces where the southerly winds flow over.

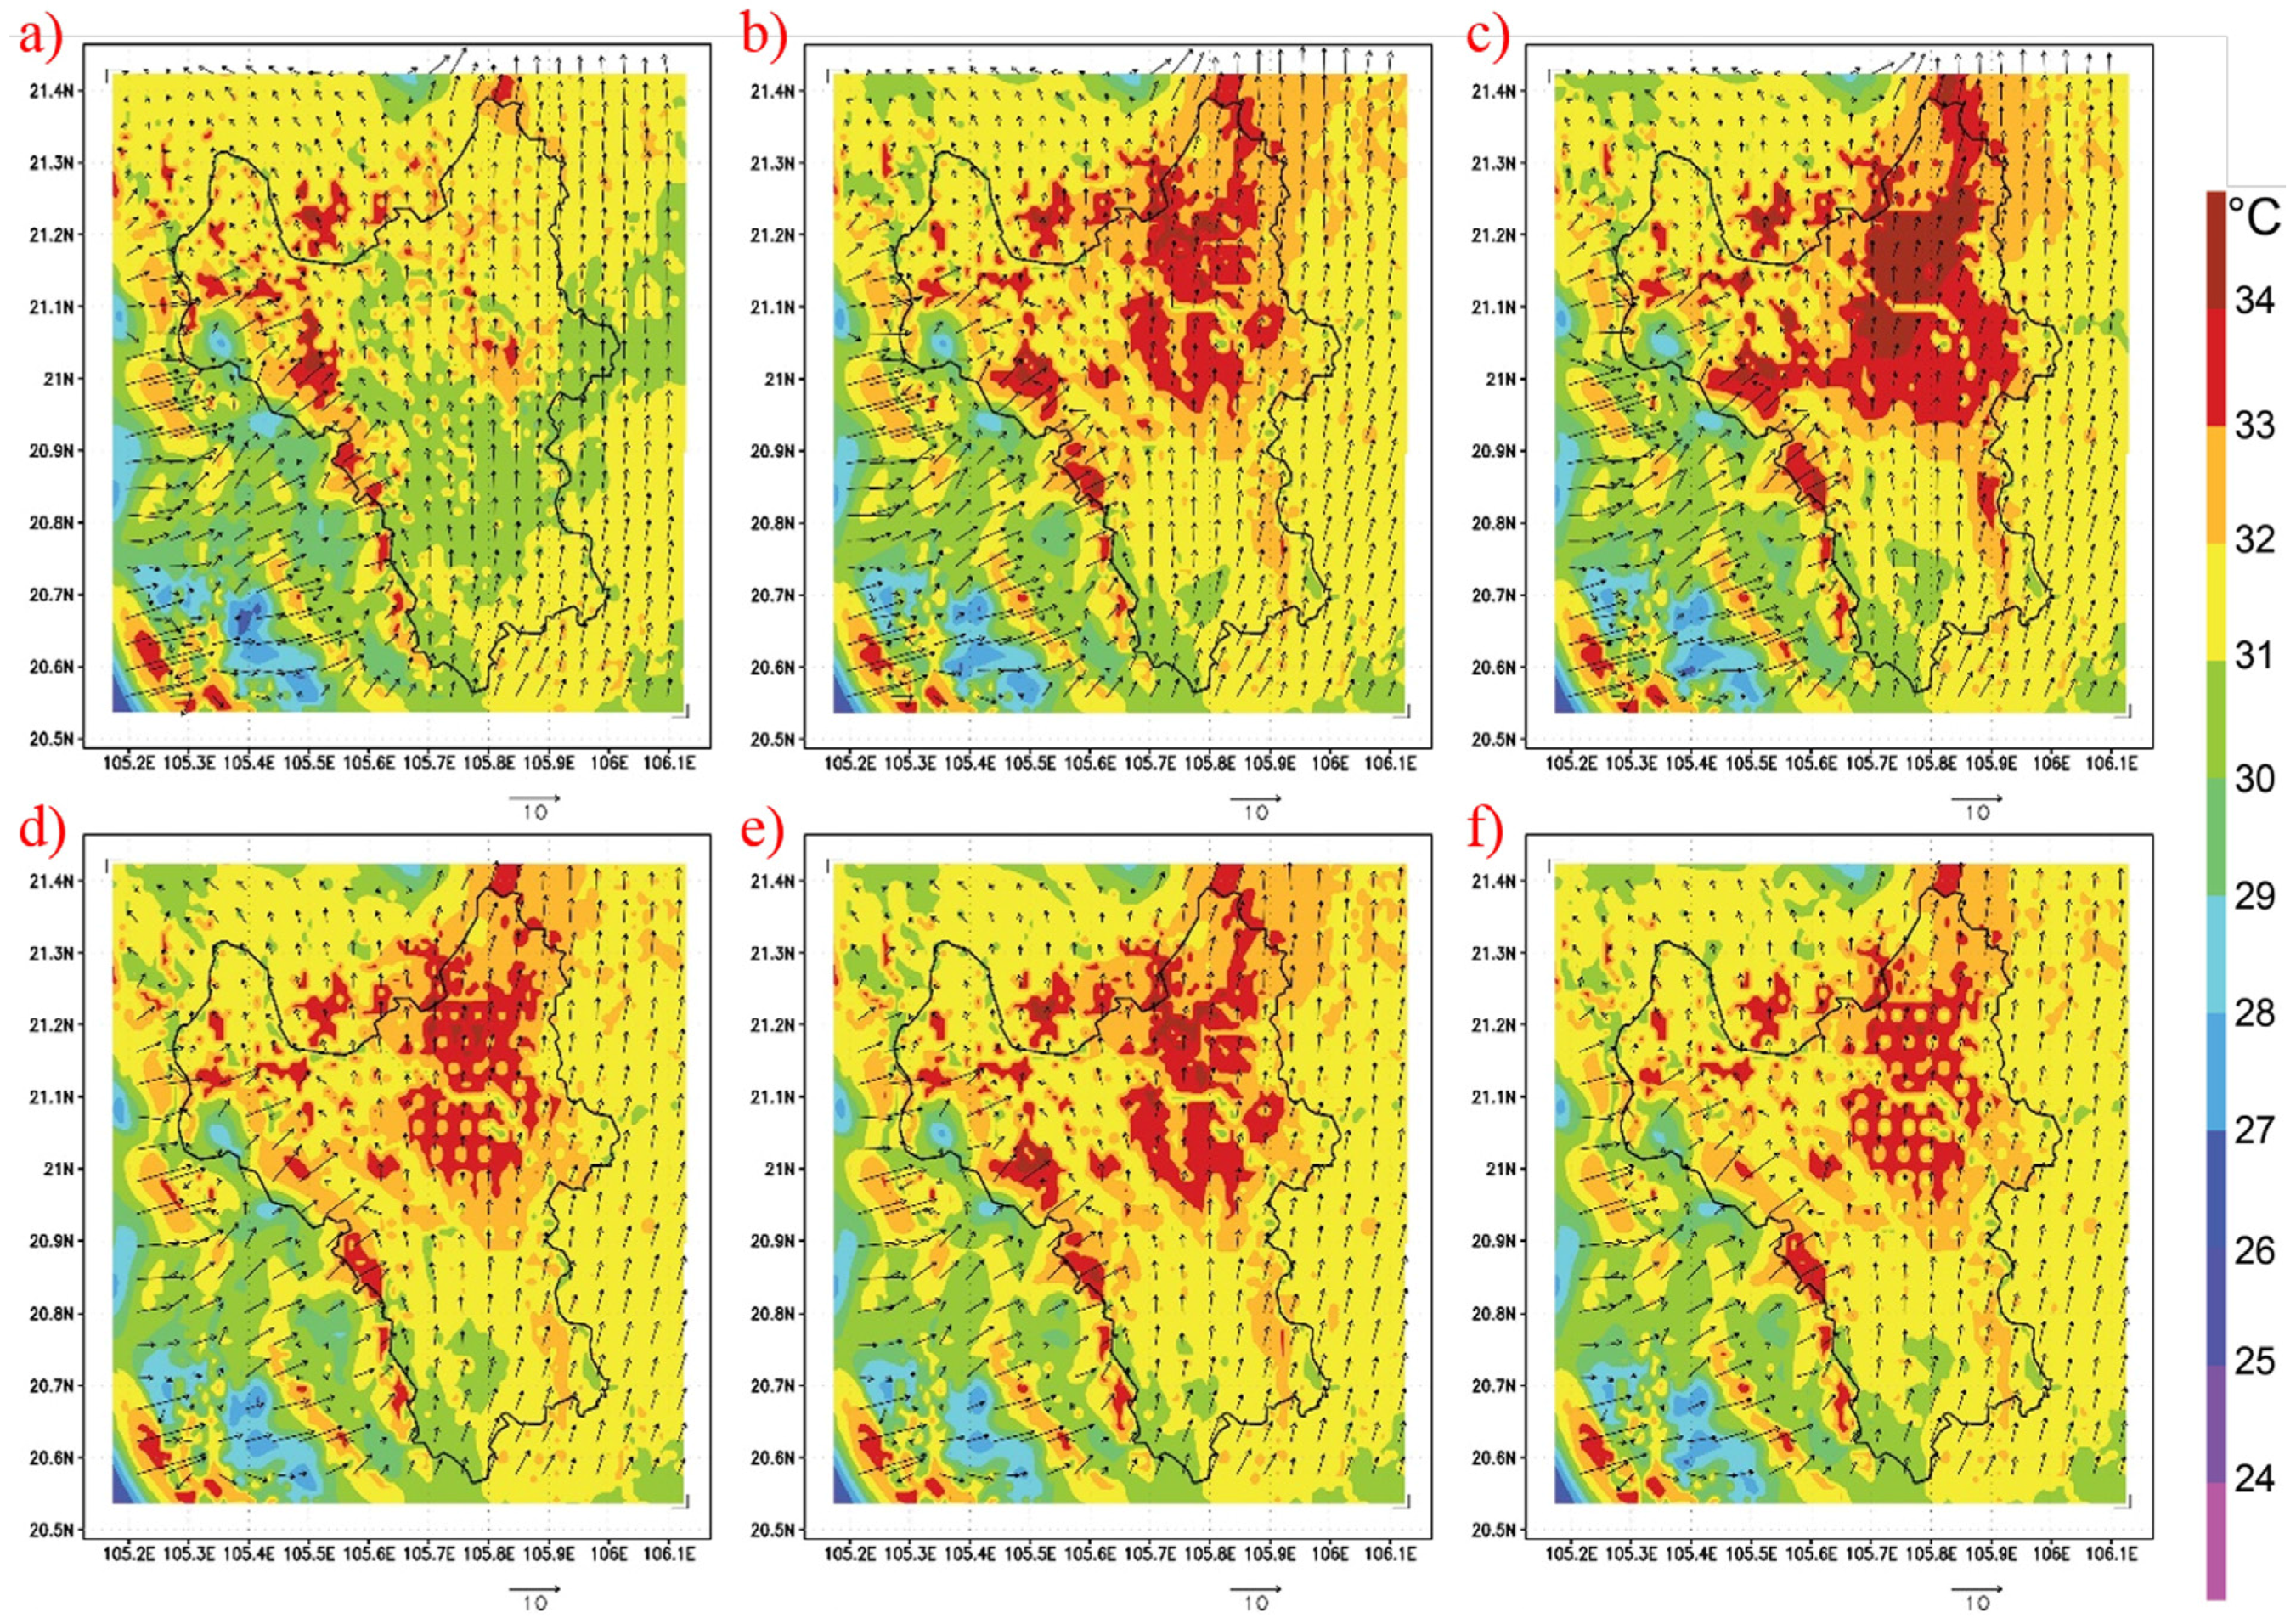
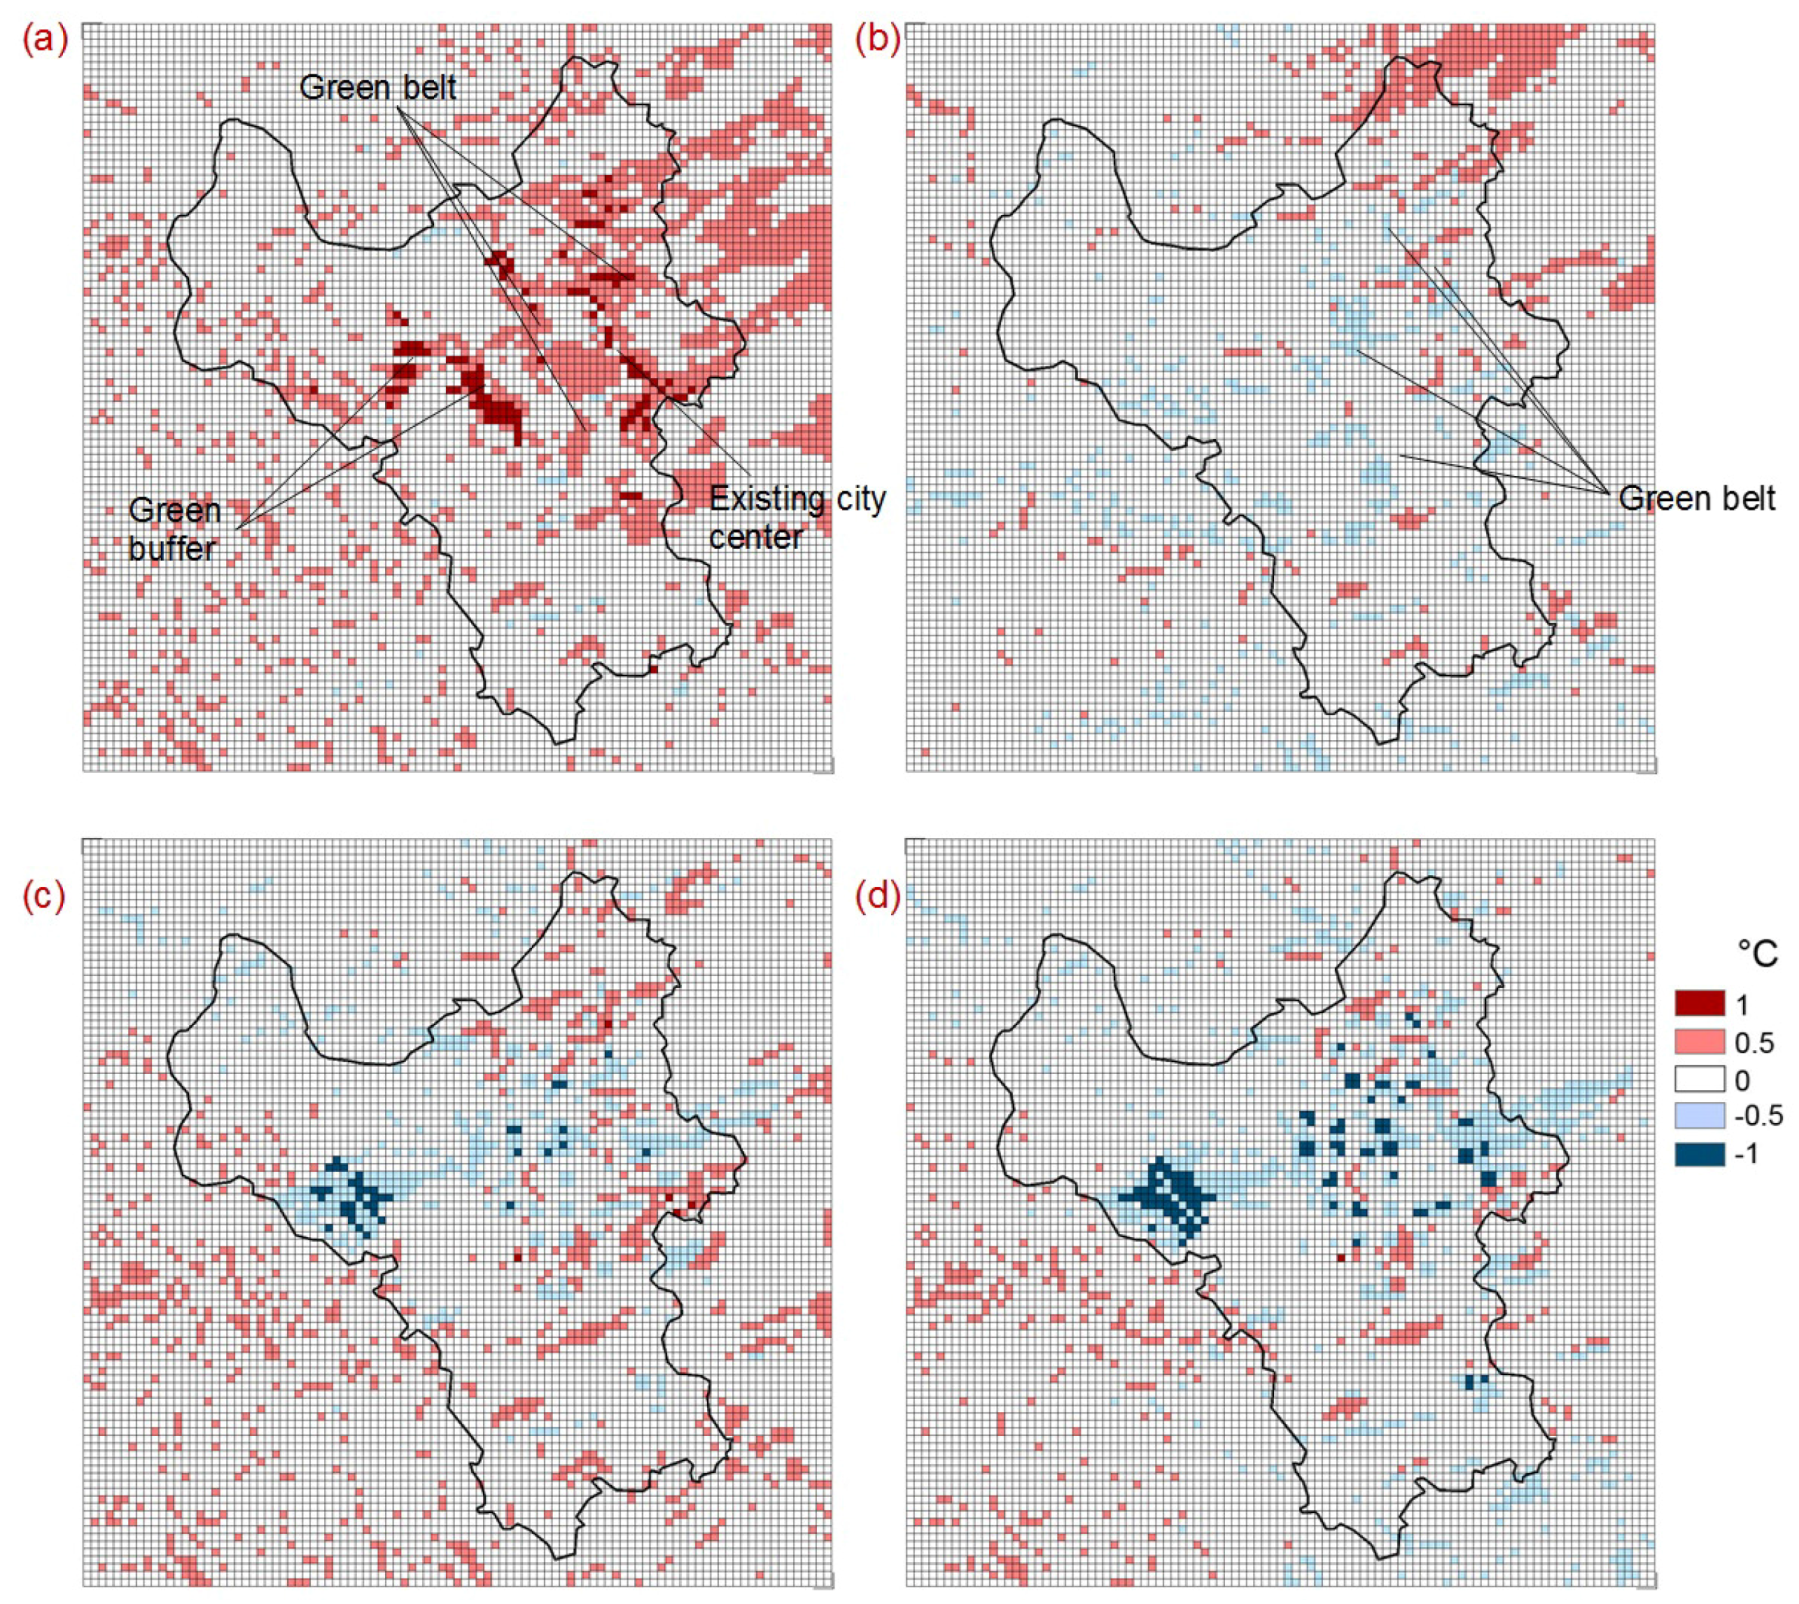
4.3. Urban Climates under Different Configurations of Green Spaces

In general, the peak air temperature maintains almost at the same level as in the current and master plan condition both in the day and night-time for all configurations. However, the number of areas experiencing hot air temperature varies among the scenarios.
In U_PARK, the mixed shrub/grassland is used as the vegetation cover inside the green spaces that are equally distributed within the new expanded built-up areas. As seen in Figure 5d and Figure 6d, the distribution of air temperature under the UHI mitigation strategy is different than that of U_HMP. The improvement of the urban green space in the built-up area located in the western mountainous region helps to relieve the occurrence of hot air temperature caused by the Foehn wind. Therefore, in U_PARK, the peak air temperature is only observed in the built-up areas located in the eastern region during the night-time. The discrepancy of air temperature between built-up area and the green spaces is up to 1 °C and it becomes more noticeable during the night-time.
Figure 5e and Figure 6e show the air temperature and wind distribution in U_HMPFOREST. The results show very similar distribution of air temperature to those in U_HMP. In particular, the locations of area experiencing peak air temperature remain the same as in U_HMP even after changing the vegetation cover. However, the mixed forest in the proposed green spaces shows lower air temperature than the mixed shrub/grassland in the U_HMP. Consequently, these green spaces contribute to the lower air temperature at its surrounding built-up areas during the daytime, thus lead to the reduction in the number of area experiencing hot air temperature. The cooling effects of the mixed forest are also seen in U_PARKFOREST. At night, the distribution of air temperature produces similar patterns as those in U_PARK (Figure 5f). However, the air temperature of the green spaces in U_PARKFOREST is lower by up to 2 °C than the surrounding built-up areas, resulting in more reductions of the hotspots compared to U_PARK. During the daytime, ameliorating effects of U_PARKFOREST on the urban climate becomes more noticeable, with large reduction of areas experiencing peak air temperature during the daytime (Figure 6f).

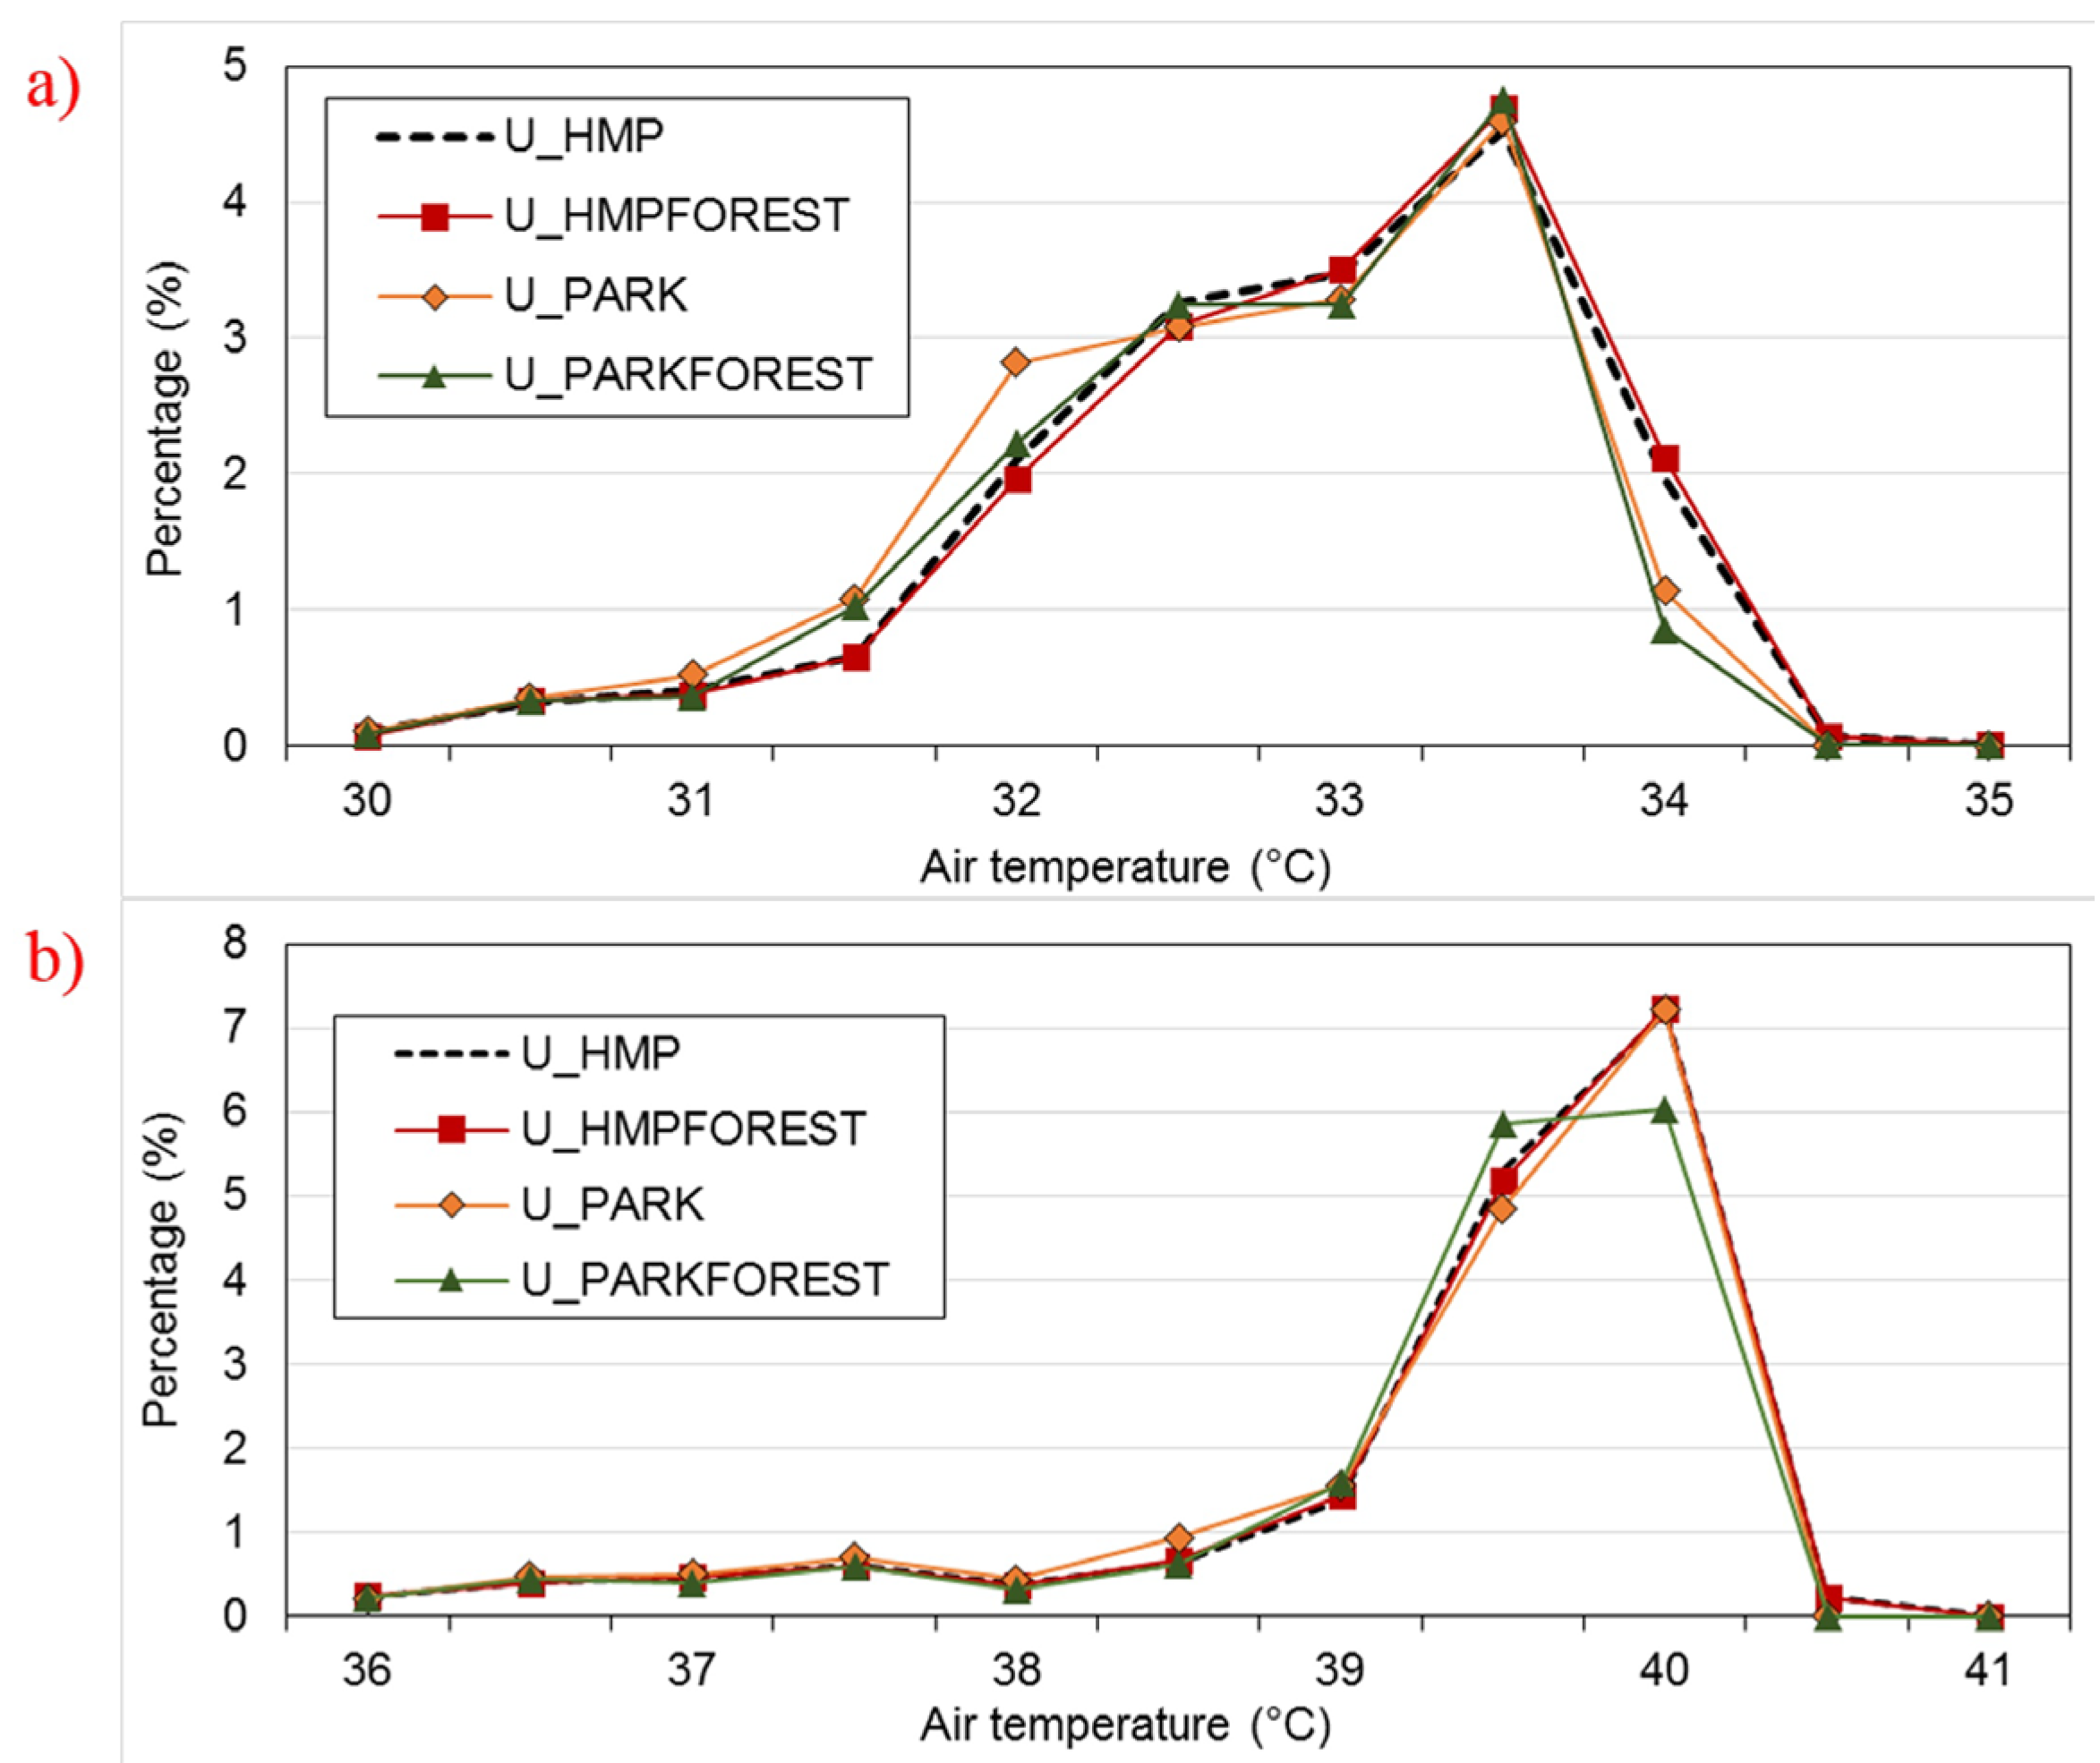
4.4. Impacts of the Configuration of Green Spaces

Figure 7 and Figure 8 show the spatial distribution of air temperature differences at 1:00 and 16:00 on 17 June between U_HMP and U_NOGREEN, U_HMPFOREST, U_PARK and U_PARKFOREST, respectively. Based on these figures, the cooling effect induced by the specific green space configuration in each scenario can be discussed.
Night-time air temperature spatial difference between U_HMP and U_NOGREEN shows an increase of over 2 °C inside the transformed built-up areas and up to 0.5 °C at their surrounding areas (Figure 7a). Nevertheless, the cooling effect of the proposed green spaces do not reach the existing city center which is located by the Red River delta, because the proposed green belts are located about 4 km away from the city center.
In U_HMPFOREST, the largest nocturnal cooling occurs only within the green network itself, by up to –0.5 °C. The cooling effect of the green spaces are not observed in the surrounding built-up areas. In contrast, applying the mixed forest in the large green belt areas induces an increase in air temperature at particular locations in the built-up areas by up to 0.5 °C at night (Figure 7b). This is because the surface fraction in the mixed forest slightly reduced the wind velocity (Figure 5e). When the wind is not strong enough, the heated air is trapped within the urban heat islands.
In U_PARK, the existence of the green spaces and the relatively close distance between them produce a strong nocturnal cooling effect (Figure 7c). The reduction in air temperature induced by the green spaces is evident at the built-up areas around it, with a cooling effect ranging from –0.5 to –1 °C at distances up to 1 km. Furthermore, U_PARKFOREST shows lower air temperature inside the green spaces by 0.5 °C, which is related to the cooling effect of the mixed forest (Figure 7d). When the results are compared with U_PARK, more reductions in air temperature of up to 1 °C are seen over the surrounding built-up areas at night. The increase in air temperature at particular locations is mainly caused by the changes in the land use that is transformed into the built-up land.
Figure 7. Air temperature difference at 1:00 on 17 June between (a) U_HMP-U_NOGREEN; (b) U_HMP-U_HMPFOREST; (c) U_HMP- U_PARK and (d) U_HMP-U_PARKFOREST.
Buildings 05 00933 g007
In the daytime, the removal of the green network in U_NOGREEN increases the air temperature at the surrounding built-up areas by up to 0.5 °C, while the maximum increase of 1 °C only occurs within the transformed built-up areas (Figure 8a). The benefic impact of the mixed forest to the surrounding areas is seen when the winds are relatively strong (6–7 m/s) (see Figure 6e), with the cooling effect of –0.5 °C within up to 1 km distance (Figure 8b). The nocturnal thermal condition inside the built-up areas is improved due to the new configuration of the green spaces, and the daytime condition also shows a positive effect of the equally distributed green spaces and the mixed forest in U_PARK and U_PARKFOREST, respectively (Figure 8c,d).
Figure 9 shows the air temperature distribution over the built-up areas in U_HMP, U_PARK, U_HMPFOREST and U_PARKFOREST at 1:00 and 16:00 on 17 June 2010, respectively. As shown in Figure 9a, the nocturnal air temperatures in the built-up areas range from 30 to 34.5 °C, with the proportion of the area at specific temperature peaking at 33.5 °C. In U_PARK, the proportions of the area with the air temperature of 32.5–34 °C are reduced, while the proportions of the area with the lower air temperatures of 31–32 °C are increased. This air temperature shift indicates the reduction in hot air temperature areas after the green spaces are equally distributed within the city. In the daytime, the amount of areas with the air temperature of 39.5 °C is reduced and shifted down to the ranges of 38.5–39 °C, indicating the temperature reduction by 0.5–1 °C (Figure 9b). The impact of the relocation of the green spaces on the reduction of UHI intensity remains greater in the night-time than that in daytime. Moreover, the greater reduction of hotspots is achieved in U_PARKFOREST. The combination between the equally distributed green spaces with mixed forest results in the reduction of hotspot areas by up to 56.5% in the night-time and 16.2% during the daytime.
Figure 8. Air temperature difference at 16:00 on 17 June between (a) U_HMP-U_NOGREEN; (b) U_HMP-U_HMPFOREST; (c) U_HMP-U_PARK; (d) U_HMP-U_PARKFOREST.
Buildings 05 00933 g008
Figure 9. Air temperature distribution over the built-up areas on 17 June at (a) 1:00 and (b) 16:00. The y-axis represent the percentage of built-up area to the total simulated areas in domain 4.
Buildings 05 00933 g009

5. Conclusions

Based on the results of the numerical experiments, the main findings are summarized as follows:
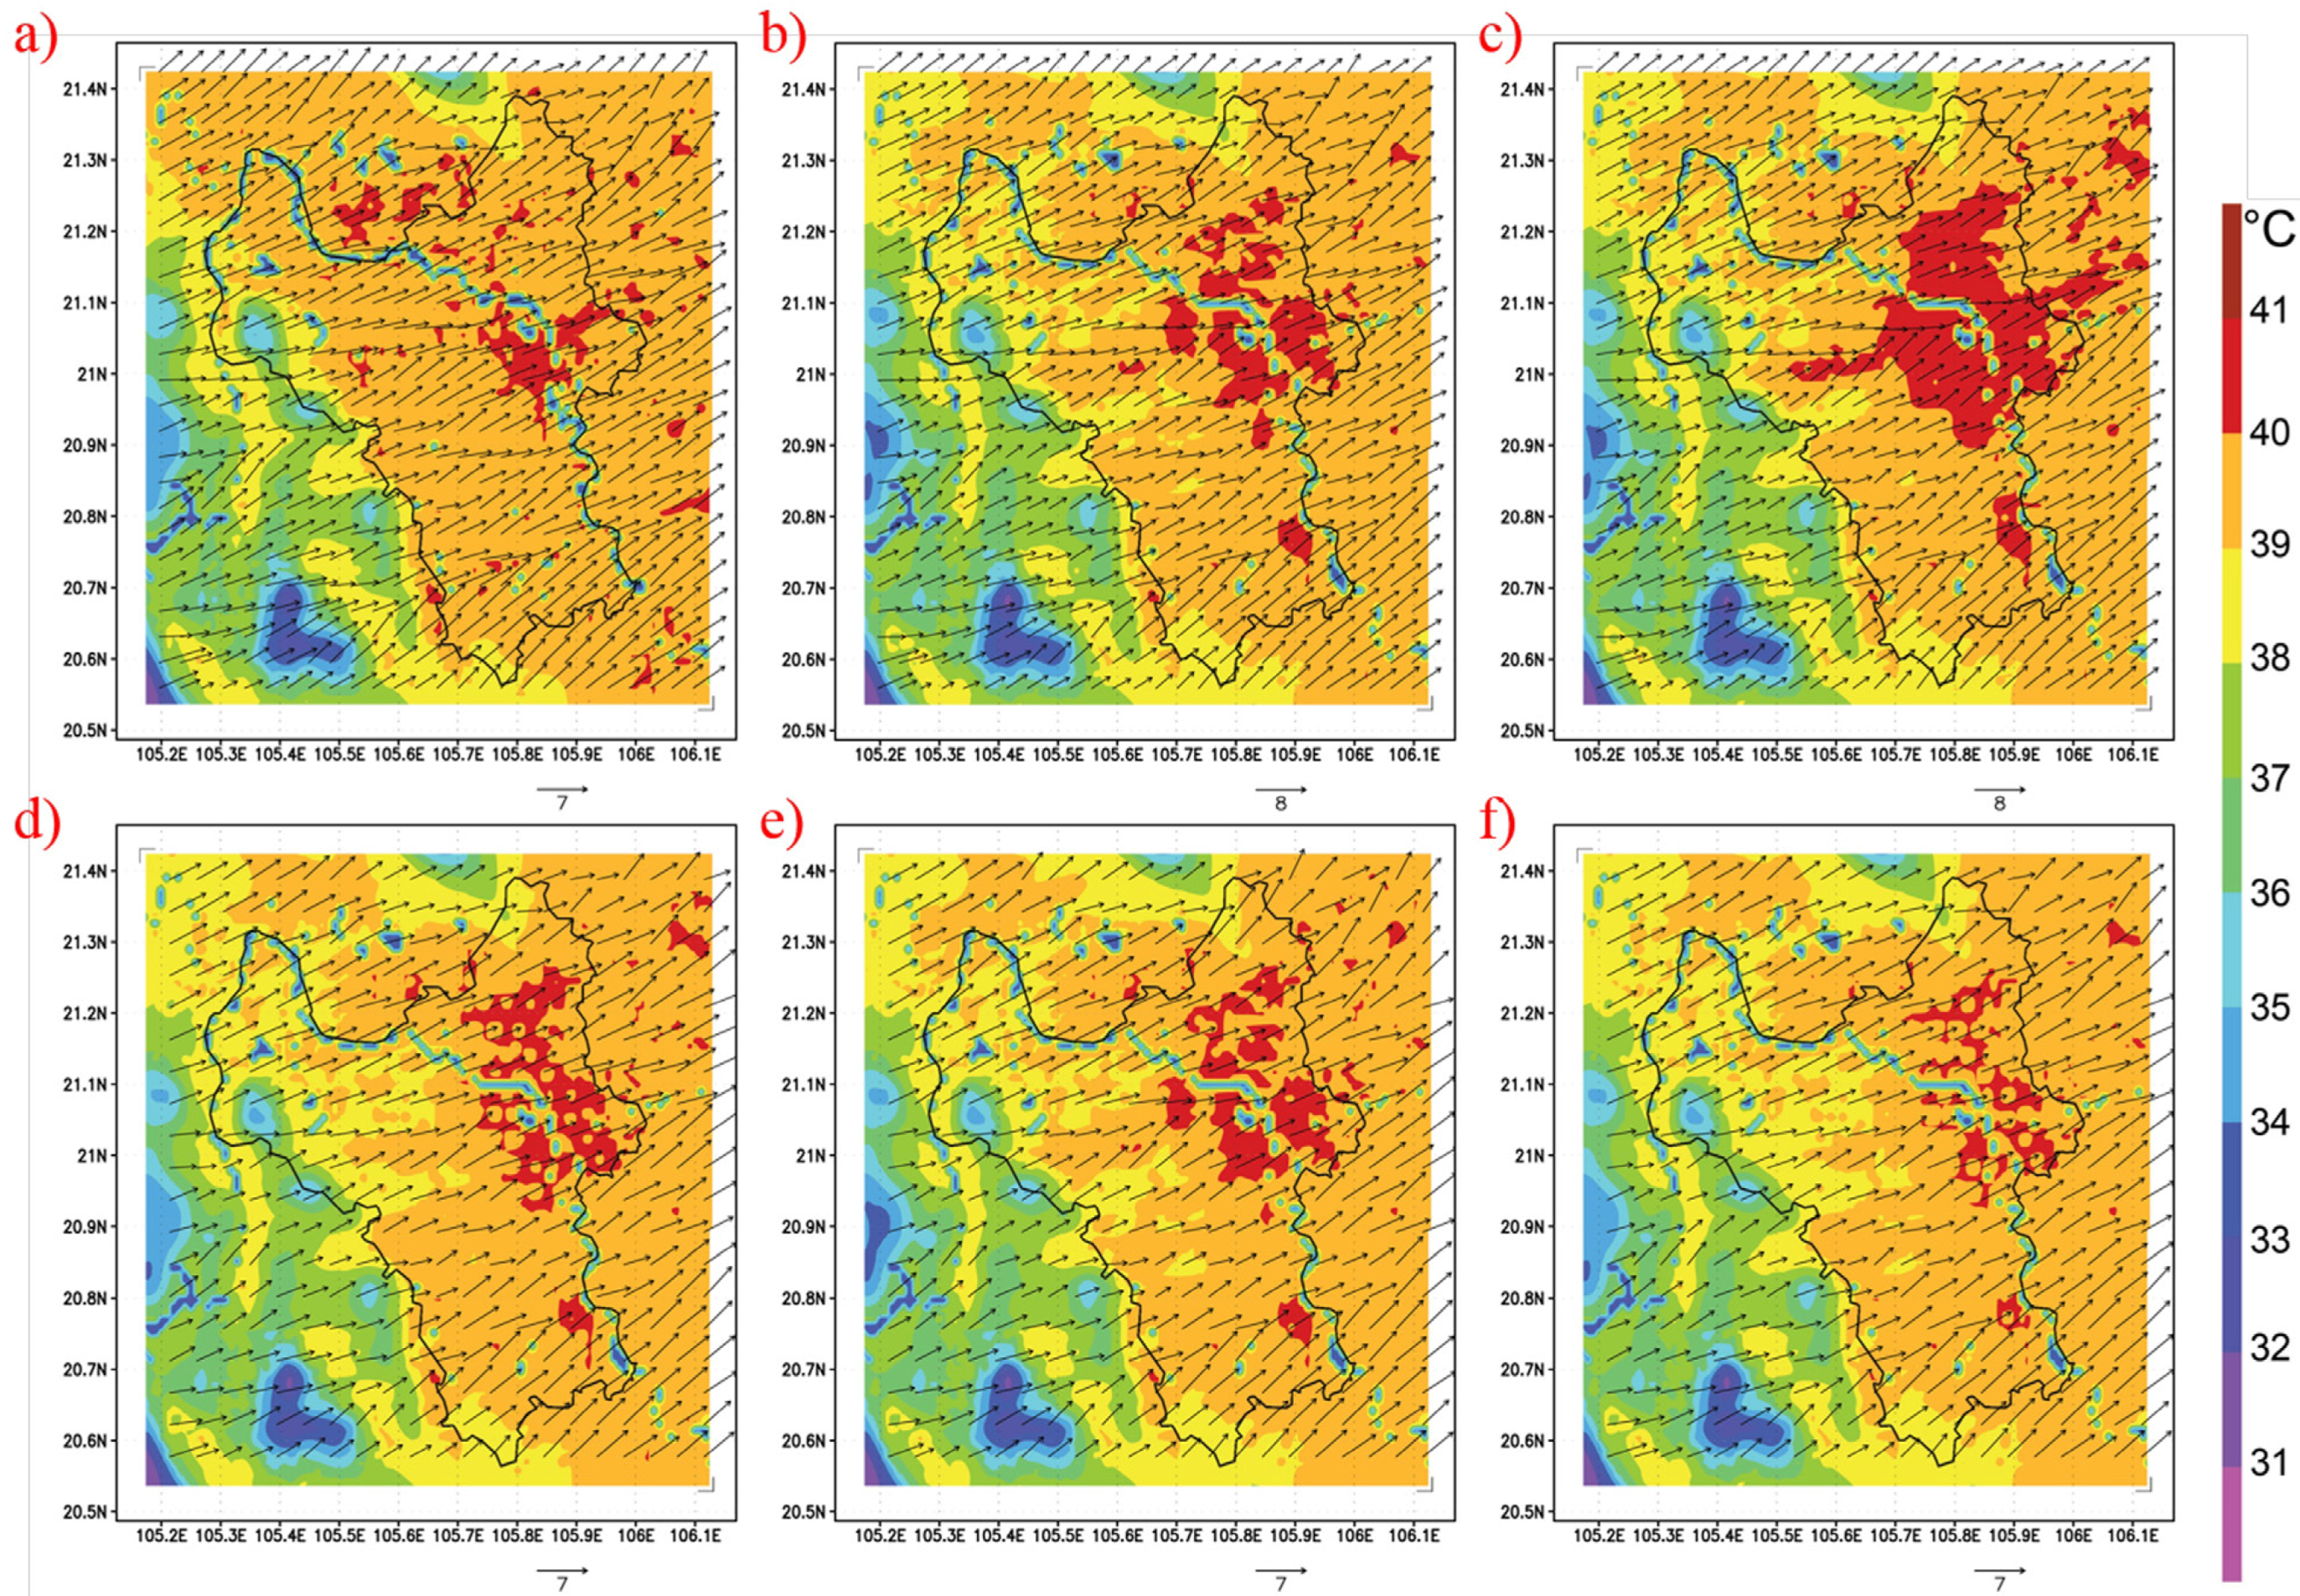
  • In general, the daytime peak air temperature rises up to 40–41 °C over the built-up areas in the city center of Hanoi in the current condition.
  • The south-westerly or westerly winds are dominant in the daytime and bring hot and dry air to the city, likely due to the Foehn wind. The air temperature in Hanoi City is increased when these Foehn winds flow over the city during the daytime. In contrast, relatively strong and cool southerly winds prevail during the night-time and contribute to reduce the nocturnal air temperature in the city. Due to the discrepancy in terms of wind condition, heat islands appearing in the western built-up region of Hanoi are found to be more intense than in the city center at night.
  • If the LULC is changed according to the master plan, the daytime peak air temperature is predicted to remain at almost the same level as the current condition. However, the new hotspots would expand widely over the planned built-up areas.
  • In addition, the peak air temperature remains almost at the same level as in the current and master plan condition both in the day and night-time for all green space configurations.
  • The strategic green spaces would not sufficiently mitigate UHIs in the city because they are located far away from the city center. On the other hand, the equally distributed green areas show a better performance in the reduction of UHI intensity, especially at night.
  • The greater reduction of the hotspots during the daytime and night-time is achieved when the mixed forest is used as the vegetation cover in the equally distributed green network.
More quantitative assessment of the proposed UHI mitigation and related issues are needed. Further study on the thermal comfort and cooling load in buildings is necessary to better understand how the ameliorating effect of the improved green spaces affect the thermal condition in buildings. Since Hanoi experiences a hot and humid climate, it is important to deal with not only sensible heat but also latent heat in the indoor thermal comfort assessment.

Acknowledgments

We sincerely appreciate the generous supports given by the Vietnam Institute of Urban and Rural Planning. We would also like to express our gratitude to Takahiro Tanaka and Kaoru Matsuo for their valuable contribution to this research. This research was supported by a grant from Mitsui & Co., Ltd. Environment Fund.

Author Contributions

The corresponding Author performed the numerical simulation, analyzing the data and wrote the paper. Tetsu Kubota contributed in analyzing the data, checking the manuscript, and supervising the whole processes of the study. Han Soo Lee contributed in supervising the WRF simulation. Tran Thi Thu Phuong contributed in the preparation of the land use and land cover data for the WRF simulation.

Conflicts of Interest

The authors declare no conflict of interest.

References and Notes

  1. Akbari, H.; Davis, S.; Dorsano, S.; Huang, J.; Winett, S. Cooling Our Communities: A Guidebook on Tree Planting and Light Colored Surfacing; United States Government Printing: San Franscisco, CA, USA, 1992.
  2. Santamouris, M. Heat island research in Europe: The state of the art. Adv. Build. Energy Res. 2007, 1, 123–150. [Google Scholar] [CrossRef]
  3. Taha, H.; Akbari, H.; Rosenfeld, A.; Huang, J. Residential cooling loads and the urban heat island the effects of Albedo. Build. Environ. 1988, 23, 271–283. [Google Scholar] [CrossRef]
  4. Crutzen., J. New Directions: The growing urban heat and pollution “island” effect—Impact on chemistry and climate. Atmos. Environ. 2004, 38, 3539–3540. [Google Scholar] [CrossRef]
  5. Moriyama, M.; Tanaka, T. The mitigation of UHI intensity through an improved land-use plan in the urban central area: Application to Osaka City, Japan. J. Heat Island Inst. Int. 2012, 7, 65–71. [Google Scholar]
  6. Connors, J.P.; Galletti, C.S.; Chow, W.T.L. Landscape configuration and urban heat island effects: Assessing the relationship between landscape characteristics and land surface temperature in Phoenix, Arizona. Landsc. Ecol. 2013, 28, 271–283. [Google Scholar] [CrossRef]
  7. Oliveira, S.; Andrade, H.; Vaz, T. The cooling effect of green spaces as a contribution to the mitigation of urban heat: A case study in Lisbon. Build. Environ. 2011, 46, 2186–2194. [Google Scholar] [CrossRef]
  8. Papangelis, G.; Tombrou, M.; Dandou, A.; Kontos, T. An urban “green planning” approach utilizing the Weather Research and Forecasting (WRF) modeling system: A case study of Athens, Greece. Landsc. Urb. Plan. 2012, 105, 174–183. [Google Scholar] [CrossRef]
  9. Wong, N.H.; Yu, C. Study of green areas and urban heat island in a tropical city. Habitat Int. 2005, 29, 547–558. [Google Scholar] [CrossRef]
  10. Romeo, C.; Zinzi, M. Impact of a cool roof application on the energy and comfort performance in an existing non-residential building. A Sicilian case study. Energy Build. 2013, 67, 647–657. [Google Scholar] [CrossRef]
  11. Santamouris, M.; Synnefa, A.; Karlessi, T. Using advanced cool materials in the urban built environment to mitigate heat islands and improve thermal comfort conditions. Sol. Energy 2011, 85, 3085–3102. [Google Scholar] [CrossRef]
  12. Rossi, F.; Castellani, B.; Presciutti, A.; Morini, E.; Filipponi, M.; Nicolini, A.; Santamouris, M. Retroreflective façades for urban heat island mitigation: Experimental investigation and energy evaluations. Appl. Energy 2015, 145, 8–20. [Google Scholar] [CrossRef]
  13. Vietnam Institute of Architecture, Urban and Rural Planning (VIAP). Hanoi Capital Construction Master Plan to 2030 and Vision to 2050, Comprehensive Report; VIAP: Hanoi, Vietnam, 2011.
  14. National Hydro-Meteorological Service of Vietnam. Historical Weather Data in Hanoi, 2014. Data Provided by Order.
  15. Skamarock, W.; Klemp, J.B.; Dudhia, J.; Gill, D.O.; Barker, D.; Duda, M.G.; Huang, X.; Wang, W. A Description of the Advanced Research WRF Version 3; NCAR Technical Notes; National Center for Atmospheric Research: Boulder, CO, USA, 2008; Available online: http://www2.mmm.ucar.edu/wrf/users/docs/arw_v3.pdf (accessed on 19 August 2015).
  16. Kusaka, H.; Chen, F.; Tewari, M.; Duda, M.; Dudhia, J.; Miya, Y.; Akimoto, Y. Performance of the WRF model as high resolution regional climate model: Model intercomparison study. In Proceedings of the 7th International Conference on Urban Climate, Yokohama, Japan, 29 June–3 July 2009.
  17. Meng, W.G.; Zhang, Y.X.; Li, J.N.; Lin, W.S.; Dai, G.F.; Li, H.R. Application of WRF/UCM in the simulation of a heat wave event and urban heat island around Guangzhou. J. Trop. Meteorol. 2011, 3, 257–267. [Google Scholar]
  18. Kusaka, H.; Crook, A.; Dudhia, J.; Wada, K. Comparison of the WRF and MM5 models for simulation of heavy rainfall along the baiu front. SOLA 2005, 1, 197–200. [Google Scholar] [CrossRef]
  19. Lee, H.S.; Yamashita, T.; Hsu, J.R.C.; Ding, F. Integrated modeling of the dynamic meteorological and sea surface conditions during the passage of Typhoon Morakot. Dyn. Atmos. Oceans 2013, 59, 1–23. [Google Scholar] [CrossRef]
  20. Kitao, N.; Moriyama, M.; Nakajima, S.; Tanaka, T.; Takebayashi, H. The characteristics of urban heat island based on the comparison of temperature and wind field between present land cover and potential natural land cover. In Proceedings of the 7th International Conference on Urban Climate, Yokohama, Japan, 29 June–3 July 2009.
  21. National Centers for Environmental Prediction; National Weather Service; NOAA; U.S. Department of Commerce. NCEP FNL Operational Model Global Tropospheric Analyses, Continuing from July 1999. Available online: http://rda.ucar.edu/datasets/ds083.2/ (accessed on 6 February 2013).
  22. Nguyen, A.T.; Reiter, S. A climate analysis tool for passive heating and cooling strategies in hot humid climate based on Typical Meteorological Year data sets. Energy Build. 2014, 68, 756–763. [Google Scholar] [CrossRef]

