1. Introduction
Hot–humid climates present significant challenges in achieving indoor thermal comfort in residential buildings due to persistently high air temperatures, elevated relative humidity, and limited diurnal temperature variation [
1,
2,
3]. In Malaysia’s equatorial climate, outdoor temperatures frequently exceed 30 °C, while relative humidity remains above 70%, creating conditions that intensify indoor heat stress. As a result, residential buildings often rely heavily on mechanical cooling systems, leading to increased energy consumption, higher operational costs, and greater environmental impact. With rapid urbanisation and climate change further exacerbating thermal stress, there is an urgent need to explore sustainable and climate-responsive design strategies that can improve indoor comfort while reducing energy demand.
Passive design strategies, including natural ventilation, shading devices, building orientation, and material optimisation, have been widely recognised as effective approaches for mitigating heat gain and enhancing thermal comfort in tropical environments [
4,
5,
6]. These strategies utilise environmental forces such as wind and solar radiation to regulate indoor conditions without relying on active cooling systems. Previous studies have demonstrated that effective cross-ventilation, appropriate façade design, and strategic shading can significantly reduce indoor temperatures and improve occupant comfort [
7,
8,
9]. However, much of the existing research has focused on simulation-based analyses or institutional and commercial buildings [
10], with limited emphasis on real-world residential environments under naturally ventilated conditions.
Despite the growing interest in passive cooling, there remains a lack of empirical field-based evidence evaluating the performance of passive design strategies in Malaysian residential buildings [
11]. Existing studies often do not capture the complex interaction between microclimate conditions, building design, and occupant behaviour in real settings. This limitation hinders the ability of architects and designers to implement evidence-based solutions tailored to hot–humid climates. Therefore, this study aims to address this gap by conducting field measurements across three residential case studies in Selangor, Malaysia, to evaluate how passive design strategies influence operative temperature, ventilation performance, and adaptive thermal comfort in naturally ventilated homes [
11].
2. Problem Statement
Achieving thermal comfort in residential buildings located in hot–humid climates remains a persistent challenge due to the combined effects of high ambient temperatures, elevated humidity, and limited natural air movement. In many Malaysian homes, insufficient integration of passive design strategies results in poor indoor environmental conditions, leading to increased reliance on mechanical cooling systems [
1,
3]. This dependence contributes not only to higher energy consumption and operational costs but also to increased environmental impacts associated with building energy use [
2,
12].
Although passive design strategies are widely recognised as effective in improving indoor thermal conditions, their practical performance in real residential settings remains insufficiently understood. Many existing studies focus on non-residential buildings such as hospitals and institutional facilities or rely on simulation-based approaches, which may not accurately capture real occupant behaviour and dynamic climatic conditions [
10,
13,
14]. Furthermore, while passive strategies such as shading and envelope optimisation have been shown to reduce heat gain, their effectiveness varies significantly depending on ventilation performance and microclimatic conditions [
8,
15].
In addition, previous studies have demonstrated that thermal comfort in tropical climates is strongly influenced by air movement and adaptive occupant behaviour, particularly under high humidity conditions [
16,
17]. However, there remains limited field-based evidence that quantifies how key parameters, such as air velocity and mean radiant temperature, interact to influence operative temperature and adaptive comfort in real residential environments [
11,
18]. This lack of empirical data restricts the ability of designers and policymakers to implement evidence-based passive design strategies tailored to hot–humid climates.
Therefore, there is a need for in situ investigations that evaluate the real-world performance of passive design strategies under naturally ventilated conditions. This study addresses this gap by conducting field measurements across three residential case studies in Selangor, Malaysia, providing empirical insights into how passive design elements influence ventilation effectiveness, operative temperature, and adaptive thermal comfort in tropical residential buildings.
3. Adaptive Thermal Comfort Theory and Analytical Framework
This research is grounded in the Adaptive Thermal Comfort (ATC) theory, which posits that occupants of naturally ventilated buildings actively adjust their thermal expectations and behavioural responses in relation to prevailing outdoor climatic conditions. Rather than relying on fixed indoor temperature thresholds, thermal comfort is understood as a dynamic and adaptive process shaped by the interaction between environmental stimuli and occupants’ capacity to respond through behavioural, physiological, and psychological adjustments [
19,
20]. This adaptive capacity is particularly relevant in tropical climates where occupants frequently modify their behaviour, such as opening windows, adjusting clothing, or relocating within the dwelling to maintain comfort under fluctuating thermal conditions [
21,
22,
23].
Within this framework, outdoor climatic variables, including ambient temperature, relative humidity, and wind speed, interact with architectural and passive design characteristics, such as building orientation, envelope materiality, ventilation pathways, and shading strategies [
4,
5,
24]. These interactions influence key indoor environmental parameters, namely air temperature (
Ta), mean radiant temperature (
Tmrt), relative humidity (RH), and air velocity (
v), which together govern the thermal sensation experienced by occupants [
25].
Collectively, these parameters define the indoor operative temperature (
Top), which integrates convective and radiative heat exchange and is widely recognised as the most representative thermal comfort indicator for naturally ventilated buildings in hot–humid climates. Numerous empirical studies in tropical residential and institutional buildings have demonstrated that variations in envelope design, solar exposure, and ventilation effectiveness directly affect operative temperature profiles and perceived comfort outcomes [
13,
26,
27].
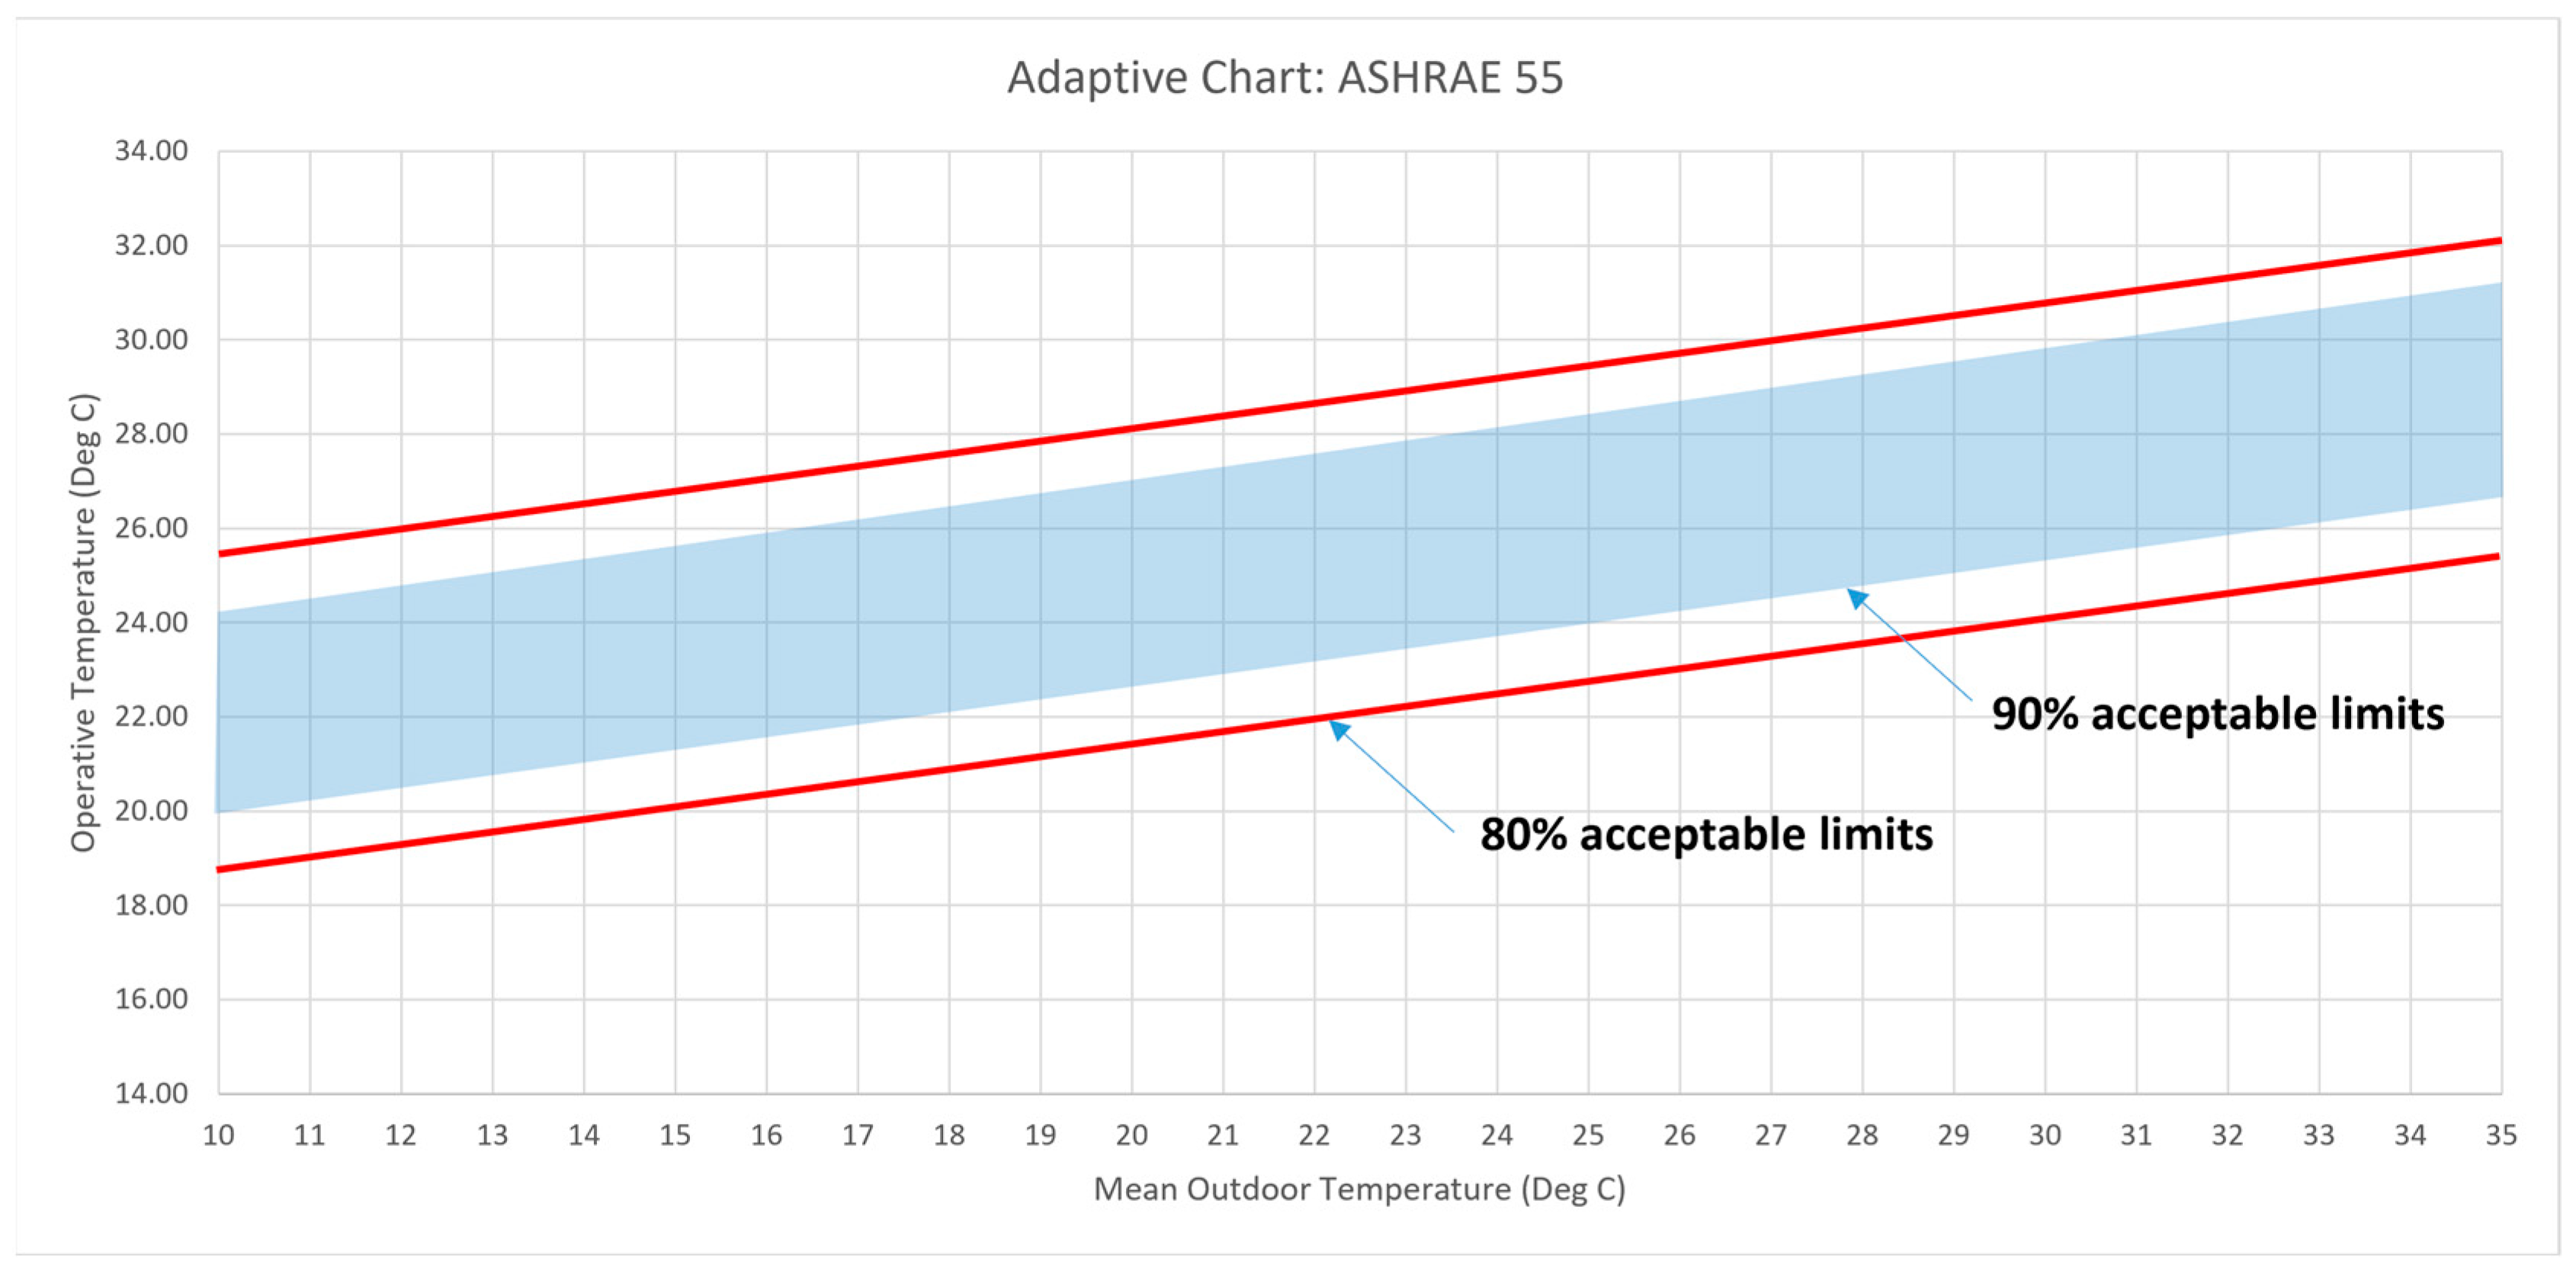
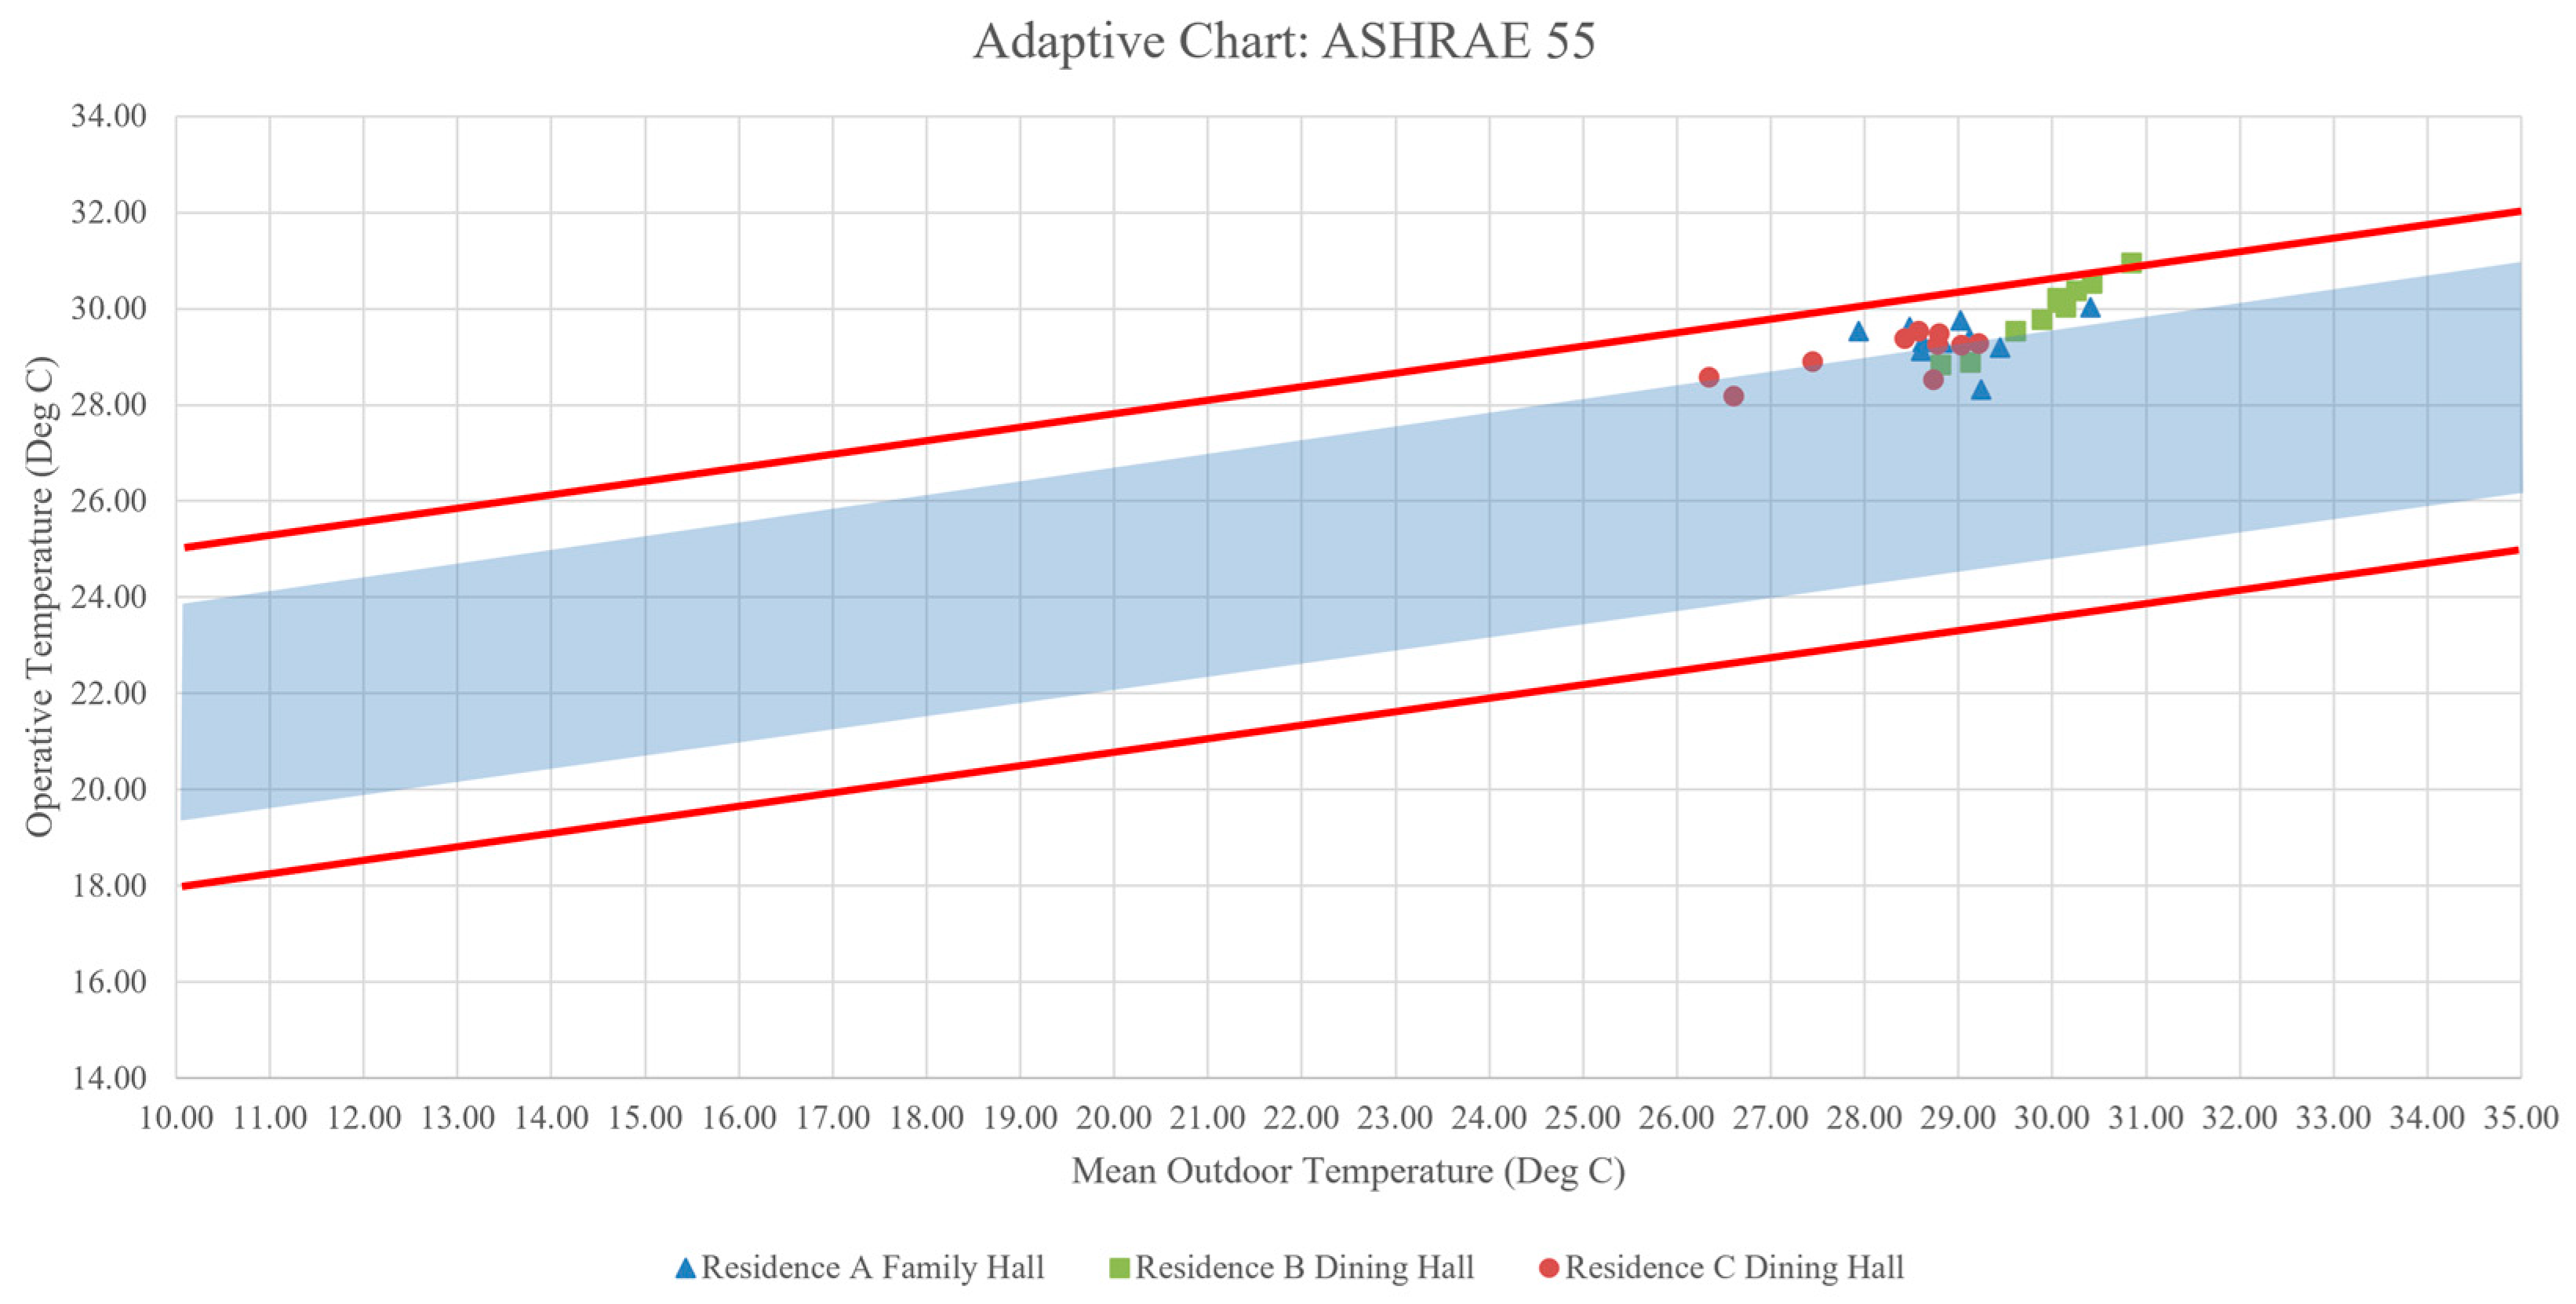
The ATC model provides the analytical basis for evaluating whether measured operative temperatures fall within the adaptive thermal acceptability limits defined in ASHRAE Standard 55 [
1] for naturally ventilated buildings. As illustrated in
Figure 1, thermal comfort is assessed using the 80% and 90% acceptability bands, which represent the indoor operative temperature ranges expected to satisfy at least 80% and 90% of occupants, respectively, under free-running conditions [
28,
29]. Operative temperatures within these bands indicate acceptable thermal conditions achieved through a combination of climatic moderation, architectural response, and occupant adaptation [
16,
19]. Conversely, temperatures exceeding the upper acceptability limit indicate environments perceived as excessively warm, often associated with insufficient external shading leading to elevated indoor mean radiant temperatures, limited air movement, or high radiant heat gains, while temperatures below the lower limit suggest thermally cool conditions that may arise during periods of reduced outdoor temperatures or increased air velocity [
20,
30]. In this study, Tₘᵣₜ was derived from globe thermometer measurements following ASHRAE 55 and ISO 7726 procedures, enabling accurate estimation of radiative heat exchange in each monitored space.
By integrating climatic drivers, architectural design strategies, indoor environmental responses, and adaptive comfort criteria, this theoretical framework establishes a clear causal pathway through which passive design measures influence thermal comfort performance. This approach enables a systematic and comparative evaluation of the effectiveness of passive design across the case-study residences. It provides a robust foundation for interpreting thermal comfort outcomes in hot–humid Malaysian residential contexts. This framework also enables comparative evaluation across the three case-study residences, highlighting how variations in ventilation pathways, shading effectiveness, and material thermal properties shape adaptive comfort outcomes.
6. Material and Methodology
To achieve the research objectives, a quantitative methodology will be implemented focusing on data collection, analysis, and comparison of three residential case studies in Selangor, Malaysia. For the first objective, the study will evaluate the impact of passive design strategies on operative temperature
Top and thermal comfort by conducting field measurements. Field measurements will include recording
Top using a globe thermometer to capture air temperature
Ta and
Tmrt, along with relative humidity and airflow using a hygrometer and an anemometer, respectively [
28,
29]. Outdoor climatic conditions, including temperature, humidity, and solar radiation, will also be monitored for contextual analysis. Thermal comfort will be assessed using the PMV/PPD (Predicted Mean Vote/Predicted Percentage of Dissatisfied) model as per ASHRAE 55 and ISO 7730 standards [
41]. Although PMV/PPD was calculated, ATC was used as the primary interpretive framework due to its suitability for naturally ventilated tropical dwellings.
For the second objective, the study will compare the thermal performance and occupant satisfaction of the two case studies by analysing architectural features, material specifications, ventilation patterns, and building orientation [
24]. Long-term monitoring of indoor conditions will be conducted over 10 days to capture variations in
Top,
Ta,
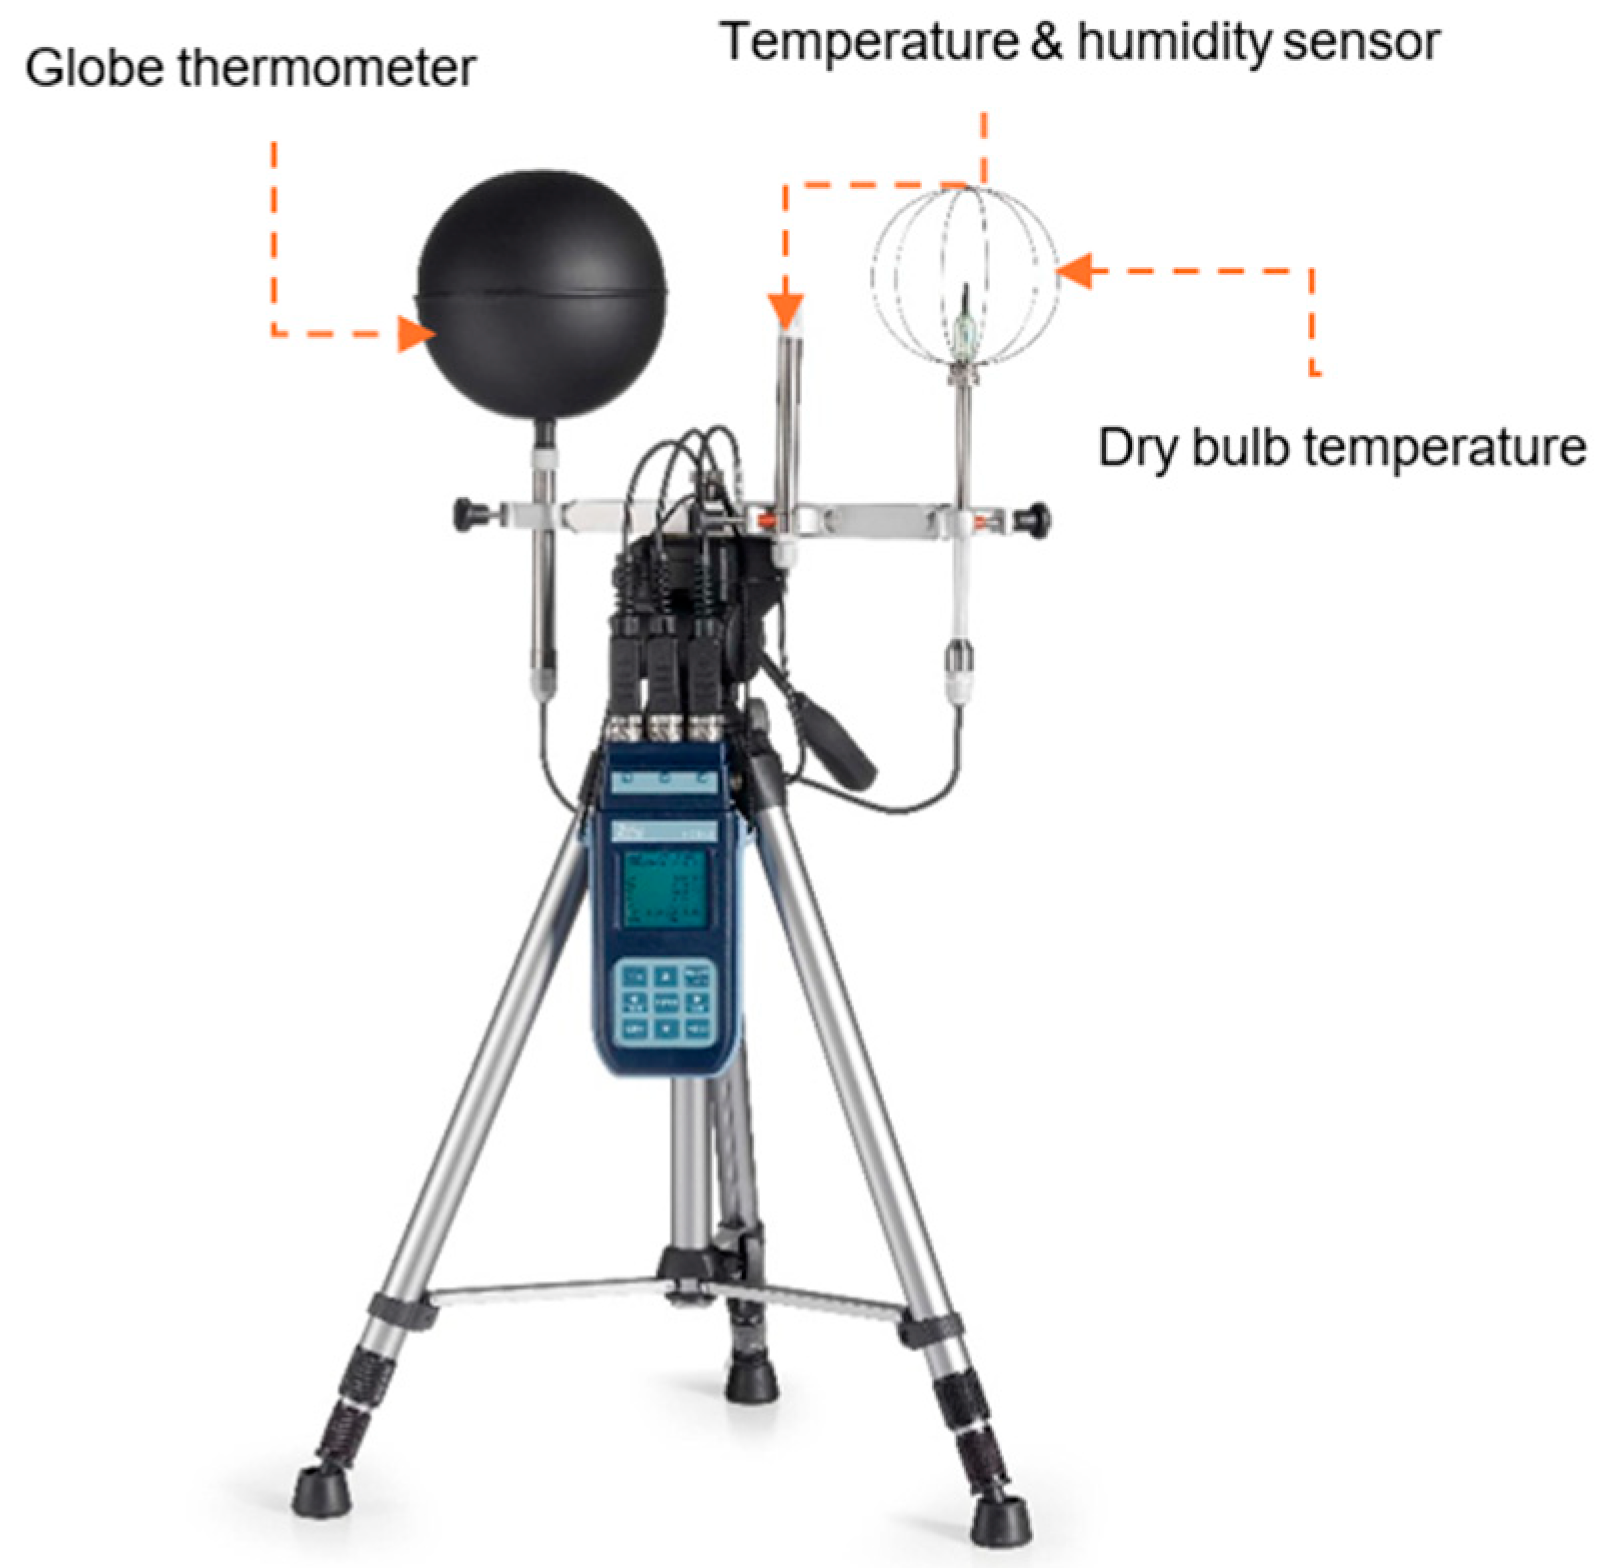
Tmrt, and humidity throughout the day. The Delta Ohm HD32.3 microclimate equipment measures air temperature (
Figure 2), globe temperature, relative humidity, air velocity, and mean radiant temperature in accordance with ASHRAE 55 and ISO 7730. Positioned 1.2 m above the floor, it captures thermal comfort at the occupant level. Measurements are taken indoors across three spaces at different times, morning, afternoon, and night, to assess diurnal fluctuations. The equipment enables real-time analysis, providing insights into passive design strategies such as cross-ventilation and stack ventilation, thereby aiding the evaluation of their short-term impact on occupant comfort [
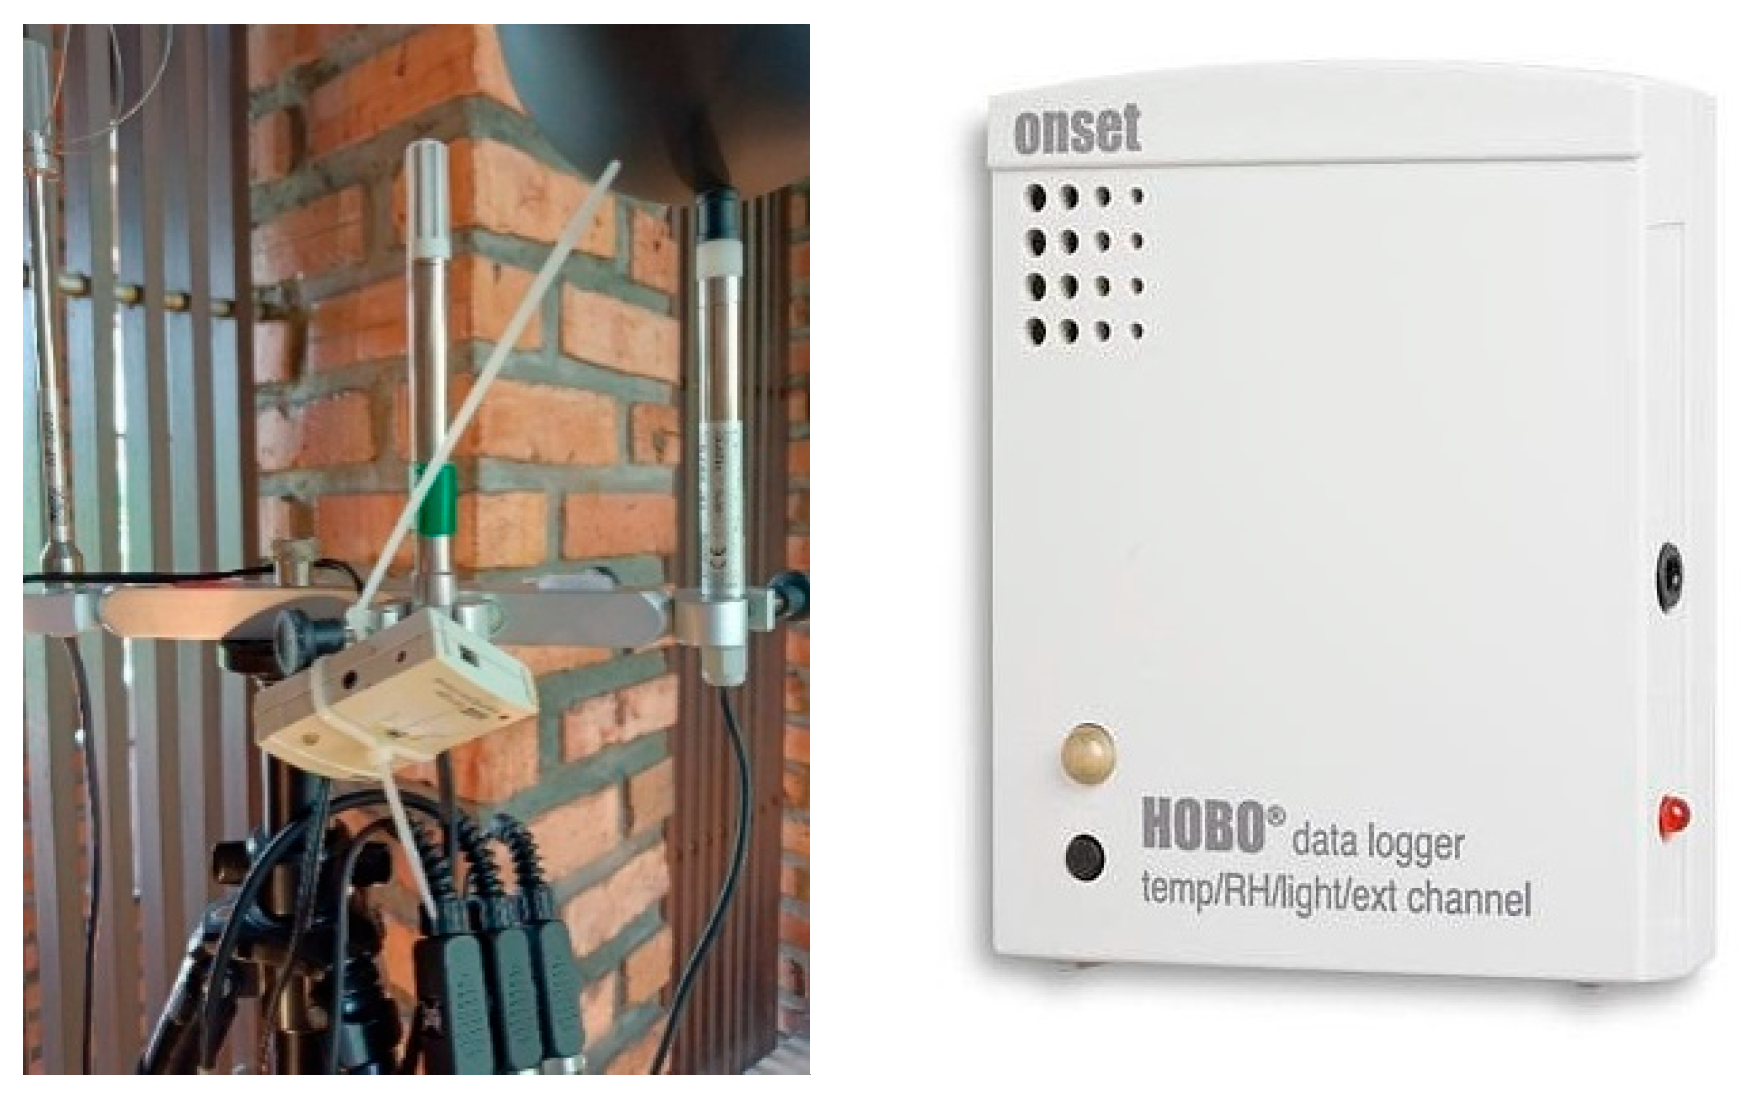
11]. The HOBO data logger records indoor temperature, relative humidity (RH), and outdoor ambient temperature (
Figure 3). Loggers are placed indoors at 1.2 m above the floor per ASHRAE standards, and outdoors in shaded, well-ventilated areas to minimise exposure to direct sunlight and precipitation.
HOBO data loggers monitor thermal comfort by recording temperature, humidity, light levels, and air movement. Following ASHRAE 55 guidelines, loggers were placed at 0.6 m for seated and 1.2 m for standing occupants in key indoor spaces. Positioned away from heat sources and sunlight, they recorded data every 5 min over 10 days. The findings were analysed using the Adaptive Comfort Model to assess compliance with ASHRAE 55 comfort thresholds. Data were recorded at 0.6 m and 1.2 m to assess potential vertical temperature stratification. The analysis revealed negligible differences (<0.5 °C) between the two heights, indicating well-mixed indoor air that complies with ASHRAE 55 thresholds. Because this difference is insignificant, the 1.2 m measurements were primarily used for the final thermal comfort evaluation to represent the heat exposure of an active occupant. The specifications of the measurement devices used in this study are presented in
Table 1.
Mean radiant temperature
was derived from black globe thermometer measurements in accordance with ISO 7726 [
42]. The parameter was calculated by correcting the measured globe temperature
with respect to the concurrent ambient air temperature
and air velocity
, using the following expression:
where
represents the globe diameter (0.15 m), and
denotes the emissivity of the black globe, typically assumed to be 0.95.
6.1. Operative Temperature
The operative temperature represents a combined index that incorporates the effects of both
Tmrt and dry-bulb air temperature, making it one of the most widely used indicators of thermal comfort in naturally ventilated indoor environments. This parameter reflects the integrated influence of radiative and convective heat exchanges between occupants and their surrounding environment. The operative temperature can be determined using Equation (1):
where
is the operative temperature in °C;
is the linear radiative heat-transfer coefficient (W/m
2·°C);
is the convective heat-transfer coefficient (W/m
2·°C);
is the mean radiant temperature (°C); and
is the air temperature (°C) [
43].
To estimate operative temperature accurately, both radiative and convective heat-transfer coefficients must be known for the specific indoor thermal environment.
Radiative heat transfer is strongly influenced by surface emissivity, occupant posture, and surrounding enclosure geometry. For most indoor thermal conditions, the radiative heat-transfer coefficient can be assumed nearly constant [
44]. Previous studies have shown that a value of approximately 4.7 W/(m
2·K) is suitable for typical thermal comfort analyses [
24,
25]. When emissivity differs substantially from unity,
may be adjusted using Equation (2):
where
represents the average emissivity of the occupant’s body surface. Empirical measurements indicate that human skin emissivity is typically close to 0.95, allowing the use of a simplified constant in most building comfort assessments.
The convective heat-transfer coefficient,
depends primarily on airspeed–induced convection. Under natural ventilation conditions, convection can be expressed as a function of indoor air velocity. For low-speed air movement typically found in residential buildings,
may be estimated using the empirical relationship
where
is air velocity in m/s. This formulation reflects the enhanced convective heat transfer that arises when ventilation increases, directly affecting thermal perception and operative temperature. This empirical formulation is widely used in tropical comfort studies and is derived from natural convection correlations validated in ASHRAE Fundamentals [
24].
By integrating these coefficients, the operative temperature provides a robust and comprehensive representation of indoor thermal conditions. It is particularly suitable for hot–humid tropical dwellings, such as the two case-study houses examined in this research, where air movement, radiant loading, and envelope heat gain jointly contribute to occupants’ thermal comfort.
6.2. Background Climate Conditions
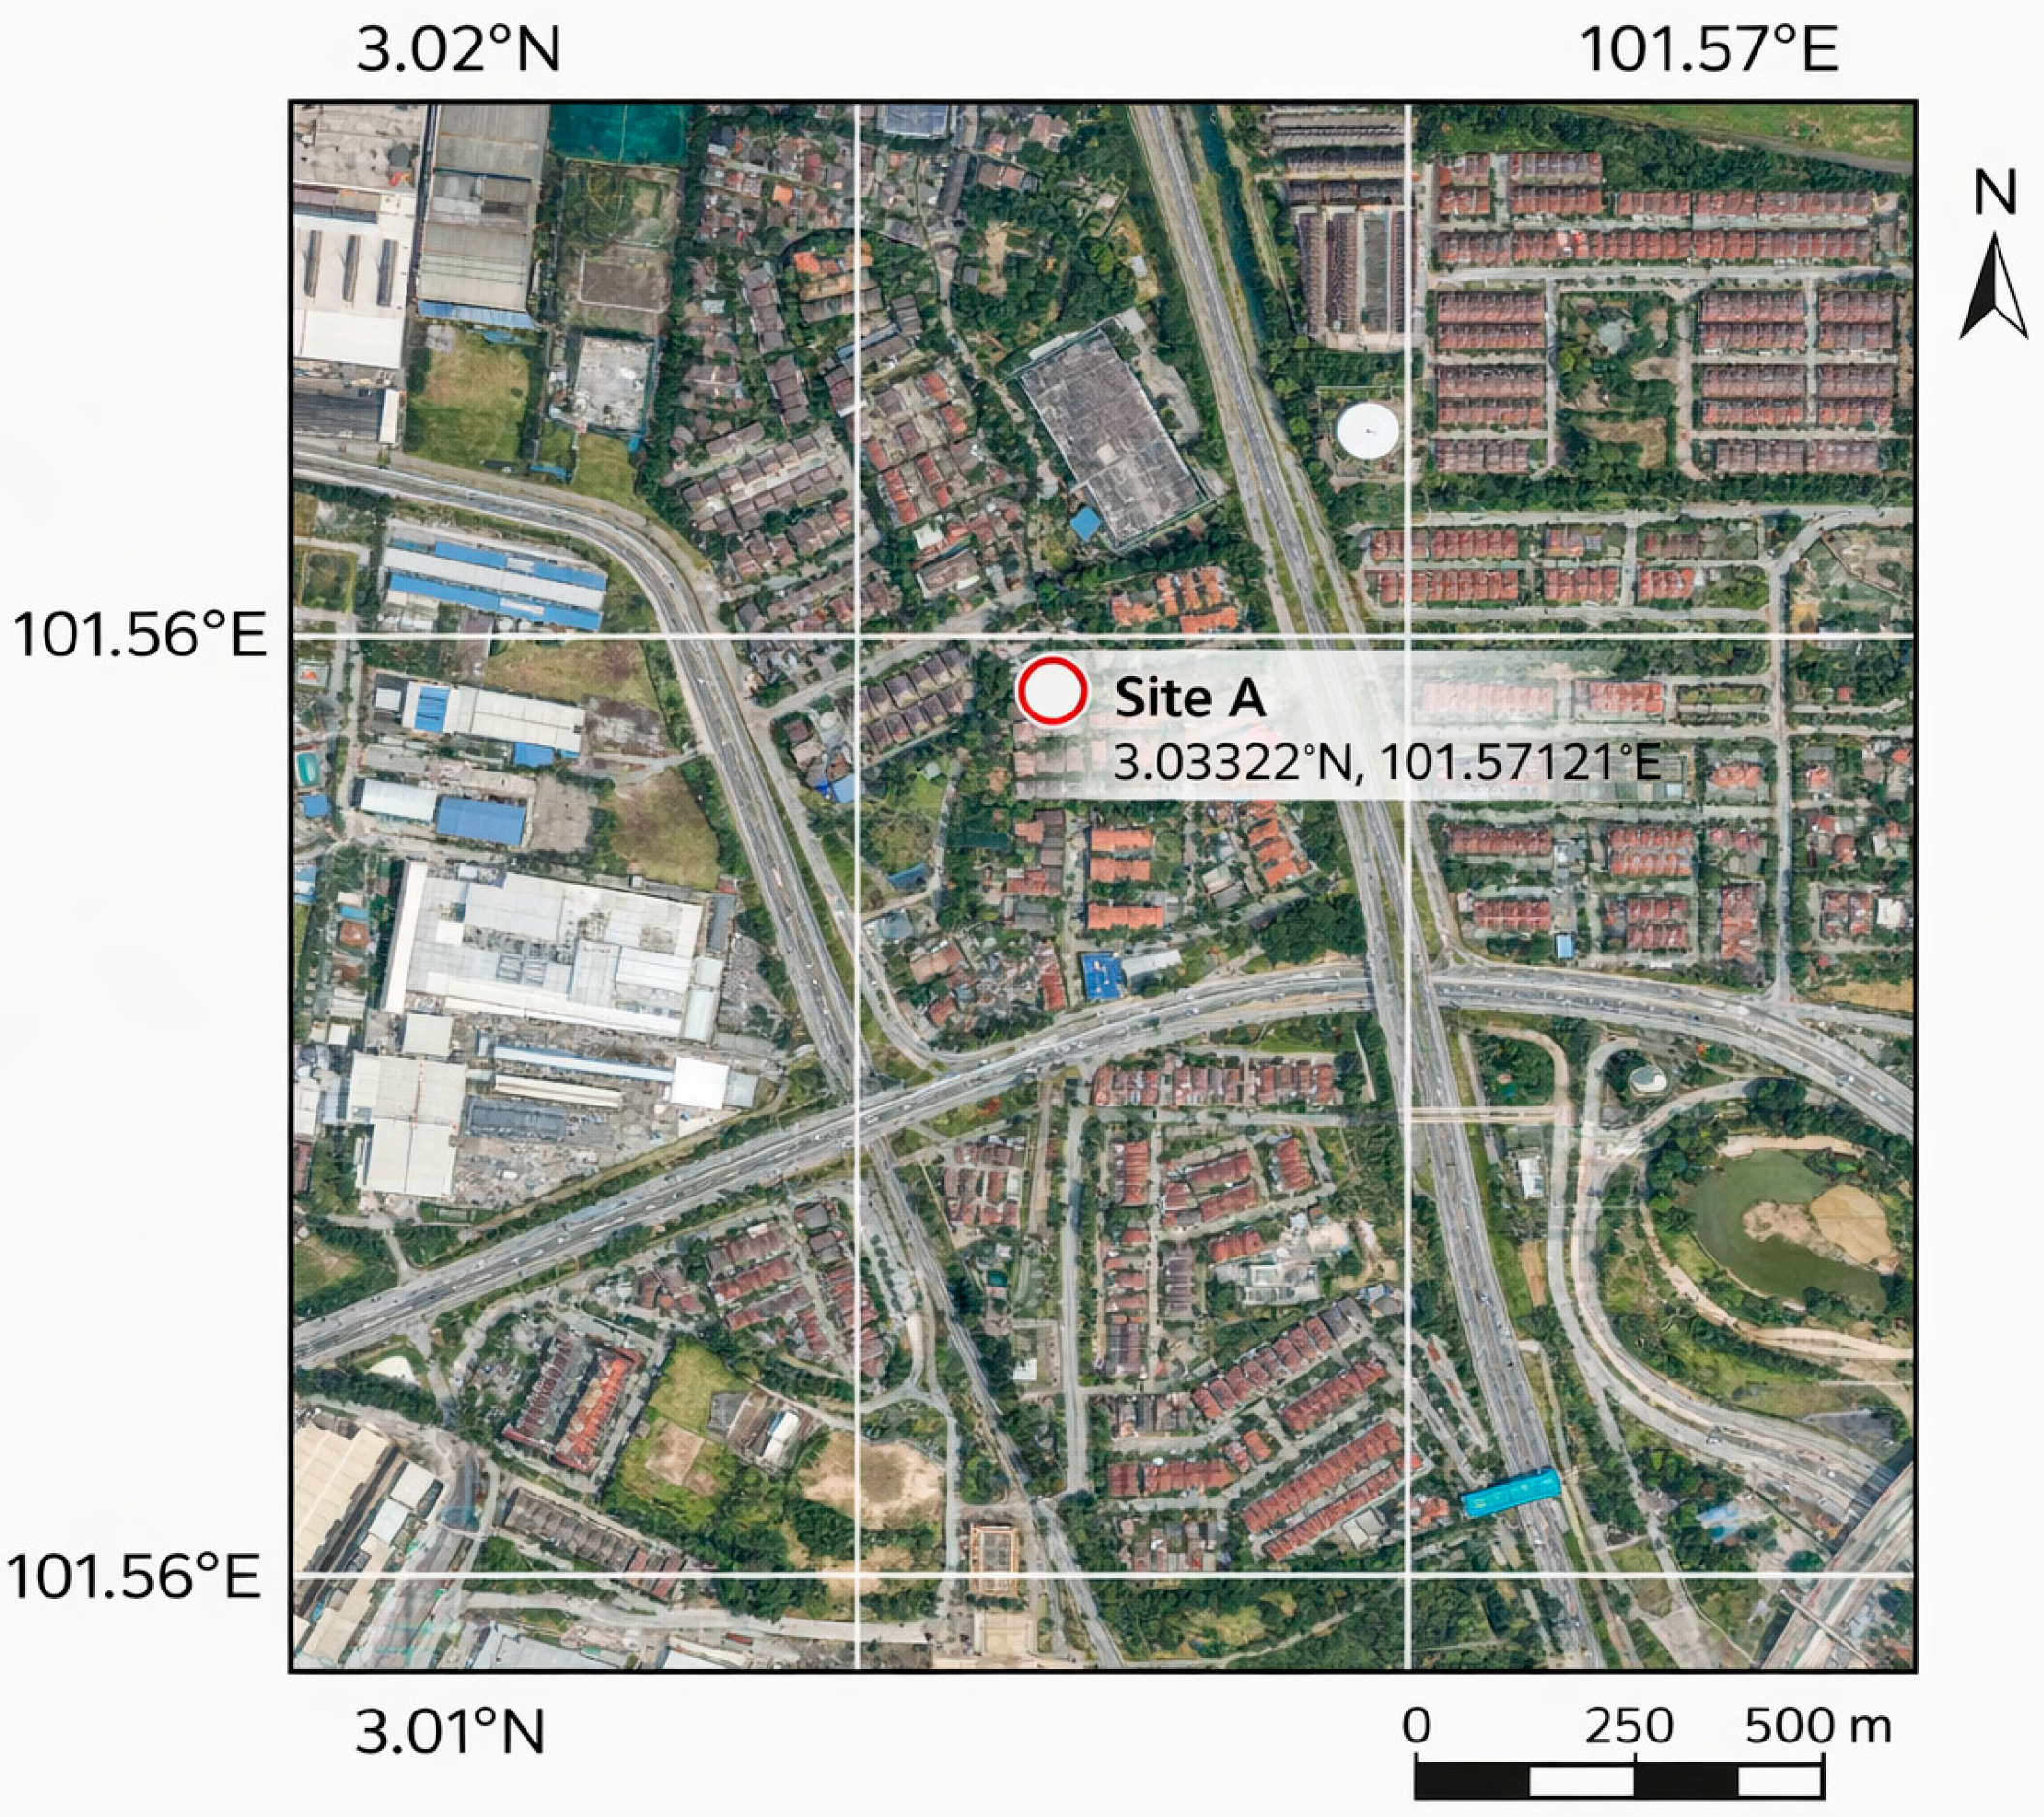
The study area within Malaysia’s Klang Valley is classified under the Köppen–Geiger Af (Tropical Rainforest) climate, characterised by uniform year-round temperatures, high humidity, and bi-annual monsoon regimes (Southwest and Northeast) rather than distinct thermal seasons [
45]. During the study period, typical hot–humid equatorial conditions prevailed: diurnal outdoor temperatures ranged from 24.0 °C at night to afternoon peaks of 34.0 °C, while relative humidity averaged between 75% and 85%, frequently exceeding 90% during early mornings or following precipitation. This persistent combination of high sensible and latent heat loads creates a highly challenging thermal environment, underscoring the critical need to optimise indoor air velocity and passive design strategies to achieve adaptive thermal comfort.
8. Results and Discussion
8.1. Indoor Thermal Conditions Across the Three Residential Spaces
8.1.1. Comparison Between Family Hall of Residence A, Dining Hall of Residence B and Dining Hall of Residence C
The monitored indoor environments across the three residences exhibit distinct thermal behaviours shaped by architectural configuration, ventilation characteristics, and exposure to external climatic conditions. Top, Tmrt, and indoor air velocity were assessed to evaluate the thermal comfort performance of each space under naturally ventilated conditions, with reference to the ASHRAE Standard 55 adaptive thermal comfort model.
Based on the ASHRAE Standard 55 adaptive comfort chart (80% and 90% acceptability limits), all recorded operative temperature data points for the three spaces fall within the 80% acceptability limits, confirming overall compliance with adaptive comfort expectations for naturally ventilated buildings in hot–humid climates. However, clearer differentiation emerges when the 90% acceptability band is considered. The Family Hall of Residence A demonstrates the strongest alignment with the 90% acceptability zone, with operative temperatures consistently clustered around 28.5–29.8 °C despite outdoor running mean temperatures ranging from approximately 27 °C to 29.5 °C. This stability reflects the combined influence of subgrade thermal mass, reduced solar exposure, and effective cross-ventilation. This tight clustering near the neutral comfort line indicates a highly adaptive indoor environment, attributable to subgrade thermal massing, minimal solar exposure, and reduced envelope heat exchange, which collectively dampen outdoor thermal fluctuations.
In contrast, the Dining Hall of Residence B exhibits operative temperatures predominantly positioned toward the upper boundary of the 80% acceptability band, with several data points approaching or marginally exceeding the 90% upper comfort threshold as outdoor temperatures rise above 30 °C. Operative temperatures ranging from approximately 29.5 °C to 31.2 °C suggest a warm-biased indoor condition with a narrower adaptive comfort margin, reflecting increased radiant heat gain from roof and façade exposure, coupled with limited shading and cross-ventilation effectiveness. Elevated Tₘᵣₜ values (>31 °C) and stagnant airflow (<0.10 m/s) contribute significantly to this thermal strain. Similarly, the Dining Hall of the Dato Elias’s residence displays a comparable adaptive pattern, though with slightly better alignment to the 90% acceptability band than Residence B. Its operative temperatures remain largely within 29–30.5 °C, indicating moderate adaptive compliance but continued sensitivity to external climatic forcing due to above-grade construction and higher solar exposure.
Mean radiant temperature trends further reinforce these comfort distinctions. The Family Hall of Residence A maintains moderated
Tmrt values (approximately 29–29.8 °C), supporting its stable positioning within the 90% acceptability zone. Conversely, the dining halls of Residence B and Residence C frequently record T
r values approaching 30–31 °C, elevating operative temperature and perceived warmth, particularly during periods of high solar load. Collectively, while all three spaces satisfy the 80% adaptive comfort criterion, the Family Hall of Residence A demonstrates superior thermal resilience and occupant comfort robustness, whereas the dining halls operate closer to the upper adaptive limits, making them more susceptible to discomfort under intensified outdoor heat conditions.
Table 4 presents the dataset for the Family Hall of Residence A and the Dining Halls of Residences B and C. The comparison of these spaces is subsequently illustrated in
Figure 15.
8.1.2. Comparison Between Level 1 of Residence A, Level 1 Living Hall of Residence B and Level 1 Living Hall of Residence C
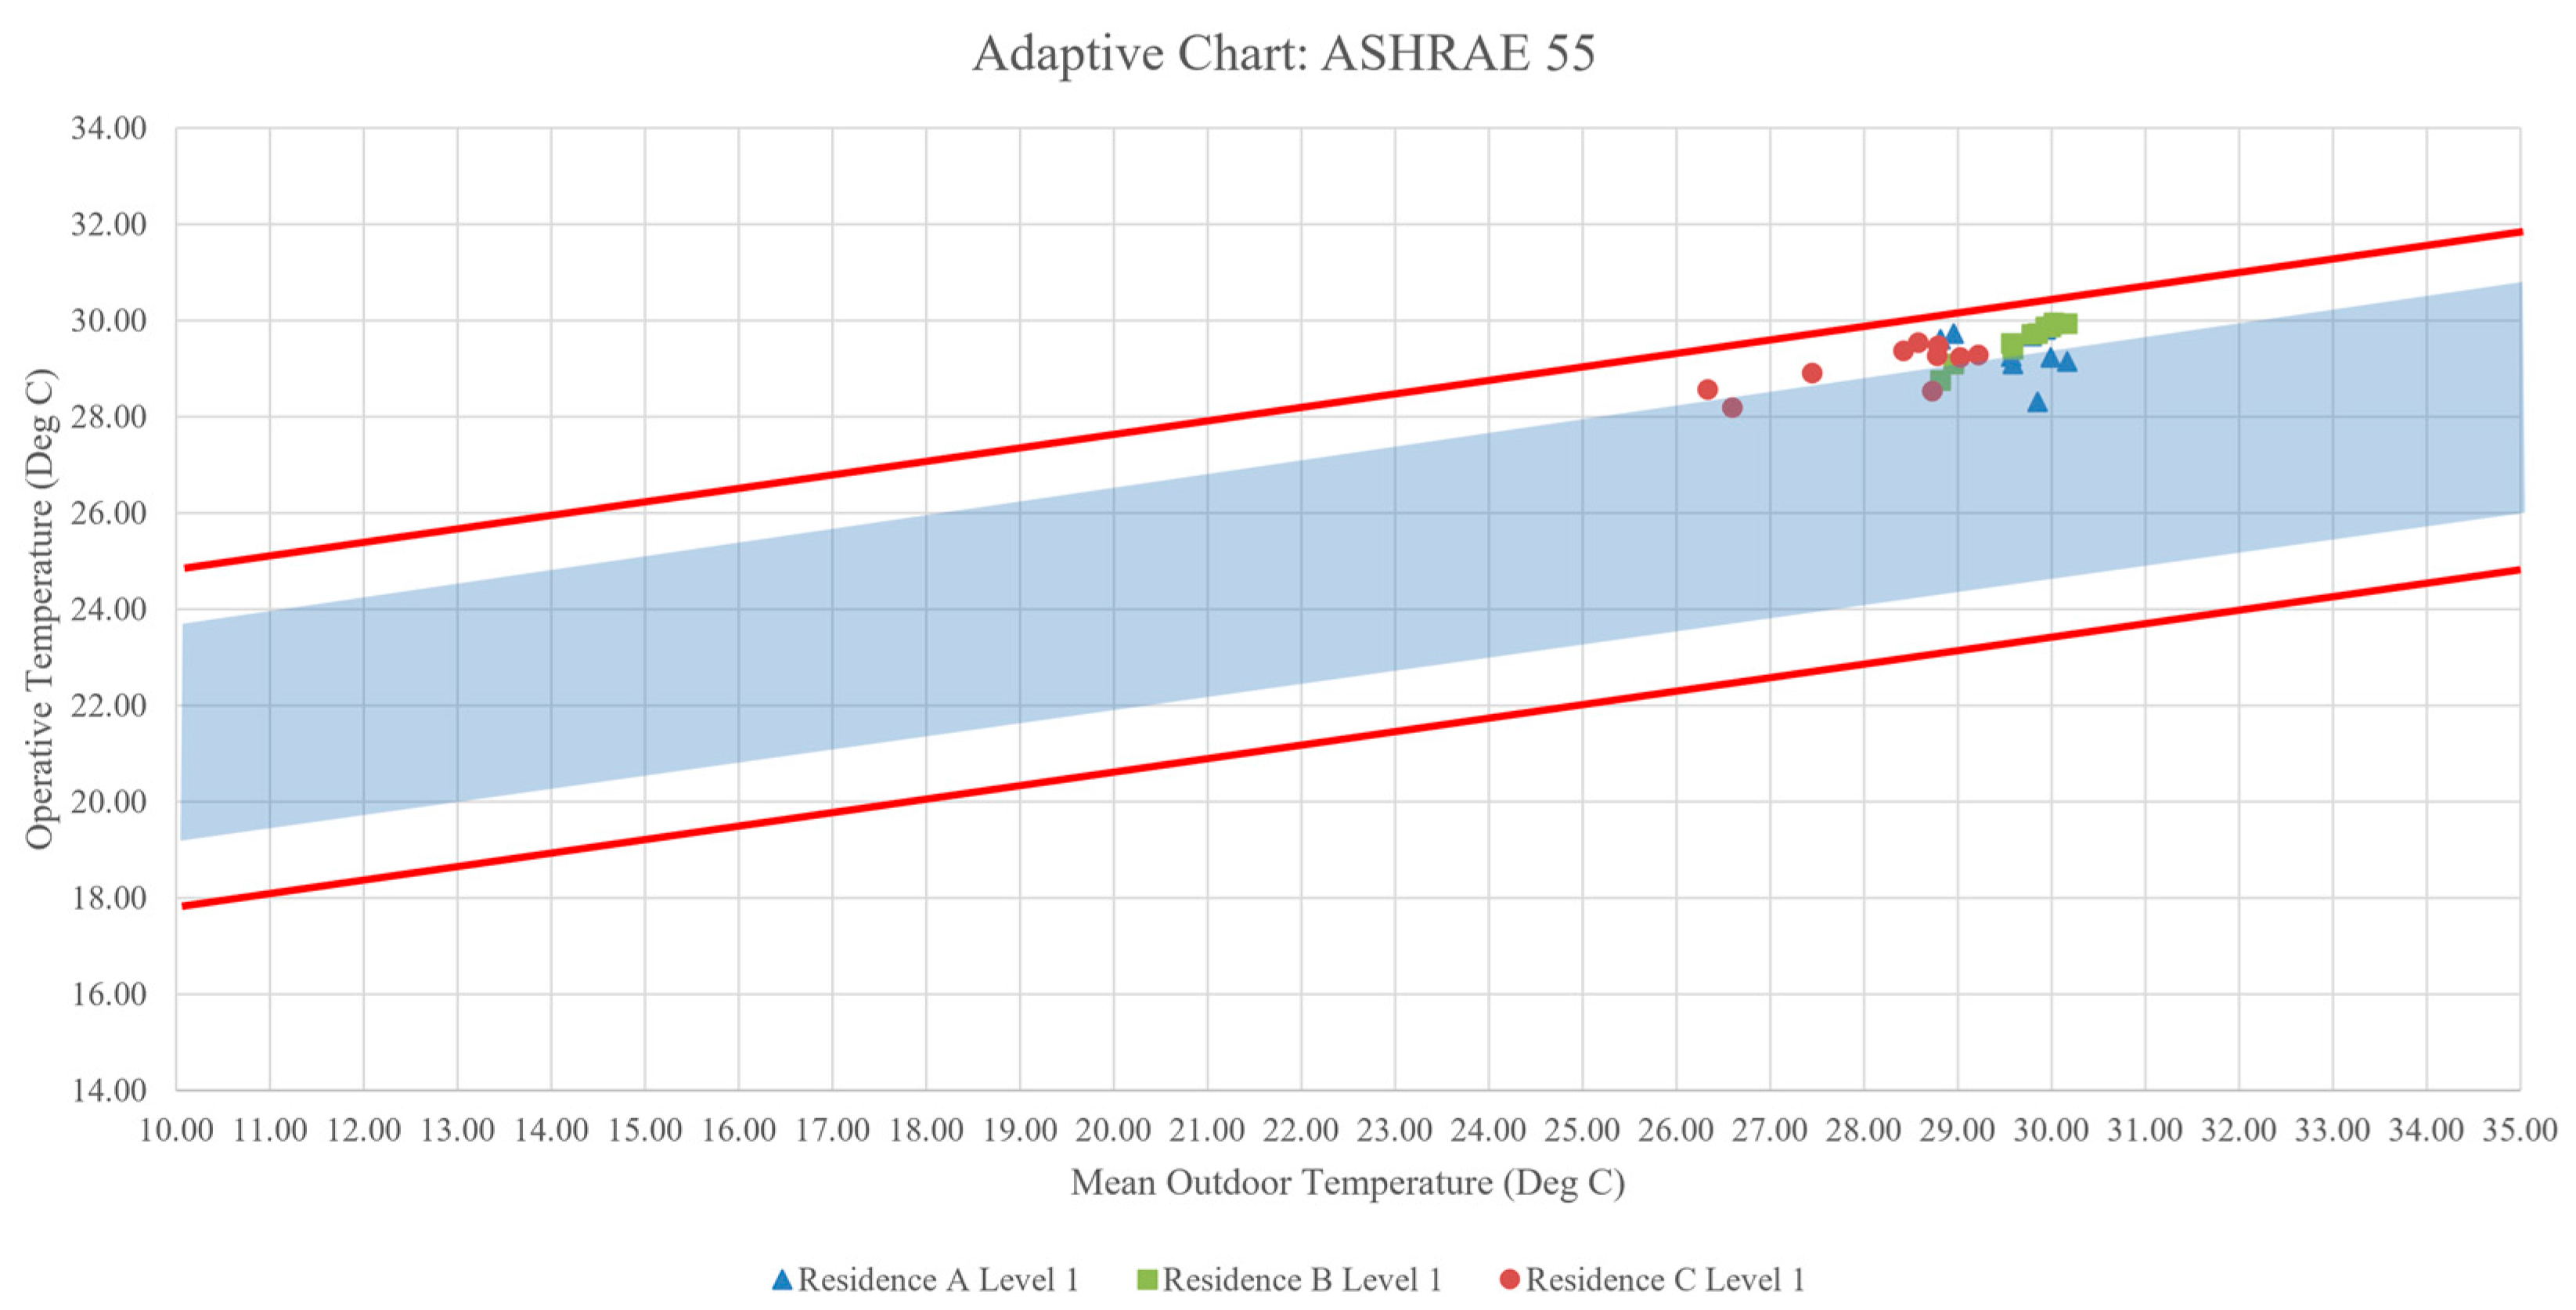
The monitored Level 1 indoor environments across the three residences exhibit clear differences in thermal behaviour shaped by ventilation effectiveness, radiant heat exposure, and the thermal performance of the building envelope. Top, Tmrt, and indoor air velocity were evaluated to characterise the comfort performance of each naturally ventilated space under typical tropical evening conditions, using the ASHRAE Standard 55 adaptive comfort model as a reference.
Based on the adaptive chart, all Level 1 data points for the three residences fall within the 80% acceptability limits, indicating that occupants are generally expected to adapt to the prevailing thermal conditions. However, differentiation becomes evident when assessed against the more stringent 90% acceptability band. The Level 1 space of Residence A demonstrates the strongest alignment with the 90% comfort zone, with operative temperatures consistently maintained between 28.3 °C and 29.9 °C despite outdoor temperatures fluctuating between 28.8 °C and 30.2 °C. The clustering of data points below the upper 90% boundary reflects effective moderation of both air and radiant temperatures, attributable to enhanced air movement, favourable airflow pathways, and reduced radiant heat gain. This indicates a robust passive thermal response with a wider comfort safety margin under adaptive conditions.
In comparison, the Level 1 Living Hall of the Dato Elias’s residence remains largely compliant with the upper range of the 90% acceptability band, though several data points trend closer to the boundary as outdoor temperatures increase. Operative temperatures ranging from 28.2 °C to 29.5 °C reflect a warm yet predictable indoor environment. Despite extremely low indoor air speeds, moderated mean radiant temperatures (≈28.2–29.5 °C) and a thermally responsive building envelope help constrain excessive heat accumulation. Consequently, the space maintains adaptive comfort compliance but exhibits reduced tolerance to further increases in outdoor temperature or radiant load.
The Level 1 Living Hall of Residence B records the warmest indoor conditions among the three case studies, with operative temperatures reaching up to 30.24 °C and rarely falling below 29 °C. While these conditions remain within the 80% acceptability limits, several data points approach or marginally exceed the upper boundary of the 90% comfort band, indicating a narrower adaptive comfort margin. The close coupling between indoor and outdoor temperatures suggests weak thermal buffering, with elevated
Tmrt values (≈29.5–30.2 °C) and minimal indoor air movement amplifying radiant heat dominance. As a result, the space is more susceptible to thermal discomfort during warmer periods, despite nominal compliance with adaptive comfort criteria. The dataset for Level 1 of Residence A, Level 1 Living Hall of Residence B, and Level 1 Living Hall of Residence C is presented in
Table 5. A comparison between Level 1 of Residence A, Level 1 Living Hall of Residence B, and Level 1 Living Hall of Residence C is shown in
Figure 16.
8.1.3. Comparison Between Level 2 Family Hall of Residence A, Level 2 Family Hall of Residence B and Level 2 Family Hall of Residence C
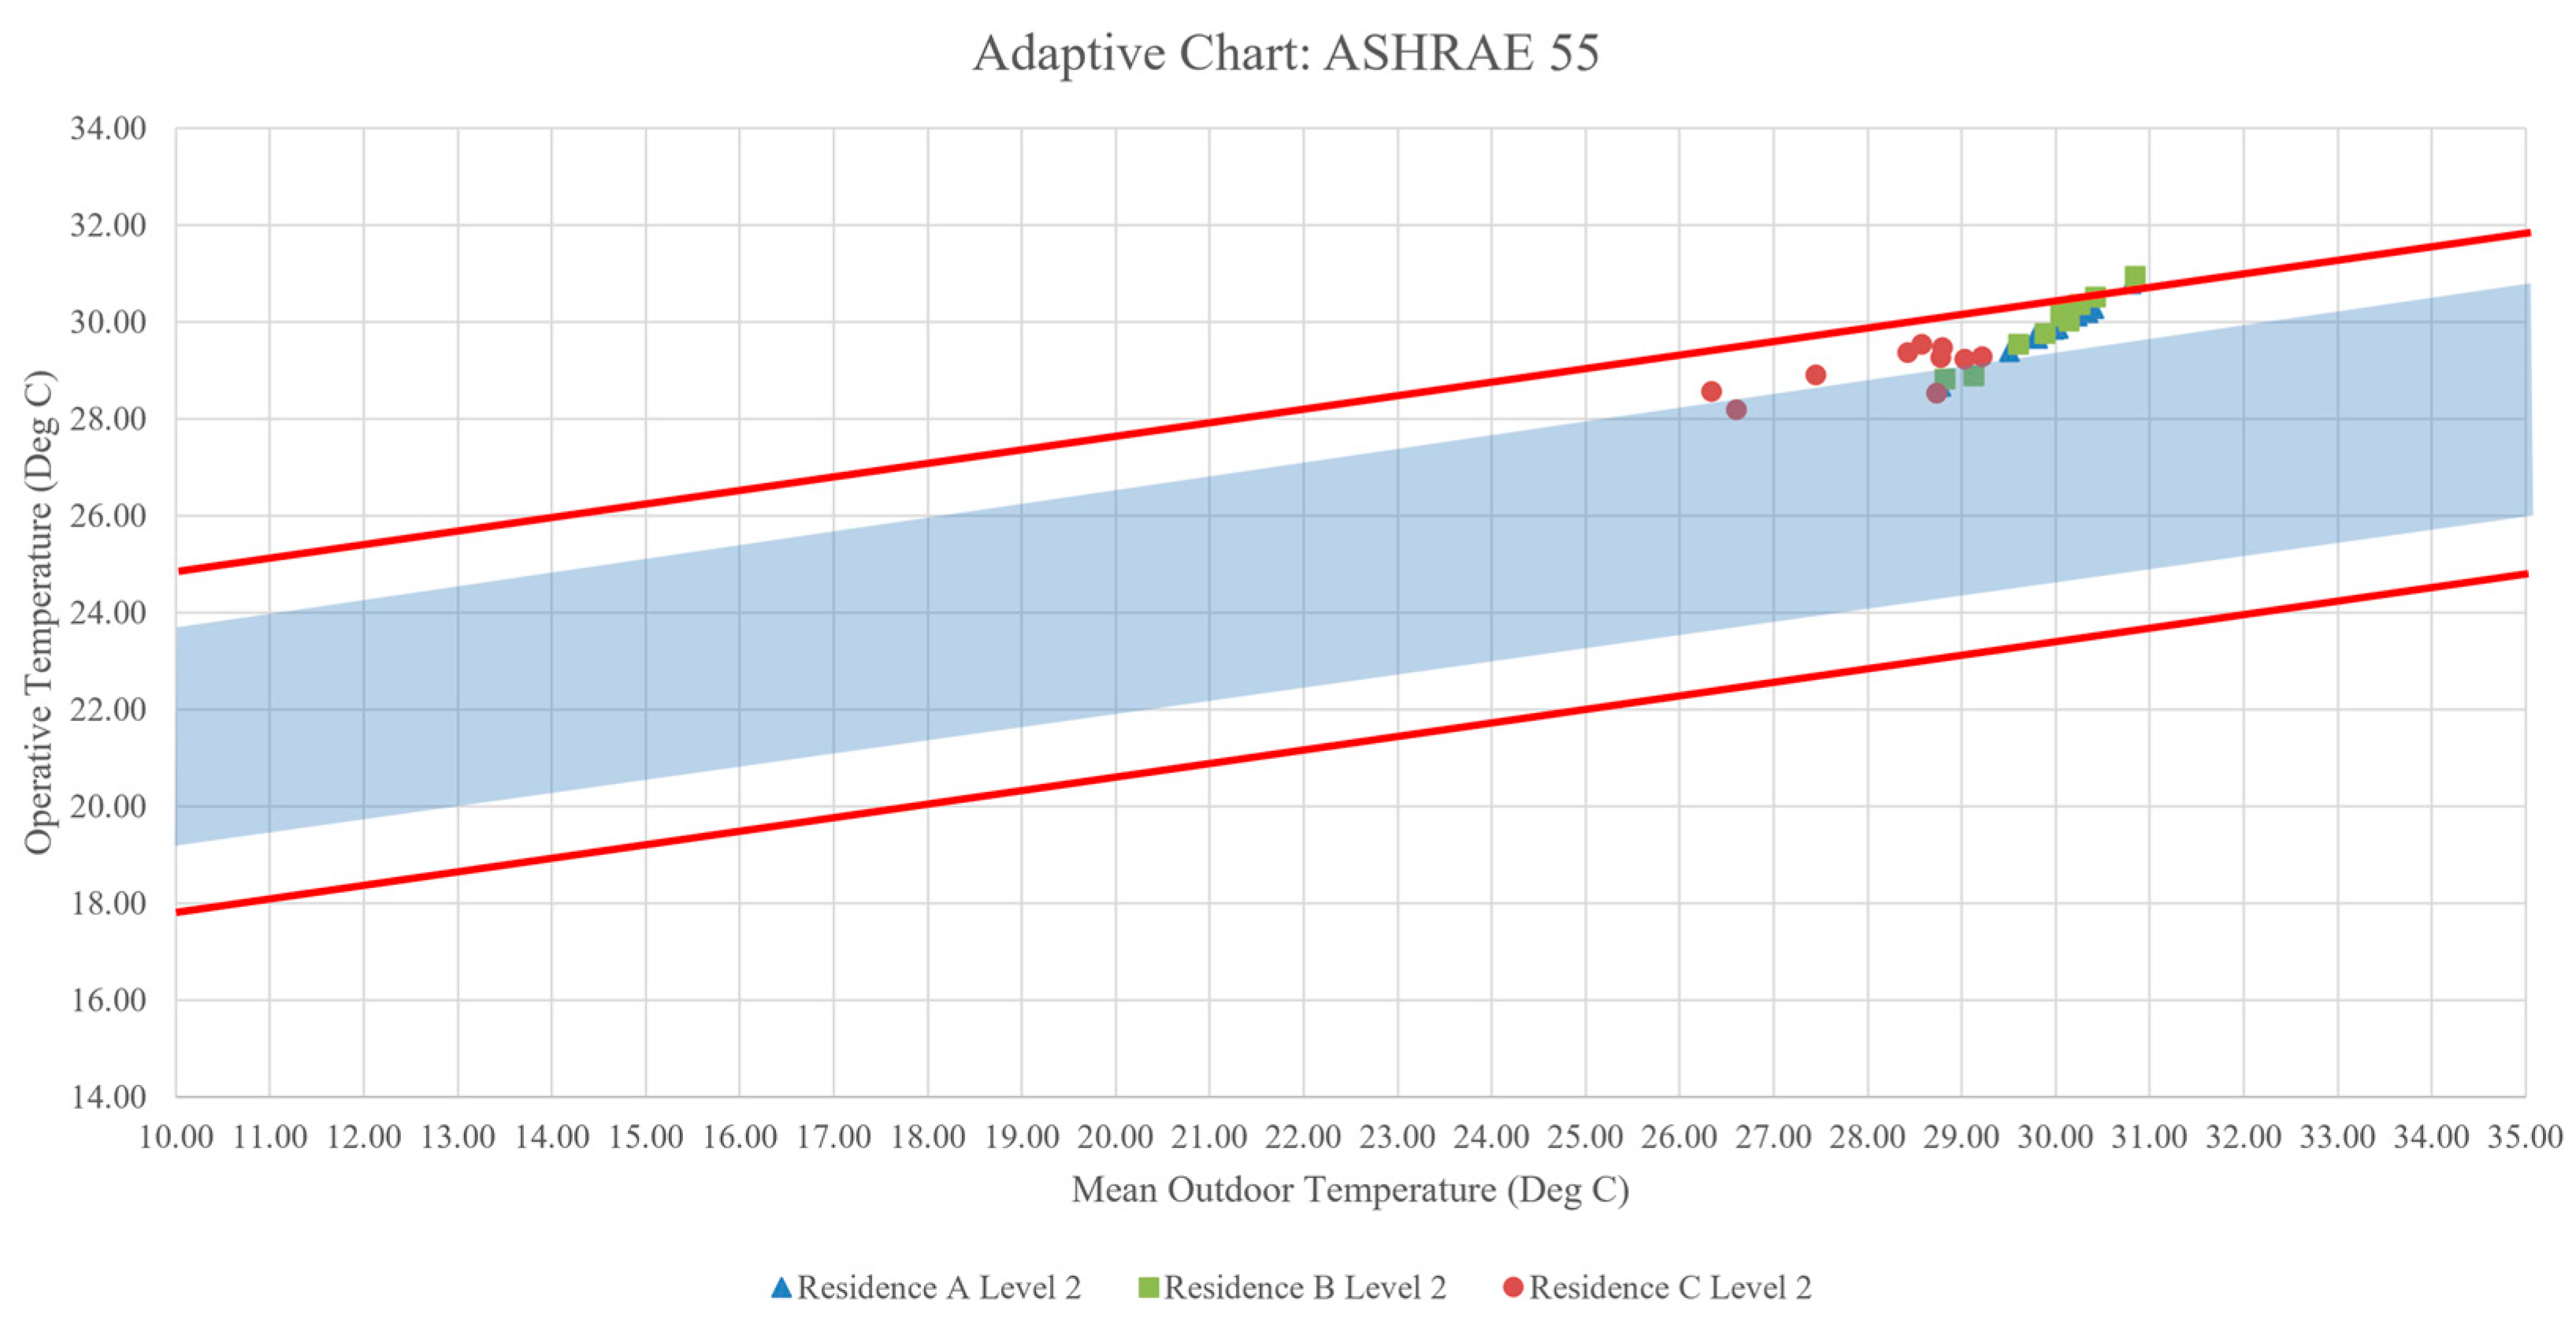
The indoor thermal environments of the three Level 2 residential spaces demonstrate distinct adaptive behaviours shaped by variations in ventilation effectiveness, radiant heat exposure, and upper-floor envelope performance. Operative temperature (top), mean radiant temperature (Tmrt), and indoor airspeed (v) were analysed to assess thermal comfort responses in spaces that are inherently more susceptible to solar heat gain and nocturnal heat retention. Performance was evaluated with reference to the ASHRAE Standard 55 adaptive comfort model.
Based on the adaptive chart, all Level 2 data points for the three residences remain within the 80% acceptability limits, indicating overall adaptive comfort compliance under naturally ventilated conditions. However, differentiation becomes more pronounced when assessed against the 90% acceptability band, revealing varying degrees of thermal robustness among the upper-floor spaces. The Level 2 Family Hall of Residence A shows the strongest alignment with the 90% comfort zone, with the majority of operative temperature readings (28.67–30.79 °C) clustering near or just below the upper 90% boundary despite outdoor running mean temperatures approaching 31 °C. This performance is supported by the highest indoor air velocities among the three spaces (0.09–0.19 m/s), which enhance convective heat dissipation and mitigate the impact of elevated radiant loads. Moderate Tmrt values (≈28.7–30.8 °C) further contribute to a wider adaptive comfort margin, demonstrating effective passive thermal moderation at the upper level.
In contrast, the Level 2 Family Hall of Residence C exhibits a warm yet exceptionally stable thermal profile, with operative temperatures confined to a narrow range between 28.19 °C and 29.54 °C. The adaptive chart indicates that these conditions remain comfortably within the central region of the 90% acceptability band, despite extremely low indoor air velocities (<0.04 m/s). This stability reflects strong thermal buffering provided by the building envelope, which limits radiant heat accumulation and moderates indoor temperature fluctuations. As a result, the space achieves adaptive comfort primarily through envelope performance rather than airflow-driven cooling, maintaining consistent thermal conditions even under warmer outdoor regimes.
The Level 2 Family Hall of Residence B records the warmest indoor conditions, with operative temperatures reaching up to 30.97 °C and rarely falling below 29 °C. While these values remain compliant with the 80% acceptability criteria, several data points approach or marginally exceed the upper boundary of the 90% comfort band, indicating a constrained adaptive comfort margin. Elevated mean radiant temperatures, frequently exceeding 31 °C, suggest significant heat absorption and re-radiation from roof and upper-level surfaces, consistent with limited insulation and strong solar exposure. Minimal indoor air movement (0.02–0.07 m/s) further restricts convective cooling, causing indoor conditions to track outdoor temperature variations closely. Consequently, this space exhibits the least thermally buffered behaviour among the Level 2 environments.
Collectively, the adaptive analysis highlights clear distinctions in upper-floor thermal resilience. While all Level 2 spaces satisfy the 80% adaptive comfort requirement, Residence A demonstrates the most balanced and robust performance through enhanced air movement, Residence C achieves stability through effective envelope moderation, and Residence B operates closest to the upper adaptive limits due to elevated radiant loads and stagnant airflow. These findings underscore the critical influence of roof design, shading strategies, ventilation pathways, and material thermal properties in governing adaptive comfort performance in upper-level residential spaces in hot–humid climates. The dataset for the Level 2 Family Hall of Residence A, Residence B, and Residence C is presented in
Table 6. A comparison between the Level 2 Family Hall of Residence A, Residence B, and Residence C is shown in
Figure 17.
8.2. Indoor Air Movement and Its Influence on Operative Temperature
8.2.1. Comparison Between Family Hall of Residence A, Dining Hall of Residence B and Dining Hall of Residence C
Significant variation in indoor airspeed was observed across the three residences, with direct implications for thermal comfort. Residence A’s Family Hall recorded substantially higher air velocities (0.45–0.65 m/s), which was attributed to advantageous airflow pathways or mechanical influences within the subgrade space. These velocities fall within the recommended range for comfort enhancement in naturally ventilated buildings (0.3–0.8 m/s), supporting convective cooling and compensating for warm ambient temperatures.
In contrast, the Dining Halls of Residence B and Residence C demonstrated consistently low air velocities, typically below 0.10 m/s, indicating stagnant air conditions with limited convective heat removal. The lack of substantial airflow coupled with higher Tr results in elevated operative temperatures, especially during late afternoon hours when solar gains peak. These findings highlight the sensitivity of warm-humid environments to ventilation performance, where even minor increases in airflow can significantly improve thermal acceptability.
8.2.2. Comparison Between Level 1 of Residence A, Level 1 Living Hall of Residence B and Level 1 Living Hall of Residence C
Distinct differences in indoor air movement were recorded across the three Level 1 residential spaces, with clear implications for thermal comfort and the resulting Top. The Level 1 of Residence A exhibited the highest air velocities among the three, ranging from 0.078–0.140 m/s. Although still below the ideal comfort-enhancing range of 0.3–0.8 m/s recommended for naturally ventilated tropical buildings, these airspeeds nonetheless provide meaningful convective cooling, helping to offset warm ambient conditions and contributing to the space’s consistently lower operative temperatures.
In contrast, the Level 1 Living Halls of Residence C and Residence B recorded significantly lower air velocities, often falling below 0.05 m/s. These stagnant air conditions greatly limit convective heat removal, making operative temperatures more heavily influenced by radiant and air temperatures. In Residence B’s Living Hall, this effect is amplified by elevated mean radiant temperatures (≈29.5–30.2 °C), resulting in consistently warm indoor environments approaching or exceeding 30 °C. Similarly, although the Living Hall of Residence C benefits from lower radiant loads, its limited air movement still restricts the space’s ability to dissipate accumulated indoor heat.
These findings reinforce the critical role of ventilation performance in warm–humid residential settings. Even modest increases in indoor airspeed can substantially improve thermal comfort by enhancing convective cooling, reducing radiant dominance, and lowering overall operative temperature. In all three houses, the data highlight that airflow, not just air temperature, is a key determinant of perceived comfort in naturally ventilated spaces.
8.2.3. Comparison Between Level 2 Family Hall of Residence A, Level 2 Family Hall of Residence B and Level 2 Family Hall of Residence C
Significant differences in indoor air movement were observed across the three Level 2 spaces, directly influencing convective cooling and the resulting operative temperature. The Level 2 Family Hall of Residence A recorded the highest indoor air velocities (0.09–0.19 m/s), providing meaningful convective heat removal despite warm ambient temperatures. Although these values remain below the optimal comfort-enhancing range for naturally ventilated buildings (0.3–0.8 m/s), they are substantially higher than those measured in the other two residences and contribute to more moderated operative temperatures and improved thermal perception. The elevated air movement also resulted in higher convective heat-transfer coefficients ( ≈ 3.48–5.25 W/m2K), reducing dependence on radiant cooling and enhancing the hall’s overall passive performance.
In contrast, the Level 2 Family Halls of Residence C and Residence B exhibited very low air velocities, typically below 0.07 m/s, indicating stagnant air conditions with limited convective cooling. For Residence C, airspeeds ranged from only 0.004–0.034 m/s, resulting in weak convective interactions ( < 2.3 W/m2K). Although this space benefitted from moderated radiant temperatures, the lack of airflow restricted its ability to dissipate indoor heat, maintaining a consistently warm but stable thermal environment. Residence B’s Level 2 Family Hall experienced similar limitations, with airspeeds between 0.02–0.07 m/s. Combined with elevated radiant loads (Tmrt frequently > 30 °C), this resulted in the warmest operative temperatures among all Level 2 spaces.
Overall, the Level 2 findings reinforce the critical role of airflow in shaping thermal comfort in warm–humid residential settings. Even small increases in indoor airspeed substantially improve convective cooling effectiveness, particularly in upper-floor spaces where radiant heat gain is significant. The contrast between Residence A and the other two residences highlights how ventilation pathways and architectural openness can meaningfully influence operative temperature in naturally ventilated homes.
8.3. Tmrt (Mean Radiation Temperature)
The mean radiant temperature (Tmrt) exhibited clear differences across the three Level 2 residential spaces, reflecting variations in roof-level heat exposure, insulation performance, and surface heat re-radiation. The Level 2 Family Hall of Residence B recorded the highest radiant temperatures, ranging from 28.87 °C to 31.05 °C, indicating substantial solar heat gain and limited insulation at the upper floor. The frequent occurrence of Tmrt values above 30 °C suggests that roof and ceiling surfaces act as significant heat sources during the evening period, contributing directly to elevated operative temperatures. In comparison, the Level 2 Family Hall of Residence A displayed moderated radiant conditions (28.73–30.81 °C), with fewer high-Tmrt peaks and a narrower overall range, likely due to improved roof shading or better thermal mass characteristics. The lowest radiant temperatures were observed in Residence C (28.20–29.55 °C), demonstrating effective control of upper-level heat gain and stronger evening cooling performance. These differences highlight the strong influence of solar exposure and envelope construction on thermal comfort in upper-floor spaces, whereby elevated Tmrt significantly amplifies perceived warmth in low-ventilation environments.
Furthermore, the mean radiant temperature (Tmrt) patterns across the three Level 1 residential spaces reveal distinct differences in radiant heat exposure and passive thermal performance. The Level 1 Living Hall of Residence B exhibited the highest radiant temperatures, with Tmrt values typically ranging from 28.75 °C to 30.21 °C, reflecting sustained evening heat retention from exposed wall surfaces and solar-exposed upper-level elements. Although not as extreme as its Level 2 counterpart, the consistently elevated Tmrt indicates that the space remains sensitive to daytime heat gains and re-radiation during night-time hours. In contrast, the Level 1 of Residence A displayed more moderated radiant conditions, with Tr values between 28.41 °C and 29.96 °C. The narrower Tr range suggests improved control of solar exposure, potentially due to shading, deeper floor plans, or reduced façade loading. Among the three, Residence C Level 1 Living Hall demonstrated the lowest radiant temperatures, ranging from 28.20 °C to 29.55 °C, indicating strong envelope moderation and limited radiant heat build-up across the monitored period. These differences highlight how architectural configuration and orientation shape radiant heat behaviour at the ground and intermediate levels, with elevated Tmrt values contributing to warmer operative temperatures especially in low-ventilation environments such as Residence B.
Meanwhile, the Tmrt patterns across the Family Hall and dining hall spaces show clear contrasts in radiant heat exposure and passive thermal moderation. The Family Hall of Residence A consistently recorded the lowest and most stable Tmrt values, typically centred around 28.5–29.5 °C, reflecting the strong thermal buffering provided by subgrade construction. The surrounding soil mass and absence of direct solar exposure reduce radiant heat gain substantially, resulting in a stable radiant environment that contributes directly to the Family Hall’s cooler operative temperatures. In contrast, both dining halls Residence B and Residence C displayed higher and more variable Tmrt values, commonly ranging between 29.0–30.5 °C. These elevated radiant temperatures are driven by increased exposure to façade surfaces, glazing, and lightweight upper-level roof structures that absorb and re-radiate heat during the late afternoon and evening hours. Among the two dining spaces, the Dining Hall of Residence B typically recorded the highest Tmrt peaks, highlighting greater susceptibility to solar gain and limited shading. These findings reinforce the significance of radiant heat control in open-plan dining areas, where higher Tmrt values can strongly elevate operative temperatures, particularly in naturally ventilated tropical dwellings lacking sufficient shading or thermal mass.
The findings of this study are consistent with established adaptive thermal comfort theory for hot–humid climates, particularly regarding the critical role of air movement in maintaining thermal acceptability. Previous studies have shown that elevated air velocity enhances convective and evaporative heat loss, thereby offsetting high temperature and humidity in naturally ventilated buildings [
20,
41,
47]. In this study, spaces with air velocities of 0.45–0.65 m/s remained within or close to the 90% adaptive comfort limits, supporting these findings.
In contrast, spaces with low air velocity (<0.10 m/s) exhibited reduced thermal acceptability, especially under high relative humidity conditions. This aligns with previous research indicating that high humidity suppresses evaporative cooling and increases thermal discomfort [
19,
48].
In addition to the overall thermal performance, vertical variations in thermal conditions were also examined. A further analysis was conducted to examine vertical variations in thermal conditions at different occupant levels (0.6 m and 1.2 m), representing seated and standing positions. The results indicate a consistent temperature difference ranging from approximately 0.3 °C to 0.5 °C, with slightly higher operative temperatures observed at 1.2 m.
Although this difference may appear small, it is not negligible, particularly when thermal conditions approach the upper 90% adaptive comfort threshold. This magnitude of variation is consistent with expected stratification effects in naturally ventilated spaces and is primarily attributed to limited air mixing under low air velocity conditions. In contrast, spaces with higher air velocities exhibited reduced temperature differences between the two levels, indicating improved vertical thermal uniformity. These findings highlight the importance of accounting for occupant level when evaluating thermal comfort performance in naturally ventilated buildings.
8.4. Influence of Surrounding Landscape and Urban Microclimate
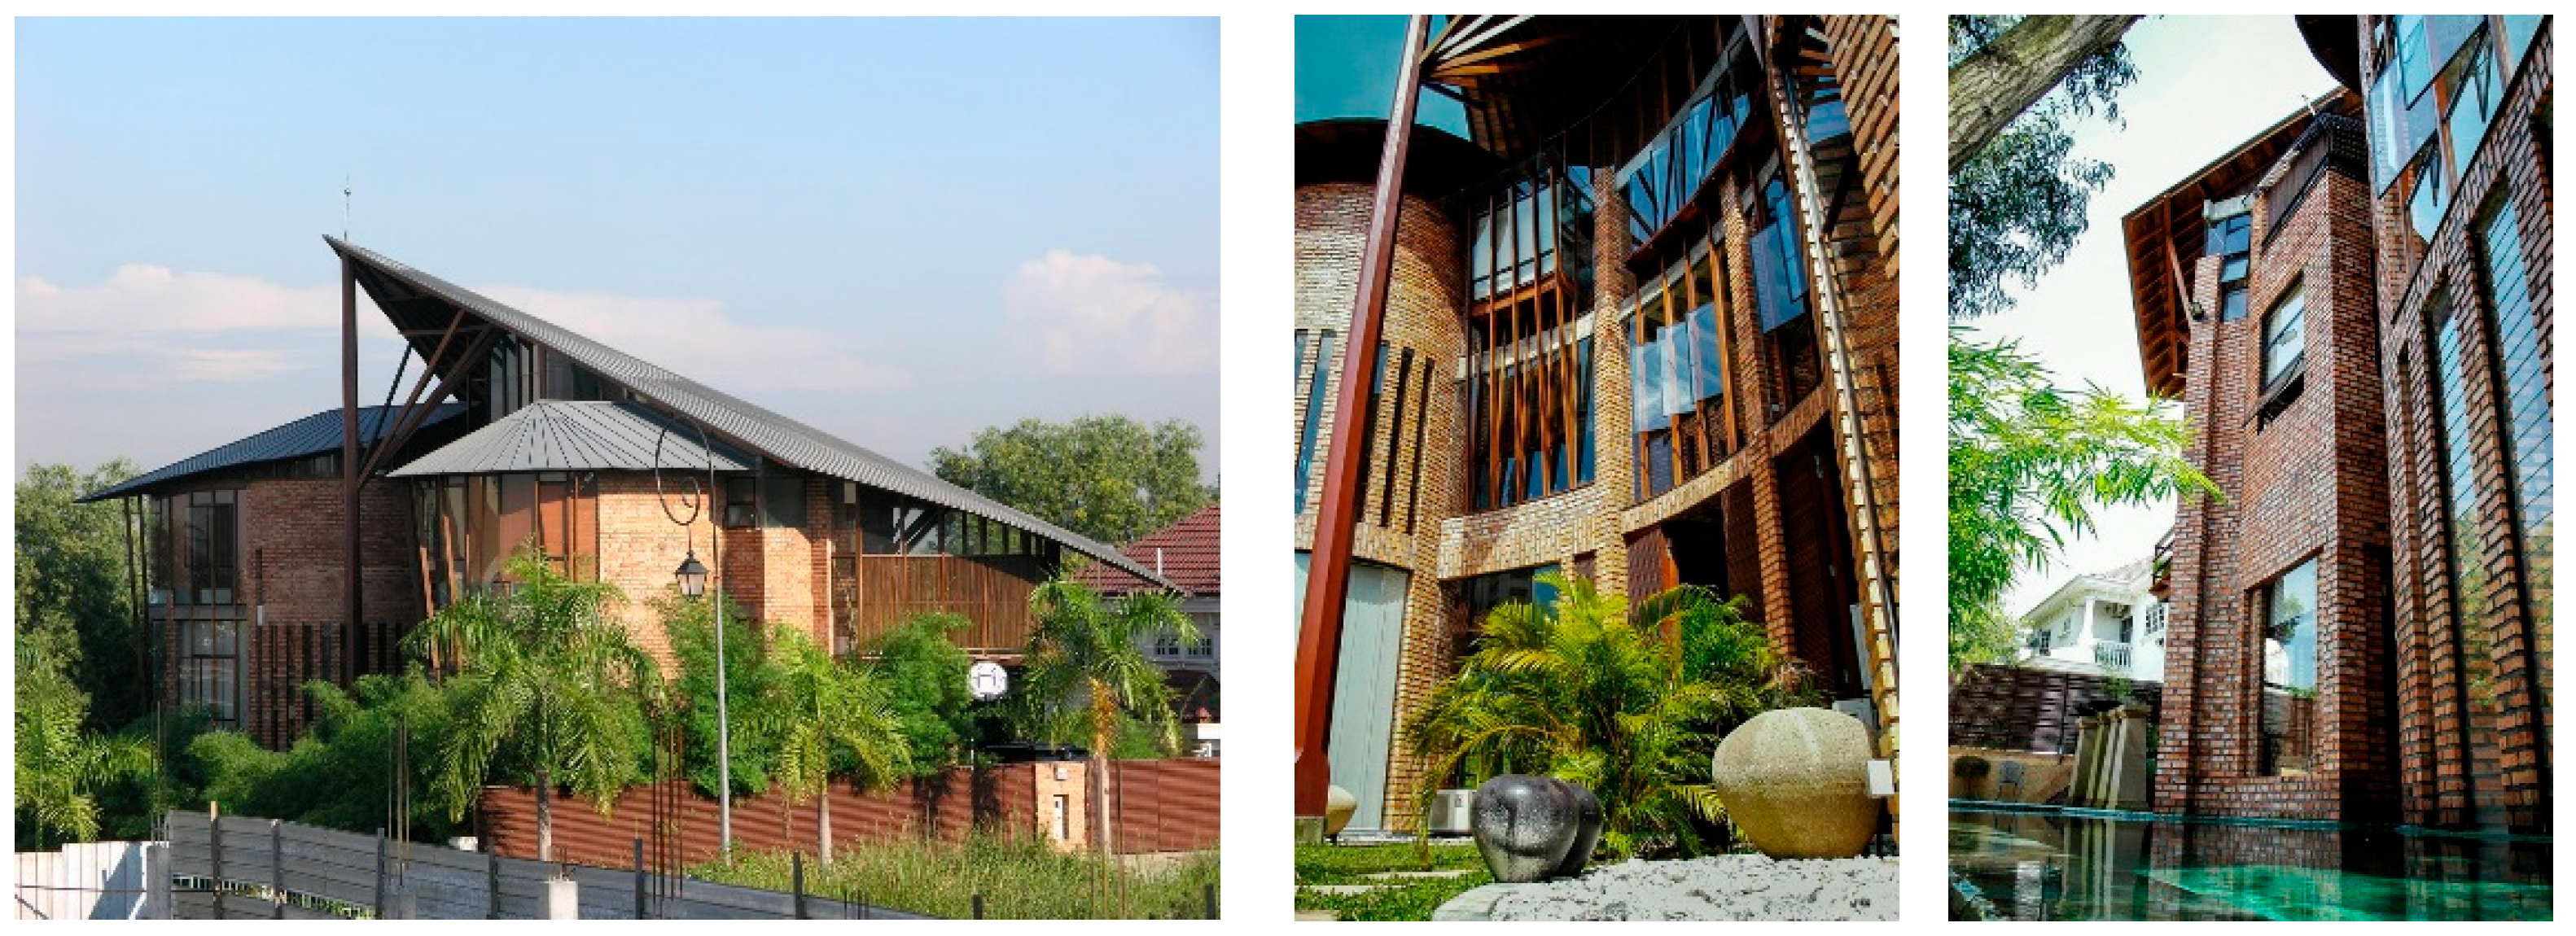
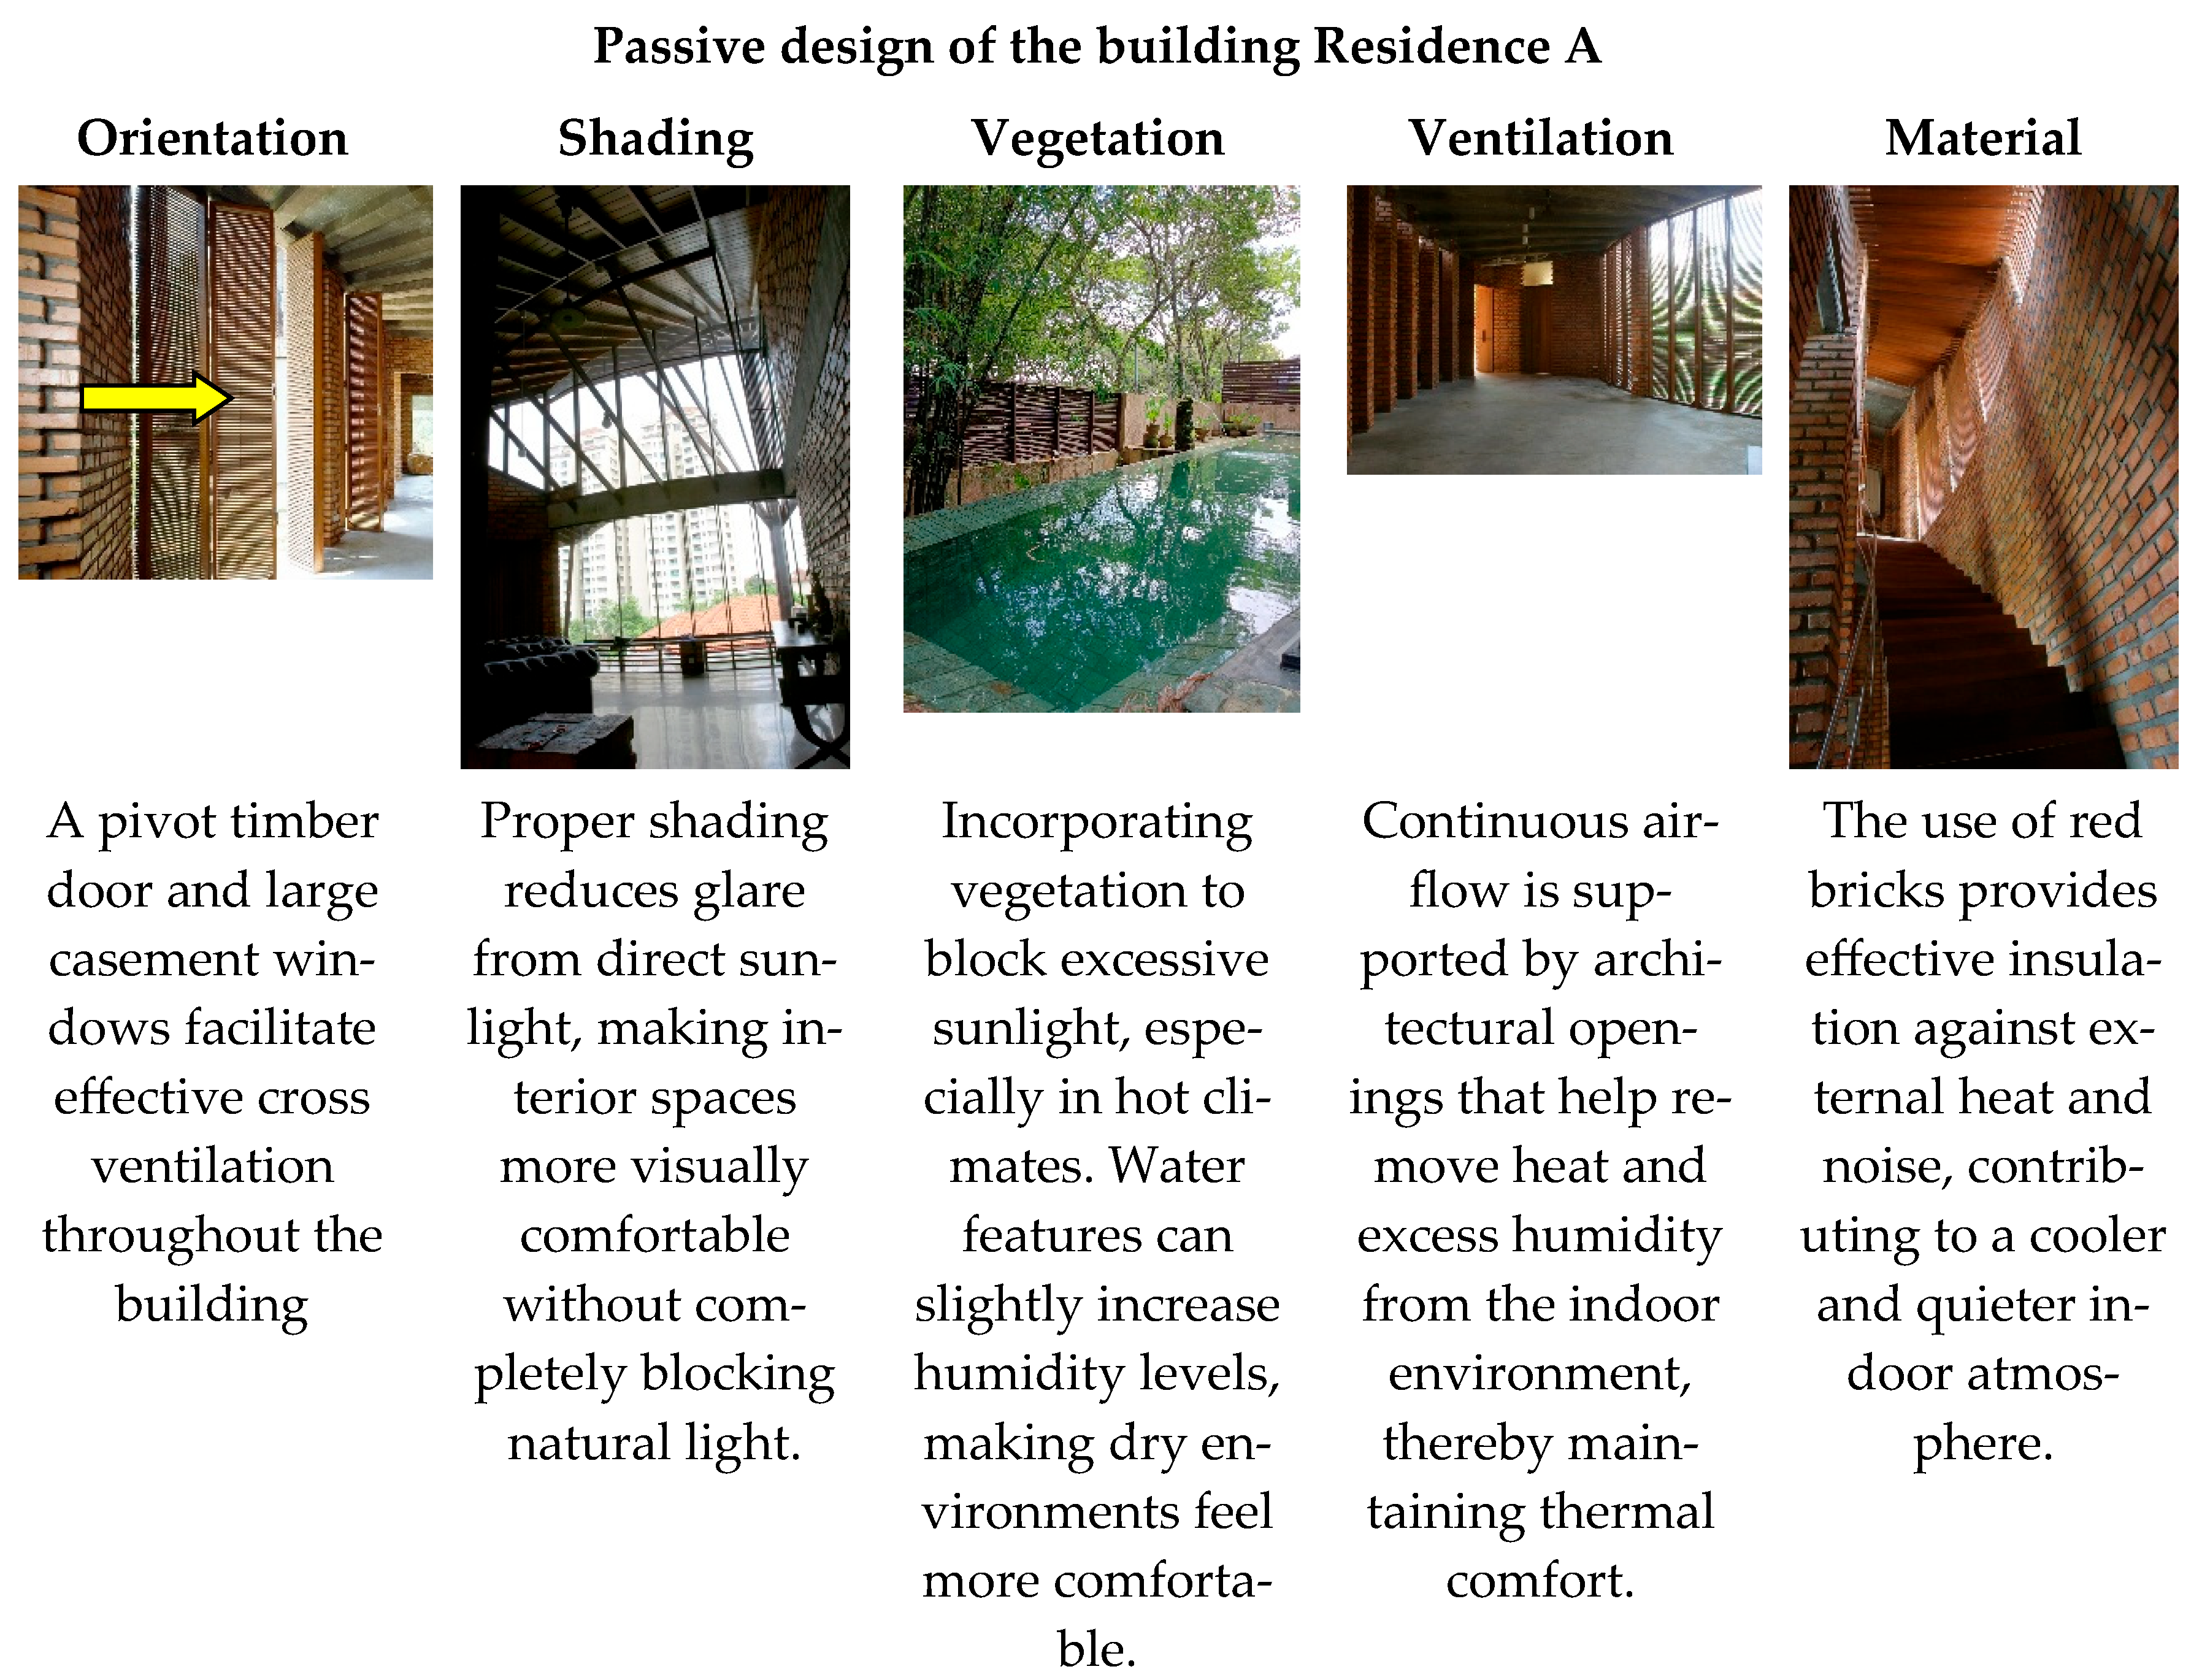
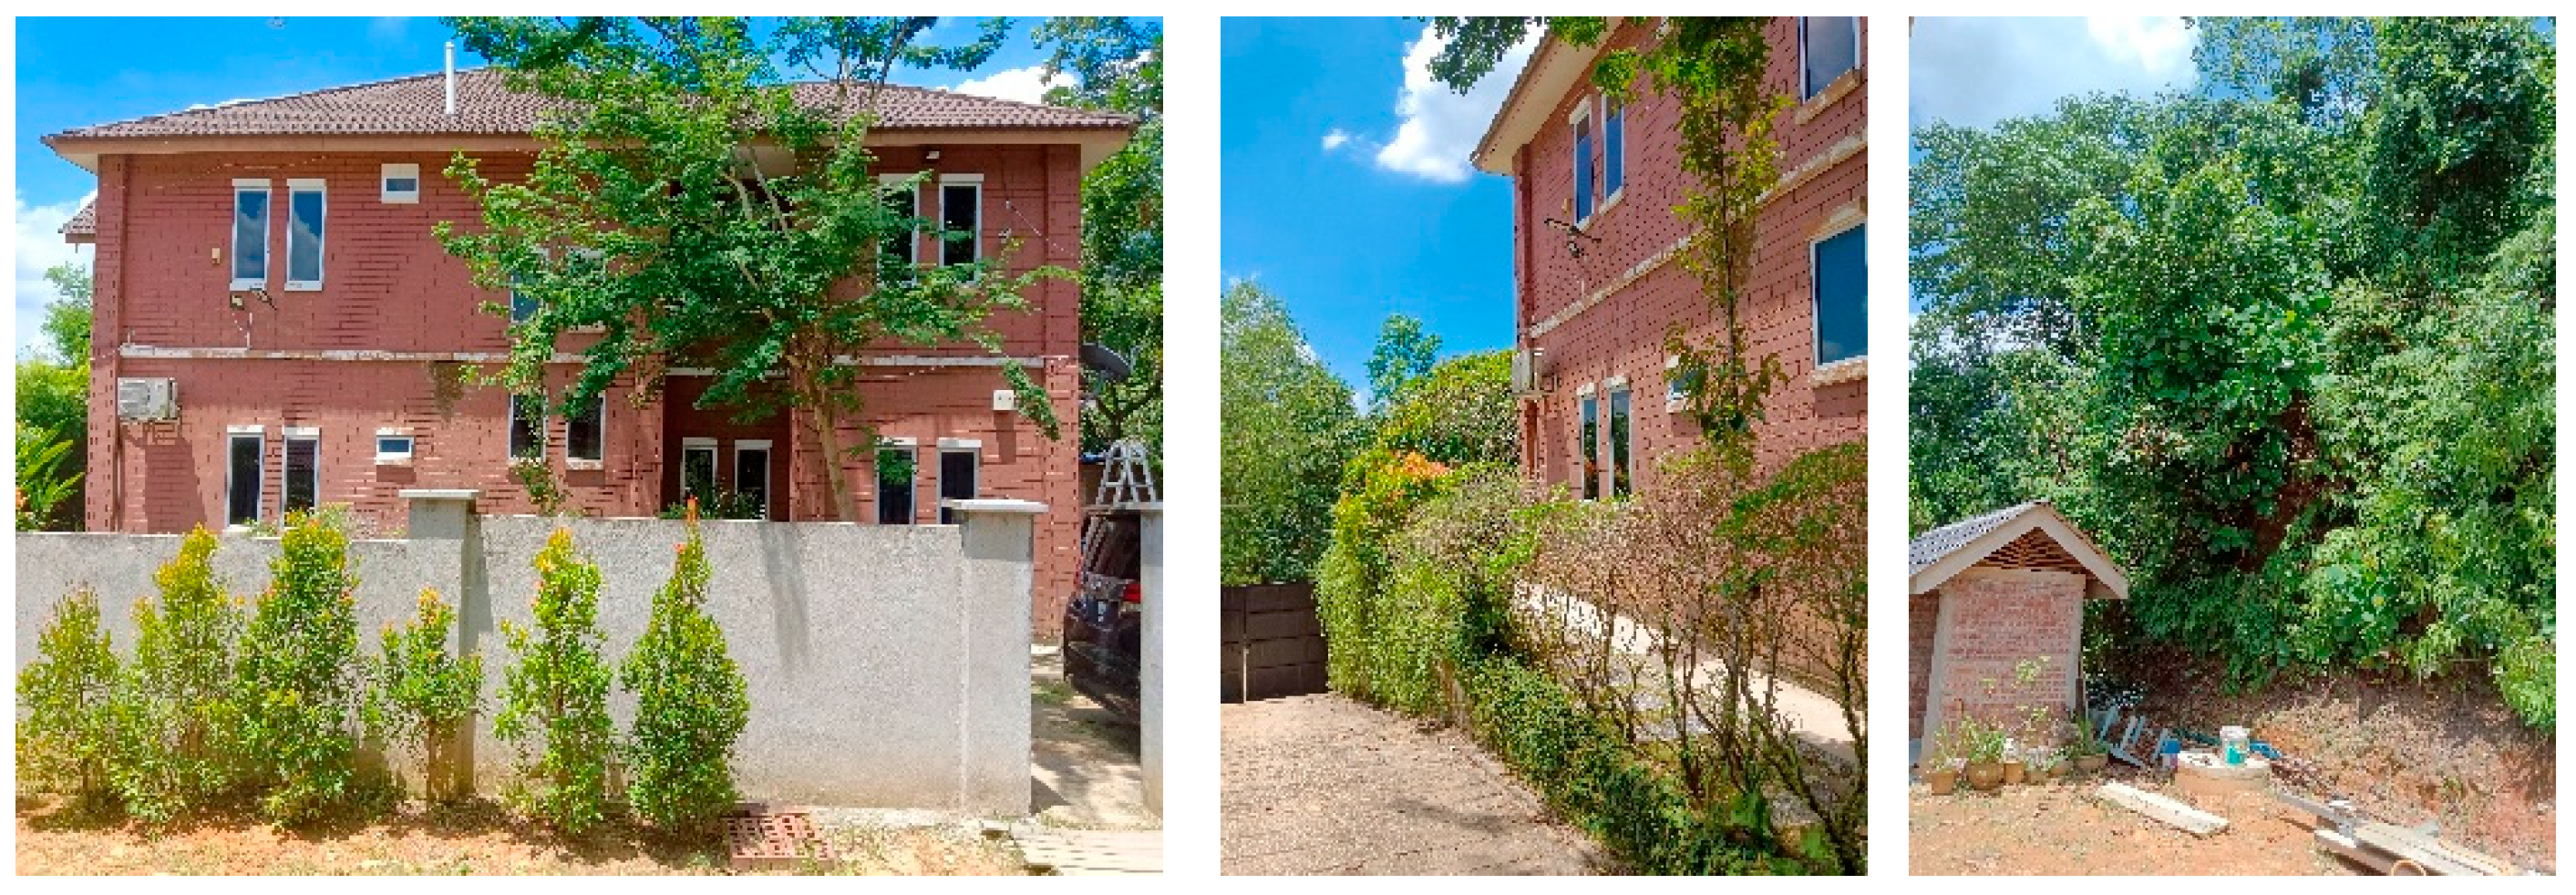
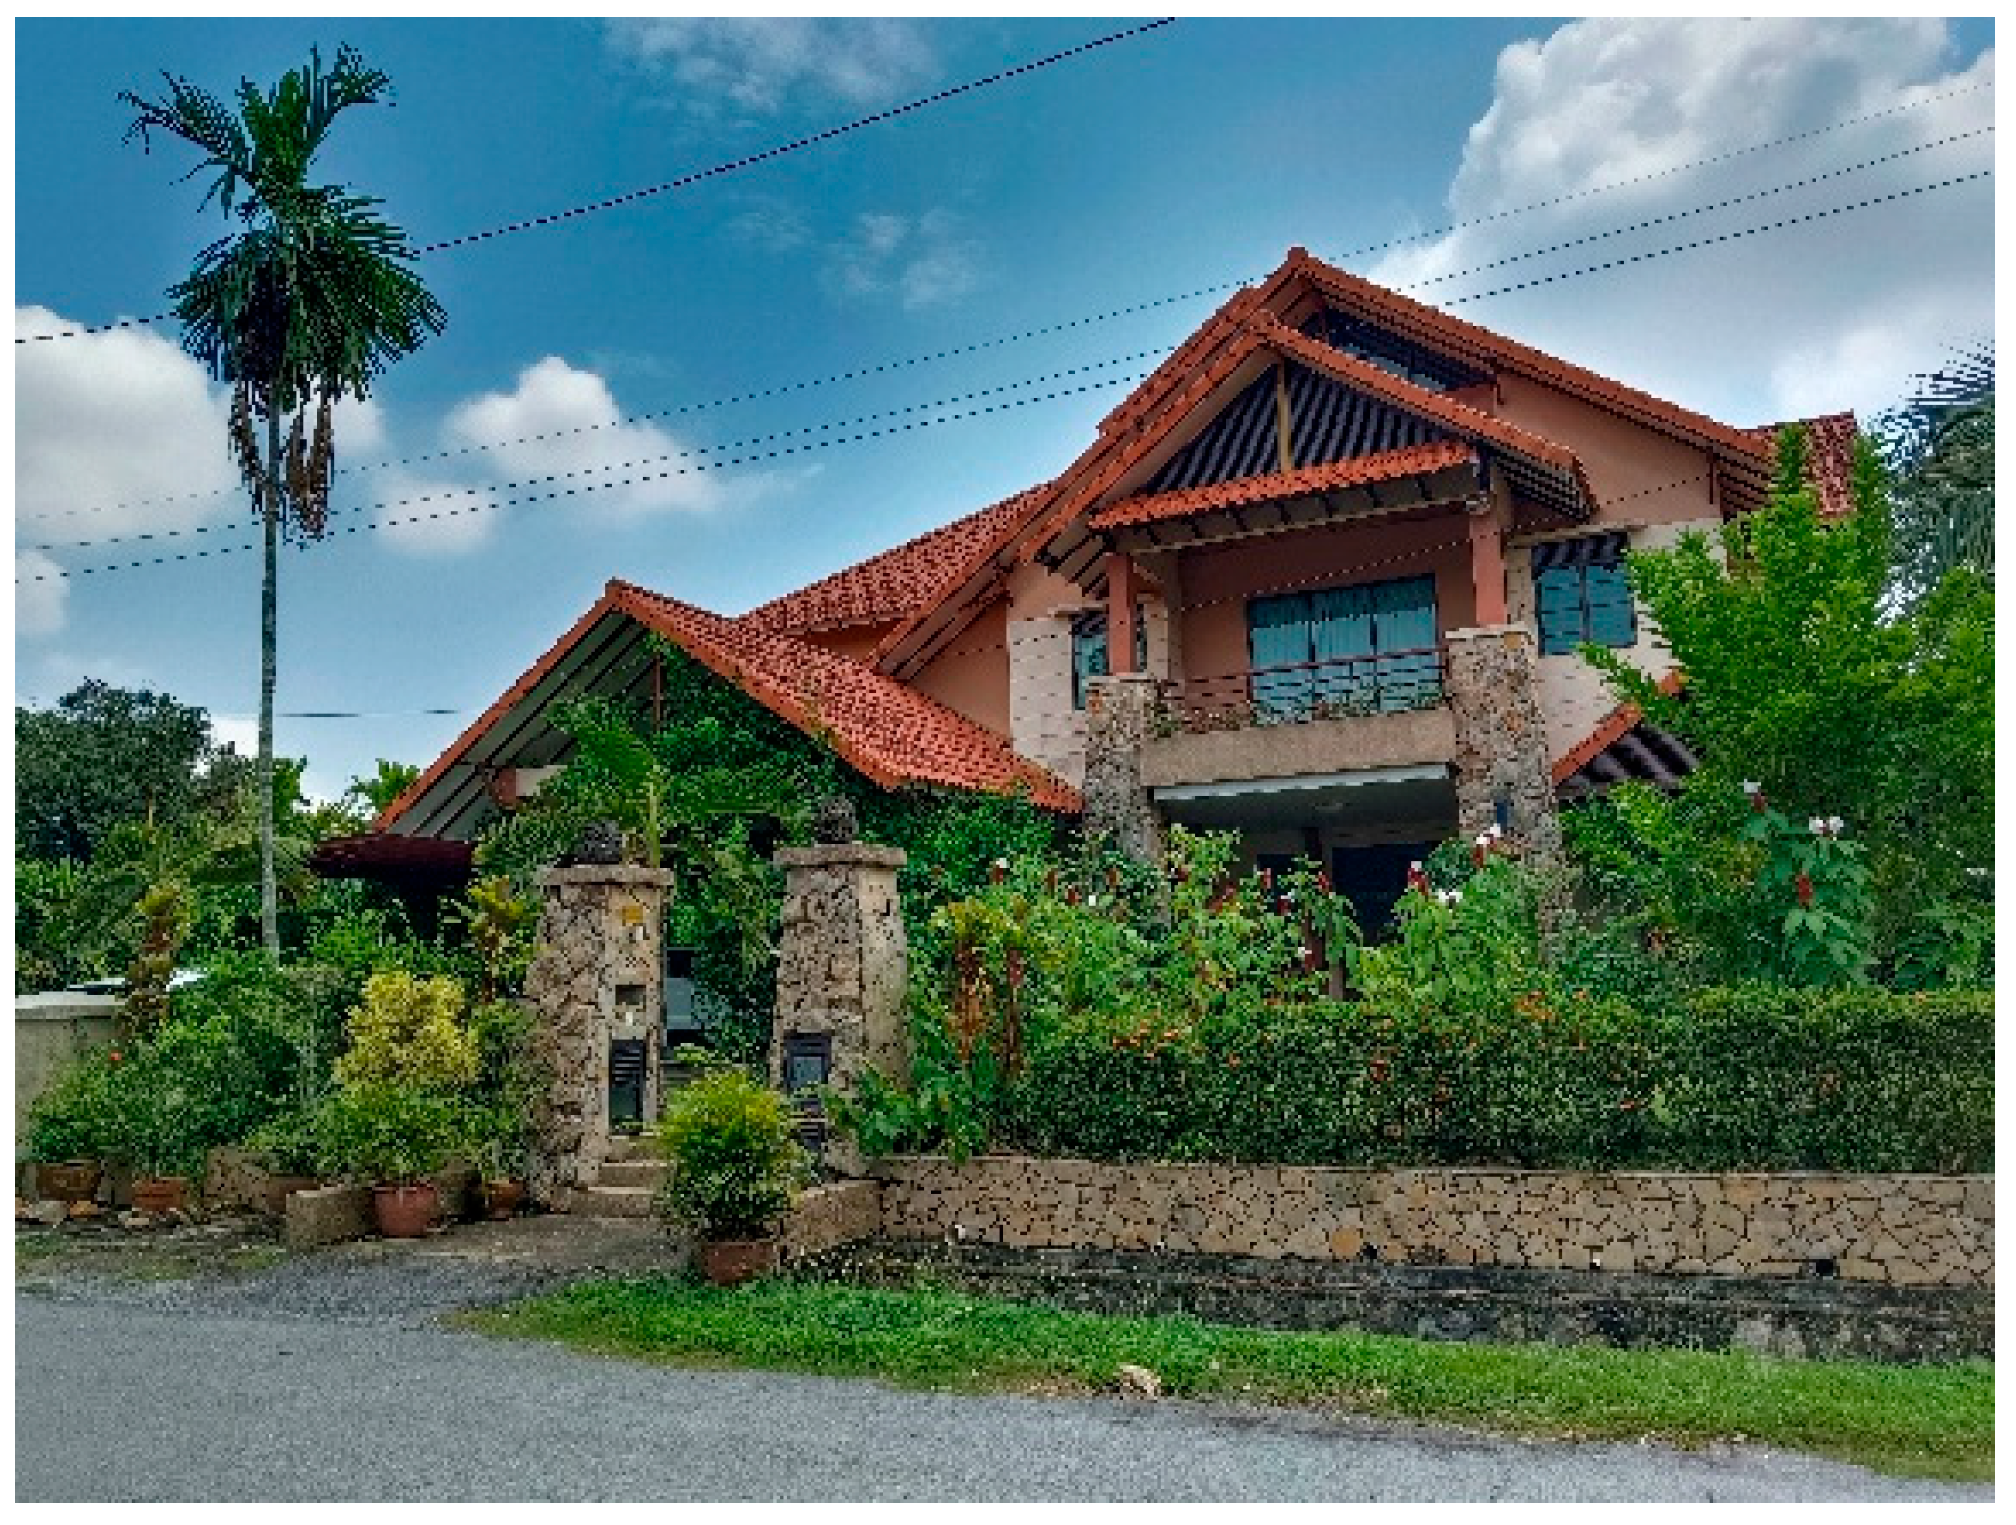
Across the three residences, the surrounding landscape emerges as a critical determinant of indoor thermal performance by altering the local microclimate, mediating solar exposure, and influencing the balance between radiative and convective heat exchanges at the building envelope. At Residence A, the combination of dense bamboo clusters, tall shading trees, and a continuously operating water feature creates a highly buffered micro-environment that lowers both surface and air temperatures through canopy interception and evaporative cooling. This vegetative mass and moisture-rich courtyard not only suppress direct and reflected solar radiation but also pre-condition incoming air, enabling the brick façade and earth-contact Family Hall to maintain exceptionally stable Tmrt and Top throughout the day. By contrast, Residence B, despite having an abundance of tropical planting, exhibits a landscape arrangement that provides insufficient shading to the upper façade where solar loading is most intense. The dominance of exposed concrete driveway surfaces and sunlit boundary walls increases ground-level albedo and contributes to thermal re-radiation into adjacent indoor zones, producing elevated Tmrt and pronounced late-afternoon overheating. Limited wind penetration due to perimeter structures further restricts convective heat removal, making the residence more vulnerable to warm indoor conditions even under naturally ventilated operation. Meanwhile, Residence C benefits from a more thermally strategic and vertically continuous landscape layer, where mature trees, thick shrubbery, and vine-covered pergola structures work cohesively with deep roof overhangs to shield all major façades from direct solar gain. The extensive grassed surfaces, low-reflectance ground treatments, and open lawn layout facilitate both evaporative cooling and unimpeded wind flow, reducing radiant asymmetry and enhancing air movement across the site. This combination of shading, low ground heat storage, and high ventilation potential significantly moderates diurnal heat flux. It supports the lower Tmrt and more stable Top observed in the dining hall and upper floors of Residence C. Collectively, the comparison demonstrates that the effectiveness of landscape design particularly its ability to provide multi-level shading, reduce surface heat storage, enable evaporative cooling, and maintain wind permeability directly governs the thermal resilience of naturally ventilated tropical dwellings and ultimately reinforces the performance hierarchy identified across the three residences.
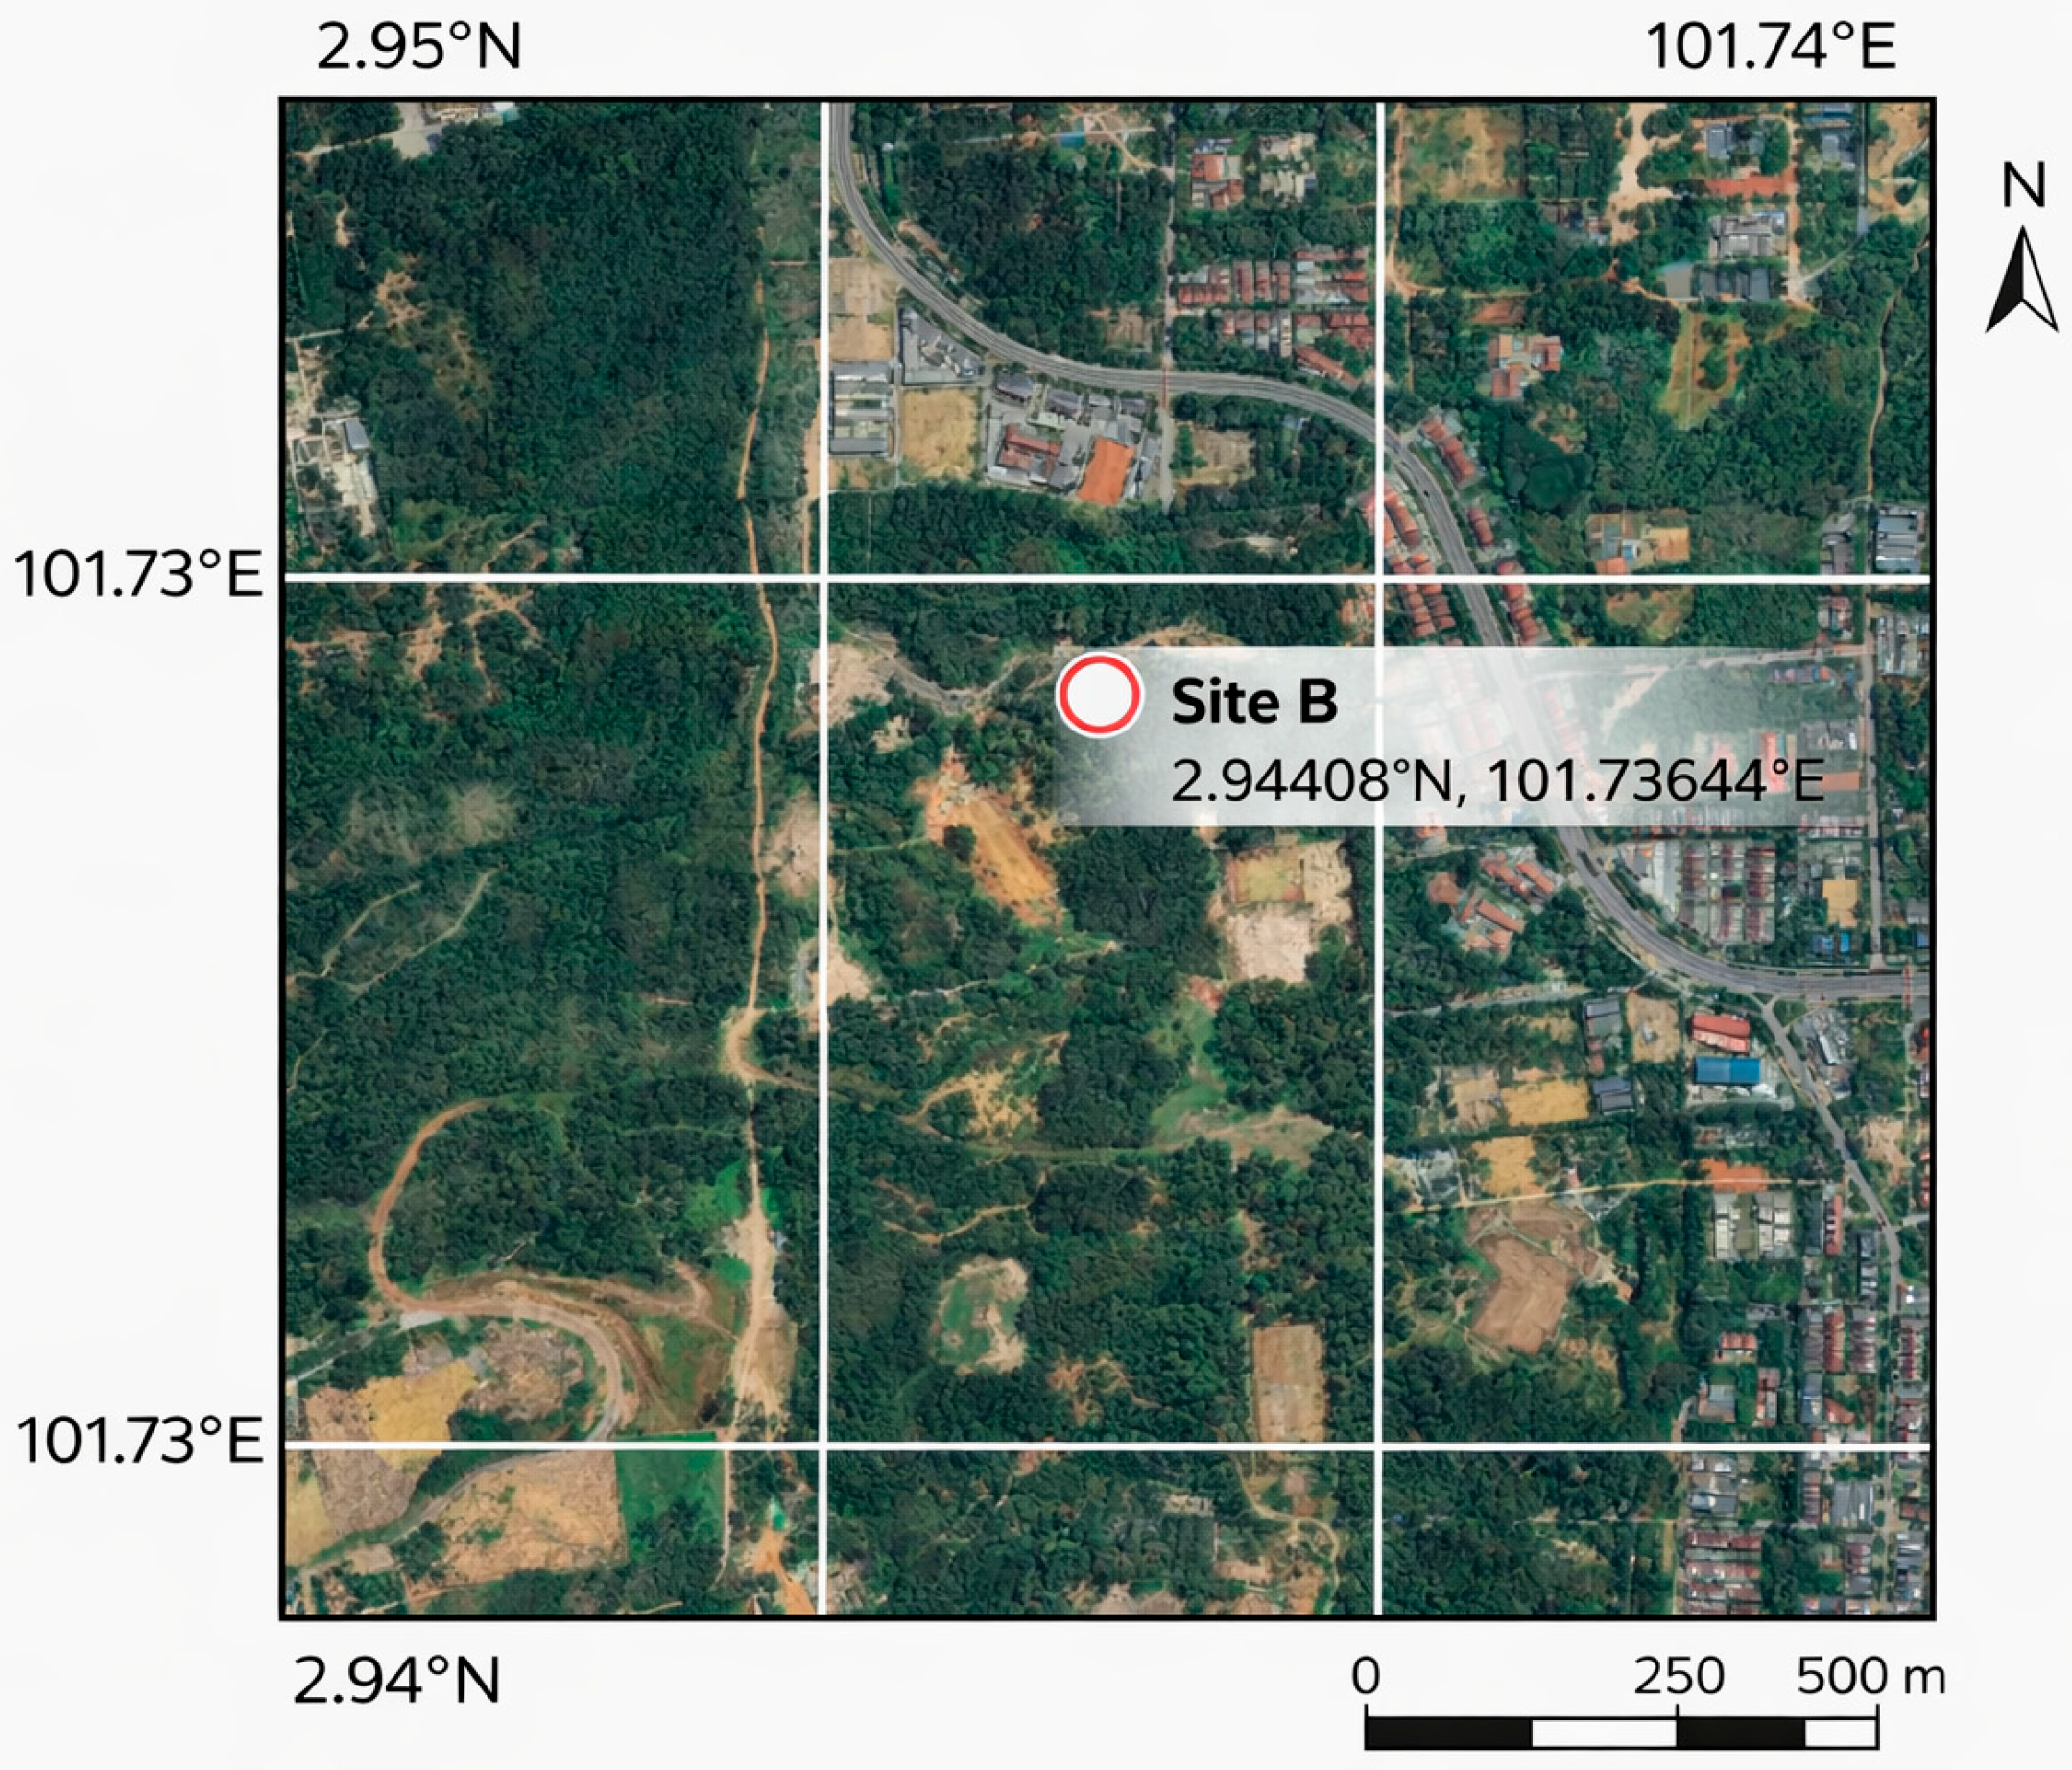
Beyond immediate site landscaping, the thermal performance of passive residential buildings is influenced by the broader urban microclimate, particularly the Urban Heat Island (UHI) effect. Residences A and B are located in urbanised areas where high building density and impervious surfaces contribute to UHI intensities of approximately 1.9–3.1 °C above rural conditions [
49]. This elevates the temperature of incoming air, reducing the effectiveness of natural ventilation.
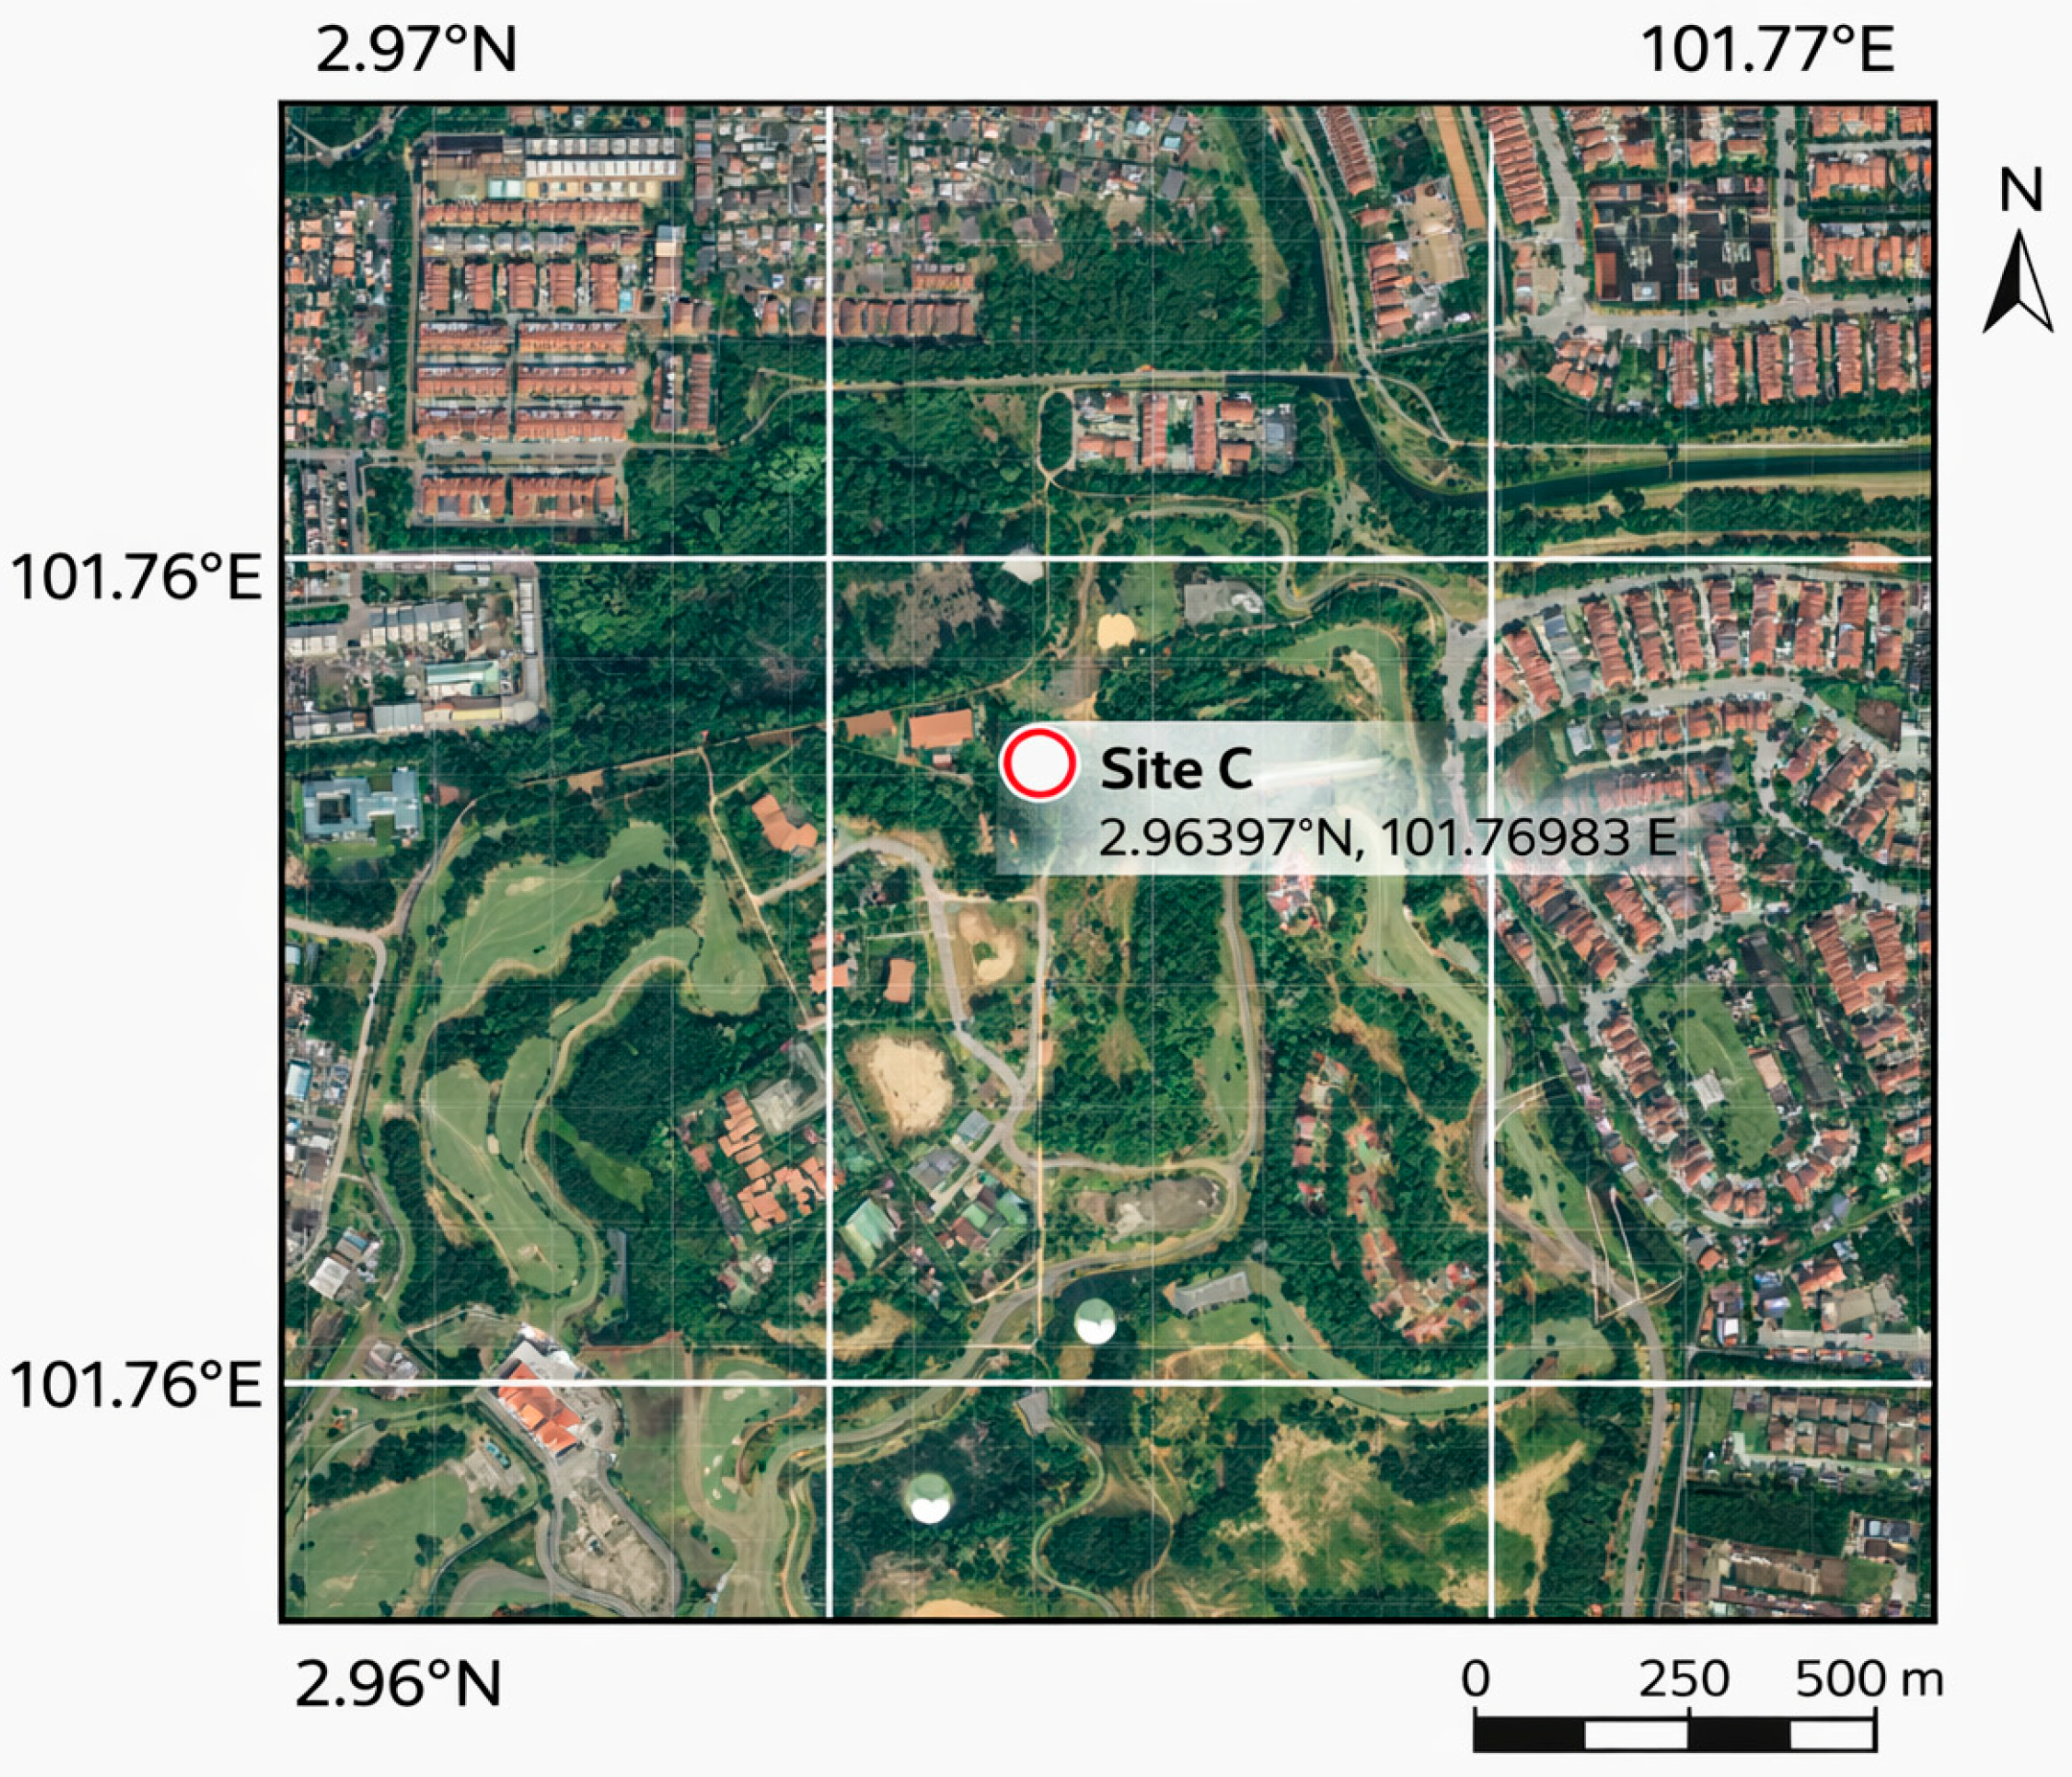
In contrast, Residence C benefits from its location within a low-density, vegetation-rich golf-course precinct, where extensive green infrastructure and water bodies function as a cooling island that mitigates local UHI effects. This pre-conditioning of ambient air enhances the effectiveness of natural ventilation and contributes to improved thermal performance. These findings are consistent with recent studies in tropical climates, which demonstrate that urban morphology, land use, and vegetation cover play a critical role in influencing UHI intensity and thermal comfort [
50,
51]
Importantly, the results indicate that UHI effects interact with ventilation performance, where elevated ambient temperatures combined with low air velocity further exacerbate thermal discomfort. This highlights a key limitation of isolated passive design strategies in urban settings. To maximise the effectiveness of natural ventilation and passive cooling, residential buildings must be supported by urban-scale interventions, including green corridors, optimised urban density, and reduced surface heat storage.
8.5. Air Velocity Comparison
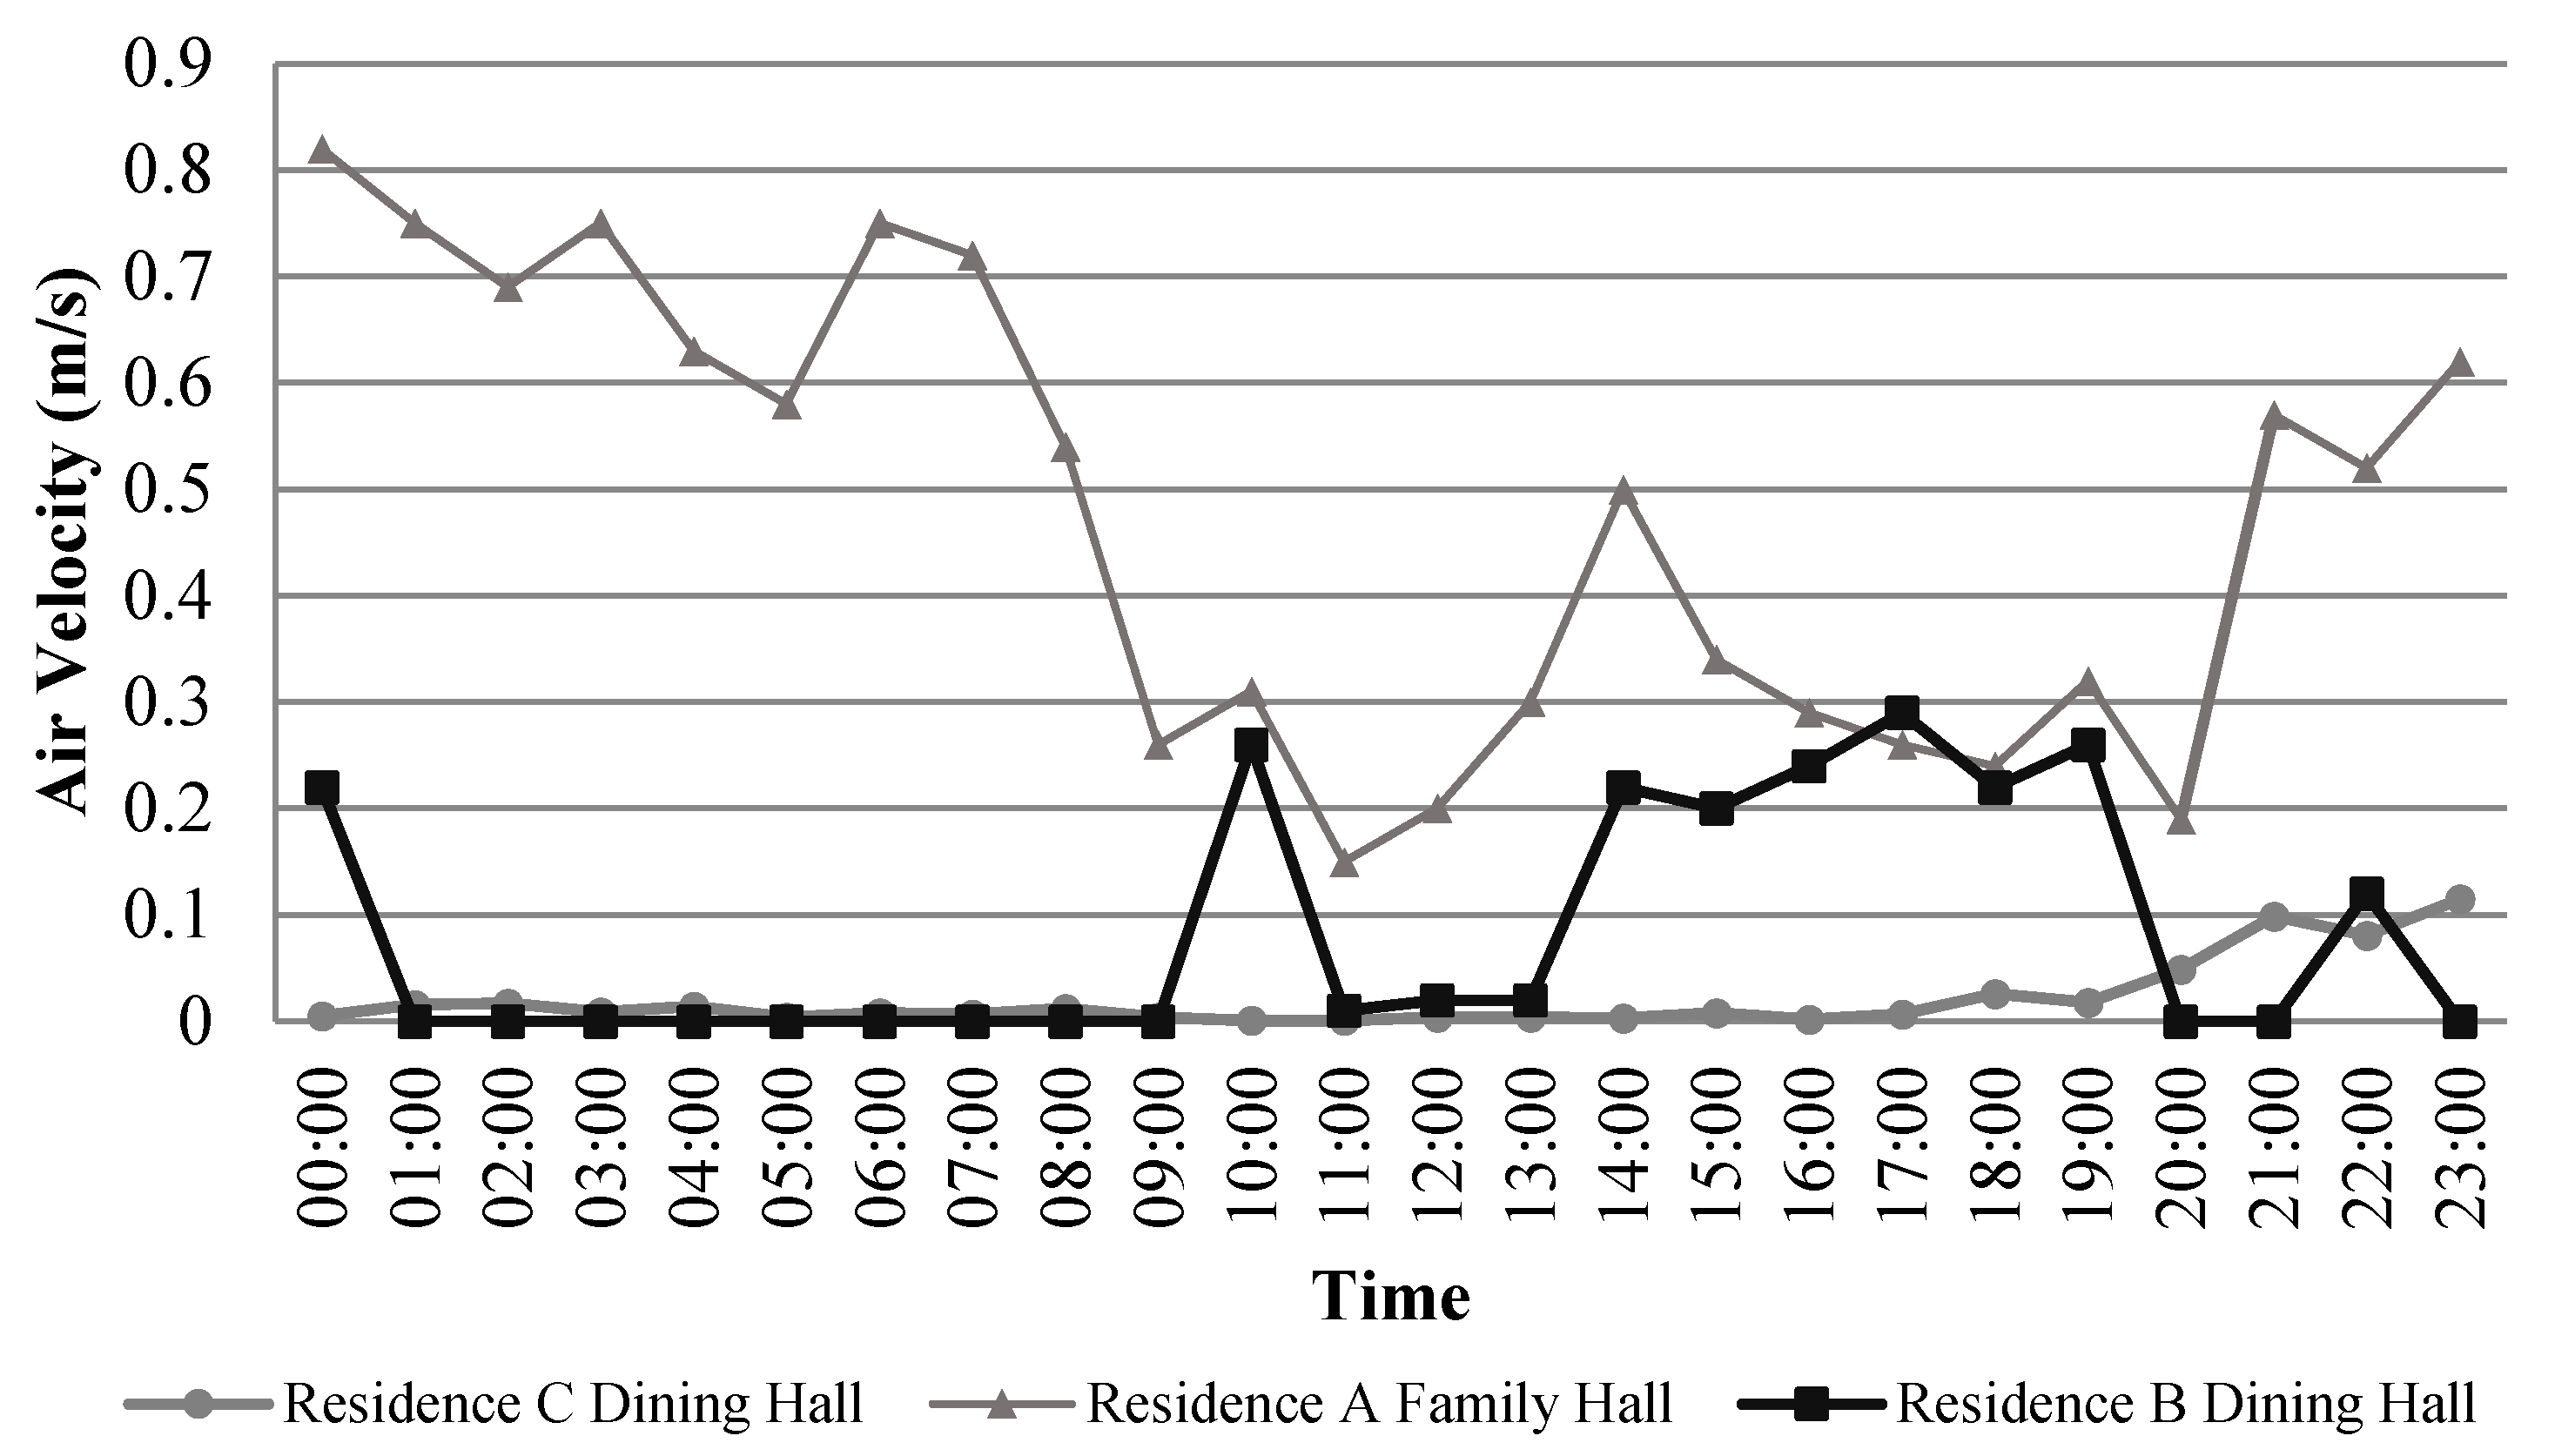
The air velocity comparison presented in
Figure 18 demonstrates clear distinctions in airflow behaviour among the three monitored residential spaces, reflecting their architectural configurations, ventilation opportunities, and microclimatic exposure. The Family Hall of Residence A exhibits the highest and most dynamic airflow, with velocities consistently ranging from 0.20 to 0.80 m/s throughout the day. The early-morning velocities peak around 0.75–0.82 m/s, suggesting strong natural pressure gradients and potentially effective cross-ventilation channels at the subgrade level. A noticeable decline in mid-morning airflow (to ~0.15–0.30 m/s) aligns with outdoor wind stagnation, which then recovers modestly during the afternoon. This relatively high air movement contributes significantly to convective heat dissipation, explaining the Family Hall’s comparatively lower operative temperatures and stronger thermal moderation.
Conversely, the Dining Hall of Residence B shows the most stagnant airflow regime, with extended periods, particularly from 01:00 to 09:00, recording near-zero velocities. Only two distinct episodes of airflow increase are visible: a spike around 10:00 (~0.25 m/s) and another between 14:00 and 18:00 (~0.20–0.30 m/s). These increases are likely driven by buoyancy-induced airflow caused by solar heating during peak outdoor temperatures, rather than effective cross-ventilation. The dominance of still air explains the persistent warm bias and elevated operative temperature in this space. The near-zero airflow for most of the day confirms that the existing architectural design provides insufficient ventilation, limiting the building’s capacity to maintain comfort under natural ventilation.
Residence C’s Dining Hall occupies an intermediate position. While early morning velocity remains very low (0.005–0.02 m/s), slight improvements occur throughout the late afternoon and evening, with values rising gradually to 0.08–0.11 m/s. A small peak is visible around 21:00, reflecting modest airflow penetration from outdoor wind exposure or internal circulation patterns. Although this airflow is insufficient to produce strong convective cooling, it prevents the complete stagnation observed in the dining hall of Residence B. The airflow pattern also suggests that Residence C benefits from partial but inconsistent natural ventilation, explaining its moderate thermal behaviour relative to the other two residences.
8.6. Relative Humidity Comparison
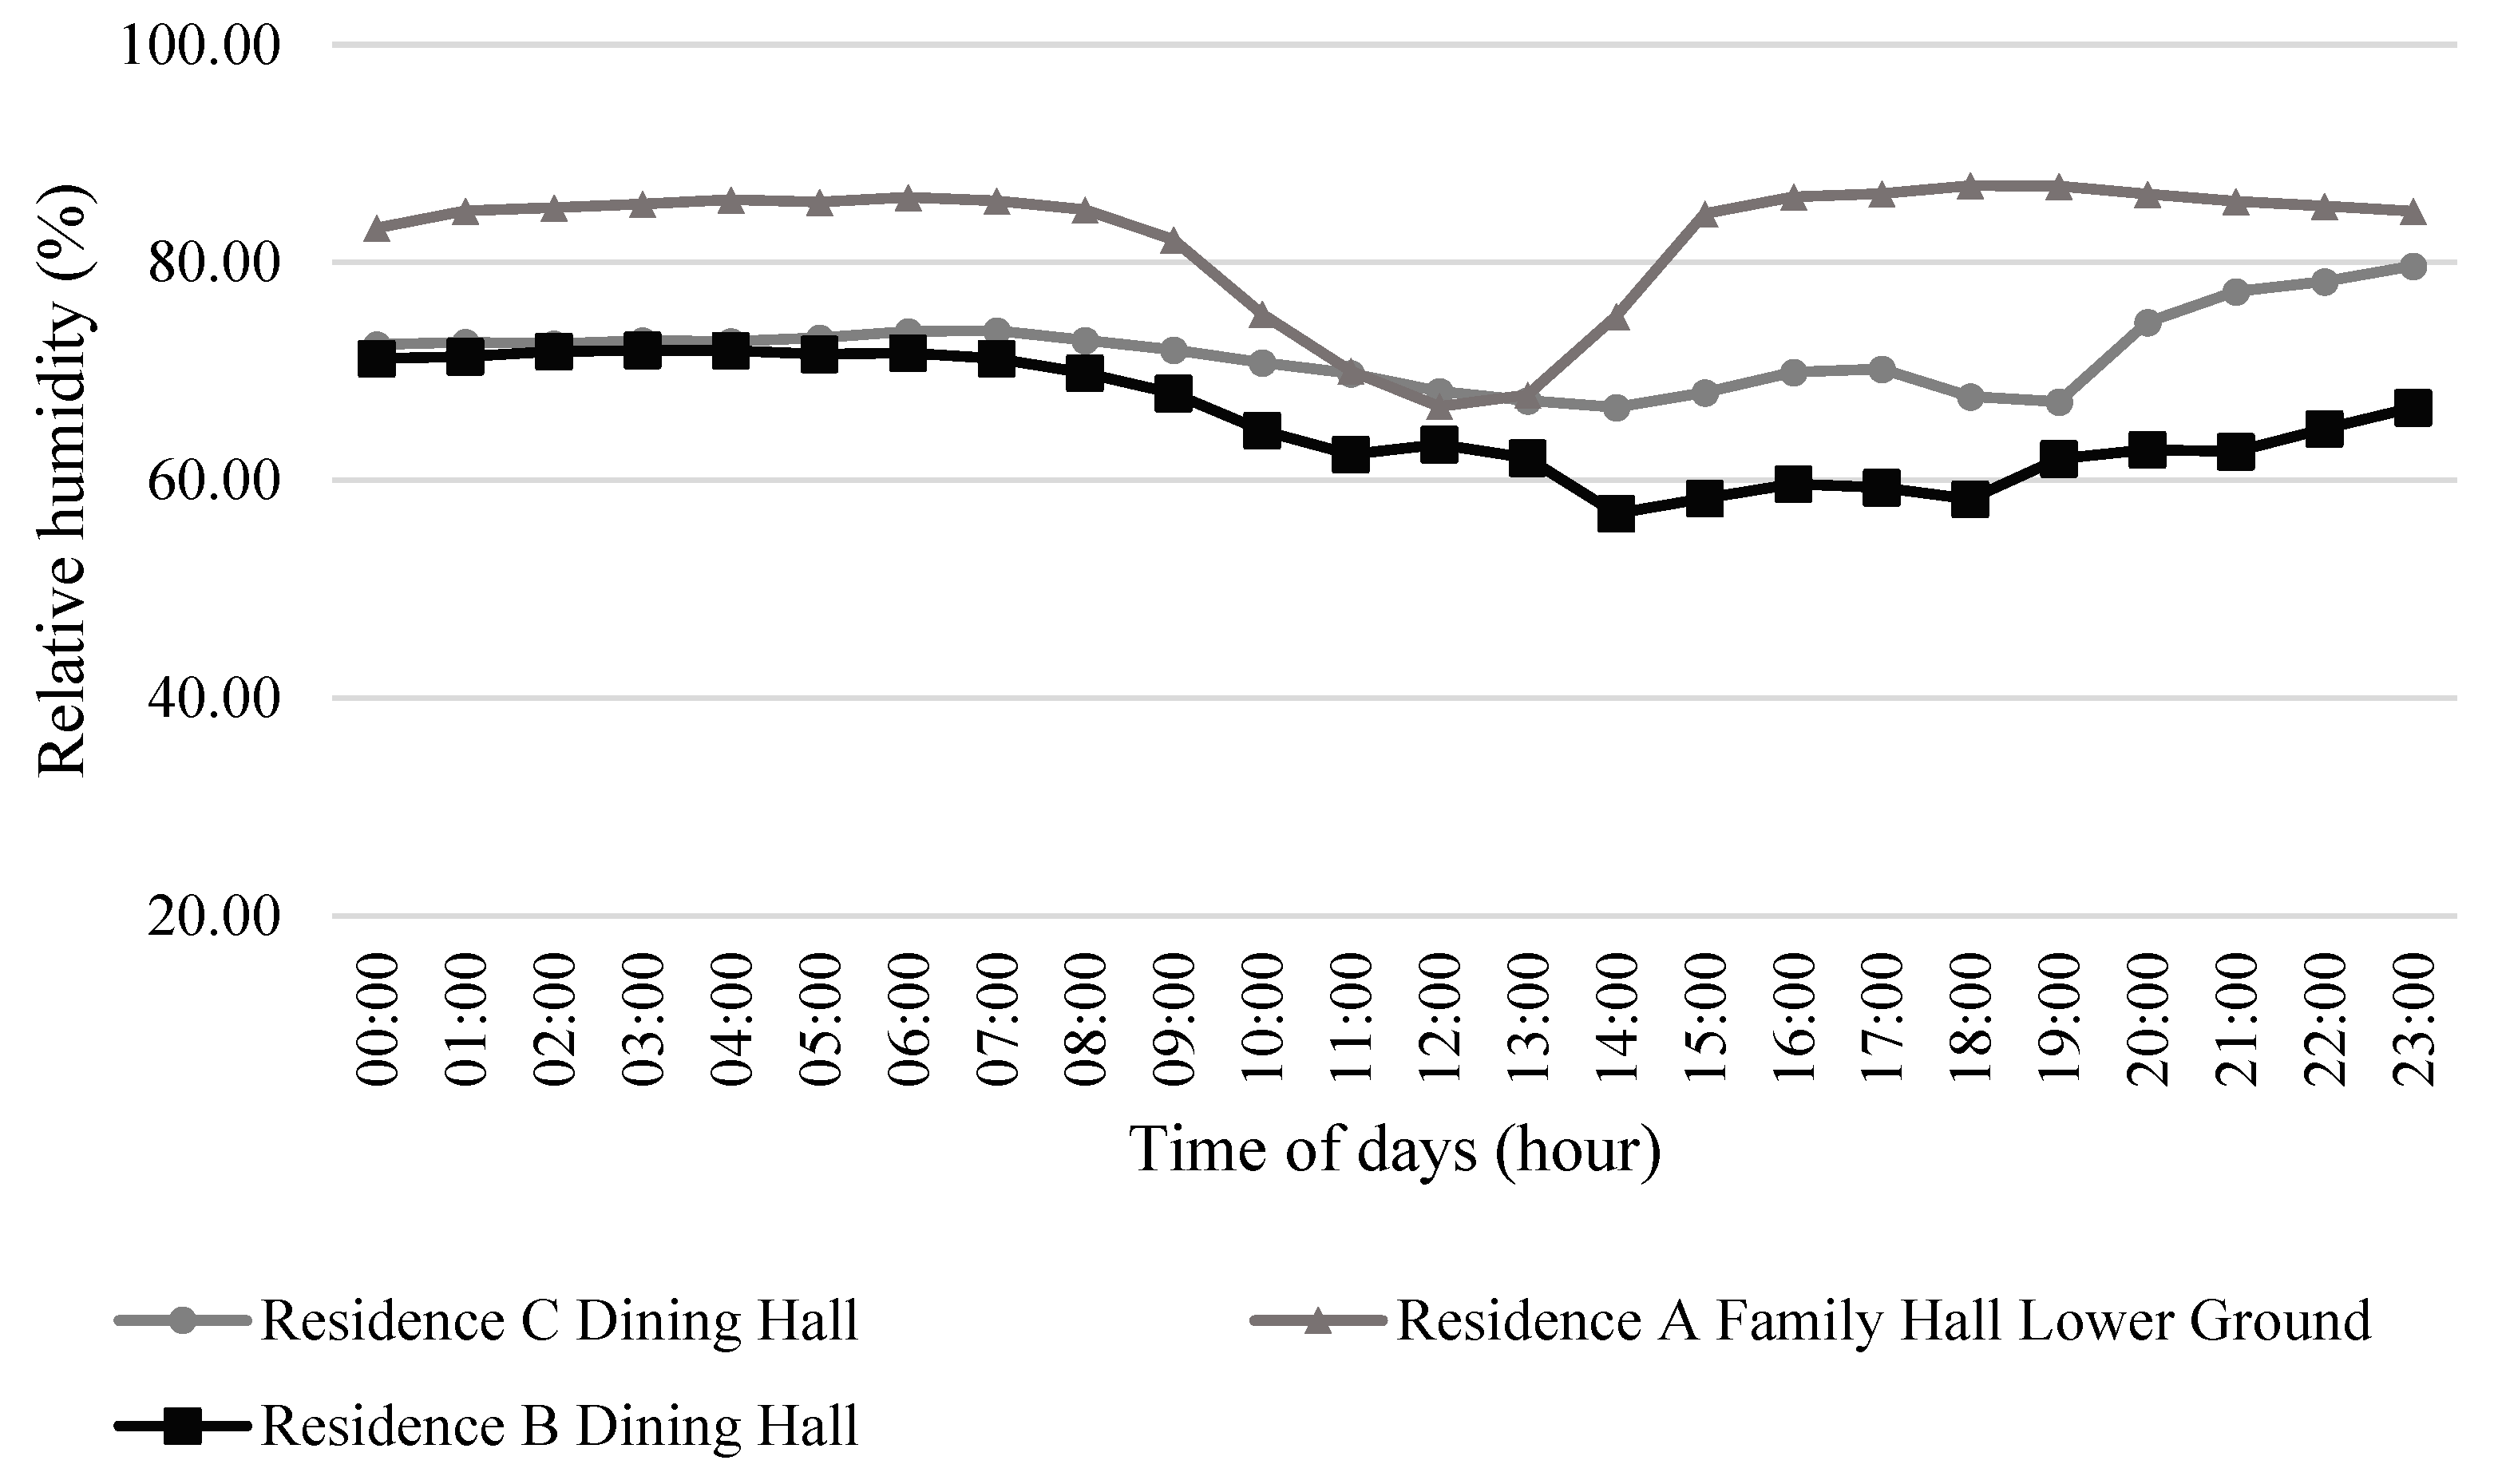
The diurnal relative humidity (RH) profiles of the three residential spaces (
Figure 19) reveal clear contrasts in moisture behaviour shaped by spatial configuration and ventilation effectiveness. The Family Hall (Lower Ground) of Residence A consistently records the highest RH levels, remaining predominantly within the 80–90% range during night-time and early morning hours. This persistent humidity reflects the moisture-retentive nature of subgrade environments, where limited solar exposure and reduced air exchange constrain moisture removal. In comparison, the Dining Halls of Residence C and Residence B exhibit lower, more moderate RH levels, generally fluctuating between 65% and 75%, indicating improved moisture dissipation in the above-ground spaces.
All three residences display a pronounced diurnal RH cycle, with humidity decreasing in the late morning and early afternoon before rising again in the evening, corresponding to increasing air temperatures and enhanced convective mixing during the daytime. The Dining Hall of Residence B experiences the greatest midday RH reduction, reaching values close to 60%, suggesting stronger solar influence and lower moisture retention. Conversely, the Family Hall of Residence A exhibits the smallest diurnal amplitude, maintaining elevated RH even during peak daytime hours. From an adaptive comfort perspective, prolonged exposure to RH levels above 80% may suppress evaporative cooling and intensify sensations of dampness, particularly under low air velocity conditions. These findings highlight that indoor humidity behaviour in naturally ventilated residences is strongly governed by vertical positioning, ventilation pathways, and envelope characteristics, and should be evaluated alongside thermal parameters in hot–humid climate assessments.
The critical dependency of thermal comfort on the interaction between RH and wind speed is explicitly demonstrated when comparing Residence A and Residence B. Although the Family Hall of Residence A recorded the highest RH levels (frequently between 80–90%), it successfully maintained operative temperatures within the 90% adaptive comfort acceptability band. This is directly attributable to its superior air velocities (ranging from 0.20 to 0.80 m/s), which effectively offset the high moisture content by facilitating continuous evaporative cooling on the occupants’ skin. In stark contrast, Residence B recorded lower, theoretically more favourable RH levels (65–75%), yet values persistently exceeded upper comfort thresholds. The near-stagnant airflow (frequently below 0.05 m/s) in Residence B nullified any evaporative cooling potential. Without sufficient wind speed to break the moisture boundary layer, sensible and latent heat accumulated, leading to severe thermal discomfort despite the lower ambient humidity. These empirical findings confirm that in naturally ventilated tropical homes, reducing heat gain or humidity is insufficient without simultaneously engineering effective airflow pathways.
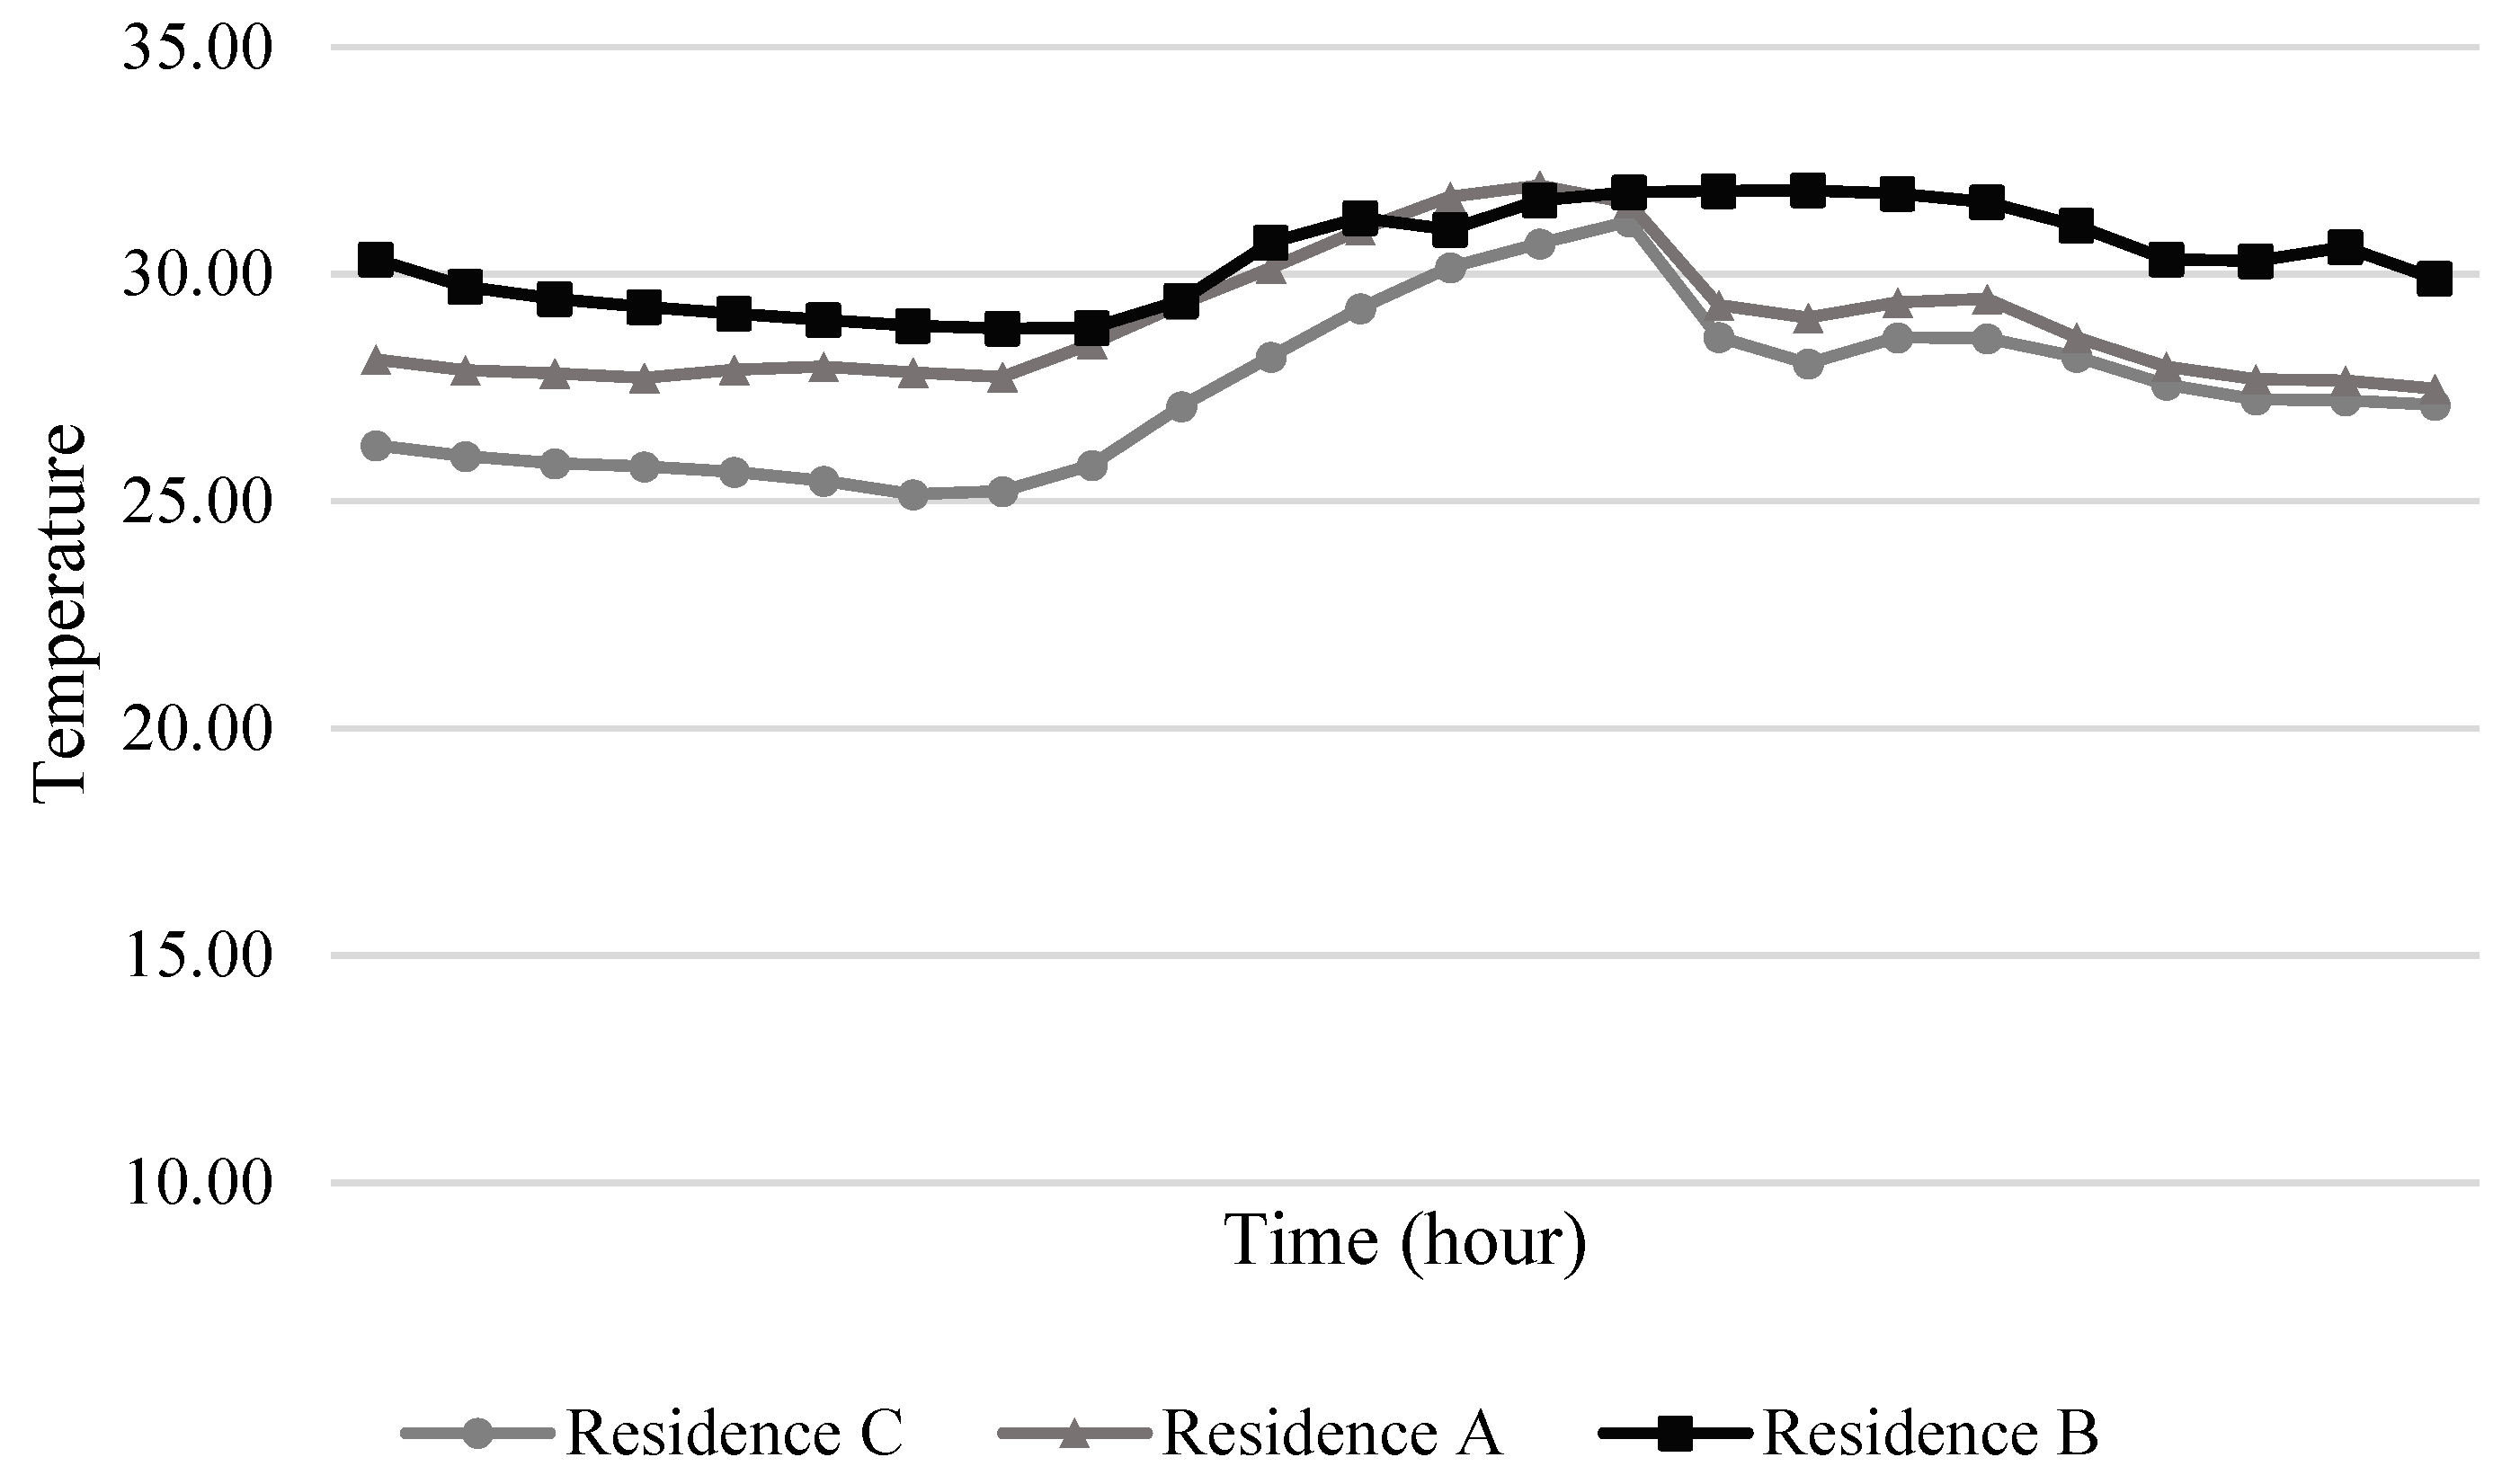
8.7. Outdoor Temperature Comparison
The diurnal profiles of mean outdoor temperature across the three residential locations display a consistent tropical pattern characterised by warm nocturnal conditions, a gradual increase in temperature during the morning, and a midday to early-afternoon peak. Night-time temperatures remain relatively high at all sites (generally above 26 °C), indicating limited nocturnal cooling under humid tropical conditions. Throughout most of the day, Residence B records the highest outdoor temperatures, followed by Residence A, while Residence C consistently exhibits slightly cooler conditions, suggesting differences in local microclimatic exposure. An outdoor temperature comparison between Residence A, Residence B, and Residence C is shown in
Figure 20.
During the late morning and early afternoon, outdoor temperatures rise sharply, peaking between approximately 12:00 and 15:00, with the highest values observed at Residence B site (≈31–32 °C). This divergence reflects variations in solar exposure, surrounding land cover, and shading conditions. In the late afternoon and evening, temperatures gradually decline across all locations, although Residence B remains persistently warmer, indicating slower heat dissipation. These systematic inter-site differences highlight the influence of local microclimate on outdoor thermal conditions, which subsequently shape the indoor thermal response and adaptive comfort performance observed in the corresponding residential spaces.
8.8. Performance Hierarchy of Thermal Environments Across All Levels and Residences
A comparative evaluation of the thermal environments across the Family Hall, Level 1, Level 2, and dining hall spaces reveals a performance hierarchy strongly shaped by architectural configuration and the underlying thermophysical behaviour of each building. The Family Hall of Residence A demonstrates the most effective passive thermal moderation, as its earth-embedded configuration substantially attenuates external temperature swings through high soil thermal mass and negligible solar radiation exposure, resulting in minimal fluctuations in both Top and Tmrt. Above grade, Residence C exhibits the most robust architectural–environmental performance, where the combined effects of enhanced roof insulation, favourable facade orientation, and material thermal inertia limit radiative heat transfer into Level 1 and Level 2 spaces. This is reflected in tightly bounded Tr values and a weak indoor–outdoor thermal coupling, indicating an envelope that effectively mitigates solar-driven heat gains despite low indoor air velocities. Residence A’s upper floors occupy an intermediate position in the hierarchy; although radiant temperatures increase with height, the architectural provision for improved cross-ventilation elevates local convective heat transfer, helping to dissipate accumulated heat and stabilise top. In contrast, the dining hall spaces particularly at Residence B display higher susceptibility to short-wave and long-wave radiative loading due to larger exposed facades, expansive glazing, and limited shading strategies. These architectural factors, coupled with low air-change effectiveness, result in greater thermal sensitivity and afternoon overheating. The least favourable conditions occur in Residence B’s Level 1 and Level 2 spaces, where elevated Tr values, minimal ventilation, and pronounced night-time thermal inertia suggest inadequate roof insulation, insufficient architectural shading, and limited capacity for passive heat rejection. Collectively, the cross-building comparison underscores the central role of architectural design variables roof assembly performance, facade exposure, ventilation pathway configuration, and material thermal mass in determining the thermal resilience of naturally ventilated tropical dwellings.
The results verified the proposed hypothesis, demonstrating that passive design strategies are essential for maintaining adaptive thermal comfort in tropical conditions. Residence A, which incorporates both shading and cross-ventilation, consistently achieved lower operative temperatures, remaining within the 80% adaptive comfort band throughout the day. Conversely, Residence B showed the highest thermal strain due to its limited passive features and constrained airflow.
Although Residence C maintained relatively favourable operative temperatures due to its insulated envelope, the absence of meaningful air movement resulted in insufficient convective cooling, supporting the hypothesis that passive thermal comfort requires the combined effects of heat-gain reduction and effective ventilation. These findings affirm the importance of integrative passive design as a sustainable pathway to reducing dependence on mechanical cooling in residential buildings.
This variation in thermal performance can be further explained by the interaction between relative humidity and air velocity. Thermal comfort in hot–humid climates is strongly influenced by the combined effects of relative humidity (RH) and air velocity. High RH reduces the effectiveness of evaporative heat loss from the human body, thereby increasing thermal discomfort even at moderate air temperatures. Under such conditions, air movement becomes a critical mechanism for enhancing convective and evaporative heat transfer by disrupting the boundary layer surrounding the skin. The present findings support this relationship, where spaces with low air velocity (<0.10 m/s) consistently exhibited higher operative temperatures and exceeded the upper 90% adaptive comfort threshold. In contrast, spaces with higher air velocities (0.45–0.65 m/s) maintained acceptable thermal conditions even under elevated temperatures, demonstrating that ventilation effectiveness plays a dominant role in offsetting the negative effects of high humidity in tropical residential environments.
9. Conclusions
This study tested the hypothesis that adaptive thermal comfort in hot–humid tropical residential buildings can be effectively achieved through the integration of passive design strategies, including heat gain reduction, ventilation enhancement, and microclimatic moderation, without reliance on mechanical cooling. The comparative analysis of Residence A, Residence B, and Residence C provides strong empirical evidence supporting this hypothesis. Across all monitored spaces, operative temperatures remained within the 80% adaptive acceptability limits of ASHRAE Standard 55, confirming baseline adaptive comfort compliance under naturally ventilated conditions. However, evaluation using the 90% acceptability criterion revealed pronounced differences in thermal robustness, primarily governed by architectural and environmental design factors rather than outdoor climatic conditions alone.
The findings demonstrate that passive strategies are most effective when applied in combination. Residence A, which integrates subgrade thermal mass, enhanced air movement (0.45–0.65 m/s at lower levels and 0.09–0.19 m/s at upper levels), controlled radiant exposure, and a well-buffered landscape microclimate, consistently achieved the lowest and most stable operative temperatures (28.3–29.8 °C), with strong alignment to the 90% adaptive comfort band. In contrast, Residence B exhibited the highest thermal strain, characterised by elevated mean radiant temperatures (>30–31 °C), very low air velocities (<0.07 m/s), persistent high relative humidity, and strong coupling between indoor and outdoor conditions. Residence C further supports the findings by demonstrating that heat gain reduction alone is insufficient; despite reduced radiant temperatures (<29.6 °C), extremely low air velocities (<0.04 m/s) limited convective cooling and constrained thermal acceptability.
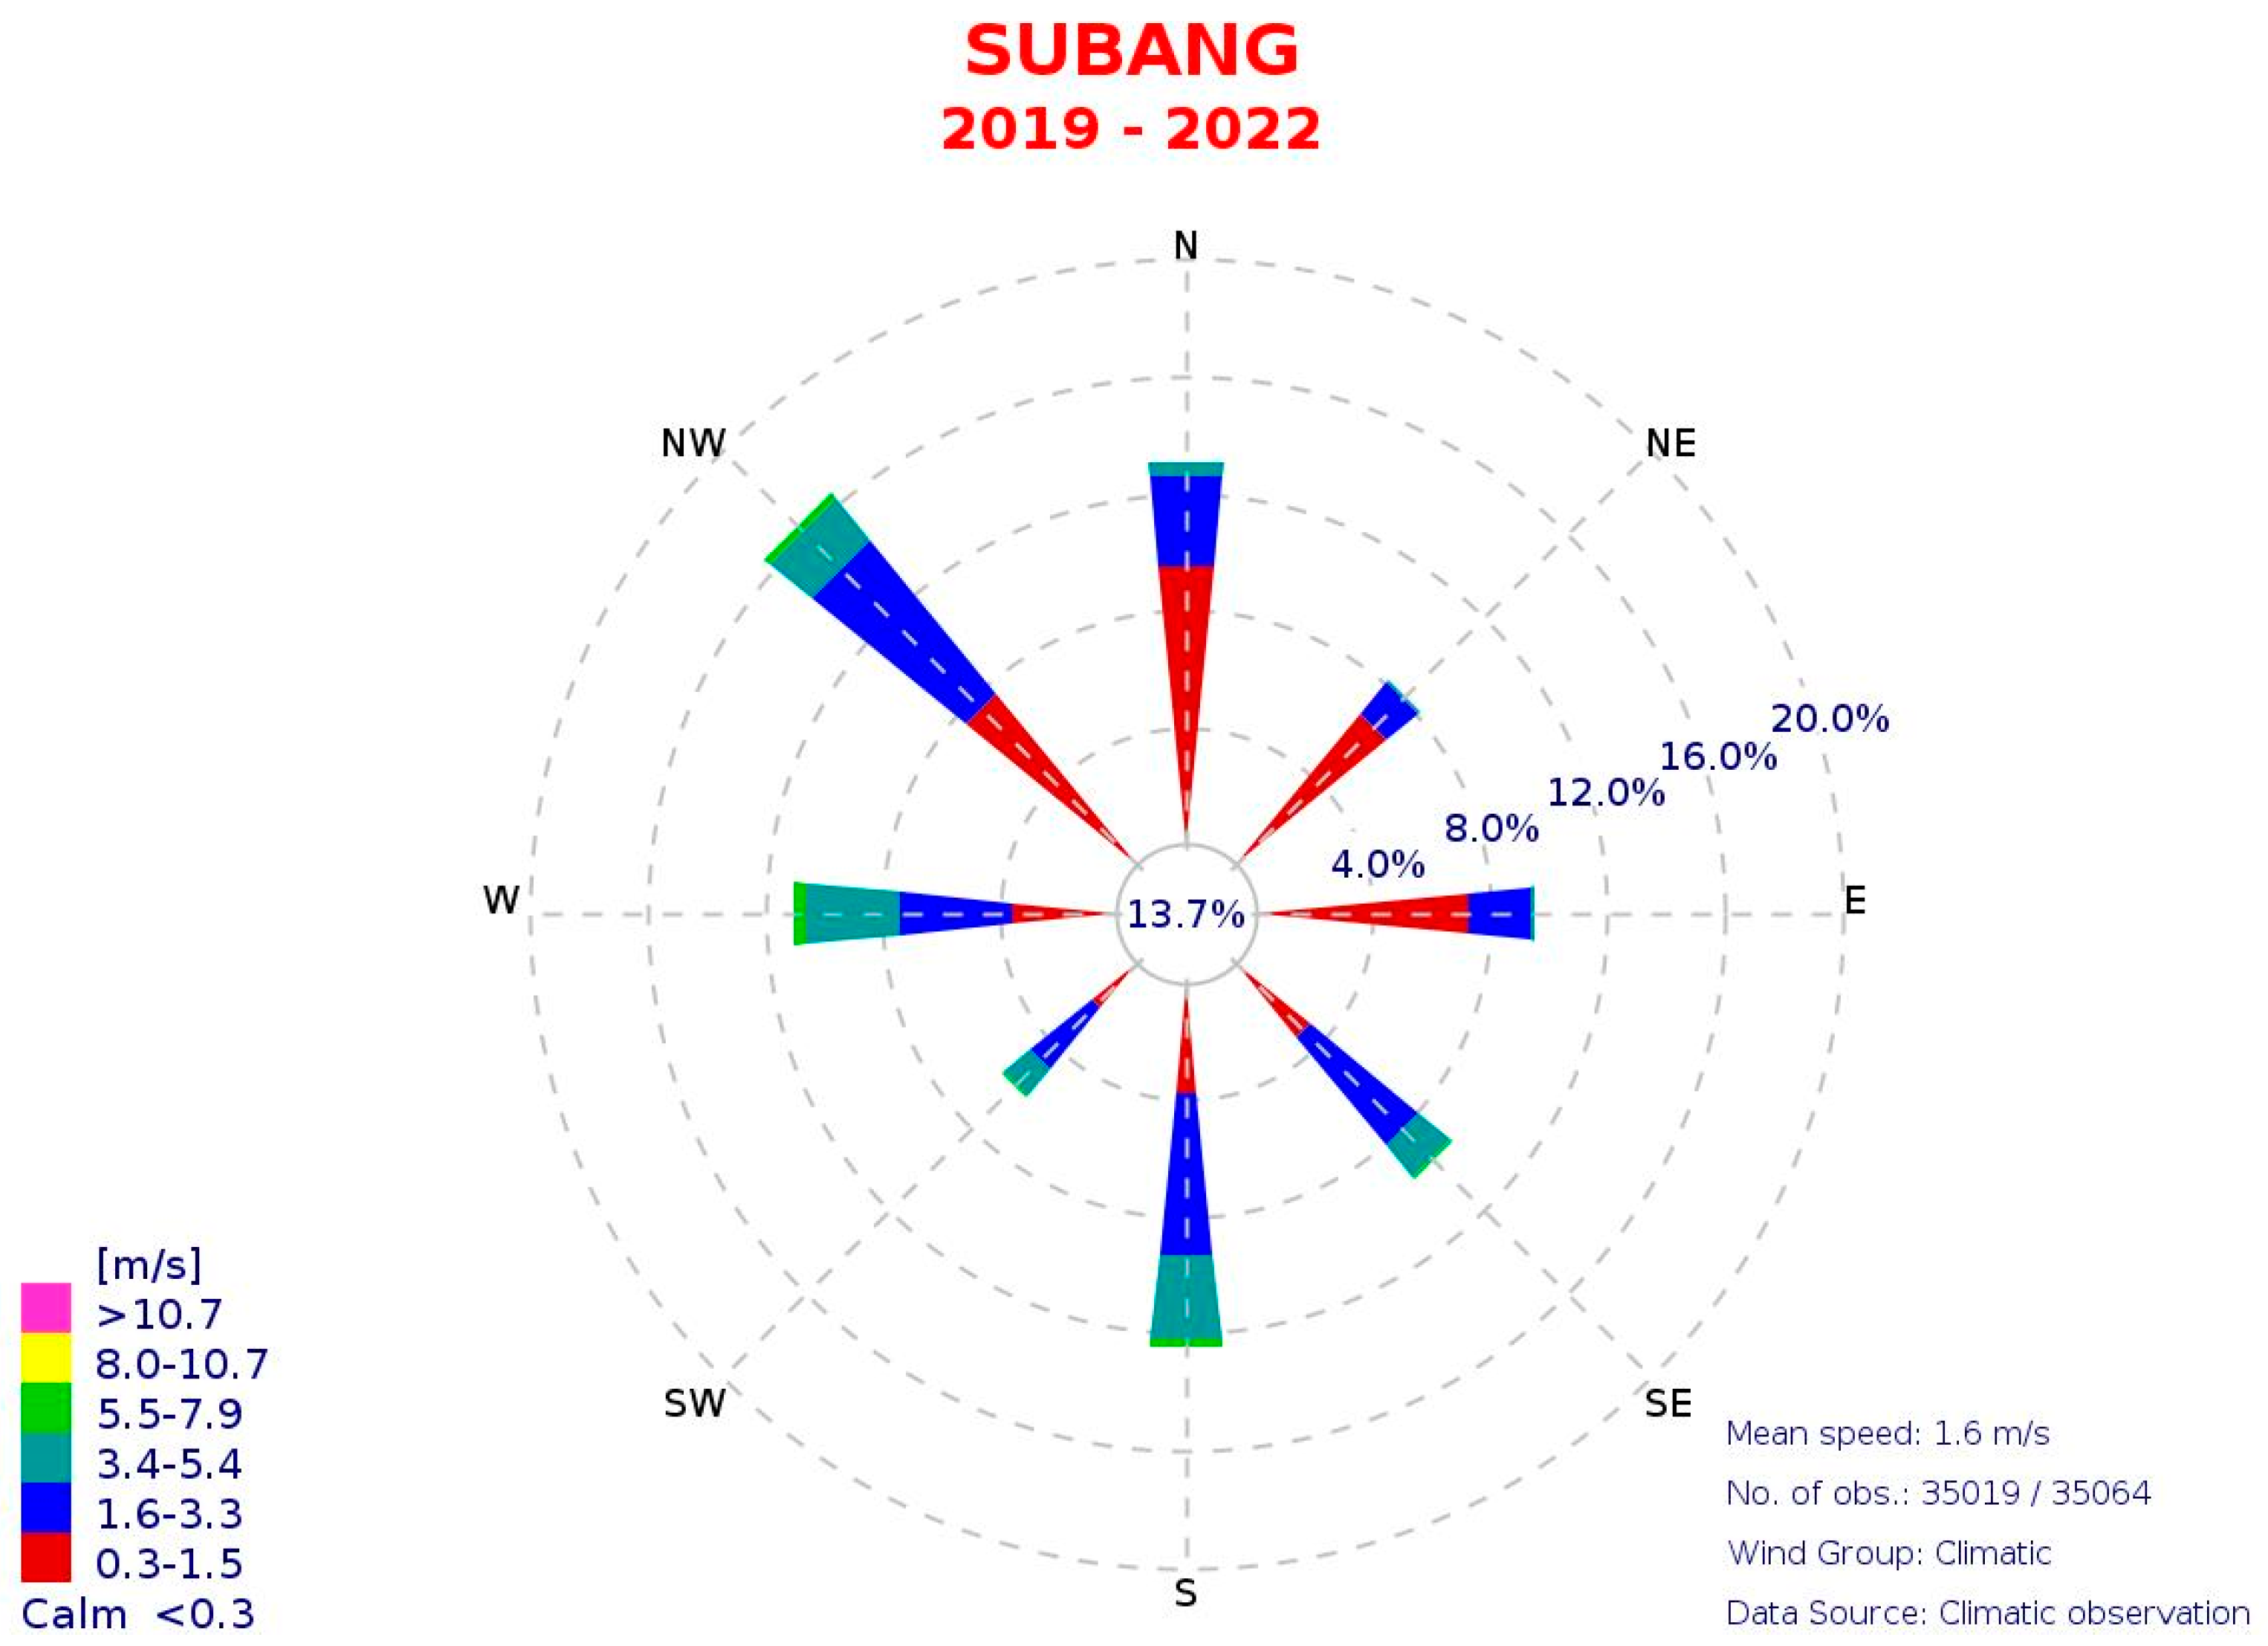
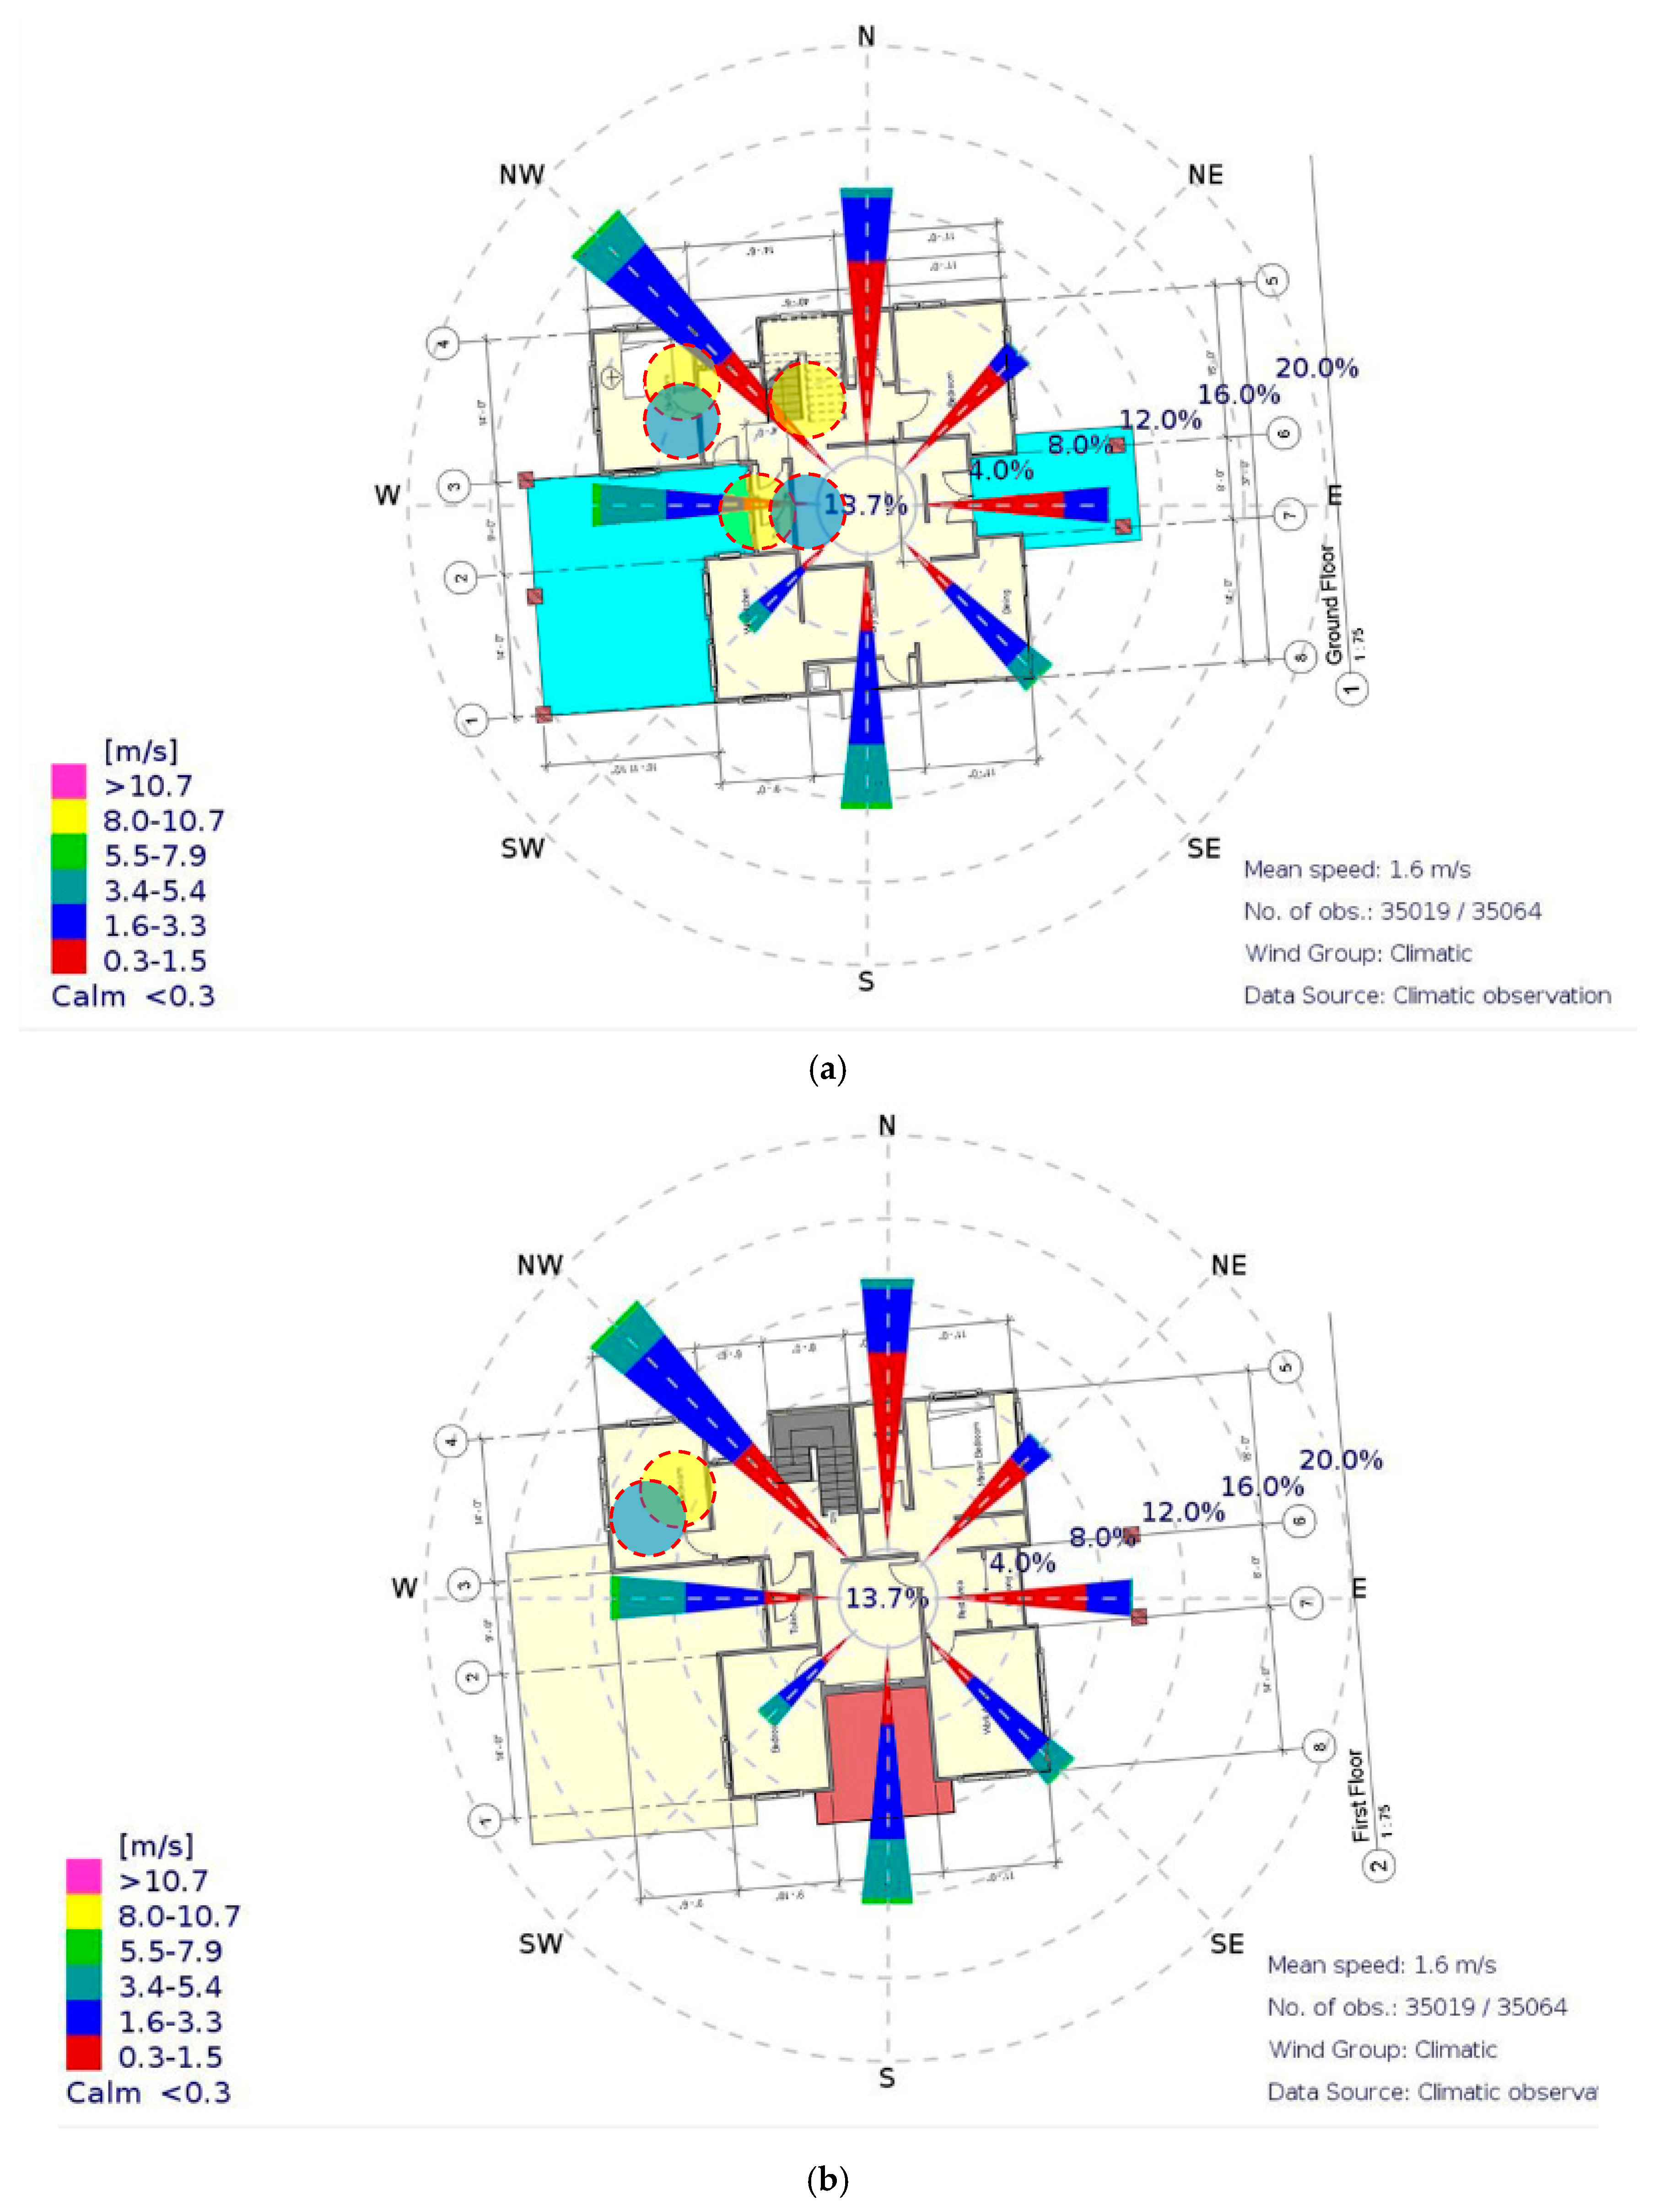
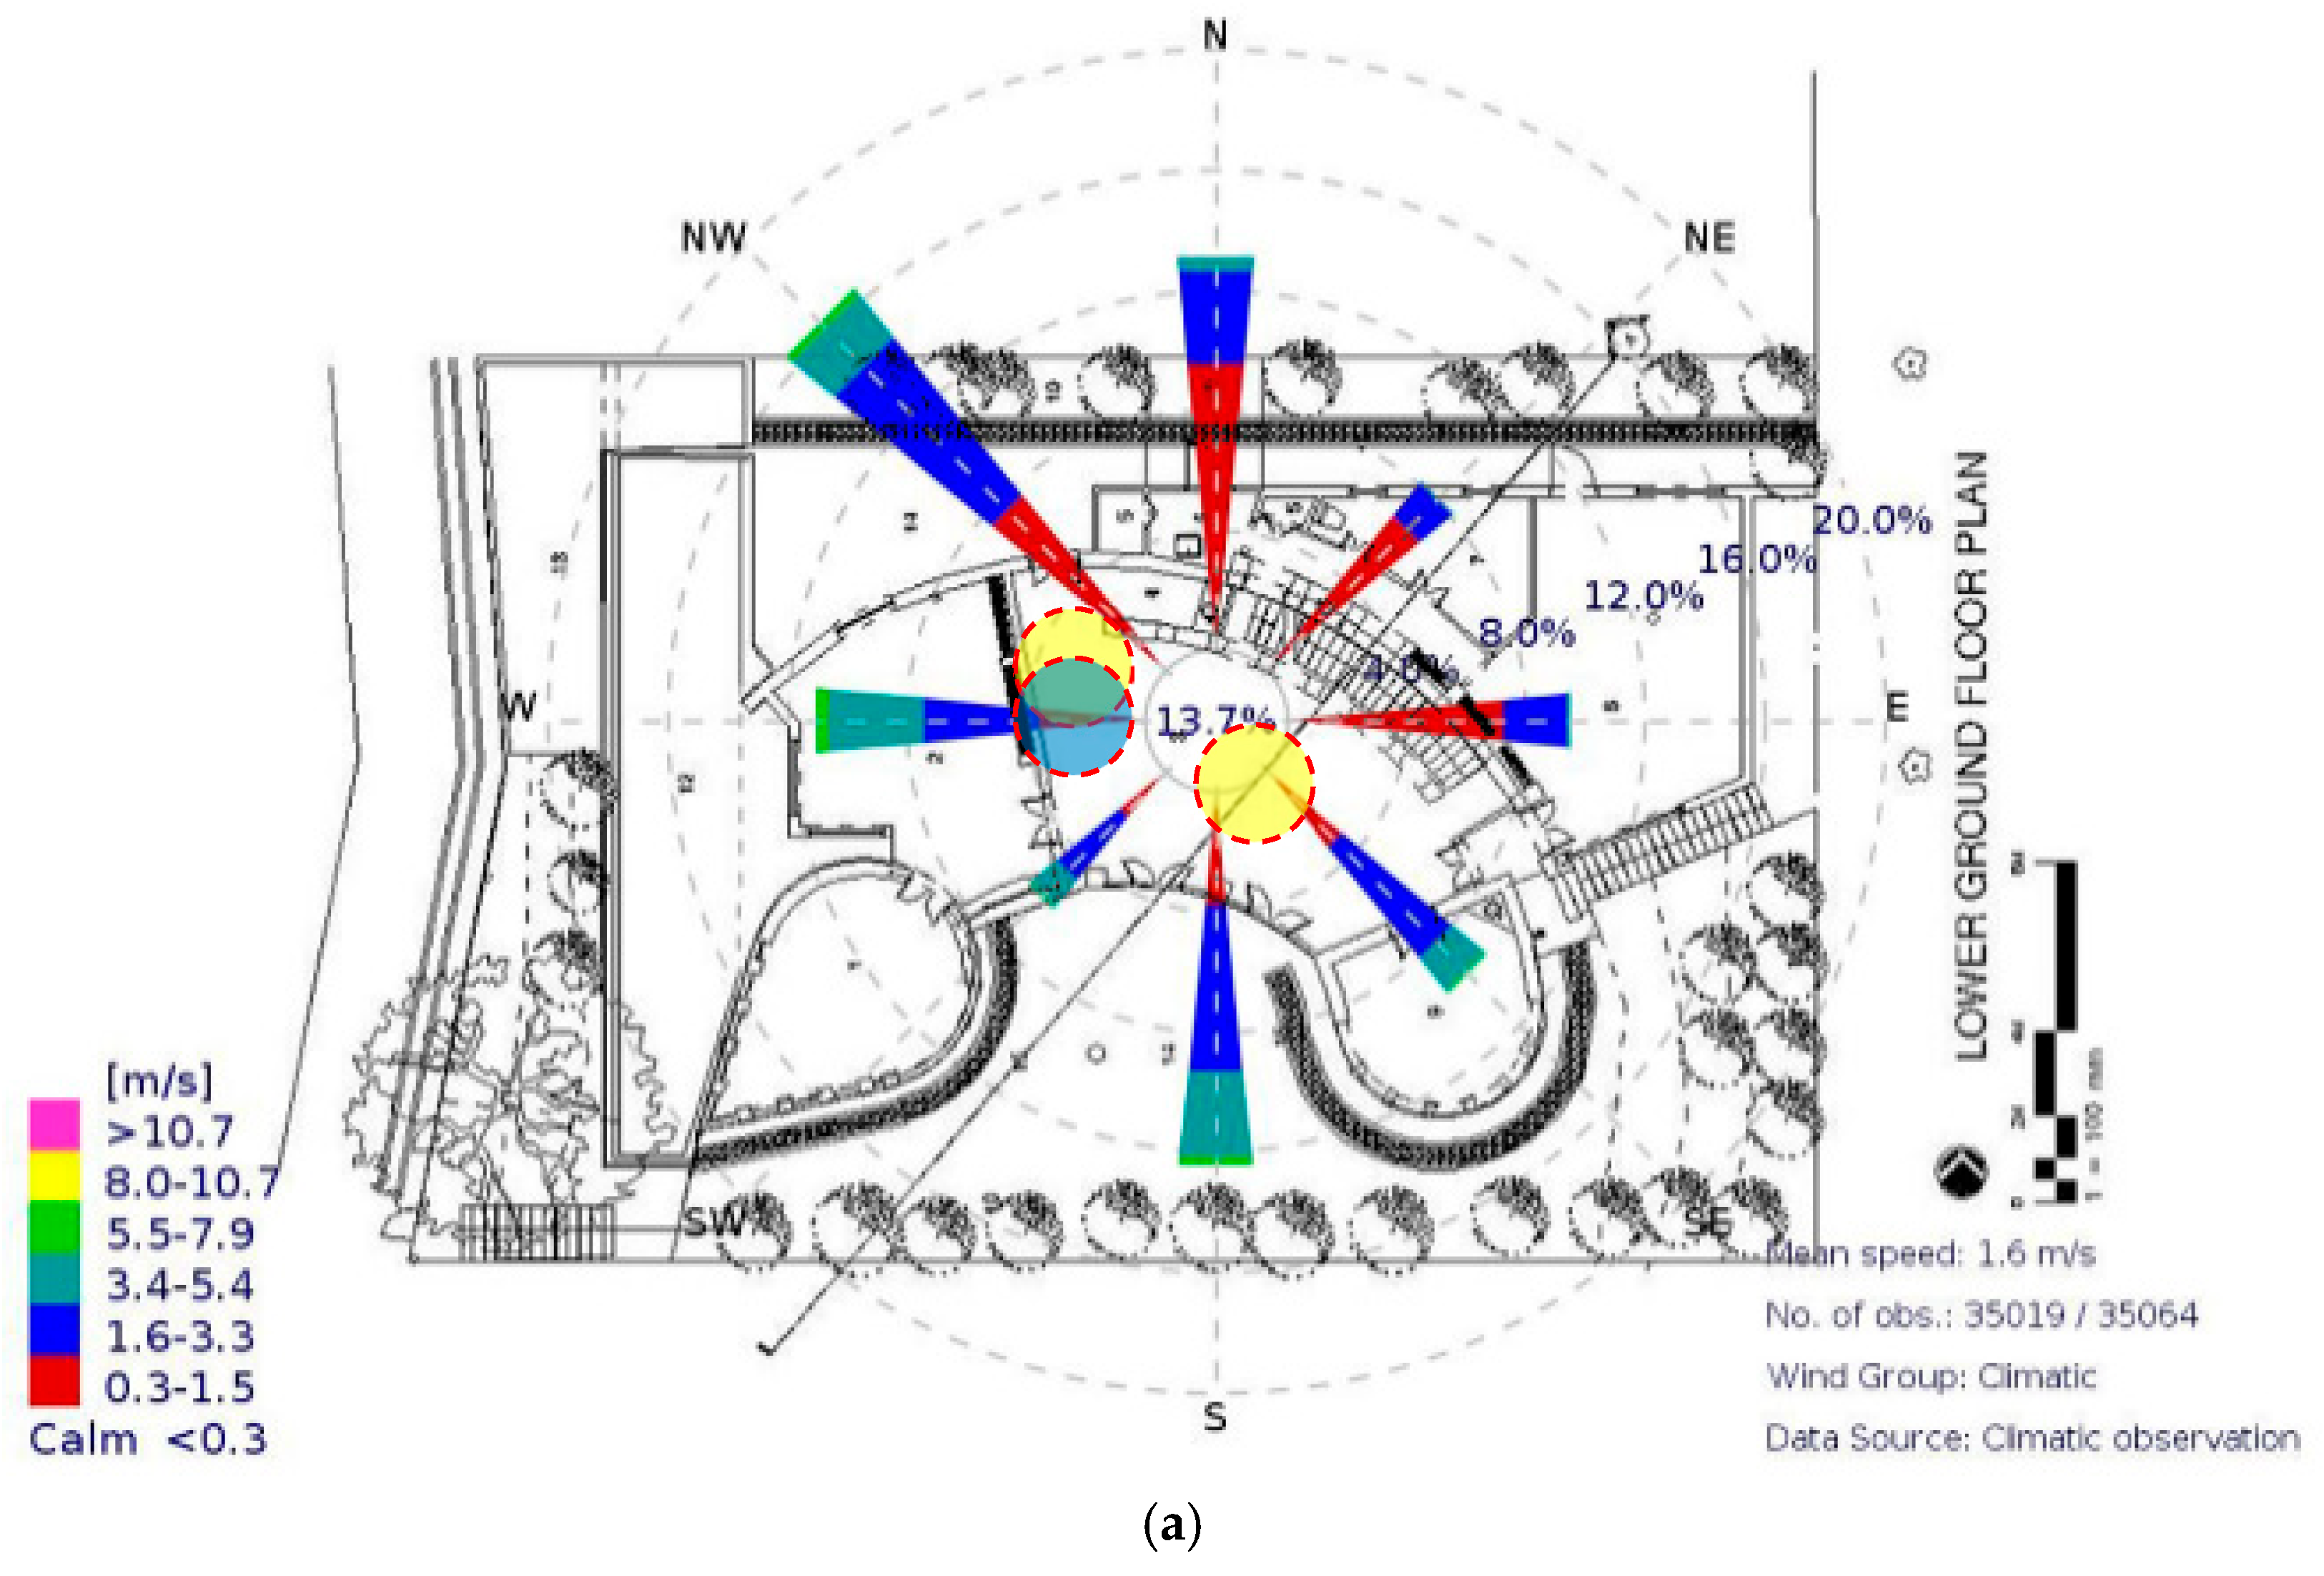
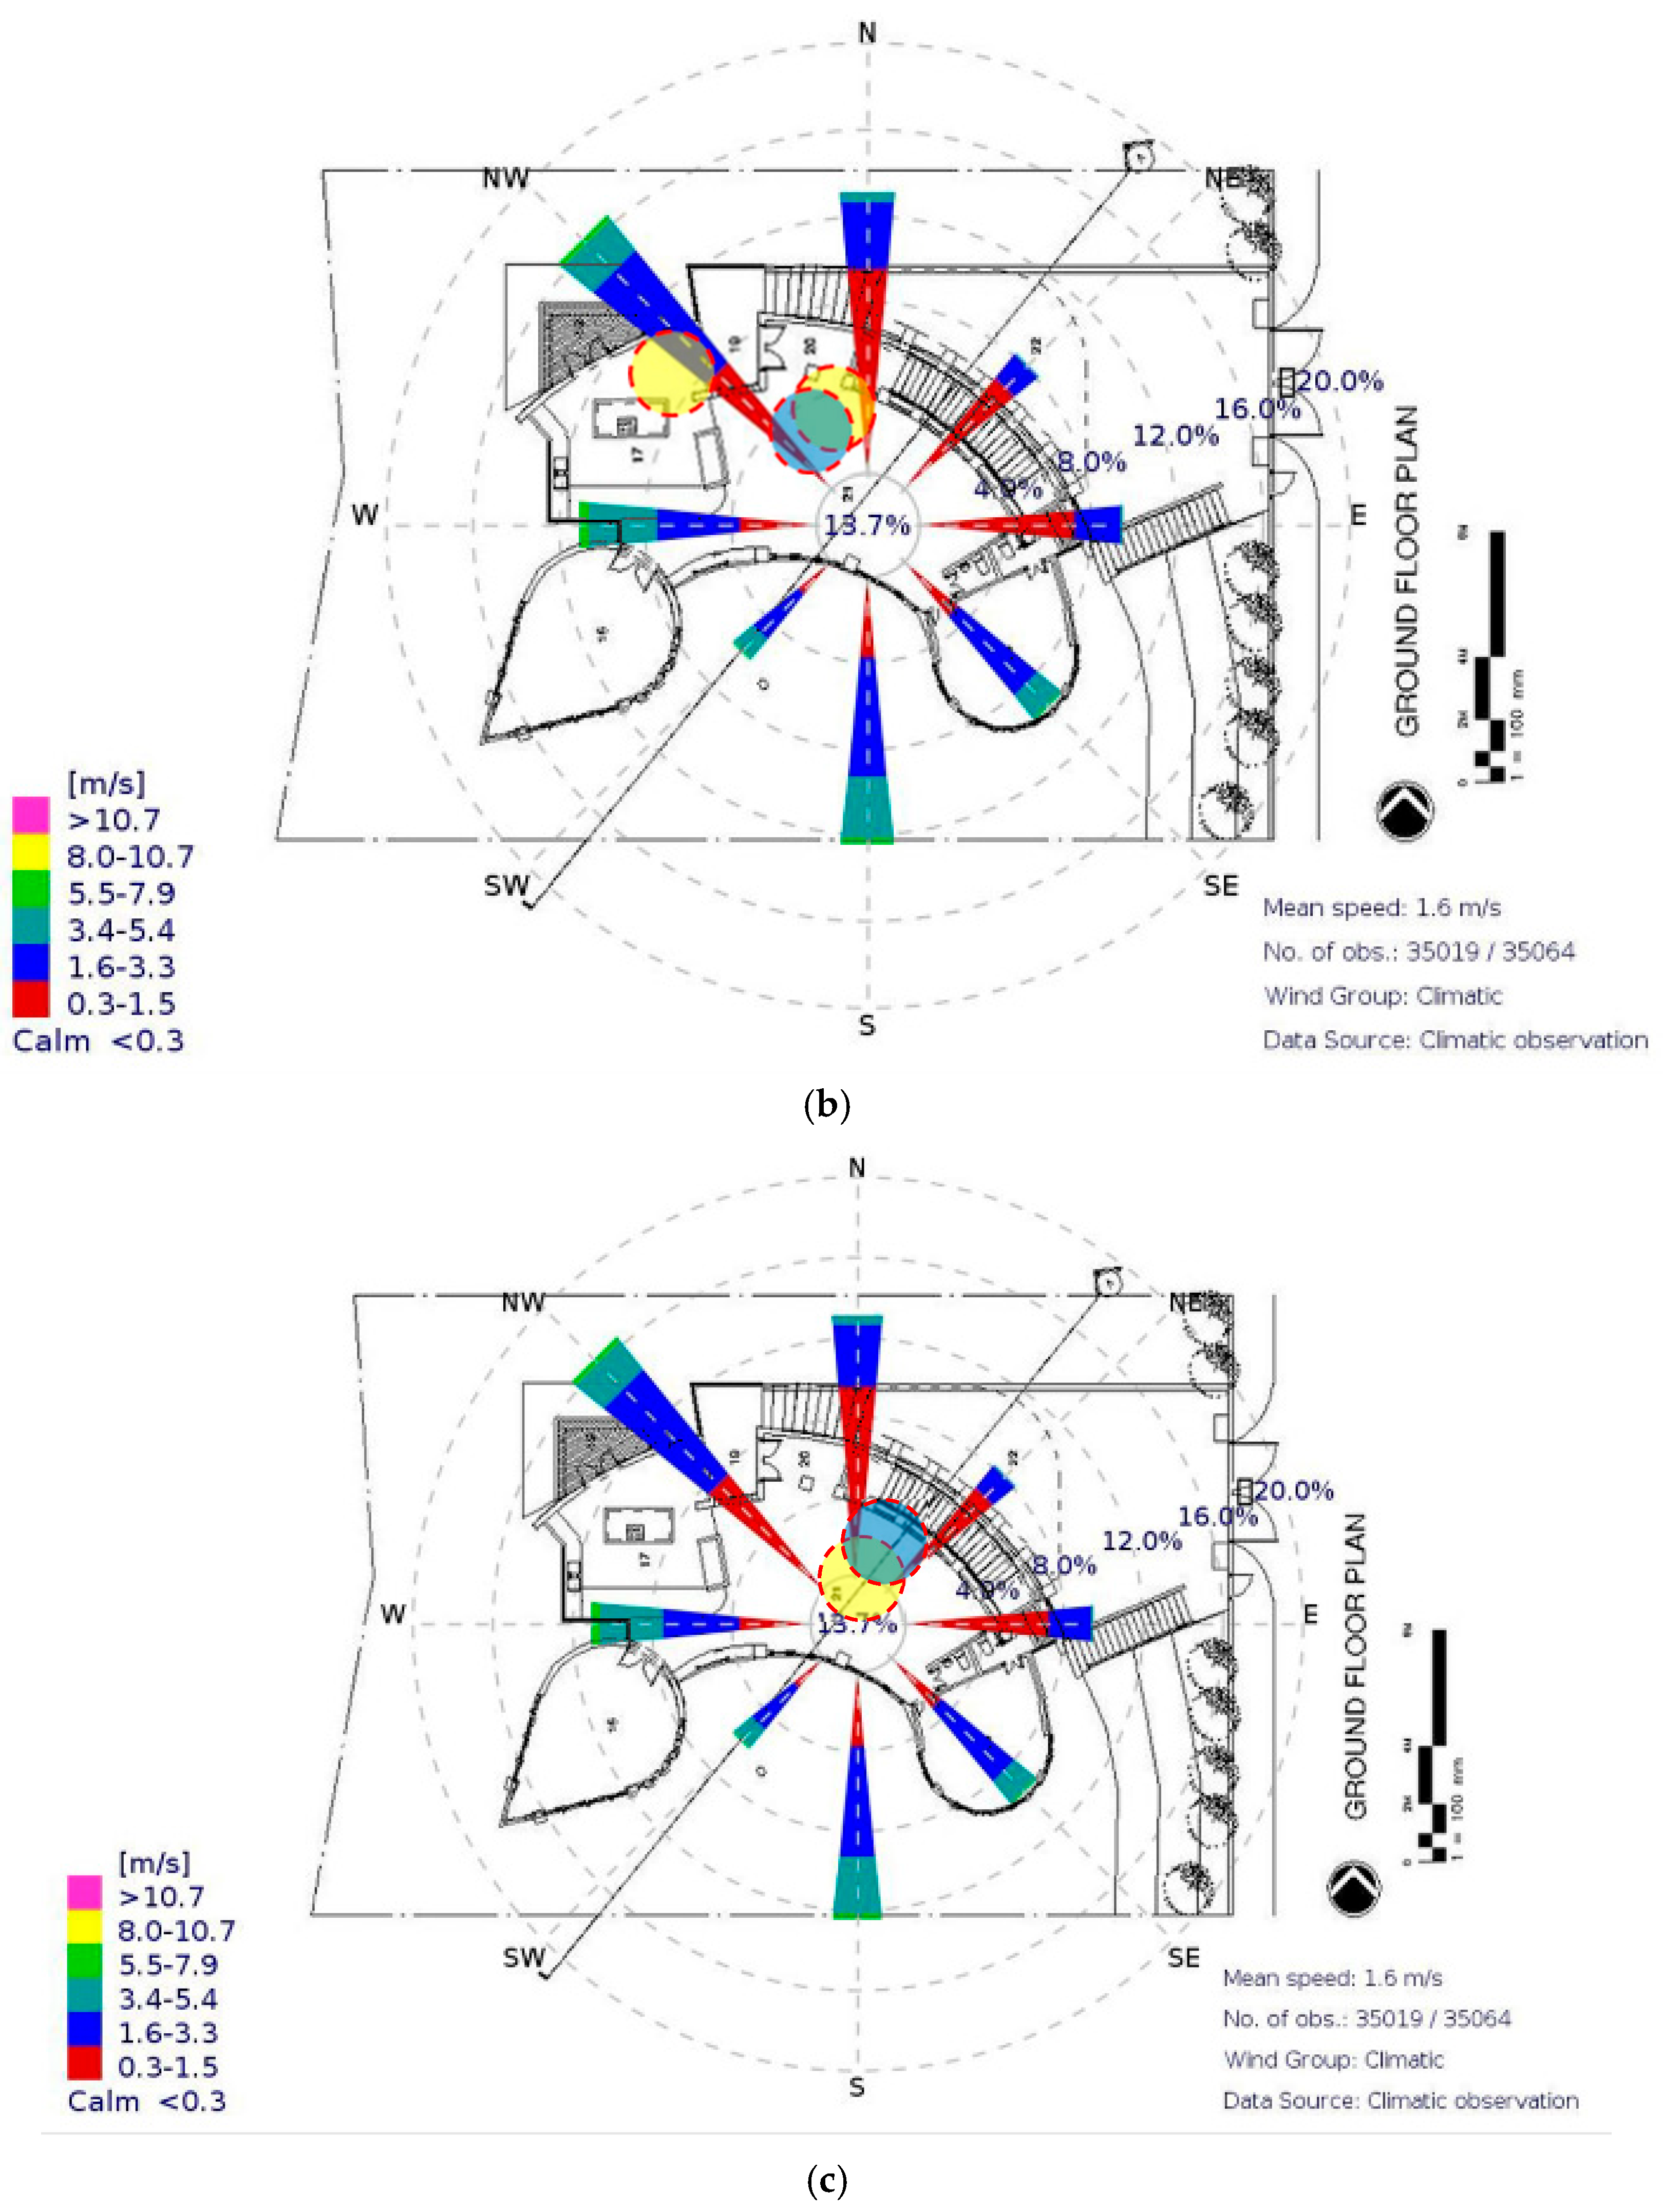
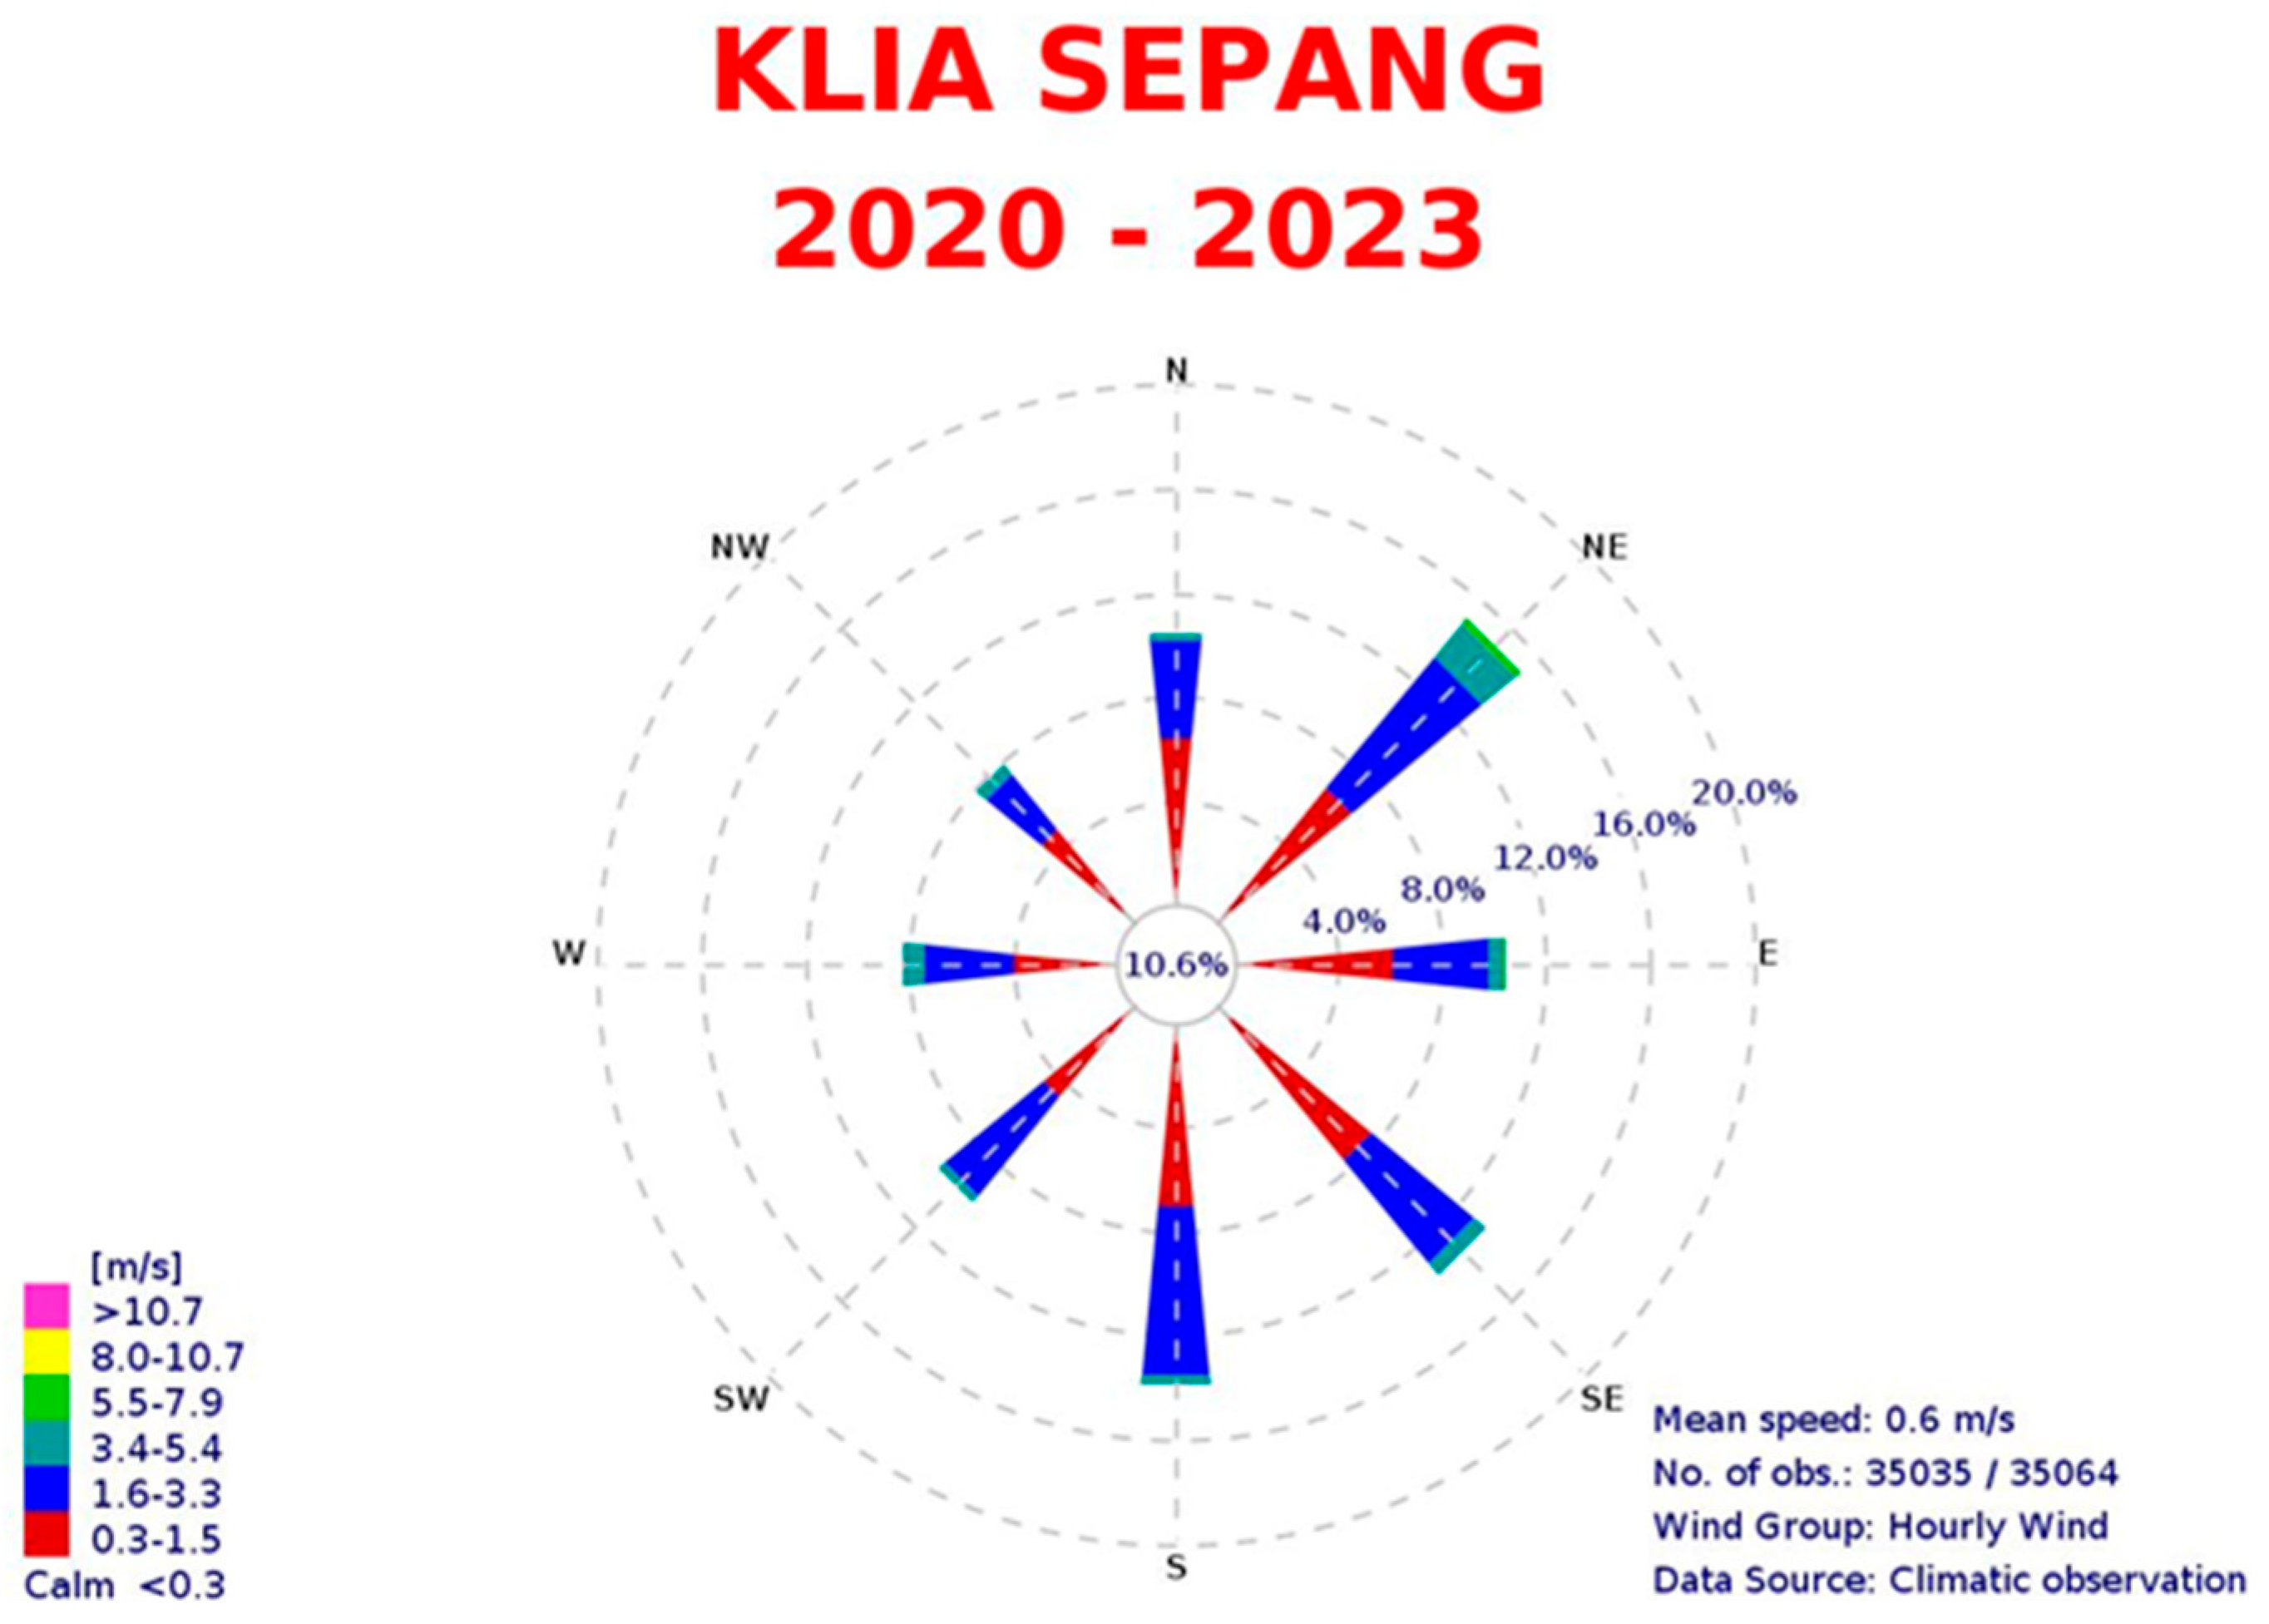
Crucially, the results highlight that both wind direction and indoor air velocity play a decisive role in determining thermal comfort across different residential contexts. Residence A, which is well aligned with prevailing Northwest and North winds, maintained continuous air movement (0.45–0.65 m/s), enabling effective convective and evaporative cooling despite high relative humidity. This indicates that under humid conditions, increased air velocity can compensate for reduced evaporative cooling potential. In contrast, Residences B and C, which are less effectively oriented towards prevailing Northeast and Southeast winds, experienced near-stagnant airflow (<0.05 m/s), resulting in inadequate heat dissipation and reduced thermal acceptability. These findings demonstrate that ventilation effectiveness is strongly dependent on both building orientation and airflow pathway design.
Based on this study’s findings, three key passive design recommendations emerge for hot–humid climates. First, building orientation and window placement must be optimised to capture the prevailing Southwest and Northeast monsoon breezes for effective cross-ventilation, a strategy essential for adaptive comfort [
47]. Second, because natural ventilation cannot offset severe radiant heat loads, designs must incorporate deep roof overhangs and exterior shading to minimise direct solar gain. Finally, to mitigate local Urban Heat Island (UHI) effects, architects should integrate microclimate strategies such as softscaping and permeable shading near natural ventilation inlets—to pre-cool incoming air before it enters the occupied zone.
Overall, the results demonstrate that adaptive thermal comfort in tropical residential environments depends on the synergistic interaction between envelope thermal performance, ventilation effectiveness, and landscape-mediated microclimate control. Quantitatively, combinations of low air velocity (<0.10 m/s) and elevated mean radiant temperature (>30 °C) consistently result in operative conditions exceeding the upper 90% adaptive comfort threshold. These findings confirm that ventilation effectiveness, rather than heat gain reduction alone, is the dominant determinant of thermal acceptability in hot–humid climates. Integrating airflow optimisation with envelope and microclimate strategies is therefore essential for achieving robust thermal comfort while reducing reliance on mechanical cooling and supporting long-term sustainability objectives.