Article

A Study on the Permeability Characteristics of Modified Red-Bed Mudstone and a Prediction Model for Its Permeability Coefficient

1
School of Civil Engineering, Lanzhou Jiaotong University, Lanzhou 730070, China
2
Gansu Province Transportation Planning, Survey & Design Institute Co., Ltd., Lanzhou 730030, China
*
Author to whom correspondence should be addressed.
Buildings 2026, 16(17), 3356; https://doi.org/10.3390/buildings16173356
Submission received: 28 July 2026 / Revised: 16 August 2026 / Accepted: 19 August 2026 / Published: 23 August 2026

Abstract

When red-bed mudstone is directly used as fill material for building foundations, road subgrades, and similar applications, it is prone to seepage-induced deformation and instability. Amending it with montmorillonite bentonite can effectively regulate its permeability characteristics. Meanwhile, rapid and accurate prediction of the permeability coefficient is crucial for building foundations and road subgrade seepage analysis and stability assessment. This study investigated red-bed mudstone fill material modified with montmorillonite bentonite at different blending ratios. Soil–water characteristic curve tests, saturated/unsaturated permeability tests, and nuclear magnetic resonance (NMR) tests were conducted on the specimens to examine the pore evolution patterns and permeability characteristics of the modified red-bed mudstone, and a predictive model for coefficients was proposed. The results indicate that the incorporation of montmorillonite-based bentonite markedly affects the permeability properties of modified red-bed mudstone fillers. The NMR T2 spectrum exhibits a bimodal distribution; the incorporation of bentonite and the saturation process result in a marked reduction in large pores and an increase in microporosity. The predictive model achieves higher accuracy when the montmorillonite bentonite content is high. Sensitivity analysis revealed that the maximum pore radius has a far greater influence on permeability than the pore fractal dimension and tortuosity. The research findings provide experimental evidence and theoretical models for the rapid estimation of permeability and seepage stability analysis of modified red-bed mudstone fill materials.

1. Introduction

Red-bed mudstone is water-sensitive and expansive; when exposed to water, it is prone to disintegration, weathering, and even liquefaction. When used as fill material for building foundations, road subgrades, and similar applications, its internal clay mineral content is a major cause of expansive deformation [1,2]. Meanwhile, variations in the composition and content of clay minerals, as well as differences in permeability, within modified red-bed mudstone determine the extent of deformation in the fill materials for building foundations and road subgrades. The permeability coefficient is a quantitative indicator of soil permeability; accurately determining or predicting it is of great significance for ensuring engineering safety and reducing construction costs [3].
Currently, direct experimental methods for determining soil permeability coefficients require large sample sizes and involve relatively long measurement cycles. Therefore, predictions are generally made indirectly by establishing various models. The Childs–Collis–George (CCG) model [4], the Mualem model [5], and the Burdine model [6] predict permeability coefficients based on the relationship between a soil’s soil–water characteristic curve (SWCC) and its relative permeability coefficient. Van Genuchten [7], Fredlund [8], Zhou [9], and others have developed new SWCC models and proposed corresponding prediction methods. Such SWCC-based methods are widely used in the prediction of unsaturated permeability coefficients; however, they essentially transform the prediction of permeability coefficients into a function of SWCC, and since the determination of SWCC is itself an indirect process, the errors introduced are further amplified in subsequent permeability coefficient predictions. Furthermore, most models of this type are based on the assumptions of isotropic and uniform porosity. Their applicability to media with complex pore structures—such as red-bed mudstones containing expansive clay minerals—which are prone to changes when exposed to water, has not yet been fully verified. Another important approach involves using fractal theory to study the microscopic pore characteristics of soil for predictive purposes. Xu et al. [10,11] studied the microscopic pore characteristics of soil using fractal theory and derived equations for the SWCC and permeability coefficient of unsaturated soils. Tao Gaoliang [12], from a microscopic perspective, indirectly characterized the SWCC using soil pore channel characteristics as an indicator and, in combination with capillary theory, established a nonlinear permeability model for hydraulic gradients in different pore channels. Fractal methods offer unique advantages in describing the irregularity of porous media pore structures; however, most existing fractal permeability models directly use SWCC as an intermediate variable, failing to circumvent the problem of cumulative errors arising from SWCC measurements. Furthermore, the model parameters often lack clear physical significance, limiting their widespread application in practical engineering.
The above studies indicate that the permeability coefficient of soil is closely related to the characteristics of its pore structure. In the relaxation theory of nuclear magnetic resonance (NMR) technology, the relaxation time T2 can effectively reflect the pore size distribution characteristics of soil, accurately obtaining parameter information such as soil porosity, pore size distribution, permeability, and pore type, which can then be used to determine the soil permeability coefficient [13,14,15,16]. Existing research indicates that the relationship between the NMR T2 time and pore diameter d can be expressed as [17]
1 T 2 ρ 2 S V = λ ρ 2 d
where S and V represent the surface area and volume of the pores containing water, respectively; ρ 2 is the transverse relaxation rate; d is the pore diameter; λ is a factor related to pore shape.
Based on the classical Kozeny–Carman equation and incorporating extensive experimental data, Kfeinberg et al. [18] proposed an empirical formula for estimating permeability using NMR porosity and the logarithmic mean of T2 times. Wu Guangshui et al. [19], taking into account the probability distribution of pores and interactions between them, established a capillary model based on Darcy’s law and Poiseuille’s law to rapidly predict the permeability coefficient of soil using the distribution of NMR T2 times. Wonjun Cha et al. [20], taking into account water transport mechanisms and combining the relationship between NMR relaxation time peaks and saturation, proposed a novel relative permeability model based on nuclear magnetic resonance for estimating the relative permeability of unsaturated coarse-grained soils. Tao Gaoliang et al. [21] presented a rapid prediction method for unsaturated permeability and relative permeability based on the correlation between transverse relaxation time and pore diameter. However, existing NMR prediction models primarily describe soil permeability through the macroscopic total volume of interconnected pores; they do not fully utilize the pore characteristics obtained from NMR experiments to analyze and predict soil permeability and permeability coefficients.
Fractal theory, as an important method for analyzing the microscopic pore distribution in porous media, has been successfully applied to the study of the permeability characteristics of porous media [22,23], and various permeability coefficient prediction models have been proposed. Vahid Nourani et al. [24], combining fractal theory, scanning electron microscopy (SEM), and image processing techniques, proposed a model for calculating the permeability coefficient of saturated soil; the calculated results were highly consistent with measured results. Feng Ming et al. [25], in order to analyze the impact of the bottleneck effect on the retention of unfrozen water in frozen soil, expressed the soil permeability coefficient as the product of saturation and the relative permeability coefficient. They derived a permeability coefficient expression based on fractal theory. By comparing the predicted data with experimental data and other common models, they demonstrated that this fractal model performs well in predicting soil permeability coefficients.
Based on the above issues, modified red-bed mudstone specimens with different montmorillonite bentonite content were designed. Soil–water characteristic curve tests were conducted using the filter paper method; the development patterns of unsaturated soil permeability coefficients were determined using the transient profile method; and NMR experiments were employed to analyze the pore structure changes and fractal characteristics of the specimens. Using fractal theory to describe the complexity and irregularity of porous media, and combining it with nuclear magnetic resonance theory and seepage theory, a fractal permeability coefficient prediction method based on pore distribution was proposed. The model’s performance was evaluated by comparing the predicted data with experimental data. A sensitivity analysis was conducted on the pore structure parameters affecting the saturated permeability coefficient. Finally, the changes in the moisture field of the embankment during the infiltration process were simulated numerically, and the results were presented.

2. Test Materials and Methods

2.1. Test Materials

The red-bed mudstone used in the experiment was collected near Lanzhou, China. Basic physical property tests of the red-bed mudstone were conducted in accordance with the “Standard for geotechnical testing method” (GB/T 50123-2019) [26]. The measured specific gravity of the soil particles was 2.68, the liquid limit was 34.78%, the plastic limit was 14.82%, and the optimum moisture content was 14.2%. XRD testing revealed that clay minerals accounted for 52.6% of the red-layered mudstone. The main mineral component of the montmorillonite bentonite used in the experiment was montmorillonite, accounting for approximately 72.6%; the remainder consisted of sodium feldspar, calcite, and quartz. Using the internal blending method, montmorillonite bentonite was incorporated into the red-bed mudstone at different proportions to prepare modified red-bed mudstone composite specimens with mass fractions of 0%, 4%, 8%, and 12%. For every 4% increase in the blending ratio, the montmorillonite content in the test soil specimens increased by approximately 3%.

2.2. Test Methods

2.2.1. Saturated Permeability Tests and Soil–Water Characteristic Curve Test

Ring-cut specimens of red-bed mudstone fill material modified with different montmorillonite-based bentonite additions were prepared, with a dry density of 1.7 g/cm3 and a moisture content of 14.2%. The ring-cut specimens had a diameter of 61.8 mm and a height of 20 mm.
The specimens were subjected to vacuum saturation in accordance with the “Standard Test Methods for Geotechnical Engineering” (GB/T 50123-2019), and their saturated permeability coefficients were measured using a variable-head permeability test. To minimize experimental error, duplicate specimens were prepared, and the average value was taken as the saturated permeability coefficient at 20 °C.
Using 4% moisture content as the initial moisture content and 2% moisture content as the gradient, five sets of soil samples with different moisture contents were prepared, along with duplicate specimens. In this experiment, Double Circle No. 203 slow-speed filter paper (Cytiva Bio-Technology (Hangzhou) Co., Ltd., Hangzhou, China) was used to measure the suction of the matrix. Based on the existing calibration curve [27], the soil suction values were calculated, and the soil–water characteristic curve was subsequently derived. The matrix suction determination equation is as follows:
lg ψ 2 = 0.077 ω f p + 5.493 ,   ω f p 47 % 0.012 ω f p + 2.470 ,   ω f p > 47 %
where ψ 2 is the suction force of the soil matrix; ω f p is the mass moisture content of the filter paper.

2.2.2. Unsaturated Permeability Test

The unsaturated permeability coefficient was measured using the instantaneous profile method. The test setup utilized a self-developed soil column seepage test apparatus, which included a water injection (and drainage) system, a data acquisition system, and a sample chamber. The water injection system consisted of a water storage tank, an electronic scale, and a 3 cm water level valve; the electronic scale recorded data every minute to monitor the injection volume in real time. The data acquisition system consists of 11 EC-5 moisture sensors and a data logger (METER Group, Pullman, WA, USA). The sensors are spaced 40 mm apart at their centers, and the data logger records sensor readings every 1 min. The sample chamber is fabricated from high-transparency acrylic with dimensions of 230 mm × 610 mm (inner diameter × height) and a wall thickness of 10 mm. The test system is shown in Figure 1, and the specific test procedures are as follows:
(1)
Calibrate the EC-5 sensors; grind the soil sample to a fine consistency and sieve it through a 2 mm sieve; mix in montmorillonite bentonite according to the specified ratio and stir thoroughly; prepare wet soil with a moisture content of 13%, seal it, and let it stand for 2 days; then remove it and remeasure the moisture content.
(2)
Based on the remeasured moisture content and the cross-sectional area of the sample chamber, calculate the mass of wet soil required for a soil column with a dry density of 1.7 g/cm3 and a height of 10 cm. Weigh the corresponding mass of soil, place it in the sample chamber, and compact it. Install the sensor at the present position. Repeat this procedure until the soil column reaches a height of 60 cm, smoothing the surface between layers to ensure a tight seal and prevent discontinuities.
(3)
Place filter paper and permeable gravel with dimensions matching the soil column’s cross-section at both the top and bottom ends to ensure uniform water infiltration. Seal the junctions with silicone sealant to prevent water from seeping out along the interfaces.
(4)
Connect the data logger, open the water inlet valve, and record the start time. Adjust the water level valve to maintain the water level at the top of the soil column at 3 cm. Begin the infiltration test, setting the computer to record data at 1 min intervals. Once drainage begins, close the water inlet valve to end the infiltration test.
(5)
After the infiltration test is complete, take layered samples from the soil column in the sample chamber using a standard ring cutter and an aluminum box. Measure the moisture content of each layer, with a layer spacing of 4 cm.
(6)
Using the above method, conduct transient profile tests on red-layer mudstone filler soil columns with montmorillonite bentonite content of 0%, 4%, 8%, and 12%, in that order.

2.2.3. Nuclear Magnetic Resonance Test

According to the principles of nuclear magnetic resonance, the rate at which energy is released after H protons are magnetized is directly proportional to their number; the differences in these signals can be used to obtain the distribution of transverse relaxation time T2. Generally, the smaller the pore diameter, the smaller the measured T2 value, and vice versa.
From Formula (1), we obtain
d = λ ρ 2 T 2
In Formula (3), ρ 2 represents the transverse relaxation rate, with a value of 2.5 × 10⁻⁵ m/s. The pore size distribution obtained from the NMR measurements in this study is primarily used to analyze the relative changes in the soil’s pore structure at different modification dosages; no strict requirements are imposed on the absolute accuracy of the pore sizes. Therefore, no separate calibration was performed for samples at each dosage; λ is a factor related to pore shape, with a value of 4 for cylindrical pores and 6 for spherical pores.
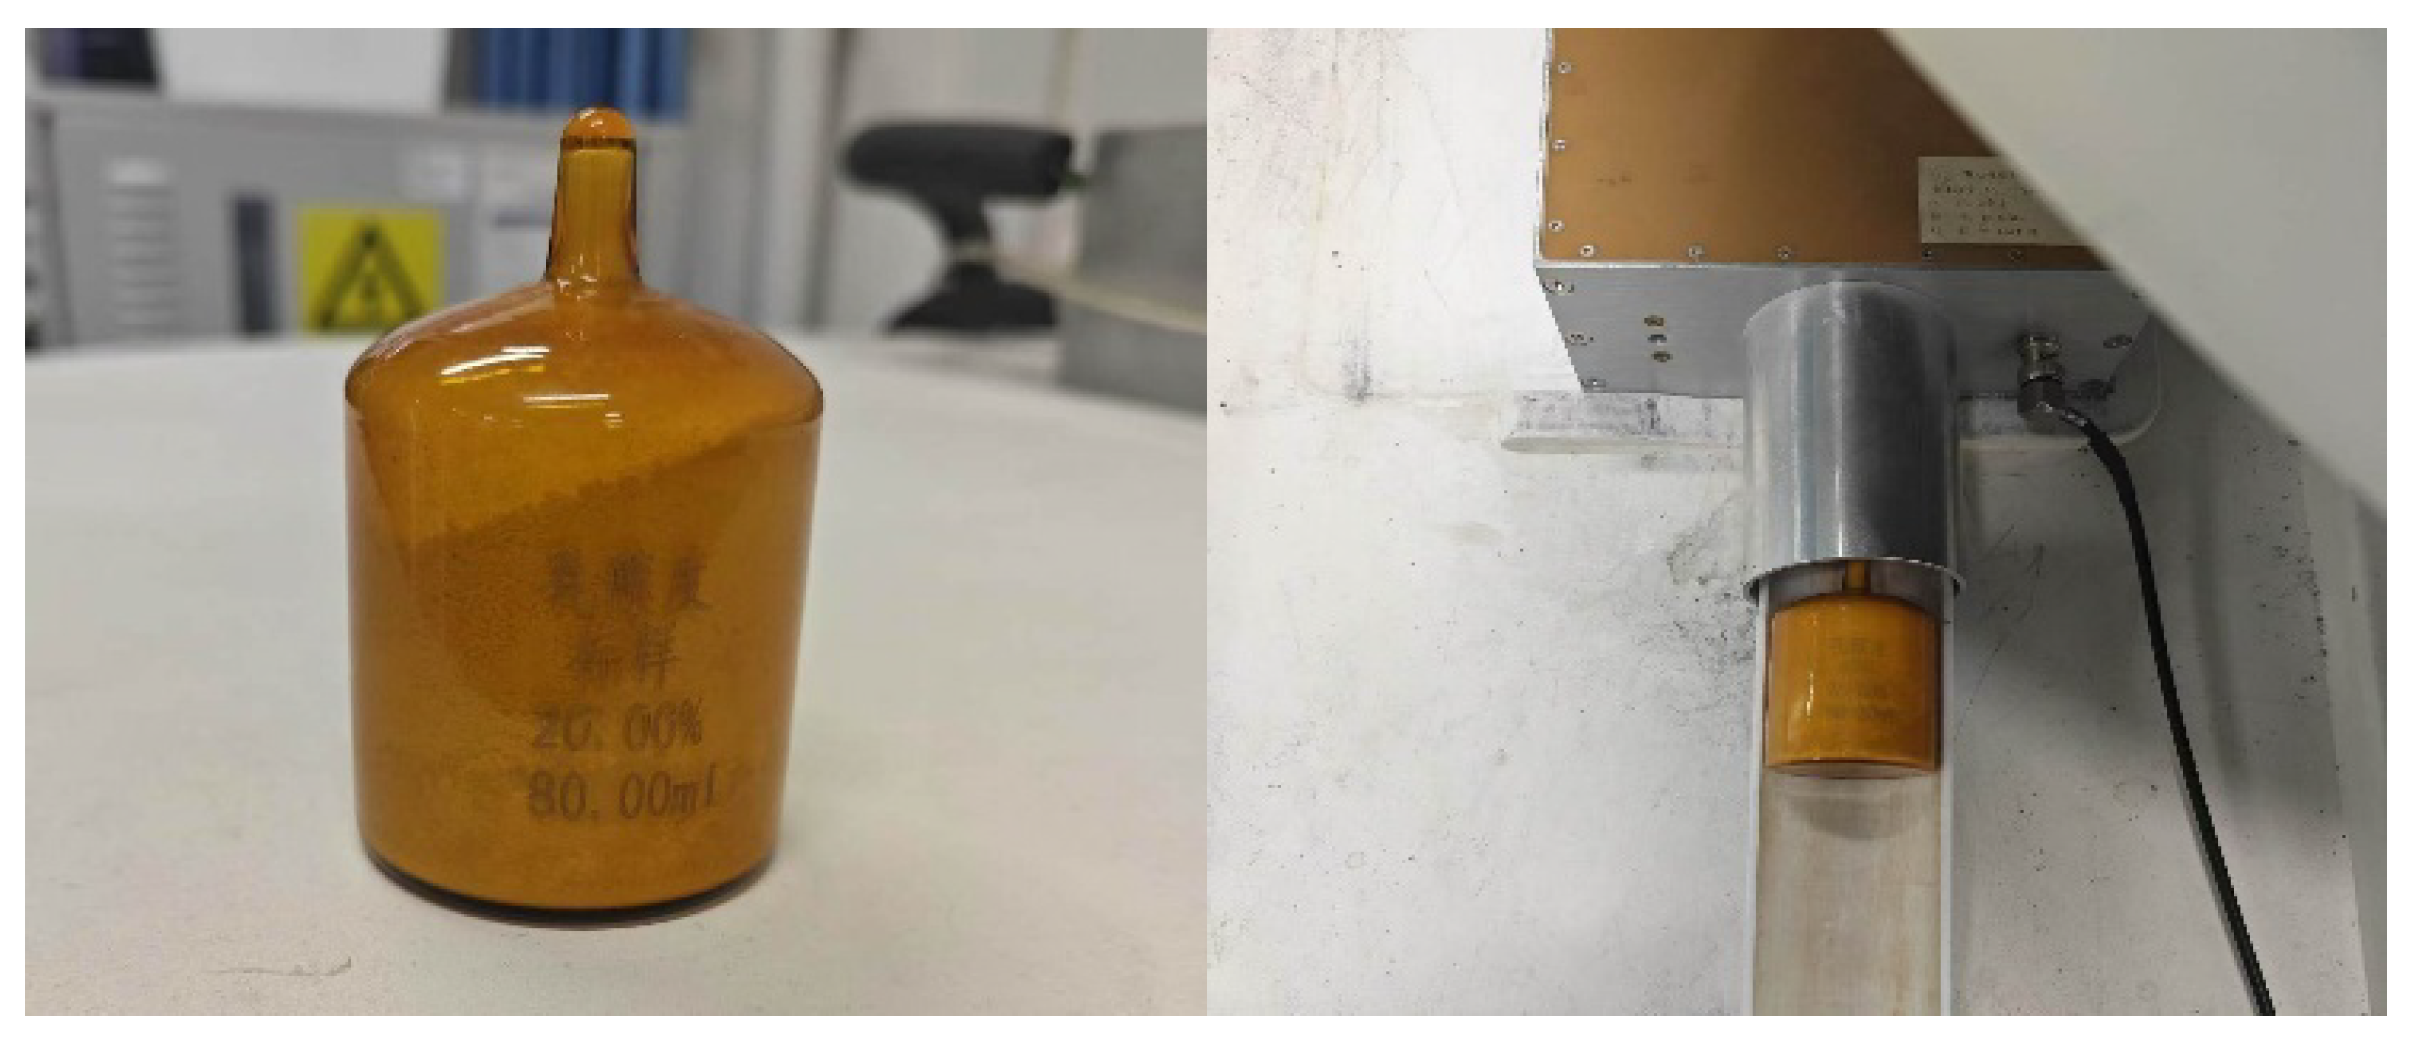
The NMR testing utilized the MacroMR12-150H-I low-field NMR analysis and imaging system developed by Suzhou Niumag Analytical Instrument Corporation (Suzhou, China). The test parameters were as follows: echo interval of 0.1 ms, dwell time of 1.5 ms, 16 scan repetitions, and 6000 echoes. Prior to the test, calibration was performed using a standard sample with a known porosity, as shown in Figure 2.
Eight ring-knife specimens (φ61.8 mm × 20 mm) of modified red-bed mudstone with varying montmorillonite-based bentonite content—each with a moisture content of 14.2% and a dry density of 1.7 g/cm3—were prepared, and the tests were divided into Groups A and B. The unsaturated specimens in Group A were placed in a cryogenic freezer maintained at a constant temperature of −80 °C for 12 h, then removed and freeze-dried in a freeze-dryer for 24 h. After freeze-drying, the specimens were evacuated for 2 h and then saturated with alcohol for 20 h. The saturated specimens were subjected to NMR testing, yielding T2 spectra of the modified red-layered mudstone filler specimens in the saturated state. It should be noted that the unsaturated samples were saturated with 99% pure alcohol rather than pure water to prevent swelling and to meet the requirements for saturated samples in NMR testing. After preparation, the samples in Group B were directly subjected to NMR testing, yielding T2 spectra of the modified red-bed mudstone samples in an unsaturated state.

3. Test Results and Evaluation

3.1. Saturation Permeation Test

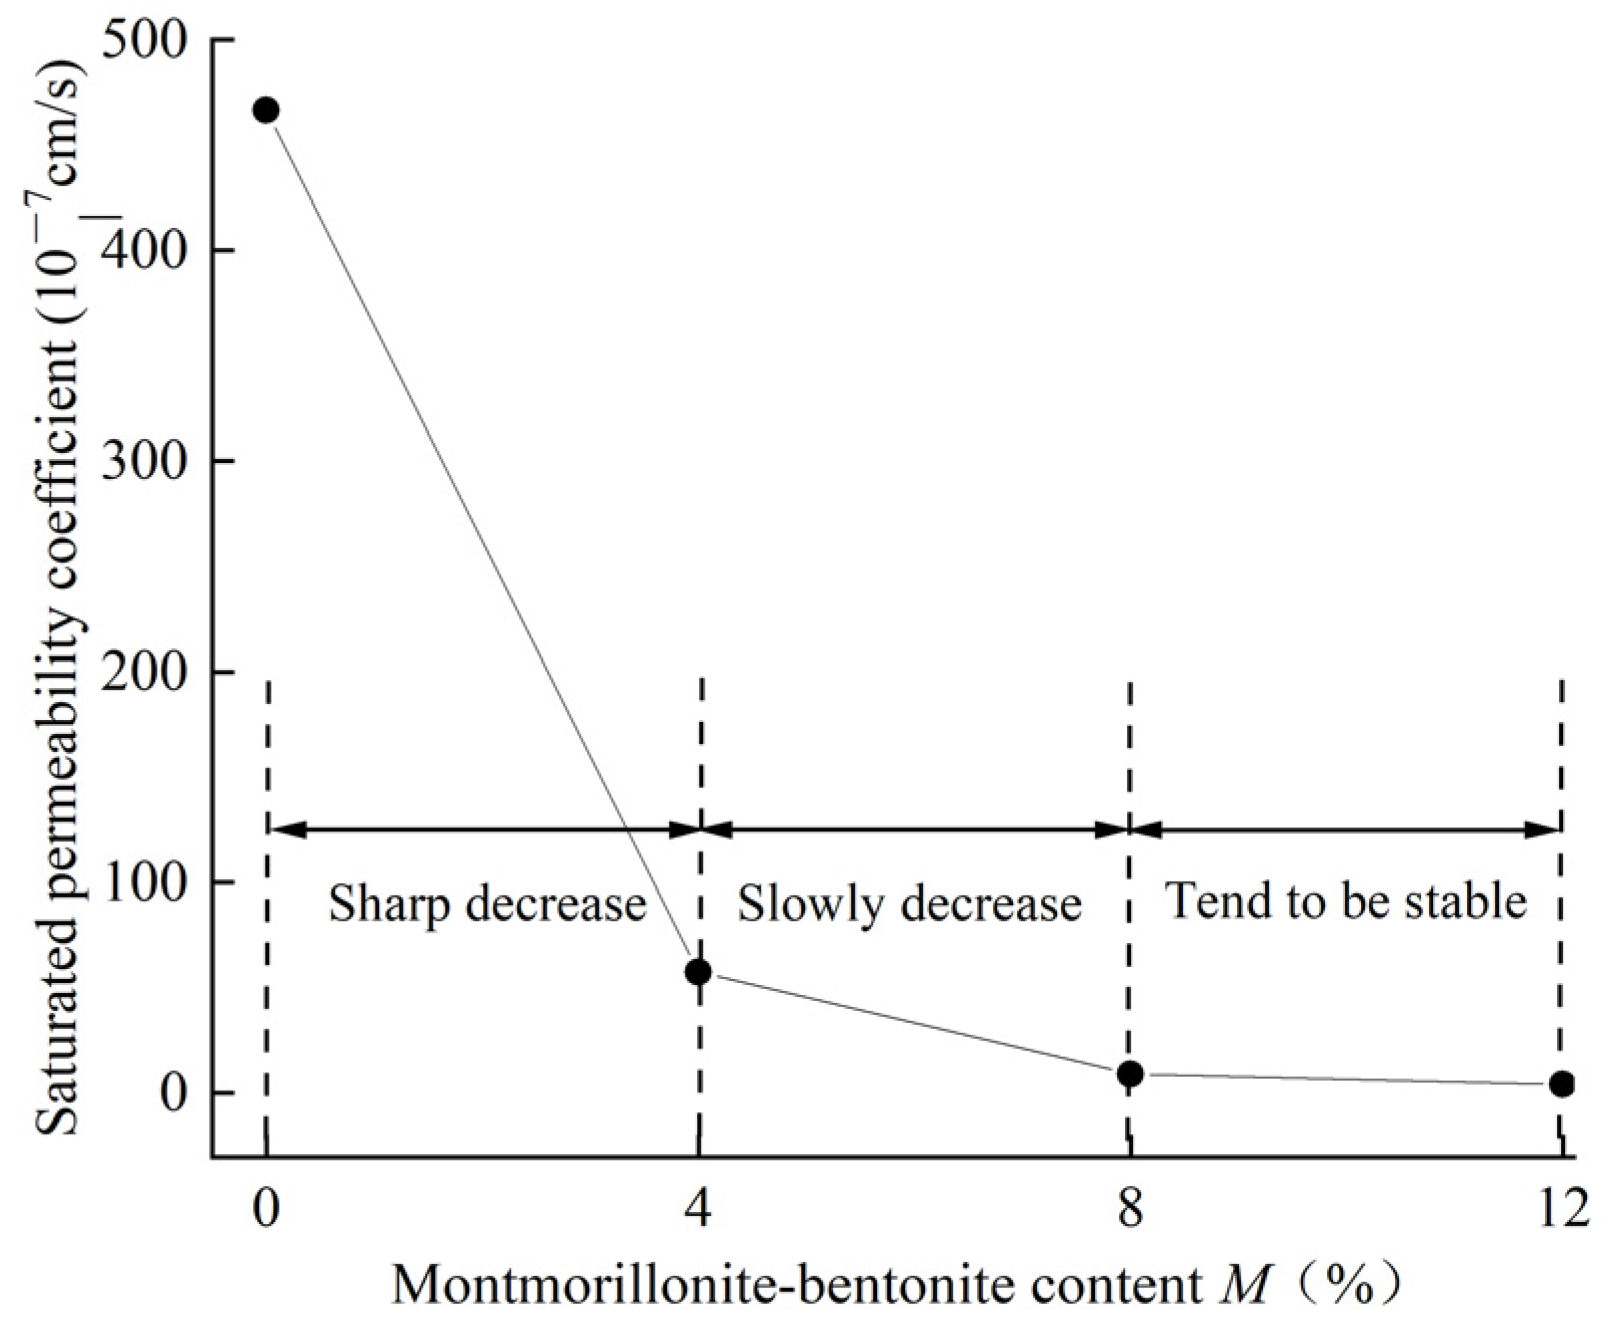
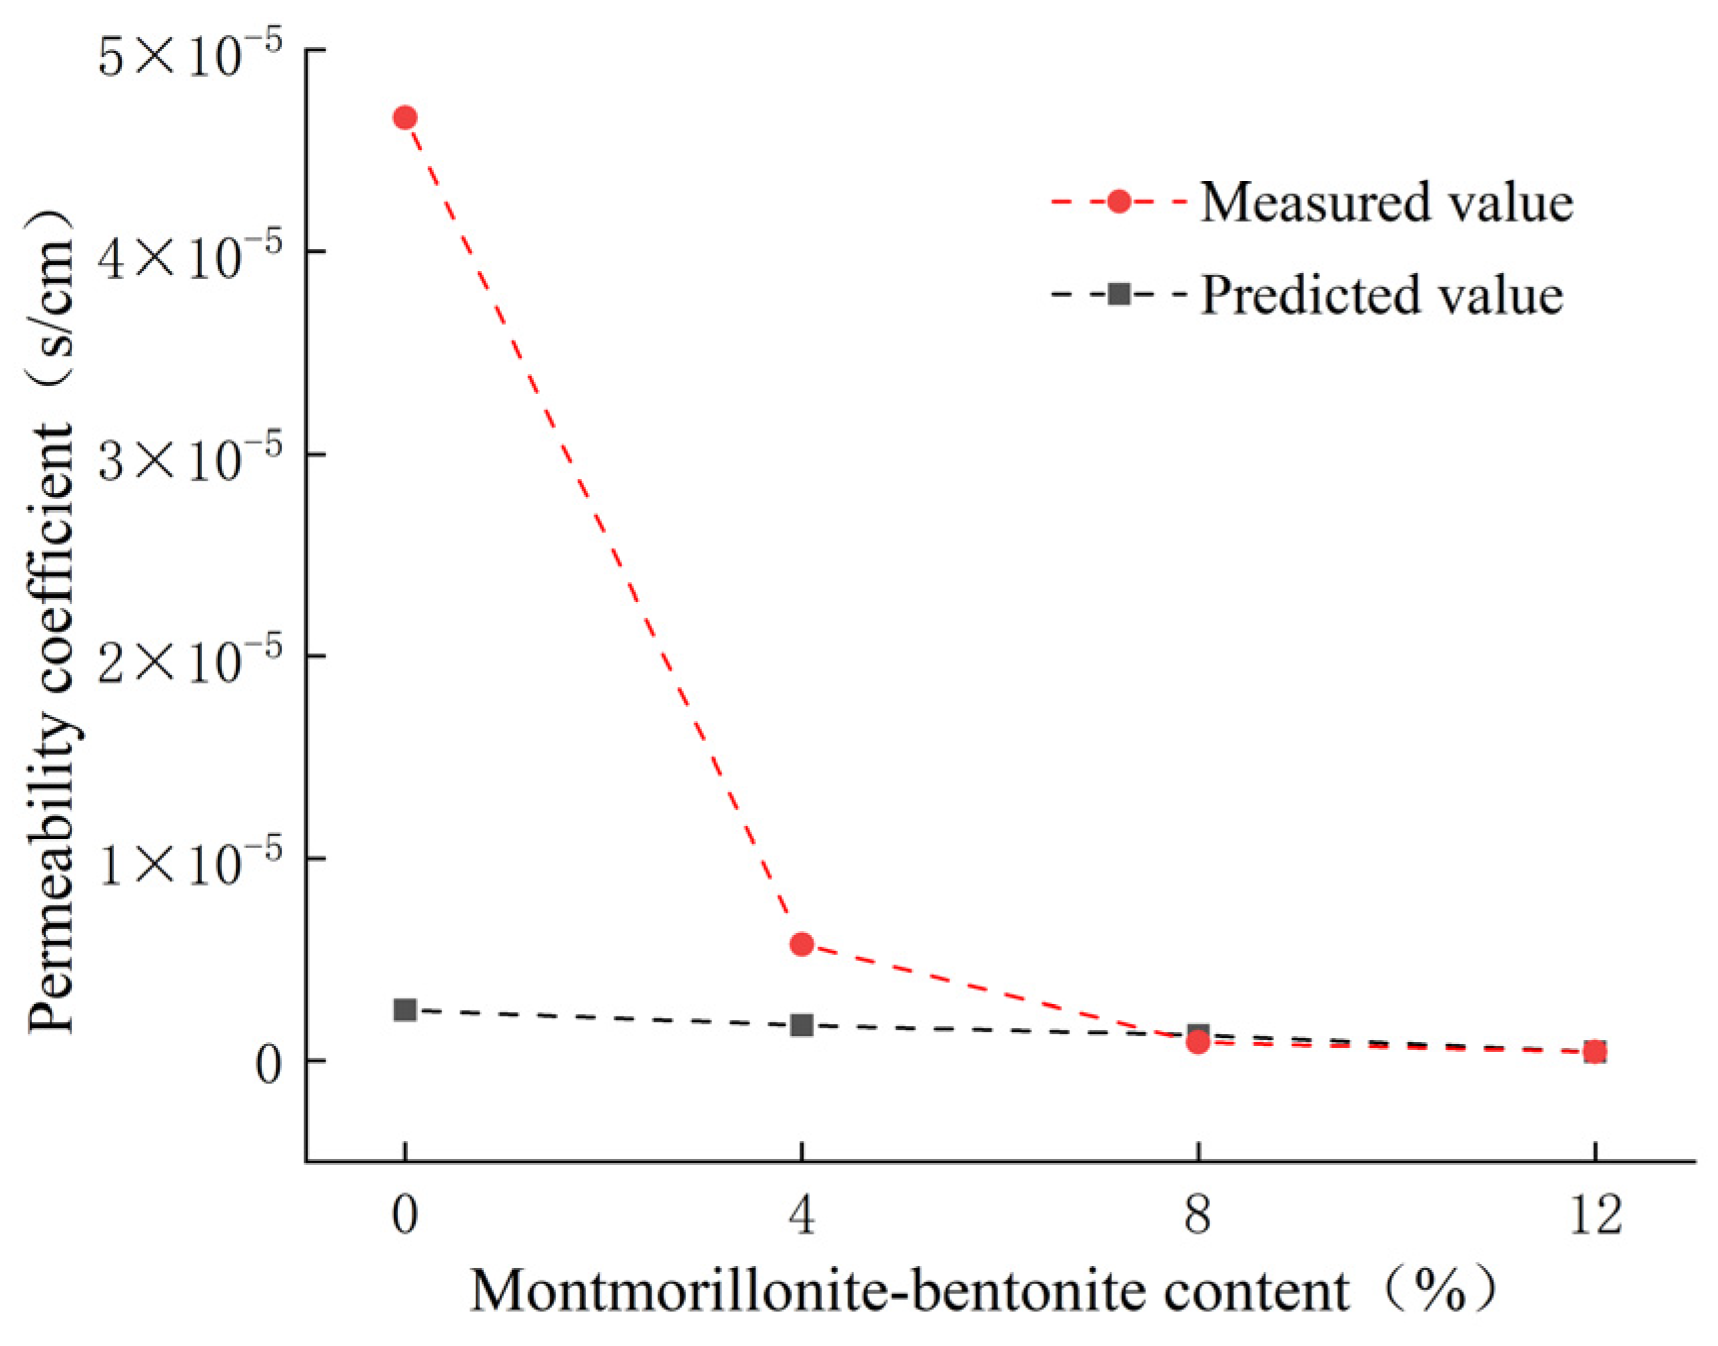
The saturated permeability coefficients of the modified red-bed mudstone are shown in Table 1 and Figure 3; the relative deviations between parallel samples were all less than 5%.
As shown in Figure 3, the saturated permeability coefficient of the modified red-bed mudstone exhibits a nonlinear decreasing trend as the montmorillonite bentonite content increases. When the montmorillonite bentonite content ranged from 0% to 4%, the permeability coefficient of the modified red-bed mudstone decreased by 87.79%, and the rate of decrease dropped sharply; when the content exceeded 4%, the permeability coefficient decreased slowly and tended to stabilize. The saturated permeability coefficient of the modified red-bed mudstone underwent three stages: a sharp drop in the rate of decrease, a slow decrease, and stabilization.

3.2. Soil–Water Characteristic Curves

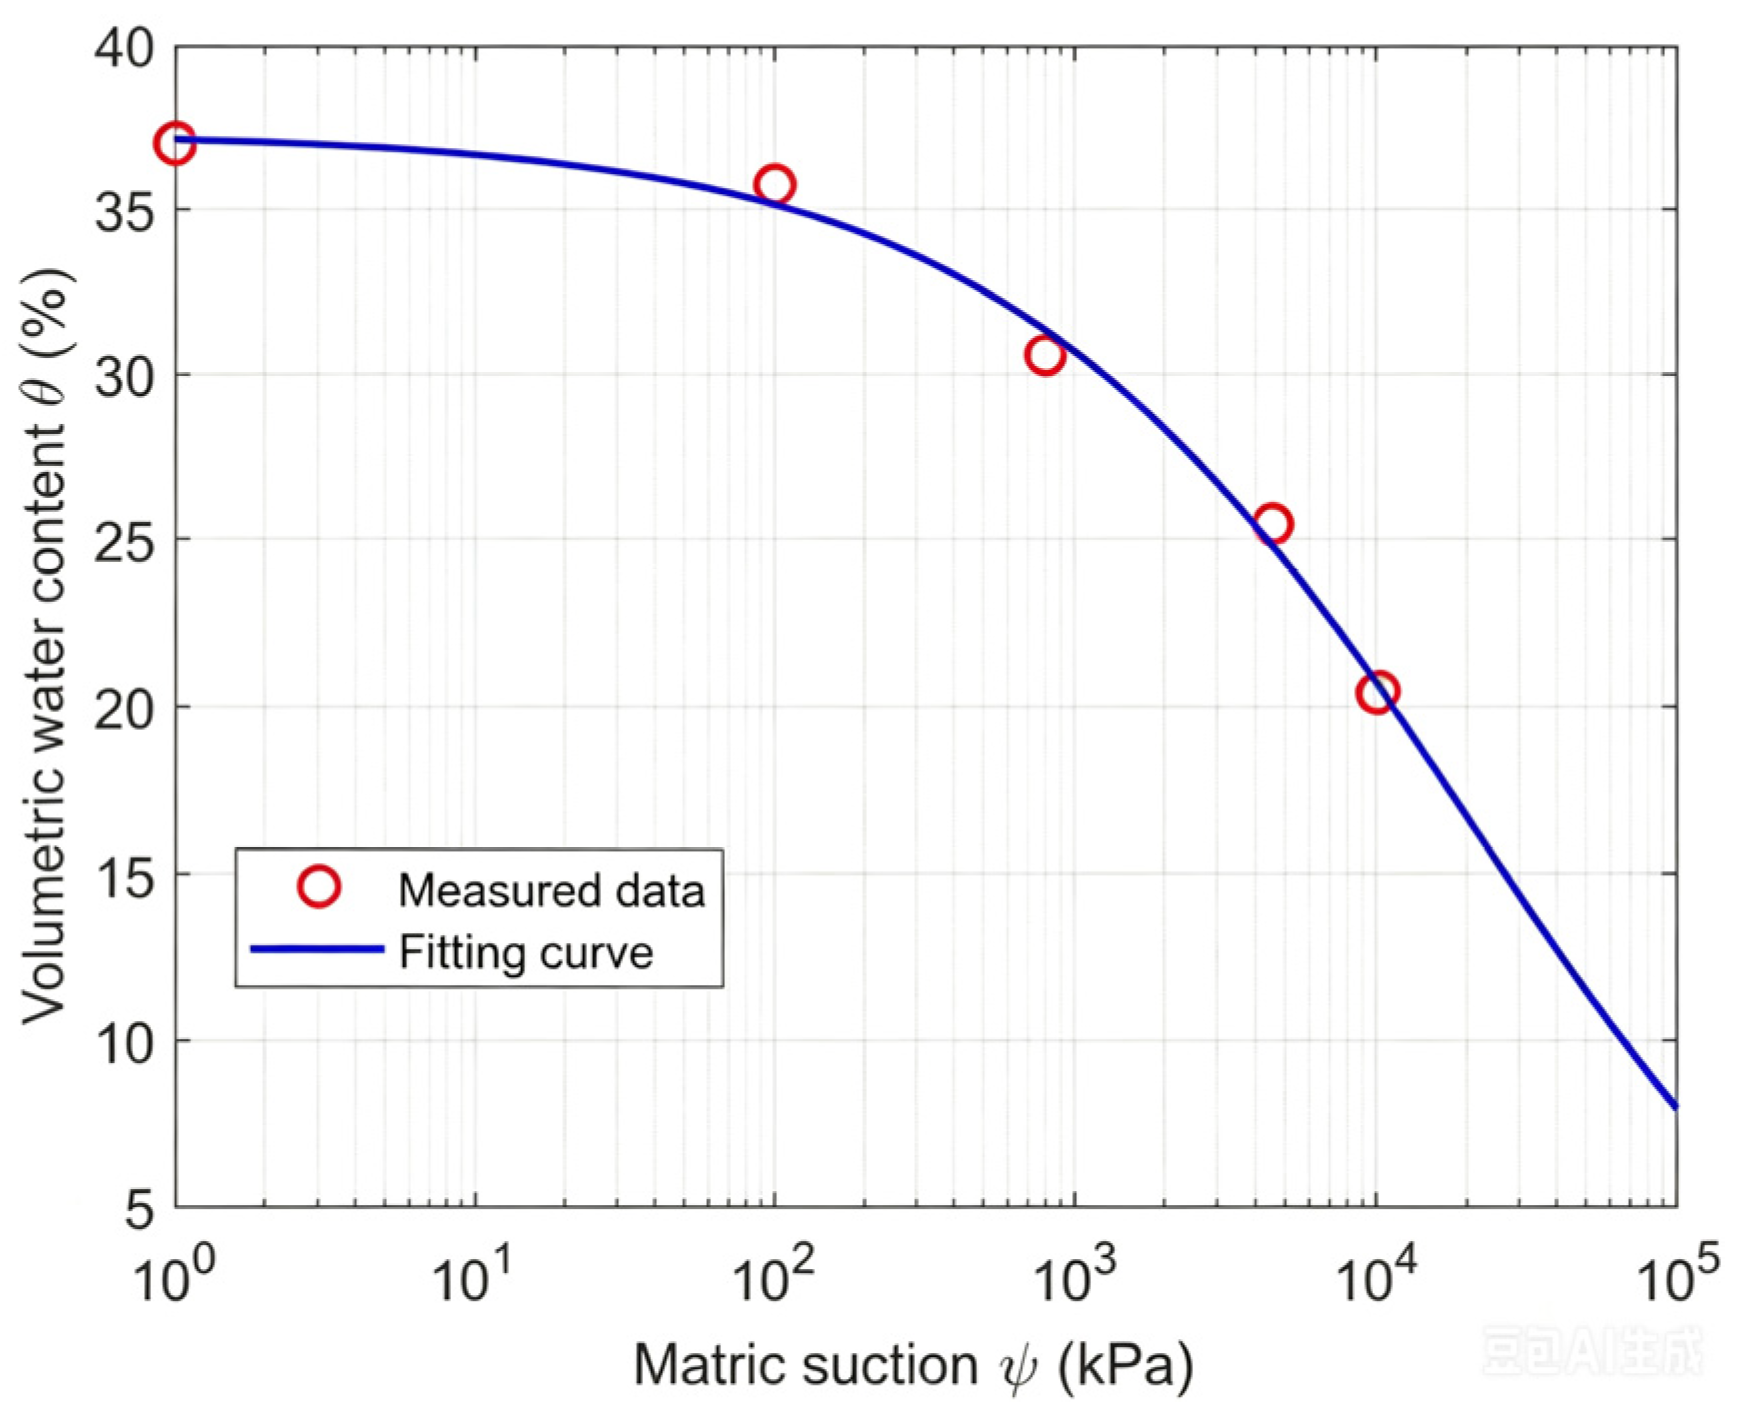
The soil–water characteristic curves for the red-bed mudstone obtained using the filter paper method are shown in Figure 4; the relative deviations between parallel samples were all less than 5%. As can be seen from the figure, the matric suction range of the test soil samples was 1–104 kPa. The volumetric moisture content gradually decreased as the matric suction increased, with the rate of decrease initially increasing and then decreasing. When the matrix suction is less than 100 kPa, the change in the soil sample’s volumetric moisture content is small, and the slope of the curve approaches 0; when the matrix suction exceeds 100 kPa, the rate of decrease in the soil sample’s volumetric moisture content increases, and the absolute value of the curve’s slope is relatively large; when the matrix suction approaches 10,000 kPa, the change in the soil sample’s volumetric moisture content decreases, and the absolute value of the curve’s slope decreases.
The Fredlund and Xing model, as shown in Formulas (4) and (5), was used to fit the soil-water characteristic test data; the fitting parameters are shown in Table 2.
θ = C ψ θ s ln e + ψ / a n m
C ψ = 1 ln 1 + ψ / C r ln 1 + 10 6 / C r
where θ (%) is the volumetric moisture content; θ s (%) is the saturated volumetric moisture content; ψ (kPa) is the matrix suction; C ψ is the correction function; C r (kPa) is the residual matrix suction; e is the natural logarithm constant; a, m, and n are model parameters.

3.3. Unsaturated Permeability Test

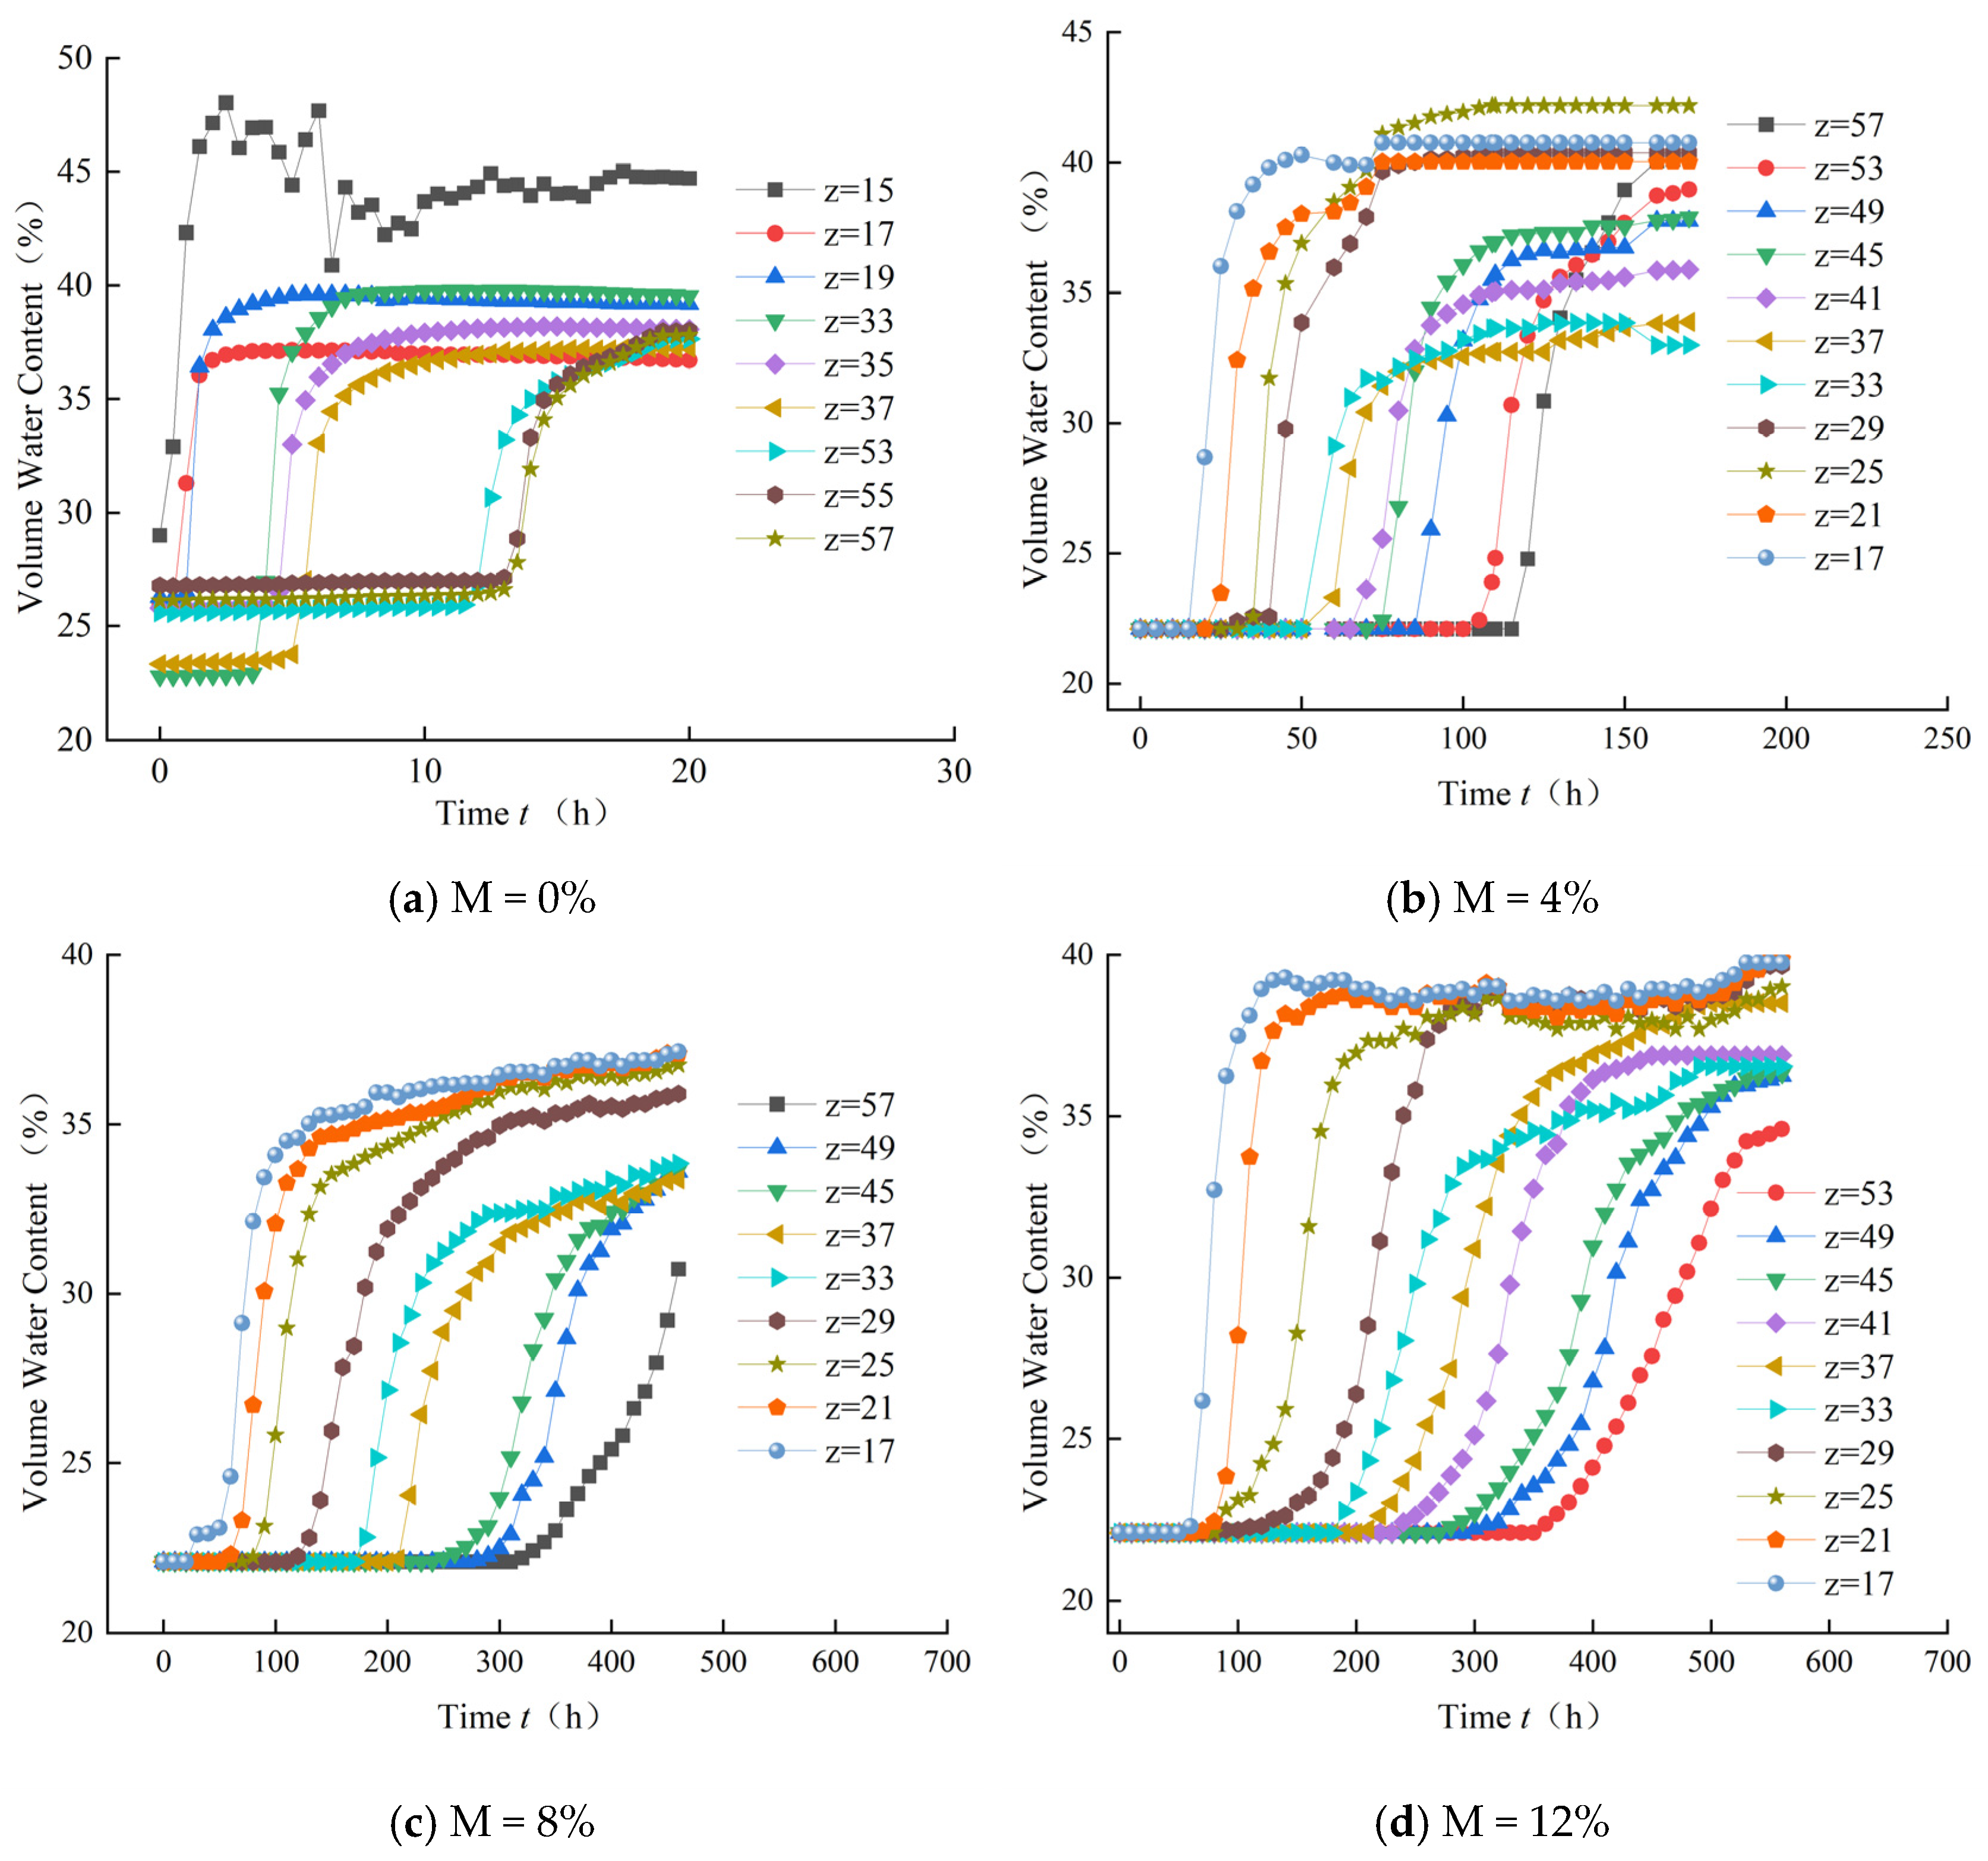
Figure 5 shows the curves of volumetric moisture content over time for modified red-bed mudstone columns at different depths. As shown in Figure 5, during the infiltration process, the volumetric moisture content of the soil layer at a given depth exhibits a phased distribution over time. Before the saturation peak is reached, the volumetric moisture content of the soil remains stable; this is referred to as the initial stabilization phase. When the saturation peak is reached, the volumetric moisture content first increases rapidly with time and then rises slowly until it reaches its maximum value. Meanwhile, the rate of increase in volumetric moisture content is related to soil depth. In shallower soil layers, expansion deformation causes a decrease in dry density, and the number of medium- and large-sized pores within the soil increases, resulting in a greater increase in volumetric water content and higher steady-state volumetric water content. In contrast, soil at greater depths experiences less expansion deformation; its dry density is higher than that of soil at shallower depths, and it contains fewer large pores, leading to a smaller increase in volumetric water content and lower steady-state volumetric water content.
There are marked differences in the spatiotemporal distribution of the volumetric water content in soil columns modified with red-bed mudstone using different montmorillonite bentonite blending ratios. The advance rate of the wetting front gradually decreases as the montmorillonite content increases. For soil layers at the same depth, the higher the montmorillonite content, the longer it takes for the wetting front to reach that area. Additionally, when the wetting front reaches a certain depth, the rate of increase in volumetric water content in that area gradually decreases with increasing montmorillonite content, and the soil requires a longer time to reach saturated volumetric water content. In soil layers where the soil column is buried at a shallow depth, the stable volumetric water content generally increases with increasing montmorillonite content. The primary reason for this is that red-bed mudstone fill materials with a higher montmorillonite content contain more clay minerals, such as montmorillonite, which allows the soil to bind with more water, thereby increasing the volumetric water content.
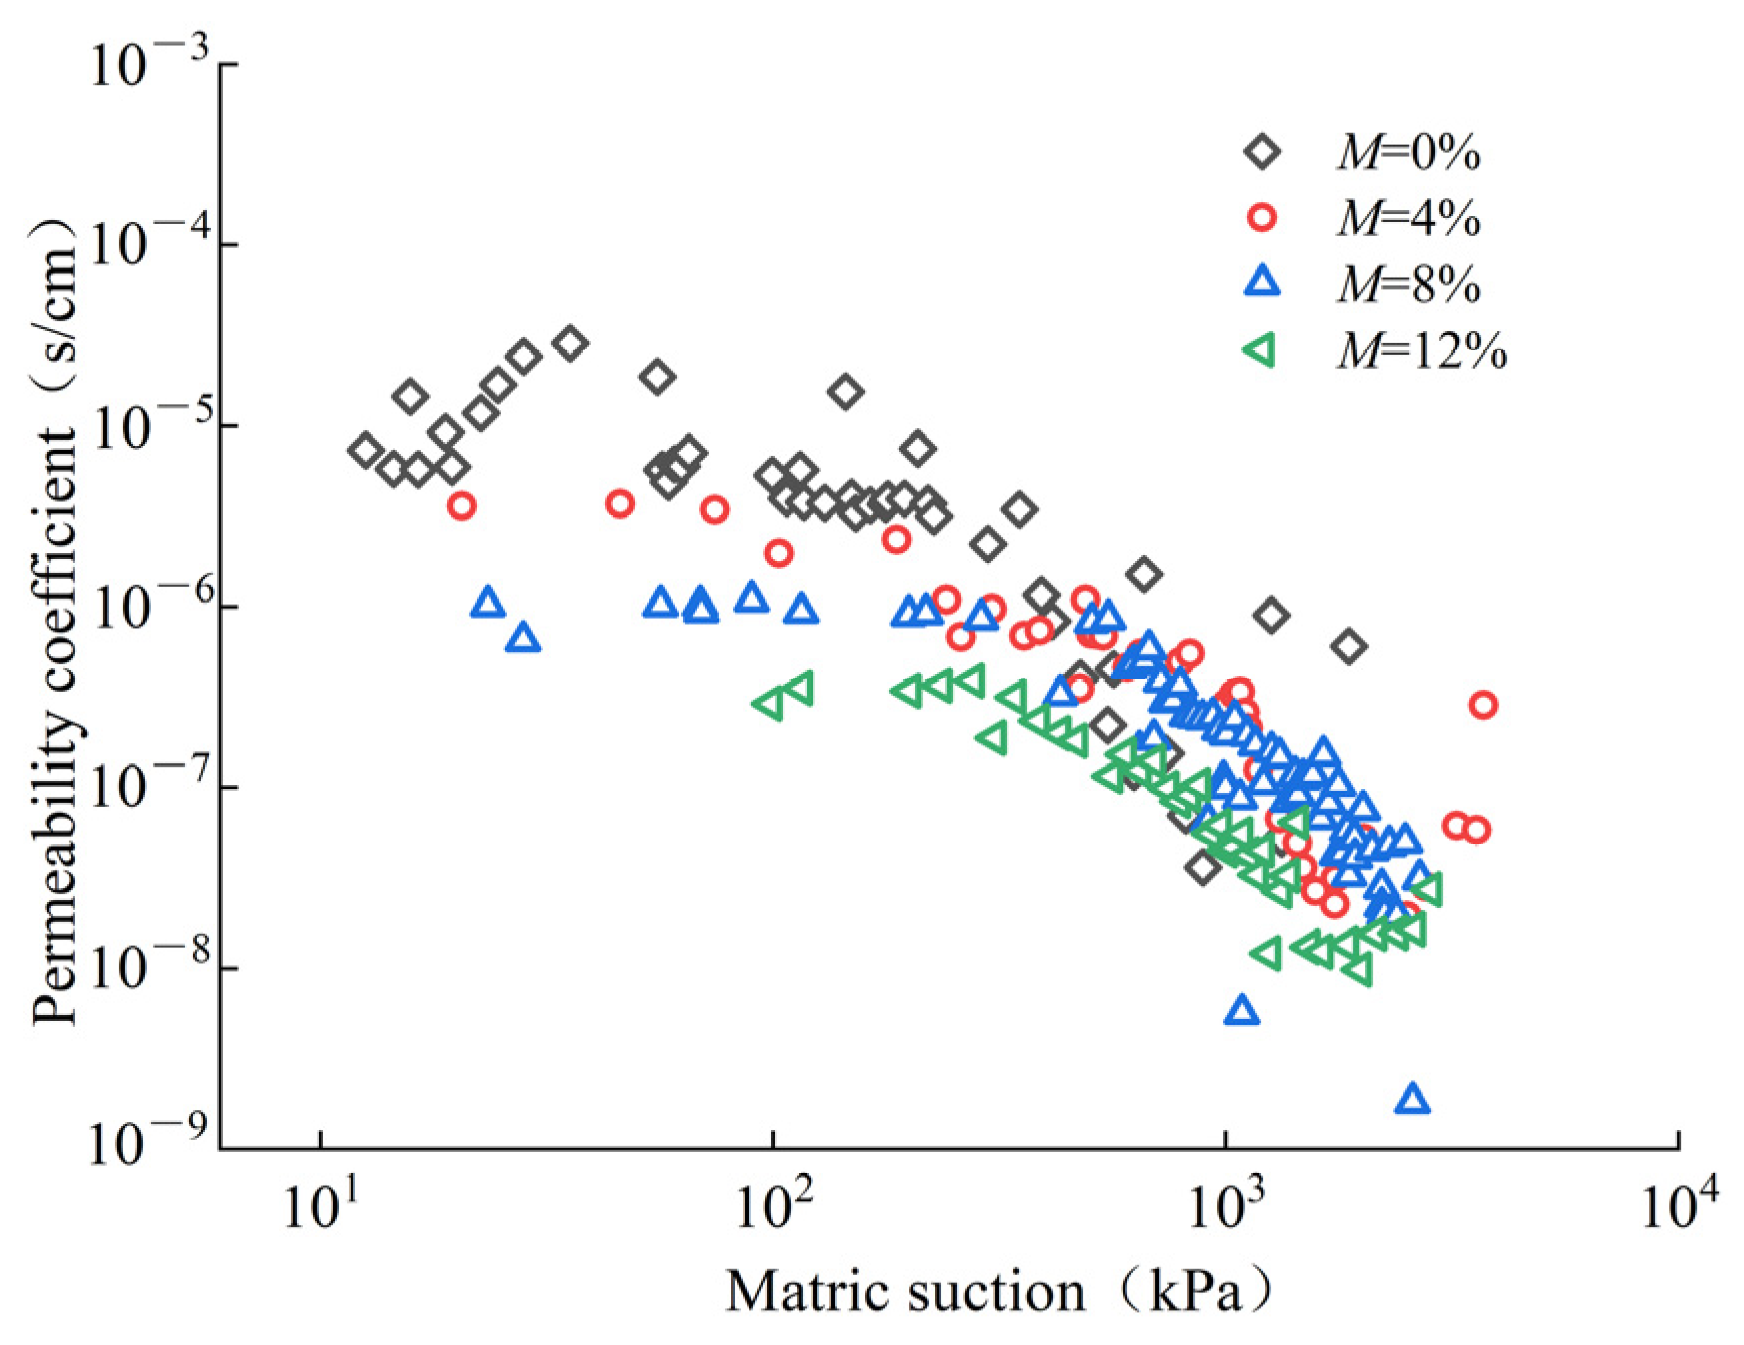
Based on the soil–water characteristic curves measured in Figure 4 and previous research [28], the curve showing how the permeability coefficient of unsaturated soil varies with matrix suction was calculated, as shown in Figure 6.
As shown in Figure 6, the unsaturated permeability coefficients of red-bed mudstone with different montmorillonite-based bentonites decrease as the matrix suction increases, and the rate of change exhibits two distinct phases: a steady decrease and a rapid decrease. When the matrix suction exceeds 300 kPa, the permeability coefficients of red-bed mudstone with different swelling potentials range from 10−6 to 10−9 cm/s, spanning 3 to 4 orders of magnitude, with relatively drastic variations; when the matrix suction is less than 300 kPa, the permeability coefficients all fall within the same order of magnitude, and the variations are relatively gradual.
Overall, at the same matrix suction, modified red-bed mudstone with higher montmorillonite bentonite content generally exhibits lower permeability coefficients. The permeability coefficient of modified red-bed mudstone with 0% montmorillonite bentonite content ranges from 10−8 to 10−5, while that of red-bed mudstone with 4% montmorillonite bentonite content ranges from 10−8 to 10−6; while the permeability coefficients of red-bed mudstone with an 8% content ranged from 10−9 to 10−6, and those with a 12% content ranged from 10−8 to 10−7. At the same time, when the matrix suction is constant, the differences in permeability coefficients among red-bed mudstone fill materials at various blending ratios are primarily evident in the range where matrix suction is less than 241 kPa. The differences in permeability coefficients between soil samples with different blending ratios gradually decrease as matrix suction increases; when matrix suction exceeds 358 kPa, the permeability coefficients of soil samples with different blending ratios become close to or even coincide.

3.4. Nuclear Magnetic Resonance Testing

3.4.1. T2 Atlas and Analysis

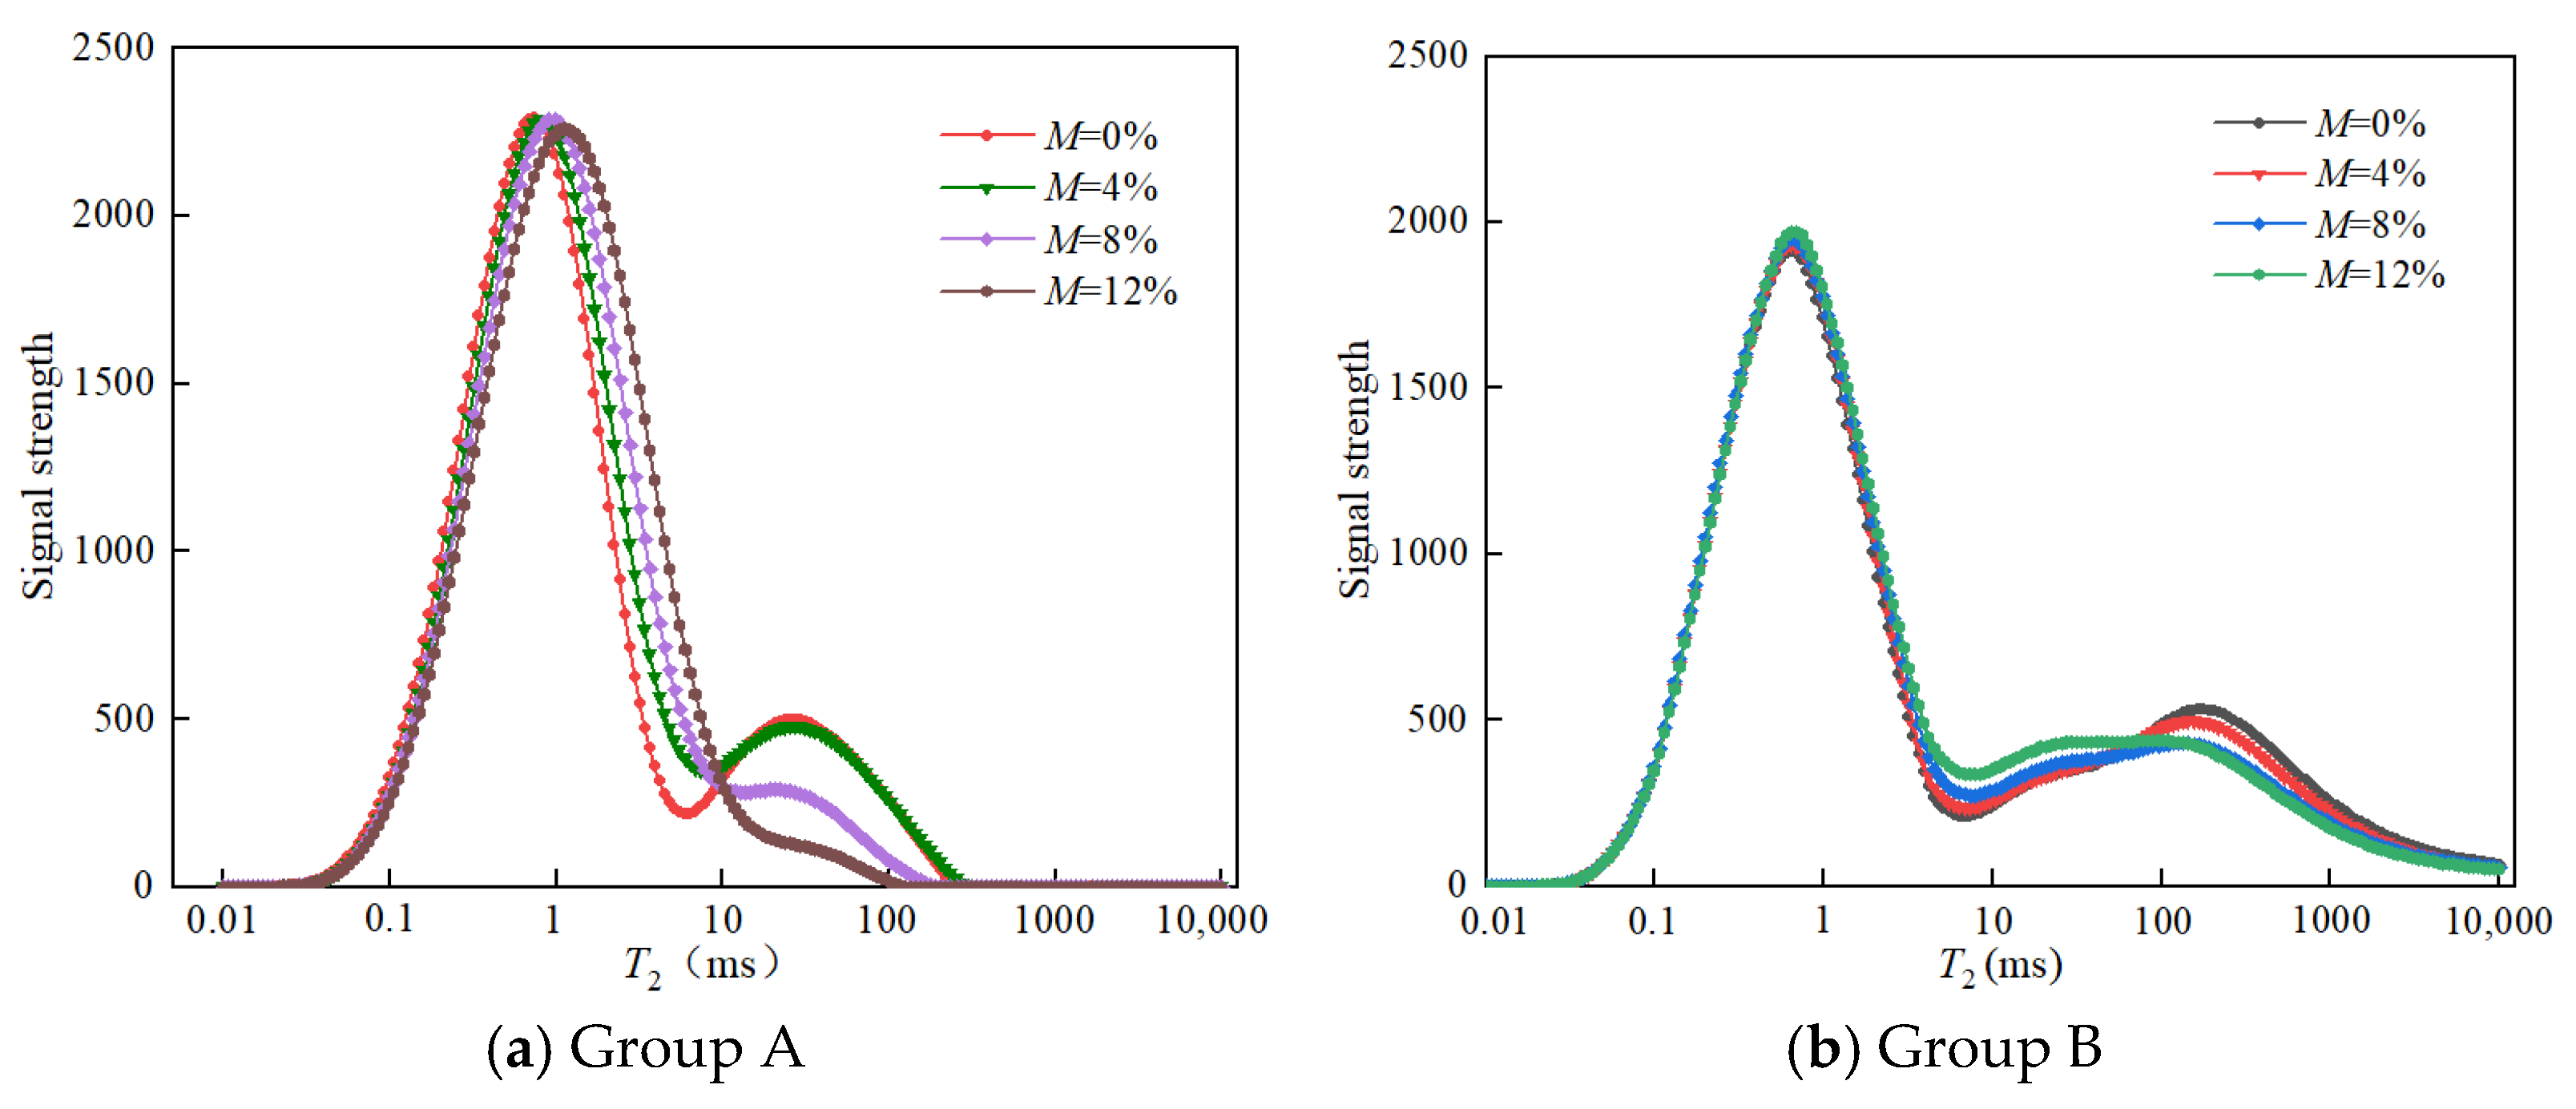
Figure 7a shows the T2 spectra of modified red-bed mudstone following NMR inversion under saturated conditions, while Figure 7b shows the T2 spectra under unsaturated conditions. As shown in Figure 7, the T2 spectra of all samples exhibit a distinct bimodal distribution. As the montmorillonite bentonite content increases, the pore size of the samples evolves toward smaller values; the areas of both micro- and mesopores increase with increasing content, which is reflected in the T2 spectra by a gradual increase in the peak value of the first peak, while the peak value of the second peak gradually decreases. Furthermore, the signal intensity to the right of the second peak decreases, while that to the left increases. Compared to the unsaturated state, the T2 spectra of the saturated modified red-bed mudstone show an increase in both the area and peak signal of the first peak, while the area of the second peak decreases. The peak signal of the second peak shifts to the left and narrows, moving from the meso- and macropore range in the unsaturated state to the micropore range.
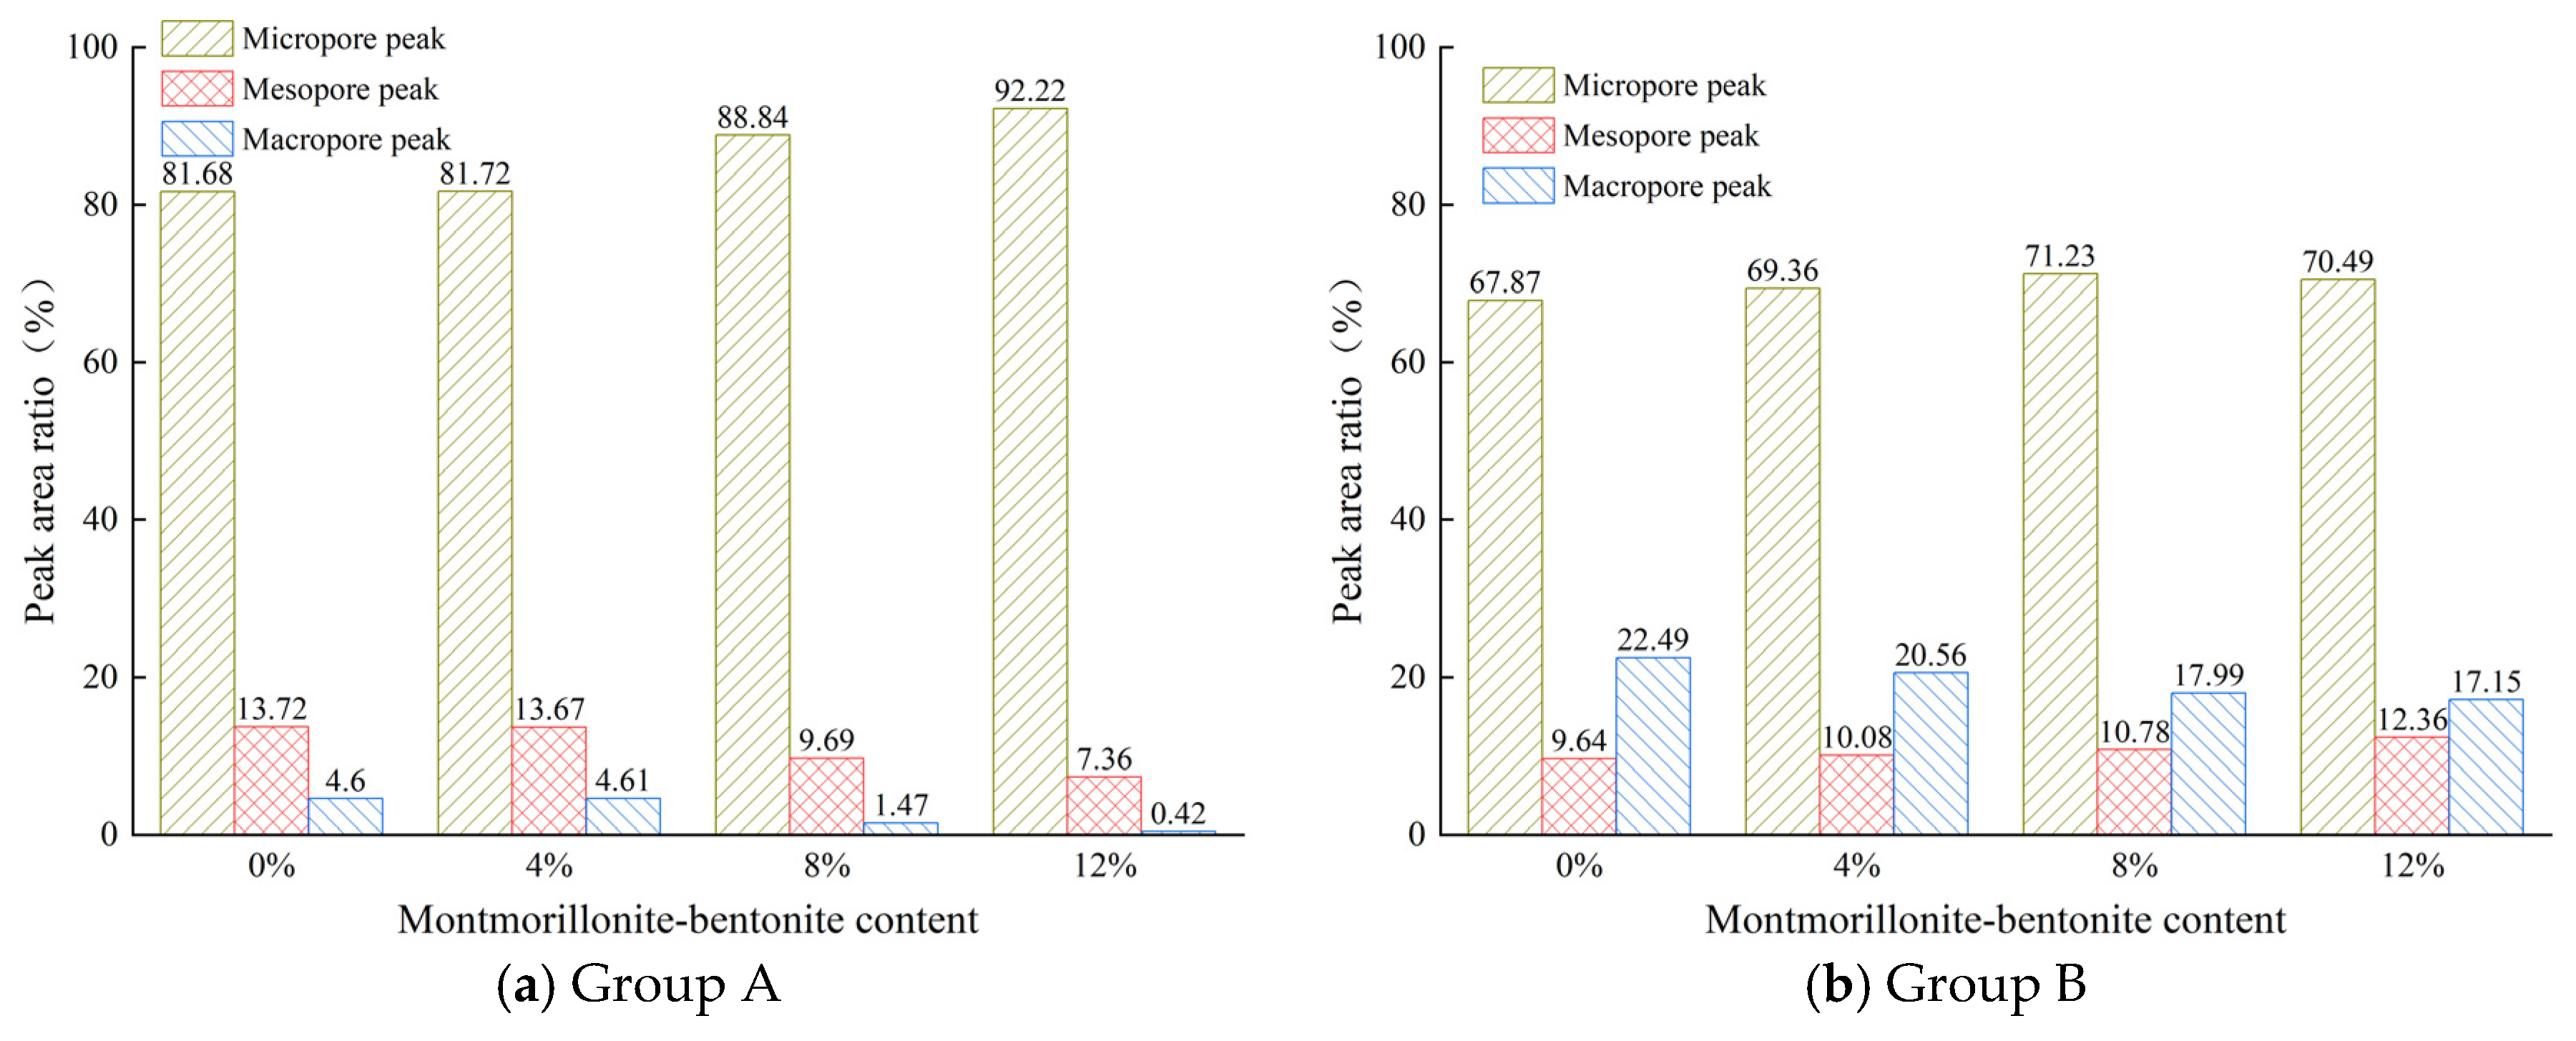
Pores were classified by pore size into micropores (T2 ≤ 6 ms), mesopores (6 ms < T2 ≤ 55 ms), and macropores (T2 ˃ 55 ms) [29]. The area distributions of the pore size spectra were calculated, as shown in Table 3. To provide a more intuitive representation of the pore structure characteristics, the percentage of the pore peak area for each sample was compiled, as shown in Figure 8.
As shown in Figure 8a, the saturated modified red-bed mudstone consists primarily of micropores. As the montmorillonite-based bentonite content increases, the proportion of micropore peak area gradually rises from 81.68% to 92.22%, while the proportions of mesopore and macropore peak areas both decrease continuously, falling from 13.72% and 4.6% to 7.36% and 0.42%, respectively. As shown in Figure 8b, the unsaturated modified red-bed mudstone is also dominated by micropores; however, the peak area of micropores does not change markedly with increasing montmorillonite-based bentonite content, and the percentage of peak area attributed to micropores at a 12% blend is slightly lower than that at an 8% blend. The proportion of the mesopore peak area gradually increased from 9.64% to 12.36%, and the proportion of the macropore peak area decreased from 22.49% to 17.15%. Comparing Figure 8a and Figure 8b, the proportion of micropore area in the saturated state is greater than that in the unsaturated state in all cases, with differences of 13.81%, 12.36%, 16.61%, and 21.73%, respectively; the magnitude of these differences increases with the increase in montmorillonite-based bentonite content; the differences in the proportion of the macropores peak area were −17.89%, −15.95%, −16.52%, and −16.73%, respectively, with the differences in area remaining relatively stable as the content increased. These results collectively indicate that the water absorption of the modified red-bed mudstone and the addition of montmorillonite bentonite markedly alter its pore structure characteristics. This is primarily due to the expansion of clay minerals combined with the mudification of the red-bed mudstone, which fills the pores, leading to a substantial reduction in the number of large pores. The internal space is compressed and filled, resulting in the formation of more medium- and micro-pores.

3.4.2. NMR Fractal Characteristics

The formula for the pore fractal dimension calculated using nuclear magnetic resonance (NMR) experiments [30,31] is
L g S V = 3 D L g T 2 + D 3 L g T 2 , max
where S V represents the cumulative pore volume determined from the NMR test; T 2 , max represents the maximum transverse relaxation time.
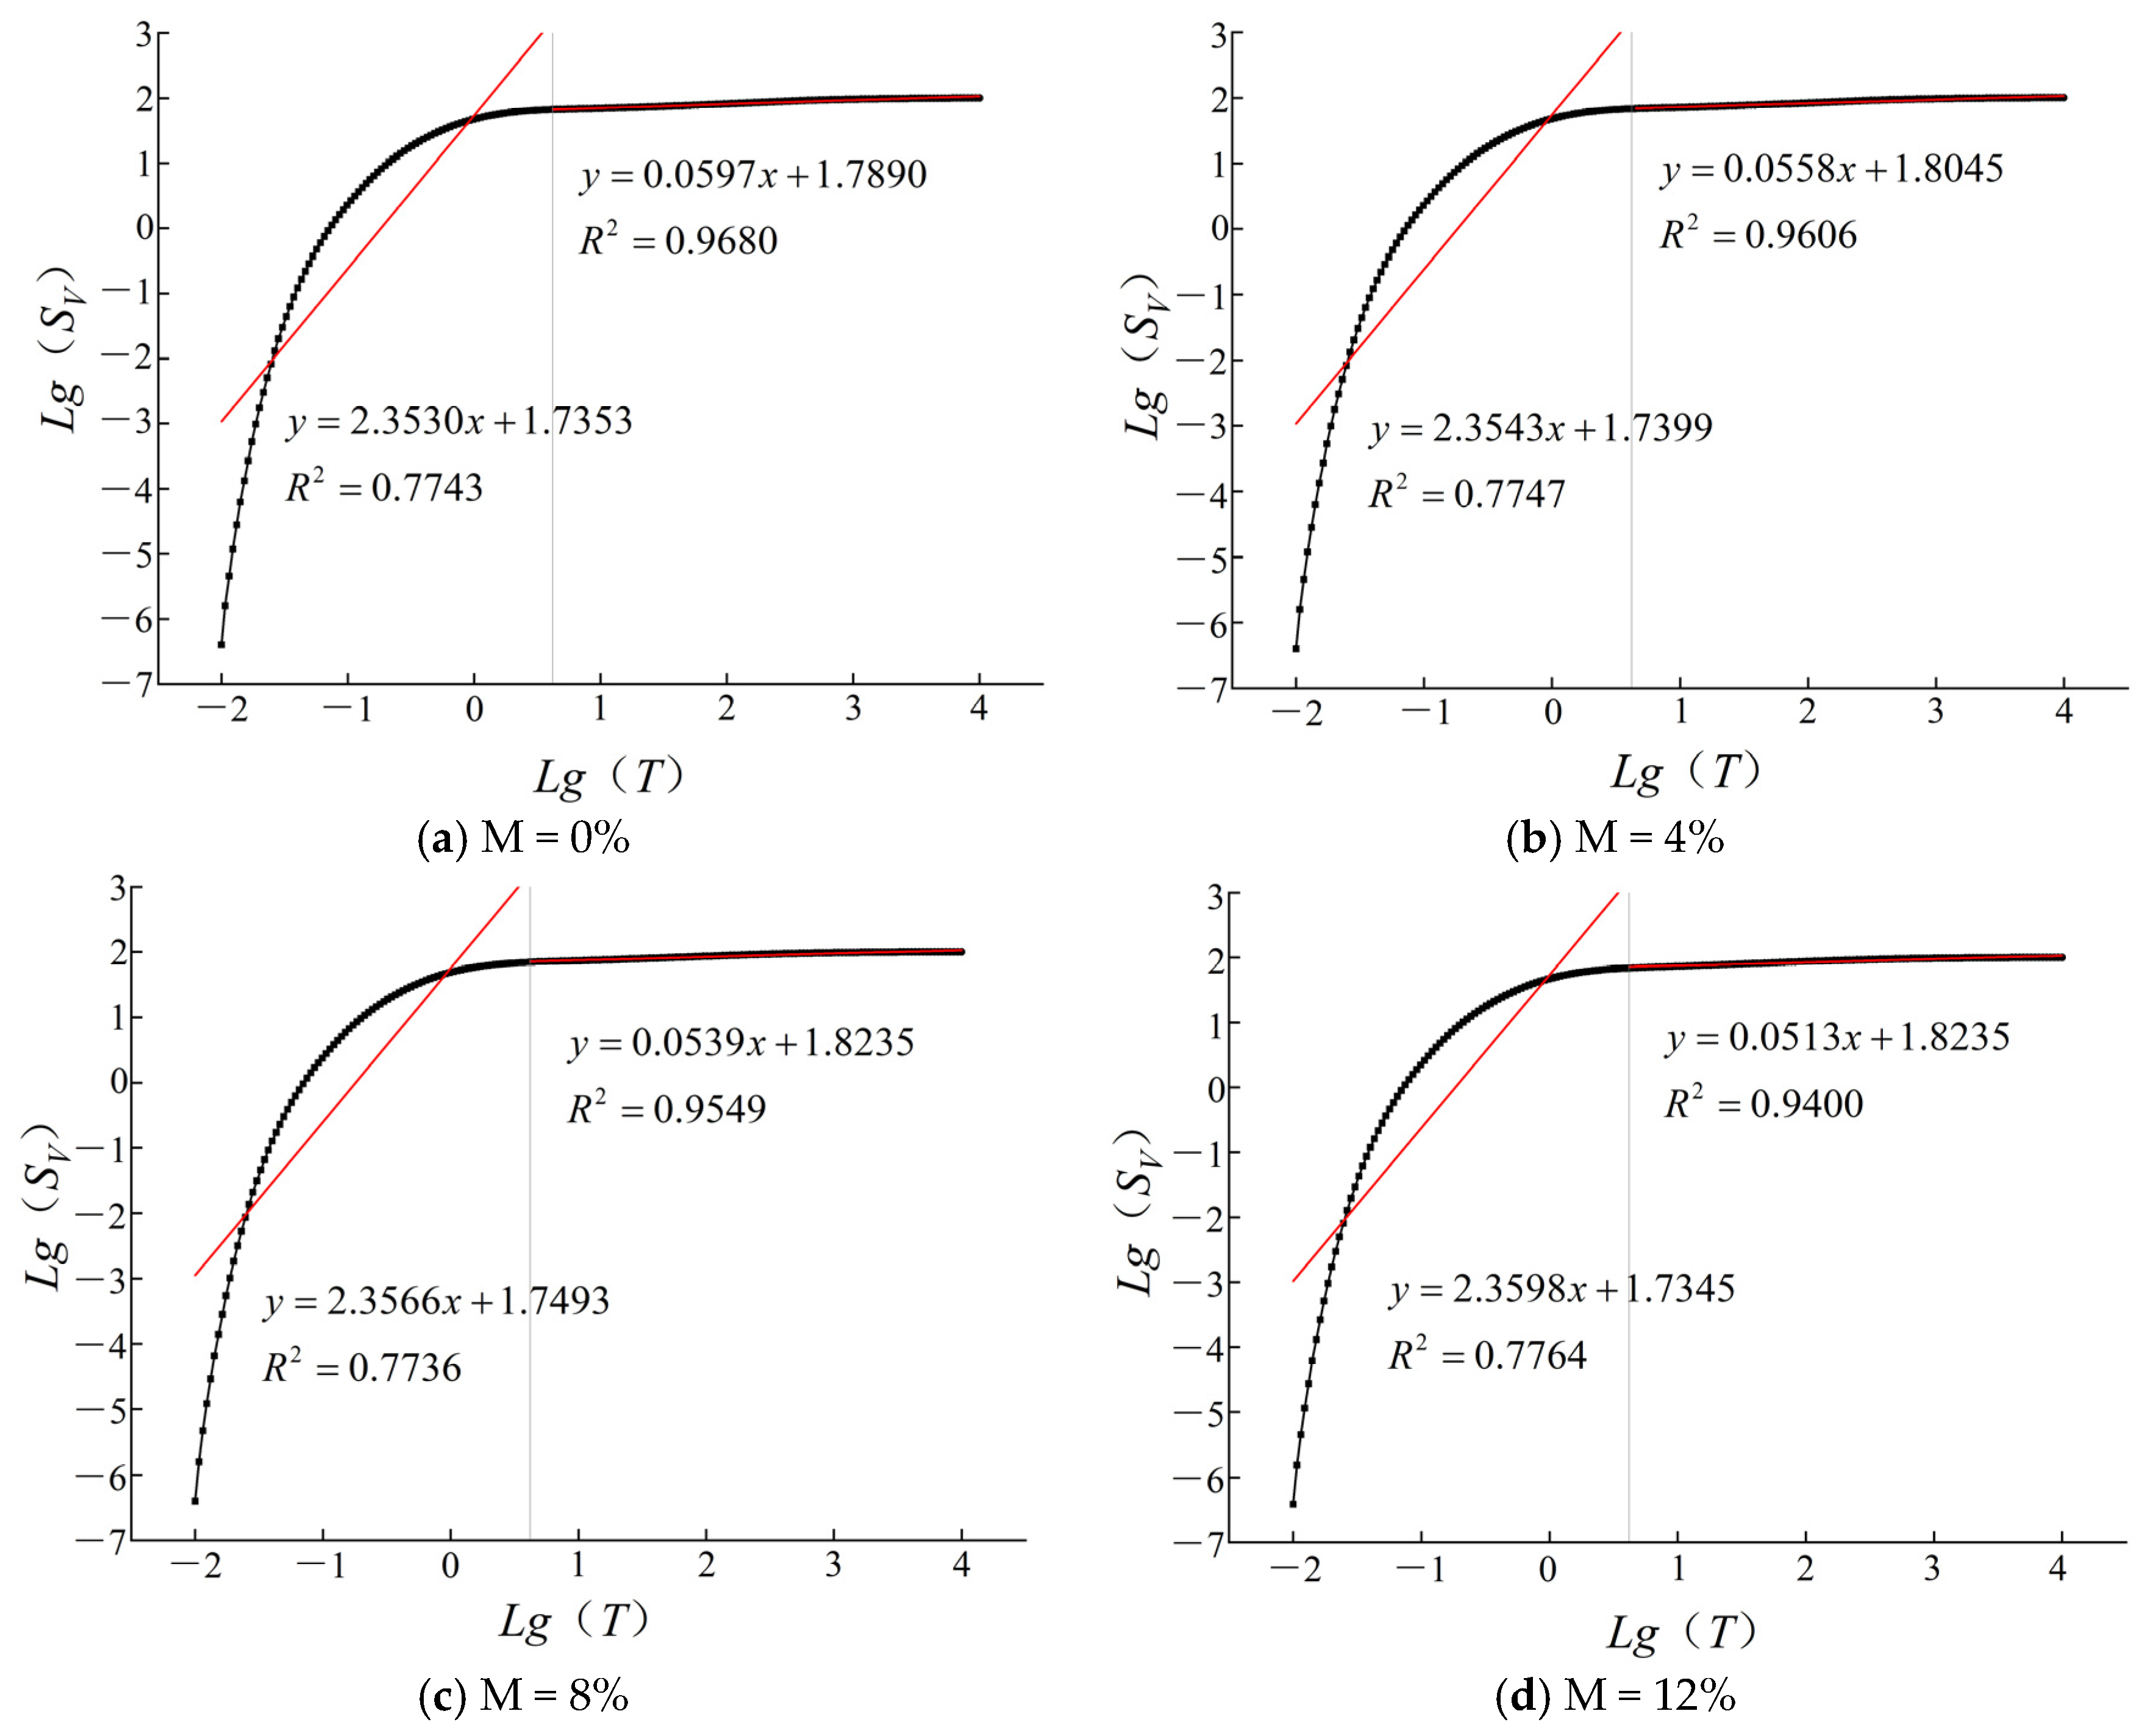
By fitting the NMR test data L g S V and L g T 2 , the slope of the resulting straight line equals the fractal dimension; the fitted curve is shown in Figure 9.
As shown in Figure 9, the fractal curves of the modified red-bed mudstone with different montmorillonite bentonite content are not straight lines but exhibit distinct inflection points, indicating that the fractal dimension of the modified red-bed mudstone characterized by the NMR fractal model is not a constant. By performing a two-segment linear fit on the fractal curve, we obtained the fractal dimension D1 representing the smaller pore structure and the fractal dimension D2 representing the larger pore structure; the inflection point represents the effective pore cutoff value of the T2 spectrum, as shown in Figure 9 and Table 4. As shown in Table 4, the fractal dimensions of the pore structures vary only slightly: D1 for the smaller pores ranges from 0.64 to 0.65, while D2 for the larger pores ranges from 2.94 to 2.95. The fractal dimension of the larger pore structure is close to 3 and is greater than that of the smaller pore structure. This indicates that the microscopic pore structure characteristics of the small and large pores in the modified red-bed mudstone exhibit distinct anisotropic fractal features.

4. Fractal Permeability Coefficient Prediction Model Based on Pore Distribution

4.1. Predictive Model Development

For soil that follows fractal behavior, the relationship between number N ( r ) and radius r can be expressed as [32],
N ( r ) = r max r D
where N is the cumulative number of pores with radii greater than or equal to r ; r max is the maximum pore radius; and D is the pore size fractal dimension.
Differentiating Formula (7) with respect to r :
d N ( r ) = D r max D r ( D + 1 ) d r
Formula (8) provides the number of pores with radii between r and r + 1 , where d N > 0 indicates that the number of pores decreases as the pore radius increases. Water flow in a curved capillary can be described by the modified Hagen–Poiseuille equation [33,34],
q = r 4 π 8 g ν Δ H L e
where q is the water flow velocity in a single capillary; r and L e are the radius and length of the capillary, respectively; v is the kinematic viscosity of the fluid; Δ H is the head difference; ρ w is the density of water; g is the acceleration due to gravity.
The total water flow velocity in the capillary can be obtained by integrating the water flow velocity in a single capillary from the minimum pore radius to the maximum pore radius,
Q = r min r max q d N = π g 8 ν Δ H L e D 4 D r max 4 1 r min r max 4 D
Since the exponent is 1 < D < 2 . In seepage channels, large pores make a dominant contribution to permeability, while the contribution of small pores is negligible; that is, rmin is negligible relative to rmax. NMR tests show that r min / r max of the modified red-bed mudstone filler are 0.0016, 0.0018, 0.0021, and 0.0034, respectively, when the montmorillonite bentonite content is 0%, 4%, 8%, and 12%. Therefore, r min / r max < 10 2 , and consequently ( r min / r max ) 4 D 1 . In this case, Formula (10) can be simplified to
Q = π g 8 ν Δ H L e D 4 D r max 4
The average flow velocity J a m/s in the capillary can be obtained by dividing the total water flow velocity in the capillary by the total pore volume A p m 2 :
J a = π g 8 ν A p Δ H L e D 4 D r max 4
In Formula (12), the total pore volume can be expressed as [35]
A p = r min r max π r 2 ( d N ) = π D ( 1 n ) r max 2 2 D
where n is the porosity.
Substituting Formula (13) into Formula (12) yields:
J a = g 8 ν Δ H L e 2 D 4 D r max 2 1 n
The Darcy velocity J T can be determined using the Dupuit-Forchheimer equation:
J T = n J a = g 8 ν Δ H L e n 1 n 2 D 4 D r max 2
where τ is the tortuosity, defined as
τ = L e L
where L is the length of the column.
Comparing Formula (15) with Darcy’s law yields ( J T = k Δ H / L ) the following expression for the permeability coefficient:
k = 1 τ g 8 υ n 1 n 2 D 4 D r max 2
where k is the permeability coefficient.
For a straight pipe, τ = 1 , Formula (17) can be simplified to
k = g 8 ν n 1 n 2 D 4 D r max 2
From Formula (18), it can be seen that for a given soil sample, the permeability coefficient is related to the maximum pore diameter, pore diameter fractal dimension, porosity, and tortuosity. Among these parameters, the maximum pore diameter has the greatest influence on the permeability coefficient. These parameters reflect the pore structure characteristics of the soil, and each parameter has a clear physical meaning.
When the suction is 0, the saturated permeability coefficient can be expressed as
k s ψ = 0 = g 8 ν n 1 n 2 D 4 D r 2 ψ = 0
When the suction is ψ , the permeability coefficient of unsaturated soil is
k ψ = g 8 ν n ψ 1 n ψ 2 D ψ 4 D ψ r 2 ψ
The relative permeability coefficient can be expressed as
K ψ = n ψ n ψ = 0 1 n ψ = 0 1 n ψ 2 D ψ 4 D ψ 4 D ψ = 0 2 D ψ = 0 r ψ r ψ = 0 2
The permeability coefficient of unsaturated soil can be expressed as:
k ψ = K ψ k s = n ψ n ψ = 0 1 n ψ = 0 1 n ψ 2 D ψ 4 D ψ 4 D ψ = 0 2 D ψ = 0 r ψ r ψ = 0 2 k s

4.2. Model Validation

Based on Formulas (19)–(22), it can be seen that by determining the pore structure parameters from NMR tests on modified red-bed mudstone, it is possible to predict the fractal permeability coefficient based on pore distribution.
Based on the aforementioned analysis of NMR classification characteristics, D1 represents the fractal dimension of the smaller pore structure, i.e., the fractal dimension of the bound pore structure in the soil; D2 represents the fractal dimension of the larger pore structure, i.e., the free fluid pore structure in the soil. Considering that larger pores contribute more markedly ly to permeability and have a notable impact on permeability, D2 is adopted as the three-dimensional fractal dimension of the specimen. In Formula (7), represents the two-dimensional pore size fractal dimension. According to Reference [36], the difference between the two-dimensional and three-dimensional fractal dimensions is 1. Therefore, D = D 2 1 is used in the calculations.
The saturated permeability coefficients of the soil were calculated using Formula (19) and compared with those measured in the variable-head test, as shown in Table 5 and Figure 10. It can be seen that the predicted and measured values for the modified red-bed mudstone both decrease as the montmorillonite bentonite admixture content increases. In terms of predicting the saturated permeability coefficient, the prediction error was greatest for undisturbed red-bed mudstone; as the montmorillonite bentonite content increased, the relative error between the predicted and measured permeability coefficients gradually decreased. There may be two reasons for the relatively large error when the montmorillonite bentonite content is 0%. First, the sample with 0% content consists of red-bed mudstone, whose physicochemical properties differ significantly from those of the modified red-bed mudstone filler; these differences may not be fully captured by the feature variables in the current model; On the other hand, the permeability coefficient itself spans multiple orders of magnitude, and even minor differences in pore structure parameters can lead to errors in the predicted permeability coefficient on the order of magnitude. However, when viewed in terms of the logarithm of the permeability coefficient, the relative error in this prediction indicates that the discrepancy between the predicted and measured values remains within an explainable range.
Next, calculate the unsaturated permeability coefficient of the soil. For the sake of convenience, assume that n ψ n ψ = 0 and D ψ D ψ = 0 , and simplify Formulas (21) and (22) to obtain
K ψ = r ψ r ψ = 0 2
k ψ = K ψ k s = r ψ r ψ = 0 2 k s
In an unsaturated state, r ψ represents the maximum radius of water-filled pores that can retain water at the current suction pressure, and is determined by the Young–Laplace equation:
r ψ = 2 σ cos θ ψ   ψ > 0
In the equation, σ is the surface tension, taken as σ = 0.072   N/m ; θ is the contact angle, taken as θ = 0 ° ( cos θ = 1 ).
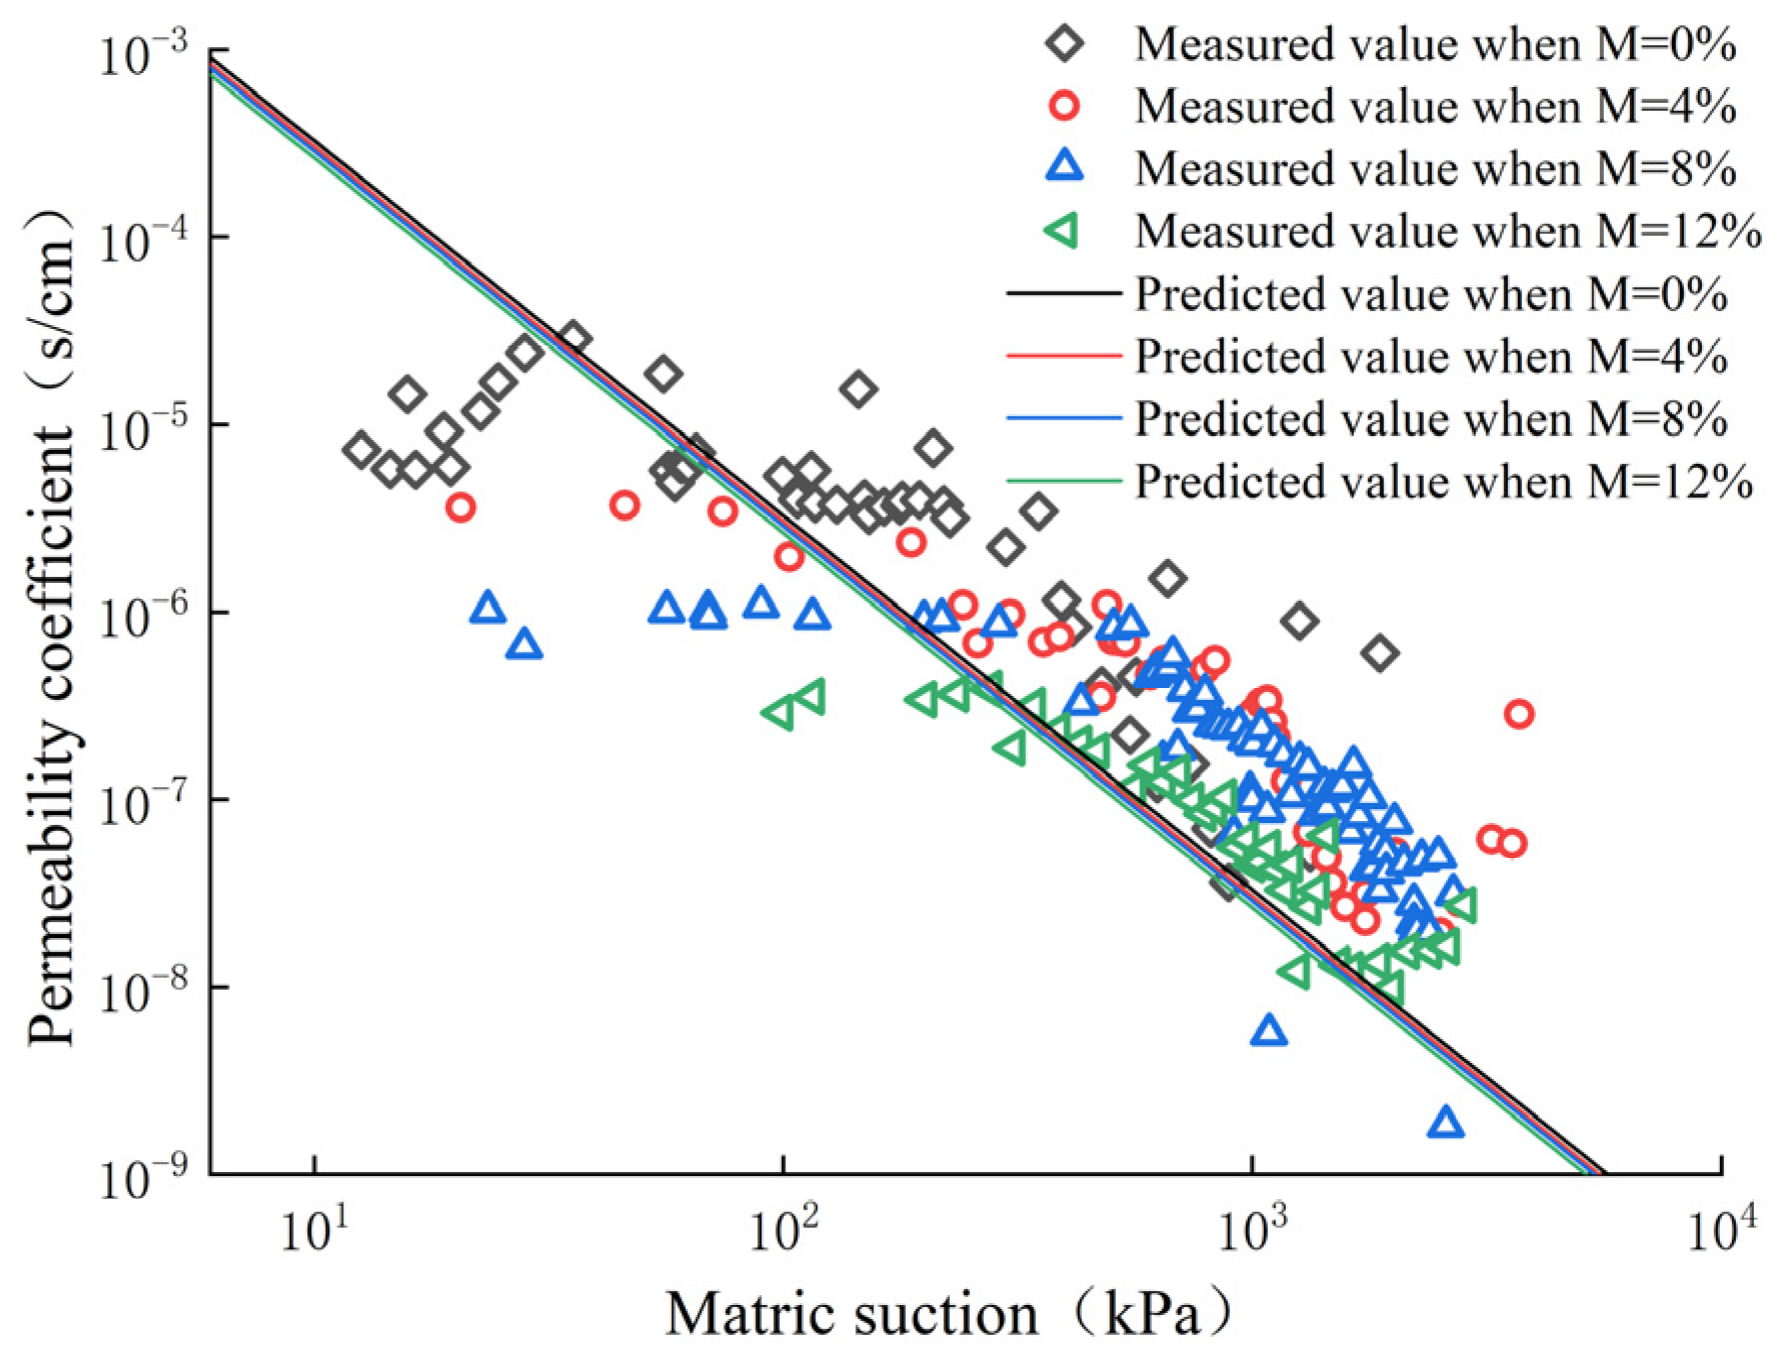
Substitute the values of r ψ = 0 and k s calculated from Figure 7b into Formula (24) to calculate k ψ for different suction pressures, and compare the predicted values with the measured values obtained from the unsaturated permeability test, as shown in Figure 11.
As shown in Figure 11, the predicted values of the unsaturated permeability coefficient for the modified red-bed mudstone are generally close to the measured values. The predicted values decrease as the matrix suction increases, approximating a straight line, but show little variation with changes in the montmorillonite bentonite content. This can be explained in two ways. First, the expression for predicting the unsaturated permeability coefficient using Formula (24) simplifies to
k ψ = a ψ 2
where a is related to the saturated permeability coefficient and the surface tension of water.
The value of a calculated for different montmorillonite bentonite contents is a constant and varies very little. Therefore, the unsaturated permeability coefficient of the modified red-bed mudstone is solely a function of the matrix suction, and it exhibits a linear trend in the range of 10–104 kPa on a double-logarithmic coordinate system. Second, nuclear magnetic resonance (NMR) testing indirectly characterizes the pore properties of a porous medium by measuring the water content, but the predictive model does not account for the effects of capillary water and adsorbed water.

4.3. Sensitivity Analysis

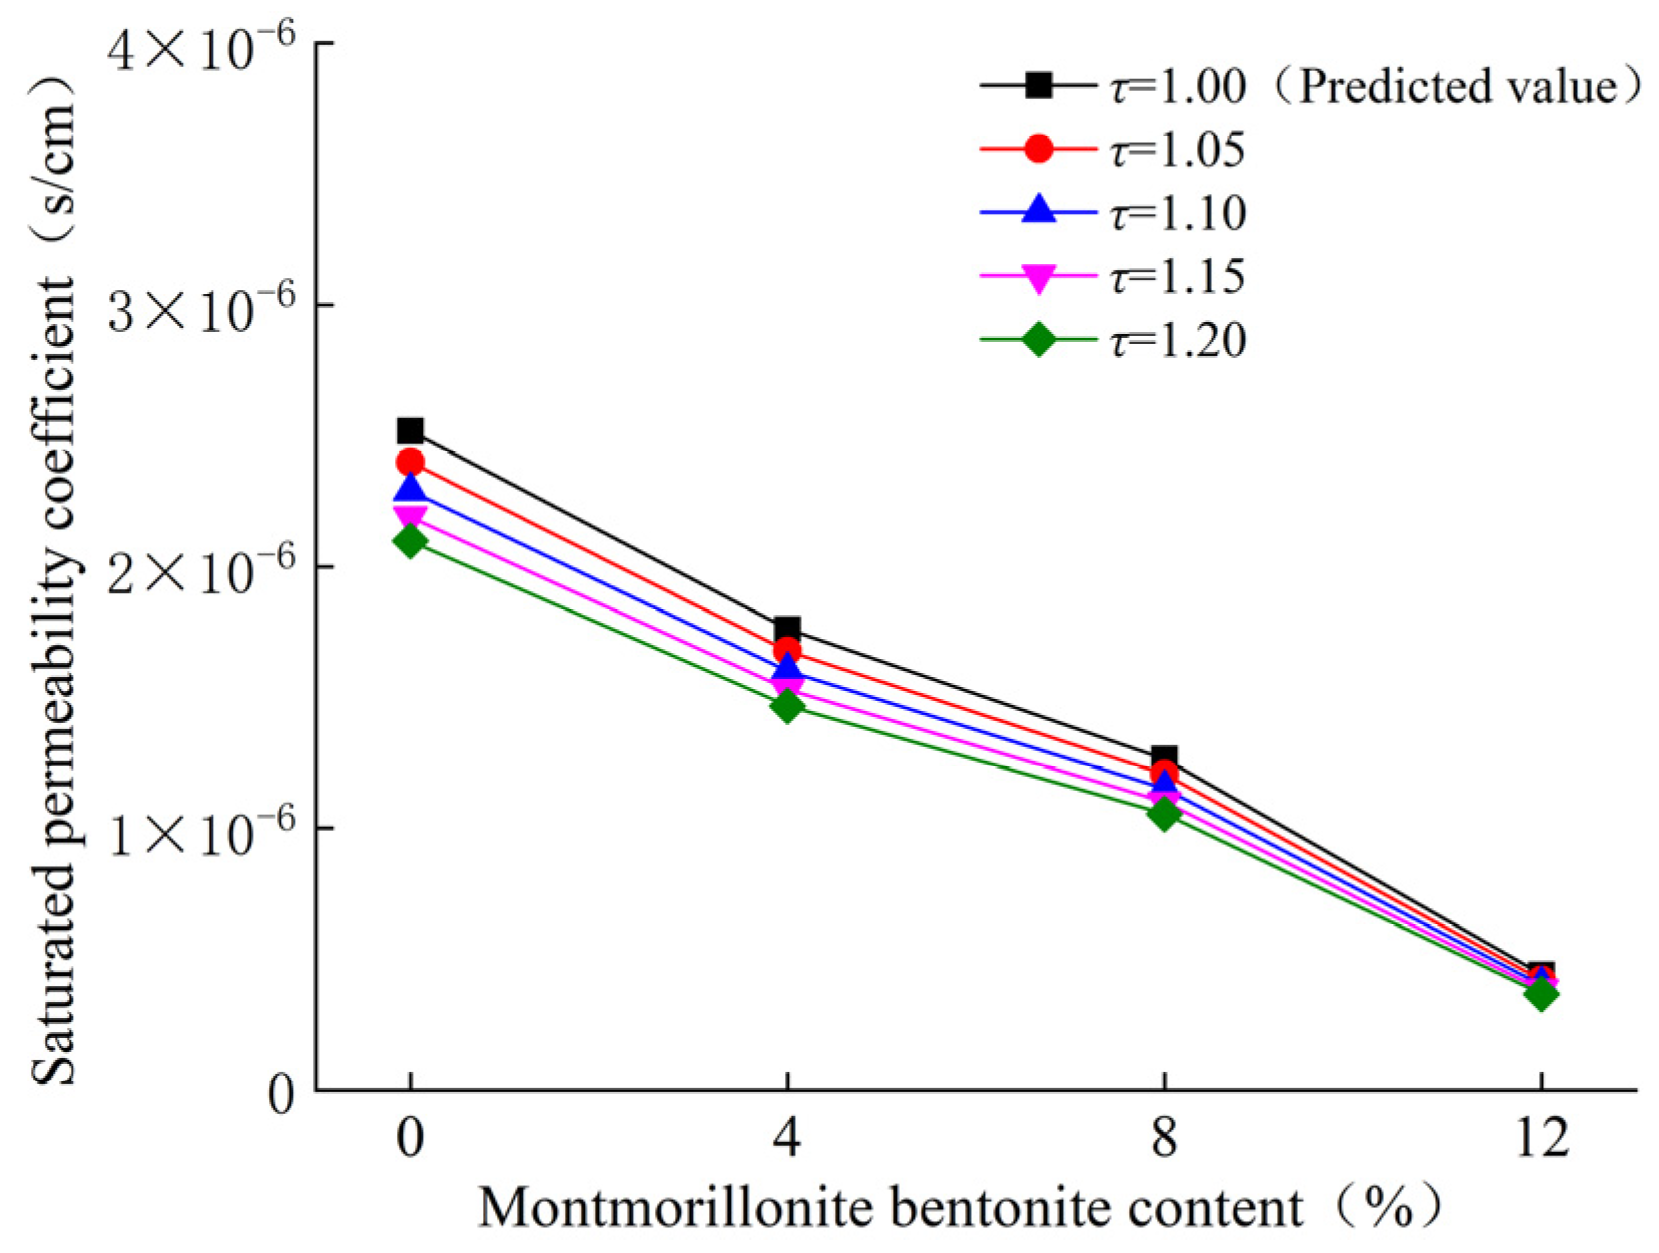
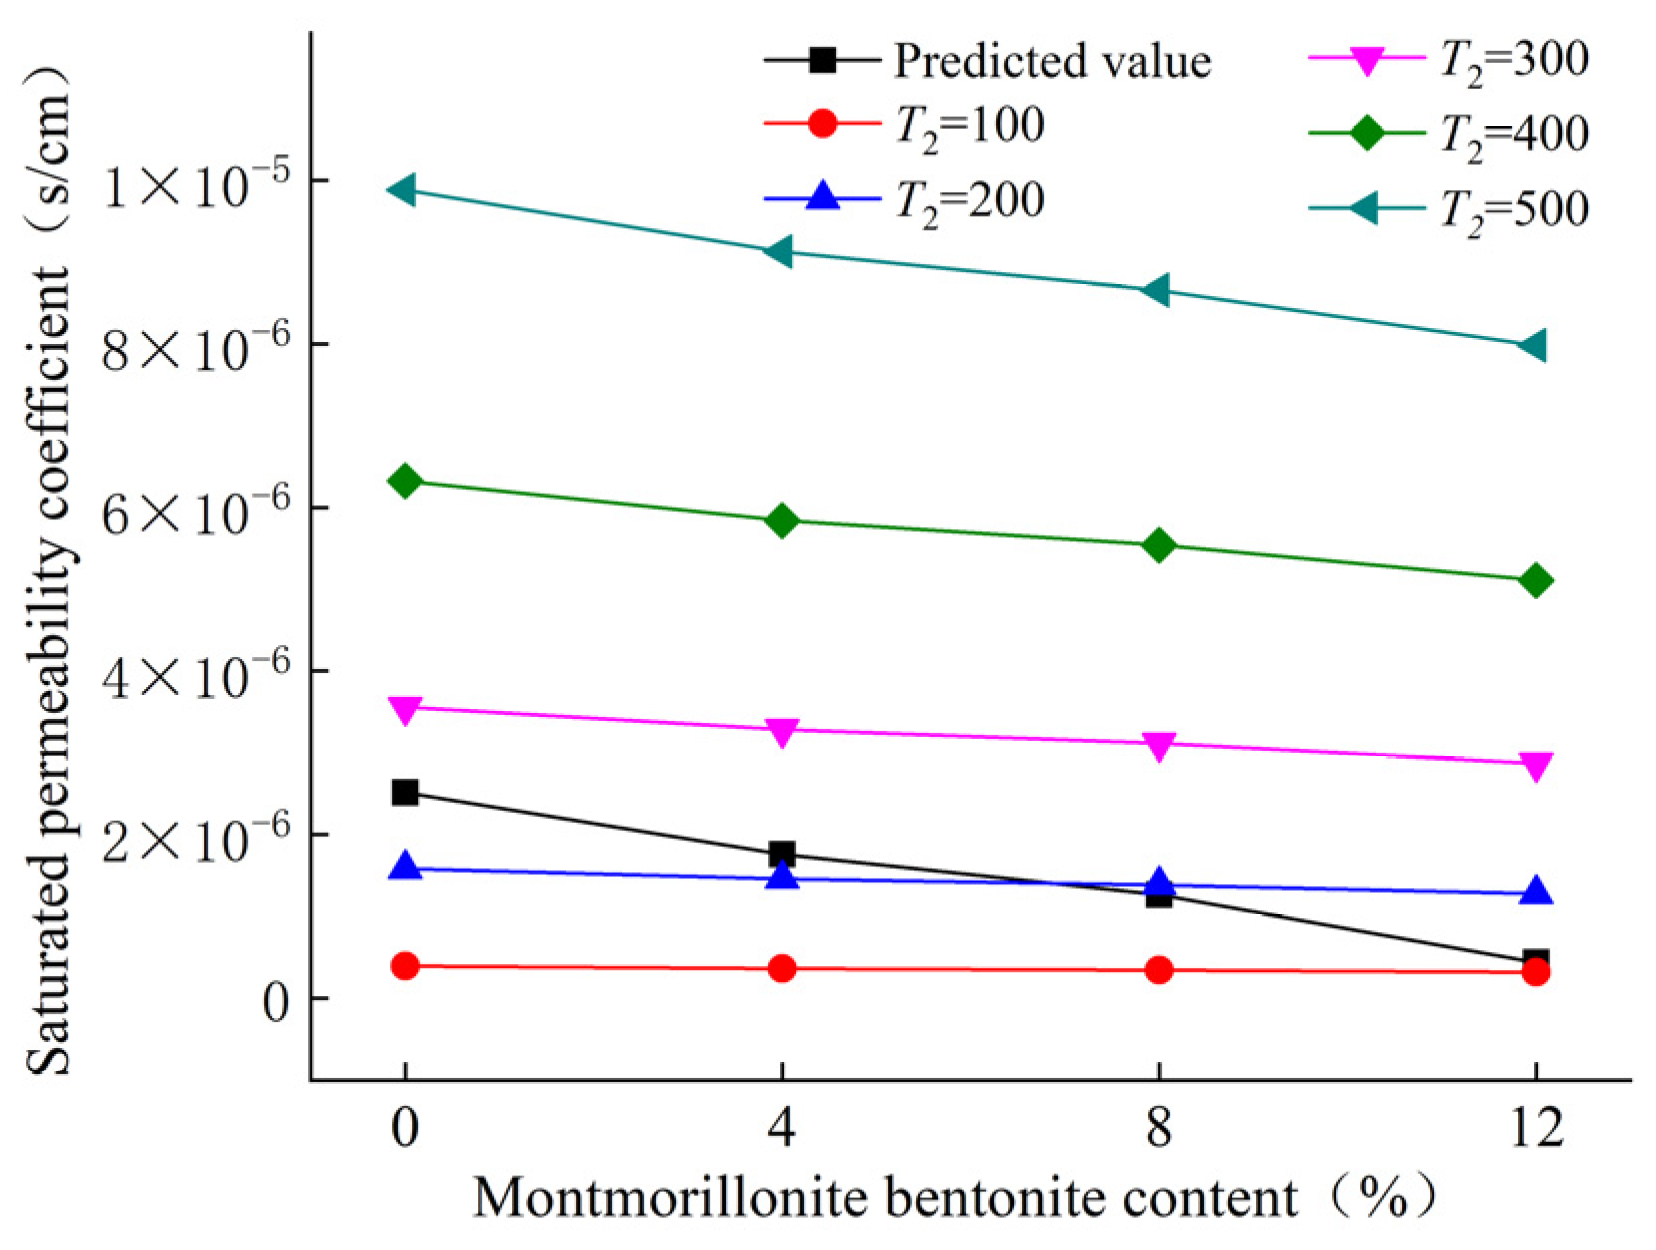
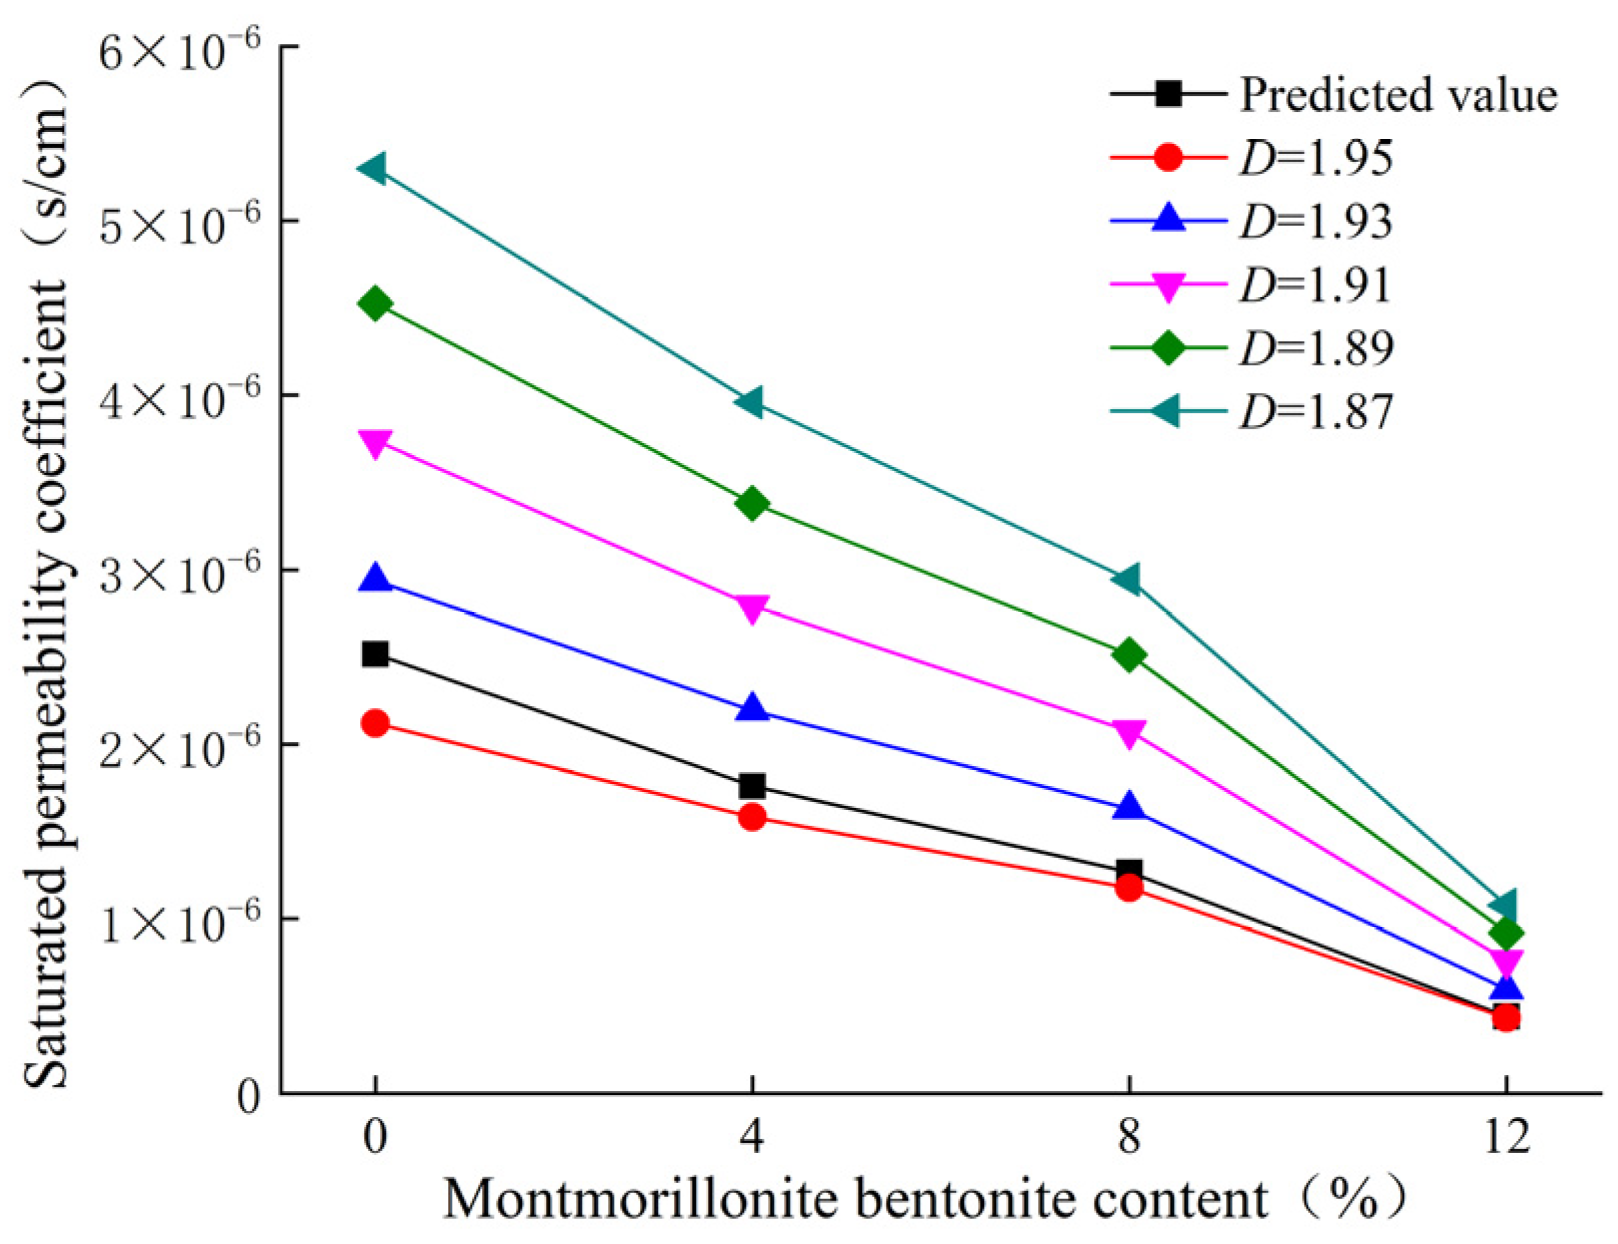
As can be seen from Formula (24), the unsaturated permeability coefficient in the predictive model depends primarily on the saturated permeability coefficient and surface tension. Therefore, a sensitivity analysis was conducted on the modified red-bed mudstone to quantitatively assess the extent to which factors such as maximum pore radius, fractal dimension, and tortuosity influence the saturated permeability coefficient, as shown in Figure 12, Figure 13 and Figure 14.
The maximum pore radius is an important parameter reflecting pore characteristics. Here, five values of maximum pore radius (1 μm, 10 μm, 15 μm, 20 μm, and 25 μm) were used to determine the variation in the saturated permeability coefficient using Formula (19). Figure 12 shows that the maximum pore radius has a marked effect on the saturated permeability coefficient. For the same montmorillonite bentonite content, the saturated permeability coefficient of the modified red-bed mudstone decreases as the maximum pore radius decreases. Furthermore, as the maximum pore radius gradually decreased from 25 μm to 20 μm, 15 μm, 10 μm, and 1 μm, the saturated permeability coefficient of the filler at each montmorillonite content decreased progressively by 33%, 41%, 54%, and 74%, respectively, with the rate of decrease increasing. This can be explained by the influence of pore characteristics, as reflected by the maximum pore radius, on permeability properties. A decrease in the maximum pore radius implies a reduction in the number of large pores and an increase in the number of small pores; small pores form complex flow paths that are elongated, leading to a decrease in the permeability coefficient. Therefore, the smaller the maximum pore radius, the lower the permeability coefficient.
The pore fractal dimension D reflects the complexity and irregularity of the pore space. As shown in Figure 13, the saturated permeability coefficient of the modified red-bed mudstone gradually decreases with increasing fractal dimension. Furthermore, the predicted fractal dimensions of the modified red-bed mudstone varied depending on the montmorillonite bentonite content. When the fractal dimension increased from 1.87 to 1.95, the saturated permeability coefficient decreased by approximately 64.17% at a montmorillonite bentonite content of 12%, whereas it decreased by approximately 60.04% at other content levels. This is because the larger the fractal dimension of the soil pores, the greater the complexity of the pore structure and the poorer the pore connectivity.
The tortuosity reflects the irregularity of the pore channels and is primarily distributed between 1.00 and 1.20 [37]. Figure 14 shows that the saturated permeability coefficient gradually decreases with increasing tortuosity. Furthermore, as tortuosity gradually increased from 1.00 to 1.05, 1.10, 1.15, and 1.20, the saturated permeability coefficients of the fillers at each admixture level increased progressively by 4.76%, 4.55%, 4.35%, and 4.17%, respectively, with the rate of increase gradually decreasing. This indicates that an increase in the irregularity of the pore channels leads to a decrease in the permeability coefficient, but the extent of this effect gradually diminishes.

5. Analysis of Unsaturated Seepage in Embankments

5.1. Unsaturated Seepage Equations and Model Parameter Definitions

5.1.1. Unsaturated Seepage Equations

For three-dimensional unsaturated seepage problems in soil, the volume continuity equation, which does not account for fluid compressibility, is as follows:
( v x x + v y y + v z z ) d x d y d z = V w x
where v is the flow velocity; V w is the volume of water in the soil unit.
The left-hand side of the equation represents the difference in water volume entering and leaving the unit, while the right-hand side represents the change in water volume within the unit per unit time.
Darcy’s theorem for seepage in unsaturated soil is as follows:
v x = k x h x ,   v y = k y h y ,   v z = k z h z
Substituting Formula (28) into Formula (27) yields:
x ( k x h x ) + y ( k y h y ) + z ( k z h z ) = ( V w / V 0 ) t
The change in water volume per unit time in the soil unit resulting from changes in the net normal stress σ v u a and the matrix suction u a u w is determined using Equation (30).
( V w / V 0 ) t = m 1 k w σ v u a t + m 2 k w u a u w t
where σ v is the volumetric stress; u a is the pore air pressure; u w is the soil matric suction; m 1 k w and m 2 k w are the water volume coefficients corresponding to the variations in net normal stress and matric suction, respectively.
In unsaturated seepage processes, it is generally assumed that the total stress does not change with time ( σ v / t = 0 ), and that the pore gas pressure is equal to atmospheric pressure or varies little with time ( u a / t = 0 ).
Head is the sum of the gravitational head and the capillary head of the matrix, and is expressed as follows:
h = y u w / ( ρ w g )
In summary, the differential equations for the unsaturated seepage problem are as follows:
x ( k x u w x ) + y ( k y u w y ) + z ( k z u w z ) = ρ w g m 2 k w u w t = C w u w t
where C w (m−1) is the water-holding capacity, which represents the change in the amount of water contained in mudstone when the matric suction of a unit volume of soil changes by one unit of water head.

5.1.2. Definition of Seepage Field Model Parameters

(1)
Material Parameters
The Mohr-Coulomb strength criterion is used for the foundation. The physical and mechanical parameters of the modified red-bed mudstone fill, obtained from laboratory tests, are shown in Table 6.
(2)
Parameters for Unsaturated Seepage Simulation
Simulating unsaturated seepage processes using finite element software requires the relationships between pore pressure and permeability coefficients in the soil and the soil’s degree of saturation. The relationships between the volumetric moisture content of red-bed mudstone fill material—at different montmorillonite bentonite content levels—and the matrix suction, as well as between the permeability coefficients and the matrix suction, are shown in Formulas (4), (5) and (22). This allowed us to determine the pore pressure and permeability coefficients at different saturation levels.

5.2. Model Development and Mesh Generation

To further elucidate the mineral composition of the modified red-bed mudstone subgrade fill and to investigate the effects of soil permeability and swelling on the road structure as moisture content changes over time, a finite element model of the red-bed mudstone embankment was developed using the finite element software Abaqus/CAE 2022. Since the embankment has a symmetrical structure, only half of the embankment was selected for the numerical simulation study. The embankment height was set at 5 m, the crest width at 12 m, the slope ratio at 1:1.5, and the subgrade soil layer thickness at 1 m. CPE4P quadrilateral elements were used for the seepage simulation.
Before submitting the finite element model for analysis, it is necessary to perform a reasonable meshing of the embankment structure to ensure that the resulting mesh is free of distortion and that the model converges well. To reduce the mesh size and number while maintaining computational accuracy—thereby shortening the finite element model calculation time—the finite element mesh was verified for irreducibility.
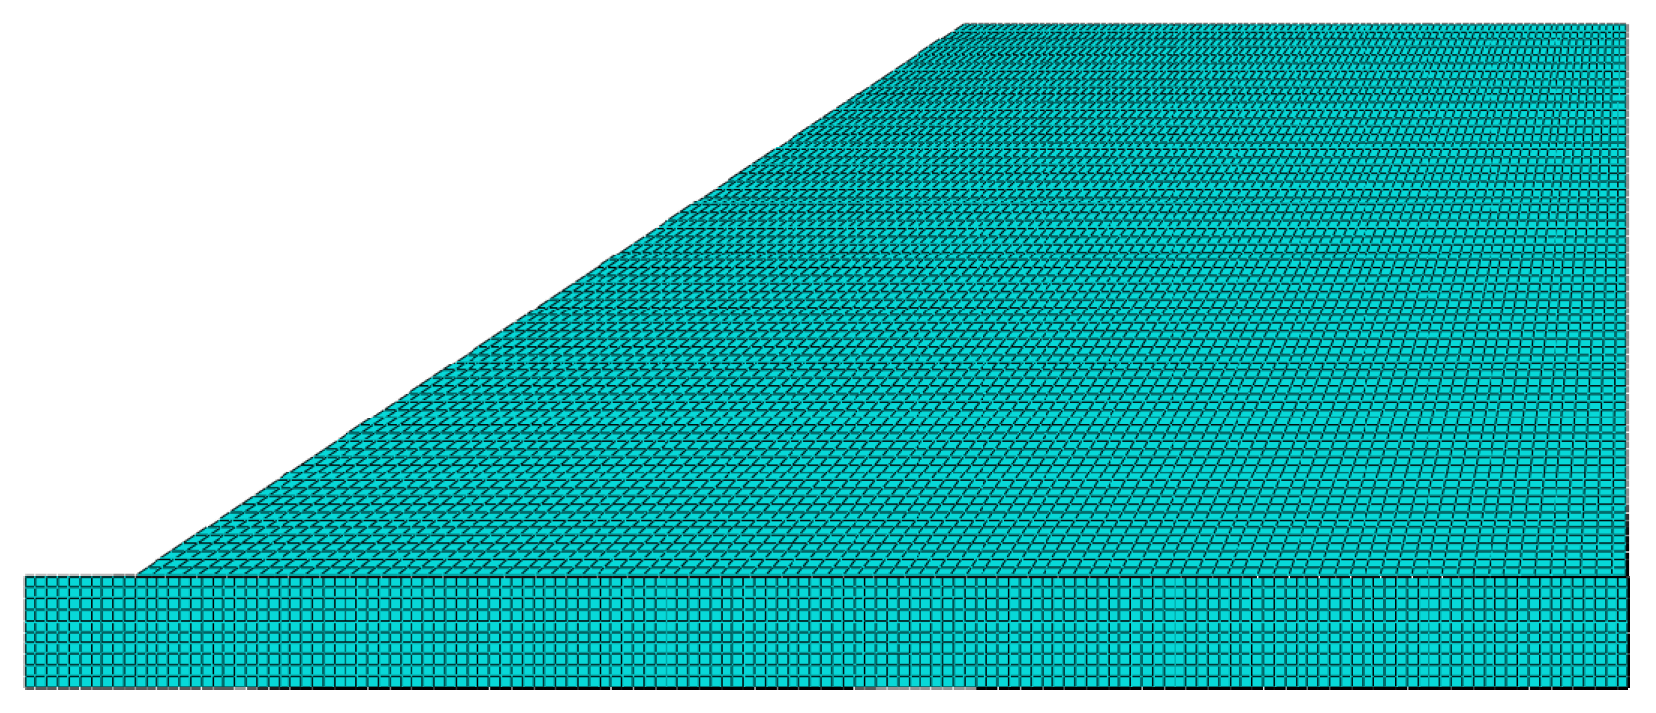
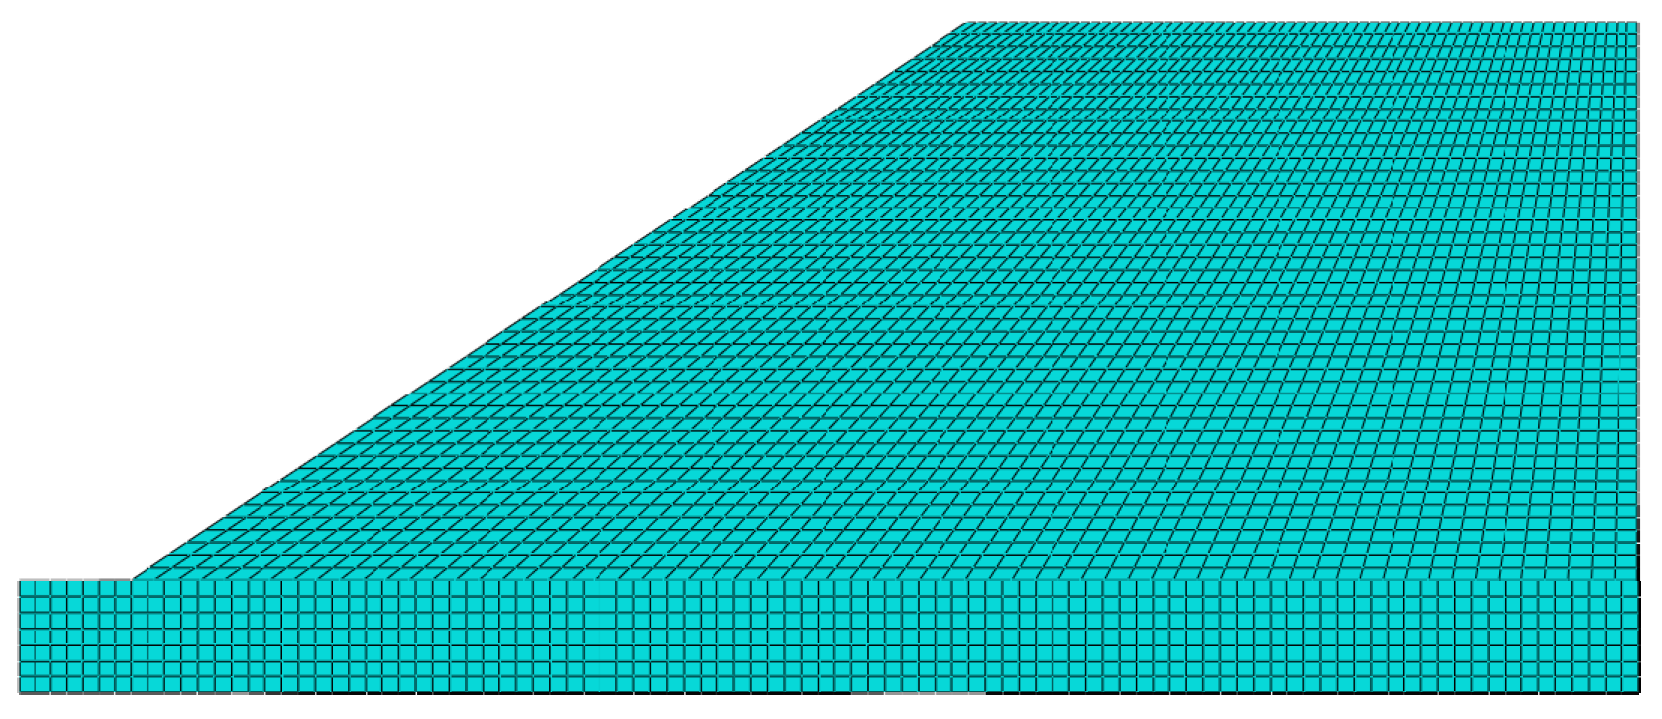
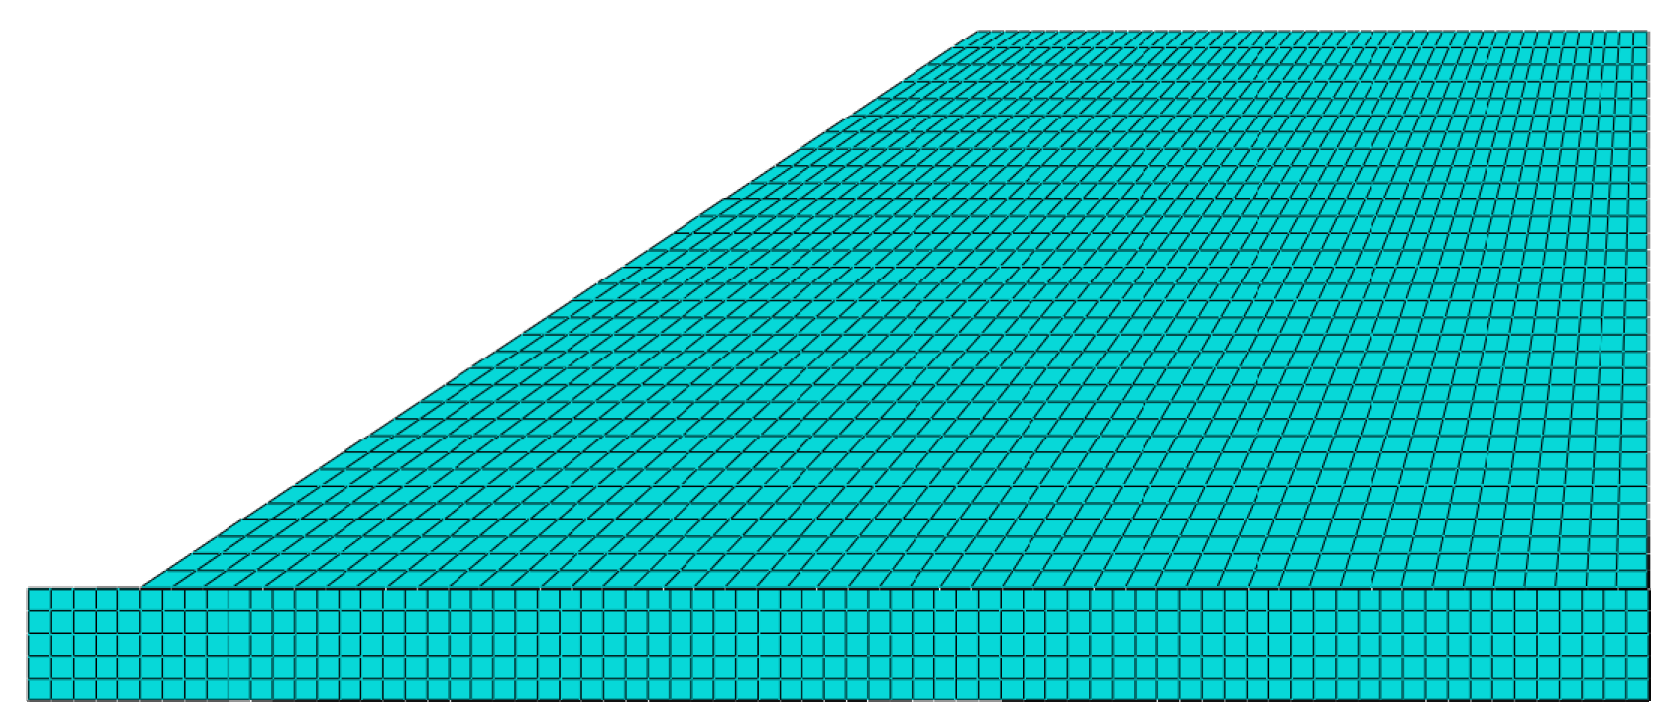
Figure 15 shows the high-density mesh model, with each mesh element having a width of 0.1 m; the embankment structure is divided into 82,400 mesh elements. Figure 16 shows the medium-density mesh model, with each mesh element having a width of 0.15 m; the embankment structure is divided into 25,228 mesh elements. Figure 17 shows a sparse-mesh model, with each mesh element having a width of 0.2 m and the embankment structure divided into 9910 mesh elements. When calculating the infiltration distance at the toe of the embankment, the numerical results for the three mesh models differed only slightly. Therefore, to reduce computation time, the sparse-mesh model was used for the calculations.

5.3. Boundary Conditions

Displacement Boundary Conditions: A fixed constraint is applied to the subgrade soil at the base of the embankment calculation model; a normal constraint is applied to the right boundary of the model, while the tangential degrees of freedom at the boundary are retained; the top surface and left boundary are set as free boundaries.
Seepage Boundary Conditions: Since the top surface of the embankment serves as the pavement and is treated as an impermeable layer, water accumulates at the toe of the embankment after rainfall. Therefore, the saturation at the upper interface of the subgrade soil at the toe is set to 0.3 kPa. The initial saturation of the embankment is 0.617, and the initial void ratio is 0.7.

5.4. Simulation Results

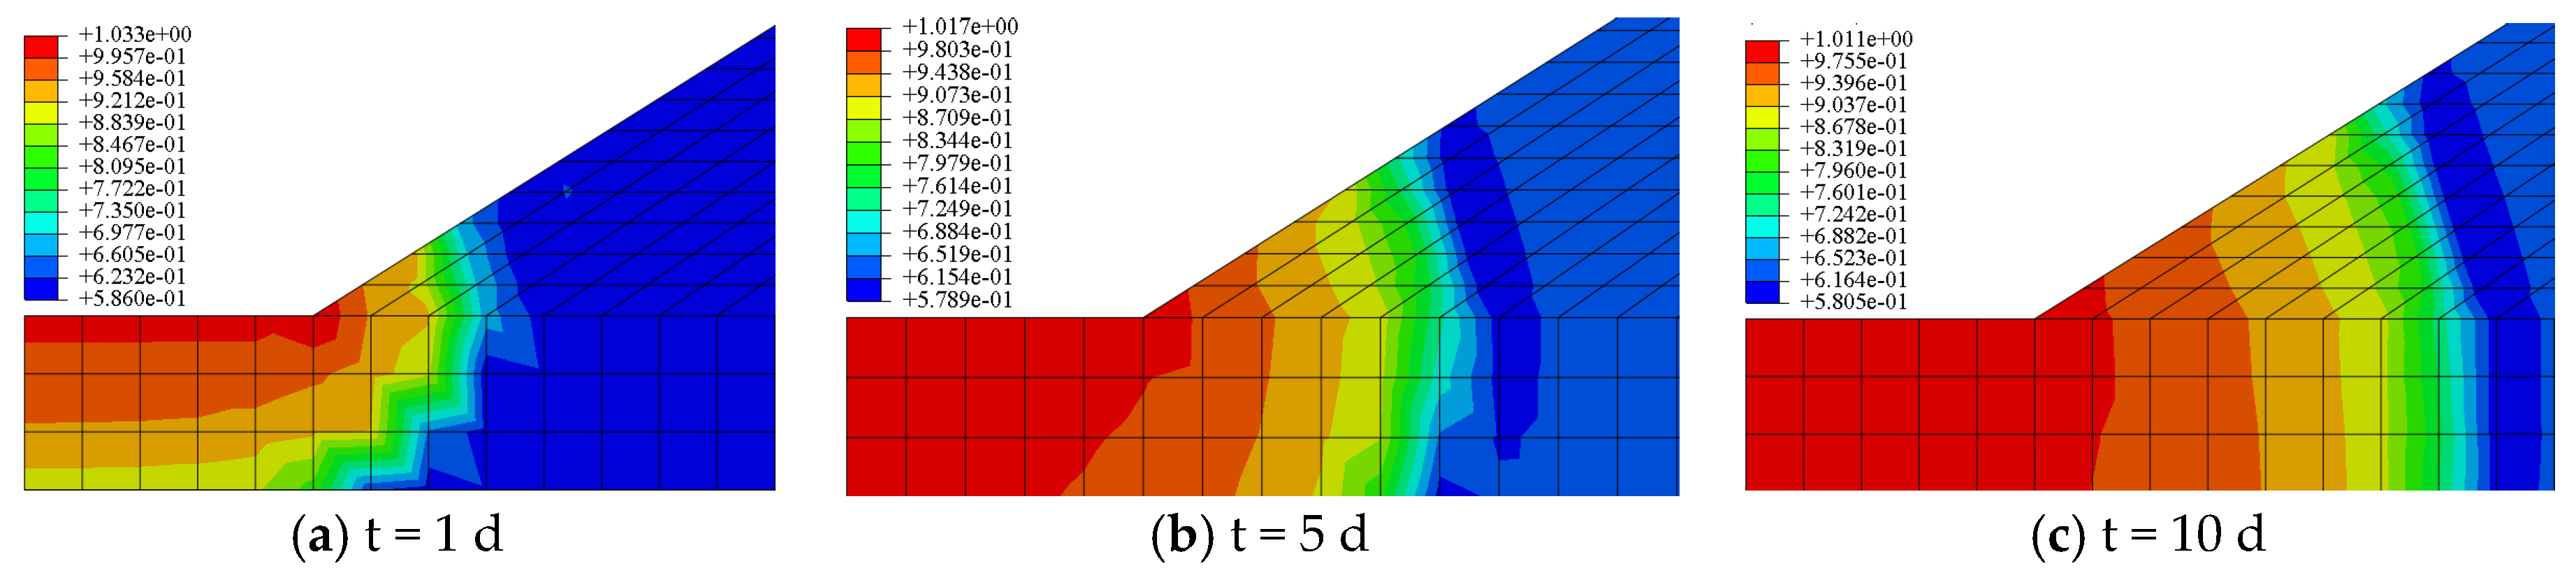
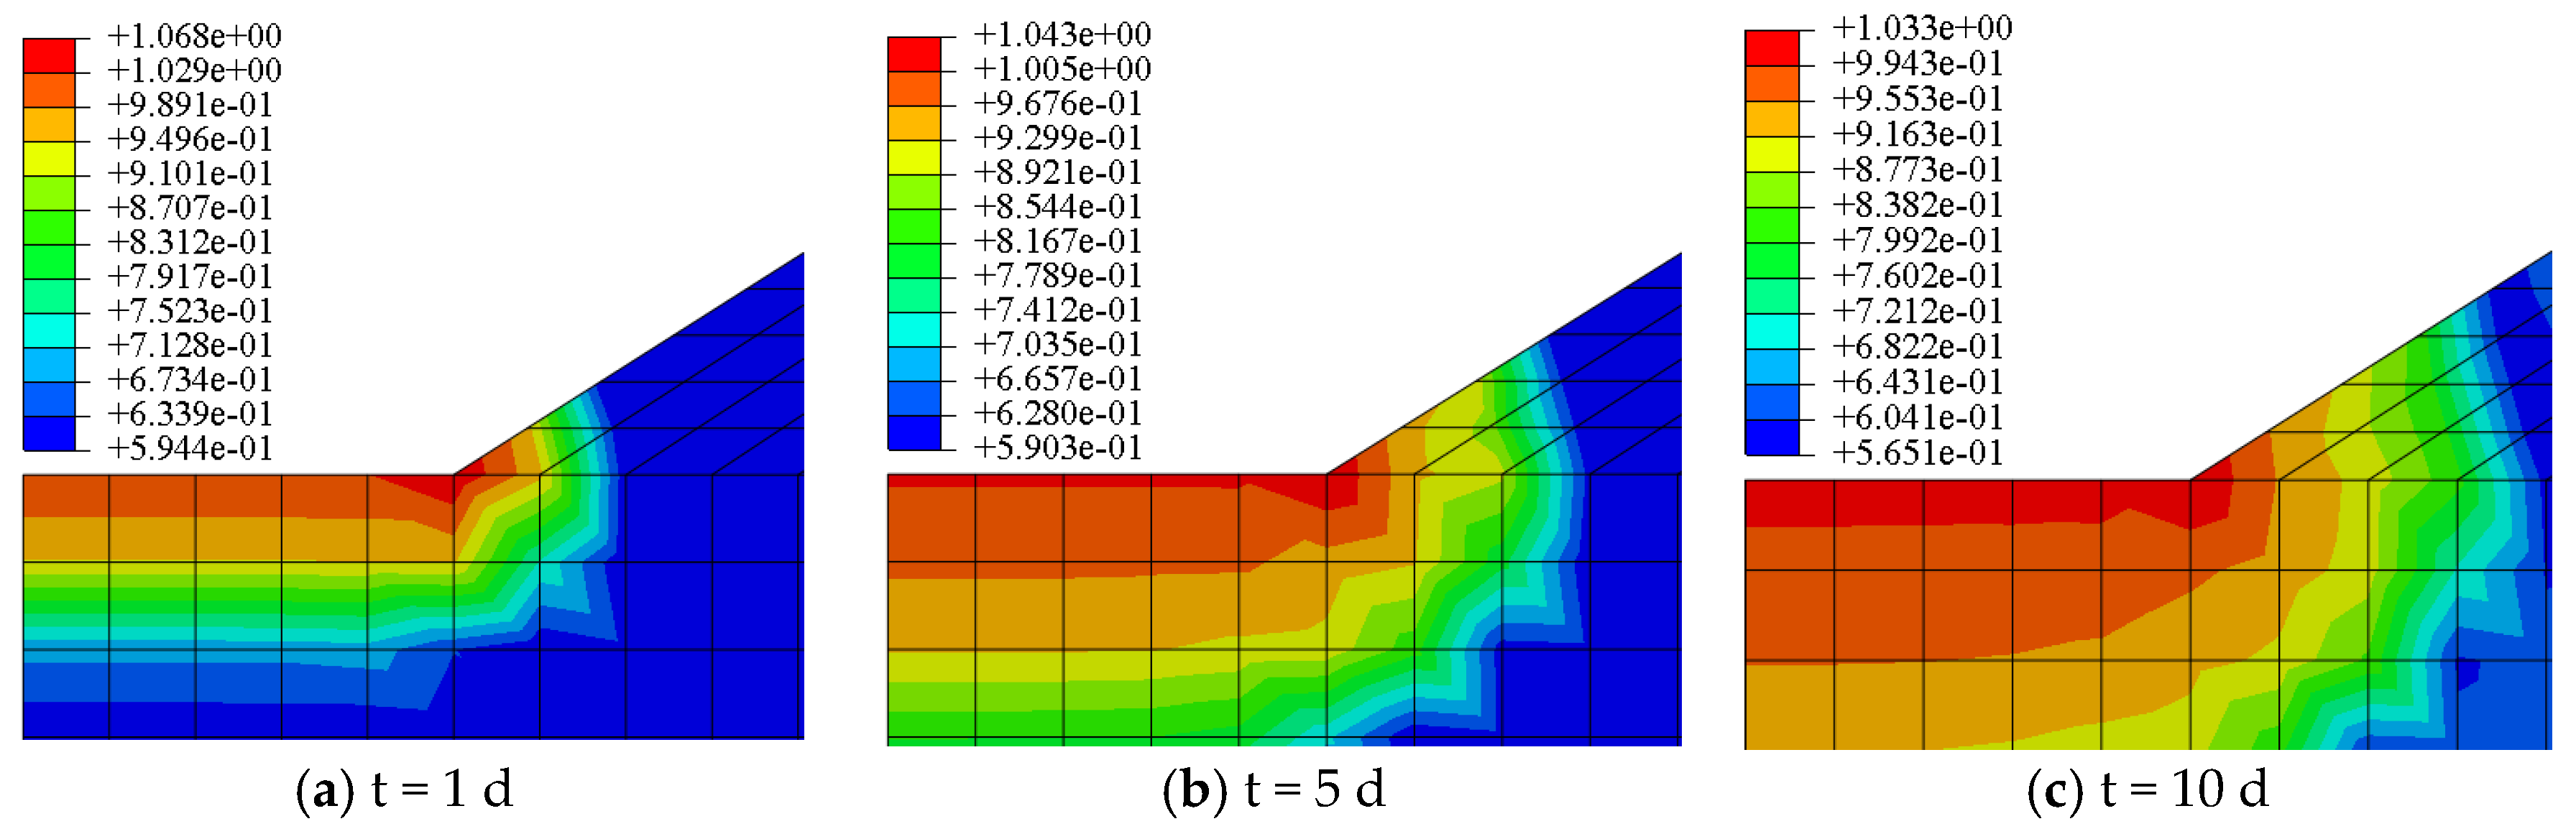
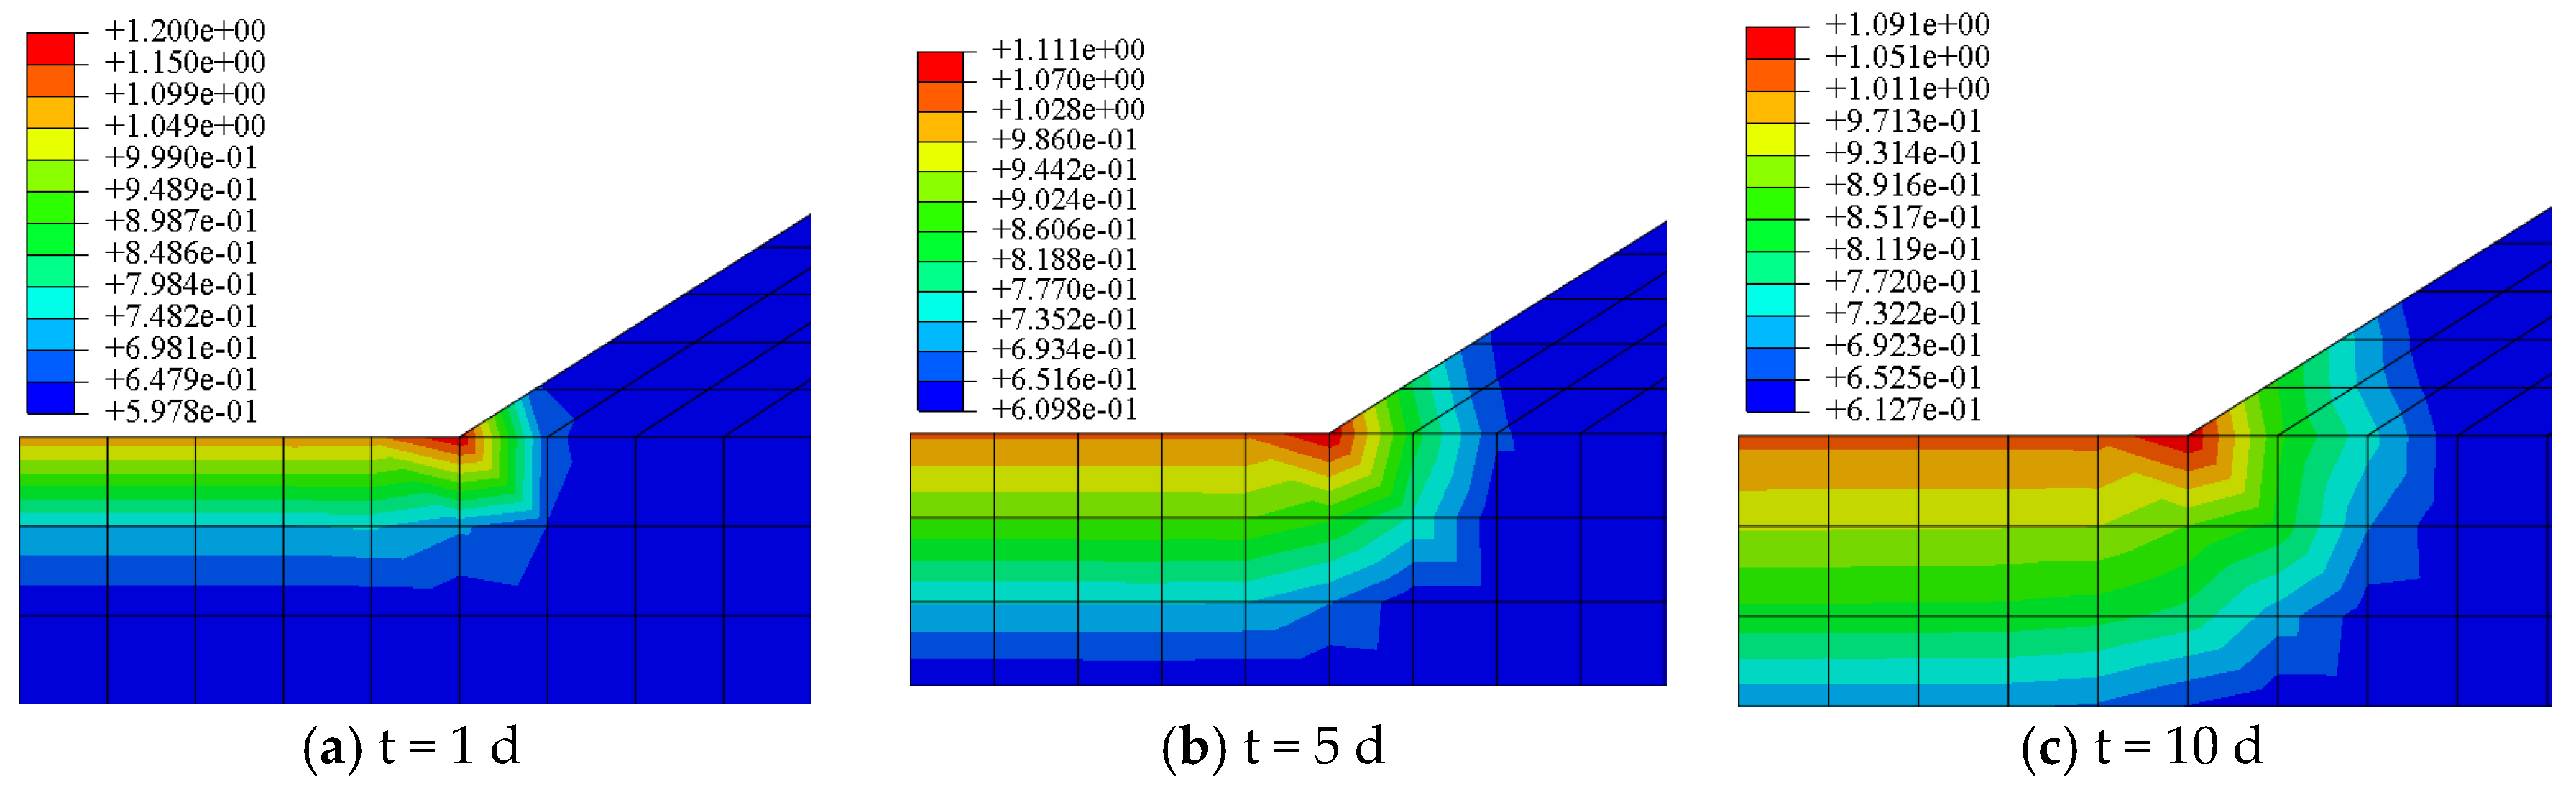
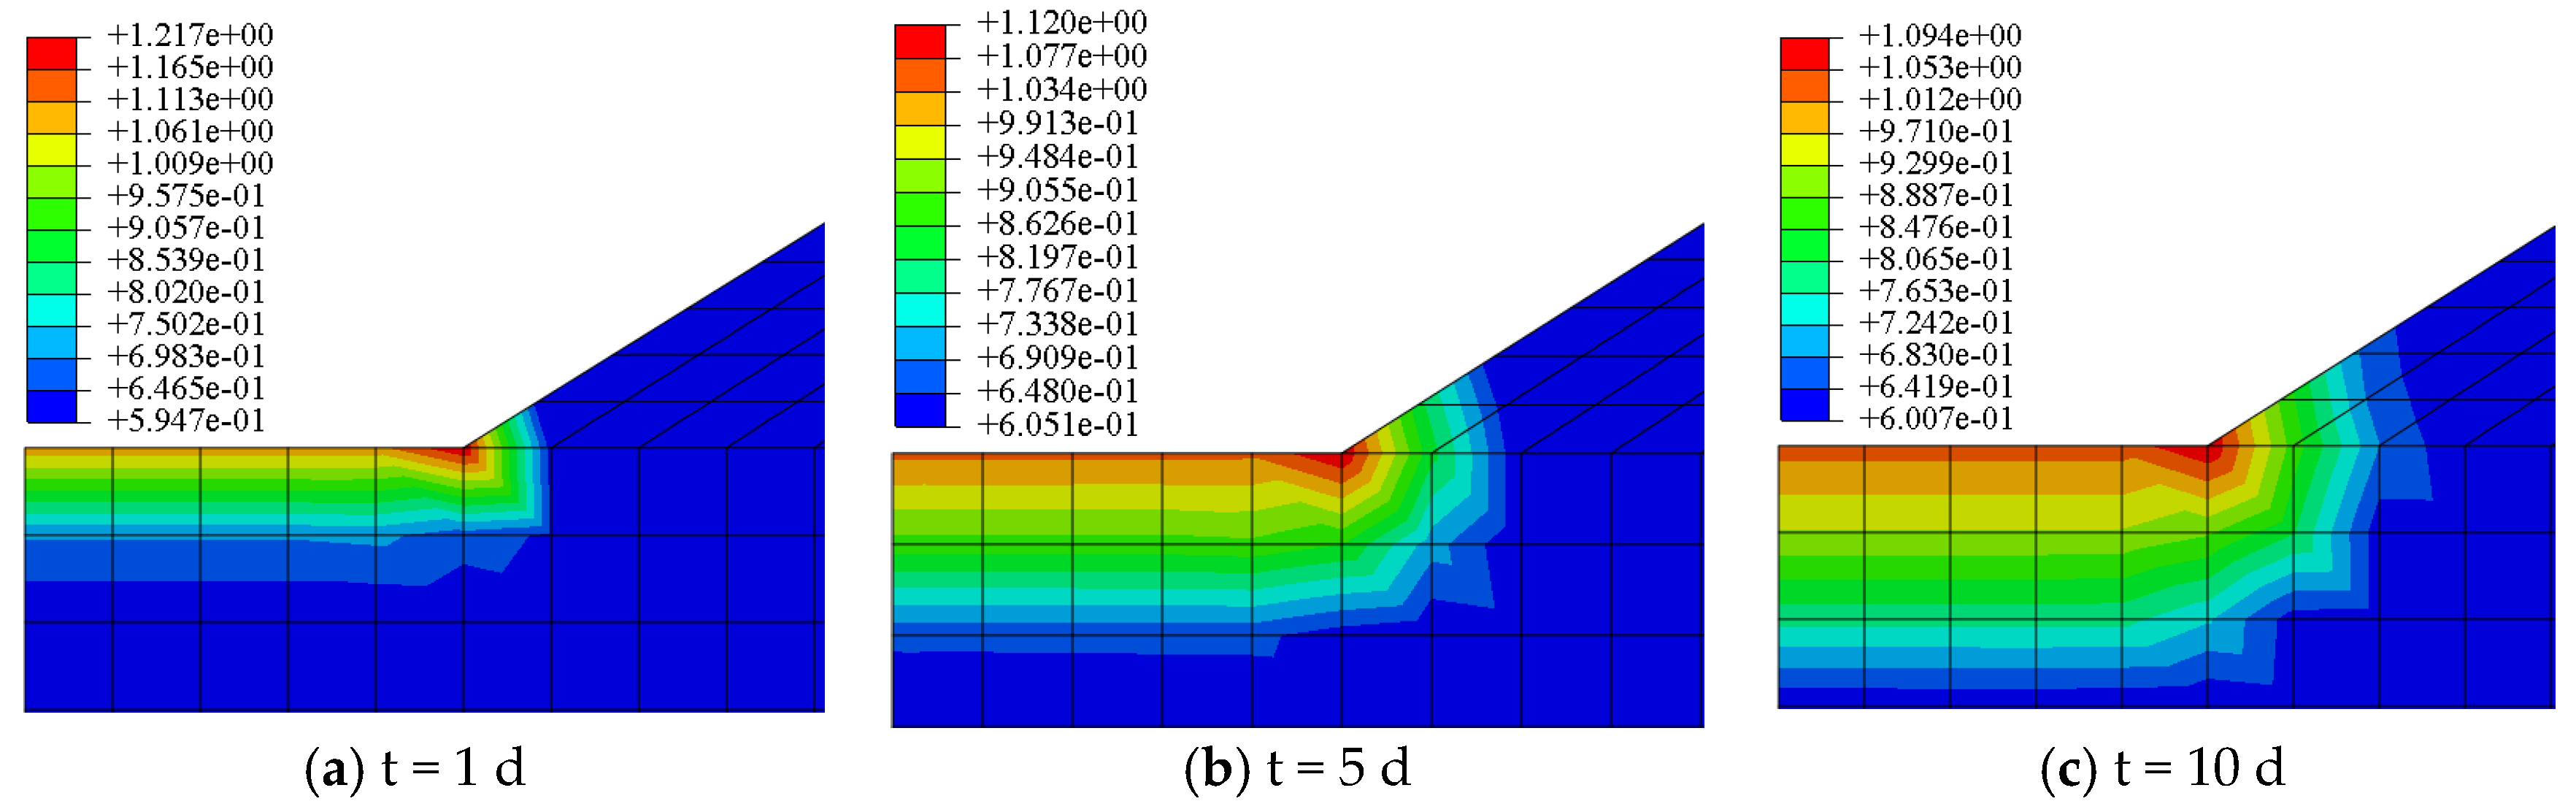
The isosaturation contour maps showing the unsaturated seepage saturation distribution at 1 day, 5 days, and 10 days for the embankment filled with modified red-bed mudstone are shown in Figure 18, Figure 19, Figure 20 and Figure 21. Given that the area affected by seepage is relatively small compared to the overall extent of the embankment, a subset of the area was selected to analyze the effect of montmorillonite bentonite content on seepage. Analysis of the contour plots shows that water flows continuously along the toe of the embankment and infiltrates deeper into the embankment; moisture migrates from areas of high saturation to areas of low saturation. As infiltration proceeds, saturation gradually increases along the toe of the embankment both horizontally and vertically; at any given time, the soil saturation is higher in areas closer to the toe of the embankment.
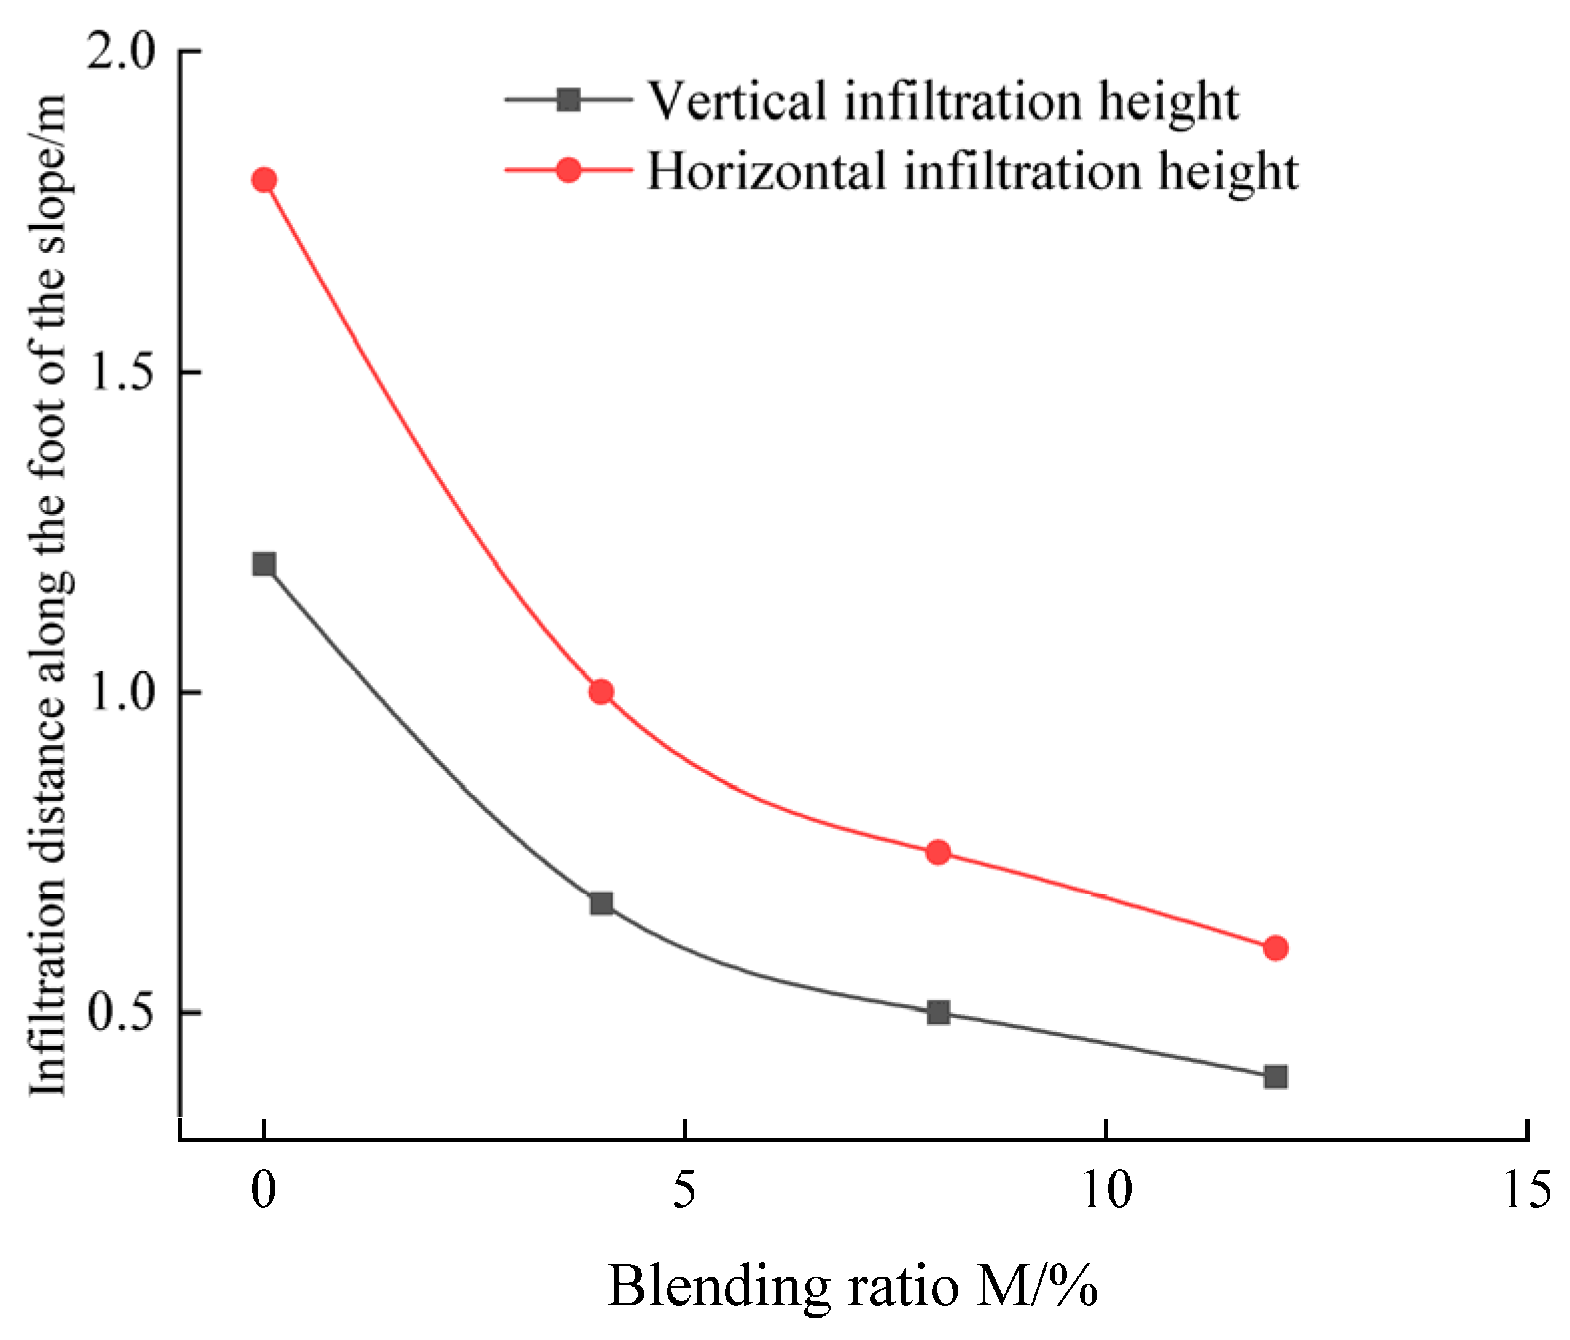
The addition of montmorillonite bentonite affects the rate of water migration and the extent of water infiltration during the infiltration process of embankments filled with red-layer mudstone. Specifically, as the montmorillonite bentonite content increases, the infiltration rate and depth of the embankment decrease markedly; at the same time, within the same area, red-bed mudstone with a higher montmorillonite bentonite content exhibits lower soil saturation. When the infiltration duration reached 10 days, the infiltration heights of the red-bed mudstone embankment fill along the toe, for montmorillonite bentonite content of 0%, 4%, 8%, and 12%, were 1.20 m, 0.67 m, 0.53 m, and 0.4 m, respectively; the horizontal infiltration depths along the toe were 1.8 m, 1 m, 0.8 m, and 0.6 m, respectively. Plotting the relationship between these two parameters and the montmorillonite bentonite content, as shown in Figure 22, reveals that as the montmorillonite bentonite content increases, both the height of infiltration along the toe and the depth of infiltration exhibit a nonlinear decreasing trend. It can be seen that the more montmorillonite bentonite added to the modified red-bed mudstone fill, the better its impermeability.
Hydrorhetic action of red-bed mudstone can lead to problems such as uneven subgrade settlement and reduced road bearing capacity, which seriously compromise traffic safety. Montmorillonite bentonite is highly effective at reducing the permeability of fill material; when the duration of water infiltration is short, it can markedly mitigate expansion and deformation of the subgrade and pavement, making it valuable for engineering applications. However, during subgrade construction, adequate consideration must still be given to waterproofing measures for the subgrade and pavement to ensure effective waterproofing and drainage.

6. Conclusions

This study determined the soil–water characteristic curves, permeability coefficients, and NMR T2 spectra of saturated and unsaturated modified red-bed mudstone fill material; analyzed the permeability characteristics and NMR fractal features of the fill material at different montmorillonite bentonite content levels; and developed a novel permeability coefficient prediction model. After validating this model against experimental results, the main conclusions are as follows:
(1)
Montmorillonite bentonite exerts a markedly regulatory effect on the permeability performance of modified red-bed mudstone. The core mechanism behind the reduction in permeability is that montmorillonite bentonite swells upon contact with water, filling internal pores in the soil and expanding seepage pathways.
(2)
The NMR T2 spectrum exhibits a typical “double peak.” The incorporation of montmorillonite bentonite and the saturation water absorption process cause clay minerals to expand, leading to the mudification and compaction of red-bed mudstone and the filling of pores, resulting in the evolution of the pore structure toward smaller pores.
(3)
The newly developed model utilizes pore structure parameters obtained from NMR experiments to rapidly predict permeability coefficients. A comparison of the model’s predictions with measured results further validates the model’s applicability.
(4)
This model does not fully account for the dynamic pore evolution caused by the water absorption and expansion of expansive soils, which may result in some deviation between the predicted results and measured values during the high matrix suction stage. Future work could consider the effects of soil expansion and deformation caused by changes in suction, as well as the influence of adsorbed water on the permeability coefficient, to further optimize the model and improve the prediction accuracy of the permeability coefficient for modified red-bed mudstone.

Author Contributions

Conceptualization, methodology, and writing—review, Y.Y.; conceptualization, methodology, writing—editing, and investigation, C.D.; funding acquisition and investigation, X.Z.; data curation and investigation, Q.L. All authors have read and agreed to the published version of the manuscript.

Funding

This research was funded by the State-owned Capital Operation Budget of Gansu Provincial Enterprises under the State-owned Assets Supervision and Administration Commission of the People’s Government of Gansu Province, China (Grant No. 2025GZ017), the Science and Technology Program of Gansu Province, China (Grant Nos. 23JRRA854, 21YF5GA050), and the Industrial Support Program of Gansu Provincial Department of Education, China (Grant No. 2021CYZC-28).

Data Availability Statement

The original contributions presented in the study are included in the article; further inquiries can be directed to the corresponding author.

Conflicts of Interest

Authors Chengcheng Du and Xiaoming Zhu were employed by the company Gansu Province Transportation Planning, Survey & Design Institute Co., Ltd. The remaining authors declare that the research was conducted in the absence of any commercial or financial relationships that could be construed as a potential conflict of interest.

References

  1. Tang, J.W.; Lan, T.L.; Lai, Y.M.; Li, M.; Ma, Q.G. Softening mechanism and characteristics of mudstone after absorbing moisture. Appl. Clay Sci. 2024, 254, 107398. [Google Scholar] [CrossRef] [Scilit]
  2. Xu, W.; Qu, X.; Yan, L.; Ning, Y. Experimental Study on Mechanical Properties and Permeability Characteristics of Calcareous Mudstone under Different Confining Pressures. Materials 2024, 17, 2731. [Google Scholar] [CrossRef] [Scilit] [PubMed]
  3. Cetre-Orejuela, H.A.; Jaramillo, M.; Alvarez-Villa, O.D. Scaling of hydraulic conductivity in porous and fractured media for continuous models: A review. Adv. Water Resour. 2024, 193, 104822. [Google Scholar] [CrossRef] [Scilit]
  4. Childs, E.C.; Collis-George, N. The Permeability of Porous Materials. Proc. R. Soc. Lond. Ser. A Math. Phys. Sci. 1950, 201, 392–405. [Google Scholar] [CrossRef] [Scilit]
  5. Mualem, Y. A new model for predicting the hydraulic conductivity of unsaturated porous media. Water Resour. Res. 1976, 12, 513–522. [Google Scholar] [CrossRef] [Scilit]
  6. Burdine, N.T. Relative Permeability Calculations From Pore Size Distribution Data. J. Pet. Technol. 1953, 5, 71–78. [Google Scholar] [CrossRef] [Scilit]
  7. van Genuchten, M.T. A Closed-form Equation for Predicting the Hydraulic Conductivity of Unsaturated Soils. Soil Sci. Soc. Am. J. 1980, 44, 892–898. [Google Scholar] [CrossRef] [Scilit]
  8. Fredlund, D.G.; Xing, A.; Huang, S. Predicting the permeability function for unsaturated soils using the soil-water characteristic curve. Can. Geotech. J. 1994, 31, 533–546. [Google Scholar] [CrossRef] [Scilit]
  9. Zhou, A.N.; Sheng, D.; Carter, J.P. Modelling the effect of initial density on soil-water characteristic curves. Géotechnique 2012, 62, 669–680. [Google Scholar] [CrossRef] [Scilit]
  10. Xu, P.; Qiu, S.; Yu, B.; Jiang, Z. Prediction of relative permeability in unsaturated porous media with a fractal approach. Int. J. Heat Mass Transf. 2013, 64, 829–837. [Google Scholar] [CrossRef] [Scilit]
  11. Xu, Y.F.; Sun, D.A. A fractal model for soil pores and its application to determination of water permeability. Phys. A Stat. Mech. Its Appl. 2002, 316, 56–64. [Google Scholar] [CrossRef] [Scilit]
  12. Tao, G.; Huang, Z.; Xiao, H.; Zhao, W.; Luo, Q. A new nonlinear seepage model for clay soil considering the initial hydraulic gradient of microscopic seepage channels. Comput. Geotech. 2023, 154, 105179. [Google Scholar] [CrossRef] [Scilit]
  13. Jaeger, F.; Shchegolikhina, A.; As, H.V.; Schaumann, G.E. Proton NMR Relaxometry as a Useful Tool to Evaluate Swelling Processes in Peat Soils. Open Magn. Reson. J. 2010, 3, 27–45. [Google Scholar] [CrossRef] [Scilit]
  14. Zeng, L.-L.; Cai, Y.-Q.; Cui, Y.-J.; Hong, Z.-S. Hydraulic conductivity of reconstituted clays based on intrinsic compression. Geotechnique 2019, 70, 268–275. [Google Scholar] [CrossRef] [Scilit]
  15. Singh, U.; Sharma, P.K. Comparison of saturated hydraulic conductivity estimated by surface NMR and empirical equations. J. Hydrol. 2023, 617, 128929. [Google Scholar] [CrossRef] [Scilit]
  16. Mashhadi, S.R.; Keating, K.; Jes Petersen, R.; Parra, A.O.; Costabel, S.; Beisembina, G.; Hiller, T.; Grombacher, D. Hydraulic conductivity estimation by NMR data in unconsolidated geological materials: Insights from SDR model calibrations. J. Hydrol. 2025, 662, 134060. [Google Scholar] [CrossRef] [Scilit]
  17. Daigle, H.; Johnson, A.; Thomas, B. Determining fractal dimension from nuclear magnetic resonance data in rocks with internal magnetic field gradients. Geophysics 2014, 79, D425–D431. [Google Scholar] [CrossRef] [Scilit]
  18. Kleinberg, R.; Straley, C.; Kenyon, W.; Akkurt, R.; Farooqui, S. Nuclear Magnetic ResonaFlce of Rocks: T1 vs. T2. Interaction 1993, 2, 10. [Google Scholar] [CrossRef]
  19. Wu, G.; Tian, H.; Hao, F.; Wang, S.; Yang, W.; Zhu, T. Rapid prediction of the permeability coefficient for soil of different dry densities with NMR T2 distribution. Rock Soil Mech. 2023, 44, 513–520. [Google Scholar] [CrossRef]
  20. Cha, W.; Park, J.; Woo, S.I. Low field NMR based relative permeability and drying model for unsaturated granular materials. Eng. Geol. 2025, 352, 108071. [Google Scholar] [CrossRef] [Scilit]
  21. Tao, G.; Peng, Y.; Chen, Y.; Xiao, H.; Luo, C.; Zhong, C.; Lei, D. A new fast prediction method for relative permeability coefficient of unsaturated soils based on NMR. Chin. J. Geotech. Eng. 2024, 46, 470–479. [Google Scholar] [CrossRef]
  22. Chen, H.; Feng, S.-J. Generalized hydraulic constitutive model of unsaturated flow in heterogeneous soils. Comput. Geotech. 2022, 151, 104985. [Google Scholar] [CrossRef] [Scilit]
  23. Kimura, M. Prediction of tortuosity, permeability, and pore radius of water-saturated unconsolidated glass beads and sands. J. Acoust. Soc. Am. 2018, 143, 3154–3168. [Google Scholar] [CrossRef] [Scilit] [PubMed]
  24. Nourani, V.; Ojaghi, A.; Zhang, Y. Saturated and unsaturated seepage analysis of earth-fill dams using fractal hydraulic conductivity function and its verification. J. Hydrol. 2022, 612, 128302. [Google Scholar] [CrossRef] [Scilit]
  25. Ming, F.; Zhang, M.; Pei, W.; Chen, L. A new hydraulic conductivity model of frozen soil considering the hysteresis effect based on fractal theory. Geoderma 2024, 442, 116790. [Google Scholar] [CrossRef] [Scilit]
  26. GB/T 50123-2019; Standard for Geotechnical Testing Method. Ministry of Housing and Urban-Rural Development of the People’s Republic of China, State Administration for Market Regulation: Beijing, China, 2019.
  27. Tangyu, Z.; Lina, M.; Rongling, Z.; Qicai, W.; Jinqian, L. Analysis for effect of mip-based compaction on micro-structure of remodeled mud stone with “micro-expansion”. J. Eng. Geol. 2021, 27, 717–722. [Google Scholar] [CrossRef]
  28. Hua, L.; Tonglu, L.; Ruijun, J.; Jiangwen, F. Measurement of Unsaturated Permeability Curve Using Filter Paper Method. Rock Soil Mech. 2020, 41, 895–904. [Google Scholar] [CrossRef]
  29. Yan, X.Q.; Fang, Y.G.; Zhang, P. Experiment study on the effects of bentonite on the micropore structure characteristics of soil. Chin. J. Geotech. Eng. 2011, 33, 1302–1307. [Google Scholar]
  30. Zhang, Z.Y.; Weller, A. Fractal dimension of pore-space geometry of an Eocene sandstone formation. Geophysics 2014, 79, D377–D387. [Google Scholar] [CrossRef] [Scilit]
  31. Wang, F.Y.; Yang, K.; Cai, J.C. Fractal characterization of tight oil reservoir pore structure using nuclear magnetic resonance and mercury intrusion porosimetry. Fractals-Complex Geom. Patterns Scaling Nat. Soc. 2018, 26, 1840017. [Google Scholar] [CrossRef] [Scilit]
  32. Yu, B.-M.; Li, J. Some fractal characters of porous media. Fractals 2001, 9, 365–372. [Google Scholar] [CrossRef] [Scilit]
  33. Yu, B.; Cheng, P. A fractal permeability model for bi-dispersed porous media. Int. J. Heat Mass Transf. 2002, 45, 2983–2993. [Google Scholar] [CrossRef] [Scilit]
  34. Yun, M.; Yu, B.; Cai, J. Analysis of seepage characters in fractal porous media. Int. J. Heat Mass Transf. 2009, 52, 3272–3278. [Google Scholar] [CrossRef] [Scilit]
  35. Xiao, B.; Fan, J.; Ding, F. A fractal analytical model for the permeabilities of fibrous gas diffusion layer in proton exchange membrane fuel cells. Electrochim. Acta 2014, 134, 222–231. [Google Scholar] [CrossRef] [Scilit]
  36. Tao, G.; Zhang, J. Two categories of fractal models of rock and soil expressing volume and size-distribution of pores and grains. Chin. Sci. Bull. 2009, 54, 4458–4467. [Google Scholar] [CrossRef] [Scilit]
  37. Zhang, B.; Liu, X. Effects of fractal trajectory on gas diffusion in porous media. AIChE J. 2003, 49, 3037–3047. [Google Scholar] [CrossRef] [Scilit]
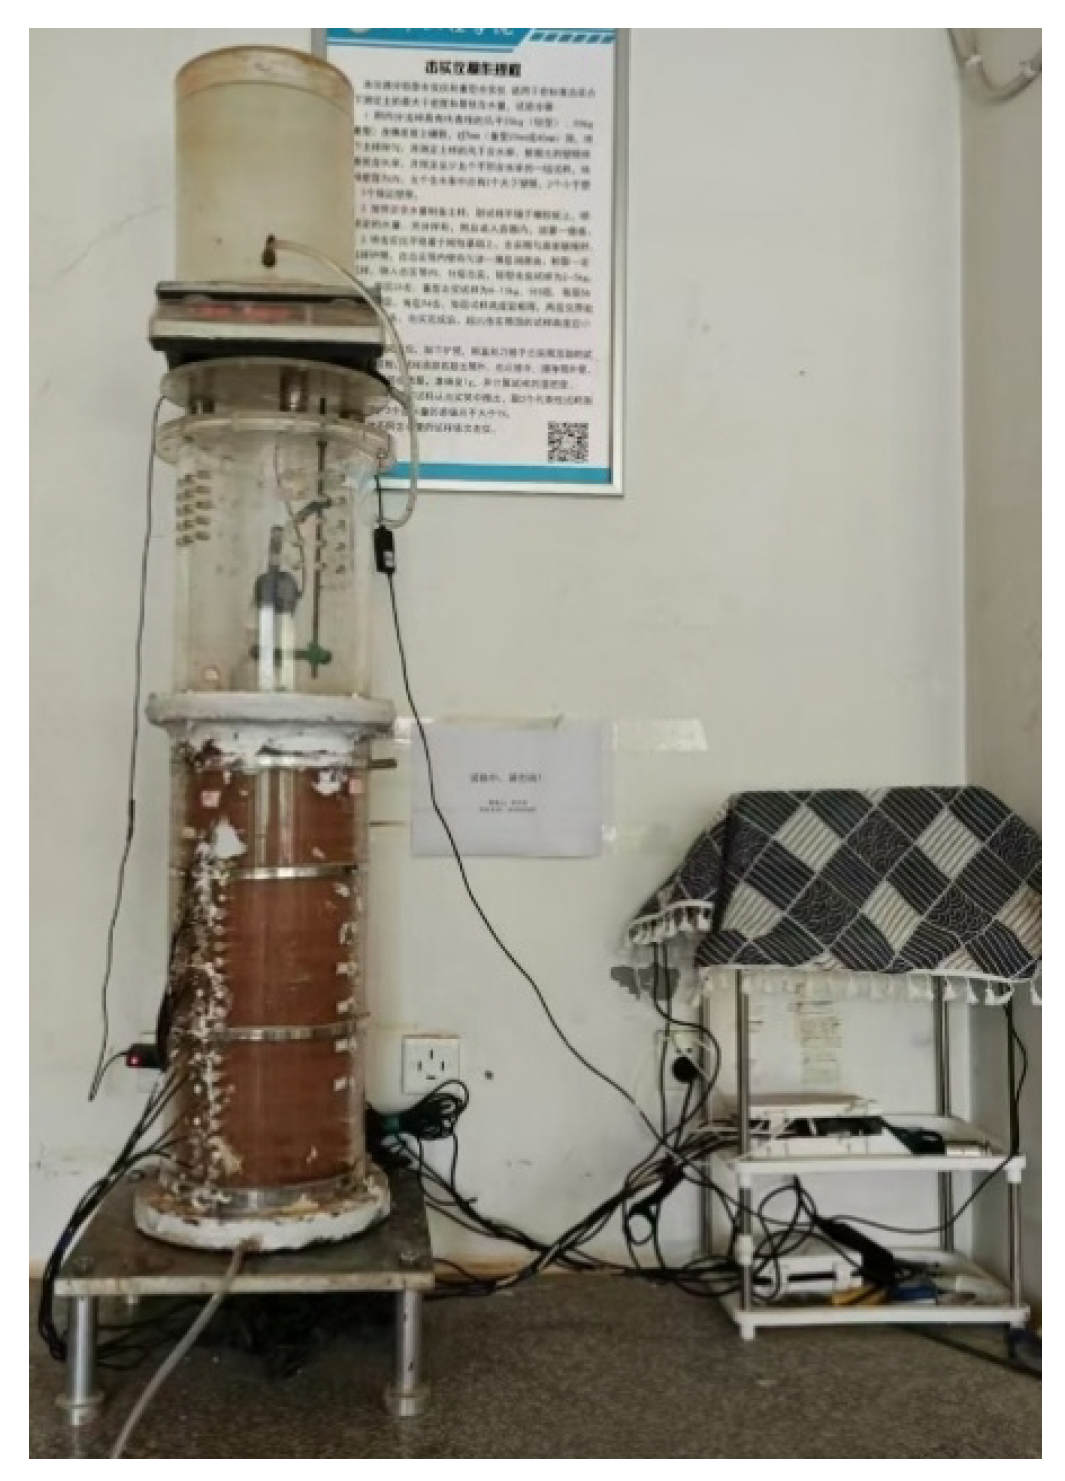
Figure 1. Unsaturated permeability test system.
Buildings 16 03356 g001
Figure 2. Instrument calibration samples and procedures.
Buildings 16 03356 g002
Figure 3. Relationship between saturated permeability coefficient and montmorillonite bentonite content.
Buildings 16 03356 g003
Figure 4. Soil–water characteristic curves of red-bed mudstone.
Buildings 16 03356 g004
Figure 5. Spatiotemporal distribution of volume water content in modified red-bed mudstone.
Buildings 16 03356 g005
Figure 6. Experimental results on the unsaturated permeability coefficient of modified red-bed mudstone.
Buildings 16 03356 g006
Figure 7. T2 spectral chart for modified red-bed mudstone.
Buildings 16 03356 g007
Figure 8. Percentage of peak areas in the sample.
Buildings 16 03356 g008
Figure 9. Nuclear magnetic resonance fractal dimension.
Buildings 16 03356 g009
Figure 10. Comparison of predicted and measured saturated seepage coefficients.
Buildings 16 03356 g010
Figure 11. Comparison of predicted and measured unsaturated seepage coefficients.
Buildings 16 03356 g011
Figure 12. The effect of maximum pore radius on the saturated seepage coefficient.
Buildings 16 03356 g012
Figure 13. The effect of fractal dimension on the saturated permeability coefficient.
Buildings 16 03356 g013
Figure 14. The effect of meandering on the saturated seepage coefficient.
Buildings 16 03356 g014
Figure 15. Encrypted mesh model.
Buildings 16 03356 g015
Figure 16. Medium density mesh model.
Buildings 16 03356 g016
Figure 17. Sparse mesh model.
Buildings 16 03356 g017
Figure 18. Contour Maps of Infiltration Saturation Distribution at Different Times (M = 0%).
Buildings 16 03356 g018
Figure 19. Contour maps of infiltration saturation distribution at different times (M = 4%).
Buildings 16 03356 g019
Figure 20. Contour maps of infiltration saturation distribution at different times (M = 8%).
Buildings 16 03356 g020
Figure 21. Contour maps of infiltration saturation distribution at different times (M = 12%).
Buildings 16 03356 g021
Figure 22. Infiltration distance along the toe of the slope after 10 days of infiltration.
Buildings 16 03356 g022
Table 1. Saturated permeability coefficient of modified red-bed mudstone (20 °C).
Montmorillonite Bentonite Content0%4%8%12%
Permeability coefficient (cm/s)4.663 × 10−55.772 × 10−69.102 × 10−74.302 × 10−7
Table 2. Parameter values for the Fredlund and Xing model.
Model Parameters θ s /% C r /kPa a n m R2
Values37.237395.3547.680.6660.4740.9930
Table 3. T2 spectrum area of modified red-bed mudstone.
SpecimenMontmorillonite-Bentonite ContentMicropore Peak AreaMesopore Peak AreaMacropore Peak AreaTotal Area
Group A0%77,420.2513,000.174361.6294,782.04
4%80,721.2913,498.764553.4198,773.46
8%84,494.579213.651396.3195,104.53
12%87,558.646986.47396.1094,941.21
Group B0%68,278.769694.3622,632.58100,605.70
4%69,896.6910,155.9320,720.32100,772.94
8%71,729.0110,851.1718,119.70100,699.88
12%72,582.5912,726.0817,655.19102,963.86
Table 4. Fractal dimension of the pore structure in modified red-bed mudstone.
Montmorillonite Bentonite Content0%4%8%12%
D1 (T2 < T2c)0.64700.64570.64340.6402
D2 (T2 > T2c)2.94032.94422.94612.9487
Table 5. Pore structure parameters of modified red-bed mudstone.
Montmorillonite-Bentonite Content n D r ψ = 0 (μm)Predicted Value k s (cm/s)Measured Data k (cm/s)Relative Error (%)
0%0.3101.940312.6182.517 × 10−64.663 × 10⁻⁵−94.60
4%0.3071.944210.9821.761 × 10−65.772 × 10⁻⁶−69.50
8%0.3031.94619.5581.265 × 10−69.102 × 10⁻⁷−39.03
12%0.2961.94875.8794.413 × 10−74.302 × 10−72.57
Table 6. Parameters of the physical and mechanical properties.
MaterialDry Density (g/cm3)Moisture Content (%)Void Ratio (%)Elastic Modulus (MPa)Poisson’s RatioCohesion (kPa)Internal Friction Angle (°)Hydraulic Conductivity (m/s)
0%1.714.20.621860.3558.3443.135.33 × 10−6
4%1.714.20.551150.3365.7147.801.96 × 10−6
8%1.714.20.51940.3365.9948.221.08 × 10−6
12%1.714.20.49810.3264.8248.012.90 × 10−6
Disclaimer/Publisher’s Note: The statements, opinions and data contained in all publications are solely those of the individual author(s) and contributor(s) and not of MDPI and/or the editor(s). MDPI and/or the editor(s) disclaim responsibility for any injury to people or property resulting from any ideas, methods, instructions or products referred to in the content.