Article

New Home Warranty for Pre-Handover Defects, Korea
1
Justice Co., Ltd., Geumcheon-gu, Seoul 08504, Republic of Korea
2
Division of Architecture, Sunmoon University, Asan-si 31460, Republic of Korea
3
School of Architecture, Halla University, Wonju-si 26404, Republic of Korea
4
Department of Architectural Engineering, Chungbuk National University, Cheongju-si 28644, Republic of Korea
*
Author to whom correspondence should be addressed.
Buildings 2026, 16(14), 2803; https://doi.org/10.3390/buildings16142803
Submission received: 4 June 2026 / Revised: 9 July 2026 / Accepted: 14 July 2026 / Published: 15 July 2026
(This article belongs to the Special Issue Real Estate, Housing, and Urban Governance—2nd Edition)

Abstract

The decline in housing quality and the rising number of housing defect cases have become a serious social issue worldwide. To protect newly built home buyers from such defects, a new home warranty system is in place. In Korea, defects are categorized by timing: pre-handover or post-handover. However, only post-handover defects are covered under the warranty. This study proposes an alternative standard for the new home warranty based on construction costs for pre-handover defects. Through a statistical analysis of 238 litigation cases, three key metrics, specifically the arithmetic mean, the 80% cutoff value, and the upper whisker from a box plot analysis, were derived. These three metrics, combined with three additional “adjusted policy indicators” derived from these initial values, constitute a total of six proposed alternatives. Based on a comparison of the above alternative indicators through case studies, it was determined that setting the home warranty at 1% of the construction cost in the pre-handover stage represents the safest option in terms of both the individual case coverage rate and the aggregate deposit coverage rate. It is expected that this measure can reinforce the social safety net designed to protect buyers of newly constructed homes against pre-handover defects.

1. Introduction

1.1. Background

Construction defects affecting housing quality are a global concern. According to an analysis by the Hawaii Economic Research Organization in the United States, litigation over housing defects has risen sharply, with 20% of newly built homes in Hawaii affected by lawsuits, resulting in a 500% increase in insurance premiums [1]. In Spain, the shortage of skilled construction workers surged by 400% compared to 2016, becoming a critical factor that significantly threatens housing quality [2]. According to the Research Triangle Institute, plumbing systems in residential complexes adjacent to industrial parks in Vietnam were found to contain substances harmful to human health, such as lead and manganese, at levels exceeding World Health Organization standards, revealing a critically low standard of housing quality [3]. In the United Arab Emirates, residential buildings have suffered from defects stemming from substandard building envelope construction and insulation, resulting in cooling energy losses ranging from 25% to 78% [4]. In Korea, defects during house construction have emerged as a significant social issue, with over 3000 disputes regarding such defects filed annually since 2015 [5].
Furthermore, escalating geopolitical conflicts have driven up global oil prices and construction material costs, significantly compounding the challenges within the industry. According to the National Association of Home Builders, 62% of U.S. homebuilders reported that rising fuel costs impose a significant burden, while elevated interest rates further compound their financial risks [6]. In Spain, too, although the housing supply is rising, it remains insufficient relative to demand. Moreover, labor shortages, declining productivity, and rising construction material costs have been identified as key challenges [7]. While Vietnam fares relatively well compared to the two aforementioned nations in terms of housing supply and transaction volume, potential systemic risks are increasingly reported in its real estate market, stemming specifically from rising interest rates and maturing corporate bonds amid increasingly stringent financing conditions [8]. The United Arab Emirates implemented a new bankruptcy law in 2024 to manage corporate insolvencies driven by surging construction costs [9]. However, due to its proximity to regional instabilities in the Middle East, the UAE is highly exposed to heightened geopolitical risks and faces the potential for significant economic repercussions. In Korea, 345 construction firms had ceased operations as of March 2026, a trend that has intensified since the beginning of 2024 [10].

1.2. New Home Warranty

Many countries operate new home warranty systems. In the United States, regulations typically mandate the use of Performance and Payment Bonds-Construction during the project, as well as the Retainage or Retention before project completion; the standard rate for both is typically 10% of the total construction cost. This coverage includes maintenance and repair of defects that arise within one year of project completion [11]. For defects arising thereafter, the warranty liability periods are stipulated to vary by component or facility, and the home warranty amounts are to be assessed individually by the respective guaranteeing parties. Effective from 1 January 2026, the State of California has lowered the retainage rate to 5% of the construction cost for both public and private projects [12]. However, residential buildings of four stories or fewer are exempt from this provision. In the case of Spain, Article 19, Paragraph 1(a) of the Building Act stipulates that the new home warranty shall be set at 5% of the contract value [13]. Vietnam’s Housing Law does not explicitly stipulate provisions regarding a new home warranty. Instead, Article 28 of the regulations concerning construction guarantees establishes a deposit of 3% of the construction cost for tier premium through class 1 projects, and 5% for all other projects [14]. The United Arab Emirates, under Article 14 of its Real Estate Escrow Law, mandates that 5% of the construction cost be deposited into an escrow account [15]. As illustrated by these examples, it is evident that countries around the world, when operating their new home warranty systems, typically set the deposit amount as a percentage of the total construction cost.
Korea is no exception; laws such as the Housing Act and the Multi-Family Housing Act stipulate that 3% of construction costs must be set aside as a new home warranty [16]. However, the scope of “defects” covered herein is strictly limited to those that manifest post-handover stages [17]. In Korea, litigation concerning housing defects began in the 1990s, resulting in the accumulation of a diverse body of case law. Accordingly, defects are now categorized based on the timing of their occurrence. Specifically, they are categorized into pre-handover and post-handover defects [18].
Defects identified as pre-handover defects are instances in which regulations have been violated or in which installation or construction was executed in deviation from the design. The defect category includes work performed contrary to the requirements stipulated by law (“a regulatory violation”). Regarding deviations from the design, discrepancies in materials or specifications are designated as “defects due to differences from drawings or specifications.” While instances involving the complete or partial omission of work are classified as “non-installation.” A representative example is the omission of top coating application in multicolor painting during finishing works [19].
Furthermore, issues arising from errors inherent in the design itself are defined as “design defects.” Although it is standard practice to verify such matters through inspections conducted by city officials, fire departments, and project supervisors just before house completion, pre-handover defects often occur in areas embedded in concrete or concealed behind finishing materials and can only be identified during construction. Therefore, pre-handover defects cannot be detected during the final inspections conducted just before the houses are completed. Of course, one could theoretically verify these defects by selecting specific samples, for example, by breaking apart concrete or removing finishing materials. However, doing so would require either the complete reconstruction of the affected section or of an entire room to restore it to its original state. It is practically difficult to conduct such verification.
“Post-handover defects” refer to issues that are not visually apparent at the time of building completion but emerge over time. Typical examples include electrical leakage, peeling of woodwork, and corrosion [20,21]. In Korea, a Supreme Court ruling has established that the new home warranty stipulated under current law serves solely to guarantee against defects that manifest after the handover inspection [22]. Consequently, in cases of post-handover defects and when the project developer becomes insolvent, a remedy can be sought through the new home warranty deposit [17,18]. However, because this warranty does not cover pre-handover defects, they are currently outside the scope of protection. As a result, while post-handover defects constituted the primary subject of litigation in Korea through the mid-2010s, pre-handover defects have emerged as the central issue since the late 2010s. However, empirical research focusing specifically on pre-handover housing defects remains profoundly insufficient even within South Korea. Kim’s study investigated pre-handover defects primarily from a legal perspective [23]. Similarly, Lee’s study classified defect types through case analysis and proposed importance rankings by building component [24]. Nevertheless, these prior works failed to directly address or establish definitive deposit standards for pre-handover housing defects. Therefore, to ensure consumer protection against housing defects, a new home warranty system that specifically addresses pre-handover defects is urgently required.

1.3. Indicator for Warranty

A new home warranty for housing defect repairs is stipulated as a specific percentage of the construction cost. However, it is difficult to ascertain the precise basis upon which individual countries established these regulations. While it is understood that this practice originated as a matter of custom, there are no clear historical records. From an empirical perspective, these warranty deposit amounts were likely determined by the actual costs of repairing housing defects. Consistent with this premise, numerous major prior studies have also frequently examined the ratio of housing defect repair costs relative to total construction costs.
Josephson’s study, focusing on residential housing in Sweden, reported that defect repair costs amounted to approximately 4.4% of construction costs [25]. Hwang, examining residential housing in the United States, reported that contractors spent 2.2% of construction costs on defect repairs [26]. Mills’ study examined cases of defect repair cost claims submitted to the Australian Home Building Warranty Fund, establishing that the repair costs accounted for an average of 4% [27]. According to a study by the Construction Industry Institute, rework costs due to defects are known to account for approximately 2% to 20% of the total construction cost [28]. Forcada’s study on residential housing in Spain suggested that defect repair costs were approximately 2.75% of construction costs [29]. Love’s study analyzed Australian residential properties and found that defect rectification costs amounted to 0.18% of the total construction cost [30]. Liu’s study, which examined residential properties in China, reported that defect rectification costs accounted for approximately 4.95% of construction costs [31]. These prior studies utilized the arithmetic mean of defect rectification costs to assess the severity of residential defects.
Love’s research also employed Pareto analysis to examine the causes of these defects [30]. Another study applied the Pareto technique to classify the types of defects occurring in woodwork within residential complexes. By aggregating the defect types that accounted for over 80% of the total repair costs, the study proposed these as the critical defect types in woodwork [20]. Another prior study proposed a policy indicator adjusted using the arithmetic mean of housing defect repair costs [18]. In that study, the calculated housing defect repair cost amounted to 0.538% of the total construction cost (based on the arithmetic mean). However, taking into account the policy function served by the new home warranty system, the study proposed setting the home warranty at 1% or 1.5% of the construction cost. These findings are summarized in Table 1 below, which illustrates that the indicators predominantly utilized in previous studies have been the arithmetic mean and Pareto analysis (specifically, the 80% cutoff value).
In conventional statistical applications, it is generally critical for empirical distributions to align with or closely cluster around a reference or target baseline value. In contrast, because the primary objective of a housing defect deposit standard is to safeguard homeowners from latent liabilities, cases with low defect frequencies present no systemic concern; rather, establishing comprehensive protection for severe, high-cost scenarios remains the paramount regulatory challenge. Therefore, it is highly rational to structure the baseline framework by targeting the maximum threshold within the statistically normal range of empirical data. Accordingly, this study newly introduces the upper whisker of a box plot as a critical indicator. The box plot upper whisker operates based on the quartile distribution of the entire dataset, which mathematically filters out random, hyper-extreme anomalies. Furthermore, because the box plot upper whisker signifies the most adverse scenario within the statistically normal boundaries of empirical variance, it is substantiated as an optimal metric that realistically reflects the high-risk conditions practically encountered in the real world. These three indicators are widely utilized in practice, making them easily understandable for both policymakers and field managers. Furthermore, considering the institutional and regulatory aspects of housing defect warranty frameworks, utilizing highly intuitive metrics is far more rational than relying on highly complex statistical models.
As shown in Table 1, prior studies present findings from statistical analyses of case data on housing defect repairs. These empirical data values may be considered appropriate as a reference standard for actual defects. However, the complex values extending to decimal places are not intuitive. New home warranty systems for housing defects in various countries typically use simplified benchmarks, such as 3% or 5% of the total construction cost. That is to be effectively utilized within a regulatory framework, it is logical to simplify these reference values and employ them as “adjusted policy indicators.” Accordingly, this study incorporates three additional values derived from an analysis of empirical data, which have been simplified and adjusted as policy indicators. These values were simplified by rounding up the results of the original statistical analysis. In summary, this study proposes six distinct indicators to determine the applicable new home warranty at the pre-handover stage. By comparing the new home warranty calculated using these indicators against empirical repair costs, this study aims to identify the most rational and optimal alternative.
The primary objective of this study is to empirically determine what percentage of the construction cost must be reserved as the defect repair deposit for pre-handover defects within the new home warranty framework, thereby proposing a rational and actionable standard. To systematically achieve this objective, this research addresses four sequential and interrelated research questions:
Research Question 1: What is the actual financial scale of pre-handover defect repair costs in real-world new home projects? To resolve this, this study empirically analyzes a comprehensive dataset of actual litigation cases to determine the authentic baseline of defect rectification expenditures.
Research Question 2: What relative proportion of the total construction cost do these identified pre-handover defect repair costs represent? This question evaluates the quantitative level of repair costs relative to the construction contract value to transition raw financial data into an institutional metric.
Research Question 3: What are the characteristics of the six proposed alternatives derived from the statistical analysis of these ratios, which include three statistical alternatives (the arithmetic mean, the upper bound of the 80% cumulative frequency interval, and the upper whisker of a box plot) and three corresponding policy indicators?
Research Question 4: Which of the six proposed alternatives demonstrates the highest rationality and empirical robustness? This final question cross-validates and compares the feasibility of the alternatives utilizing separate, independent verification cases.
By operating through this interconnected, four-tier research framework, a validated standard for the pre-handover defect repair deposit is firmly established. Ultimately, this systematic approach serves as a cornerstone to practically protect new homeowners, while establishing a specific, appropriate, and mutually acceptable threshold for the new home industry.

2. Materials and Methods

2.1. Object and Scope

The subject of this study comprises newly constructed residential properties in Korea sold through pre-sale offerings. Given that multi-family housing constitutes the vast majority of residential properties in Korea, these dwellings are the specific focus of this research. The cases examined here involve homeowners who have filed lawsuits against housing developers to demand repairs for defects, specifically cases in which a first-instance court ruling has been rendered and the costs of such repairs have been definitively determined. In Korea, it is rare for a single homeowner (representing a single household or unit) to file a defect-related lawsuit independently. Instead, such litigation typically takes the form of a class action involving most of the complex’s homeowners. Consequently, each individual “case” analyzed in this study should be understood as encompassing an entire multi-family housing complex.
Meanwhile, housing defects are defined as issues investigated by experts appointed by a Korean court and subsequently deemed to be the result of the housing developer’s negligence [18]. These experts, referred to as court appraisers, are selected by the court from a pool of individuals who hold professional qualifications in fields such as housing design and construction and who possess extensive experience and professional credentials [18]. After investigating the housing defects over several months, the court appraiser determines the existence and nature of the defects, calculates the necessary repair methods and costs, and submits a report to the court. Furthermore, the court renders a final judgment after reviewing the evidentiary materials and statements submitted by both the homeowner and the housing developer [17].
Defects are categorized based on the timing of their occurrence: those arising during the pre-handover and post-handover stages. The criterion for this distinction is applied to cases where construction was executed in strict accordance with the design, appearing free of issues at the time of completion, but problems gradually manifest over time. Defects that are readily visible and easily identifiable even by an ordinary person, such as concrete cracks, the dieback of landscaping trees, or plumbing leaks, typically fall under the category of post-handover defects.
Defects are classified as “pre-handover defects” if the installation deviates from statutory standards or the design. This category primarily encompasses instances of “non-installation” where an item was omitted entirely and “defect on differences from drawings or specifications” where the material, location, or detailed specifications differ from the original plan. It also includes “design defects,” wherein flaws inherent in the design itself lead to problems. This study focuses exclusively on pre-handover defects. Therefore, the terms “defect repair costs” and “new home warranty” discussed hereafter refer specifically to those associated with pre-handover defects.
Meanwhile, different countries use different terminology for new home warranties. This appears to stem from cultural differences or variations in associated legal attributes. The United States refers to this concept as a “warranty” or “bond” [11,12], whereas Spain and Korea designate it as a “guarantee” [13,16]. Furthermore, differences exist regarding the timing and scope of the warranty. In the United States, it is termed “retainage” or “retention,” and it applies from the construction phase through a certain period following completion [11,12]. In Korea, the term “deposit” is used. However, regulations stipulate that this excludes the construction phase and applies only from completion onward [16]. Since the defect repair warranty examined in this study pertains to newly constructed homes, it is referred to herein as a “new home warranty.” Also, because the security deposit applies only from the time of completion, it is designated as a “defect repair deposit.”

2.2. Data Collection

In this study, data on housing defect litigation were collected and categorized into two sets: a foundational dataset (training data) to establish standards and a validation dataset for comparative verification. Both datasets consist of court judgments documenting first-instance rulings. The court judgments were obtained from attorneys handling residential defect litigation and their supporting technical firms. Although a total of 474 cases were initially collected for the foundational dataset, it was determined that only 238 contained complete information on both housing construction costs and costs incurred during the pre-handover stage. The analysis described hereafter was conducted using this subset of 238 cases. Additionally, a separate set of 20 cases was collected to serve as the validation data.
From the collected court rulings, it is possible to calculate the housing construction costs and the defect repair costs incurred during the pre-handover stage. Although the defect repair costs incurred during the pre-handover stage are subsumed within the total defect repair costs, they can be calculated by examining the detailed breakdown of the summation process provided in the court rulings. While housing construction costs are not explicitly stated in the court rulings, they can be determined if the new home warranty applicable at the post-handover stage is specified [17]. In Korea, the new home warranty applicable during post-handover is fixed at 3% of the housing construction costs. Thus, it is calculated as shown in Equation (1) below. Accordingly, the construction costs can be derived through a reverse calculation, as illustrated in Equation (2). These construction costs do not include land acquisition costs. Rather, they reflect only the expenses directly invested in the construction itself.
Defect repair deposit = Construction cost × 3%
Construction cost = Defect repair deposit ÷ 3%
Meanwhile, in housing defect litigation, the monetary amounts vary because the lawsuits were filed at different times. Furthermore, Korean courts require that defect repair costs be calculated based on the year the lawsuit was initiated [19]. Consequently, the monetary values of both the original construction costs and the defect repair costs in each case must be adjusted to a specific reference timing. In this study, these values are converted to future values, as shown in Equation (3) below, using a reference date of 31 December 2025. The n value represents the time difference between the reference date and the actual lawsuit filing date, and the Korean treasury bond interest rate was quoted at 2.953%. To present all tables and graphs in this study in U.S. dollars, an exchange rate of 1467.4 KRW per 1 USD, as of 31 December 2025, was applied [32].
F u t u r e   V a l u e = P r e s e n t   V a l u e × ( 1 + i ) n

2.3. Comparison Method

Various countries set the new home warranty as a specific percentage of total housing construction costs [11,12,13,14,15,16]. In addition, numerous prior studies have utilized the ratio of defect repair costs to construction costs as an indicator for comparing housing quality [17,18,23,24,25,26,27]. Therefore, employing the same methodology, the present study proposes a standard for the defect repair deposit for pre-handover defects, defined as a percentage of the construction cost. This can be calculated as shown in Equation (4) below:
Defect repair deposit = Construction cost × Deposit ratio (%)
This study proposes six detailed indicators as potential alternatives to recommend the most rational option among them to serve as the standard for a new home warranty for pre-handover defects. These indicators consist of the arithmetic mean, the 80% cutoff value, and the upper whisker from a box plot, all of which are derived through statistical analysis of the foundational data, along with three corresponding policy indicators that have been simplified and adjusted. Basic statistical values, including the arithmetic mean, were calculated using IBM SPSS Statistics version 21. To determine the 80% cutoff value, a Pareto chart was generated using MS Excel. The zone exceeding the 80% cutoff value was identified, and the maximum value was obtained for that zone. The cumulative percentage up to the top k intervals can be calculated as in Equation (5). Similarly, the upper whisker of the box plot was generated using MS Excel to identify the maximum value. The upper whisker (Q4) of the box plot can be determined using Equation (6), where Q3 represents the third quartile, Q1 represents the first quartile, and the InterQuartile Range (IQR) is calculated using Equation (7). The three policy indicators were adjusted by rounding them up to an appropriate level. This can be verified in Section 4.2.
P k = ( i = 1 k f i i = 1 m f i ) × 100   ( % ) ( k = 1 , 2 , 3 , , m )
Upper whisker (Q4) = Q3 + (1.5 × IQR)
IQR = Q3 − Q1
Once the values for these six detailed indicators are derived from the foundational data, they are compared against validation data to verify their appropriateness. The following describes the methodology employed for this validation process.
(1)
Comparison 1: Deposit Coverage Rate per Case
For each case within the validation dataset, the warranty is calculated for the detailed indicators specific to each alternative. This figure is then compared against the actual defect repair costs to verify whether the warranty exceeds the repair costs. If the warranty exceeds the repair costs, the outcome can be considered safe at the level of individual cases. If the repair costs exceed the warranty, the situation can be risky. The ratio of cases in which the warranty exceeds the repair costs compared to the total number of cases is defined as the “individual case coverage rate.” This relationship is expressed mathematically in Equation (8). These individual case coverage rates are used to compare the various alternatives. However, since the warranty system does not operate on a strictly case-by-case basis, it is also necessary to verify at the aggregate level. This step is performed in the following stage.
D e p o s i t   C o v e r a g e   R a t e   p e r   C a s e = Number   of   deposit-coverd   cases Total   number   of   cases × 100   ( % )
(2)
Comparison 2: Aggregate Deposit Coverage Rate
Across the entire validation dataset, the aggregate warranty for each alternative is compared with the aggregate actual defect repair costs. Even if the warranty for an individual case falls somewhat short of the repair costs, if there is no shortage across the entire dataset, the system is operational and thus does not harm homeowners. If an alternative yields an aggregate warranty lower than the aggregate actual repair costs, we cannot expect that alternative to function effectively as a warranty system. Comparisons are conducted for each alternative by using the ratio of aggregate warranty costs to aggregate defect repair costs across all cases. This relationship is mathematically expressed in Equation (9).
Aggregate   Depost   Covergate   Rate = Total   amount   of   deposits Total   amount   of   defect   repair   costs × 100   ( % )
(3)
Comprehensive Evaluation Criteria
By compiling the results of the comparison between the two aforementioned indicators, the most rational alternative is derived. The optimal alternative is expected to be the scenario in which the warranty exceeds the defect repair costs, whether considered on a case-by-case basis or in aggregate. As a secondary option, though it cannot protect every individual case, if protection can be ensured at the aggregate level, an appropriate standard may be selected from among the available options.
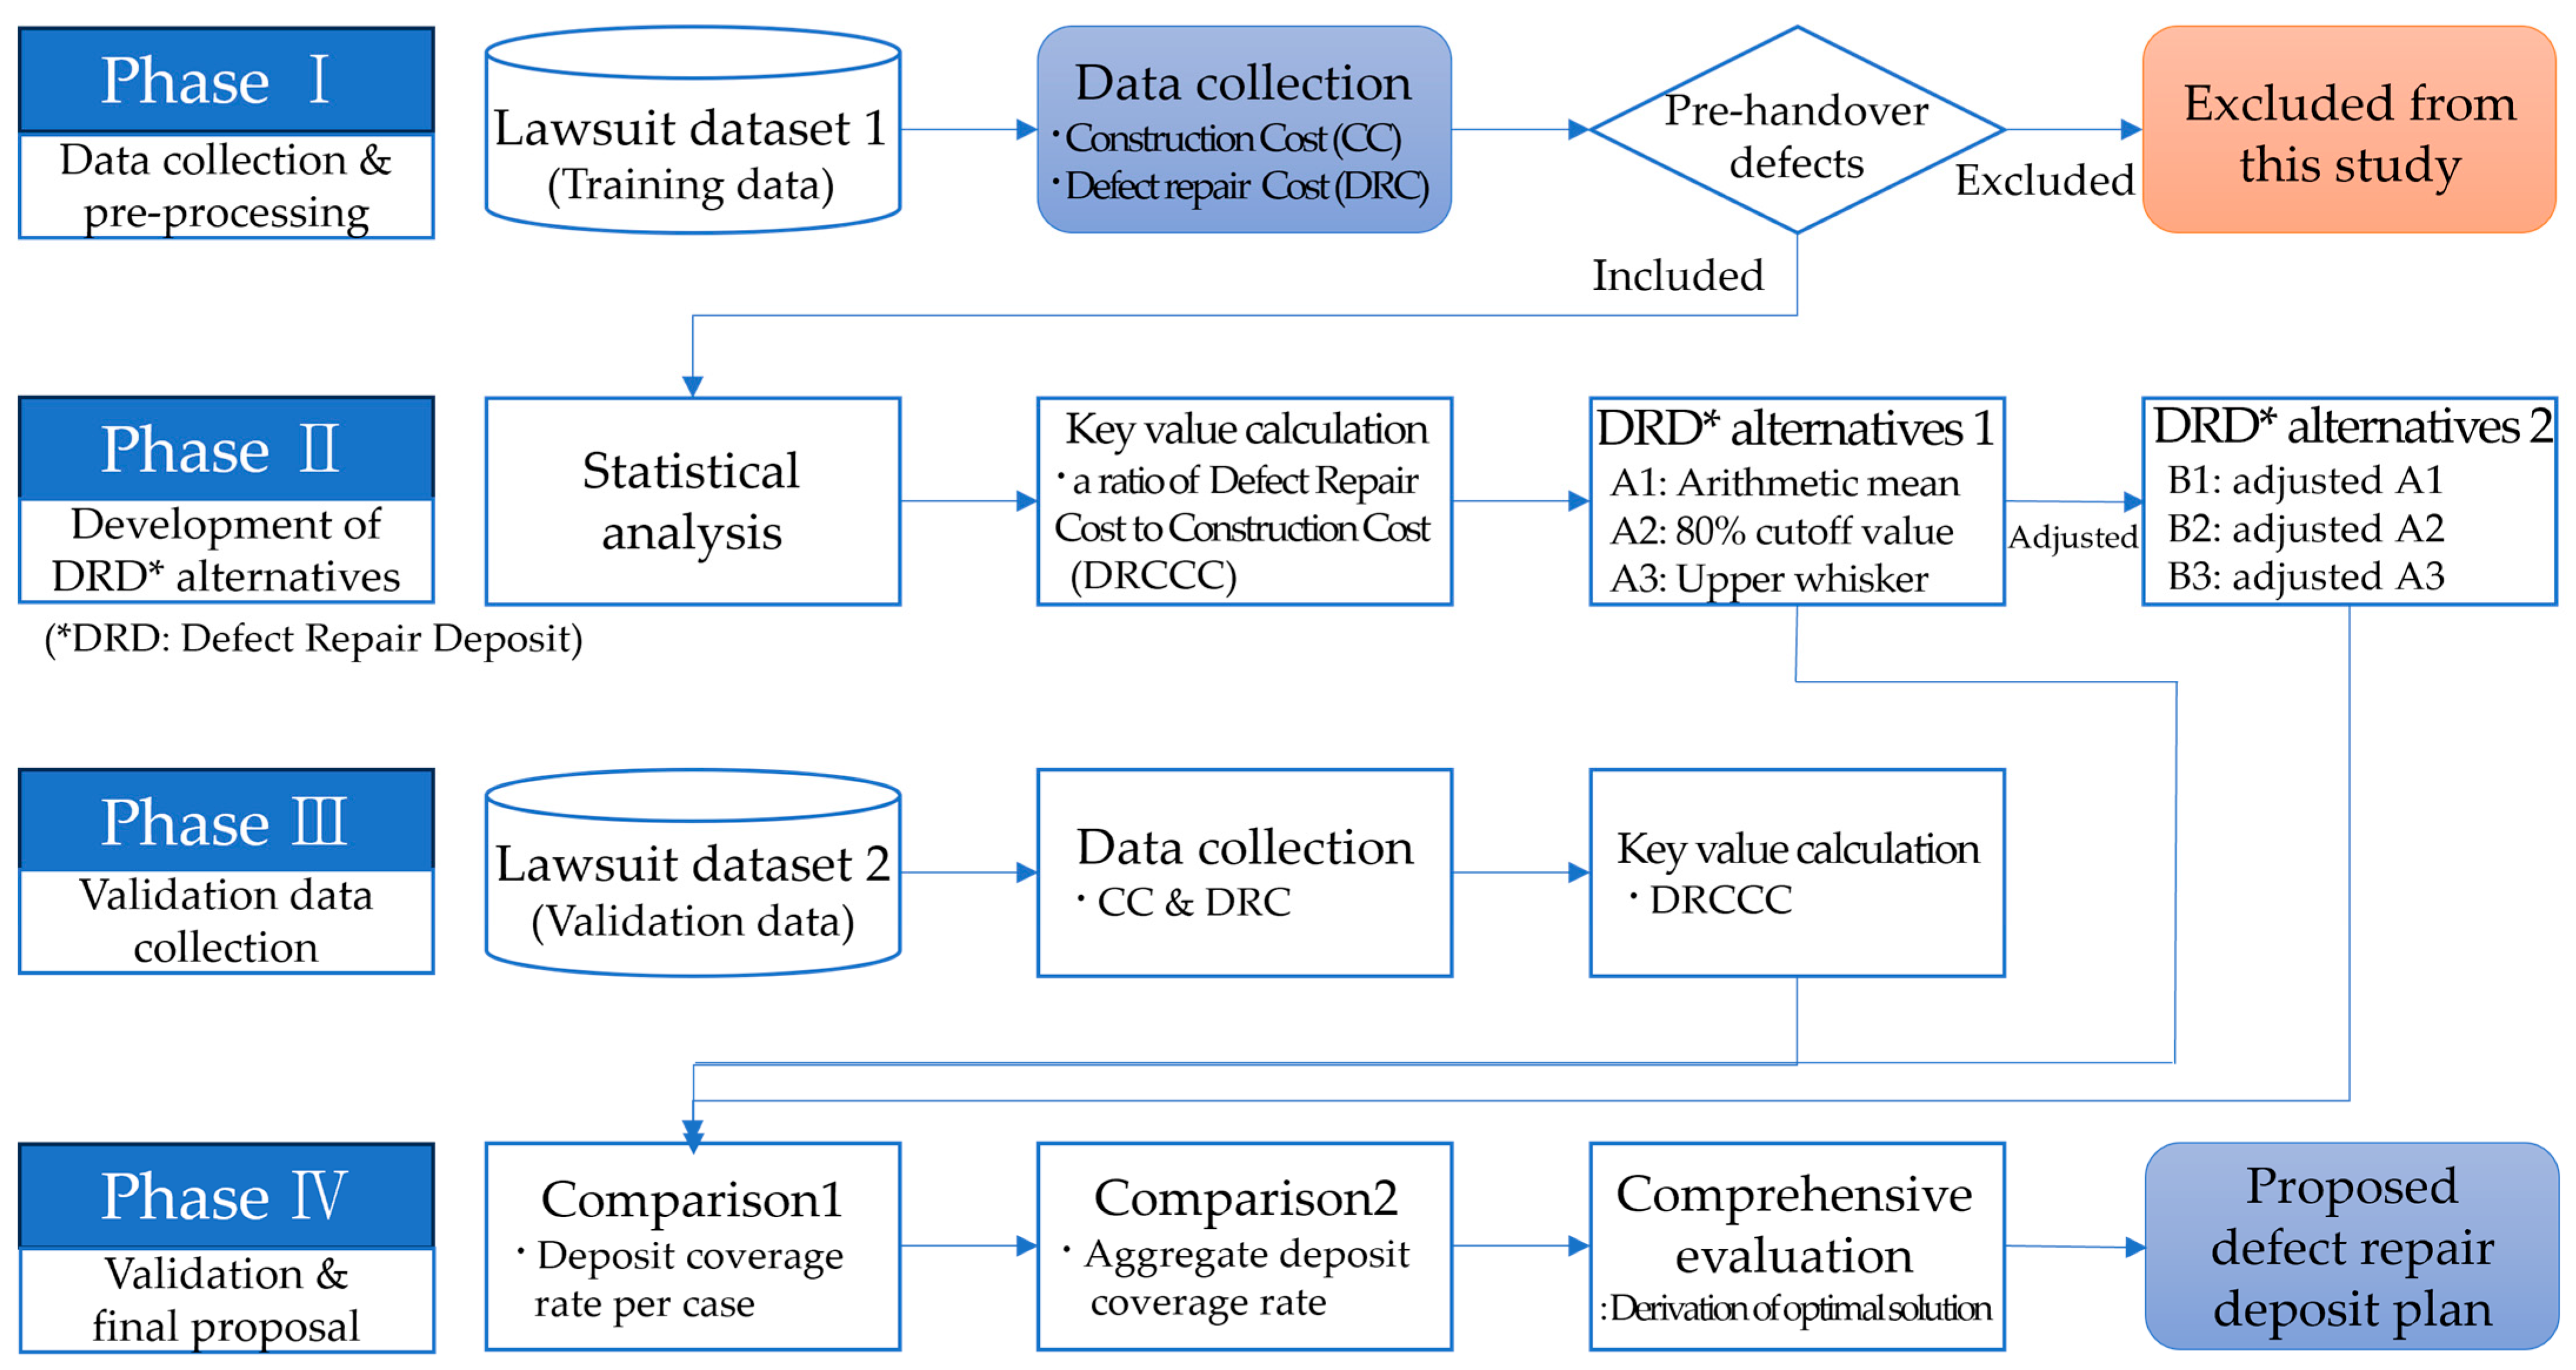
Figure 1 below presents a sequential summary of the research methodology outlined above.
(1)
In Phase I, basic data is collected to verify information regarding housing construction costs and defect repair costs; cases with no pre-handover defect repair costs are excluded, and only those cases involving such pre-handover defect repair costs incurred are selected as subjects for analysis.
(2)
In Phase II, the housing construction cost and defect repair cost data collected above are utilized. The repair cost ratio is obtained by dividing the construction cost by the defect repair cost. From these results, the arithmetic mean, the 80% cutoff value, and the upper whisker of the box plot are calculated. Additionally, three policy indicators, which are adjusted based on these calculated values, are established.
(3)
In Phase III, information on housing construction costs and defect repair costs from validation data is extracted, and the ratio of defect repair costs to construction costs is calculated.
(4)
In Phase IV, the six alternatives are compared using the ratios of defect repair costs to construction costs derived from verification data. By consolidating the warranty rates for individual cases and the aggregate warranty rates, the optimal alternative is selected and proposed as the basis for the new home warranty for pre-handover defects.

3. Results

3.1. Outline

The primary data collected to formulate alternatives for the new home warranty system in this study pertained to 238 apartment complexes completed between 1999 and 2015. Defect-related lawsuits concerning these complexes were filed between 2007 and 2019, with first-instance judgments pronounced between 2010 and 2021. On average, it took approximately two years and two months to reach a verdict.
As shown in Table 2 below, an examination of the housing construction costs and defect repair costs for these projects resulted in a total construction cost of $37,675,000, with an average of $158 million. The total defect repair cost was $97,063, with an average allocation of $408,000. Using these figures to calculate the ratio of defect repair costs to construction costs, the arithmetic mean was 0.3129%, with a minimum of 0.0063% and a maximum of 2.6041%. The 95% confidence interval for the mean ranges from 0.2703% to 0.3556%. Of these values, the arithmetic mean of 0.3129% was adopted as the first alternative indicator for this study.

3.2. Deduction on Defect Indicators

(1)
Pareto analysis
The results of the statistical analysis conducted to establish the criteria for the home warranty in the pre-handover stage can be confirmed through the following Pareto chart and box plot.
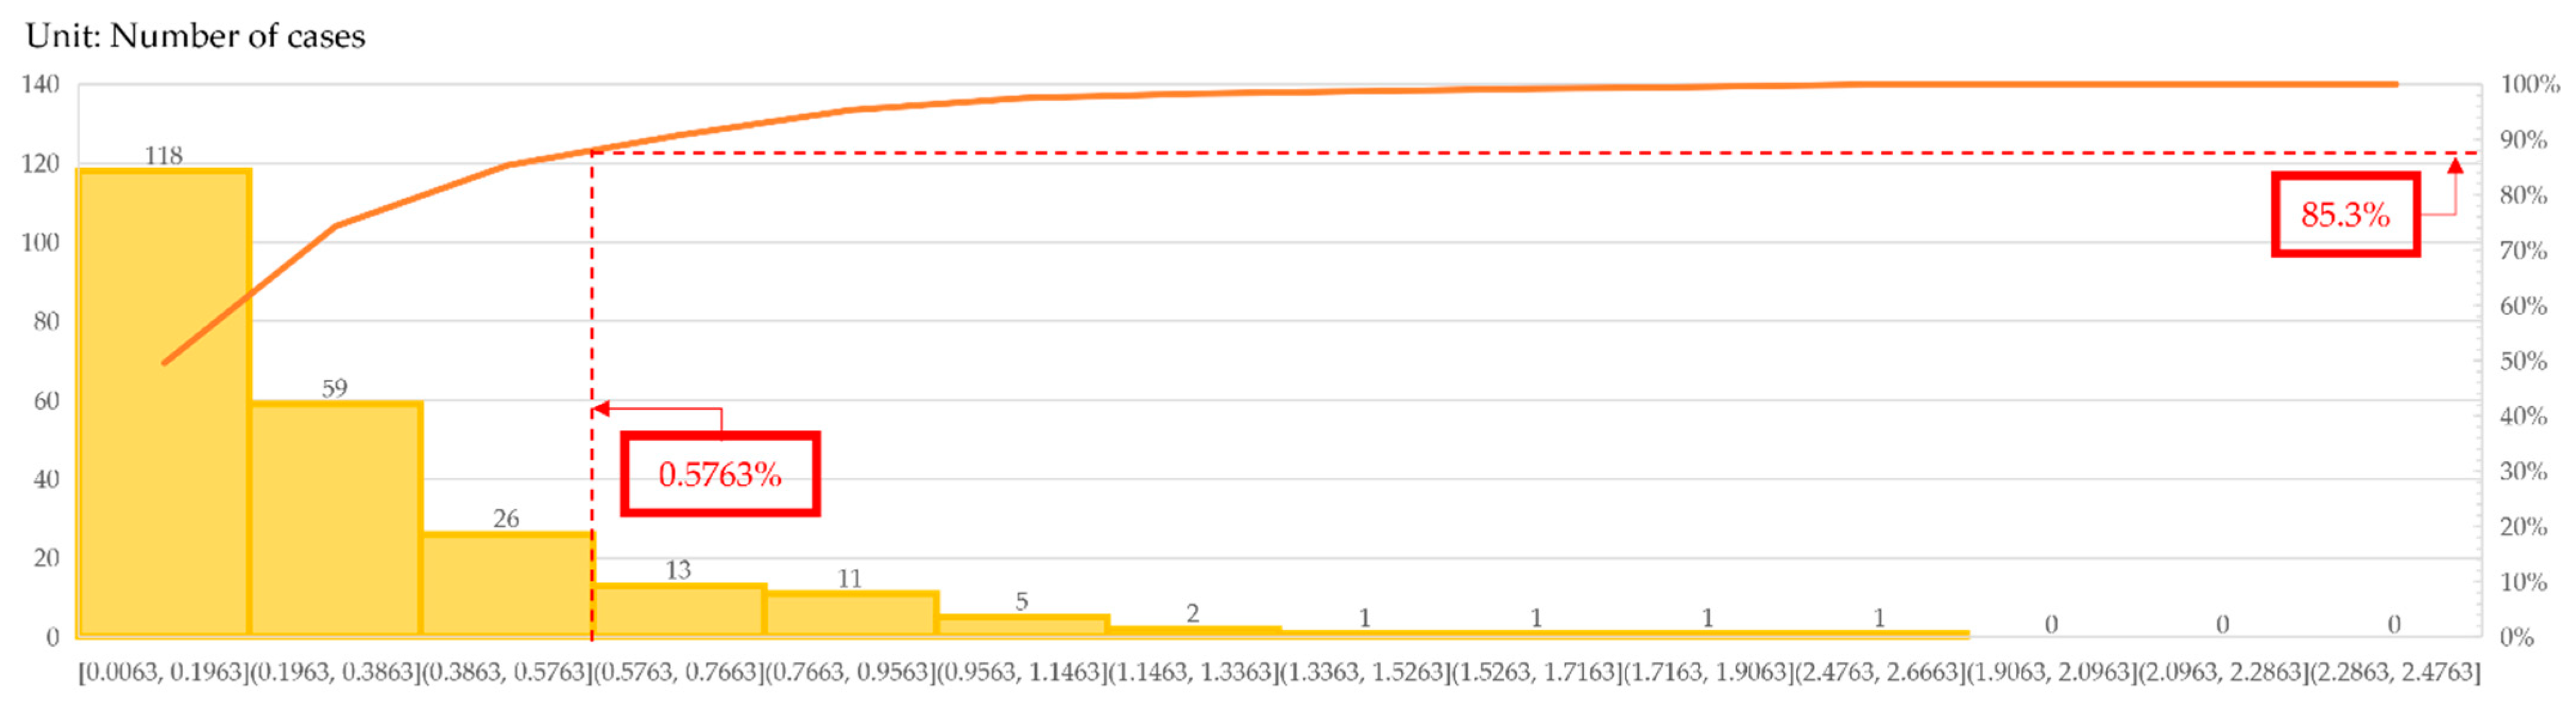
The Pareto analysis results are presented in Figure 2. A Pareto chart consists of a histogram in which the bars are arranged in descending order of frequency. In this case, the cumulative number of cases within the top three categories totaled 203, accounting for 85.3% of the total 238 cases. Since these top three categories alone exceed the 80% cutoff, the data demonstrate a typical Pareto distribution. The second alternative proposed in this study is defined as the 80% cutoff value in the Pareto analysis. Thus, as shown in Figure 2, the maximum value in the third zone is 0.5763%. If this ratio, 0.5763% of the total construction cost allocated for defect repairs, were to be established as the standard for the warranty, it would imply that, based on the available data, the warranty would be sufficient to fully cover the defect repair costs for 85.3% of the cases.
(2)
Box plot analysis
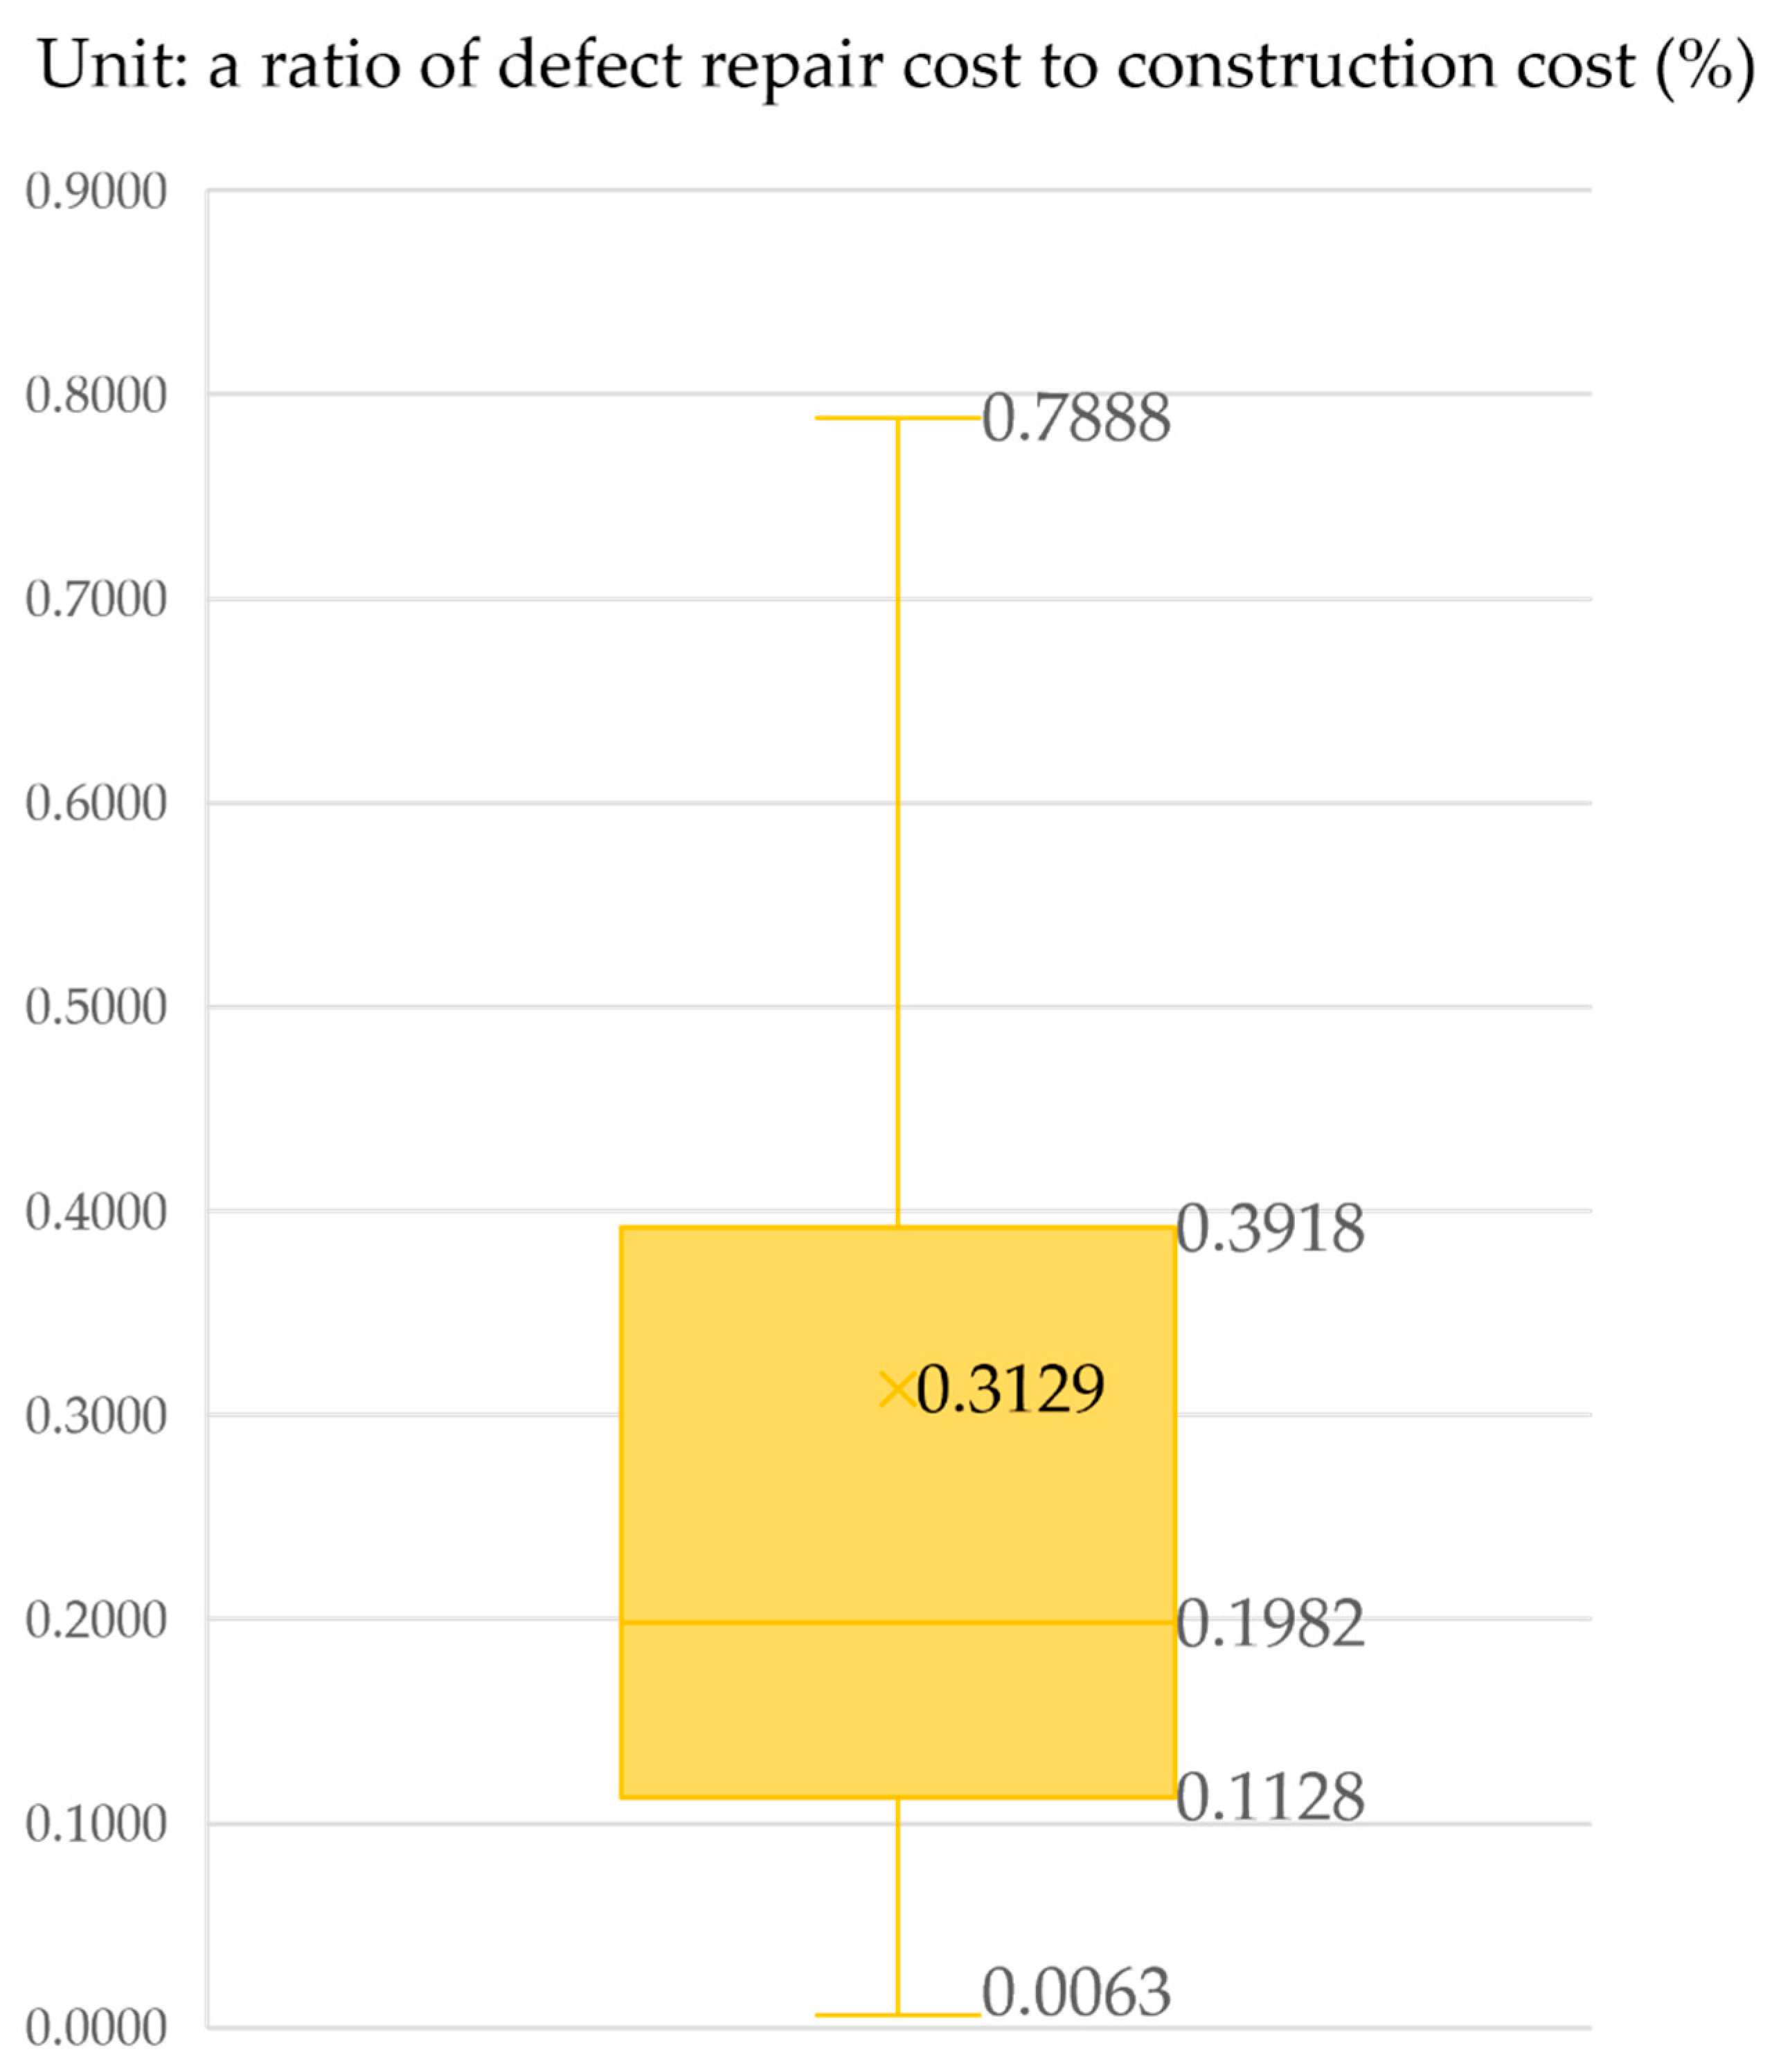
Next, the results of the box plot analysis are displayed in Figure 3. As shown in Figure 3, the arithmetic mean is 0.3129%. After excluding outliers, the minimum value within the normal range is 0.0063%. The arithmetic mean was previously confirmed in Table 2, and the maximum value of 0.7888% was identified through the box plot analysis. It will be utilized as the third alternative in this study.
(3)
Deposit indicators and detailed values
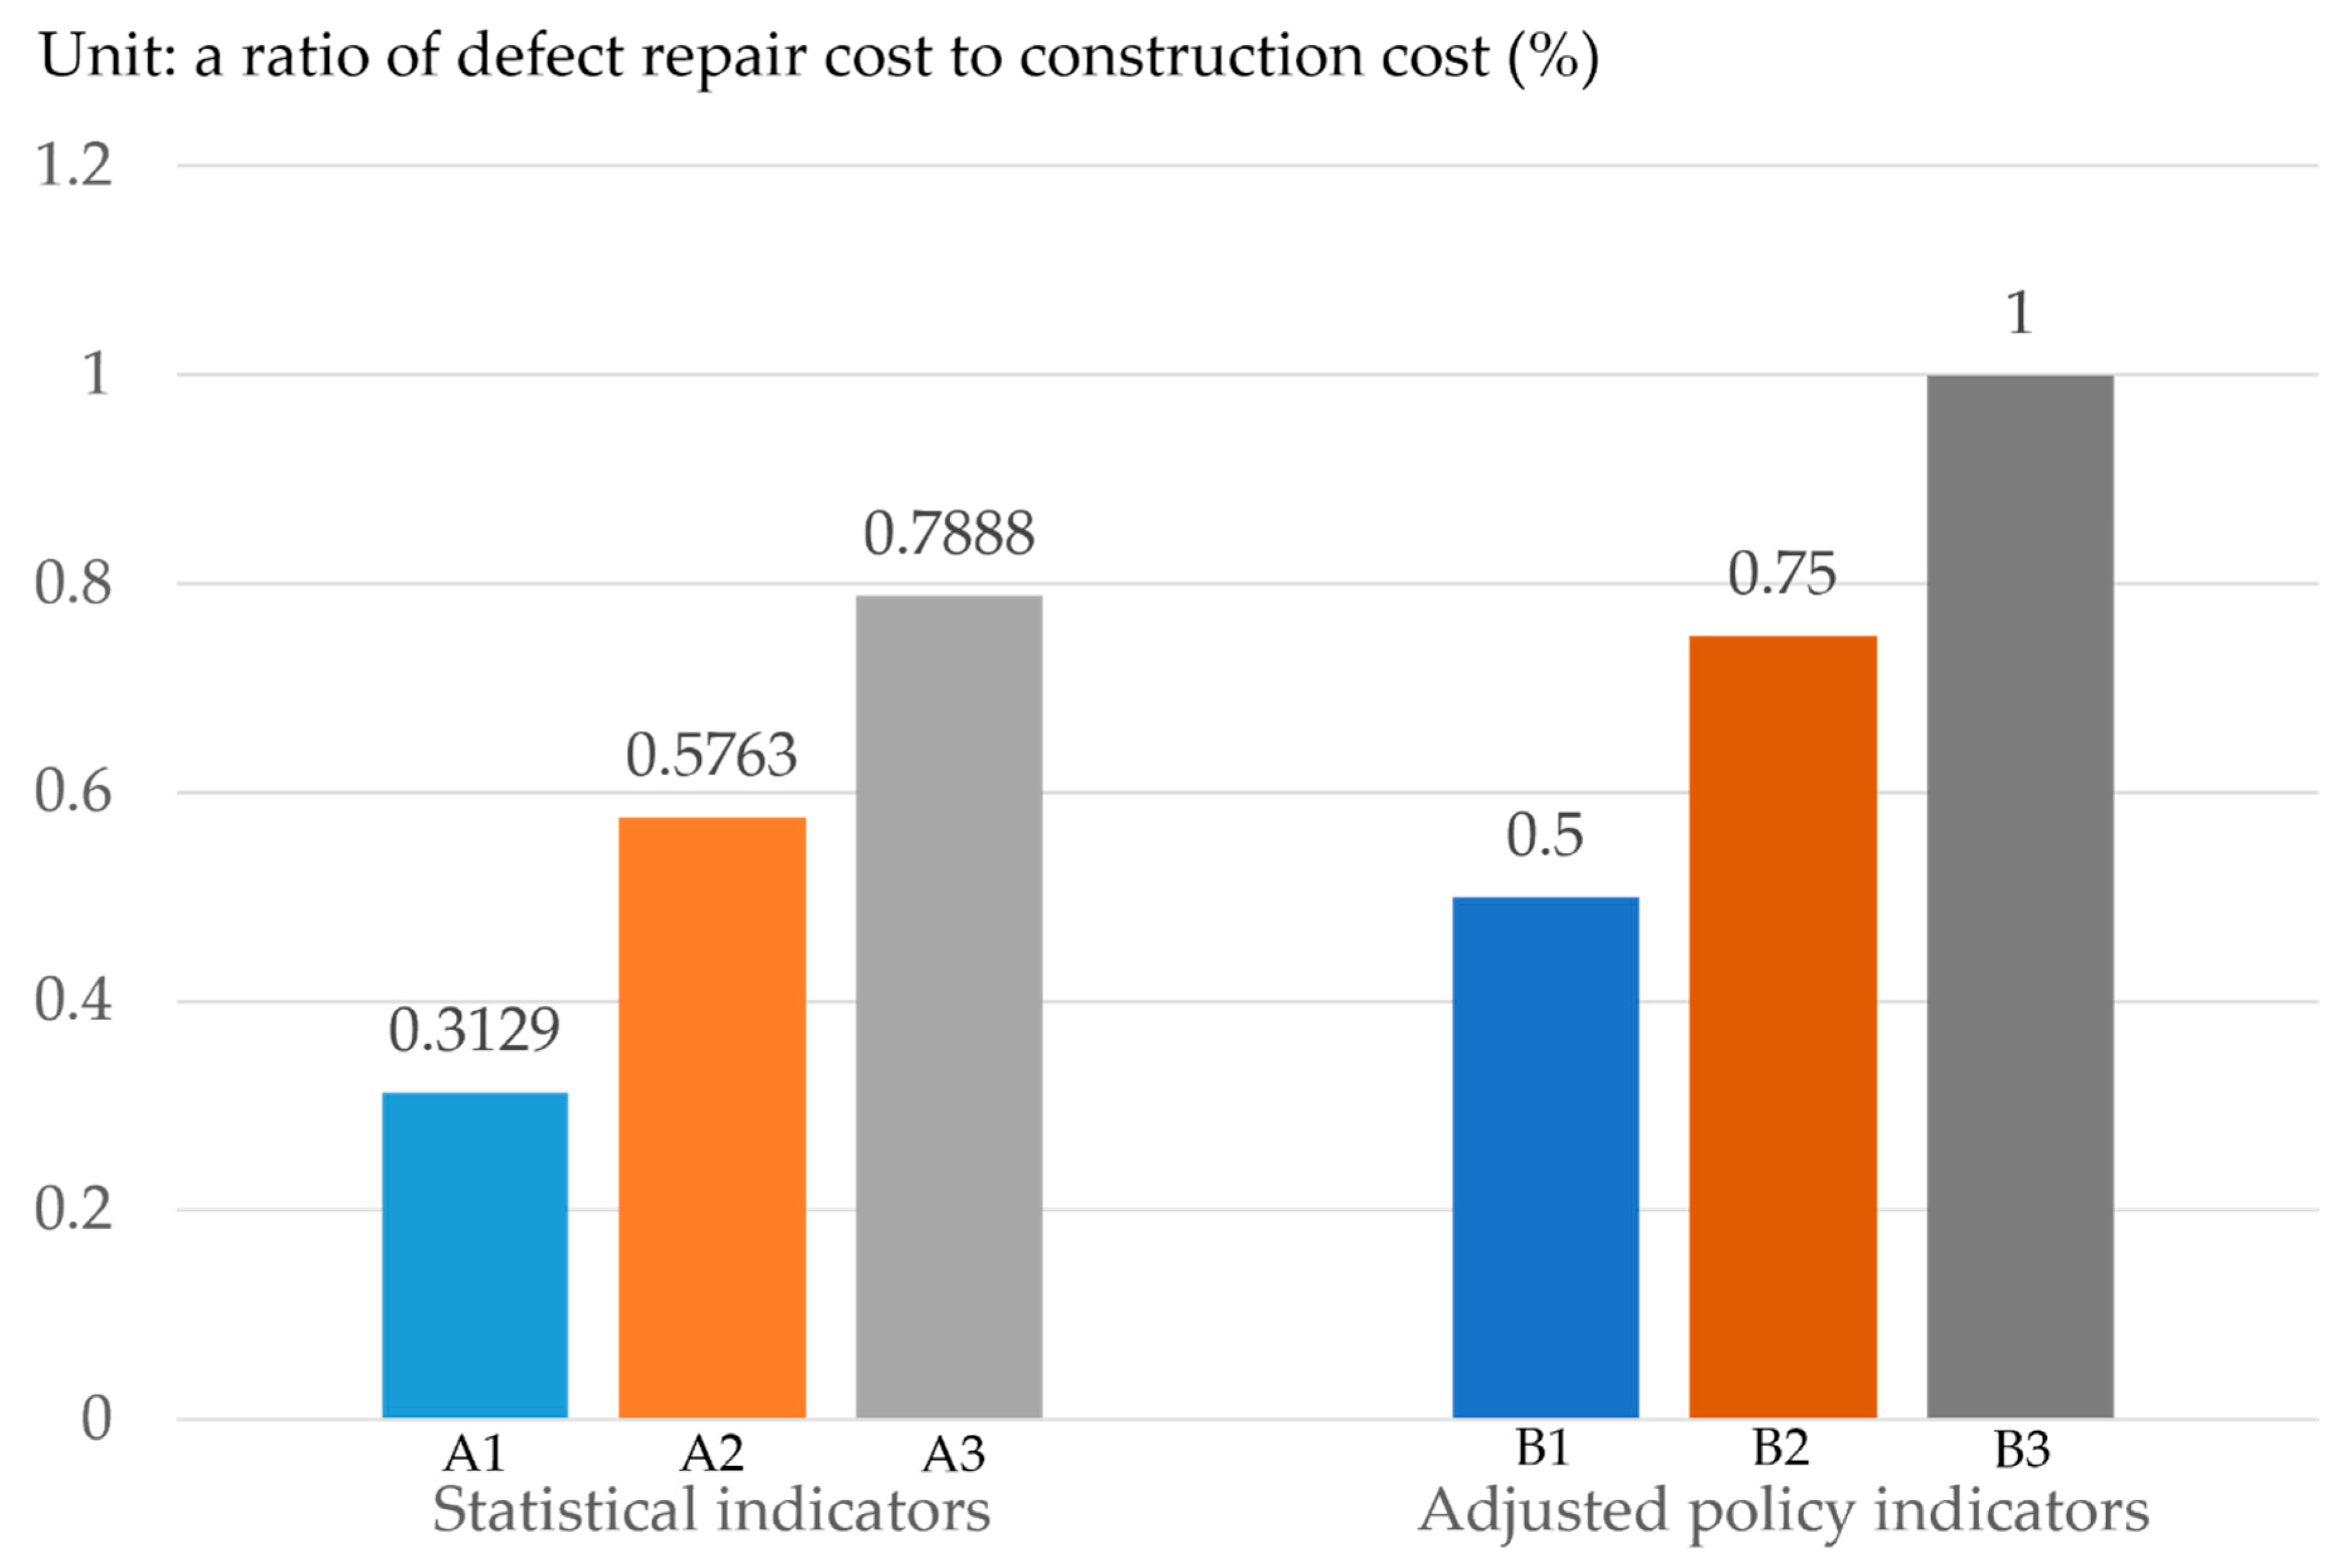
Summarizing the results of the analysis of the aforementioned foundational data, the arithmetic mean is 0.3129%, the 80% cutoff is 0.5763%, and the upper whisker in the box plot is 0.7888%. The alternatives derived from these statistical analyses are designated as A1, A2, and A3, respectively. In addition, the corresponding policy indicators, established by incorporating a certain margin of allowance, are designated as B1, B2, and B3. The policy indicator B1, corresponding to the arithmetic mean (A1) of 0.3129%, is set at 0.5%. The policy indicator B2, corresponding to the 80% cutoff value (A2) of 0.5763%, is set at 0.75%. The policy indicator B3, corresponding to the upper whisker from the box plot analysis (A3) of 0.7888%, is set at 1%. Accordingly, specific values have been established for the six alternatives to be used in this study as warranty standards for defects in housing units during the pre-handover stage. These values are presented in Figure 4 below.
(4)
Comparison 1: training data
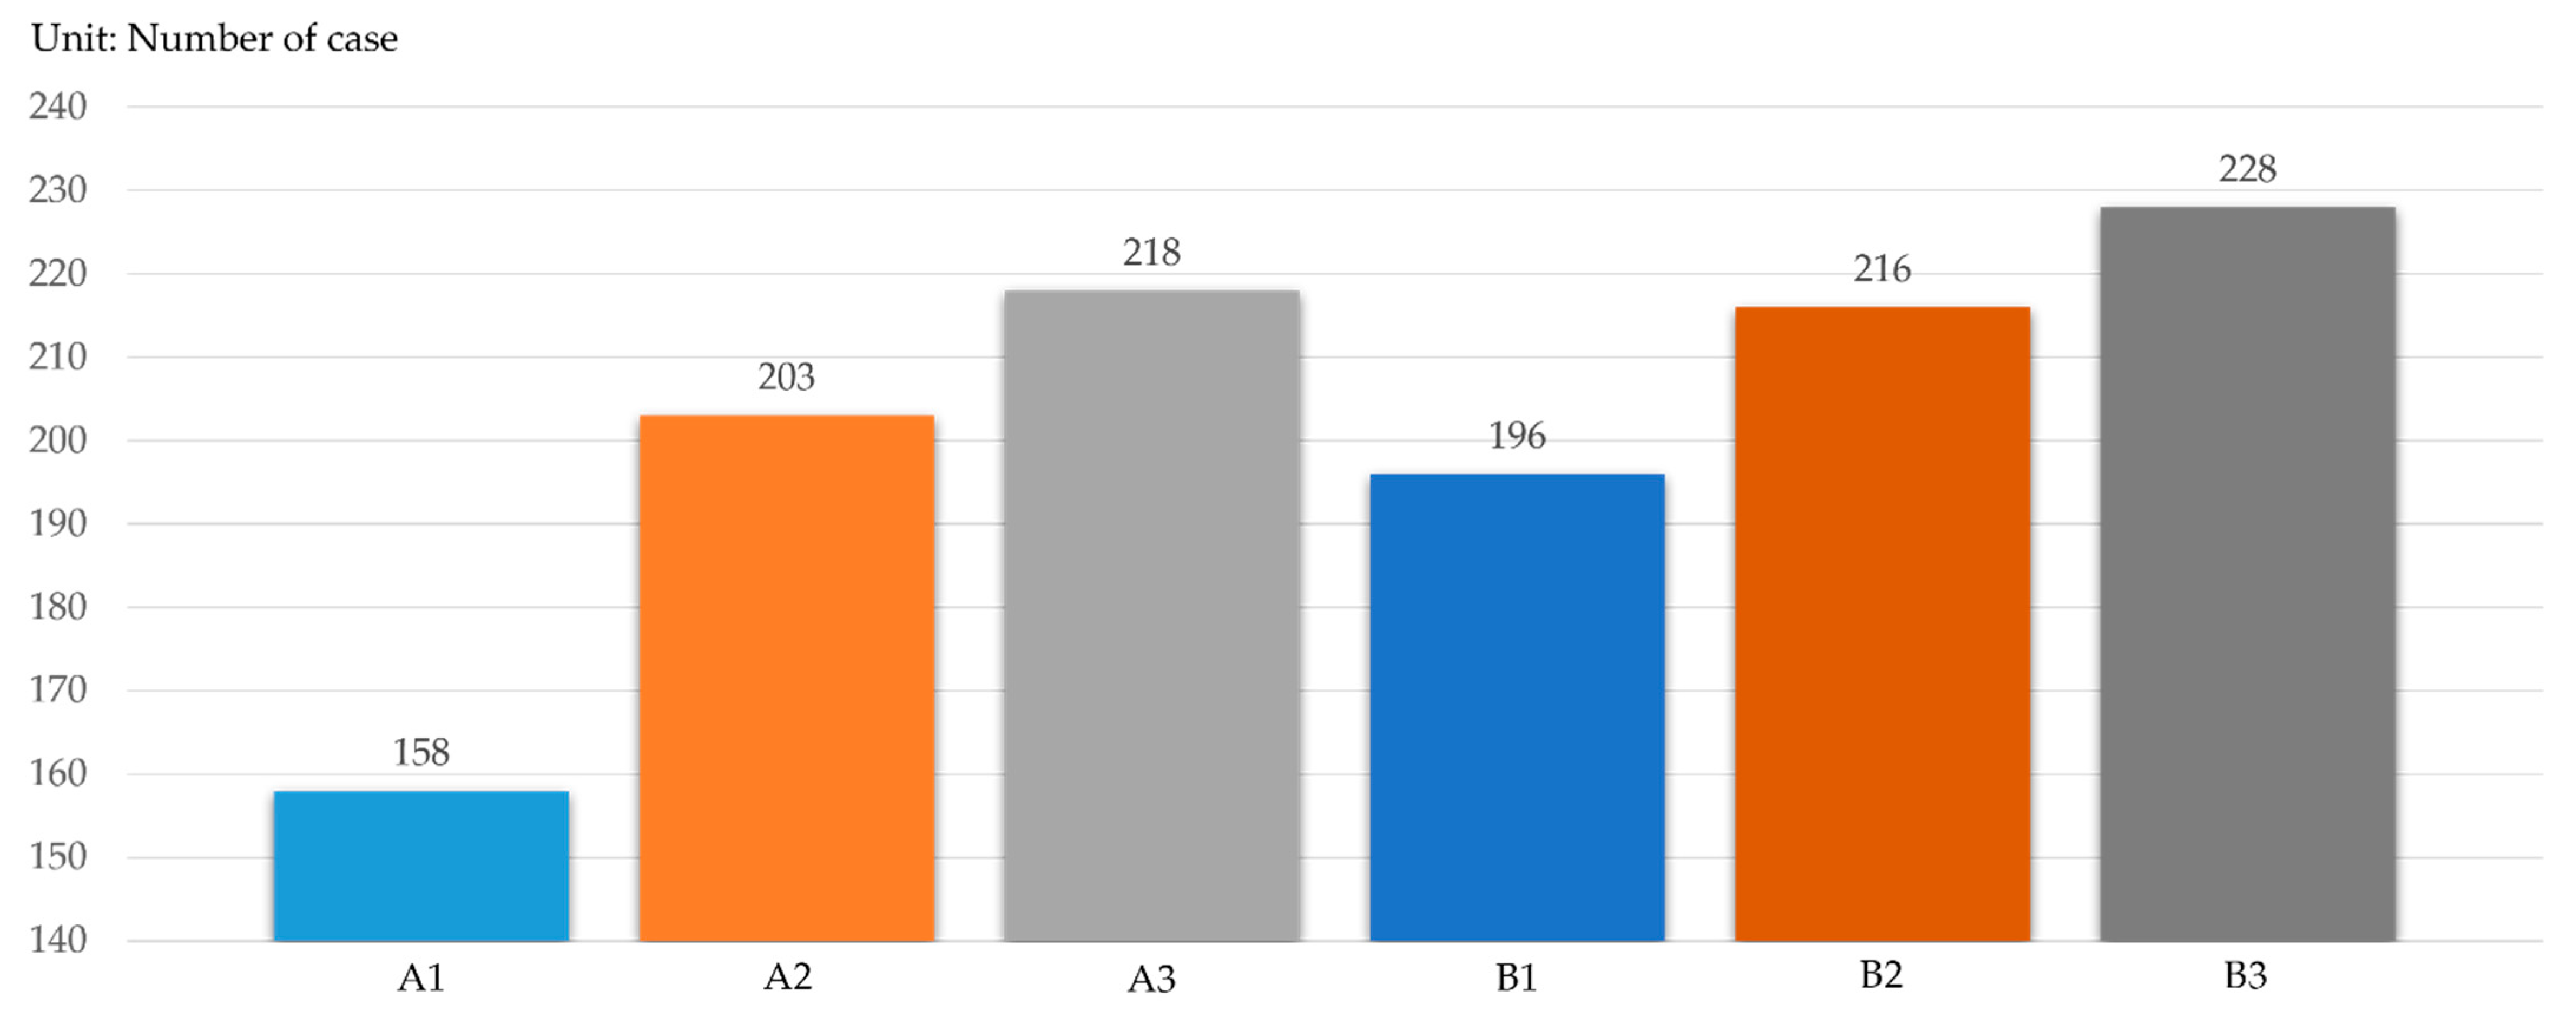
As illustrated in Figure 5, when evaluating indicator values for each alternative based on the warranty, there are cases in which the warranty exceeds the actual defect repair costs. Specifically, for Alternative A1, which represents the lowest level, there were 158 cases in which the warranty exceeded the actual repair costs. This implies that if the arithmetic mean of the defect repair cost-to-construction cost ratio from the baseline scenario (0.3129%) is used as the standard for the warranty, it would exceed the actual repair costs in 158 of the 238 cases. In other words, if A1 is applied based on the warranty, it exceeds the actual defect repair costs in 158 out of 238 cases, implying that full protection is possible for all of these cases. When calculated as an individual-case protection rate using the aforementioned Equation (8), this figure is 66.4%. Thus, under A1 applied on a warranty standard, 66.4% of all cases are fully protected, while the remaining 33.6% receive only partial protection.
Meanwhile, for B3, which exhibits the highest level, the warranty exceeded the actual cost of defect repairs in 228 cases. When applying a 1% warranty standard to the construction cost in these cases, the warranty would be sufficient to cover the defect repair costs in 228 of the 238 cases. Viewed in terms of individual case coverage ratios, applying the B3 standard implies that 95.8% of all cases would be fully covered, while the remaining 4.2% would receive only partial coverage.
(5)
Comparison 2: training data
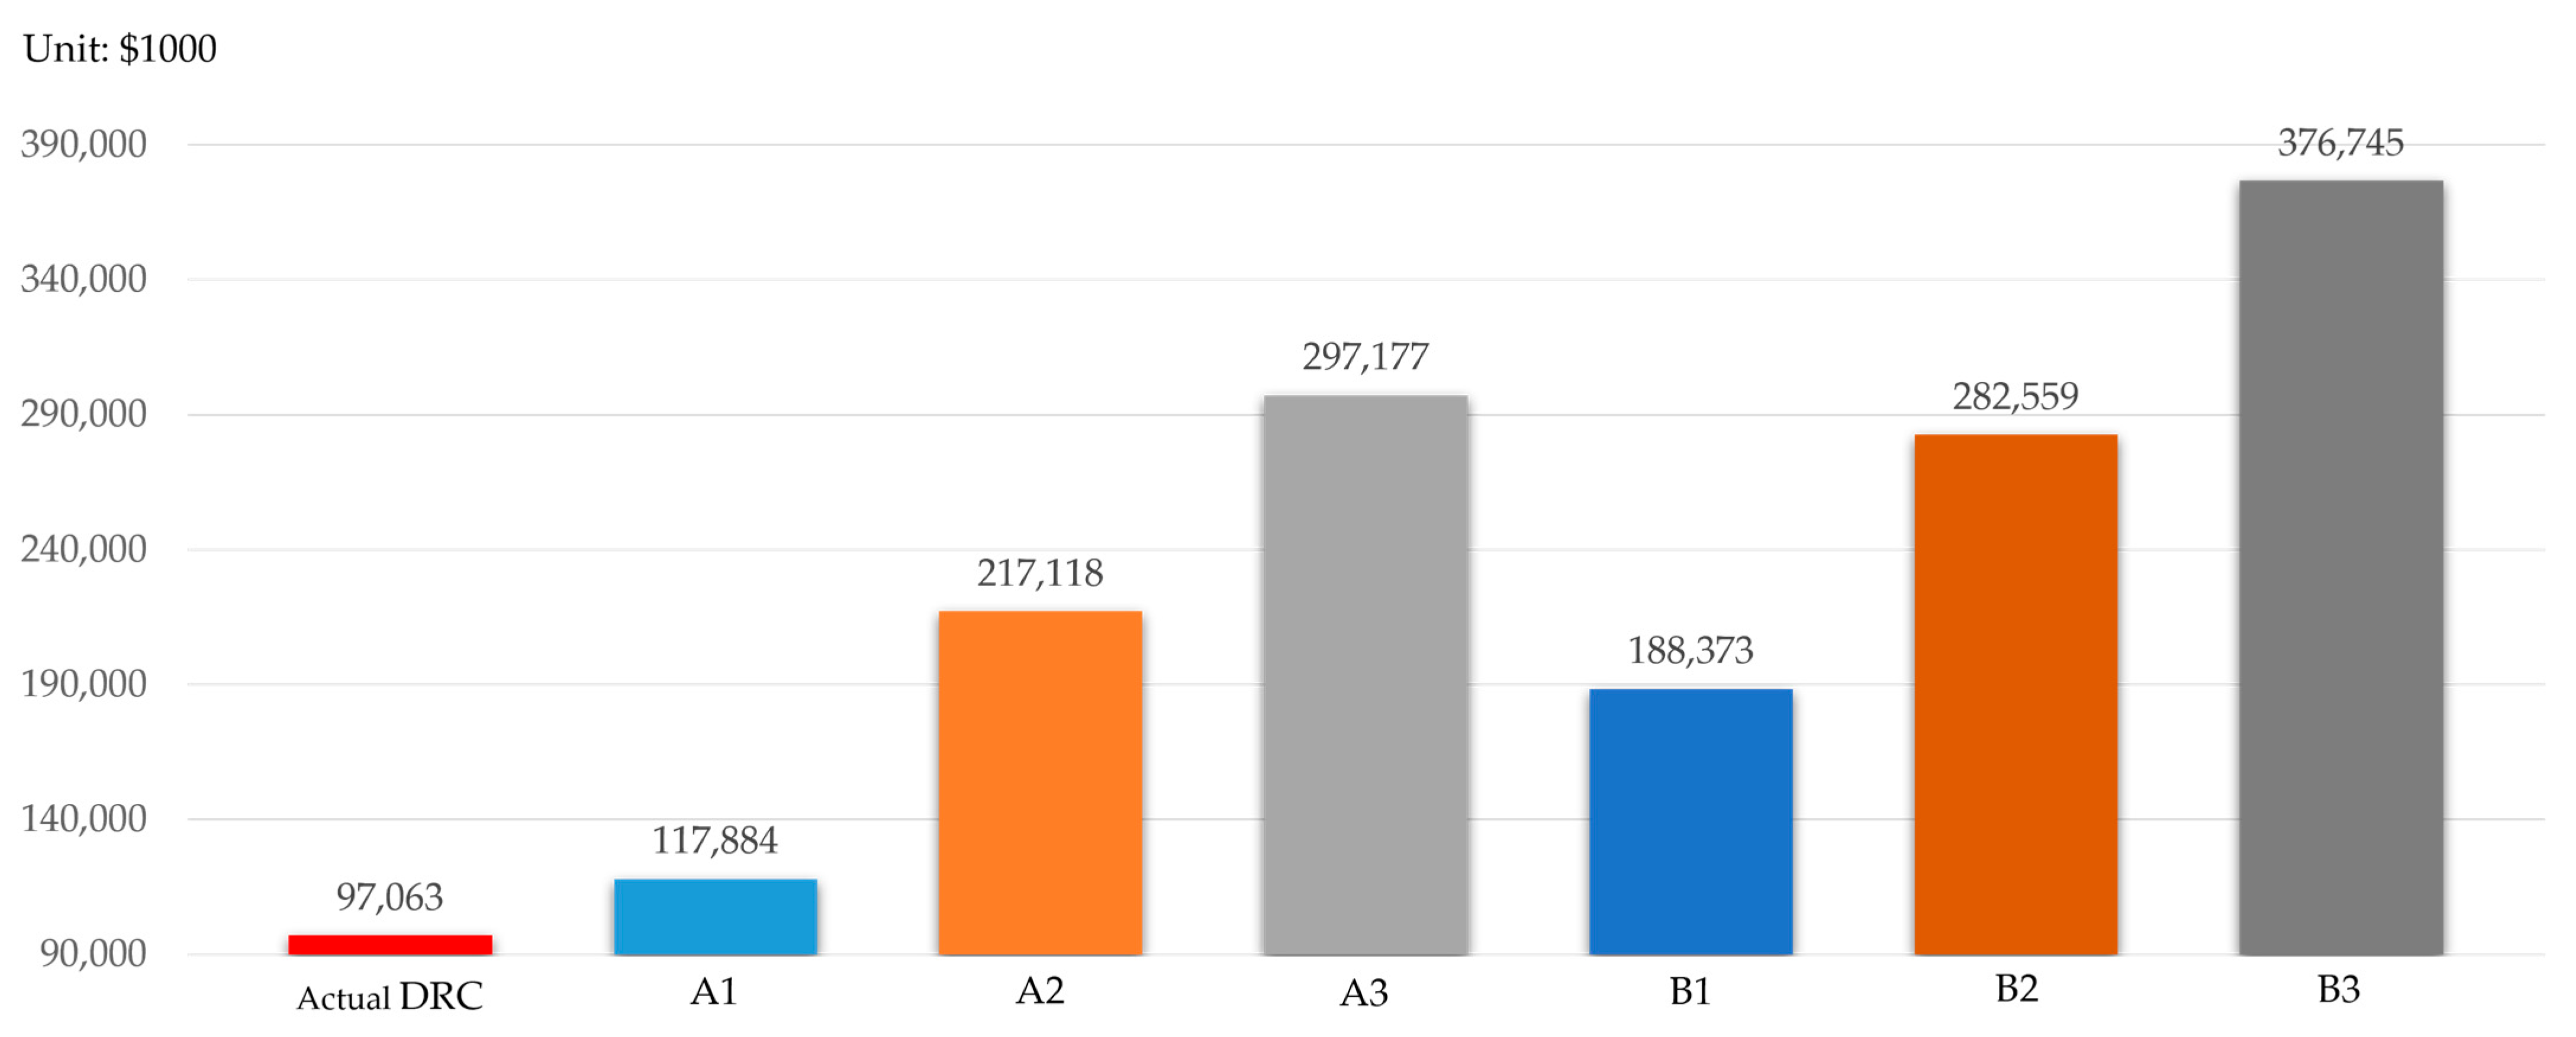
Figure 6 illustrates the aggregate actual defect repair costs and aggregate warranty for the entire set of cases, based on the indicator values derived from each alternative. As shown in Table 2, the total defect repair cost across all 238 cases in the baseline scenario is $97,063. An examination of the total warranty across the six alternatives reveals that A1 has the lowest total at $117,884, while B3 has the highest at $376,745. When A1 is adopted as the basis for the warranty, calculating the overall coverage ratio using Equation (9) yields a result of 121.5%. Therefore, if A1 is used as the standard for the warranty deposit, the total deposits provide a 21.5% margin relative to the aggregate actual defect-repair costs. Applying the B3 warranty using the same method yielded an overall warranty ratio of 388.1%. This signifies that when B3 is applied according to warranty standards, the total warranty amount is approximately 3.8 times the actual aggregate defect repair cost, implying a sufficient margin of roughly 280%.
(6)
Comprehensive Evaluation
When the results of applying the five alternatives to the baseline case are listed in descending order of individual case coverage rates, it becomes B3, A3, B2, A2, B1, and A1. The overall coverage rates also followed this same order. When comparing the individual case coverage rates against actual defect repair costs, A1 stood at 66.4%. This represented a significant disparity, as the other five alternatives all exceeded 80%. Regarding overall coverage rates, even Alternative A1, which featured the smallest warranty fund, secured a warranty fund exceeding the actual defect repair costs.
When the six alternatives are compared against the baseline case, considering individual case coverage rates alone, Alternative A1 falls short of the others. Though the remaining alternatives exhibit some variation, they are satisfactory. Furthermore, when these results are considered alongside the overall coverage rates, the operation of the new home warranty system itself appears feasible, even compared with A1, which has the lowest individual coverage rate; the total warranty easily exceeds the aggregate cost of defect repairs. However, while the overall coverage rates for the other alternatives hover around 200%, A1 offers only a 20% margin, which is significantly lower. Therefore, establishing the warranty standards at the A1 level might result in operational difficulties for the system in the future.
As for the five remaining alternatives, it appears difficult to distinguish a clear hierarchy of superiority among them. Their individual case warranty rates range from 80% to 90%. However, A3, B2, and B3, which fall within the relatively high 90% range, are considered to offer greater security. Overall warranty rates range from 190% to 370%. Here, A2, A3, B2, and B3, which exceed the high threshold of 200%, are deemed most advantageous for the warranty system’s operation. Therefore, considering these factors, it would be reasonable to select among A3, B2, and B3, as they demonstrate favorable performance in both individual-case and aggregate warranty rates.

3.3. Validation

(1)
Outline of validation data
To validate the indicator values of the aforementioned alternatives, an additional 20 defect litigation cases were collected. These cases were selected entirely at random without any prior review. The cases selected for validation were filed between 2007 and 2020, with an average litigation duration of 2 years and 3 months to reach a first-instance judgment. As shown in Table 3, the validation cases had an average construction cost of $90.4 million and an average defect repair cost of $374,200. Based on these averages, the construction costs for the validation cases were lower than those of the baseline cases. However, because the difference in defect repair costs was minimal, the ratio of defect repair costs to construction costs was higher at 0.6085%. The 95% confidence interval for the mean ranges from 0.3303% to 0.8867%. Therefore, the verification dataset represents a more challenging scenario with lower baseline quality, exhibiting a higher ratio of defect repair costs to construction costs compared to the baseline cases.
(2)
Distribution of defect repair costs and warranty by indicators
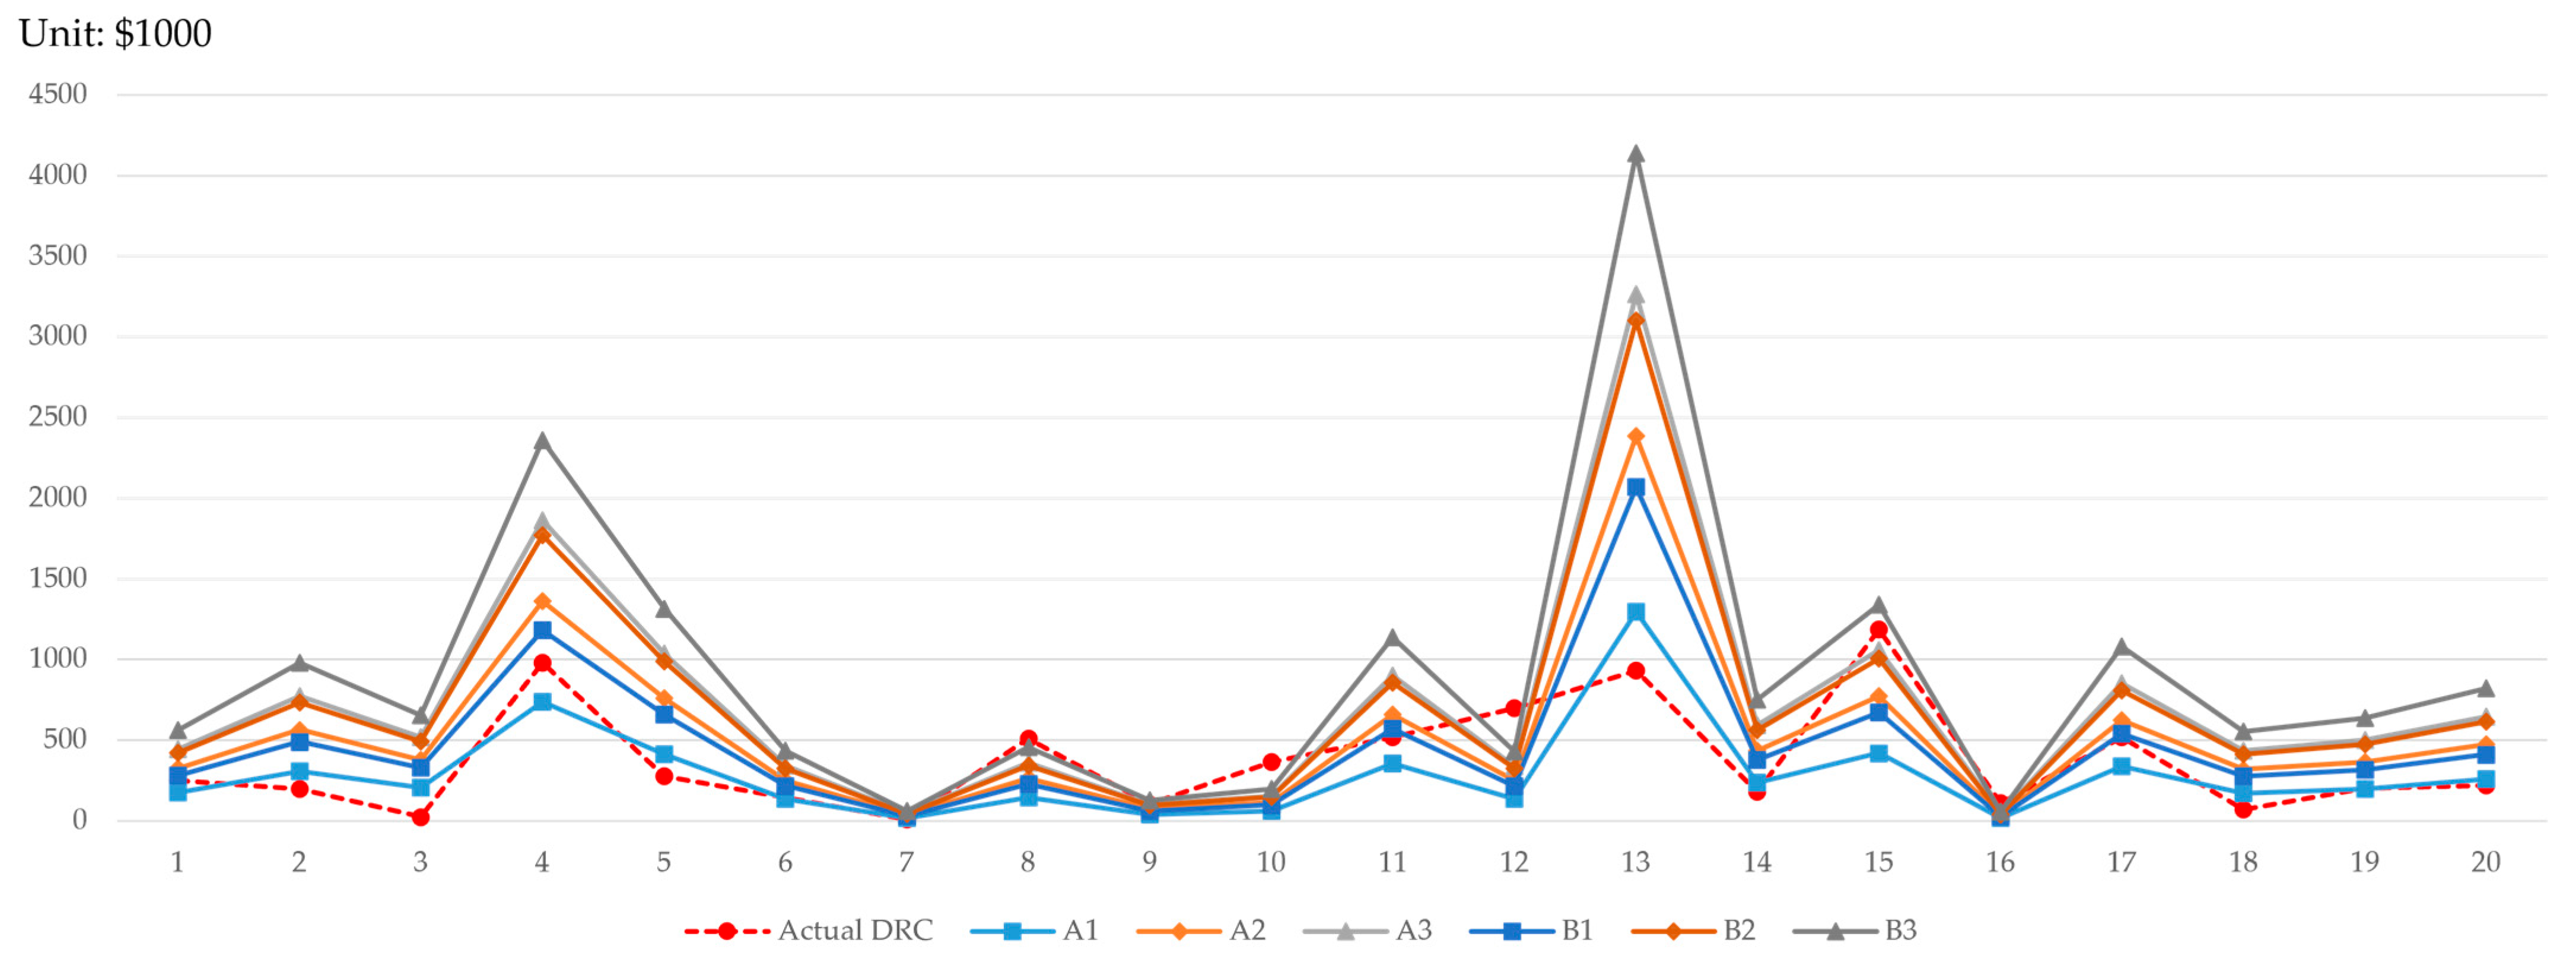
Figure 7 compares the actual defect repair costs for 20 validation cases with the warranty calculated using six alternative methods. These results reveal variations across individual cases. Notably, validation Cases 4 and 13 exhibited a significant discrepancy between the defect repair costs and the calculated warranty, whereas Cases 7 and 9 showed very minimal differences. This suggests that both defect repair costs and warranty may vary depending on the case.
(3)
Comparison 1: validation data
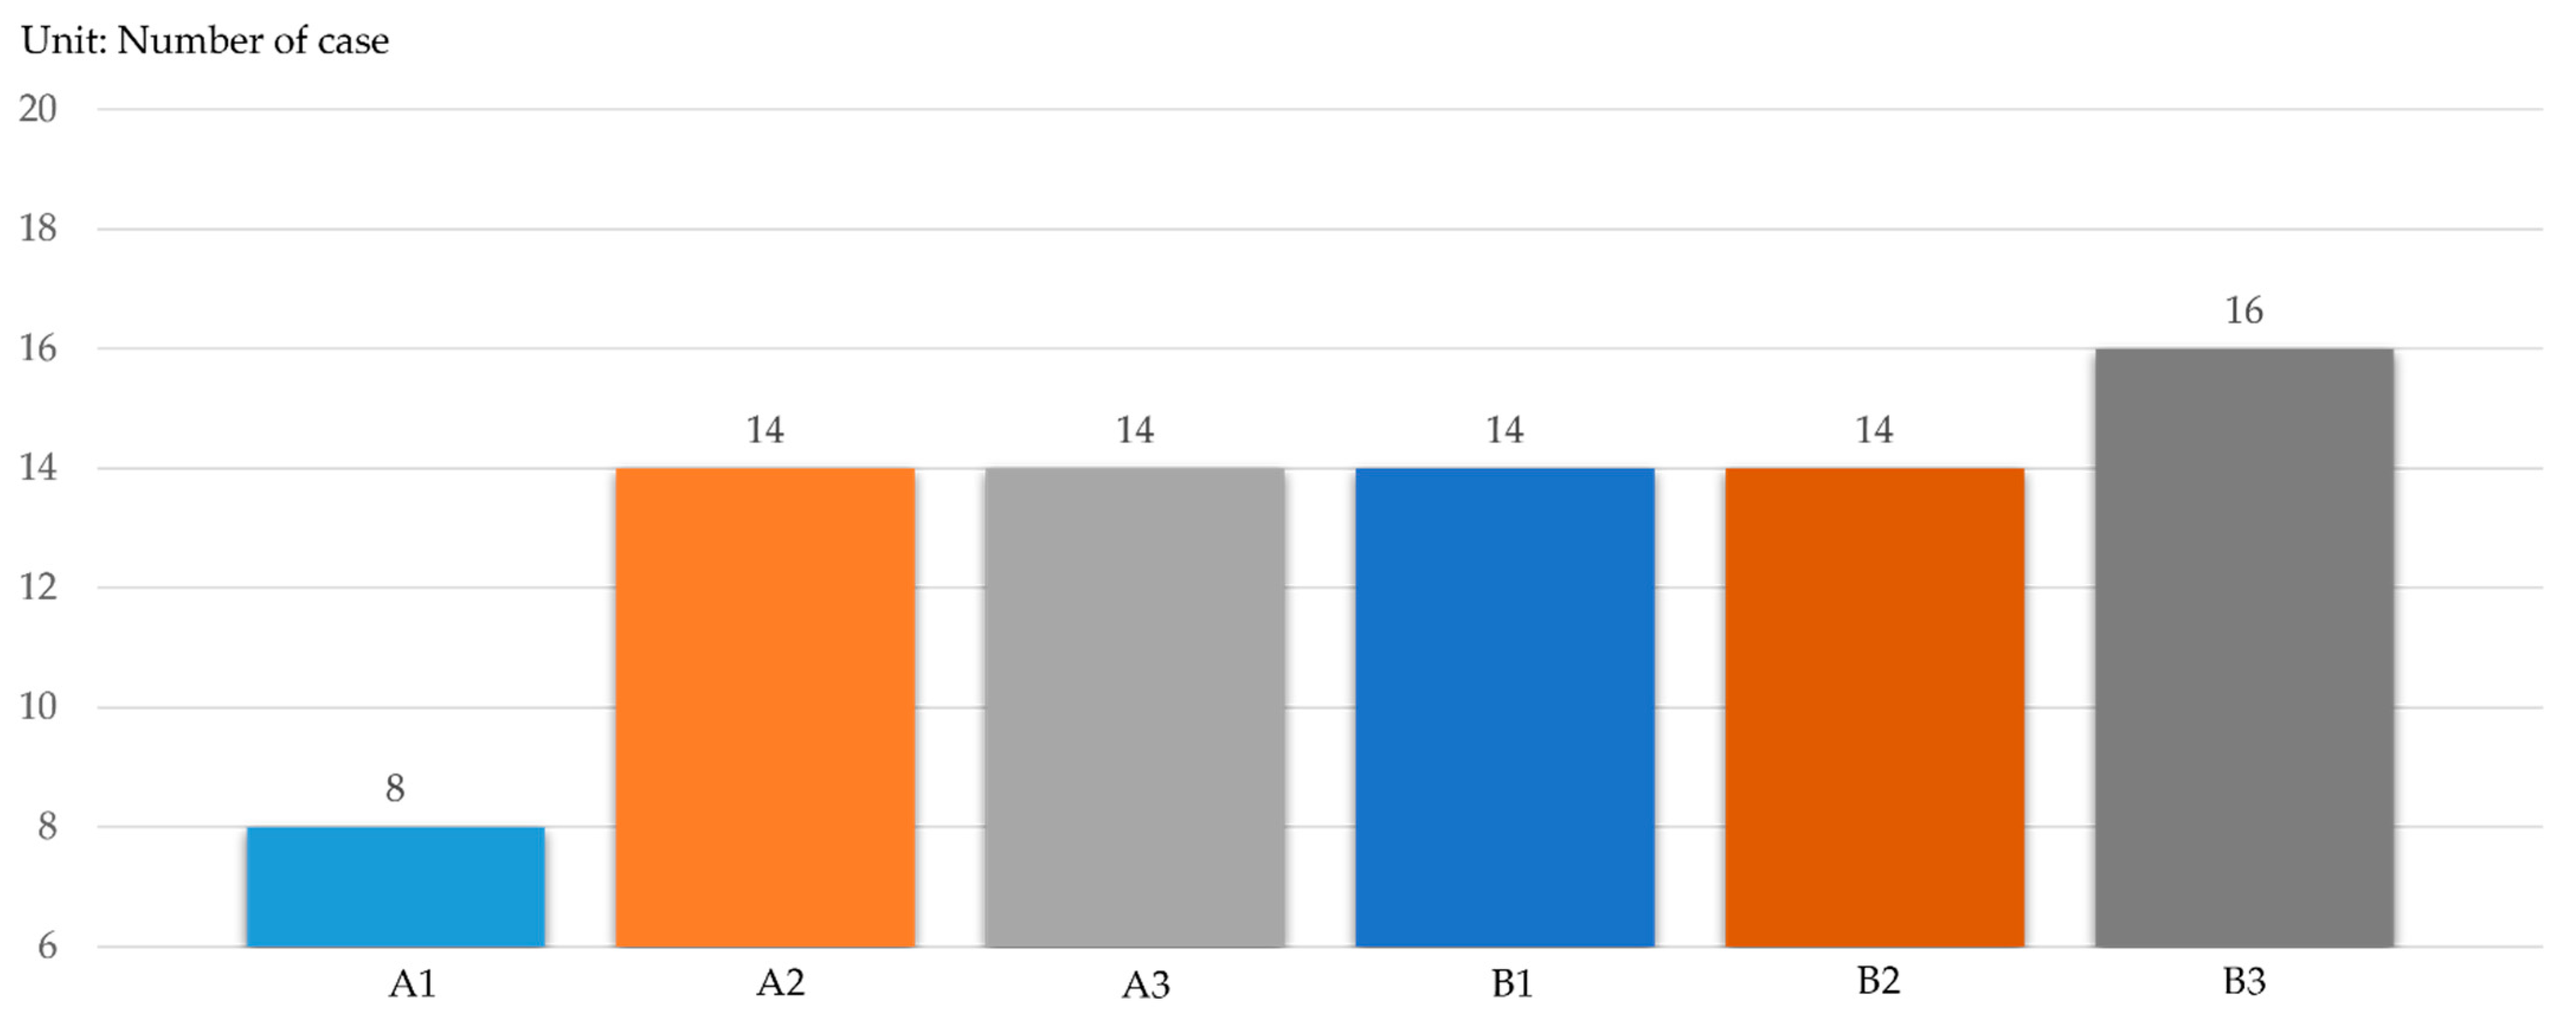
Figure 8 illustrates a case-by-case comparison of warranty versus defect repair costs across the 20 validation cases presented in Figure 7. For Alternative A1, the deposit exceeded the cost of defect repair in 8 of 20 cases. For Alternatives A2 through B2, the deposit exceeded the defect repair cost in 14 of 20 cases. For Alternative B3, the warranty exceeded the cost of repairing the defect in 16 cases. When evaluated based on whether the warranty for each alternative exceeded the defect repair cost, Alternative A1 at 40% yielded the lowest rate. It is therefore deemed relatively unfavorable compared to the other alternatives. Therefore, it is reasonable to exclude Alternative A1 and proceed with a subsequent comparative analysis of the remaining alternatives.
As shown in Figure 5, although Alternative A1 had the lowest individual guarantee rate among the baseline cases, it still fell within the 60% range. Conversely, as shown in Figure 8, in the validation cases, the number of cases where the warranty exceeded the defect repair cost was only 8 out of 20 when applying A1, resulting in an individual warranty rate of merely 40%. For the remaining alternatives, i.e., A2 through B3, their individual warranty rates exceeded 80% in the baseline cases but declined to the 70% range in the validation cases. Nevertheless, these results are considered favorable relative to A1.
(4)
Comparison 2: validation data
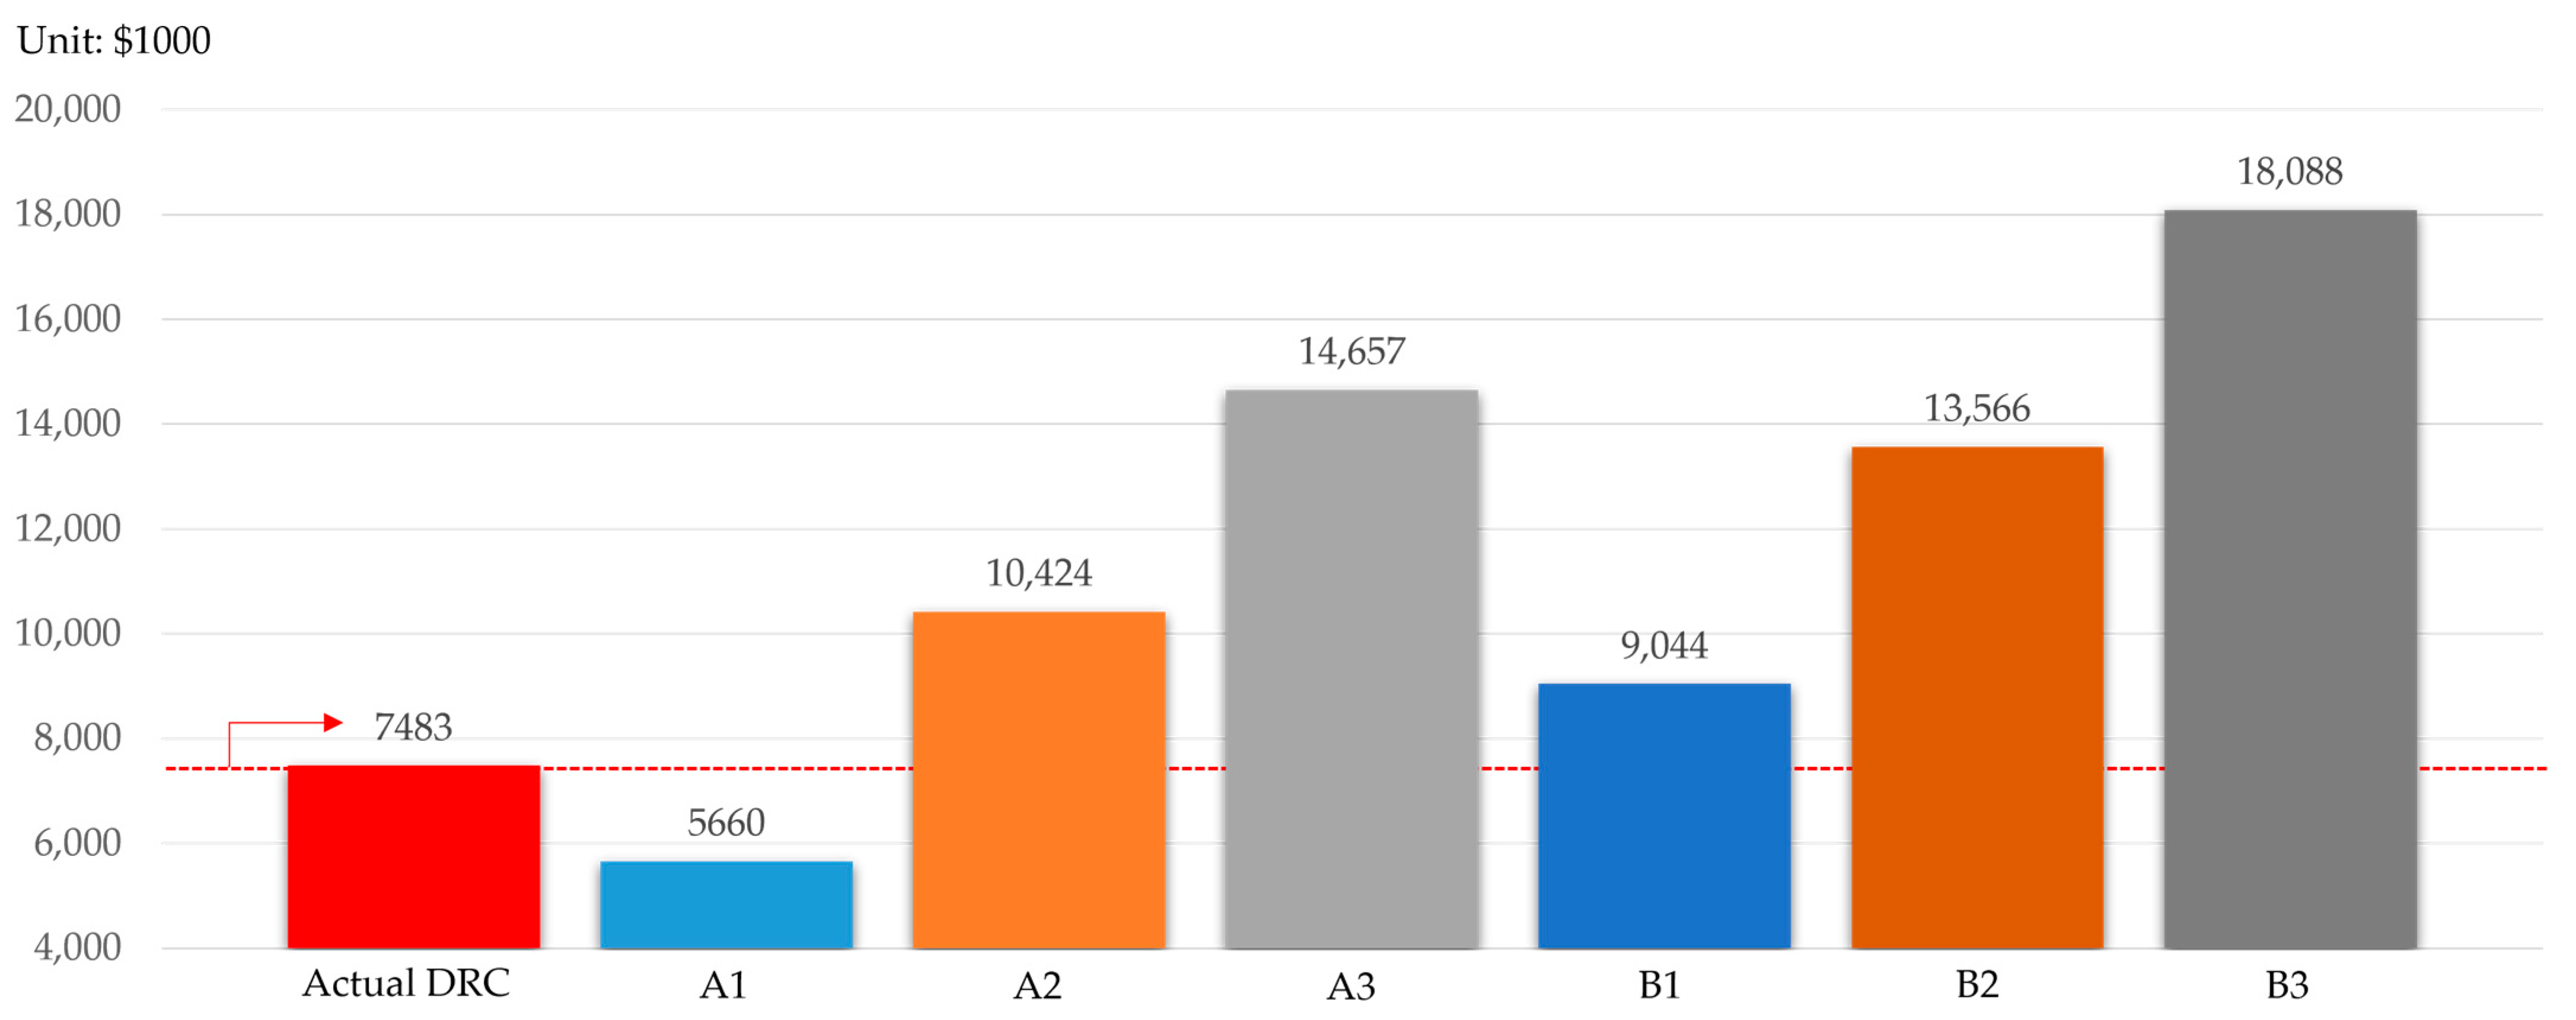
The aggregate warranty was compared with the aggregate defect-repair costs across all 20 validation cases. As shown in Figure 9, the actual aggregate defect repair cost amounted to $7,483,000. While under A1, the aggregate warranty totaled $5,660,000, which was lower than the actual repair costs. In the baseline analysis, although the individual warranty rates under A1 were lower than those of the other alternatives, the aggregate warranty costs exceeded the aggregate defect repair costs. Therefore, it was deemed feasible to adopt Alternative A1 as the warranty standard. However, with respect to the validation cases, even the aggregate warranty with Alternative A1 fell short of the aggregate defect repair costs. Therefore, designating Alternative A1 as the standard for guarantee amounts is inappropriate.
For all alternatives other than A1, the aggregate warranty easily exceeded the actual total cost of defect repairs. However, a difference was observed in the level of financial buffer compared to the analysis conducted on the baseline case. In the baseline case, all five alternatives, excluding A1, exhibited an overall coverage ratio of 200% or higher. In the verification case, only A3 and B3 remained around 200%, while the other alternatives dropped into the 100% range. Specifically, B1 declined significantly, falling to a level comparable to A1’s in the baseline case. Alternative A2 was also analyzed to fall short of even 150%.
(5)
Derivation of optimal solution
The results of an analysis conducted using verification cases for six alternative approaches to pre-handover defect repair deposits showed that the individual warranty rate was highest for Alternative B3 and lowest for Alternative A1. The remaining alternatives demonstrated comparable levels. In terms of the overall warranty rate, the ranking was as follows: B3, A3, B2, A2, B1, and A1. Specifically, the aggregate warranty for Alternative A1 fell short of the total cost of defect repairs. A1 had already exhibited the lowest individual and overall warranty rates in the baseline case studies. Also, in the verification cases, it again recorded the lowest individual guarantee rate. As its overall warranty rate fell below 100%, it failed to meet the established warranty standards and was therefore excluded.
Among the baseline cases, cases A3, B2, and B3 were the ones in which the Deposit coverage rate per case exceeded 80%, and the Aggregate deposit coverage rate stood at 200%. However, a comparative analysis of the validation cases revealed that B3 was the only one to demonstrate consistent performance. Additionally, the 95% confidence intervals for the mean cost ratios derived via the t-distribution were evaluated, yielding a range of [0.2703%, 0.3556%] for the original dataset and [0.3303%, 0.8867%] for the verification dataset. This variance indicates that the randomly selected verification sample represented a scenario with smaller construction budgets, which inherently increased the relative ratio of defect expenditures. Because the study establishes the threshold by factoring in the upper bound (0.8867%) of this higher-ratio condition, the proposed 1% construction cost threshold robustly contributes to enhancing the operational stability of the defect repair deposit system under varying real-world scales. Accordingly, this study suggests that the indicator value derived from B3, equivalent to 1% of the construction cost, could serve as a potential benchmark for the defect repair guarantee deposit required for pre-handover defects.

4. Discussion

4.1. Defect Repair Deposit in Pre-Handover

We examine the necessity of a new home warranty at the pre-handover stage of a housing project. In other countries, new home warranty systems are not operated by specifically categorizing [12,13,14,15]. Korea currently operates a home warranty system for post-handover defects, but pre-handover defects are treated as a separate category and are therefore not covered [18]. However, pre-handover defects constitute a significant issue within residential properties. Indeed, these defects have existed in practice, necessitating the implementation of a new home warranty system to protect homeowners.
Next, we consider what criteria would be appropriate to adopt for the new home warranty system applicable in the pre-handover stage. Many countries, including the United States [12], Spain [13], the United Arab Emirates [14], Vietnam [15], and Korea [16], operate their new home warranty systems based on construction costs. In particular, Korea stipulates that the warranty for post-handover defects be set at 3% of the construction cost [16]. Therefore, it would be possible to set the new home warranty system applicable at the pre-handover stage to cover construction costs as well.
Finally, this study considers which specific indicator values would be appropriate for a new home warranty at the pre-handover stage. Neither Korea nor other countries currently provide specific indicator values for guaranteeing such pre-handover defects. To explore potential alternatives for these specific indicator values, this study analyzed case precedents involving residential defect litigation. Using the ratio of defect repair costs to construction costs as a metric, this study presents three indicator values derived from a statistical analysis of baseline cases, along with three adjusted policy indicator values. Upon validating these values against a set of verification cases, the indicator that best accommodated cases where the Deposit coverage rate per case exceeded 80%, as well as the Aggregate deposit coverage rate exceeded 200%, was identified as B3. It represents an adjustment of the upper whisker (A3) within the box plot analysis. Therefore, this study proposes establishing the B3 criterion, specifically 1% of the construction cost, as the appropriate level for the warranty required at the pre-handover stage of housing construction. Although extreme outliers where actual defect repair costs exceeded this 1% threshold were partially observed within the empirical data, the analysis confirmed that these rare anomalies can be stably absorbed and neutralized through the risk-pooling.
This figure is lower than the 3% of construction costs currently mandated by Korea’s Housing Act for a new home warranty required at the post-handover stage [16]. However, according to prior studies analyzing actual performance data, a new home warranty of approximately 1% of the construction cost is considered sufficient to serve its intended function in the context of Korean housing [17,18]. Therefore, the proposed warranty of 1% of the construction cost derived from an analysis of actual performance data in this study would be a justifiable and reasonable level.
Housing defects represent a pervasive global challenge rather than a localized Korean domestic issue. Therefore, the empirical methodologies and practical findings developed in this study offer distinct and meaningful utility for global stakeholders struggling with housing defects. This study possesses high practical significance by proposing an empirical percentage for the defect repair deposit based on empirical data and holds substantial policy merit by contributing directly to the institutionalization and formulation of housing warranty regulations. Global policy-makers and construction professionals can actively utilize the evaluation framework established herein by entering their respective judicial precedents, dispute cases, or empirical defect tracking records into the model, thereby deriving statistically validated, market-specific warranty standards tailored to their domestic construction sectors. For housing policy-makers, this study provides a practical guideline to establish objective and rational deposit criteria that are mutually acceptable to all relevant stakeholders based on rigorous empirical data analysis. Concurrently, for construction field engineers, these findings can serve as a dependable baseline metric to quantitatively predict and mitigate the financial scale of potential risks that may arise during the construction and quality management processes. Above all, the pre-handover defect repair deposit system proposed in this study, integrated alongside the existing post-handover framework, is expected to serve as an indispensable social safety net to fundamentally enhance the protection of new homeowners in Korea.

4.2. Plan to Increase New Home Quality

Based on the new home warranty system and warranty standards applicable to pre-handover defects, this review examines the appropriate attitude and approach required of construction firms and engineers to improve housing quality. Conclusively, multifaceted efforts are essential to improve housing quality, identify latent risks, and prevent them from escalating into actual defects.
Post-handover defects encompass issues ranging from natural aging to wear and tear resulting from usage. Therefore, they require diligent management and effort from both the producer and the consumer. Meanwhile, pre-handover defects clearly stem from the builder’s negligence, so the builder’s willingness to rectify is important. Of course, numerous issues stemming from the inherent problems within defect-related litigation are also involved. However, given the vast scope of the subject matter, these aspects could not be addressed within the confines of this study. We intend to explore these matters in greater depth by examining specific issues in detail in subsequent research.
Since both the baseline cases and verification cases examined in this study are drawn from a sample, case-specific variations inevitably exist. Among these, a subset of cases exhibits a high ratio of defect repair costs to total construction costs. While these cases might be classified as outliers within the sample data, they nonetheless represent actual occurrences. Therefore, concerted efforts are required by both housing developers and construction firms to enhance their quality improvement and risk management standards. Adhering to the proposed 1% ratio of defect repair costs to construction costs threshold as a baseline goal will serve as the most fundamental guideline for these stakeholders. However, merely relying on abstract slogans that demand unconditional achievement is undesirable. Instead, it is imperative to precisely diagnose the specific conditions of individual construction sites in light of the empirical findings of this study. Practitioners must collaborate with specialized experts to evaluate where their current quality baseline stands relative to the aggregate distribution and to formulate strategic action plans tailored to their targeted improvement areas. Furthermore, considering the practical hardships faced by field engineers, preventing every single defect is structurally challenging under resource constraints; thus, it is far more effective to selectively prioritize and execute intensive quality management on specific defects that yield the highest prevention efficiency relative to the required effort. To systematically operationalize this selective mitigation strategy, subsequent research must follow to develop comprehensive risk assessment models for pre-handover housing defects, specifically factoring in rectifying costs, severity levels, and resultant stakeholder damages. Conversely, the study identified cases in which the pre-handover defect was remarkably low. These examples can serve as valuable benchmarks for the aforementioned cases.
However, this study has the limitation of not providing a detailed analysis of the specific particulars of exemplary and problematic cases. To accomplish this, materials beyond court judgments, such as expert appraisal reports, are required. The judgments in defect litigation cases collected for this study do not address every issue pertinent to each case. Rather, they explicitly cite only a very limited subset of these issues. Expert appraisal reports are necessary to ascertain the full scope of the details. However, unlike publicly available court judgments, which are subject to certain restrictions, these appraisal reports are not disclosed to any parties other than those directly involved in the litigation. Furthermore, since appraisal reports are discarded once their retention periods have elapsed, it is currently impossible to access their contents. Similarly, regarding court judgments, for the past two years, only heavily redacted versions, with significant portions blocked out to protect personal information, have been made available, making them difficult to decipher. To address these limitations, future research could make a substantial contribution to professional practice by identifying “best practices” for superior housing quality management and proposing concrete points for improvement through in-depth analysis of cases of substandard quality.

5. Conclusions

Worldwide, there remains a steady demand for new housing. New homes must be supplied to those seeking to move due to the natural aging of houses, as well as to young adults looking to establish families while achieving financial independence. However, the difficulties facing housing developers are intensifying as global supply chains are disrupted, caused by recent international conflicts. Rising interest rates and skyrocketing raw material prices also severely undermine business viability; the risk of bankruptcy among housing developers is increasing.
Under these challenging environments, the prevalence of housing defects underscores the critical necessity for robust social safety nets to protect new homebuyers. While institutional defect warranty frameworks exist, current regulatory blind spots leave buyers exposed to latent financial risks. In the case of Korea, post-handover housing defects are legally guaranteed, whereas pre-handover housing defects remain entirely unregulated and un-warranted.
This study proposes warranty standards for pre-handover defects, drawing upon case studies from Korea. Specifically, the standard based on construction cost—a metric widely adopted in numerous countries—was applied to pre-handover defects. Through a statistical analysis of the ratio of defect repair costs to total construction costs across 238 defect-related litigation cases, the arithmetic mean, the 80% cutoff, and the upper whisker from a box plot were established as key indicator values. In addition to the three values mentioned above, three modified versions in which these values were adjusted upward to serve as policy indicators were also introduced, for a total of six proposed alternatives. These six alternatives were compared using a set of 20 validation cases to propose a final alternative. These alternatives were compared based on two criteria: the “Deposit coverage rate per case,” defined as the percentage of cases where the warranty exceeded the actual defect repair costs, relative to the total number of cases, and the “Aggregate deposit coverage rate,” defined as the ratio of the aggregate warranty to the aggregate defect repair costs. The results indicated that Alternative B3, which sets the security deposit at 1% of the total construction cost, was the most secure option. It is anticipated that supplementing the existing post-handover warranty system with the pre-handover warranty system proposed in this study can afford new home buyers in Korea even greater protection against construction defects.
Nevertheless, due to the inherent accessibility limitations of litigation data, this study could not provide a detailed engineering analysis regarding the specific technical root causes underlying excellent quality practices and poor defect cases. To supplement these constraints, subsequent research will focus on analyzing professional expert appraisal reports containing detailed engineering data to identify the fundamental causes of housing defects and to formulate granular mitigation strategies for systematic defect prevention.

Author Contributions

Conceptualization, I.B. and J.P.; methodology, I.B. and J.P.; software, J.P.; validation, I.B. and J.P.; formal analysis, I.B. and J.P.; investigation, J.P.; resources, J.P.; data curation, J.P.; writing—original draft preparation, I.B. and J.P.; writing—review and editing, J.P.; visualization, J.P.; supervision, D.S. and O.K.; project administration, J.P.; funding acquisition, J.P. All authors have read and agreed to the published version of the manuscript.

Funding

This research received no external funding.

Institutional Review Board Statement

Not applicable.

Data Availability Statement

The data presented in this study are available on request from the corresponding author.

Conflicts of Interest

The authors declare no conflicts of interest. Inho Bae is an employee of Justice Co., Ltd. The author declares that their contributions to this work and the preparation of the manuscript were conducted independently, without any requirement, guidance, or input from their respective employers. Furthermore, no financial compensation was received from any source for their contributions to this scientific work. The other authors declare no conflicts of interest.

Abbreviations

The following abbreviations are used in this manuscript:
DRDDefect Repair Deposit
CCConstruction Cost
DRCDefect Repair Cost
DRCCCRatio of Defect Repair Cost to Construction Cost

References

  1. Gordner, T.; Tyndall, J.; Burnett, K.; Kim, E.; Ronquilio, K. Construction Defect Litigation, Housing Affordability, and Homeownership in Hawai’i. University of Hawaii Economic Research Organization. Available online: https://uhero.hawaii.edu/wp-content/uploads/2025/03/ConstructionDefectLitigation.pdf?v=1741392081 (accessed on 22 April 2026).
  2. Lores, F. Real Estate Watch. Banco Bilbao Vizcaya Argentaria Research. Available online: https://www.bbvaresearch.com/wp-content/uploads/2025/05/Observatorio_may25.pdf (accessed on 22 April 2026).
  3. DeLuca, N.; Mulhern, R.; Nguyen, M.; Tran, T.; McWilliams, A.; Weber, F.; Levine, K.; Gates, L.; Redmon, J. Environmental Health Risks for Worker Housing Near Vietnam Industrial Zones. Research Triangle Institute. Available online: https://rtipress.scholasticahq.com/article/158735-environmental-health-risks-for-worker-housing-near-vietnam-industrial-zones (accessed on 22 April 2026).
  4. Aoul, K.; Hagi, R.; Abdelghani, R.; Syam, M.; Akhozheya, B. Building Envelope Thermal Defects in Existing and Under-Construction Housing in the UAE; Infrared Thermography Diagnosis and Qualitative Impacts Analysis. Sustainability 2021, 13, 2230. [Google Scholar] [CrossRef] [Scilit]
  5. Housing Defects Dispute Mediation Committee. Work Performance Statistics of the Housing Defects Dispute Mediation Committee. Housing Defects Dispute Mediation Committee. Available online: https://www.adc.go.kr/adms/portal/portalMain.do (accessed on 22 April 2026).
  6. National Association of Home Builders. The Biggest Challenges Expected by Home Builders in 2026. National Association of Home Builders. Available online: https://www.nahb.org/blog/2026/02/builders-top-concerns-2026 (accessed on 22 April 2026).
  7. Alarcos, A. BBVA Anticipates That Housing Prices Will Rise Another 7% in 2026. Idealista. Available online: https://www.idealista.com/en/news/property-for-sale-in-spain/2025/11/28/871269-bbva-anticipates-that-housing-prices-will-rise-another-7-in-2026 (accessed on 22 April 2026).
  8. Xuân, T. Real Estate Capital Flows Forecast to be More Cautious in 2026. VnEconomy. Available online: https://en.vneconomy.vn/real-estate-capital-flows-forecast-to-be-more-cautious-in-2026.htm (accessed on 22 April 2026).
  9. UAE Legislation. Federal Decree-Law No. (51) of 2023 Promulgating the Financial and Bankruptcy Law. Ministry of Cabinet Affairs. Available online: https://uaelegislation.gov.ae/en/legislations/2190 (accessed on 22 April 2026).
  10. Cho, S. They Endured the Financial Crisis. But with the Prolonged War, Construction Companies are Filing for Bankruptcy in Droves. Maeil Business. Available online: https://www.mk.co.kr/news/business/12019731 (accessed on 22 April 2026).
  11. Acqyuisition.GOV. 52.232-5 Payments under Fixed-Price Construction Contracts. General Services Administration. Available online: https://www.acquisition.gov/far/52.232-5 (accessed on 22 April 2026).
  12. California Legislative Information. Civil Code ARTICLE 2. Retention Payment [8810-8822]. California Legislature. Available online: https://leginfo.legislature.ca.gov/faces/codes_displaySection.xhtml?lawCode=CIV&sectionNum=8811 (accessed on 22 April 2026).
  13. Boletín Oficial del Estado. Building Act: Act 38/1999 of 5th November 1999. State Agency for the Official State Gazette. Available online: https://www.boe.es/buscar/act.php?id=BOE-A-1999-21567 (accessed on 22 April 2026).
  14. Viet Nam Government Portal. Decree No. 06/2021/ND-CP on Quality Management, Construction and Maintenance of Construction Works. Available online: https://vanban.chinhphu.vn/?pageid=27160&docid=202585 (accessed on 22 April 2026).
  15. Dubai Real Estate Legislation. Law No. (8) of 2007. Escrow Accounts for Real Estate Development in the Emirate of Dubai. Dubai Land Department. Available online: https://dubailand.gov.ae/media/zrrd4qw4/en-legislation.pdf (accessed on 22 April 2026).
  16. National Law Information Center. Housing Act. Ministry of Government Legislation of the Republic of Korea. Available online: https://www.law.go.kr/engLsSc.do?menuId=1&subMenuId=21&tabMenuId=117&query=%EC%A3%BC%ED%83%9D%EB%B2%95# (accessed on 22 April 2026).
  17. Park, J.; Seo, D. Defect Repair Deposit and Insurance Premium for a New Home Warranty in Korea. Buildings 2023, 13, 815. [Google Scholar] [CrossRef] [Scilit]
  18. Park, J.; Seo, D. Defect Repair Cost and Home Warranty Deposit, Korea. Buildings 2022, 12, 1027. [Google Scholar] [CrossRef] [Scilit]
  19. Park, J.; Seo, D.; Ganaha, S.; Kwon, J.; Kim, H.; Kang, J. A Case Study on the Top Coating of Multicolor Painting Work Based on the Empirical Method. Coatings 2026, 16, 337. [Google Scholar] [CrossRef] [Scilit]
  20. Park, J.; Seo, D. Post-Handover Quality Management Index of Electric Housing Work. Adv. Civ. Eng. 2022, 2022, 4690073. [Google Scholar] [CrossRef] [Scilit]
  21. Park, J.; Seo, D. Defect Index of Timberwork in House, Korea. Forests 2021, 12, 896. [Google Scholar] [CrossRef] [Scilit]
  22. National Law Information Center. Case no. 99Da69662. The Supreme Court of Korea. Available online: https://www.law.go.kr/precSc.do?menuId=7&subMenuId=47&tabMenuId=213&query=%EC%A3%BC%ED%83%9D%EB%B2%95#licPrec81265 (accessed on 22 April 2026).
  23. Kim, K. Measures to Improve Current Building Defect Liability System through Relevant Legislation Analysis and Status Analysis. J. Real. Estate Anal. 2021, 7, 117–139. [Google Scholar] [CrossRef] [Scilit]
  24. Lee, S.; Han, M.; Kim, J.; Lee, J. Analysis on Characteristics of Defects before Inspection for Apartment Use. J. Korea Acad.-Ind. Coop. Soc. 2020, 21, 167–178. [Google Scholar] [CrossRef] [Scilit]
  25. Josephson, P.; Larsson, B.; Li, H. Illustrative Benchmarking Rework and Rework Costs in Swedish Construction Industry. J. Manag. Eng. 2002, 18, 76–83. [Google Scholar] [CrossRef] [Scilit]
  26. Hwang, B.; Thomas, S.; Haas, C.; Caldas, C. Measuring the Impact of Rework on Construction Cost Performance. J. Constr. Eng. Manag. 2009, 135, 187–198. [Google Scholar] [CrossRef] [Scilit]
  27. Mills, A.; Love, P.; Williams, P. Defect Costs in Residential Construction. J. Constr. Eng. Manag. 2009, 135, 12–16. [Google Scholar] [CrossRef] [Scilit]
  28. Construction Industry Institute Research Team. A Guide to Construction Rework Reduction; Construction Industry Institute: Austin, TX, USA, 2011; no. CII RT-252; Available online: https://www.construction-institute.org/a-guide-to-construction-rework-reduction (accessed on 30 June 2026).
  29. Forcada, N.; Gangolells, M.; Casals, M. Factors Affecting Rework Costs in Construction. J. Constr. Eng. Manag. 2017, 143, 445–465. [Google Scholar] [CrossRef] [Scilit]
  30. Love, P.; Teo, P.; Morrison, J. Revisiting Quality Failure Costs in Construction. J. Constr. Eng. Manag. 2018, 144, 5017020. [Google Scholar] [CrossRef] [Scilit]
  31. Liu, Q.; Ye, G.; Feng, Y.; Wang, C.; Peng, Y. Case-based insights into rework costs of residential building projects in China. Int. J. Constr. Manag. 2020, 20, 347–355. [Google Scholar] [CrossRef] [Scilit]
  32. Bank of Korea. Economic Statistics System. Bank of Korea. Available online: https://ecos.bok.or.kr/#/SearchStat (accessed on 22 April 2026).
Figure 1. Research Flowchart. Source: Newly created by the authors for the purpose of this study based on empirical data analysis.
Buildings 16 02803 g001
Figure 2. Pareto diagram of training data. Source: Newly created by the authors for the purpose of this study based on empirical data analysis.
Buildings 16 02803 g002
Figure 3. Box plot of training data. Source: Newly created by the authors for the purpose of this study based on empirical data analysis.
Buildings 16 02803 g003
Figure 4. Indicators of Alternatives. Source: Newly created by the authors for the purpose of this study based on empirical data analysis.
Buildings 16 02803 g004
Figure 5. Comparison of cases for deposit-covered repair costs: training data. Source: Newly created by the authors for the purpose of this study based on empirical data analysis.
Buildings 16 02803 g005
Figure 6. Comparison between total actual defect repair costs and deposits: training data. Source: Newly created by the authors for the purpose of this study based on empirical data analysis.
Buildings 16 02803 g006
Figure 7. Comparison of costs and deposits by case: validation data. Source: Newly created by the authors for the purpose of this study based on empirical data analysis.
Buildings 16 02803 g007
Figure 8. Comparison of cases for deposit-covered repair costs: validation data. Source: Newly created by the authors for the purpose of this study based on empirical data analysis.
Buildings 16 02803 g008
Figure 9. Comparison between total actual defect repair costs and deposits: validation data. Source: Newly created by the authors for the purpose of this study based on empirical data analysis.
Buildings 16 02803 g009
Table 1. Indicators by Previous Research.
ResearcherReferenceStatistical IndicatorsAdjusted Policy Indicator
Arithmetic Mean80% Cutoff ValueUpper Whisker
Josephson[25]
Hwang[26]
Mills[27]
Construction Industry Institute[28]
Forcada[29]
Love[30]
Liu[31]
Park and Seo (2021)[21]
Park and Seo (2022)[18]
This research
Note. ‘○’ indicates that the variable was adopted in the prior literature. Source: Newly created by the authors for the purpose of this study based on empirical data analysis.
Table 2. Statistics of cases: training data.
MetricsConstruction Cost
(Million USD)
Defect Repair Cost
(Thousand USD)
Defect Repair Cost Ratio to Construction Cost (%)
Sum37,67597,063-
Minimum0.1420.0063
Mean1584080.3129
Maximum113545002.6041
Standard deviation1595460.3340
Source: Newly created by the authors for the purpose of this study based on empirical data analysis.
Table 3. Statistics of cases: validation data.
MetricsConstruction Cost
(Million USD)
Defect Repair Cost
(Thousand USD)
Defect Repair Cost Ratio to Construction Cost (%)
Sum1808.87483.7-
Minimum5.57.00.0362
Mean90.4374.20.6085
Maximum413.81187.62.0115
Standard deviation93.5339.90.5944
Source: Newly created by the authors for the purpose of this study based on empirical data analysis.
Disclaimer/Publisher’s Note: The statements, opinions and data contained in all publications are solely those of the individual author(s) and contributor(s) and not of MDPI and/or the editor(s). MDPI and/or the editor(s) disclaim responsibility for any injury to people or property resulting from any ideas, methods, instructions or products referred to in the content.