Article

Developer–Homebuyer Priority Divergence in Low-Rise Terraced Housing: An Exploratory AHP Case Study of Changhua County, Taiwan

1
Graduate School of Engineering Science and Technology, National Yunlin University of Science and Technology, Douliu 640301, Taiwan
2
Department of Civil and Construction Engineering, National Yunlin University of Science and Technology, Douliu 640301, Taiwan
*
Author to whom correspondence should be addressed.
Buildings 2026, 16(14), 2769; https://doi.org/10.3390/buildings16142769
Submission received: 7 June 2026 / Revised: 9 July 2026 / Accepted: 10 July 2026 / Published: 12 July 2026
(This article belongs to the Section Architectural Design, Urban Science, and Real Estate)

Abstract

Low-rise terraced housing dominates residential construction in non-metropolitan Taiwan, yet empirical evidence on priority divergence between developers and homebuyers in such markets remains scarce. Using a case study of Changhua County, we applied the Analytic Hierarchy Process (AHP) to quantify priority structures of 35 construction managers and 58 homebuyers. Both groups evaluated an identical five-dimensional hierarchy encompassing fourteen directly surveyed factors across location selection, housing price, financing, construction risk, and building planning. Consistency ratios were 0.028 (developers) and 0.019 (homebuyers). The results indicate substantial differences in relative priorities. Developers prioritized Construction Risk (0.368), with Government Regulations (A42) ranking first globally (0.152). Homebuyers prioritized Location Selection (0.412), with Transportation Convenience (A11) ranking first (0.223). The Location Selection dimension gap (0.221 points) and Construction Risk gap (0.251 points) represent the largest divergences. Factor-level rank inversions are pronounced: Transportation Convenience ranks first for homebuyers but fifth for developers; Government Regulations ranks first for developers but fourteenth for homebuyers. The findings suggest that supply-side and demand-side stakeholders may place different emphasis on project feasibility and residential use, with implications for site selection, floor plan design, and buyer communication in regional markets.

1. Introduction

Low-rise terraced housing—typically three to five stories with ground-floor commercial or mixed-use and independent land title—remains the dominant residential product in non-metropolitan Taiwan. In Changhua County, terraced housing accounts for most new residential completions, particularly in Changhua City, Yuanlin, and Hemei [1]. Despite its market significance, we lack empirical evidence on whether developer decision priorities align with homebuyer purchase criteria.
The market environment has shifted substantially over the past five years. Available land in established residential zones has become increasingly scarce, driving acquisition costs upward. In Changhua City’s core districts, residential land prices have risen steadily since 2019, with annual adjustments to the announced land value recorded in successive years through 2024 [1]. Construction material and labor costs rose sharply after 2021 and remain elevated relative to pre-pandemic levels. Taiwan’s Construction Cost Index (CCI), compiled by the Directorate-General of Budget, Accounting and Statistics (DGBAS), recorded annual increases of 10.94% in 2021 and 7.36% in 2022—the steepest consecutive rises since 2008—before moderating to 1.74% in 2023 [2]. The 2022 revision to Taiwan’s Building Technical Regulations introduced additional seismic design requirements that increased compliance costs, particularly for small- and medium-sized developers [3]. The revision mandated higher seismic resistance coefficients for buildings in seismic zone 2 (which includes Changhua County), requiring additional structural reinforcement and engineering analysis [3].
Meanwhile, homebuyer expectations have evolved. Homebuyers in Taiwan consistently prioritize walkability, public transit access, and proximity to schools and parks as key location attributes [4]. Prior studies suggest that proximity to schools and parks positively influences residential preference and willingness to pay [4]. In non-metropolitan markets, where car ownership is nearly universal, transportation convenience is primarily expressed through road accessibility and commuting time rather than transit proximity; however, younger and car-free households retain a preference for public transport access, making A11 relevant across both mobility contexts. Older cohorts emphasize parking availability, ground-floor accessibility, and neighborhood stability as primary housing attributes [5]. They report concerns about industrial noise, air quality, and building maintenance in older neighborhoods. These shifts create potential misalignment between what developers prioritize during project planning and what homebuyers value during purchase decisions.
Existing research on residential development decision-making has focused primarily on metropolitan markets and high-rise condominiums [6,7]. Studies of developer site selection emphasize land cost, zoning flexibility, and infrastructure readiness [8,9]. Research on homebuyer preferences highlights location, price, and unit layout [10,11]. However, few studies directly compare developer and homebuyer priorities within the same market using a common evaluation framework. The low-rise terraced housing segment—characterized by smaller project scales, mixed-use ground floors, and localized buyer pools—may exhibit different priority structures than high-rise markets.
This study addresses three research questions:
  • What are the relative priorities of developers and homebuyers across five key dimensions (location selection, housing price, financing, construction risk, and building planning) in the low-rise terraced housing market?
  • Where do the largest priority divergences occur between developers and homebuyers at both dimension and factor levels?
  • What are the implications of these divergences for project planning, product design, and buyer communication strategies?
We employ the Analytic Hierarchy Process (AHP) to quantify priorities. AHP is a structured multi-criteria decision-making method that decomposes complex decisions into hierarchical levels and uses pairwise comparisons to derive relative weights [12]. It has been widely applied in construction management, real estate development, and housing policy [13,14,15]. We surveyed 35 construction managers from local development firms and 58 homebuyers who purchased terraced housing in Changhua County between 2022 and 2024. Both groups evaluated the same five-dimension, fourteen-factor hierarchy through pairwise comparison questionnaires.
Our findings reveal substantial divergence. Developers assign the highest weight to Construction Risk (0.368), driven primarily by Government Regulations (A42, global weight 0.152). Homebuyers assign the highest weight to Location Selection (0.412), driven primarily by Transportation Convenience (A11, global weight 0.223). The dimension-level gap in Location Selection (0.221 points) and Construction Risk (0.251 points) indicates markedly different decision logics. At the factor level, Transportation Convenience ranks first for homebuyers but fifth for developers; Government Regulations ranks first for developers but fourteenth for homebuyers. These inversions suggest a possible gap between supply-side planning priorities and demand-side purchase considerations.
This article proceeds as follows. Section 2 reviews the literature on developer decision-making, homebuyer preferences, and AHP applications in housing research. Section 3 describes the AHP methodology, hierarchy design, data collection, and consistency checks. Section 4 presents dimension-level and factor-level results for both groups. Section 5 discusses the implications of priority divergences for site selection, regulatory compliance, product design, and buyer communication. Section 6 concludes with recommendations for practice and future research.

2. Literature Review

2.1. Developer Decision-Making in Residential Development

Residential developers operate under multiple constraints: land acquisition costs, construction costs, regulatory compliance, financing terms, and market absorption risk [16]. Site selection decisions balance land price, zoning flexibility, infrastructure readiness, and proximity to demand centers [8]. In non-metropolitan markets, land availability is often less constrained than in metropolitan areas, but infrastructure quality and buyer purchasing power may be lower [17].
Construction risk encompasses technical, regulatory, and schedule dimensions. Technical risk includes site conditions (soil stability, groundwater, and slope), structural complexity, and material availability [18]. Regulatory risk includes zoning approvals, building permits, environmental impact assessments, and seismic compliance [19]. Schedule risk includes weather delays, labor shortages, and subcontractor coordination [20,21]. In Taiwan, the 2022 Building Technical Regulations revision increased seismic design requirements, raising compliance costs for developers in seismic zones [3].
Financing capacity affects project scale and timing. Developers rely on a mix of equity, bank loans, and presales revenue [16]. In non-metropolitan markets, presales absorption rates are typically lower than in metropolitan areas, requiring developers to carry higher equity ratios or secure longer-term financing [17]. Interest rate increases since 2022 have raised financing costs, compressing profit margins [22].
Product design decisions involve trade-offs between construction cost and market appeal. Floor plan efficiency (usable area as a percentage of gross floor area), unit mix (number of bedrooms and bathrooms), and facade design affect both construction cost and sales price [23]. In terraced housing, ground-floor commercial space adds complexity: developers must assess demand for retail or office use, design flexible layouts, and manage mixed-use building systems [1].

2.2. Homebuyer Preferences in Non-Metropolitan Markets

Homebuyer preferences vary based on demographic characteristics, household composition, and life stage [10]. Location factors—proximity to workplaces, schools, parks, and transit—consistently rank among the top priorities [11]. In non-metropolitan Taiwan, car ownership is nearly universal, reducing the importance of public transit relative to metropolitan areas, but proximity to schools and parks remains highly valued [4].
Price and affordability are primary constraints. Homebuyers evaluate total price, down payment requirements, monthly mortgage payments, and price-to-income ratios [24]. In Changhua County, median household income is lower than in Taipei or Taichung, making affordability a binding constraint for many buyers [1]. Buyers report willingness to trade off unit size or finishes for better locations or lower prices [11].
Building characteristics include floor plan layout, natural lighting, ventilation, parking, and exterior appearance [11]. Buyers in Taiwan’s housing markets report strong preferences for functional floor plans, modern finishes, and energy-efficient designs [4]. Older buyers prioritize accessibility (elevator or ground-floor units), parking, and low maintenance costs [5]. In terraced housing, ground-floor commercial space can be a positive or negative attribute depending on buyer preferences for mixed-use environments versus purely residential neighborhoods [1].
Neighborhood quality encompasses environmental factors (air quality, noise, and green space), social factors (neighbor composition and community cohesion), and safety (crime rates and traffic safety) [11]. In Changhua County, proximity to industrial zones is a common concern: buyers report willingness to pay premiums to avoid industrial noise and air pollution [5].

2.3. AHP Applications in Housing and Real Estate

The Analytic Hierarchy Process (AHP) has been applied extensively in housing and real estate research. Park et al. (2025) used AHP to evaluate redevelopment priorities in old residential projects, finding that residents prioritized safety and infrastructure, while developers prioritized financial returns [25]. Cabral and Blanchet (2023) applied AHP to material selection for prefabricated wood buildings, identifying cost, environmental impact, and structural performance as top criteria [26]. Omar (2023) developed an AHP framework for evaluating self-sustained houses, with energy efficiency and water conservation ranking highest [27].
AHP has also been used for residential site selection. Mokhtar et al. (2023) applied AHP with geospatial analysis to identify suitable residential sites in Malaysia, prioritizing accessibility, environmental quality, and infrastructure [28]. Akmaludin et al. (2024) combined AHP with EDAS (Evaluation based on Distance from Average Solution) to rank residential locations in Indonesia, finding that proximity to schools and hospitals was a top factor [29]. Ramzanpour and Rahimi (2023) used AHP to prioritize physical resilience criteria for affordable housing, with seismic resistance and flood protection ranking highest [30].
Several studies have compared stakeholder priorities using AHP. Nguyen et al. (2023) compared apartment provider evaluations by buyers and real estate agents, finding significant divergence in the importance of brand reputation versus price [31]. Taylor et al. (2022) developed an AHP-based decision support tool for converting commercial property to residential use, comparing developer and local authority priorities [32]. Pinzon Amorocho and Hartmann (2023) applied AHP to residential building renovation decisions, comparing owner and contractor priorities [33]. Daniel and Ghiaus (2023) used AHP for energy retrofit decisions, comparing technical, economic, and environmental criteria [34].
These studies demonstrate AHP’s utility for structuring complex, multi-criteria decisions and comparing stakeholder priorities. Recent work has extended AHP into more specialized residential contexts. Issa et al. (2022) applied a hybrid AHP–fuzzy TOPSIS approach to construction project decision-making, demonstrating how AHP-derived weights across fourteen subcriteria—including safety, cost, and site characteristics—can guide practical choices under uncertainty [35]. Ji et al. (2023) used AHP to rank political, economic, and social drivers of a senior housing development in Hong Kong, finding that land costs and financing incentives dominated expert priorities, a pattern consistent with the developer-side weighting of Construction Risk and Financing observed in the present study [36]. Kang et al. (2024) applied AHP to prioritize building defects in multi-unit residential buildings, showing that structural and material subcriteria received substantially higher weights than cosmetic or service-related issues—a result that parallels the asymmetry between developer and homebuyer priorities documented here [37].
However, few studies have applied AHP to directly compare developer and homebuyer priorities in low-rise terraced housing markets. This study fills this gap by quantifying priority structures for both groups using an identical evaluation framework.
Compared with previous AHP studies that focus mainly on site selection, renovation, redevelopment, or housing attributes, this study contributes by directly comparing developer and homebuyer priority structures within the same low-rise terraced housing market. Rather than treating housing decisions as a single stakeholder problem, this study highlights how supply-side feasibility concerns and demand-side residential preferences may diverge under a shared evaluation hierarchy.

3. Methodology

3.1. Analytic Hierarchy Process (AHP)

The Analytic Hierarchy Process (AHP), developed by Saaty (1980), is a structured technique for organizing and analyzing complex decisions [12]. It decomposes a decision problem into a hierarchy of criteria and alternatives, uses pairwise comparisons to derive relative weights, and aggregates weights to produce overall priorities.
The AHP procedure consists of four steps:
  • Hierarchy construction: Define the decision goal, identify criteria (dimensions) and sub-criteria (factors), and organize them into a hierarchical structure.
  • Pairwise comparison: For each level of the hierarchy, compare elements pairwise with respect to their importance to the parent element. Comparisons use Saaty’s 1–9 scale: 1 = equal importance, 3 = moderate importance, 5 = strong importance, 7 = very strong importance, 9 = extreme importance. Intermediate values (2, 4, 6, and 8) represent intermediate judgments.
  • Weight calculation: Construct a pairwise comparison matrix A = [aij], where aij represents the relative importance of element i to element j. Calculate the priority vector w (normalized weights) as the principal eigenvector of A, satisfying Aw = λmaxw, where λmax is the largest eigenvalue.
  • Consistency check: Assess the consistency of pairwise comparisons using the Consistency Ratio (CR):
CR = CI/RI
where CI (Consistency Index) = (λmax − n)/(n − 1), n is the matrix size, and RI (Random Index) is the average CI of randomly generated matrices. Saaty recommends CR < 0.10 for acceptable consistency [12].
Global weights for sub-criteria are calculated by multiplying local weights (within each dimension) by the dimension weight. The sum of all global weights equals 1.0 before rounding; minor discrepancies (≤ 0.001) may appear when weights are reported to four decimal places.

3.2. Hierarchy Design

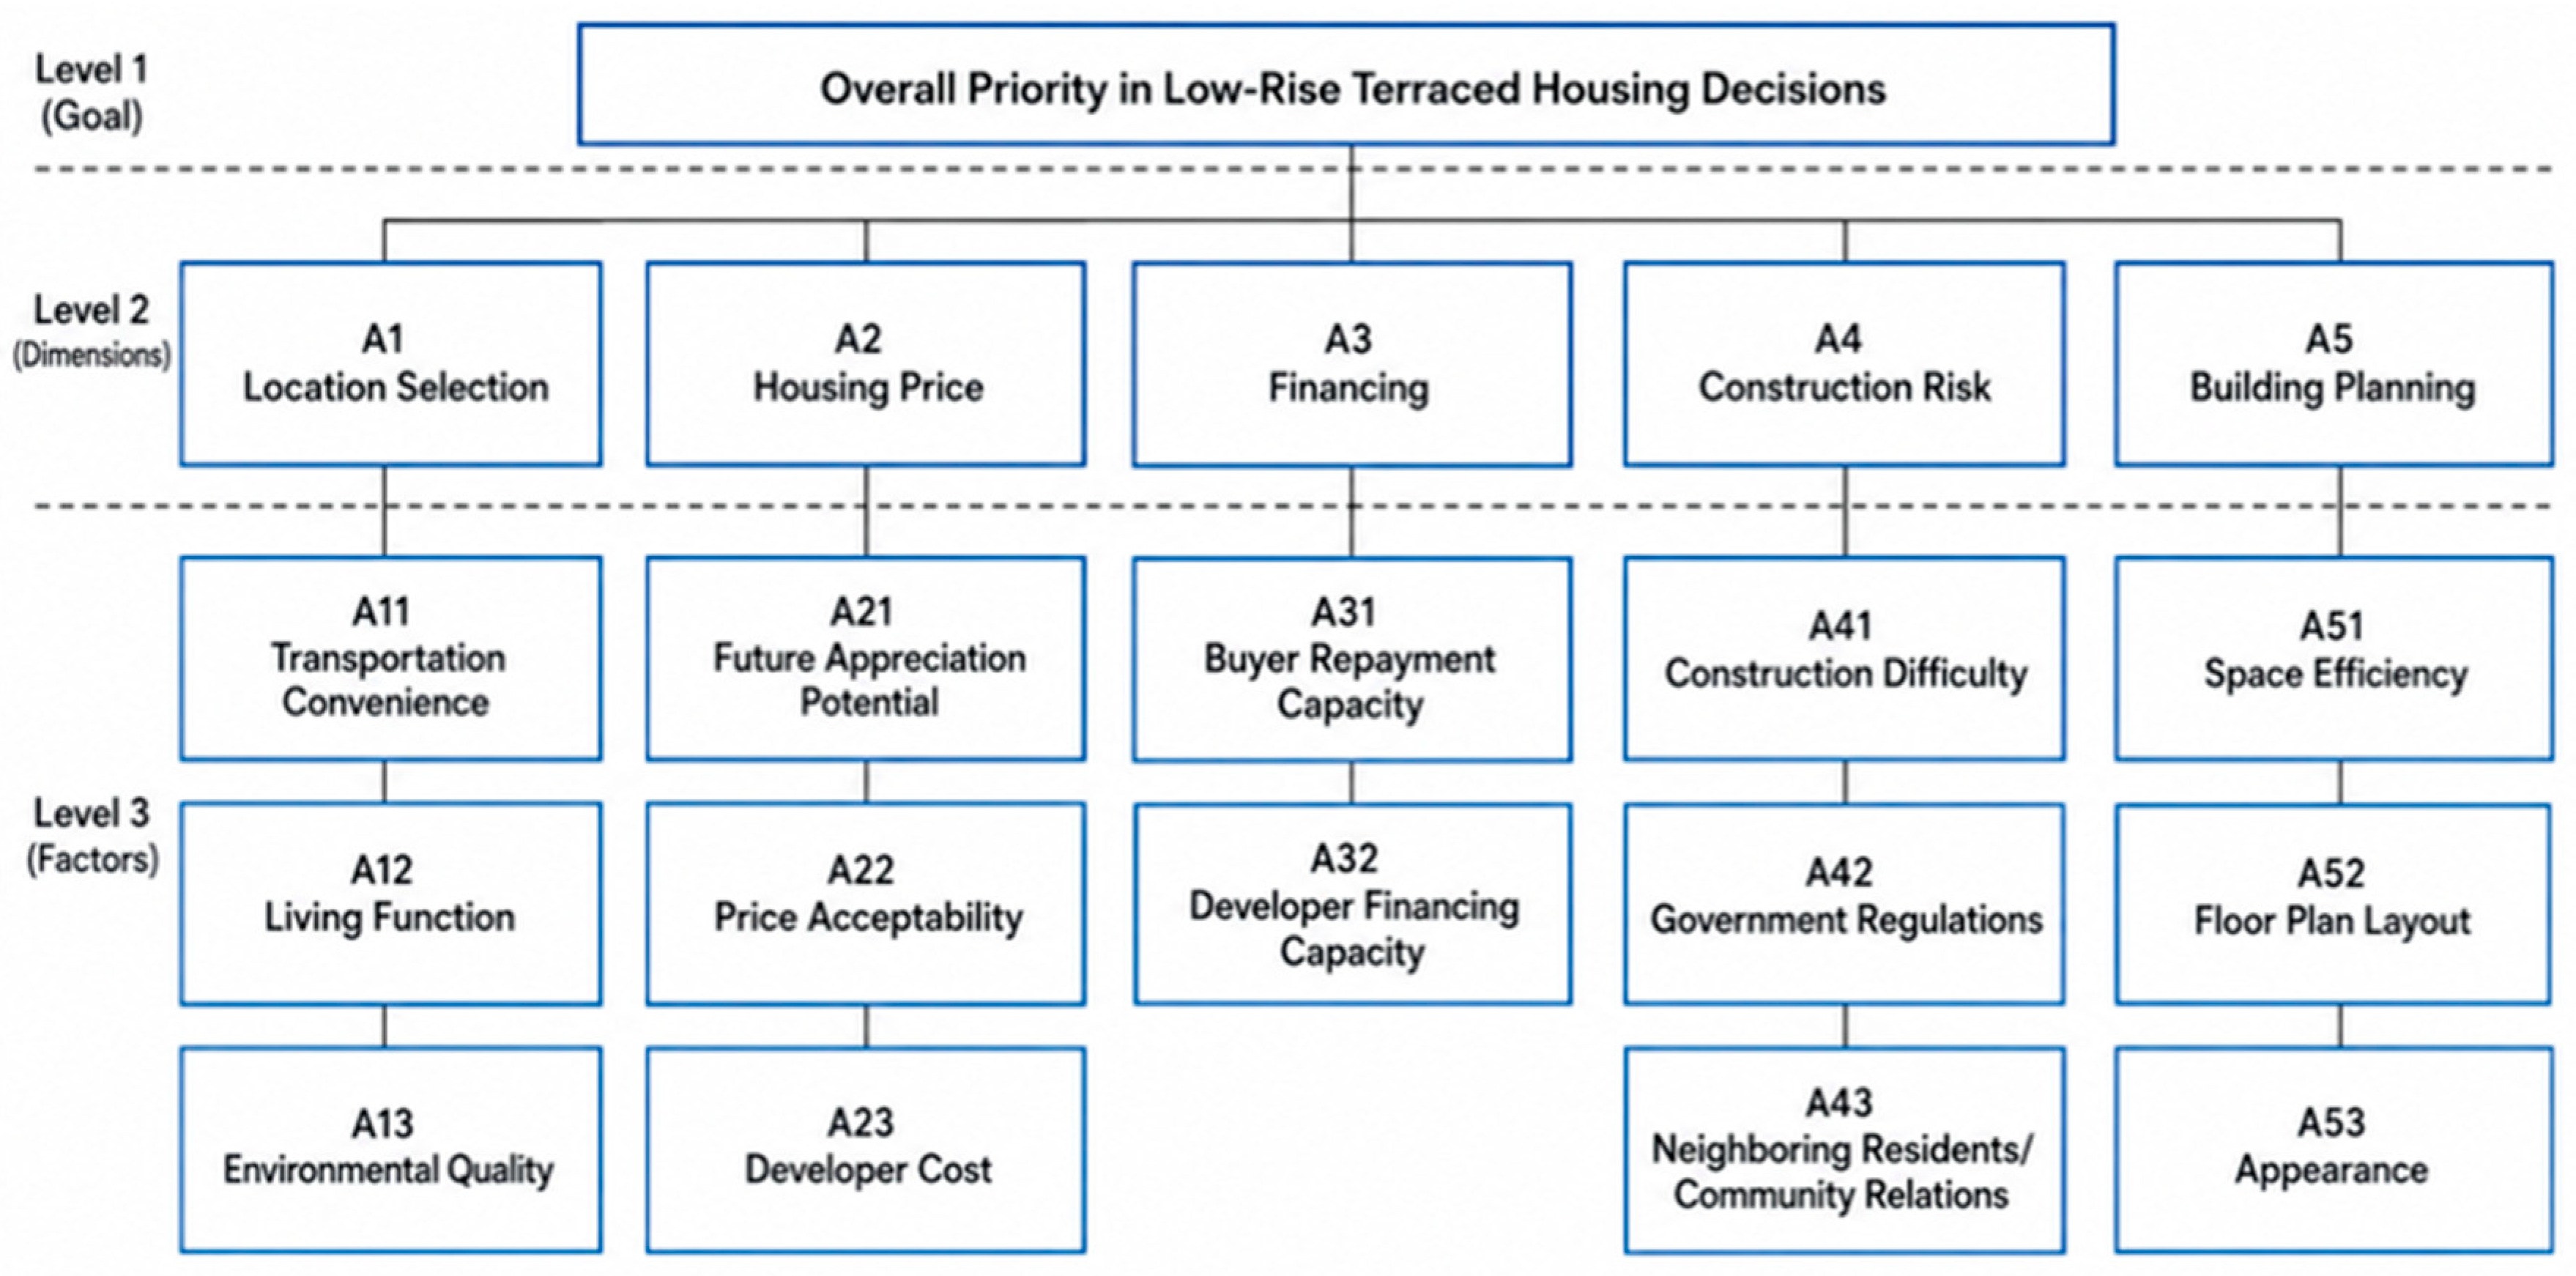
We designed a three-level hierarchy for evaluating low-rise terraced housing development and purchase decisions:
  • Level 1 (Goal): Overall priority in terraced housing decisions.
  • Level 2 (Dimensions): Five key dimensions.
    A1. Location Selection: Site characteristics and accessibility.
    A2. Housing Price: Cost and value considerations.
    A3. Financing: Capital and loan capacity.
    A4. Construction Risk: Technical and regulatory challenges.
    A5. Building Planning: Design and layout attributes.
  • Level 3 (Factors): Fourteen specific factors.
A1. Location Selection (3 factors): - A11. Transportation Convenience: Accessibility by both road and public transport, encompassing proximity to major roads, highway interchanges, bus routes, and commuting time to key employment centers. In non-metropolitan contexts, road-based commuting dominates, but access to public transit remains relevant for younger and car-free households. - A12. Living Function: Proximity to schools, hospitals, shopping, and daily services. - A13. Environmental Quality: Air quality, noise levels, green space, and neighborhood character.
A2. Housing Price (3 factors): - A21. Future Appreciation Potential: Expected property value growth based on area development trends. - A22. Price Acceptability: Alignment between asking price and buyer willingness to pay. - A23. Developer Cost: Total development cost including land acquisition, construction, and financing.
A3. Financing (2 factors): - A31. Buyer Repayment Capacity: Buyer’s ability to afford down payment and monthly mortgage payments. - A32. Developer Financing Capacity: Developer’s access to equity and debt financing for project execution.
A4. Construction Risk (3 factors): - A41. Construction Difficulty: Site conditions, structural complexity, and technical challenges. - A42. Government Regulations: Zoning, building codes, seismic requirements, and permit processes. - A43. Neighboring Residents/Community Relations: This factor captures stakeholder concerns arising from the immediate residential neighborhood, but each group approaches it from a structurally distinct vantage point.
Developer interpretation (construction-phase risk): The primary concern is mitigating disputes and damage claims from adjacent property owners during the build—specifically, risks of excavation-induced settlement, noise and vibration complaints, boundary encroachment, and access obstruction. From a project-management perspective, unresolved neighbor conflicts can trigger work stoppages, litigation, and cost overruns.
Homebuyer interpretation (post-occupancy environment): The primary concern is the quality of the surrounding community after move-in—neighbor compatibility, social cohesion, noise management, and the overall living atmosphere. For owner-occupiers in low-rise terraced housing, where shared walls and close proximity are structural features, neighbor relations directly affect residential satisfaction [38].
Both interpretations are legitimate and internally consistent within the AHP framework, which measures relative importance rather than requiring construct identity across groups. The factor label was intentionally kept broad to allow each respondent group to weight it according to the dimension most salient to their decision context. We acknowledge this as a construct-level limitation and recommend that future studies operationalize A43 as two separate factors—one for construction-phase neighbor risk and one for post-occupancy community quality—to enable cleaner cross-group comparison.
A5. Building Planning (3 factors): - A51. Space Efficiency: Ratio of usable area to gross floor area. - A52. Floor Plan Layout: Room configuration, circulation, and functional zoning. - A53. Appearance: Facade design, materials, and aesthetic appeal.
This hierarchy was developed through the literature review and consultation with three experienced construction managers and two real estate agents in Changhua County. All fourteen factors are directly evaluated through pairwise comparisons; no factors are estimated or derived.
Figure 1 illustrates the three-level AHP hierarchy adopted in this study, consisting of the overall goal, five evaluation dimensions, and fourteen evaluation factors.

3.3. Study Area and Data Collection

This study is designed as an exploratory case study of Changhua County rather than a statistically representative survey of all non-metropolitan Taiwan. The purpose is to identify and compare priority structures within a specific regional housing market.

3.3.1. Why Changhua County?

Changhua County was selected as the study area for several reasons that collectively support its representativeness of non-metropolitan Taiwan.
Demographic scale: With a registered population of approximately 1.27 million (2023), Changhua is the most populous non-metropolitan county in Taiwan, providing a sufficiently large market to support meaningful sample sizes for both developer and homebuyer groups.
Housing stock profile: Low-rise terraced housing accounts for most residential units in Changhua County, consistent with the broader non-metropolitan pattern across central and southern Taiwan. The county’s housing stock is dominated by owner-occupied, low-rise structures rather than the high-rise condominium towers characteristic of metropolitan Taipei or Taichung.
Construction industry structure: The Changhua construction industry is composed primarily of small-to-medium local developers—firms with annual revenue below TWD 300 million—rather than the large national developers that dominate metropolitan markets. This structure is typical of non-metropolitan counties in Taiwan, where project scale and financing capacity differ markedly from metropolitan norms.
Regulatory environment: Changhua County operates under the same national building codes, seismic regulations, and land-use planning framework as other non-metropolitan counties, ensuring that findings related to the Construction Risk dimension (A4) are transferable to comparable jurisdictions.
We acknowledge that Changhua County represents one specific non-metropolitan context, and that priority structures may vary in other non-metropolitan counties (e.g., Yunlin, Chiayi, and Pingtung) that differ in land supply, infrastructure quality, or demographic composition. Replication in additional counties is recommended before broad generalizations are drawn.

3.3.2. Survey Administration

We conducted surveys in Changhua County, Taiwan, between March and May 2024. Two respondent groups were recruited:
Developer group (n = 35): Construction managers, project managers, and senior engineers from local development firms. Inclusion criteria: (1) minimum three years of experience in residential development, (2) direct involvement in at least two terraced housing projects in Changhua County, (3) participation in project planning or site selection decisions. Respondents were recruited through the Changhua County Construction and Development Industry Association. Mean experience: 8.2 years (range: 3–18 years). Firm size: 12 respondents from firms with annual revenue under TWD 100 million, 15 from firms with revenue of TWD 100–300 million, 8 from firms with revenue over TWD 300 million.
Homebuyer group (n = 58): Individuals who purchased terraced housing units in Changhua County between January 2022 and March 2024. Inclusion criteria: (1) primary residence purchase (not investment), (2) purchase decision made within the past two years, (3) willingness to complete a 30 min questionnaire. Respondents were recruited through real estate agencies, homeowner associations, and snowball sampling. Age distribution: 12 respondents aged 25–34, 23 aged 35–44, 16 aged 45–54, 7 aged 55–64. Household income: 18 respondents with annual income under TWD 1 million, 26 with income of TWD 1–1.5 million, 14 with income over TWD 1.5 million.
Each respondent completed a structured AHP questionnaire consisting of pairwise comparison matrices. The questionnaire included the following:
  • 1 matrix comparing the 5 dimensions (10 pairwise comparisons).
  • 1 matrix for A1 factors (3 comparisons).
  • 1 matrix for A2 factors (3 comparisons).
  • 1 matrix for A3 factors (1 comparison).
  • 1 matrix for A4 factors (3 comparisons).
  • 1 matrix for A5 factors (3 comparisons).
Total: 23 pairwise comparisons per respondent. Questionnaires were administered in person or via video call. Each comparison was explained verbally, and respondents were asked to indicate their preference using Saaty’s 1–9 scale. Questionnaires with CR > 0.10 at any level were flagged, and respondents were asked to review and revise inconsistent comparisons. A total of 11 questionnaires (8 from developers and 3 from homebuyers) required one round of revision; no questionnaire required more than one revision cycle. After revision, all questionnaires achieved CR ≤ 0.10.
Individual responses were aggregated using the geometric mean method, which preserves the reciprocal property of pairwise comparison matrices [12]. For each pairwise comparison, the geometric mean of all respondents’ judgments was calculated and used to construct group-level comparison matrices for developers and homebuyers.
Because recruitment was conducted through professional associations, real estate agencies, homeowner associations, and snowball sampling, the exact number of individuals approached, the response rate, and the number of individuals declining participation were not systematically recorded. This limitation is acknowledged in Section 5.4.

3.4. Consistency Check

The present study is intended as an exploratory comparison of aggregated AHP priorities rather than inferential statistical testing. Accordingly, the findings of this study should be interpreted as exploratory comparisons of stakeholder priorities rather than formal statistical inference.
All AHP calculations were performed using Microsoft Excel. Pairwise comparison matrices were constructed for each respondent, and priority vectors were derived using the principal eigenvector method. Consistency indices and consistency ratios were calculated following Saaty’s procedure. The Spearman rank correlation reported in Appendix A was computed using Python 3.11 and SciPy (scipy.stats.spearmanr).
Consistency ratios (CRs) were calculated at each level of the hierarchy for both groups. Table 1 reports CR values for all comparison matrices.
All consistency ratios are well below Saaty’s 0.10 threshold, indicating that both groups provided internally consistent judgments. The A3 dimension has only two factors, requiring only one pairwise comparison, which by definition is perfectly consistent (CR = 0.000).
Because the objective of this study was an exploratory comparison of aggregated stakeholder priorities, formal sensitivity analysis was not performed.


4. Results

4.1. Dimension-Level Priorities

Key findings:
  • Developers prioritize Construction Risk (A4) with a weight of 0.368, nearly twice the weight of the second-ranked dimension (Housing Price, 0.243). This may reflect developers’ focus on regulatory compliance, technical feasibility, and project execution risk.
  • Homebuyers prioritize Location Selection (A1) with a weight of 0.412, substantially higher than all other dimensions. This may reflect homebuyers’ emphasis on accessibility, daily convenience, and neighborhood quality.
  • The largest divergence is in Construction Risk (A4): Developers assign 0.368, homebuyers assign 0.117, a gap of 0.251 points. Developers rank it first; homebuyers rank it fourth.
  • The second-largest divergence is in Location Selection (A1): Homebuyers assign 0.412, developers assign 0.191, a gap of 0.221 points. Homebuyers rank it first; developers rank it third.
  • Housing Price (A2) shows relative alignment: Developers assign 0.243 (rank 2), homebuyers assign 0.228 (rank 3), a difference of only 0.015 points. Both groups recognize price as a critical factor.
  • Financing (A3) and Building Planning (A5) are lower priorities for both groups, though homebuyers assign slightly higher weight to Building Planning (0.126 vs. 0.117).
A comparison of the dimension-level priorities between developers and homebuyers is presented in Table 2.
These results indicate distinct decision logics. The results suggest that developers may place greater emphasis on regulatory and technical constraints in their planning process. The results suggest that homebuyers may place greater emphasis on location and lifestyle preferences during residential purchase decisions. The minimal overlap in top priorities suggests potential misalignment in project planning and marketing strategies.

4.2. Factor-Level Priorities Within Dimensions

Table 3, Table 4, Table 5, Table 6 and Table 7 present local weights (within each dimension) for all fourteen factors.
Within Location Selection, both groups rank Transportation Convenience first, but homebuyers assign substantially higher weight (0.541 vs. 0.428). Homebuyers assign lower weight to Environmental Quality (0.162 vs. 0.260), possibly reflecting budget constraints that prioritize accessibility over neighborhood amenities.
Within Housing Price, developers prioritize Price Acceptability (0.405), which may reflect concern about market absorption and sales velocity. Homebuyers prioritize Future Appreciation Potential (0.486), which may reflect investment considerations and long-term value. Homebuyers assign low weight to Developer Cost (0.163), which is primarily a supply-side concern.
Within Financing, developers prioritize Developer Financing Capacity (0.613), which may reflect the importance of securing construction loans and managing cash flow. Homebuyers prioritize Buyer Repayment Capacity (0.621), which may reflect affordability constraints and mortgage qualification. The rank inversion is expected given the different roles of the two groups.
Within Construction Risk, developers prioritize Government Regulations (0.413), which may reflect the complexity of zoning, building codes, and seismic compliance. Homebuyers prioritize Neighboring Residents (0.568), which may reflect concerns about community relations, noise, and neighborhood stability. This divergence is pronounced: developers rank Government Regulations first and Neighboring Residents third; homebuyers rank Neighboring Residents first and Government Regulations third.
Because A43 may reflect construction-phase neighbor risk for developers and post-occupancy community quality for homebuyers, the cross-group comparison of this factor should be interpreted as a comparison of relative importance under a broad neighborhood-relations construct, rather than as a strict construct-identical measurement.
Within Building Planning, developers prioritize Space Efficiency (0.385), which may reflect cost control and profit margin considerations. Homebuyers prioritize Floor Plan Layout (0.419), which may reflect livability and functional preferences. Appearance receives similar weight from both groups (0.287 vs. 0.284).

4.3. Global Factor Rankings

The global ranking of A43 should therefore be interpreted with caution because its practical meaning differs between the two respondent groups.
A comparison of the global factor weights and rankings between developers and homebuyers is presented in Table 8.
Key findings:
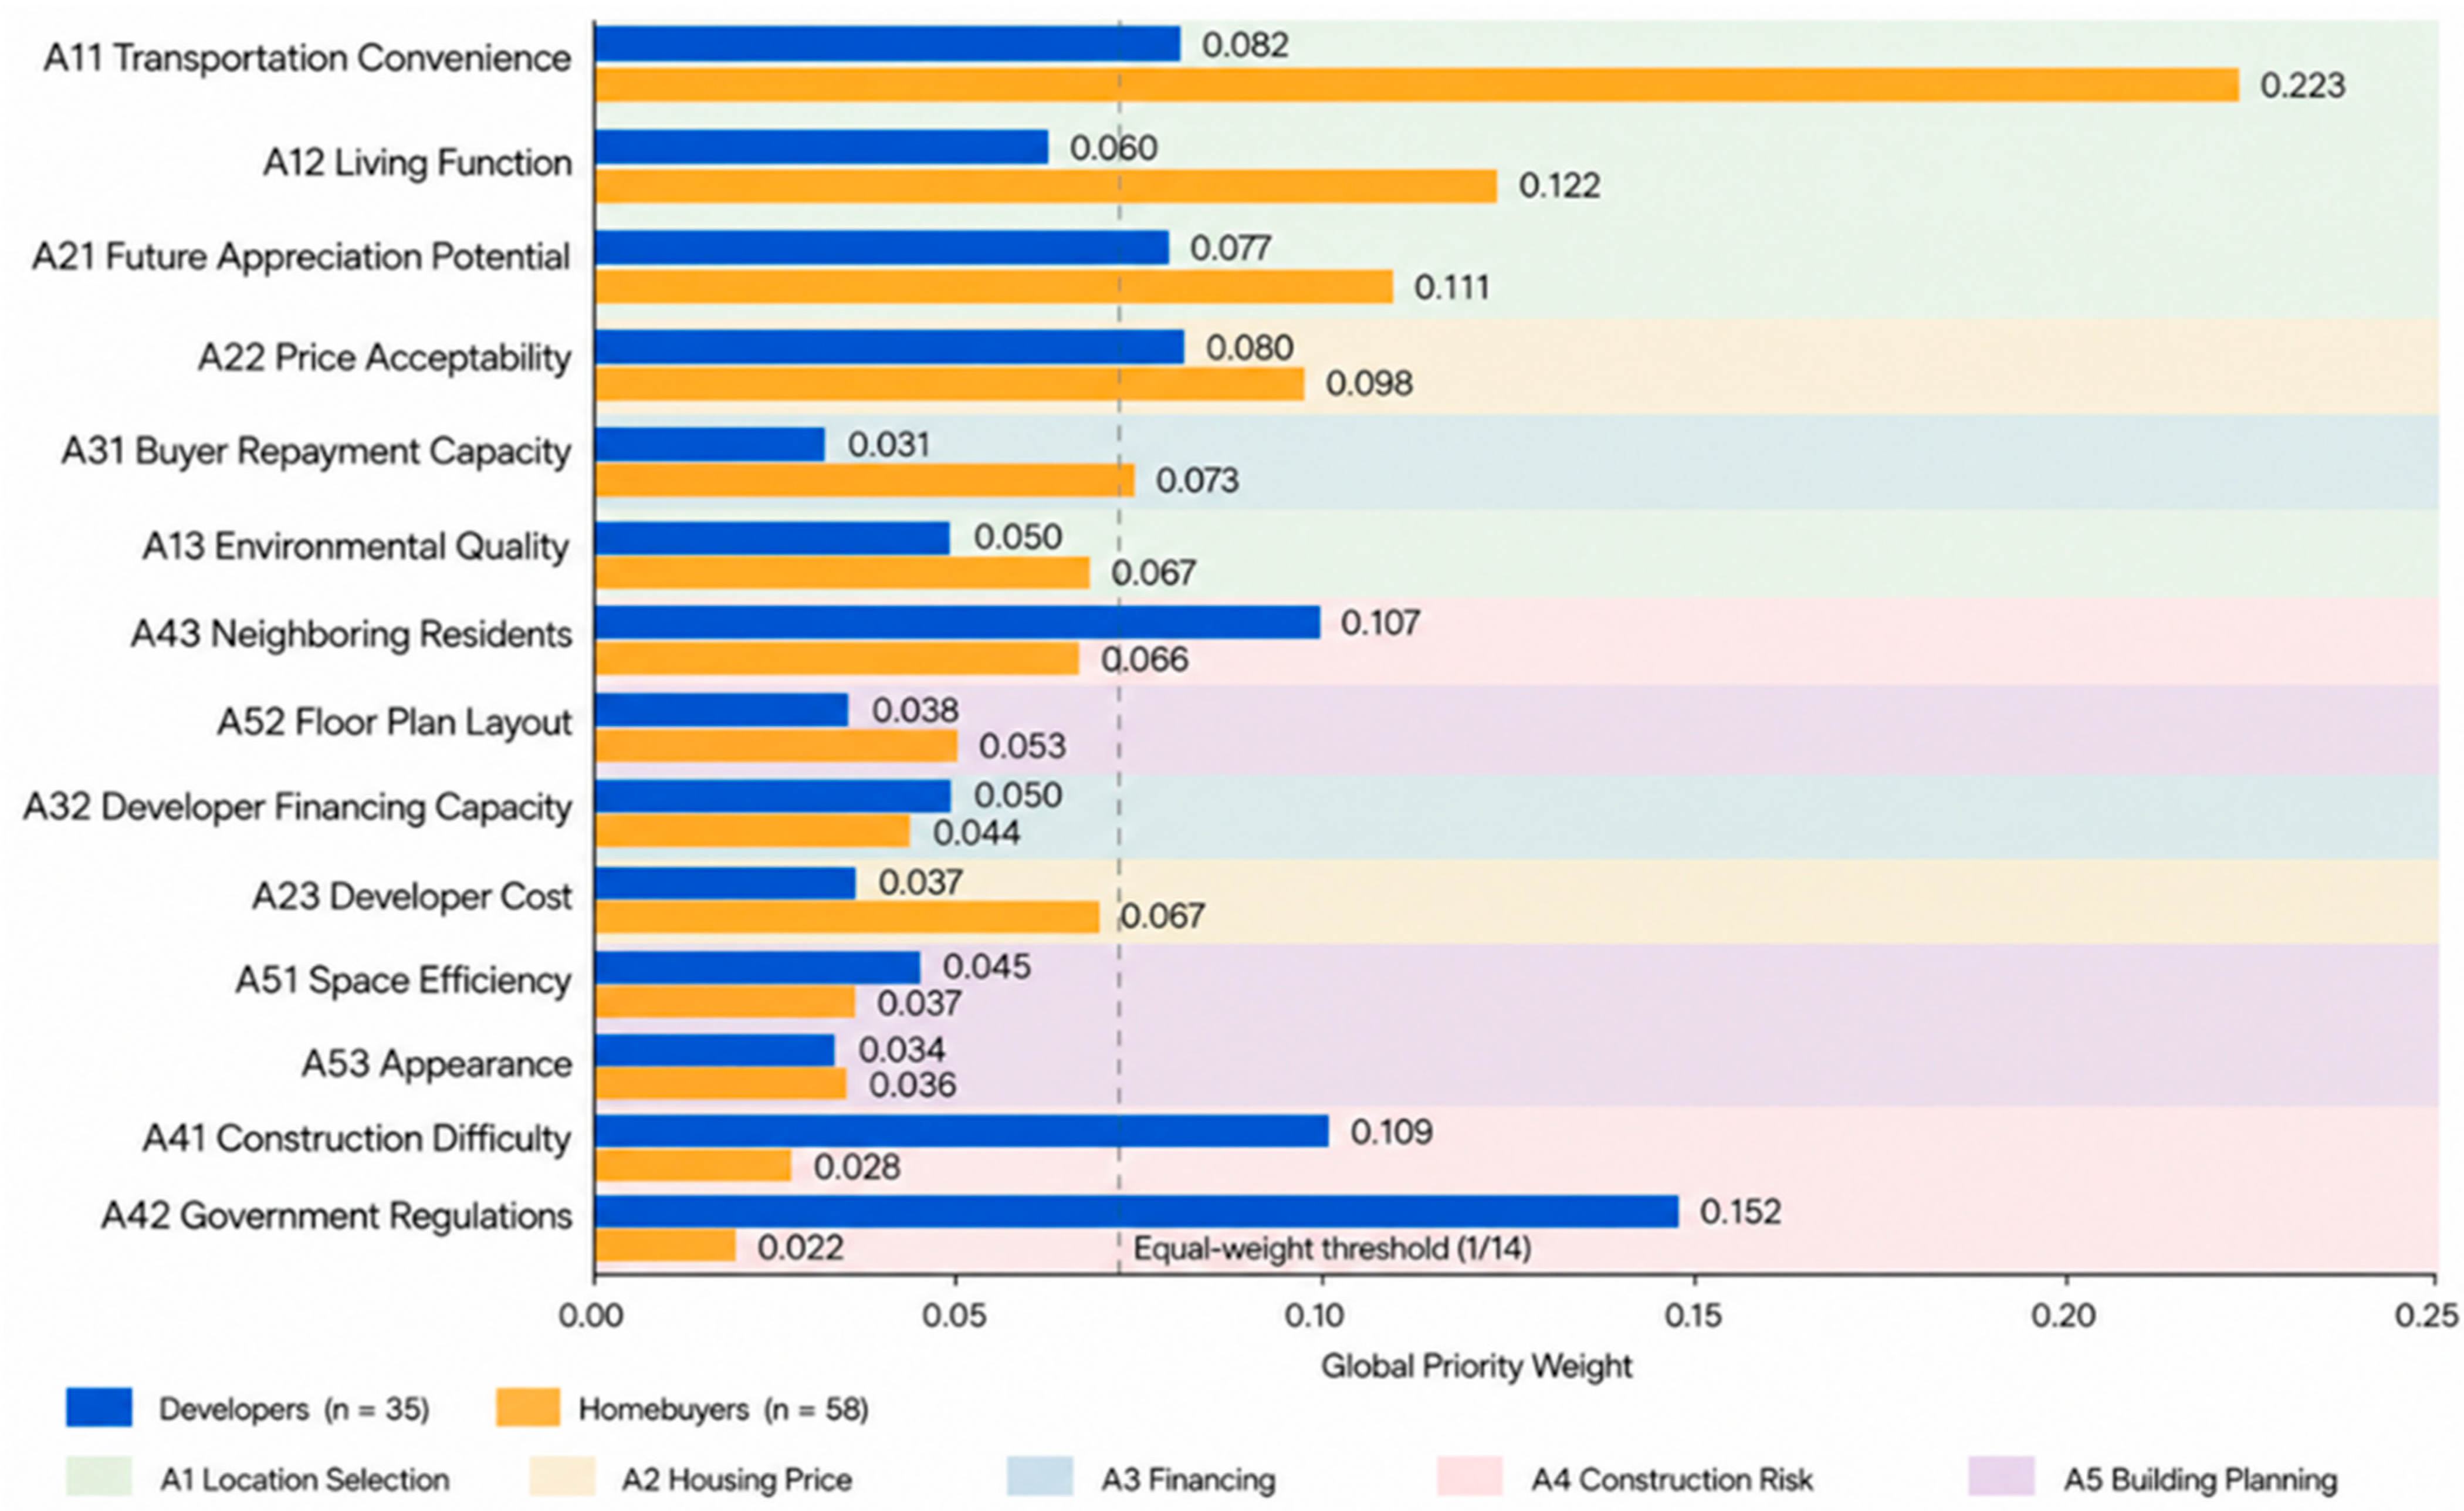
  • Transportation Convenience (A11) ranks first for homebuyers but fifth for developers, with a difference of 0.141 points—the largest absolute divergence at the factor level.
  • Government Regulations (A42) ranks first for developers but fourteenth for homebuyers, with a difference of 0.130 points—the second-largest absolute divergence.
  • Construction Difficulty (A41) and Neighboring Residents (A43) rank second and third for developers (0.109 and 0.107), but thirteenth and seventh for homebuyers (0.028 and 0.066). Developers’ focus on construction execution is not mirrored in homebuyer priorities.
  • Living Function (A12) and Future Appreciation Potential (A21) rank second and third for homebuyers (0.122 and 0.111), but eighth and sixth for developers (0.060 and 0.077). Homebuyers’ emphasis on location quality and investment value is not fully reflected in developer priorities.
  • Price Acceptability (A22) shows the closest alignment: developers rank it fourth (0.098), homebuyers rank it fourth as well (0.080). Both groups recognize the importance of pricing strategy relative to market conditions.
  • Appearance (A53) ranks near the bottom for both groups (developers rank 13 and homebuyers rank 12), suggesting facade design is a lower priority than functional and location attributes for both stakeholders.
Figure 2 illustrates that developers’ priority profile is heavily weighted toward Construction Risk factors (A41, A42, and A43), while homebuyers’ profile is heavily weighted toward Location Selection factors (A11 and A12) and Future Appreciation Potential (A21).

4.4. Rank-Order Correlation

To quantify the overall divergence, we calculated the Spearman rank correlation coefficient (ρ) between the two groups’ global weights across all fourteen factors. Ranks were assigned using the average method to handle tied weights (A13 and A32 share developer rank 9.5; A23 and A51 share homebuyer rank 10.5). The rank differences (di) and their squares are reported in Appendix A.
The result is ρ = −0.077 (p = 0.788, n = 14), indicating no statistically significant rank-order agreement. The negative sign reflects a weak inverse tendency: factors ranked highly by developers tend to rank lower for homebuyers, and vice versa. This is consistent with the pronounced rank inversions observed at both dimension and factor levels. The non-significant p-value should be interpreted cautiously: with only 14 ranked items, the test has limited statistical power, and a non-significant result does not preclude substantive divergence. The absolute rank differences—particularly for A42 (d = −13.0), A41 (d = −11.0), and A31 (d = +9.0)—are substantively large and are best read alongside the dimension-level weight comparisons rather than in isolation.

5. Discussion

5.1. Interpretation of Dimension-Level Divergence

The dimension-level results reveal two distinct decision logics. Developers prioritized Construction Risk (0.368), which may reflect the operational realities of project execution, including regulatory compliance, site conditions, and construction coordination. The 2022 Building Technical Regulations revision, which increased seismic design requirements, has heightened developers’ focus on regulatory compliance [3]. In interviews, several construction managers noted that permit approval timelines and seismic engineering costs are now primary concerns in project feasibility analysis.
Homebuyers prioritized Location Selection (0.412), which may reflect the well-established finding in residential decision-making research that location is the most important and least changeable attribute of a home [10,11]. In non-metropolitan markets, where car ownership is nearly universal, Transportation Convenience (A11) primarily reflects commuting time to workplaces in Changhua City or Taichung, rather than public transit access [4]. Living Function (A12) reflects proximity to schools, hospitals, and shopping, which are key determinants of daily quality of life [5].
The 0.251-point gap in Construction Risk and 0.221-point gap in Location Selection represent the largest dimension-level divergences. These gaps suggest that developers may place comparatively less emphasis on location factors that are salient to buyers, while buyers may be less aware of the regulatory and technical constraints that shape project feasibility. This potential divergence may have implications for site selection: developers may select sites based on regulatory ease and construction cost, while buyers evaluate sites based on accessibility and neighborhood quality. If these criteria are not correlated—for example, if sites with favorable zoning are located in less accessible areas—developers may need to pay closer attention to how such sites are perceived by buyers.
Housing Price (A2) shows relative alignment (0.243 vs. 0.228), suggesting that both groups recognize price as a critical factor. However, the internal composition differs: developers prioritize Price Acceptability (A22), which may reflect concern about market absorption, while homebuyers prioritize Future Appreciation Potential (A21), which may reflect investment considerations. This suggests that developers may focus more on short-term pricing considerations, while buyers may focus more on long-term value.

5.2. Interpretation of Factor-Level Divergence

At the factor level, the most pronounced divergence is in Government Regulations (A42): developers rank it first (0.152), homebuyers rank it fourteenth (0.022). This difference may reflect the asymmetry of regulatory burden: developers bear the direct cost and time burden of permit approvals, seismic engineering, and code compliance, while buyers experience regulatory compliance only indirectly through price and delivery timelines. Several developer respondents in this study indicated that seismic compliance requirements introduced by the 2022 Building Technical Regulations revision [3] had meaningfully increased construction costs, and that permit approval processes contributed to project start delays. Homebuyers, by contrast, in our survey rarely raised concerns about seismic design or permit status during purchase decisions.
The second-largest divergence is in Transportation Convenience (A11): homebuyers rank it first (0.223), and developers rank it fifth (0.082). These findings suggest that developers may place relatively less emphasis on accessibility during site selection. In non-metropolitan markets, land availability is less constrained than in metropolitan areas, giving developers more site options [17]. However, if developers prioritize sites with favorable zoning or lower land costs over sites with better accessibility, they may need to pay closer attention to how accessibility is perceived by potential buyers.
Neighboring Residents (A43) shows an interesting pattern: developers rank it third (0.107), homebuyers rank it sixth (0.066). Developers’ concern reflects construction-phase risks: conflicts with adjacent property owners over noise, dust, access, and property boundaries can delay construction and increase costs [20]. Homebuyers’ concern reflects post-purchase neighborhood quality: compatibility with neighbors, community cohesion, and social environment [11]. Both groups value this factor, but for different reasons and at different project stages. We acknowledge that A43 may be interpreted as two partially distinct constructs across groups. However, both interpretations share a common core—stakeholder relationships in the immediate residential vicinity—which justifies their treatment as a single AHP factor. The cross-group weight comparison for A43 should therefore be read as a relative importance comparison rather than a construct-identical comparison; the modest rank difference (rank 3 vs. rank 6) is consistent with this nuanced reading. We acknowledge this as a construct-level limitation: future studies could operationalize A43 as two separate factors—one for construction-phase neighbor risk and one for post-occupancy community quality—to enable cleaner cross-group comparison.
Future Appreciation Potential (A21) ranks third for homebuyers (0.111) but only sixth for developers (0.077). This may reflect homebuyers’ investment mindset: in Taiwan, homeownership is widely viewed as a wealth-building strategy, and buyers evaluate properties based on expected capital gains [24]. Developers, by contrast, may focus more on current market conditions and short-term pricing rather than long-term appreciation. This divergence suggests that developers may place relatively less emphasis on location and neighborhood attributes that drive long-term value, focusing instead on short-term cost control and pricing considerations.

5.3. Implications for Practice

These findings have several implications for residential development practice in non-metropolitan markets:
1. Developers may consider incorporating buyer location priorities into site selection decisions. Developers currently prioritize regulatory ease and construction cost, but buyers prioritize accessibility and daily convenience. Developers may benefit from evaluating potential sites on buyer-relevant criteria (commuting time, school proximity, shopping access) alongside traditional feasibility criteria. Quantitative site scoring models that weigh both supply-side and demand-side factors may improve site selection decisions.
2. Developers may consider addressing priority divergence in marketing and sales communication. Buyers prioritize Transportation Convenience and Living Function, but developers may emphasize construction quality or regulatory compliance. Sales materials and model home presentations may highlight location attributes, accessibility, and neighborhood amenities. Developers may consider providing quantitative accessibility data (e.g., driving time to major employment centers and walking distance to schools) rather than generic location descriptions.
3. Developers may consider balancing cost efficiency with buyer preferences. Developers prioritize Space Efficiency (A51), but buyers prioritize Floor Plan Layout (A52). Developers may consider avoiding over-optimizing for space efficiency at the expense of livability. For example, reducing hallway width or eliminating storage space may improve space efficiency but reduce buyer satisfaction. Buyer focus groups or preference surveys during design development can identify layout features that buyers value most.
4. Developers may consider communicating regulatory compliance as a value proposition. Developers rank Government Regulations first, but buyers rank it fourteenth. However, seismic compliance and building code adherence are important for long-term safety and value. Developers may consider communicating compliance as a quality signal rather than a cost burden. For example, marketing materials could highlight seismic design features, structural engineering certifications, or third-party quality inspections.
5. Developers may consider aligning pricing strategy with buyer investment mindset. Buyers prioritize Future Appreciation Potential, suggesting that they evaluate properties based on expected capital gains. Developers may consider providing market data on historical price trends, area development plans, and infrastructure investments that support appreciation expectations. Transparent pricing that aligns with buyer value perceptions could be associated with smoother sales processes and reduced price negotiation friction.

5.4. Limitations

This study has several limitations. First, the sample is geographically restricted to Changhua County, a non-metropolitan market in central Taiwan. While this study is explicitly framed as a non-metropolitan investigation, Changhua County represents one specific socioeconomic and regulatory context within a diverse non-metropolitan landscape. Priority structures may differ in other non-metropolitan counties—such as Yunlin, Chiayi, or Pingtung—which vary in demographic composition, land supply, and local construction industry maturity. Caution is therefore warranted when extrapolating findings to “non-metropolitan Taiwan” as a whole. Replication studies in additional non-metropolitan counties are needed before broad generalizations can be drawn. Priority structures in metropolitan markets (Taipei, Taichung, and Kaohsiung) are also likely to differ substantially, particularly for the A2 (Housing Price) and A3 (Financing) dimensions.
Second, the developer sample consists of construction managers and project managers, who may have different priorities than firm owners or financial decision-makers. Future research should compare priorities across different roles within development firms.
Third, the homebuyer sample consists of recent purchasers (2022–2024), whose priorities may reflect current market conditions (high interest rates, elevated construction costs, and post-pandemic preferences). Priorities may shift as market conditions change. Longitudinal studies tracking priority changes over time would provide additional insights.
Fourth, AHP relies on pairwise comparisons, which can be cognitively demanding for respondents. Although we achieved acceptable consistency ratios (CR < 0.10), some respondents may have found the comparison task difficult. Alternative methods such as Best–Worst Scaling or discrete choice experiments could complement AHP findings.
Fifth, the hierarchy includes fourteen factors, which may not capture all relevant decision criteria. For example, we did not include factors related to property management, community facilities, or smart home technology. Future research could expand the hierarchy or use exploratory methods (e.g., interviews and focus groups) to identify additional factors.
Sixth, we aggregated individual responses using geometric means to construct group-level comparison matrices. This approach assumes that group priorities can be represented by a single consensus matrix. However, within-group heterogeneity may be substantial. For example, younger and older homebuyers may have different priorities. Future research could use cluster analysis or latent class models to identify priority segments within each group.
Seventh, formal sensitivity analysis was not conducted in this study because the objective was an exploratory comparison of aggregated group priorities. This limitation is acknowledged in the present study, and future research may test the stability of AHP weights using bootstrapping, permutation tests, or individual-level comparisons to assess the robustness of the priority structures reported here.
Because respondents were recruited through professional associations, real-estate agencies, homeowner associations, and snowball sampling, some degree of selection bias cannot be excluded.

6. Conclusions

This study quantified priority structures of developers and homebuyers in the low-rise terraced housing market of non-metropolitan Taiwan using the Analytic Hierarchy Process. We surveyed 35 construction managers and 58 homebuyers, who evaluated an identical five-dimension, fourteen-factor hierarchy through pairwise comparisons. The results reveal pronounced divergence in priorities.
Developers prioritize Construction Risk (0.368), with Government Regulations (A42) ranking first globally (0.152). Homebuyers prioritize Location Selection (0.412), with Transportation Convenience (A11) ranking first globally (0.223). The dimension-level gap in Construction Risk (0.251 points) and Location Selection (0.221 points) indicates markedly different decision logics. At the factor level, rank inversions are pronounced: Transportation Convenience ranks first for homebuyers but fifth for developers; Government Regulations ranks first for developers but fourteenth for homebuyers. The Spearman rank correlation between the two groups’ factor rankings is ρ = −0.077 (p = 0.788), indicating that no statistically significant rank-order association was detected. Therefore, the Spearman result should be interpreted descriptively and alongside the observed absolute rank differences.
These findings suggest that supply-side planning priorities and demand-side purchase considerations may diverge in meaningful ways. Developers focus on regulatory compliance, construction feasibility, and cost control, while buyers focus on accessibility, daily convenience, and investment value. This potential divergence may inform site selection, product design, pricing strategy, and marketing communication.
We recommend that developers incorporate buyer location priorities into site selection models, emphasize accessibility and neighborhood amenities in marketing materials, balance space efficiency with livability in floor plan design, communicate regulatory compliance as a quality signal, and provide market data to support buyer appreciation expectations. Future research should replicate this study in other markets, compare priorities across different roles within development firms, track priority changes over time, and explore within-group heterogeneity using segmentation methods.
By quantifying the priority divergence between developers and homebuyers, this study provides exploratory empirical evidence that may help developers better understand potential differences between supply-side planning priorities and homebuyer purchase considerations in regional housing markets.
The interpretation of A43 should therefore remain context-dependent because the factor represents a broad neighborhood-related construct that differs between stakeholder groups.

Author Contributions

Conceptualization, T.-C.L. and T.-C.T.; methodology, T.-C.L. and T.-C.T.; software, T.-C.L.; validation, T.-C.T.; formal analysis, T.-C.L.; investigation, T.-C.L.; resources, T.-C.L. and T.-C.T.; data curation, T.-C.L.; writing—original draft preparation, T.-C.L.; writing—review and editing, T.-C.L. and T.-C.T.; visualization, T.-C.L.; supervision, T.-C.T.; project administration, T.-C.L. and T.-C.T. All authors have read and agreed to the published version of the manuscript.

Funding

This research received no specific grant from any funding agency in the public, commercial, or not-for-profit sectors.

Institutional Review Board Statement

This study involved an anonymous questionnaire survey of construction professionals and homebuyers. The research did not involve medical intervention, biological samples, vulnerable populations, or the collection of personally identifiable information. According to the applicable institutional regulations, this type of anonymous survey was exempt from Institutional Review Board review. Therefore, no formal IRB approval number is available.

Informed Consent Statement

Participation was voluntary. Before completing the questionnaire, respondents were informed of the research purpose and the academic use of the collected data. Completion of the anonymous questionnaire was regarded as informed consent.

Data Availability Statement

The data presented in this study are available from the corresponding author on request.

Acknowledgments

We thank the Changhua County Construction and Development Industry Association and all survey respondents for their assistance in data collection. During manuscript preparation, we used AI-assisted writing tools for language editing and refinement. We have reviewed and edited all output, and take full responsibility for the content of this publication.

Conflicts of Interest

The authors declare no conflicts of interest.

Appendix A. Spearman Rank Correlation Calculation

This appendix presents the complete rank-order data and calculation procedure for the Spearman rank correlation coefficient (ρ) reported in Section 4.4.

Appendix A.1. Global Weights and Ranks

All fourteen factors are ranked in descending order of global weight within each group. Tied global weights receive the average of the tied positions (average-rank method). Two ties are present: developer ranks for A13 and A32 (both 0.0500, sharing ranks 9 and 10 → assigned 9.5); homebuyer ranks for A23 and A51 (both 0.0370, sharing ranks 10 and 11 → assigned 10.5).
Table A1. Spearman rank correlation calculation for global factor rankings.
FactorCodeDev WeightDev Rank (RD)HB WeightHB Rank (RH)di = RD − RHdi2
Transportation ConvenienceA110.08205.00.22301.0+4.016.00
Living FunctionA120.06008.00.12202.0+6.036.00
Future Appreciation PotentialA210.07706.00.11103.0+3.09.00
Price AcceptabilityA220.09804.00.08004.00.00.00
Buyer Repayment CapacityA310.031014.00.07305.0−9.081.00
Environmental QualityA130.05009.50.06706.0+3.512.25
Neighboring ResidentsA430.10703.00.06607.0−4.016.00
Floor Plan LayoutA520.038012.00.05308.0+4.016.00
Developer Financing CapacityA320.05009.50.04409.0+0.50.25
Developer CostA230.06707.00.037010.5−3.512.25
Space EfficiencyA510.045011.00.037010.5+0.50.25
AppearanceA530.034013.00.036012.0+1.01.00
Construction DifficultyA410.10902.00.028013.0−11.0121.00
Government RegulationsA420.15201.00.022014.0−13.0169.00
Sum 1.0000 0.9990 490.00
Note: Homebuyer weights sum to 0.9990 due to rounding of four-decimal-place values; the discrepancy (0.001) is negligible and does not affect rank assignments.

Appendix A.2. Formula and Calculation

The Spearman rank correlation coefficient is defined as
ρ = 1 6 d i 2 n ( n 2 1 )
Substituting n = 14 and Σdi2 = 490.00,
ρ = 1 6 × 490 14 × ( 196 1 ) = 1 2940 2730 = 1 1.0769 = 0.0769

Appendix A.3. Tie Correction

Because two tie groups exist (one in developer ranks and one in homebuyer ranks), we applied the tie-corrected Spearman formula using the Pearson correlation of the rank vectors, computed via the scipy.stats.spearmanr function (Python 3.11, SciPy 1.11). This yields
ρ = −0.077, p = 0.788 (two-tailed, n = 14)
The tie correction has a negligible effect (−0.0769 vs. −0.0793 before rounding), confirming the robustness of the result.

Appendix A.4. Interpretation

The negative coefficient indicates a weak inverse tendency: factors assigned high priority by developers tend to be assigned lower priority by homebuyers, and vice versa. The non-significant p-value (0.788) should be interpreted cautiously. With only 14 ranked items, the Spearman test has limited statistical power; a non-significant result indicates that the rank correlation cannot be statistically distinguished from zero, not that the two priority structures are similar. The substantive interpretation rests on the magnitude of individual rank differences—A42 (|d| = 13.0), A41 (|d| = 11.0), A31 (|d| = 9.0), A12 (|d| = 6.0), and A43/A52/A11 (|d| = 4.0)—which are large in practical terms and consistent with the dimension-level weight comparisons presented in Section 4.2.

References

  1. Changhua County Government. Changhua County Statistical Yearbook 2023; Department of Budget, Accounting and Statistics: Changhua, Taiwan, 2024. Available online: https://ctrl.chcg.gov.tw/main/main_act3/main.aspx?act_id=413 (accessed on 11 June 2026).
  2. Directorate-General of Budget, Accounting and Statistics (DGBAS), Executive Yuan, Taiwan. Construction Cost Index [Statistical Database]. 2023. Available online: https://www.stat.gov.tw/cp.aspx?n=2665 (accessed on 11 June 2026).
  3. National Land Management Agency (NLMA), Ministry of the Interior, Taiwan. Building Technical Regulations Revision: Seismic Design Requirements. 2022. Available online: https://www.nlma.gov.tw/ch/titlelist/stats (accessed on 11 June 2026).
  4. Zhuang, Z.-Y.; Fu, C.-H. Housing preference structures in east Asia: An empirical study and non-paradigmatic shifts between nearby metropoles. Int. J. Strateg. Prop. Manag. 2023, 27, 1–20. [Google Scholar] [CrossRef] [Scilit]
  5. Wu, K.-K.; Lee, C.-C.; Liang, C.-M. Exploring the factors influencing Kaohsiung residents’ intentions to choose age-friendly housing. Int. J. Environ. Res. Public Health 2020, 17, 7793. [Google Scholar] [CrossRef] [Scilit] [PubMed]
  6. Kok, N.; Monkkonen, P.; Quigley, J.M. Land use regulations and the value of land and housing: An intra-metropolitan analysis. J. Urban Econ. 2014, 81, 136–148. [Google Scholar] [CrossRef] [Scilit]
  7. Hui, E.C.M.; Zhong, J.; Yu, K. The impact of landscape views and storey levels on property prices. Landsc. Urban Plan. 2012, 105, 86–93. [Google Scholar] [CrossRef] [Scilit]
  8. Lai, R.N.; Wang, K. Land-supply restrictions, developer strategies and housing policies: The case of Hong Kong. Int. Real Estate Rev. 1999, 2, 143–159. [Google Scholar] [CrossRef] [Scilit] [PubMed]
  9. Somerville, C.T. Permits, starts, and completions: Structural relationships versus real options. Real Estate Econ. 2001, 29, 161–190. [Google Scholar] [CrossRef] [Scilit]
  10. Kim, J.H.; Pagliara, F.; Preston, J. The intention to move and residential location choice behaviour. Urban Stud. 2005, 42, 1621–1636. [Google Scholar] [CrossRef] [Scilit]
  11. Opoku, R.A.; Abdul-Muhmin, A.G. Housing preferences and attribute importance among low-income consumers in Saudi Arabia. Habitat Int. 2010, 34, 219–227. [Google Scholar] [CrossRef] [Scilit]
  12. Saaty, T.L. The Analytic Hierarchy Process; McGraw-Hill: Columbus, OH, USA, 1980. [Google Scholar]
  13. Mulliner, E.; Smallbone, K.; Maliene, V. An assessment of sustainable housing affordability using a multiple criteria decision making method. Omega 2013, 41, 270–279. [Google Scholar] [CrossRef] [Scilit]
  14. Zavadskas, E.K.; Kaklauskas, A.; Vilutiene, T. Multicriteria evaluation of apartment blocks maintenance contractors: Lithuanian case study. Int. J. Strateg. Prop. Manag. 2009, 13, 319–338. [Google Scholar] [CrossRef] [Scilit]
  15. Ishizaka, A.; Labib, A. Review of the main developments in the analytic hierarchy process. Expert Syst. Appl. 2011, 38, 14336–14345. [Google Scholar] [CrossRef] [Scilit]
  16. Geltner, D.M.; Miller, N.G.; Clayton, J.; Eichholtz, P. Commercial Real Estate Analysis and Investments, 3rd ed.; OnCourse Learning: St. Louis, MO, USA, 2014. [Google Scholar]
  17. Huang, Y.-L.; Clark, W.A.V. Housing tenure choice in transitional urban China: A multilevel analysis. Urban Stud. 2002, 39, 7–32. [Google Scholar] [CrossRef] [Scilit]
  18. Zou, P.X.W.; Zhang, G.; Wang, J. Understanding the key risks in construction projects in China. Int. J. Proj. Manag. 2007, 25, 601–614. [Google Scholar] [CrossRef] [Scilit]
  19. Ling, F.Y.Y.; Hoang, V.T.P. Political, economic, and legal risks faced in international projects: Case study of Vietnam. J. Prof. Issues Eng. Educ. Pract. 2010, 136, 156–164. [Google Scholar] [CrossRef] [Scilit]
  20. Hwang, B.-G.; Zhao, X.; Toh, L.P. Risk management in small construction projects in Singapore: Status, barriers and impact. Int. J. Proj. Manag. 2014, 32, 116–124. [Google Scholar] [CrossRef] [Scilit]
  21. Ling, F.Y.Y.; Kwok, D.H.Y. Enablers for Singapore contractors to internationalize construction services. Constr. Manag. Econ. 2007, 25, 267–275. [Google Scholar] [CrossRef] [Scilit]
  22. Central Bank of the Republic of China (Taiwan). Quarterly Economic Review Q1 2024; Economic Research Department: Taipei, Taiwan, 2024. Available online: https://www.cbc.gov.tw/ (accessed on 11 June 2026).
  23. Chau, K.W.; Wong, S.K.; Yiu, C.Y. Housing quality in the forward contracts market. J. Real Estate Financ. Econ. 2007, 34, 313–325. [Google Scholar] [CrossRef] [Scilit]
  24. Chen, J.; Hao, Q.; Stephens, M. Assessing housing affordability in post-reform China: A case study of Shanghai. Hous. Stud. 2010, 25, 877–901. [Google Scholar] [CrossRef] [Scilit]
  25. Park, C.; Son, M.; Kim, J.; Kim, B.; Ahn, Y.; Kwon, N. TOPSIS and AHP-based multi-criteria decision-making approach for evaluating redevelopment in old residential projects. Sustainability 2025, 17, 7072. [Google Scholar] [CrossRef] [Scilit]
  26. Cabral, M.R.; Blanchet, P. Analytical hierarchical process as a multicriteria decision tool in material selection for prefabricated wood buildings. Buildings 2023, 13, 2973. [Google Scholar] [CrossRef] [Scilit]
  27. Omar, E. Towards a self-sustained house: Development of an analytical hierarchy process system for evaluating the performance of self-sustained houses. MSA Eng. J. 2023, 2, 56–79. [Google Scholar] [CrossRef] [Scilit]
  28. Mokhtar, E.S.; Shuib, K.B.; Mohamad, M.I.; Jaafar, M.; Kasim, N. Geospatial analysis of sustainable living residential site suitability using analytical hierarchy process. Plan. Malays. J. 2023, 21, 234–246. [Google Scholar] [CrossRef] [Scilit]
  29. Akmaludin, A.; Saputra, A.D.; Wibowo, M.A.; Setiawan, R. Application of MCDM-AHP and EDAS methods for selection of the best residential locations areas. Sink. J. Dan Penelit. Tek. Inform. 2024, 8, 2269–2280. [Google Scholar] [CrossRef] [Scilit]
  30. Ramzanpour, M.; Rahimi, R. Prioritization physical resilience criteria for affordable housing locating based on an analytic hierarchy process AHP. In Sustainable Development; IntechOpen: London, UK, 2023. [Google Scholar] [CrossRef] [Scilit]
  31. Nguyen, P.H.; Nguyen, T.L.; Nguyen, T.G.; Nguyen, D.T.; Tran, T.H.; Le, H.C.; Phung, H.T. Streamlining apartment provider evaluation: A spherical fuzzy multi-criteria decision-making model. Heliyon 2023, 9, e22353. [Google Scholar] [CrossRef] [Scilit] [PubMed]
  32. Taylor, K.; Wamuziri, S.; Smith, I. Converting commercial and industrial property into rented residential accommodation: Development of a decision support tool. Facilities 2022, 41, 1–29. [Google Scholar] [CrossRef] [Scilit]
  33. Pinzon Amorocho, J.A.; Hartmann, T. A multi-criteria decision-making framework for residential building renovation using pairwise comparison and TOPSIS methods. J. Build. Eng. 2023, 67, 104596. [Google Scholar] [CrossRef] [Scilit]
  34. Daniel, S.; Ghiaus, C. Multi-criteria decision analysis for energy retrofit of residential buildings: Methodology and feedback from real application. Energies 2023, 16, 902. [Google Scholar] [CrossRef] [Scilit]
  35. Issa, U.H.; Saeed, F.; Miky, Y.; Alqurashi, M.; Osman, E.A.M. Hybrid AHP-fuzzy TOPSIS approach for selecting deep excavation support system. Buildings 2022, 12, 295. [Google Scholar] [CrossRef] [Scilit]
  36. Ji, T.; Wei, H.H.; Sun, Y.; Seo, J.; Chen, J.H. An explorative study of the political, economic, and social factors influencing the development of senior housing: A case study of Hong Kong. Buildings 2023, 13, 617. [Google Scholar] [CrossRef] [Scilit]
  37. Kang, D.; Lee, E.; Ahn, Y.; Kwon, N. Deriving the importance of defects in multi-unit residential buildings using the analytic hierarchy process method. Buildings 2024, 14, 4028. [Google Scholar] [CrossRef] [Scilit]
  38. Galster, G.; Hesser, G.W. Residential satisfaction: Compositional and contextual correlates. Environ. Behav. 1981, 13, 735–758. [Google Scholar] [CrossRef] [Scilit]
Figure 1. Three-level AHP hierarchy for evaluating low-rise terraced housing decisions. Level 1: overall goal; Level 2: five evaluation dimensions (A1–A5); Level 3: fourteen factors (A11–A13, A21–A23, A31–A32, A41–A43, and A51–A53). All fourteen factors were directly surveyed through pairwise comparison questionnaires.
Buildings 16 02769 g001
Figure 2. Global priority weights for all fourteen factors, ranked by homebuyer weight (descending). Paired horizontal bars show developers (blue) vs. homebuyers (orange). Background bands denote dimension groupings (A1–A5). The dashed vertical reference line marks the equal-weight threshold (1/14 ≈ 0.071).
Buildings 16 02769 g002
Table 1. Consistency ratios for developer and homebuyer groups.
LevelMatrixDevelopers (n = 35)Homebuyers (n = 58)
DimensionA1–A50.0280.019
A1 factorsA11–A130.0120.008
A2 factorsA21–A230.0180.015
A3 factorsA31–A320.0000.000
A4 factorsA41–A430.0210.013
A5 factorsA51–A530.0090.011
Note: CR = consistency ratio [12]. All six CR values listed above are well below the 0.10 threshold, confirming acceptable pairwise judgment consistency for both groups. A3 (Financing) comprises only two factors (A31 and A32), yielding a single pairwise comparison and therefore perfect consistency (CR = 0.000) by definition.
Table 2. Dimension-level AHP priorities by respondent group.
DimensionCodeDevelopersHomebuyersDifferenceRank (Dev)Rank (Buyer)
Location SelectionA10.1910.412−0.22131
Housing PriceA20.2430.228+0.01523
FinancingA30.0810.117−0.03655
Construction RiskA40.3680.117+0.25114
Building PlanningA50.1170.126−0.00942
Note: Difference = Developers − Homebuyers. Positive values indicate higher developer priority; negative values indicate higher homebuyer priority.
Table 3. Local factor weights for Location Selection (A1) by respondent group.
FactorCodeDevelopersHomebuyersDifferenceRank (Dev)Rank (Buyer)
Transportation ConvenienceA110.4280.541−0.11311
Living FunctionA120.3120.297+0.01522
Environmental QualityA130.2600.162+0.09833
Note: Local weights sum to 1.0 within dimension A1.
Table 4. Local factor weights for Housing Price (A2) by respondent group.
FactorCodeDevelopersHomebuyersDifferenceRank (Dev)Rank (Buyer)
Future Appreciation PotentialA210.3180.486−0.16821
Price AcceptabilityA220.4050.351+0.05412
Developer CostA230.2770.163+0.11433
Note: Local weights sum to 1.0 within dimension A2.
Table 5. Local factor weights for Financing (A3) by respondent group.
FactorCodeDevelopersHomebuyersDifferenceRank (Dev)Rank (Buyer)
Buyer Repayment CapacityA310.3870.621−0.23421
Developer Financing CapacityA320.6130.379+0.23412
Note: Local weights sum to 1.0 within dimension A3.
Table 6. Local factor weights for Construction Risk (A4) by respondent group.
FactorCodeDevelopersHomebuyersDifferenceRank (Dev)Rank (Buyer)
Construction DifficultyA410.2970.243+0.05422
Government RegulationsA420.4130.189+0.22413
Neighboring ResidentsA430.2900.568−0.27831
Note: Local weights sum to 1.0 within dimension A4.
Table 7. Local factor weights for Building Planning (A5) by respondent group.
FactorCodeDevelopersHomebuyersDifferenceRank (Dev)Rank (Buyer)
Space EfficiencyA510.3850.297+0.08813
Floor Plan LayoutA520.3280.419−0.09121
AppearanceA530.2870.284+0.00332
Note: Local weights sum to 1.0 within dimension A5.
Table 8. Global factor weights and rankings by respondent group.
FactorCodeDev GlobalDev RankHB GlobalHB RankDiff (D − H)
Transportation ConvenienceA110.082050.22301−0.1410
Living FunctionA120.060080.12202−0.0620
Future Appreciation PotentialA210.077060.11103−0.0340
Price AcceptabilityA220.098040.08004+0.0180
Buyer Repayment CapacityA310.0310140.07305−0.0420
Environmental QualityA130.0500=9.50.06706−0.0170
Neighboring ResidentsA430.107030.06607+0.0410
Floor Plan LayoutA520.0380120.05308−0.0150
Developer Financing CapacityA320.0500=9.50.04409+0.0060
Developer CostA230.067070.0370=10.5+0.0300
Space EfficiencyA510.0450110.0370=10.5+0.0080
AppearanceA530.0340130.036012−0.0020
Construction DifficultyA410.109020.028013+0.0810
Government RegulationsA420.152010.022014+0.1300
Note: Global weights are computed as dimension weight × local factor weight and sum to 1.0000 (developers) and 0.9990 (homebuyers; rounding to four decimal places). Tied ranks use the average method: developer ranks A13 and A32 share rank 9.5; homebuyer ranks A23 and A51 share rank 10.5. See Appendix A for Spearman rank correlation calculation details.
Disclaimer/Publisher’s Note: The statements, opinions and data contained in all publications are solely those of the individual author(s) and contributor(s) and not of MDPI and/or the editor(s). MDPI and/or the editor(s) disclaim responsibility for any injury to people or property resulting from any ideas, methods, instructions or products referred to in the content.