1. Introduction
Tower cranes operate at considerable heights, cover wide working radii and undergo frequent changes in load conditions. Installation, dismantling, jacking and anchorage are staged operations with strong technical coupling. Tower-crane safety is therefore shaped by the equipment, operating environment, load conditions, foundation and anchorage, safety protection, personnel coordination and organizational management. Current regulations and standards for lifting appliances, tower-crane products, design, installation, use, dismantling and safety monitoring all set requirements for these aspects [
1,
2,
3,
4,
5,
6,
7]. In multi-crane operations, high-rise anchorage work, complex surrounding environments and schedule-constrained construction, risk factors may interact, substitute for one another o r accumulate. Single-item inspection and linear evaluation methods cannot fully explain how high-risk states are formed.
From an accident-causation perspective, tower-crane accidents seldom stem from one component failure or one isolated violation. They more often occur after technical defects, environmental disturbances and weak organizational control accumulate along the construction process. Inadequate foundation bearing capacity, unreliable anchorage connections, tower-body verticality deviations, fatigue cracks and insufficient bolt pre-tightening can reduce resistance to overturning and deformation [
8,
9]. Sudden wind changes, eccentric loads, repeated starting and braking, and combined movements can further amplify structural and mechanical demand. When load limiters, travel limiters, brakes or safety monitoring systems fail, the interception of unsafe states is weakened [
1,
2,
3,
6,
7]. Poor scheme approval, technical disclosure, maintenance records and closed-loop rectification allow known defects to persist [
10,
11,
12]. These patterns raise two research questions: how can a large candidate set be reduced to representative, measurable and low-redundancy factors, and how do multiple factors combine to form high-risk tower-crane states?
Previous studies provide a useful basis for identifying tower-crane safety factors. Shapira and Lyachin classified the factors affecting tower-crane safety into project conditions, environment, human factors and safety management, and found that operator competence, site management and maintenance management had pronounced effects [
13]. Shapira and Simcha used the analytic hierarchy process to weight safety factors and develop site-evaluation risk scales [
14,
15]. Tam and Fung showed that inadequate training, weak responsibility fulfillment and time pressure were important organizational and personnel factors in Hong Kong construction [
10]. Fatality and near-miss studies further linked lifting operations, personnel exposure, equipment failure, site organization and human error [
8,
9,
11,
12,
16,
17,
18]. These findings show that tower-crane risks are multi-source and hierarchical. Less attention has been paid to controlling redundancy within candidate factor systems and to identifying asymmetric causal pathways.
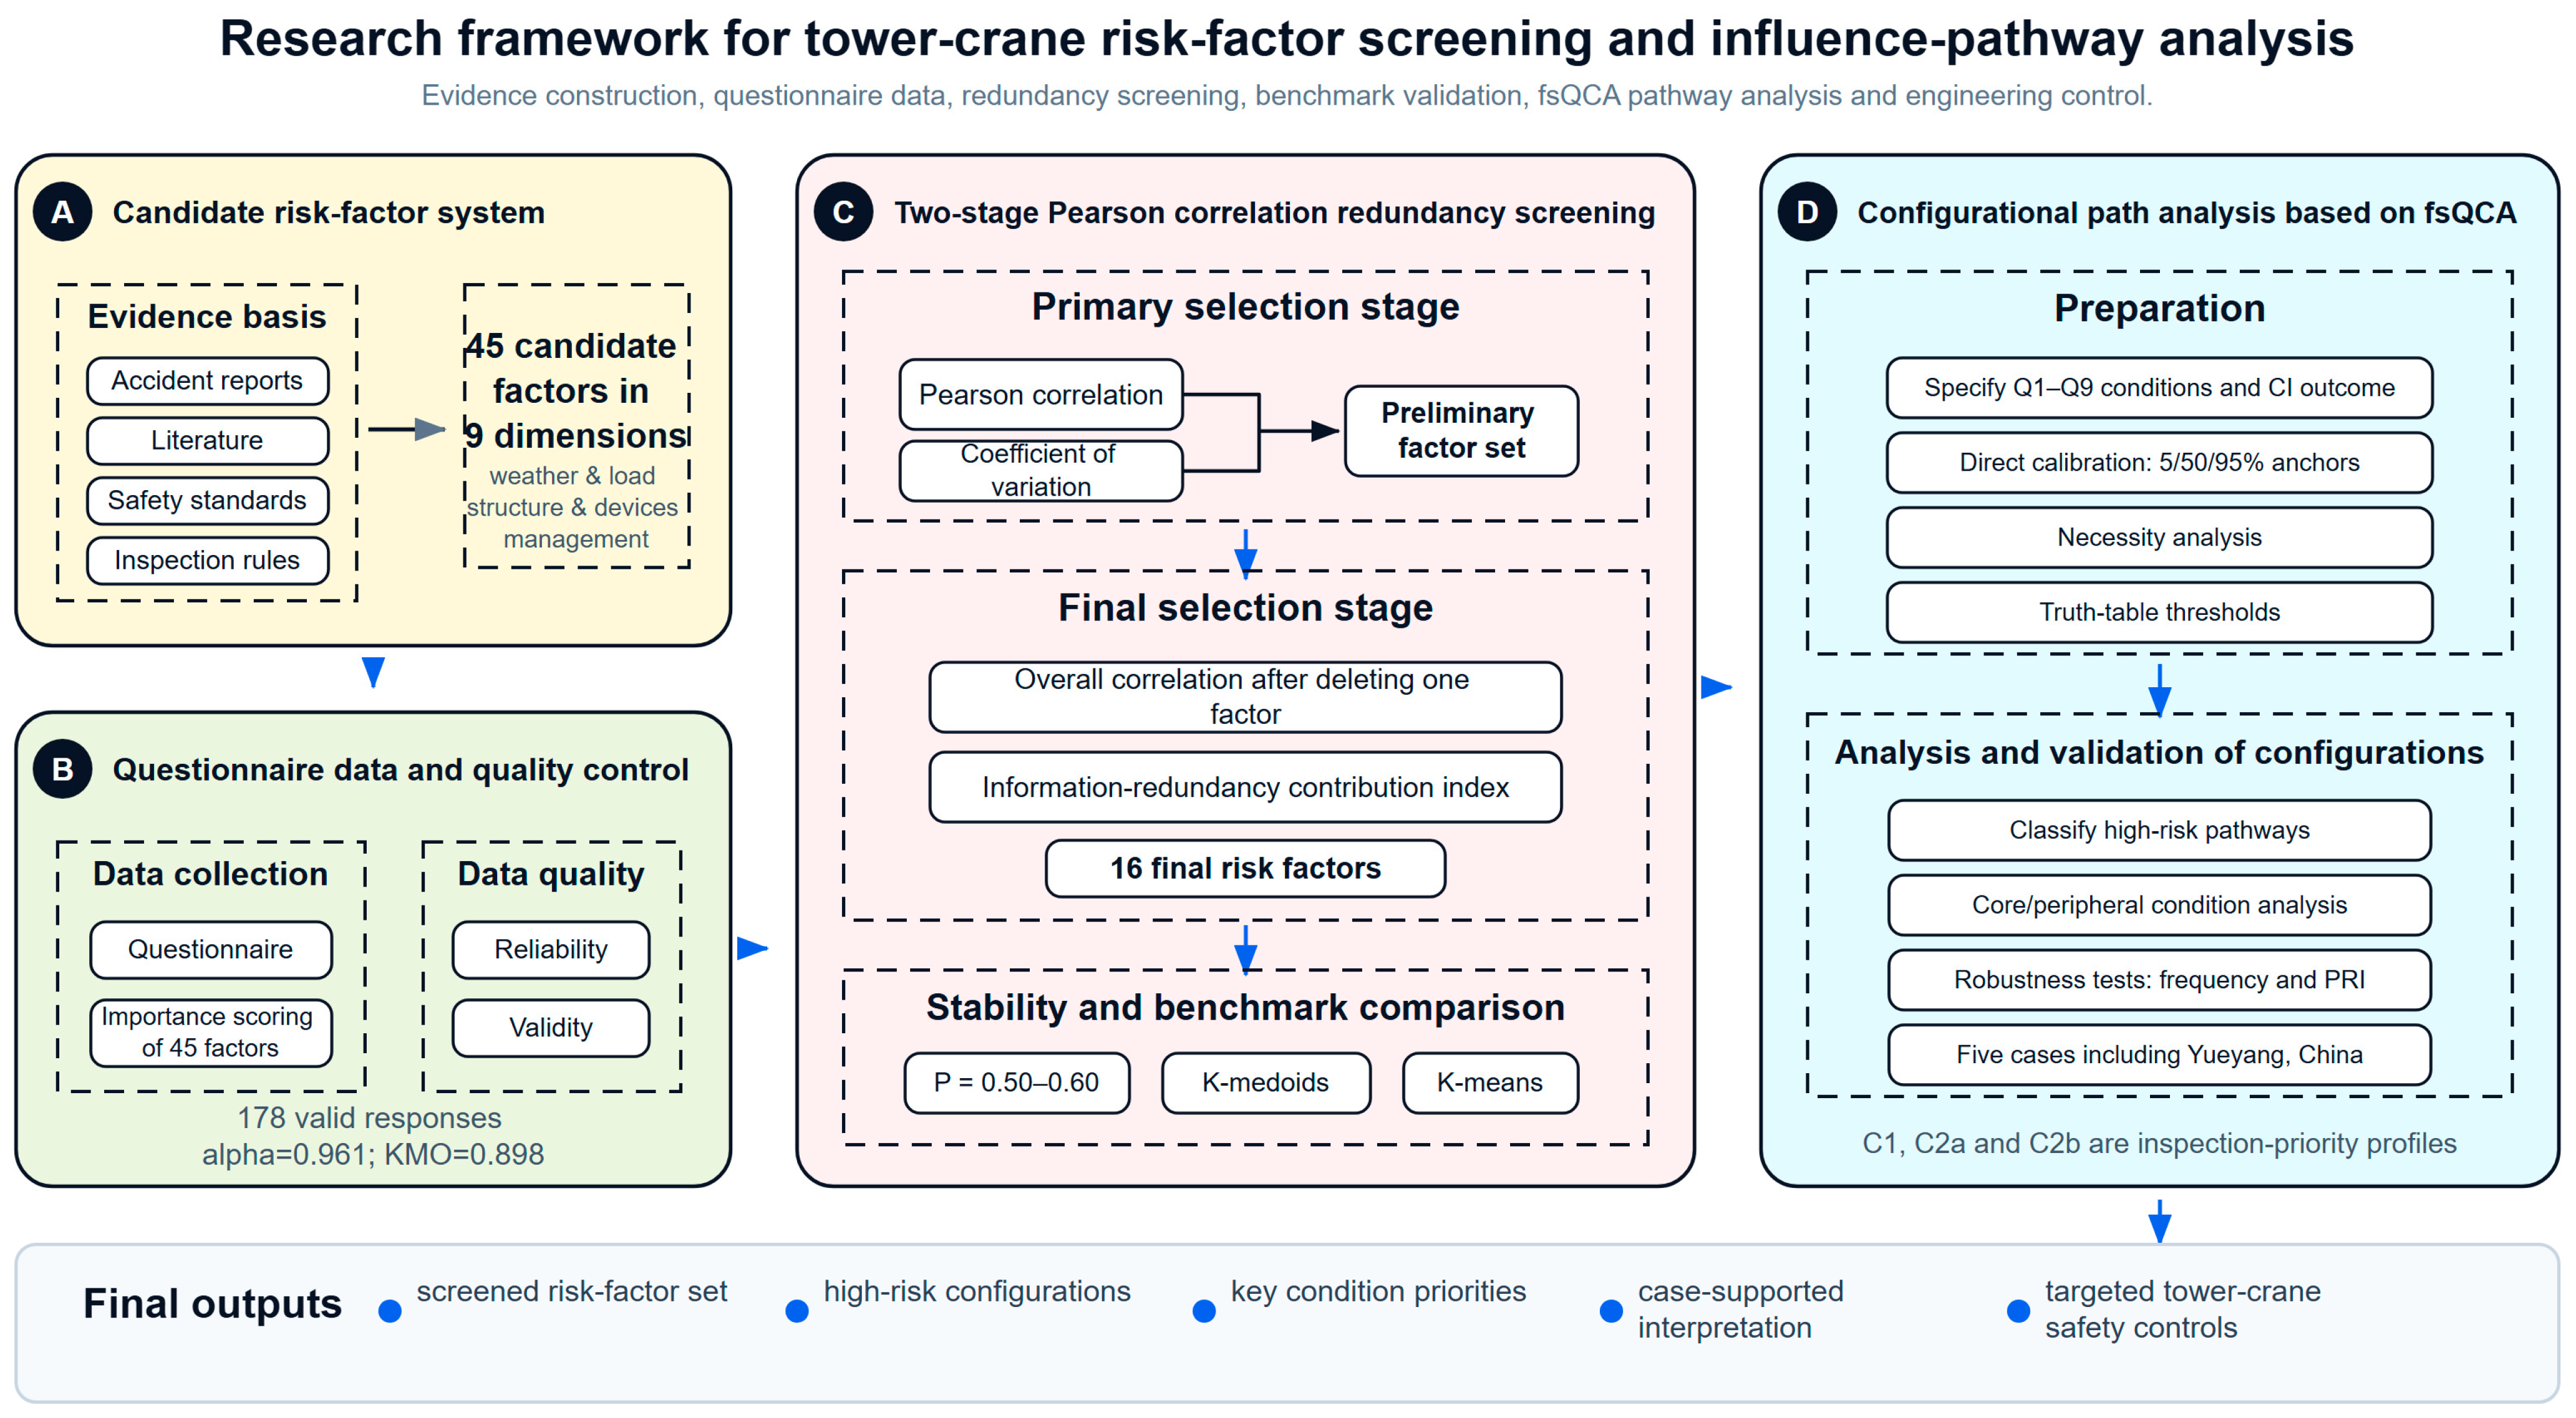
Accordingly, this study develops a framework that integrates candidate factor identification, questionnaire data collection, reliability and validity testing, two-stage Pearson correlation screening, method-comparison validation, fsQCA pathway analysis and risk-control recommendations. Compared with expert weighting or single-correlation filtering, the two-stage Pearson method addresses both pairwise overlap and system-level information redundancy. Compared with regression-based analysis, fsQCA is better suited to conjunctural causation, equifinality and conditional substitution in tower-crane risk formation [
19,
20,
21,
22,
23].
The study contributes in three ways. First, the candidate system covers installation, jacking, anchorage, use, inspection, maintenance and dismantling, so risk identification includes equipment status, operating scenarios and organizational control. Second, the screening procedure specifies threshold selection, iterative deletion, the information-redundancy contribution index and cumulative information contribution, which improves reproducibility. Third, the fsQCA analysis moves the study from single-factor identification to pathway-oriented combinations of priority control factors.
3. Risk-Factor Screening Procedure
Although the candidate system is comprehensive, strong information overlap can remain within the same dimension and between adjacent dimensions. Actual lifting weight approaching rated capacity and actual lifting moment approaching the rated moment, for example, both reflect severe lifting conditions. Foundation settlement, excessive verticality deviation and abnormal anchorage connections jointly describe the crane’s stability boundary. Load limiters, moment limiters, travel limiters and safety monitoring systems all perform risk-identification and interception functions. Including all factors directly in an evaluation model can produce dispersed weights, repeated explanations and unnecessarily large early warning indicator sets. Indicator-screening studies commonly identify redundant variables using correlation, variation or matrix-structure statistics [
29,
30,
31]. This study adopts a two-stage Pearson correlation method.
The proposed method differs from one-step correlation filtering and PCA-based reduction in four respects. First, correlation is used only to identify potential local redundancy; the deletion decision also considers the coefficient of variation and engineering substitutability. Second, the procedure is iterative, so each deletion changes the subsequent correlation structure. Third, the second stage uses an information-redundancy contribution index to examine the system-level effect of each retained factor. Fourth, unlike PCA, the method does not transform inspection items into latent components. The final factors remain original, nameable and directly linked to site inspection and risk-control actions.
3.1. Preliminary Selection of Risk Factors
The preliminary stage reduces local information redundancy. When two candidate factors are highly correlated, their information overlaps; in that case, the factor with greater score dispersion and stronger sensitivity to extreme risk is retained. Let
denote the score of the
-th risk factor in the
-th questionnaire, and let
denote the sample size. The Pearson correlation coefficient between any two risk factors is calculated as follows:
The coefficient of variation is used to measure the dispersion of risk-factor scores and is calculated as follows:
Here, the numerator is the standard deviation of the -th risk factor and the denominator is its mean score. A larger coefficient of variation indicates stronger disagreement among experts regarding the importance of a factor, or a greater ability to distinguish risk states across projects. Such factors have higher information value for early warning and graded control.
The preliminary screening procedure involved four steps. First, a Pearson correlation matrix was calculated from the 45 candidate factors, and a heatmap was used to examine within-dimension and cross-dimension correlations. Second, the correlation threshold p was set. In this study, p = 0.55 was selected because it lies in the middle of the 0.50–0.60 sensitivity interval and balances redundancy removal with dimension preservation. The threshold was not applied mechanically: the factor set was recalculated at p = 0.50, 0.55 and 0.60, and the same 16 factors were retained. Third, the coefficient of variation was calculated and ranked for each candidate factor. For factor pairs whose absolute correlation exceeded p, the factor with the smaller coefficient of variation was removed and the factor with the larger coefficient entered the next iteration. Fourth, the comparison was repeated until the remaining correlations were below the threshold or further deletion would damage dimension integrity.
This stage was not designed simply to reduce the number of factors. It preferentially removed factors that were synonymous, near-synonymous or highly overlapping in engineering function. If a highly correlated factor was irreplaceable for standard inspection, accident-chain interpretation or engineering rectification, it could be retained after expert review and reassessed in the final selection stage.
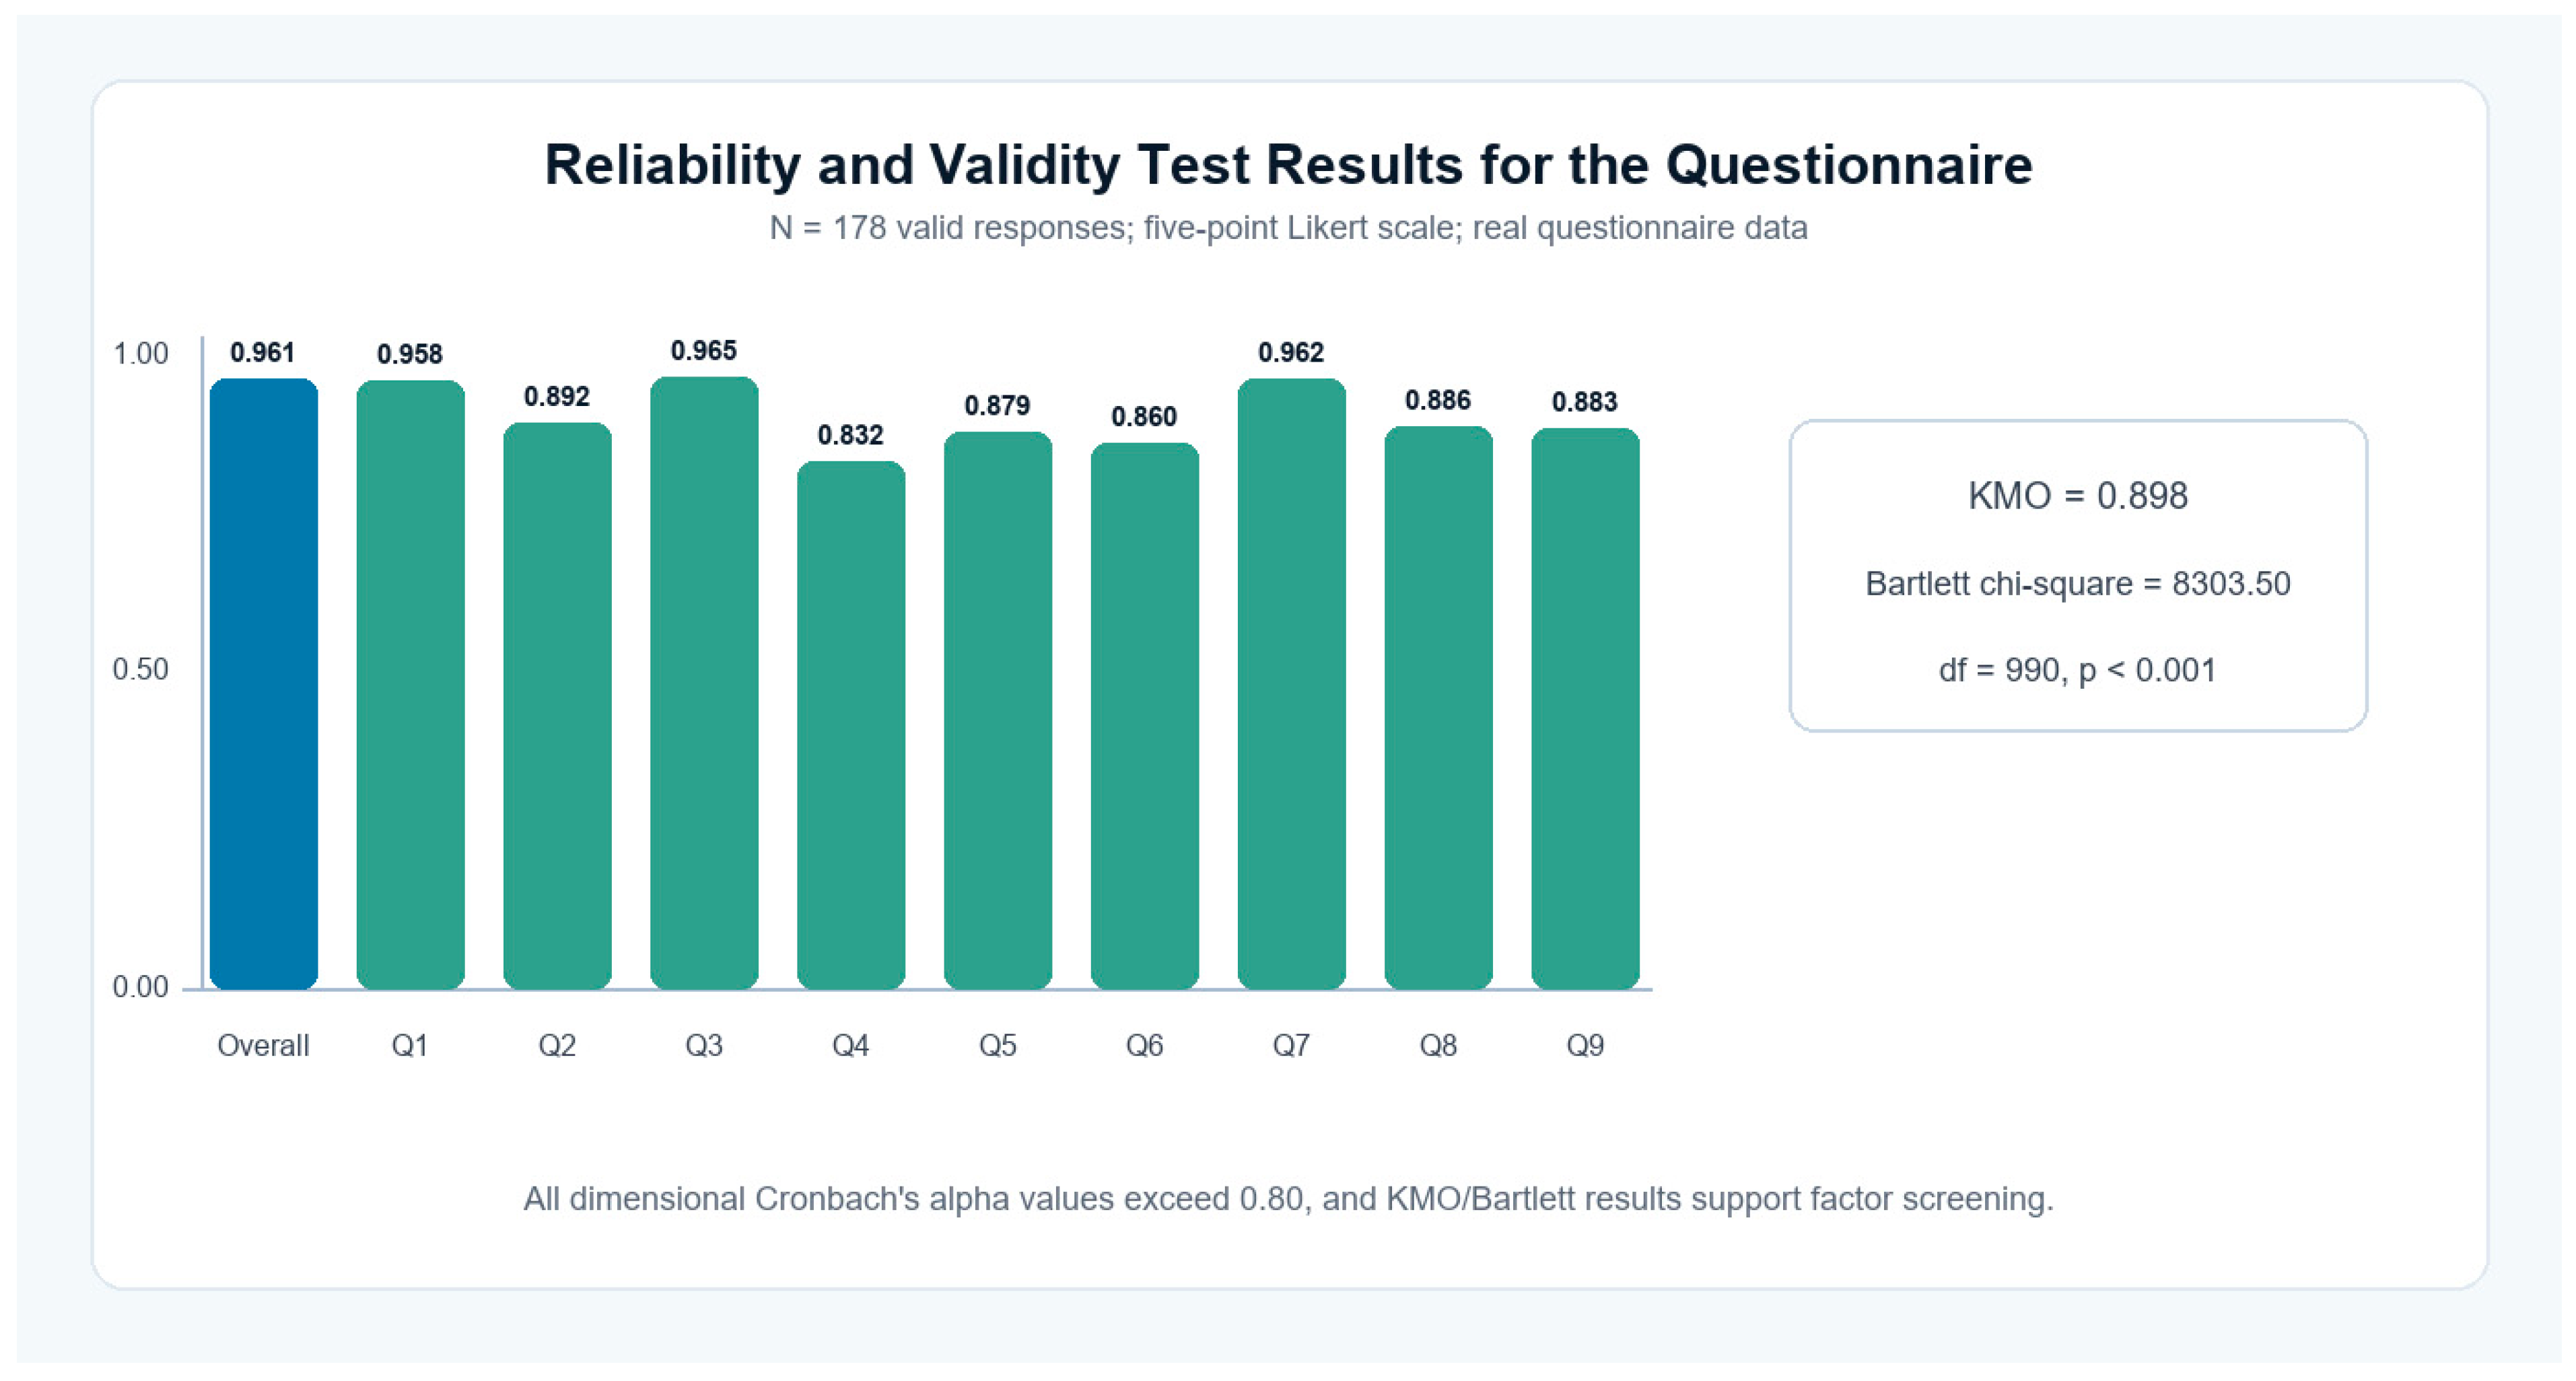
After the questionnaire data were converted into a numerical matrix, the Pearson correlation matrix was calculated from the 178 valid questionnaires. Absolute correlation coefficients were used to measure the strength of linear association among candidate factors.
3.2. Final Selection of Risk Factors
The preliminary stage mainly addresses local redundancy between pairs of factors. Some factors may still contribute little to the overall system, or duplicate information from several other factors. To address this, the second stage introduces the information-redundancy contribution index to optimize the factor system from the perspective of overall correlation change. This follows the logic of first reducing local overlap and then checking system-level information retention in risk-factor screening [
30].
Assume that
h risk factors remain after preliminary selection. The individual correlation between a risk factor and the other factors is defined as:
The overall correlation of the preliminary risk-factor system is defined as:
After removing a risk factor
, the overall correlation of the remaining system is denoted as
. The information redundancy contribution index is then defined as:
When the index is below 0, removing the factor reduces the overall correlation, which indicates that the factor increases system redundancy. The smaller the value, the stronger the redundancy contribution. When the index is above 0, removing the factor increases the overall correlation, which indicates differentiated information or a buffering effect. The larger the value, the less appropriate early deletion becomes. The final stage retains factors in descending order of the information-redundancy contribution index and controls information loss using the cumulative information contribution rate. The cumulative information contribution rate is defined as the ratio of the sum of the coefficients of variation of the final factors to that of the preliminary factors:
The numerator is the sum of coefficients of variation for the t final factors, and the denominator is the sum for the h preliminary factors. The cumulative CV ratio is used here as an information-concentration and compression indicator. It is not equivalent to the cumulative variance contribution in PCA because the present method keeps original indicators rather than extracting orthogonal latent components. When the second stage further removes factors from the preliminary set, a high within-stage CV-retention ratio can serve as a stopping rule. When the first stage has already produced a stable, dimension-complete final set, the ratio should be interpreted together with dimension coverage, Jaccard stability and the information-explanation strength index N.
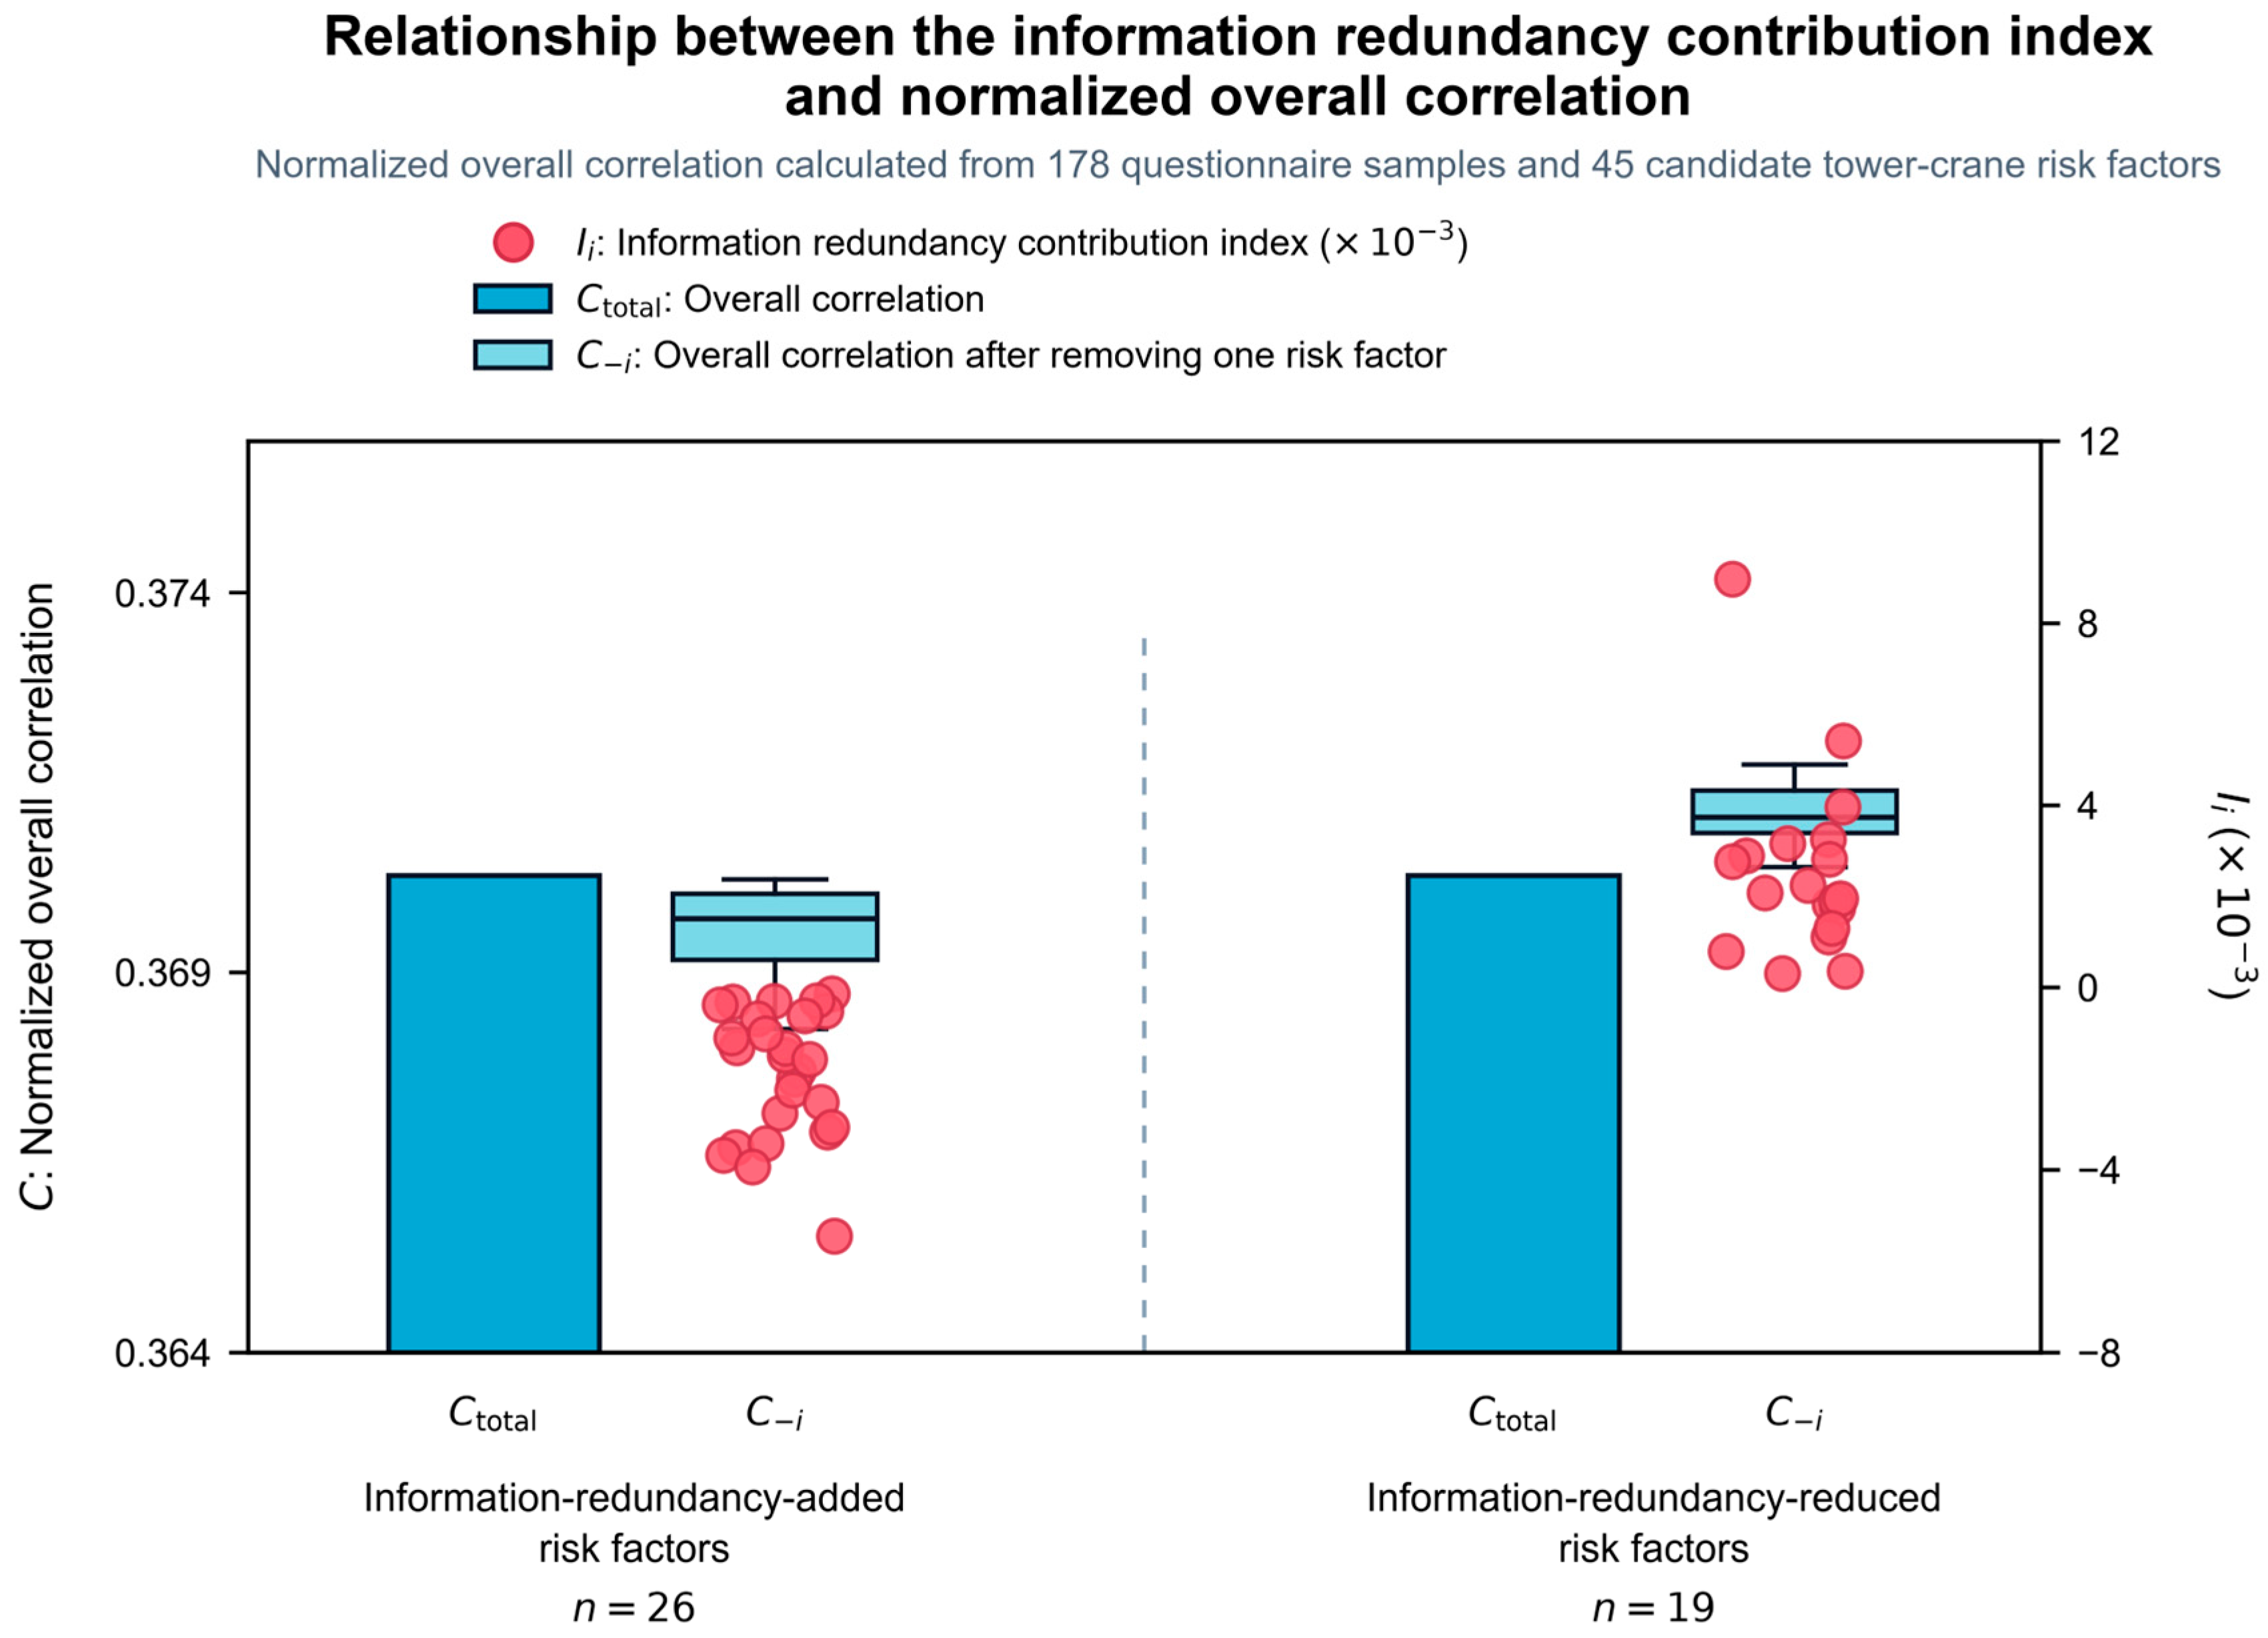
Using the 178 questionnaire responses and the 45 candidate factors, this study further calculated the normalized overall correlation before and after removing each factor. The information redundancy contribution index was divided into two categories according to its direction: redundancy-increasing and redundancy-reducing factors, as shown in
Figure 3. The normalized overall correlation
was 0.3703. Removing X5, X6, X8, X9 and 22 other factors produced
values below
, indicating mainly overlapping information. Removing X1, X2, X3, X4 and 15 other factors produced
values above
, indicating stronger differentiated information or structural support. These results provide a direct basis for factor retention and engineering review.
The final selection had to satisfy three requirements. First, the retained set should concentrate discriminating information relative to the number of variables removed, as reflected by the cumulative CV ratio and the information-explanation strength index N. Second, the structural distribution should remain balanced, with representative factors retained in dimensions linked to major tower-crane accident chains. Third, the factors should be executable on site, meaning that they can be obtained from inspection records, monitoring data, operation records or expert scores.
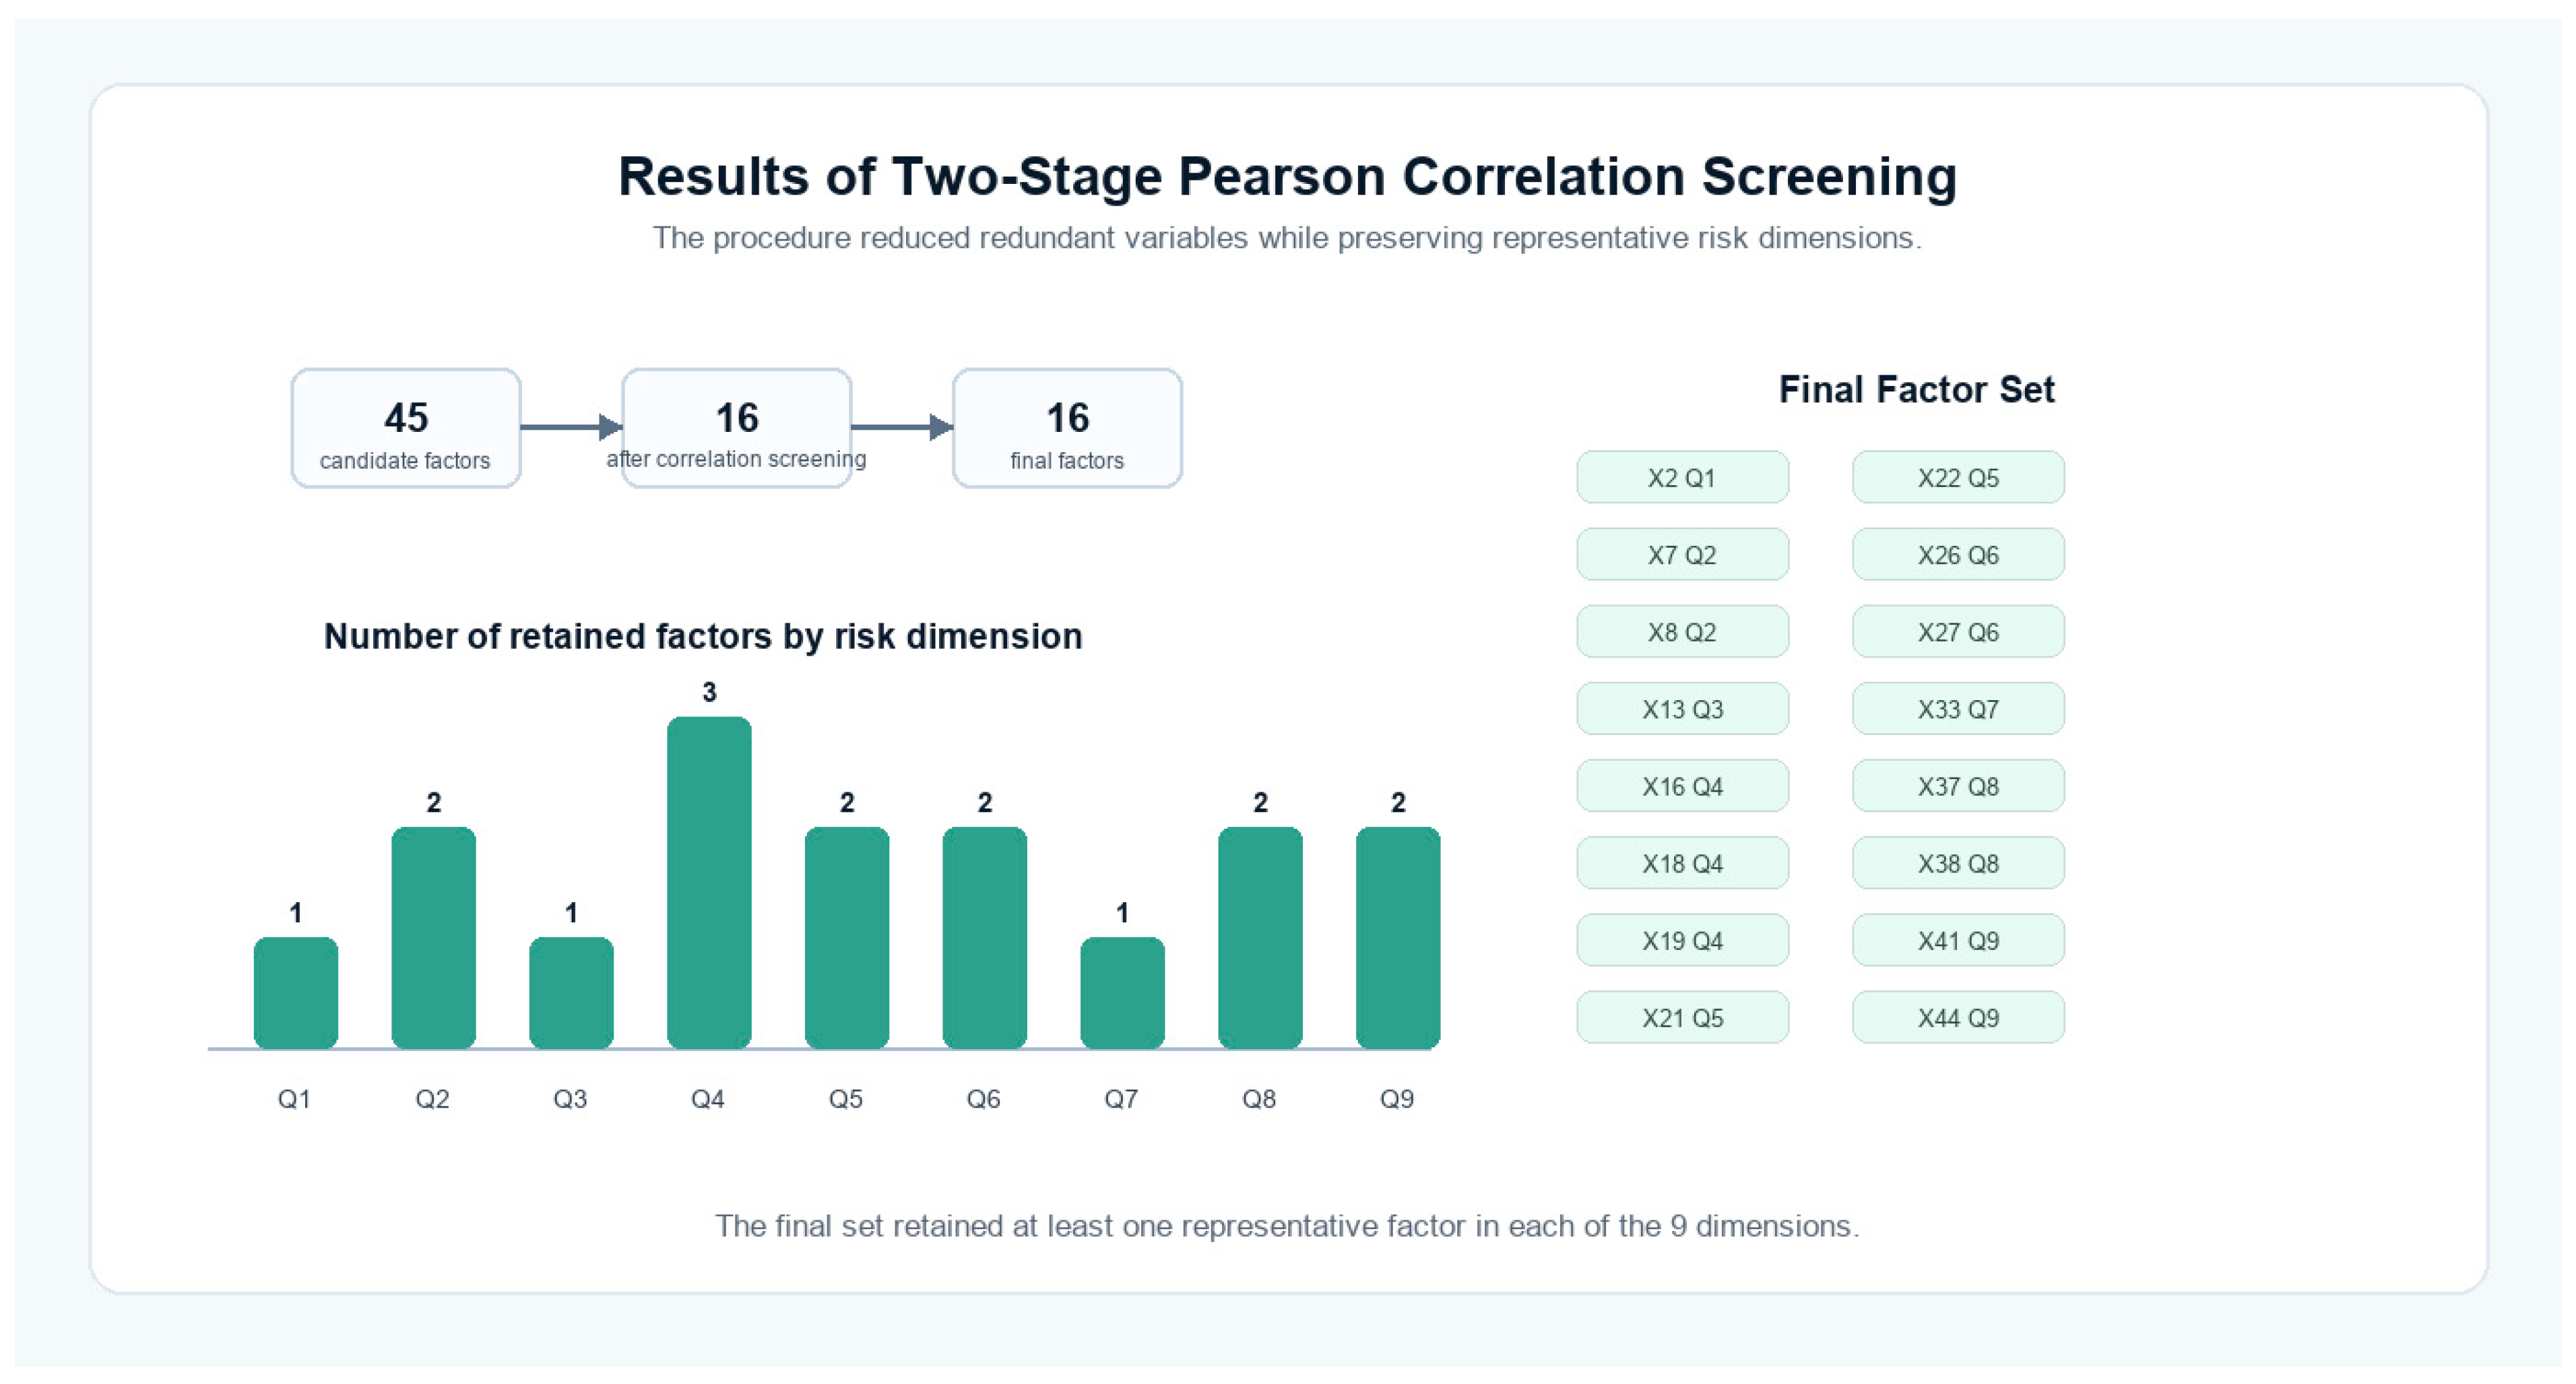
The first-stage high-correlation screening retained 16 factors, as shown in
Table 3, and the second-stage information-redundancy check did not remove any additional factors. The final set was {X2, X7, X8, X13, X16, X18, X19, X21, X22, X26, X27, X33, X37, X38, X41, X44}, covering all nine risk dimensions. The cumulative CV ratio of 0.463 was calculated relative to the original 45 candidates. This does not mean that only 46.3% of a PCA-type variance structure was retained. Instead, 35.6% of the original variables retained 46.3% of the total coefficient-of-variation information. The information-explanation strength index N was 1.538, showing that the retained factors were more information-dense than the full candidate system while maintaining complete dimensional coverage.
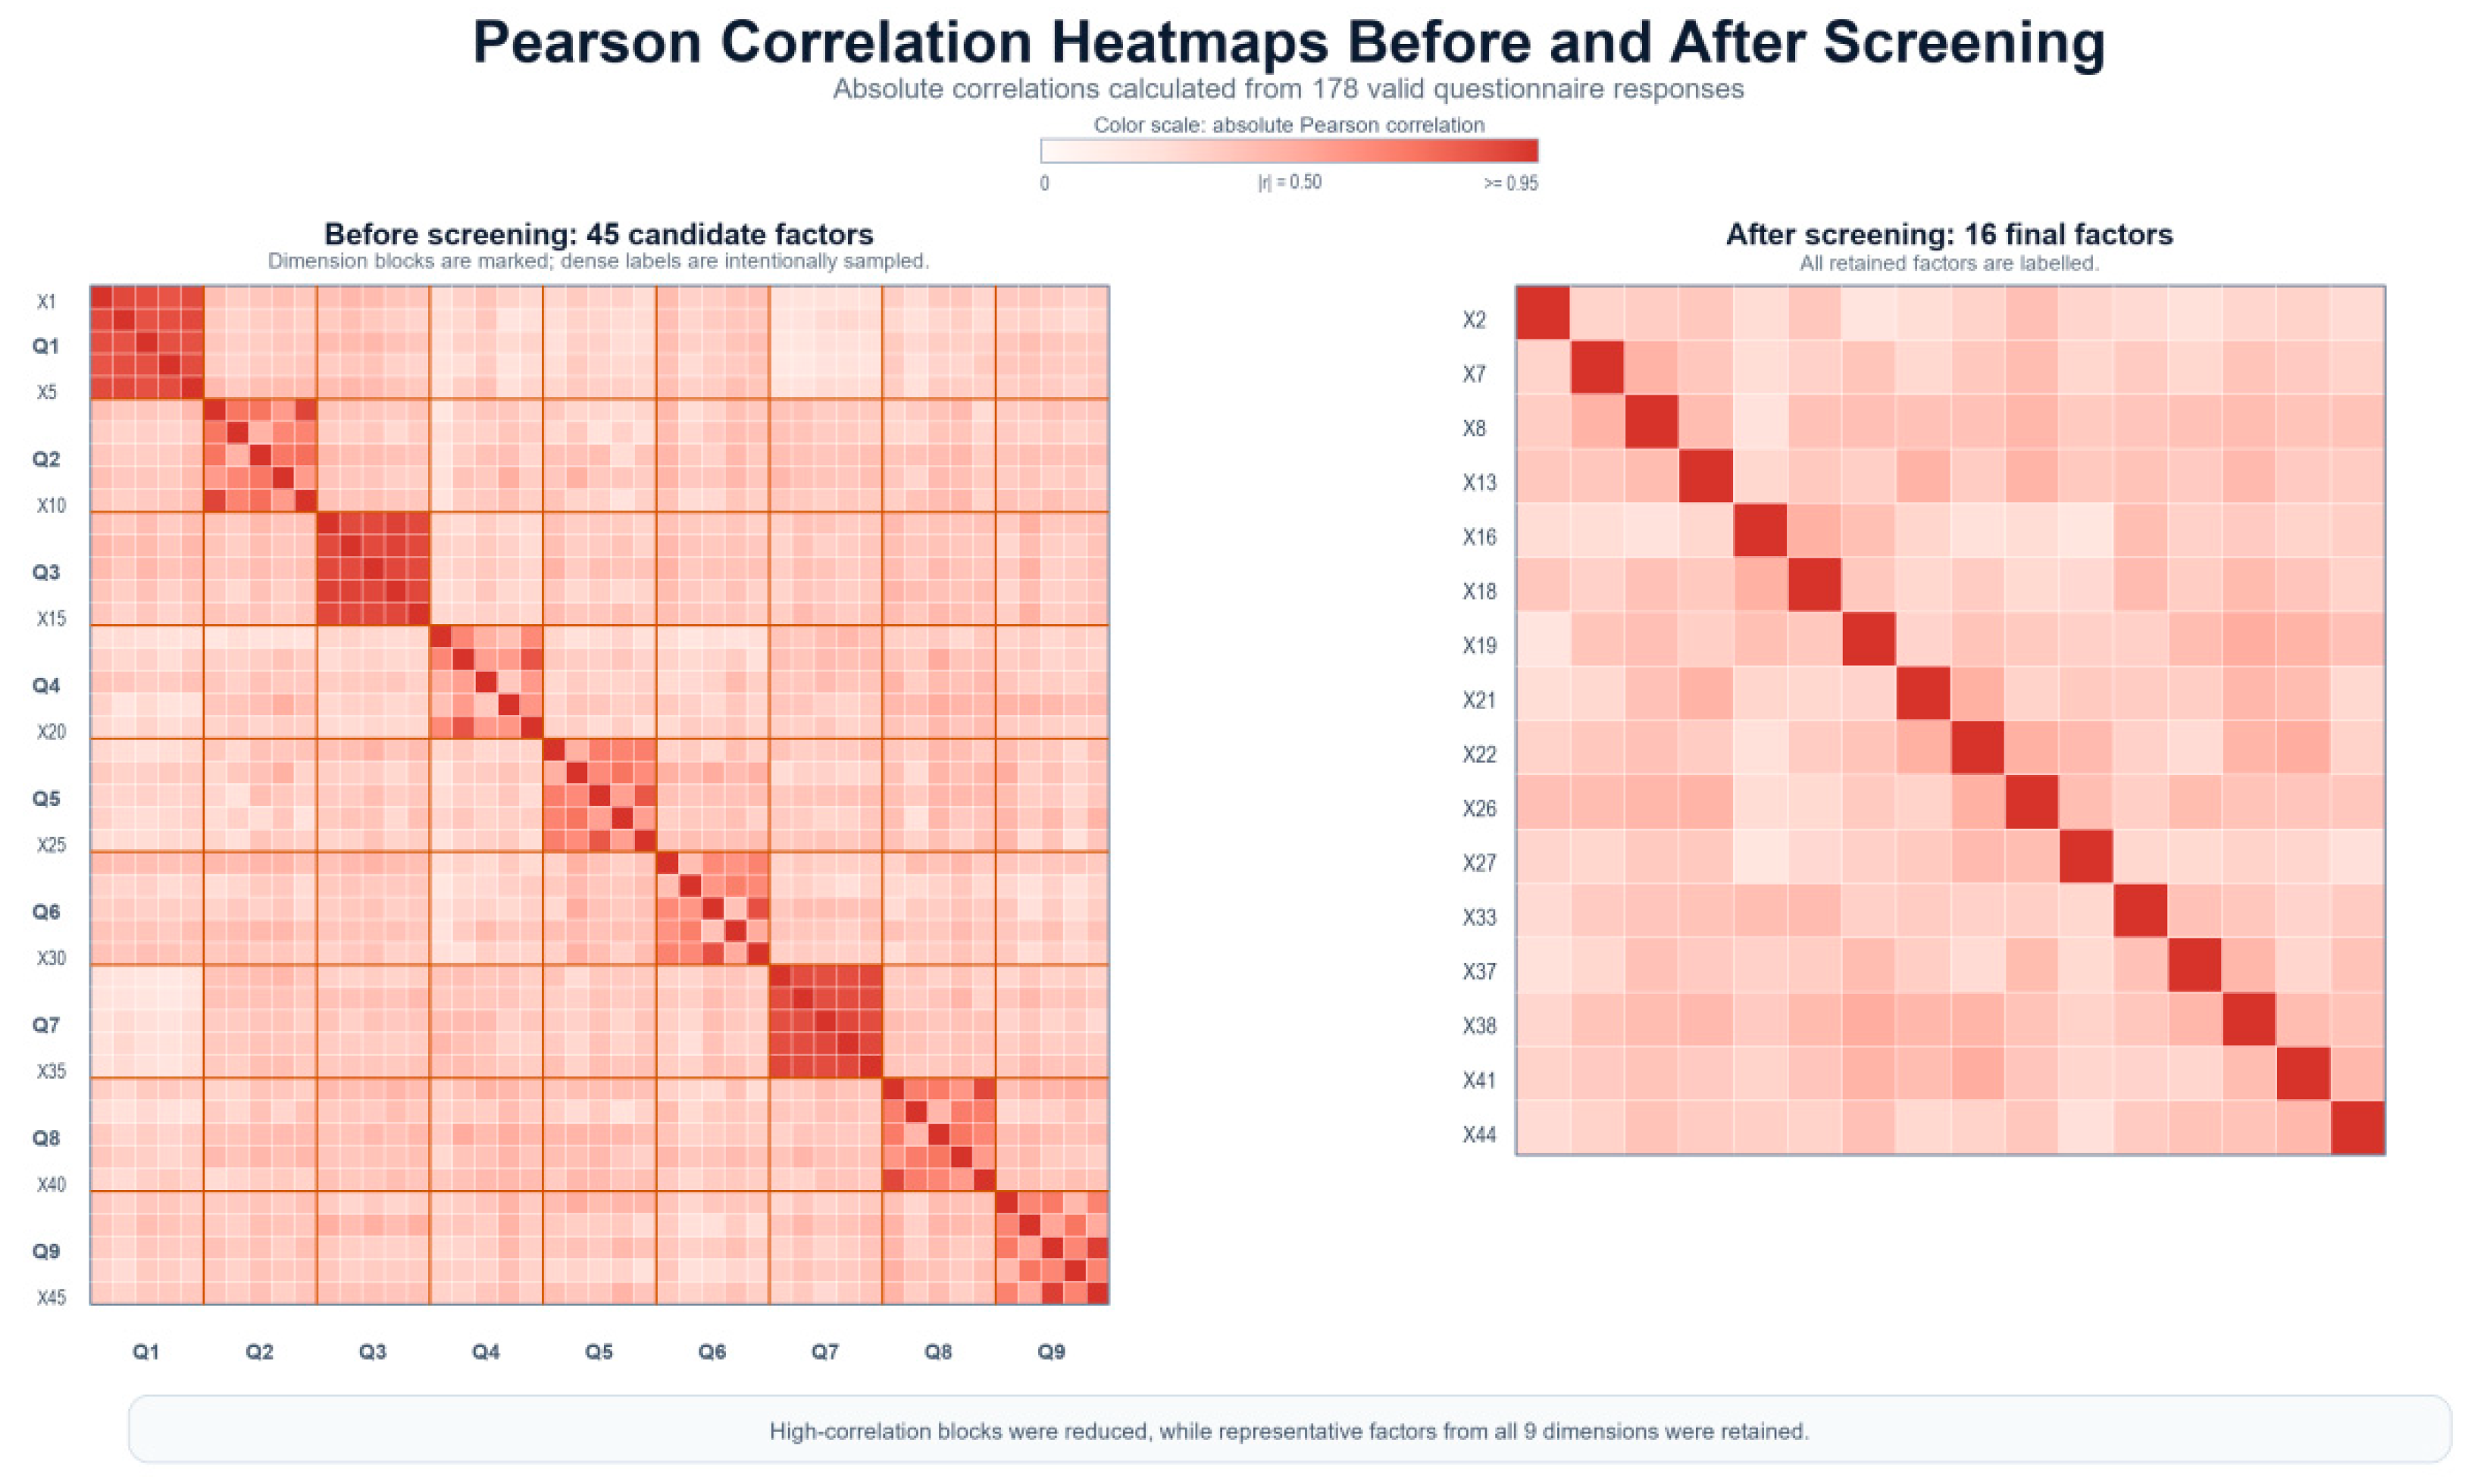
Figure 4 visualizes this reduction from the original 45-factor correlation structure to the final 16-factor system.
Figure 5 visualizes this reduction from the original 45-factor correlation structure to the final 16-factor system.
3.3. Stability Test
To test whether the screening result was sensitive to sample disturbance, the valid questionnaire sample was randomly divided into two groups. The same screening procedure was applied to each group, and the Jaccard similarity coefficient was used to evaluate agreement between each grouped result and the full-sample result:
Here, is the final factor set obtained from the full sample, and is the final factor set obtained from a grouped sample. If the Jaccard coefficient remains above 0.60 and the cumulative information contribution rate satisfies the requirement, the screening method can be considered stable. Multiple random splits can further reduce the influence of a single grouping.
For the stability test, the 178 valid questionnaires were randomly split into two subsamples and the two-stage Pearson screening procedure was repeated for each subsample. Subsample B1 produced 14 key factors, with a Jaccard coefficient of 0.875 relative to the full-sample final set. Subsample B2 produced 15 key factors, with a Jaccard coefficient of 0.938. A sensitivity test then varied
p from 0.50 to 0.60, and the final factor set remained unchanged, as shown in
Table 4. These results indicate that the screening outcome was robust to both sample partitioning and threshold perturbation.
The threshold-sensitivity results show that the final factor set was not an artifact of a single threshold. Across p = 0.50–0.60, the number of retained factors, dimension coverage, Jaccard similarity and cumulative CV ratio were unchanged.
4. Method Comparison
4.1. Comparison of Screening Results
To assess applicability, this study compared the two-stage Pearson method with K-medoids and K-means clustering, as shown in
Table 5. K-medoids uses actual sample points as cluster representatives and is relatively robust to outliers. K-means iteratively updates mean centroids and is simple to compute, but it is sensitive to initial centroids and outliers [
26,
27]. Both methods can group candidate factors by questionnaire-score features and select representatives from each cluster. However, tower-crane risk factors have clear engineering dimensions, a moderate sample size and strong correlations among similar factors. Clustering results may therefore depend on the preset number of clusters and initial centroids, which can weaken important dimensions. By contrast, the two-stage Pearson method reduces redundancy while retaining dimension integrity and provides clearer reasons for retaining or deleting factors.
The comparison focused on three aspects. First, factor distribution should remain balanced. A method that concentrates final factors in management or structural dimensions while omitting wind load, safety devices or foundation anchorage is incomplete for engineering control. Second, factor interpretation should be transparent. The two-stage Pearson method explains why each factor is removed or retained, whereas clustering methods usually identify only cluster membership. Third, final factors should be actionable. In engineering applications, a risk factor must be statistically representative and linked to specific inspection items and rectification measures.
The questionnaire-based calculation showed that the two-stage Pearson method reduced the 45 candidate factors to 16 final factors, a 64.4% reduction, as shown in
Table 6. At least one representative factor was retained in each of the nine dimensions, giving 100% dimension coverage. Three factors were retained in Q4 (foundation, rail and anchorage conditions), indicating that the stability boundary of the whole crane is central to risk identification. Two factors were retained in each of Q2, Q5, Q6, Q8 and Q9, reflecting the load-structure-mechanism-protection-management chain in high-risk formation. Q1, Q3 and Q7 each retained one factor, representing external disturbance, spatial exposure and electrical control protection.
For a calculable comparison, the 45 candidate factors were treated as clustering objects, and the score sequence of each factor across the 178 questionnaires was used as its feature vector. Each sequence was first standardized using Z-scores to remove the influence of mean and dispersion differences on distance calculation. Because the two-stage Pearson method retained 16 factors, both clustering methods were set to K = 16 and one representative factor was extracted from each cluster. In K-medoids clustering, the medoid was used directly as the representative factor. In K-means clustering, the factor closest to the cluster centroid was selected. For reproducibility, K-medoids was implemented with deterministic PAM BUILD + SWAP, and K-means used K-means++ initialization with random seed 20,250,605 and n_init = 100.
Table 7 and
Table 8 show that, under K = 16, both clustering methods output 16 representative factors and cover all nine dimensions. Thus, they are comparable in quantity control and dimension coverage. Their overlap with the final two-stage Pearson set was limited: four factors for K-medoids and five for K-means, with Jaccard coefficients of 0.143 and 0.185, respectively. Their information-explanation strength indices were also lower (0.911 and 0.956) than that of the two-stage Pearson method. This pattern indicates that clustering methods tend to select factors near cluster centers rather than factors with stronger score dispersion or risk-state discrimination. For example, K-medoids selected X5, X6, X14 and X17 in Q1–Q4, whereas the two-stage Pearson method retained X2, X7, X8, X13, X16, X18 and X19, which better represent extreme disturbances or engineering weaknesses. K-medoids and K-means can therefore support grouping and robustness comparison, but they should not replace a screening process that integrates information redundancy with engineering interpretability.
4.2. Comparison of Screening Performance
4.2.1. Comparison of Information-Explanation Strength and Cumulative Information Contribution
Screening performance was evaluated from two perspectives: information-explanation ability and information retention. The information-explanation strength index measures how strongly the final factor system expresses variance information relative to the candidate system. The cumulative information contribution rate measures how much dispersion information the final factors retain from the preliminary or candidate factors. A reasonable screening result should reduce variables while retaining enough information to support risk diagnosis and pathway analysis.
The information-explanation strength index
N can be defined as the ratio between the mean variance of the final risk-factor data and the mean variance of the candidate risk-factor data:
Here, t is the number of final factors and m is the number of candidate factors. N greater than 1 indicates that the final system retains strong information dispersion, which helps distinguish risk states across projects or samples. In empirical work, N, the cumulative information contribution rate and the number of final factors should be reported together to avoid evaluating screening performance with a single indicator.
As shown in
Table 7, the two-stage Pearson method retained 16 factors and covered all nine dimensions, with a dimension coverage of 1.000. The cumulative CV ratio of 0.463 was calculated relative to all 45 candidates and should be interpreted together with the information-explanation strength index of 1.538. The result shows that the retained indicators were more information-dense after compression; it does not mean that the method failed to meet a PCA-style 85% variance rule. Although K-means and K-medoids also retained all nine dimensions, their cumulative CV ratios were 0.347 and 0.338, and their information-explanation strength indices were 0.956 and 0.911, respectively, both lower than those of the two-stage Pearson method.
4.2.2. Comparison of KMO Changes
The KMO value measures the suitability of a common-factor structure among variables. Its change should not be read simply as ‘the larger the decrease, the better’. A high KMO value at the candidate stage indicates shared information among variables and supports redundancy screening. If KMO remains high or increases moderately after screening, the final system still has a stable common structure. A sharp decrease may indicate that the representative factors carry the common risk structure less effectively. This study therefore interprets KMO change together with dimension coverage, Jaccard similarity and the information-explanation strength index N, as shown in
Table 9.
Overall, the two-stage Pearson method balanced statistical association, differences in risk information and structural integrity of the indicator system. The results from 178 valid questionnaires provide a data basis for tower-crane risk-factor screening and subsequent configuration-pathway analysis.
4.3. Comparison of Application Scenarios
The engineering attributes of tower-crane risk factors mean that screening methods should not pursue statistical compression alone. Most factors come from regulatory inspection, site records or expert scoring, and the number of variables is moderate. Clear information overlap also exists within dimensions. Safety devices, for example, jointly reflect risk-interception capability, whereas management factors jointly reflect organizational control. For early warning and rectification, final factors must correspond to inspection objects, responsible links and control measures. Based on these requirements, the two-stage Pearson method is the main screening method in this study. K-medoids and K-means are used for comparison and robustness explanation, but they do not replace a screening process centered on information redundancy and engineering mechanisms.
Recent tower-crane safety studies have increasingly used data-supported decision tools, including knowledge-based risk assessment, dynamic obstacle-avoidance path planning and UAV-based intelligent inspection [
32,
33,
34]. These studies improve monitoring, assessment or operational control after safety information has been collected. The present study instead addresses the upstream problem of reducing a standards-based candidate factor system to a concise, interpretable set of risk factors and then explaining how those factors combine into high-risk pathways. This distinction also separates the proposed method from general filter-based feature selection, which usually prioritizes predictive compactness rather than dimension integrity and engineering traceability [
35].
From a management perspective, the two-stage Pearson method is not intended to reduce inspection responsibilities. Its purpose is to build a concise set of early warning indicators and research variables. Items required by regulations should remain in site safety management even if they are statistically redundant. They can be treated as institutional inspection items rather than research model variables. In this study, the screening results mainly support risk diagnosis, early warning modeling and influence-pathway analysis.
5. Pathways for High-Risk Tower-Crane States
Configurational analysis was conducted after the screening procedure retained 16 factors. With 178 observations, treating all 16 factors as separate antecedent conditions would produce 65,536 logically possible truth-table rows and severely limited diversity. The retained factors were aggregated into the nine dimensions used throughout the study: wind load and operating weather (Q1), lifting load and operating conditions (Q2), surrounding operating environment (Q3), foundation, rail and anchorage conditions (Q4), metal structure and connection status (Q5), mechanisms and key components (Q6), electrical control and power-supply protection (Q7), safety protection and monitoring devices (Q8), and management, maintenance and emergency capability (Q9). This dimensional specification allows practitioners to identify the active pathway first and then inspect the retained factors within each dimension.
The outcome represents membership in the set of high-risk tower-crane states. It was constructed as a principal component analysis (PCA) composite index from the 16 retained factors, whereas Q1–Q9 were calculated as dimensional means. This design avoids exact duplication between antecedent variables and the outcome while preserving factor-level variance. However, both the antecedents and the outcome were derived from the same questionnaire responses. Accordingly, the fsQCA results characterize expert-perceived high-risk profiles and should not be interpreted as independent causal effects. The composite index was calculated in three steps.
Step 1. Standardize the data. For retained risk factor
(
i = 1, 2, …, 16) and questionnaire
j (
j = 1, 2, …, 178), the standardized value is:
where
and
are the sample mean and sample standard deviation of factor
.
Step 2. Calculate principal component scores. Let the correlation matrix be decomposed as
, where
is the loading matrix and
. The eigenvalue-greater-than-one rule retained only two components and explained 45.5% of the variance, so the cumulative-variance criterion was used. The smallest set exceeding 85% contained 11 components and explained 86.2%. The score of questionnaire
j on component
y is:
Step 3. Calculate the composite index. Each retained component was weighted by its eigenvalue:
The sign of was aligned so that a higher value corresponded to a higher mean score across the 16 retained risk factors.
5.1. Data Calibration and Necessity Analysis
Direct calibration used the 95th, 50th and 5th percentiles as the anchors for full membership, the crossover point and full non-membership, respectively. Calibrated membership scores exactly equal to 0.500 were adjusted to 0.501 by adding 0.001, which prevented cases at the point of maximum ambiguity from being excluded from truth-table analysis [
20]. This adjustment was applied only to exact crossover scores after calibration. The same calibration procedure was used for Q1–Q9 and CI. Necessity was evaluated with a consistency threshold of 0.90.
Table 10 reports the necessity results. Neither any condition nor its negation reached the 0.90 threshold. Q4 had the highest consistency for the high-risk outcome (0.875), followed by Q3 (0.871), Q1 (0.838) and Q7 (0.836). The remaining condition consistencies ranged from 0.788 to 0.832. High-risk tower-crane states did not depend on one indispensable condition, supporting analysis of conjunctural pathways.
5.2. Analysis of Configurational Conditions
The truth table used Q1–Q9 as antecedent conditions and calibrated CI as the outcome. The case-frequency threshold was 3, the consistency threshold was 0.80 and the PRI consistency threshold was 0.70. PRI was calculated by subtracting the overlap min(X, Y, ~Y) from the numerator and denominator of the sufficiency relation [
21]. Nine observed rows met the frequency requirement. As shown in
Table 11, six rows passed both consistency criteria and were coded OUT = 1, whereas three rows were coded OUT = 0. Positive directional expectations were specified because higher scores represent greater risk exposure or weaker control.
Boolean minimization was performed for the six positive truth-table rows.
Table 12 reports the complex, intermediate and parsimonious outputs. No unobserved row qualified as a positive directional easy counterfactual; thus, the complex and intermediate solutions were identical and each contained three terms. Allowing all logical remainders produced two parsimonious terms. Conditions appearing in both the intermediate and parsimonious solutions were classified as core, while conditions appearing only in the intermediate solution were classified as peripheral.
The intermediate terms were reorganized into the three interpretable configurations shown in
Table 13. All configurations had consistency at or above 0.999. The overall solution consistency was 0.999, indicating that membership in the combined configurations was almost entirely a subset of high-risk membership within the questionnaire data. Solution coverage was 0.490, so the configurations covered 49.0% of the calibrated high-risk outcome. These two measures should be read together: the profiles were highly consistent where they occurred, but they did not represent every high-risk questionnaire response.
5.3. Configurational Interpretation of High-Risk Tower-Crane Profiles
(1) Load-support-mechanism-protection type. This type consists of configuration C1, expressed as Q1*Q2*Q3*Q4*Q5*Q6*Q8. All seven conditions are core, whereas Q7 and Q9 are not specified by the solution term. C1 links external disturbance, operating demand, spatial exposure, support stability, structural load transfer, mechanical execution and safety interception. High wind or adverse weather (Q1) increases lateral action, and heavy, eccentric or combined lifting operations (Q2) raise dynamic demand. The surrounding environment (Q3) adds exposure through multi-crane interference, obstacles, power lines and public areas. These demands act on the foundation and anchorage system (Q4) and the metal structure and connections (Q5), which determine whether the crane can resist and transfer imposed loads. When mechanisms and key components (Q6) are also unreliable and safety devices or monitoring systems (Q8) cannot interrupt unsafe actions, the expert assessments consistently correspond to the high-risk outcome. This interpretation is consistent with the tower-crane failure mechanisms summarized earlier [
1,
2,
3,
4,
5,
6,
7,
14,
15,
16,
17,
18].
C1 had a consistency of 1.000, raw coverage of 0.454 and unique coverage of 0.069, giving it the most extensive empirical coverage and unique contribution among the three configurations. The control sequence should follow the same pathway. Work should first be suspended or restricted when weather or lifting conditions exceed allowable limits. Inspectors should then verify foundation settlement, rail condition, anchorage nodes, tower verticality, free-end height, structural members, bolts and pins. Brake performance, wire ropes, hooks, pulleys, limiters, anemometers, anti-collision devices and monitoring alarms should be checked before operation resumes. The optional status of Q7 and Q9 in C1 does not mean that electrical control or management is unimportant. It means only that their membership is not constrained in this minimized configuration.
(2) Electrical-management coupling type. This type comprises configurations C2a and C2b. Both share the core expression Q1*Q2*Q3*Q4*Q5*Q7*Q9. They retain the same front-end chain of weather disturbance, lifting demand, surrounding exposure, support weakness and structural-connection weakness as C1. Their downstream route is characterized by electrical control risk (Q7) and weak management, maintenance and emergency capability (Q9). Electrical interlocks, emergency-stop circuits, grounding and power-supply protection determine whether unsafe commands or failures can be interrupted. Management and maintenance determine whether defects are detected, rectified and prevented from recurring. Their joint presence as core conditions indicates that technical abnormalities are more likely to remain active when organizational closure is weak.
C2a adds Q6 as a peripheral condition, while Q8 is optional. It represents an electrical-management pathway reinforced by degraded mechanical execution. C2b instead adds Q8 as a peripheral condition, while Q6 is optional. It represents an electrical-management pathway reinforced by weak safety interception and monitoring. The two configurations show conditional substitution between mechanical reliability and automatic protection. C2a had consistency of 0.999, raw coverage of 0.399 and unique coverage of 0.014. C2b had consistency of 1.000, raw coverage of 0.407 and unique coverage of 0.022. Control should focus first on emergency-stop circuits, zero-position and interlock functions, grounding, power-supply protection, scheme approval, personnel qualification, maintenance records, hazard closure and emergency readiness. This package should then be supplemented by mechanical inspection for C2a, or by full functional testing of limiters, anti-collision devices and monitoring alarms for C2b.
5.4. Key Condition Analysis
Comparison across the three configurations shows that Q1–Q5 are core conditions in every pathway. Their repeated occurrence defines a common front-end risk chain rather than five independent causes. Q1 captures external weather disturbance, Q2 captures operating and dynamic load, and Q3 captures exposure to surrounding cranes, obstacles, power lines and people. Q4 defines the support and anchorage boundary of the crane, while Q5 determines the continuity and reliability of structural load transfer. Q4 also had the highest necessity consistency (0.875), although it remained below the 0.90 threshold. Foundation and anchorage should receive priority without being treated as a single necessary cause.
The downstream conditions distinguish the pathways. Q6 and Q8 form the mechanism-protection route in C1. Q7 and Q9 form the electrical-management route in C2a and C2b, with Q6 or Q8 providing peripheral reinforcement. In terms of core-condition occurrence, Q1–Q5 appear in all three configurations, Q7 and Q9 appear in two, and Q6 and Q8 each define one principal downstream route. This pattern supports a two-stage inspection strategy. The first stage should assess Q1–Q5 for every tower crane. The second stage should select either the Q6–Q8 mechanical and protection package or the Q7–Q9 electrical and management package according to the observed equipment and organizational state. Because the evidence comes from expert questionnaire responses, these conditions should be interpreted as priority combinations in perceived high-risk states rather than individually verified accident causes.
5.5. Robustness Analysis
Robustness was examined through two threshold adjustments. First, the case-frequency threshold was raised from 3 to 4. Three truth-table rows remained and were minimized to two intermediate solution terms, as shown in
Table 14. Both terms retained Q1–Q5, Q8 and Q9; R1 additionally retained Q6, whereas R2 retained Q7. Second, the PRI consistency threshold was raised from 0.70 to 0.80 while the case-frequency threshold remained at 3. All six baseline truth-table rows still passed, and the three intermediate terms in
Table 13 were unchanged.
After the frequency threshold was raised, both R1 and R2 retained Q1–Q5, Q8 and Q9, while Q6 and Q7 remained alternative links. R1 had consistency of 1.000, raw coverage of 0.415 and unique coverage of 0.030; R2 had consistency of 1.000, raw coverage of 0.407 and unique coverage of 0.022. Overall solution consistency remained 1.000, while solution coverage declined from 0.490 to 0.437 because configurations represented by only three questionnaires were removed. The persistence of Q1–Q5 under both threshold tests supports the stability of the common front-end chain. The appearance of Q8 and Q9 in both higher-frequency terms indicates that safety interception and organizational closure become more prominent when analysis is restricted to better represented configurations.
The robustness checks support substantive stability rather than exact invariance. After the frequency threshold was raised, the number of intermediate terms decreased from three to two and coverage fell by 0.053, but the common Q1–Q5 structure and the distinction between mechanical-protection and electrical-management links were preserved. These findings are bounded by the data source. The 178 observations are professional questionnaire responses, not matched project records with observed accident outcomes. The configurations identify stable combinations in expert risk assessments and can guide inspection packages, but they should not be presented as validated accident-prediction rules.
5.6. Retrospective Case-Based External Validation
To examine whether the retained factors and configurations appeared beyond the questionnaire data, five independent accident cases were selected after the fsQCA model had been estimated, as shown in
Table 15. These cases included the 2008 New York 51st Street collapse, the 2008 Rotterdam collapse, the 2019 Seattle dismantling collapse, the 2019 Halifax collapse during Post-Tropical Storm Dorian [
36,
37,
38,
39], and the 2019 Huarong Pearl Phase III tower-crane collapse in Yueyang, Hunan Province, China, which was reported by a municipal accident investigation and used as a validation case in a prior Chinese tower-crane accident-causation study [
40,
41].
The five cases showed clear factor-level concordance. New York documented lifting, anchorage, connection and procedural failures. Rotterdam documented load-radius, structural, mechanical, control, protection and risk-management failures. Seattle documented the interaction of wind, prematurely removed structural pins and dismantling management. Halifax documented high wind acting on a hidden mast-weld defect. Yueyang documented imbalance during jacking and dismantling, unreliable seating of the jacking-beam pin, non-use of anti-falling protection, outward movement of the standard section, insufficient dismantling qualification, weak technical disclosure and deficient on-site supervision. Across the five cases, at least two retained dimensions were involved in every event, and all nine dimensions appeared in at least one investigation.
The stronger pathway-level test was not satisfied. None of the five cases supplied evidence for all five common Q1–Q5 conditions together with either the Q6–Q8 or Q7–Q9 downstream package. Rotterdam occurred under favorable weather, while Halifax occurred even though the investigating authority found that the owner and operator had met applicable preventive requirements. Yueyang reproduced a China-based jacking/dismantling chain involving Q2, Q5, Q6, Q8 and Q9, but did not establish Q1, Q3 or Q4 as causal evidence. The external cases support the engineering relevance of the screened factor system but do not validate the complete questionnaire-derived configurations as universal accident pathways. This finding reinforces the bounded interpretation adopted in this study: C1, C2a and C2b are structured profiles for prioritizing inspection under expert-perceived high-risk states, not deterministic or predictive accident rules.
6. Conclusions and Discussion
This study examined key factor identification and questionnaire-derived high-risk configurations for tower-crane construction safety. It developed a 45-factor candidate system covering equipment status, operating conditions, site environment, foundation and anchorage, structural connections, mechanical and electrical control, safety protection, and management and maintenance. By integrating standards, accident-causation characteristics and site inspection items, the system reflects the central feature of tower-crane construction risk: equipment conditions, operational processes, environmental disturbances and organizational management jointly shape the high-risk state.
For risk-factor screening, this study introduced a two-stage Pearson correlation method to reduce redundancy in the candidate system. The final threshold was set at p = 0.55, and sensitivity tests at p = 0.50, 0.55 and 0.60 produced the same 16-factor set. Compared with one-step correlation filtering, PCA-based reduction and clustering-based representative selection, the method keeps the engineering meaning of the original indicators while considering local correlation, score dispersion, system-level redundancy and dimension integrity. The final 16 factors covered all nine dimensions and showed higher information density than the full candidate system.
For the questionnaire-derived high-risk profiles, no antecedent condition reached the 0.90 necessity threshold. The truth table retained six positive rows at a case-frequency threshold of 3, consistency threshold of 0.80 and PRI threshold of 0.70. Minimization produced three intermediate solution terms with overall consistency of 0.999 and coverage of 0.490. Q1–Q5 were core conditions in every term, whereas Q6 and Q8 formed one downstream combination and Q7 and Q9 formed another. Raising the case-frequency threshold to 4 reduced the solution to two terms but retained Q1–Q5 in both; raising PRI to 0.80 did not alter the baseline result. Retrospective comparison with five independent accident investigations supported the external relevance of individual retained dimensions but did not reproduce any complete configuration. Tower-crane safety management can use the configurations as structured inspection profiles, while avoiding interpretation as validated accident-prediction rules.
The study has limitations. The fsQCA conditions and outcome were derived from the same questionnaire responses, although they were constructed at different aggregation levels. The resulting configurations therefore describe expert-perceived high-risk profiles rather than causal effects estimated from independent project outcomes. The retrospective accident comparison was qualitative because the official reports did not provide calibrated membership scores for all nine conditions, and an unreported condition could not be coded as absent. Future research should link the final factor set with monitoring data, inspection records and accident or near-miss outcomes from real tower-crane projects. It should also construct an outcome independent of the antecedent conditions and test predictive performance prospectively.
Overall, this study makes three contributions. It builds a candidate factor system for tower-crane construction safety, specifies a screening strategy that considers both correlation redundancy and information retention, and identifies questionnaire-derived high-risk profiles from a configurational perspective. The independent accident comparison supports the engineering relevance of the retained dimensions while defining the boundary of the configuration claims. The results can support optimization of key inspection items and graded on-site control, but project-level outcome data are needed before predictive use.