


Abstract
Heritage Building Information Modelling (H-BIM) is increasingly used for the documentation, conservation and management of historical assets. However, the integration of geometric singularities, degradation phenomena and vulnerability-related information within H-BIM environments remains only partially addressed, as current workflows are often manual, fragmented and poorly connected to structured conservation assessment procedures. This paper introduces V-HBIM, a vulnerability-oriented Heritage BIM approach aimed at integrating geometric data, defect mapping and conservation parameters into a single digital model. A semi-automated scan-to-model workflow is proposed, combining point cloud processing, geometric modelling, mesh-based defect representation, BIM conversion, structural vulnerability calculations and automated information enrichment. The workflow uses CloudCompare, Rhinoceros 3D, Rhino.Inside.Revit, Autodesk Revit and Dynamo scripts to connect digital survey outputs with a structured database derived from the Italian Ministry of Culture Risk Map. The method is validated on the Roman Arch of San Damiano, in the Archeological Park of Carsulae, Italy. Results show that defects can be represented as queryable BIM entities and associated with severity, extent and urgency parameters. The proposed approach supports conservation planning, inspection updating and vulnerability-oriented management of cultural heritage assets.
1. Introduction
The digital transformation of the architecture, engineering and construction sector has significantly changed the way built assets are documented, designed and managed. Building Information Modelling (BIM), originally developed for new buildings and infrastructures, allows the creation of object-based digital models in which geometric representation and information management coexist within the same environment [1,2]. In recent decades, this approach has been increasingly extended to existing and historical constructions, giving rise to Heritage or Historic Building Information Modelling, commonly referred to as H-BIM [3,4,5,6].
Unlike conventional BIM, which generally relies on standardized components and predictable construction processes, H-BIM must address the intrinsic complexity of historical assets. These structures are often characterized by irregular geometries, non-standard construction techniques, heterogeneous materials, stratified transformations, decay processes and incomplete documentation. As a result, the creation of an H-BIM model is not merely a modelling task but a knowledge-based process that combines digital survey, historical interpretation, material characterization and conservation-oriented data management [3,5].
The transition from survey data to an H-BIM model is commonly referred to as scan-to-BIM or scan-to-HBIM. This process usually starts with laser scanning, photogrammetry or integrated survey techniques and requires the transformation of point clouds or mesh-based data into semantically meaningful BIM objects. Although several studies have investigated as-built BIM generation [7], object recognition [8] and semantic enrichment from survey data [9], this conversion remains time-consuming and only partially automated, especially in the presence of irregular geometries, non-standard elements and incomplete information [4,10]. These difficulties are further amplified in cultural heritage applications, where the model is expected not only to reproduce geometry but also to document the actual state of conservation of the asset.
For conservation-oriented applications, the integration of defects, degradation phenomena and vulnerability-related information into BIM models represents a crucial yet still open issue [11,12]. Cracks, biological colonization, material loss, detachments, moisture-related phenomena and surface alterations are often documented through drawings, images, annotations or external reports, but they are not always converted into structured, queryable and updateable BIM entities [13]. Recent studies have started to address this limitation by proposing H-BIM-based protocols for damage classification, severity assessment and monitoring [14], as well as HBIM workflows for structural and seismic assessment of heritage masonry buildings [15,16]. Nevertheless, the integration of conservation-oriented defect classes, state-of-conservation parameters and vulnerability visualization within a coherent H-BIM workflow remains only partially explored.
2. Open Challenges in H-BIM Applications
Heritage Building Information Modelling (H-BIM) extends BIM methodologies to historical and archeological assets by integrating geometric, historical, material and conservation-related information within a semantic digital environment [1,3,5,13]. Unlike conventional BIM applications, H-BIM must represent irregular geometries, deformations, material decay and non-standard architectural elements, requiring reverse-engineering workflows based on survey data rather than idealized design models.
Recent review studies confirm the growing role of HBIM as a framework for cultural heritage documentation, conservation and information management, highlighting both the increasing maturity of survey-based modelling workflows and the persistent challenges related to semantic enrichment, interoperability and long-term data management [17,18,19,20].
Digital survey techniques such as laser scanning and photogrammetry are therefore fundamental in H-BIM processes, enabling the acquisition of dense point clouds that accurately capture the existing state of heritage assets [21]. Previous survey-to-HBIM applications have shown how survey data can be transformed into structured information models to support documentation, restoration and intervention planning [22]. However, the conversion of point clouds into semantically structured BIM objects remains one of the main unresolved challenges, particularly for irregular and degraded historical structures [4,10]. Although several studies proposed semi-automated recognition and classification procedures [23], heritage buildings still require substantial expert interpretation because of their geometric complexity and non-repetitive components [24]. Mesh-based H-BIM has also been explored to improve the representation of irregular geometries and support knowledge enrichment [25]. Nevertheless, interoperability between survey software, modelling environments and BIM platforms remains problematic, even when open standards such as Industry Foundation Classes (IFC) are adopted.
Another major issue concerns the modelling of defects and degradation phenomena. Historical buildings are frequently affected by cracks, moisture, biological colonization, detachments and material loss, all of which are essential for vulnerability assessment and conservation planning [14]. In many H-BIM applications, these phenomena are represented through annotations, textures or external documentation [15], thus limiting the semantic potential of BIM environments. Recent studies emphasize the need to model defects as independent, queryable and updateable entities linked to specific attributes and conservation parameters [14,15,26]. Different degradation types may also require different geometric strategies, including subtractive, additive or surface-based representations.
The integration of vulnerability assessment into H-BIM frameworks represents a further open challenge. For cultural heritage assets, this process requires the systematic identification, classification and interpretation of damage and decay phenomena. In Italy, the “Carta del Rischio”—hereinafter referred to as the Risk Map—provides an institutional framework for this purpose [27]. Developed by the Italian Ministry of Culture, the Risk Map is a national information system aimed at supporting the preventive conservation of cultural heritage through the identification, classification and monitoring of vulnerability and risk conditions. Among its tools, the vulnerability assessment sheet related to the state of conservation of monuments provides a structured methodology for describing defects and evaluating their relevance through parameters such as severity, extent and urgency [27].
Within this framework, defects are grouped into six main categories:
- Compromise of structural integrity;
- Disintegration and loss of material;
- Staining and moisture-related phenomena;
- Biological attacks;
- Alterations of surface layers;
- Partial or total absence of portions of the artefact.
Each defect is described through three main parameters:
- -
- Severity, which expresses the impact of the defect on the element or asset;
- -
- Extent, which describes the portion of the element affected by the phenomenon;
- -
- Urgency, which indicates the priority of intervention.
This classification provides a relevant basis for structuring vulnerability-related information within H-BIM environments. Recent research demonstrated the potential of H-BIM for crack classification, monitoring-based assessment, structural diagnosis, intervention design and seismic vulnerability analysis [16,28]. In parallel, approaches based on the dynamic response of cultural heritage assets, including ambient vibration testing and vibration-based monitoring, have long been used to assess the conservation state of historical structures and to validate the capability of numerical or digital models to reproduce their actual physical behaviour [29,30,31]. These methods provide complementary information to geometry- and defect-based H-BIM workflows, especially when the objective is to connect digital documentation with structural diagnosis and monitoring-based assessment. Nevertheless, the integration of vulnerability assessment procedures into H-BIM environments remains only partially addressed, especially when defect geometries, assessment parameters, calculation rules and visual outputs need to be connected within a single interoperable workflow. Within this perspective, the Risk Map framework provides a suitable reference for structuring defect categories and vulnerability-related parameters.
Overall, current H-BIM research still faces important limitations related to scan-to-HBIM automation, interoperability, semantic defect representation and the integration of vulnerability assessment within BIM environments [4,10].
In this context, the present paper introduces the concept of V-HBIM, defined as a vulnerability-oriented H-BIM model in which geometric entities, defect classes and vulnerability-related parameters are integrated into a single digital environment. The objective is to move beyond a purely geometric or documentary model and to develop an information system capable of supporting the assessment of the conservation state of cultural heritage assets.
The proposed approach is based on a semi-automated scan-to-model workflow. Starting from digital survey data, the methodology enables the modelling of basic architectural elements and defect-related mesh elements, their conversion into BIM components, and the automatic enrichment of the model with information derived from a structured vulnerability database, based on the Risk Map framework. In particular, the attention is focused on the vulnerability assessment sheet related to the state of conservation of monuments.
The main contributions of this study are:
- The definition of a V-HBIM framework for integrating vulnerability assessment into Heritage BIM;
- The development of a semi-automated workflow linking point cloud processing, 3D modelling, BIM conversion and information enrichment;
- The representation of selected defects as independent digital entities within the BIM environment;
- The integration of severity, extent and urgency parameters into the H-BIM model through automated information transfer;
- The validation of the workflow on the Roman Arch of San Damiano in the Archeological Park of Carsulae, Italy.
The methodological advance of the proposed V-HBIM framework can be better understood by comparing it with existing H-BIM and scan-to-BIM approaches. Previous studies have addressed the conversion of point clouds into as-built or semantically enriched BIM models, focusing on point-cloud segmentation, object recognition, geometric reconstruction, object relationship modelling, and information structuring from survey data [7,8,9,10,24,25,32,33,34,35,36]. These studies, including scan-to-BIM reviews and point-cloud-based workflows, have highlighted the importance of moving from raw survey data to structured BIM information through geometric modelling and object recognition procedures. However, in these approaches, degradation phenomena are generally not the central modelling target and are often managed through annotations, textures, images or external documentation rather than as independent BIM entities. Other contributions have explored diagnosis-aided information modelling, conservation documentation, preventive conservation, maintenance-oriented data management, seismic vulnerability and multi-hazard risk assessment within H-BIM or HBIM-GIS environments [11,12,13,14,15,16,19,20,28,37,38,39,40].
Compared with these approaches, the proposed V-HBIM workflow introduces an operational connection between defect geometry, conservation parameters and BIM-based visualization. Selected defects are modelled as independent mesh-based objects, linked to Risk Map-derived state-of-conservation parameters and automatically enriched through an Excel–Dynamo–Revit workflow. The contribution is therefore not limited to geometric modelling or semantic enrichment but consists of integrating defect mapping, vulnerability-oriented information management and chromatic assessment outputs within a single queryable and updateable H-BIM environment.
3. Methodology: The Vulnerability-Oriented Heritage BIM (V-HBIM)
In this paper, V-HBIM is defined as a vulnerability-oriented Heritage BIM environment in which the geometric, material, diagnostic and conservation-related information of a historical asset are integrated into a single digital model. The prefix “V” emphasizes the role of vulnerability assessment as a core component of the model, rather than an external or subsequent analysis.
The V-HBIM model is therefore not limited to the representation of the asset’s morphology. It includes information about the state of conservation, the spatial distribution of defects, their classification, and their relevance for maintenance and intervention planning. The model is intended to support multiple operations: documentation, inspection, querying, updating, visualization and decision-making.
The proposed V-HBIM workflow consists of eight main phases (Figure 1):
Figure 1.
General V-HBIM workflow, showing the integration between the geometric/modelling stream and the vulnerability-related information stream, together with the software tools adopted in each phase.
- Digital survey and point cloud generation;
- Point cloud processing and segmentation;
- Geometric modelling of basic architectural elements;
- Identification and mesh-based modelling of defects;
- Conversion of 3D elements into BIM entities;
- Creation of a Risk Map-based vulnerability database;
- Automated assignment of vulnerability-related information;
- Visualization, querying and updating of the V-HBIM model.
The workflow is semi-automated because it combines manual interpretation, which remains necessary for heritage-specific features, with automated procedures for information transfer and parameter assignment. This balance is considered appropriate for cultural heritage applications, where full automation may lead to oversimplification or misinterpretation of complex and irregular conditions.
3.1. Digital Survey and Point Cloud Processing
The methodology starts with the acquisition of the asset’s geometry through digital survey techniques. Laser scanning and photogrammetry can be used either separately or in combination, depending on the characteristics of the asset and the required level of detail [36]. The output of this phase is a dense point cloud representing the current geometry and state of the monument.
The point cloud is processed in CloudCompare according to a semi-automatic and operator-controlled pipeline. After importing the dense cloud, a preliminary verification is carried out to check the consistency of the reference system, spatial extent, orientation and completeness of the surveyed asset. Points outside the area relevant to the monument are then removed through manual cropping using the Segment tool. The area of interest is defined by considering the visible limits of the asset, including the main architectural components, foundation elements and exposed masonry surfaces.
Noise filtering is performed to remove isolated points and scattered artefacts not belonging to the monument. When necessary, tools such as the Statistical Outlier Removal filter can be used to identify sparse outliers, while manual verification remains essential to avoid the removal of diagnostically relevant surface irregularities. The cleaned point cloud is then simplified using spatial subsampling, with a minimum point spacing selected according to the required level of detail and the computational burden of the subsequent modelling stages. This step reduces dataset size while preserving the main geometric features of the asset and the surface irregularities relevant to the V-HBIM workflow.
The segmentation phase distinguishes between the main architectural components, non-relevant surrounding elements and local portions corresponding to defect or singularity areas. Surrounding ground portions, vegetation, temporary objects and survey artefacts are manually identified and removed when clearly unrelated to the monument. Particular attention is paid to surface degradation phenomena, exposed construction materials and other morphological irregularities relevant to conservation assessment. Before export to Rhinoceros 3D, the processed cloud is visually inspected from plan, elevation and oblique views to verify surface continuity, the absence of residual outliers and the preservation of diagnostically significant areas.
Since this phase includes an interpretative component, a set of operational criteria is adopted to reduce operator-dependent variability. Points are removed only when they clearly belong to vegetation, ground portions, surrounding elements or survey artefacts not relevant to the monument. Architectural components are preserved when they contribute to the interpretation of the asset geometry, construction system or state of conservation. Defect-related areas are segmented only when their spatial extent and physical interpretation are sufficiently clear from both the point cloud and the photographic documentation. Ambiguous areas are retained as part of the general survey documentation rather than converted into independent defect meshes. In this way, the processing phase combines data reduction with conservative selection criteria, avoiding the loss of diagnostically relevant information.
This step is essential because the quality and organization of the point cloud strongly influence the efficiency and accuracy of the modelling process. For heritage assets, point cloud processing is not merely a technical operation but also an interpretative phase in which the main architectural components and defect areas are identified.
3.2. Geometric Modelling of Basic Elements
After processing, the point cloud is imported into Rhinoceros 3D. The basic architectural elements of the structure are modelled by tracing the surveyed geometry and adapting surfaces and solids to the actual morphology of the asset [41]. Rhinoceros is used in this work due to its flexibility in handling complex shapes and its ability to manage NURBS surfaces, curves and mesh objects.
The model is divided into distinct components, such as arches, abutments, walls, foundations or other architectural elements. This subdivision is important because each component must later be converted into a BIM entity and associated with specific information. However, the objective is not to produce either a fully idealized model or an excessively detailed replica of every surface irregularity. Rather, the aim is to define a modelling strategy able to balance geometric accuracy, modelling effort and vulnerability-oriented information management.
In conventional BIM workflows, existing structures are often regularized into ideal geometric components [42]. While this approach may be acceptable for ordinary architectural documentation, it can be insufficient for historical constructions, where geometric anomalies, deformations, material discontinuities and surface defects may influence the conservation state and, potentially, the structural behaviour of the asset. For this reason, the proposed methodology adopts a selective modelling strategy.
The main architectural and structural components, such as the arch, abutments and foundation blocks, are modelled as regularized “basic” elements while avoiding excessive approximation of their actual shape. This choice reduces modelling time, keeps the BIM model manageable and supports a clear semantic organization of the monument. Conversely, the features that are relevant for vulnerability assessment, including surface defects, morphological singularities and non-standard material portions, are modelled separately as mesh-based components derived from the point cloud.
In this way, the V-HBIM model preserves a faithful representation of the diagnostically significant areas while maintaining an efficient geometric structure for the overall monument. Rather than reproducing every surface irregularity with the same level of detail, the workflow assigns higher geometric fidelity to those features that are relevant for conservation and vulnerability assessment. The resulting model therefore combines regularized architectural components with high-fidelity defect-related mesh entities, providing a more realistic and heritage-specific basis for information management and future vulnerability analyses.
3.3. Defect Mapping and Mesh-Based Representation
Defect mapping is performed by identifying the areas affected by degradation or morphological anomalies on the point cloud and on the geometric model. The identified defects are classified according to the Risk Map categories (described in Section 2) and represented as independent mesh elements. This step is central to the proposed V-HBIM workflow, as it allows defect-related information to be spatially located, geometrically represented and subsequently managed as BIM data.
For surface-related phenomena, a local mesh is generated from the portion of the point cloud corresponding to the area where the defect is located. This mesh is not intended to reproduce the entire architectural element but only the irregular or degraded surface portion that requires a higher level of geometric fidelity. It can be generated through two alternative but compatible routes, depending on the available photogrammetric outputs and on the level of control required during segmentation. In the first route, the local mesh is extracted from the photogrammetric mesh generated in Agisoft Metashape after image alignment and dense cloud reconstruction. In this case, the global polygonal mesh of the surveyed asset is used as the geometric source from which the local portion corresponding to the defect area is isolated. This solution is suitable when a textured and geometrically continuous mesh is already available from the photogrammetric processing stage. In the second route, the local mesh is generated after point-cloud segmentation in CloudCompare. The dense cloud is first cleaned, filtered and segmented to isolate the subset corresponding to the defect area; the selected subset is then converted into a mesh using surface reconstruction tools, such as 2.5D Delaunay triangulation for locally projectable surfaces or Poisson-type reconstruction for more irregular three-dimensional portions. This route provides greater control over the points used for mesh generation, especially when the defect area needs to be isolated before meshing.
In both cases, the aim is to avoid transferring the entire high-density survey mesh into the BIM environment and to retain only localized high-fidelity mesh elements representing diagnostically relevant surface portions.
The resulting local mesh is then imported into Rhinoceros 3D and superimposed on the regularized basic geometry of the corresponding architectural component.
At this stage, the _MeshSplit command is used to separate the local mesh with respect to the reference basic geometry (see Section 5 for practical details). In practical terms, the command divides the mesh into different portions, allowing the operator to distinguish the part that is geometrically coherent with the surveyed surface from portions that overlap with, intersect, or fall inside the regularized element. The selection of the portion to be retained is based on both geometric and diagnostic criteria. For positive or surface-related defects, the retained mesh must: (i) be located on the external side of the regularized reference surface; (ii) preserve the spatial continuity of the mapped defect area; (iii) be consistent with the photographic evidence and point cloud texture; (iv) maintain a sufficiently coherent boundary for subsequent BIM import; and (v) avoid duplicated, disconnected or overlapping mesh fragments generated by the splitting operation. Mesh fragments are discarded when they fall inside the reference geometry, correspond to numerical artefacts, are disconnected from the defect area, or do not represent the physical phenomenon under consideration. In the present implementation, which focuses on surface-related and positive mesh defects, the retained portion therefore corresponds to the external surface mesh representing the defect or morphological singularity. Conversely, portions associated with material loss or inward geometrical discontinuities require a negative representation strategy. In this case, the defect should be represented by comparing the regularized reference geometry with the surveyed recessed surface and by generating a negative volume corresponding to the missing or eroded portion. This negative volume could be managed either as a subtractive geometry applied to the basic element or as an independent negative-defect object associated with the corresponding vulnerability record. This strategy, which is not fully implemented in the current workflow, is proposed here as a proof of concept for future extension of the workflow to classes involving material loss or missing portions, such as classes B and F (see Section 2).
Once isolated, the retained mesh portion becomes an independent object, geometrically coherent with the surveyed surface and suitable for import into Autodesk Revit as a separate BIM entity, generally under the category of generic models. In this way, the defect is not treated as a simple texture, annotation or visual overlay, but as a distinct digital object. It can therefore be selected, queried and enriched with specific attributes, including defect class, material, severity, extent, urgency and vulnerability-related index.
The use of independent mesh elements has several advantages. First, it preserves the spatial relationship between the defect and the architectural element on which it occurs. Second, it allows the model to distinguish between regularized structural components and high-fidelity diagnostic features. Third, it enables the subsequent automatic assignment of vulnerability-related information through the Excel–Dynamo–Revit workflow. Finally, it supports the chromatic visualization of defects according to the outcome of the vulnerability-oriented analysis.
Three modelling logics can be adopted according to the physical nature of the defect:
- -
- Negative representation: For phenomena involving material loss or missing portions.
- -
- Neutral representation: For superficial alterations that do not significantly affect geometry.
- -
- Positive representation: For phenomena involving the addition of material or surface colonization.
To clarify the relationship between the Risk Map defect classes and the adopted modelling strategy, Table 1 summarizes the proposed representation logic for each category.
Table 1.
Risk Map defect categories, V-HBIM representation strategies and current implementation level within the proposed workflow.
As shown in the table, the current geometric implementation of the workflow focuses mainly on defects that can be represented as surface or positive mesh elements, such as biological attacks and surface alterations. Defect classes involving material subtraction or missing portions can already be included at the database and parameter-assignment level; however, their full geometric implementation as negative BIM representations remains a future development of the method.
3.4. Risk Map-Based Vulnerability Database
The vulnerability assessment component of the workflow is based on a digital database derived from the Risk Map of the Italian Ministry of Culture [27]. The database reproduces, in a simplified and operational form, the logic of the vulnerability assessment sheet related to the state of conservation of monuments.
For each identified defect, the database stores information such as:
- -
- Element identification code;
- -
- Defect identification code;
- -
- Defect category;
- -
- Material;
- -
- Location;
- -
- Severity;
- -
- Extent;
- -
- Urgency;
- -
- Notes or inspection information;
- -
- Vulnerability-related level.
The database is structured in Microsoft Excel, allowing easy compilation, inspection and updating. This choice provides a practical interface between field observations, vulnerability assessment and BIM. The Excel database acts as an intermediate layer between the diagnostic interpretation of the asset and the automatic population of the BIM model.
The three main parameters adopted for the assessment are severity, extent and urgency. As anticipated in Section 2, severity expresses the impact of the phenomenon on the conservation state of the element. Extent describes how much of the surface or component is affected. Urgency indicates the intervention priority associated with the defect. Together, these parameters provide the basis for assigning a vulnerability-related level to each defect.
It is worth noting that in this study, the subsequent calculation of the vulnerability-related index was implemented as a demonstrative procedure for workflow validation. The Risk Map framework was therefore used to structure the defect categories and assessment parameters, while the numerical combination of these parameters was defined to test the interoperability between the digital sheet and the BIM environment.
3.5. Transition from 3D Model to BIM Environment
Once the modelling phase in Rhinoceros is completed, the model is transferred to Autodesk Revit using Rhino.Inside.Revit. This plug-in allows the direct import of Rhinoceros geometries into Revit, reducing the limitations associated with conventional file exchange procedures.
The basic architectural elements are imported as BIM components and organized according to appropriate Revit categories and families. As anticipated in Section 3.3, mesh elements representing defects or morphological singularities are imported separately, under the category of generic models. This organization allows the model to distinguish between structural or architectural components and defect-related entities.
The correct management of Revit categories, families and shared parameters is essential for the proposed workflow. Standard Revit parameters are not sufficient to describe the conservation state of a heritage asset. Therefore, customized shared parameters are created to store information related to material properties, defect classification, vulnerability assessment and historical or diagnostic data.
The use of shared parameters enables the creation of schedules and tables inside Revit, allowing users to query the model and retrieve information about each component or defect. Moreover, these parameters can be exported and updated, supporting interoperability and future integration with external platforms.
3.6. Automated Information Enrichment Through Dynamo
The information enrichment of the V-HBIM model is performed through Dynamo, the visual programming environment integrated into Autodesk Revit. Dynamo is used to automate the connection between an external Excel database and the BIM model [43].
Three main scripts are implemented:
- Material assignment script: this script reads the material information from the Excel database and assigns it to the corresponding BIM elements.
- Defect parameter and colour-coding script: this script assigns severity, extent and urgency values to the defect elements. It also applies a graphical representation consistent with the vulnerability-related level, allowing immediate visual interpretation of the conservation state.
- Integrated script: this script combines the previous functions into a single routine, optimizing the process of populating the V-HBIM model with material and vulnerability-related information.
The automation process reduces manual data entry and improves consistency between the vulnerability database and the BIM model. It also allows the model to be updated when new inspection data become available, making the V-HBIM environment suitable for monitoring and maintenance planning.
4. Case Study and Workflow Application
4.1. The Roman Arch of San Damiano in Carsulae
The proposed methodology was applied to the Roman Arch of San Damiano (Figure 2), located in the Archaeological Park of Carsulae, near San Gemini, in Umbria, central Italy. Carsulae was an important Roman settlement that developed along the route of the Via Flaminia, the consular road traced by Gaius Flaminius around 220 BC [44]. The road entered the city through the monumental Arch of San Damiano, which marked the northern access to Carsulae [45].
Figure 2.
Roman Arch of San Damiano in Carsulae: current state of the monument and dimensional scheme of the surviving archway and foundation base.
The monument is dated to the 1st century AD. Only the central archway is preserved today. The surviving structure consists of two massive pillars in opus caementicium (Roman concrete) [46], faced with large squared limestone blocks arranged in opus quadratum and laid without mortar. The round arch, made of squared limestone blocks, has a span of approximately 5.0 m, a thickness of about 0.8 m, an overall height of approximately 9.2 m from ground level and a depth of around 4.5 m. The base consists of three stone steps, with an overall width of approximately 4.0 m and a depth of 6.0 m. These features make the Arch of San Damiano one of the most recognizable remains of the archaeological site.
Despite its long-term preservation, the arch is affected by degradation phenomena mainly related to environmental exposure, biological growth and the natural ageing of stone materials. Surface erosion, localized detachments, biological colonization and alterations of the stone surfaces partly affect the readability of the masonry texture and the conservation state of the monument. These conditions make the Arch of San Damiano a suitable case study for testing the proposed V-HBIM workflow, as it combines a clear monumental geometry with material irregularities, surface decay and localized defects.
4.2. Workflow Application Strategy
The V-HBIM workflow was applied to the Arch of San Damiano as a validation case study (Figure 3). The application followed the methodological sequence described in Section 3, from digital survey and point-cloud processing to geometric modelling, mesh-based defect representation, BIM conversion and information enrichment. The aim was not only to obtain a three-dimensional representation of the monument but also to verify whether defect-related geometries and vulnerability-related parameters could be integrated into a single queryable BIM environment.
Figure 3.
V-HBIM workflow applied to the Arch of San Damiano.
From the geometric point of view, the application distinguished between regularized basic elements and high-fidelity mesh-based components. The basic elements included the surviving archway, the two abutments and the foundation blocks. Mesh-based elements were instead used to represent morphological singularities and surface-related degradation phenomena. In particular, the geometric implementation focused on biological attacks classified as defect type D, while additional Risk Map categories were introduced at the information-management level to test the database and automation workflow (see Section 3.3).
This distinction follows the representation strategy summarized in Table 1: surface and positive defects can be managed through mesh-based representation, while negative defects involving material loss or missing portions require further geometric development. The detailed survey outputs, modelling results, BIM structuring process and vulnerability-oriented visualization are presented in Section 5.
5. Results
5.1. Digital Survey Output and Geometric Model Generation
The first result of the workflow is the generation of a survey-based geometric dataset suitable for the subsequent V-HBIM modelling phases. The aero-photogrammetric survey was performed using a DJI Mavic Mini drone (DJI, Shenzhen, China). The drone is equipped with a 12 MP FC7203 camera, with a 6.2 mm × 4.5 mm CMOS sensor, a 4.49 mm focal length, corresponding approximately to 24 mm in full-frame equivalent format, and an f/2.8 aperture. High-resolution images, with a size of 4000 × 2250 pixels, were acquired in Auto ISO exposure mode. The survey was carried out under cloudy sky conditions, which provided diffuse lighting and reduced strong shadows on the stone surfaces.
The aerial survey lasted approximately 40 min and produced a dataset of 550 images. The flight was performed manually, rather than through a pre-planned nadiral acquisition, in order to adapt the image acquisition to the geometry, accessibility conditions and conservation features of the monument. Convergent images were acquired from multiple viewpoints around the arch, with distances ranging from approximately 1.5 m for detailed images to about 4–5 m for contextual views. The flight height ranged approximately between 10 m and 14 m. The intrados of the arch was also documented by tilting the camera approximately 20° upwards, allowing the internal curved surface to be included in the photogrammetric dataset.
The images were processed in Agisoft Metashape Professional, version 1.8.3. A total of 546 cameras were aligned, producing 245,242 tie points, 1,260,409 projections and a reprojection error of 1.03 pixels. The estimated ground resolution was 1.99 mm/pixel. Image alignment was performed with medium accuracy, generic preselection enabled, a key point limit of 40,000 and a tie point limit of 4000. Depth maps were generated with medium quality, mild filtering and a maximum number of 16 neighbours. The dense cloud generated in Metashape consisted of approximately 6.83 million points.
Sixteen Agisoft Metashape-coded circular markers were used as reference targets. The model was scaled using scale bars defined between selected markers, without assigning absolute coordinates to the markers. The total error of the control scale bars was 0.0028 m, while the total error of the check scale bars was 0.0017 m. Therefore, the photogrammetric model was not georeferenced through a complete topographic control network but was metrically scaled for the purposes of geometric modelling, segmentation and defect localization within the proposed V-HBIM workflow.
The CloudCompare processing workflow described in Section 3.1 was applied to the Arch of San Damiano point cloud using version 2.13.2 of the software and conservative parameters. Noise filtering was performed to remove isolated points and scattered artefacts not belonging to the monument. Statistical Outlier Removal was applied with a neighbourhood size of 20 points and a standard deviation multiplier of 1.5. Point cloud simplification was then performed through spatial subsampling, using a minimum point spacing in the range of 5–10 mm. This range was selected to reduce local point redundancy while preserving masonry edges, surface discontinuities and defect-related areas. Small isolated clusters were removed only when clearly unrelated to the monument, using a conservative minimum cluster-size threshold of approximately 50 points and a final visual inspection from multiple viewpoints.
After point cloud cleaning and segmentation, the model was organized into two main groups of elements: basic architectural components and mesh-based elements (Figure 4).
Figure 4.
3D modelling of basic elements (architectural elements) and mesh elements (defects and singularities) in Rhinoceros 3D.
The first group includes the main load-bearing and architectural parts of the monument, namely the round arch, the two abutments and the corresponding foundation blocks. These elements were modelled in Rhinoceros 3D, version 8, through a controlled simplification process, aimed at preserving the main geometry of the monument while avoiding unnecessary over-modelling of minor surface irregularities.
The second group consists of mesh elements, used to represent both morphological singularities and selected degradation phenomena. As anticipated in Section 3.3, these elements were added to the geometric model in the Rhinoceros environment through the _MeshSplit operator (Figure 5). In particular, irregular portions of opus caementicium visible on the abutments were modelled as mesh-based singular elements, while surface defects, that is biological attacks (defect type D), were isolated from the point cloud and processed as independent mesh objects. This distinction between basic elements and mesh elements proved essential for preserving the semantic organization of the model during the transition to Autodesk Revit (version used: 2025), where each component could be classified, selected and enriched with specific information.
Figure 5.
Mesh-based defect representation workflow: localization of the defect area (a), generation of the local mesh (b), _MeshSplit-based separation (c) and isolated mesh output for BIM import (d).
5.2. BIM Structuring of Basic Elements, Singularities and Defects
The transition from the Rhinoceros 3D model to the BIM environment was performed through Rhino.Inside.Revit. This step produced a structured V-HBIM model in Autodesk Revit, where the different components of the monument were imported and organized according to their role within the information model.
The basic architectural elements were imported first and treated as the main geometric framework of the monument. The mesh elements were imported separately under the category of generic models. This category was selected because it allows non-standard geometries, such as defects and irregular remains of historical construction materials, to be managed as independent BIM entities. As a result, the final Revit model is not a single undifferentiated geometry but a structured digital representation composed of distinct and queryable objects.
This organization allowed the model to preserve three different levels of information:
- The architectural level: Corresponds to the basic geometry of the arch, abutments and foundations.
- The material and constructive level: Corresponds to singular geometries such as exposed opus caementicium.
- The diagnostic level: Corresponds to degradation phenomena and defect-related mesh objects.
5.3. Defect Records and Digital Vulnerability Sheet
The digital vulnerability sheet represents the intermediate layer between the diagnostic interpretation of the monument and the BIM model. It was structured in Microsoft Excel following the logic of the Risk Map vulnerability sheet related to the state of conservation. The database was organized to store both identification data and assessment parameters for each defect (Figure 6a). The adopted structure includes the element ID, family name, Revit category, defect type, material, inspected part, localization, severity, extent, urgency, intervention type and the resulting vulnerability-related index.
Figure 6.
Excel–Dynamo–Revit workflow for vulnerability-oriented information transfer: digital vulnerability sheet (a), Dynamo-based automation (b), Revit parameters assignment (c), chromatic classification of the vulnerability index and colour-coded visualization of defect-related BIM objects (d).
For the case study, the digital vulnerability sheet was tested using three representative defect records, selected to verify the ability of the database and Dynamo scripts to manage different Risk Map categories and assign the corresponding vulnerability-related parameters in Revit. The geometrically implemented record corresponds to a biological attack on the arch, classified as type D and represented as a surface/positive mesh element. Two additional records, related to material disintegration, type B, and missing portions, type F, were introduced only at the information-management level. Their purpose was to test the robustness of the digital sheet and the automated parameter-assignment procedure across defect categories that require different representation strategies. This distinction is relevant because the current workflow fully implements the geometric representation of surface-related defects, whereas the complete BIM representation of negative defects involving material subtraction remains a future development.
A key result of this phase is the conversion of the traditional vulnerability assessment sheet into a machine-readable database. This makes it possible to move from a static conservation form to a dynamic information structure that can interact with the V-HBIM model and support automated information transfer, parameter assignment and chromatic visualization in Revit.
5.4. Workflow-Based Vulnerability Index and Chromatic Classification
The vulnerability assessment was implemented through the calculation of a normalized vulnerability-related index, here referred to as IndK. The IndK index is not proposed as an official Risk Map vulnerability value but as a workflow-validation index designed to demonstrate the digital integration of vulnerability assessment rules into the V-HBIM environment.
As anticipated in Section 2, in the present application, the Risk Map of the Italian Ministry of Culture was adopted as the reference framework for structuring defect classification, from class A to class F, and for defining the input parameters of the assessment, namely severity, extent and urgency. However, the official computational procedure used by the Risk Map to derive final vulnerability values is not directly available to external users. Therefore, a demonstrative calculation rule was introduced to test whether such parameters could be processed in a digital database, transferred into Autodesk Revit and visualized through chromatic classification.
For this purpose, IndK was calculated through a weighted combination of severity, extent and urgency. The weights adopted in this study do not derive from the official Risk Map computational procedure and should not be interpreted as normative or generally calibrated coefficients. They were defined in Excel for demonstrative purposes in order to obtain differentiated test outputs suitable for verifying the information-transfer and chromatic-classification procedure. Severity was assigned a weight of 49.5%, extent a weight of 0.5%, and urgency a weight of 50%. The resulting weighted output was then rescaled within the range 0–1 according to the demonstrative calculation rules implemented in the Excel database in order to make the index compatible with the chromatic classification adopted in Excel and Revit. The resulting IndK value was then associated with four chromatic classes for visualization in Revit:
- -
- Class 0.00–0.25: Low vulnerability-related level, represented in green.
- -
- Class 0.25–0.50: Moderate vulnerability-related level, represented in yellow.
- -
- Class 0.50–0.75: Medium-high vulnerability-related level, represented in orange.
- -
- Class 0.75–1.00: High vulnerability-related level, represented in red.
This classification was implemented to verify the automatic correspondence between the numerical index calculated in the database and the colour assigned to each defect object in Revit. Once the IndK value was computed, Dynamo scripts were used to assign it to the corresponding BIM object and apply the related colour within the model (Figure 6b). In this way, the user can move from a tabular vulnerability assessment to a spatially referenced and immediately readable representation of the conservation state, where each defect can be selected, inspected and interpreted according to its assigned parameters.
5.5. Automated Transfer of Vulnerability Data into Revit
The information transfer between the Excel vulnerability sheet and the Revit model was automated through Dynamo (Figure 6b). In the present implementation, the script links each Excel record to the corresponding Revit element through a unique defect identifier, used as the matching key between the external database and the BIM object. This allows the automatic assignment of defect class, severity, extent, urgency, IndK value and chromatic class to the target element. The procedure was tested on the limited number of defect records implemented in the case study and was primarily intended to verify the consistency of the information-transfer mechanism between the external database and the V-HBIM model.
The automated routine performs three main operations. First, it identifies the target element in Revit by matching the information stored in the Excel sheet with the Revit family and element data. Second, it assigns the material and defect-related parameters to the selected object. These include the defect category, material, severity, extent, urgency, and vulnerability index. Third, it applies the chromatic representation associated with the calculated IndK value.
The script was tested on the implemented defect records and demonstrated that the same information manually inserted in the digital vulnerability sheet can be transferred into Revit without retyping the data (Figure 6c). This reduces the risk of transcription errors and ensures consistency between the analytical database and the V-HBIM model. It should be noted that this result refers specifically to the reduction in repeated manual data entry between the Excel database and the BIM environment, while a quantitative assessment of the overall reduction in modelling or processing time was not carried out in this study.
5.6. Final V-HBIM Model and Queryable Information Output
The final output of the workflow is a fully informed V-HBIM model of the Arch of San Damiano. The model integrates the basic geometry of the monument, mesh-based singularities, defect objects, material data and vulnerability parameters (Figure 6d). The information is accessible both through the object properties and through Revit schedules.
The schedules represent a relevant result of the workflow because they transform the model into an exportable and updateable information system. By selecting the dedicated schedule, the user can visualize the main properties associated with each defect, including its identification code, category, material, severity, extent, urgency, IndK value and chromatic class. These schedules can also be exported for further analyses or for integration with external conservation databases.
The V-HBIM model therefore supports three complementary levels of use:
- Visual inspection: Through the 3D model and chromatic classification of defects.
- Data querying: Through object properties and Revit schedules.
- Data updating: Through the Excel database and the Dynamo-based transfer routine.
This result demonstrates that the proposed approach can support a more structured conservation workflow. The model enables the user to move from the visual localization of degradation phenomena to the calculation and consultation of their vulnerability parameters, creating a direct link between geometric evidence, diagnostic interpretation and intervention prioritization.
5.7. Assessment of Workflow Performance
The case study confirmed the feasibility of integrating vulnerability assessment into an H-BIM environment through a semi-automated scan-to-model workflow. The main outputs of the process are summarized as follows:
- -
- A photogrammetric dataset composed of 550 images and a point cloud of approximately 6.08 million points;
- -
- A structured 3D model divided into basic architectural components and mesh-based elements;
- -
- Three representative defect records were implemented in the digital vulnerability sheet, including one biological-attack defect geometrically modelled as a surface/positive mesh element and two additional records used to test the information-management workflow for further Risk Map categories;
- -
- Automated assignment of material, defect category and vulnerability parameters through Dynamo;
- -
- Chromatic visualization of defect vulnerability in Revit;
- -
- Generation of an exportable schedule containing the main information associated with the defect objects.
From a methodological perspective, the most relevant result is the preservation of semantic continuity across the workflow. The information is generated in the vulnerability sheet, processed through the IndK calculation, transferred through Dynamo and finally visualized in Revit through both parameters and colours. This continuity reduces fragmentation between survey, modelling and assessment phases.
At the same time, the application highlighted some technical constraints. The procedure is still semi-automated and requires manual operations for defect identification, mesh editing and correct association between database rows and BIM objects. In addition, the Dynamo script was tested on a limited number of defects. Although the workflow is conceptually extendable, the management of a larger number of defect objects may require optimization of the script structure and memory handling. These aspects do not reduce the validity of the proposed methodology but indicate the need for future developments aimed at improving scalability.
6. Discussion
6.1. Scientific Contribution
The proposed V-HBIM framework contributes to the development of Heritage BIM by explicitly integrating vulnerability assessment into the modelling process. While many H-BIM applications focus mainly on geometric documentation or historical data management, the present approach places the state of conservation at the centre of the model.
The main innovation lies in the combination of three components: survey-based modelling, defect representation, and Risk Map-based vulnerability parameters. By connecting these components through a semi-automated workflow, the model becomes an operational tool for conservation rather than a static digital representation.
Compared with previous H-BIM applications which were mainly focused on geometric documentation, semantic enrichment or conservation data management as separate tasks, the proposed V-HBIM workflow provides an integrated operational chain linking defect geometry, vulnerability-related parameters and BIM-based visualization.
6.2. Advantages of the Proposed Workflow
The proposed workflow offers several advantages.
First, it allows the representation of defects as queryable BIM objects. This improves the management of diagnostic information and supports the systematic documentation of degradation phenomena.
Second, the use of a structured database derived from the Risk Map provides a consistent framework for classifying defects and assigning vulnerability-related parameters. This reduces subjectivity and facilitates the comparison of information across different elements or inspection campaigns.
Third, the use of Dynamo enables semi-automatic information transfer between the database and the BIM model. This reduces manual work and improves data consistency.
Fourth, the workflow is based on widely used software tools, making it potentially replicable in other heritage contexts. Although specific adaptations may be required for different assets, the general structure of the process can be transferred to other case studies.
Finally, the model can support conservation planning by providing a visual and queryable representation of the state of conservation. This is particularly relevant for heritage managers, restorers, and engineers involved in maintenance and intervention planning.
6.3. Limitations
Despite its potential, the proposed methodology has some limitations.
The workflow is semi-automated rather than fully automated. Manual expert interpretation is still required during point cloud processing, defect identification, mesh editing, and the association between database records and BIM objects. This aspect is particularly relevant in cultural heritage applications, where degradation phenomena, irregular geometries and material discontinuities cannot always be identified or classified through purely automatic procedures. Moreover, although the proposed workflow introduces automated procedures for information transfer and parameter assignment, a quantitative assessment of time reduction was not carried out in the present study. Therefore, the improvement in information management should be understood primarily in terms of reduced manual retyping of data, improved consistency between the external vulnerability sheet and the BIM model, and easier updating of defect-related parameters, rather than as a measured reduction in the overall modelling or processing time. Future applications on larger datasets should include a quantitative comparison between fully manual data entry and the proposed Excel–Dynamo–Revit transfer procedure.
A second limitation concerns the distinction between geometric and information-level implementation of defect categories. In the present application, the geometric modelling phase focused mainly on surface-related and positive mesh defects, such as biological attacks. Other Risk Map categories, including material disintegration and missing portions, were introduced as information-level records to test the database structure, Dynamo automation and chromatic visualization procedure. Their complete geometric representation as negative BIM entities, involving subtraction from the ideal geometry, remains a future development.
A further limitation concerns the vulnerability index adopted for workflow validation. The Risk Map of the Italian Ministry of Culture was used as the reference framework for defect classification and for the definition of the input parameters included in the digital vulnerability sheet, namely severity, extent and urgency. Nevertheless, the IndK calculation implemented in this study should not be interpreted as an official Risk Map index or as a generally validated vulnerability indicator. The weighting factors and chromatic thresholds adopted in the present application do not derive from the official Risk Map computational procedure but were introduced as a demonstrative rule to test the interoperability between the vulnerability database, Dynamo scripts and the Revit environment. Consequently, the numerical values obtained in the case study are intended to validate the digital workflow, the automated parameter transfer and the visualization process, rather than to provide an official conservation-risk certification of the monument.
Another limitation lies in the current implementation of the Dynamo-based information-transfer procedure. In the present study, the script was developed and tested on a limited number of defect records, with the main objective of demonstrating the feasibility of linking an external vulnerability sheet to BIM elements through a unique defect identifier. Advanced procedures for duplicate detection, missing-match management, automatic logging and error handling were not fully implemented. Similarly, the scalability of the procedure on large defect datasets was not quantitatively assessed. These aspects represent important requirements for future applications in more complex heritage assets, where a larger number of defects and repeated updating cycles may require more robust database validation, error reporting and performance testing.
The methodology has also been validated on a single case study. Although the Arch of San Damiano provides a meaningful archeological application, additional tests on different types of heritage assets are needed to assess the generalizability of the approach, especially in the presence of more complex geometries, larger surfaces and a higher number of defect records.
Finally, the vulnerability assessment currently focuses on the state of conservation of the monument. Future work should therefore integrate additional risk components, including structural, seismic, environmental or territorial hazards, and replace or calibrate the demonstrative IndK procedure with officially validated algorithms or with calculation rules defined in collaboration with heritage authorities and conservation specialists.
6.4. Future Developments
Future developments will address the limitations identified in Section 6.3 and extend the scope of the proposed workflow along four main directions.
The first is the completion of the digital Risk Map database, including all defect classes and representation strategies. This will allow the workflow to manage a wider range of degradation and damage phenomena. Within this development, specific attention should also be devoted to the IndK index by investigating alternative weighting criteria, sensitivity analyses and validation procedures using larger datasets and different heritage assets.
The second is the improvement of automation in point cloud segmentation and defect recognition. Artificial intelligence and machine learning approaches may support the semi-automatic identification of recurrent damage patterns, although expert validation will remain essential [47].
The third is the integration of the V-HBIM model with GIS-based platforms [48]. This would allow the monument-scale model to be connected with territorial data, environmental information, and multi-risk analysis outputs.
The fourth is the use of the V-HBIM model as a dynamic monitoring tool. By updating the database after future inspections, the model could support the temporal analysis of degradation evolution and the planning of preventive conservation strategies.
7. Conclusions
This paper proposed the concept of V-HBIM as a vulnerability-oriented extension of Heritage BIM, aimed at integrating digital survey, defect mapping and representation, vulnerability assessment and BIM-based information management within a single workflow. The proposed approach addresses a recurring limitation of many H-BIM applications, where degradation phenomena and vulnerability-related parameters are often documented outside the model or managed as non-queryable annotations, images or external records.
The main outcomes of the study are:
- −
- A semi-automated scan-to-model workflow, connecting survey-based geometric data, point cloud processing, controlled modelling of basic architectural elements, mesh-based representation of selected defects, BIM conversion and automated information enrichment.
- −
- A selective modelling strategy, combining regularized architectural components with high-fidelity mesh elements, in order to preserve diagnostically relevant information while keeping the model geometrically manageable.
- −
- A Risk Map-based vulnerability assessment structure, using the defect classification and state-of-conservation parameters of the Italian Ministry of Culture Risk Map to organize the digital vulnerability database.
- −
- An Excel–Dynamo–Revit information-transfer workflow, enabling the semi-automatic association of defect-related information and vulnerability parameters with the corresponding BIM objects.
- −
- A queryable, updateable and visually interpretable V-HBIM model, where vulnerability-related information can be associated with defect-related BIM objects and visualized through chromatic outputs, supporting the interpretation of conservation priorities within the three-dimensional model.
The validation on the Roman Arch of San Damiano in Carsulae demonstrated the feasibility of representing defects as independent BIM entities associated with structured conservation-oriented assessment information. The case study confirmed that the proposed workflow can connect geometric modelling, defect documentation and vulnerability-related information management within a single H-BIM environment, supporting documentation, inspection updating, visual interpretation and maintenance planning.
Some limitations remain. The workflow still requires expert interpretation during point cloud processing, defect identification, mesh editing and data association. Moreover, defect modelling is only partially automated; the adopted vulnerability index has a demonstrative role for workflow validation, and the full geometric implementation of negative defects, such as material loss and missing portions, remains a future development.
Future work should focus on extending the workflow to all Risk Map defect classes, improving the automation of defect recognition and mesh generation, and testing the approach on different types of cultural heritage structures. Further work should also investigate the integration of V-HBIM models with GIS-based platforms, monitoring systems and multi-risk assessment tools. In this perspective, V-HBIM can support the evolution of Heritage BIM from a documentation-oriented environment towards a dynamic decision-support tool for preventive conservation and vulnerability-oriented management of cultural heritage assets.
Author Contributions
Conceptualization, P.M. and L.B.C.; methodology, P.M. and L.B.C.; software, P.M.; validation, P.M.; formal analysis, P.M.; investigation, P.M.; data curation, P.M. and L.B.C.; writing—original draft preparation, P.M.; writing—review and editing, P.M. and L.B.C.; visualization, P.M.; supervision, P.M. and L.B.C.; project administration, P.M.; funding acquisition, P.M. All authors have read and agreed to the published version of the manuscript.
Funding
This work was carried out within the research project “ARCHES—Augmented Reality for Cultural HEritage monitoring and conServation”, funded by the National Recovery and Resilience Plan (NRRP), Mission 4, Component 2, Investment 1.3, Project Code PE00000005, CUP B83C22004820002, and supported by the “Next Generation EU” Programme of the European Union within the “RETURN—Multi-risk science for resilient communities under a changing climate” research programme.
Data Availability Statement
The original contributions presented in this study are included in the article. Further inquiries can be directed to the corresponding author.
Acknowledgments
The authors would also like to acknowledge the contribution of Alessio Pasquali, whose Master’s thesis supported the development and testing of parts of the proposed workflow. During the preparation of this manuscript ChatGPT 5.5 was used solely to support English language editing and the graphical arrangement of selected figures. The underlying scientific content, data, analyses, methodology, source images, figures, tables, results and interpretations are entirely original and were produced and reviewed by the authors. The authors have reviewed and edited the output and take full responsibility for the content of this publication.
Conflicts of Interest
The authors declare no conflicts of interest.
Abbreviations
The following abbreviations are used in this manuscript:
| BIM | Building Information Modelling |
| H-BIM | Heritage Building Information Modelling |
| V-HBIM | Vulnerability-oriented Heritage BIM |
| IndK | Normalized vulnerability-related index |
| IFC | Industry Foundation Classes |
References
- Azhar, S. Building Information Modeling (BIM): Trends, Benefits, Risks, and Challenges for the AEC Industry. Leadersh. Manag. Eng. 2011, 11, 241–252. [Google Scholar] [CrossRef] [Scilit]
- Pallante, L.; Meriggi, P.; D’Amico, F.; Gagliardi, V.; Napolitano, A.; Paolacci, F.; Quinci, G.; Lorello, M.; de Felice, G. An integrated data-driven system for digital bridge management. Buildings 2024, 14, 253. [Google Scholar] [CrossRef] [Scilit]
- Murphy, M.; McGovern, E.; Pavia, S. Historic Building Information Modelling. Struct. Surv. 2009, 27, 311–327. [Google Scholar] [CrossRef] [Scilit]
- Volk, R.; Stengel, J.; Schultmann, F. Building Information Modeling (BIM) for existing buildings—Literature review and future needs. Autom. Constr. 2014, 38, 109–127. [Google Scholar] [CrossRef] [Scilit]
- Logothetis, S.; Delinasiou, A.; Stylianidis, E. Building Information Modelling for cultural heritage: A review. ISPRS Ann. Photogramm. Remote Sens. Spat. Inf. Sci. 2015, II-5/W3, 177–183. [Google Scholar] [CrossRef] [Scilit]
- Yang, X.; Grussenmeyer, P.; Koehl, M.; Macher, H.; Murtiyoso, A.; Landes, T. Review of built heritage modelling: Integration of HBIM and other information techniques. J. Cult. Herit. 2020, 46, 350–360. [Google Scholar] [CrossRef] [Scilit]
- Bosché, F.; Ahmed, M.; Turkan, Y.; Haas, C.T.; Haas, R. The value of integrating Scan-to-BIM and Scan-vs-BIM techniques for construction monitoring using laser scanning and BIM: The case of cylindrical MEP components. Autom. Constr. 2015, 49, 201–213. [Google Scholar] [CrossRef] [Scilit]
- Ochmann, S.; Vock, R.; Wessel, R.; Tamke, M.; Klein, R. Automatic reconstruction of parametric building models from indoor point clouds. Comput. Graph. 2016, 54, 94–103. [Google Scholar] [CrossRef] [Scilit]
- Bloch, T. Connecting research on semantic enrichment of BIM—Review of approaches, methods and possible applications. J. Inf. Technol. Constr. 2022, 27, 416–440. [Google Scholar] [CrossRef] [Scilit]
- Tang, P.; Huber, D.; Akinci, B.; Lipman, R.; Lytle, A. Automatic reconstruction of as-built building information models from laser-scanned point clouds: A review of related techniques. Autom. Constr. 2010, 19, 829–843. [Google Scholar] [CrossRef] [Scilit]
- Bruno, S.; De Fino, M.; Fatiguso, F. Historic Building Information Modelling: Performance assessment for diagnosis-aided information modelling and management. Autom. Constr. 2018, 86, 257–276. [Google Scholar] [CrossRef] [Scilit]
- Brusaporci, S.; Maiezza, M.; Tata, A. A framework for architectural heritage HBIM semantization and development. ISPRS Arch. Photogramm. Remote Sens. Spat. Inf. Sci. 2018, XLII-2, 179–184. [Google Scholar] [CrossRef] [Scilit]
- Ilter, D.; Ergen, E. BIM for building refurbishment and maintenance: Current status and research directions. Struct. Surv. 2015, 33, 228–256. [Google Scholar] [CrossRef] [Scilit]
- Parente, M.; Bruno, N.; Ottoni, F. An HBIM-based protocol for damage classification and severity assessment through monitoring. In Structural Analysis of Historical Constructions. SAHC 2025. RILEM Bookseries; Springer: Cham, Switzerland, 2026; pp. 2395–2404. [Google Scholar] [CrossRef] [Scilit]
- Zanni, T.; Sbrogiò, L.; Zanchetta, C.; Valluzzi, M.R. Seismic vulnerability assessment in HBIM models of historical masonry buildings using IFC standard. Int. J. Archit. Herit. 2026, 1–21. [Google Scholar] [CrossRef] [Scilit]
- Croce, P.; Landi, F.; Puccini, B.; Martino, M.; Maneo, A. Parametric HBIM procedure for the structural evaluation of heritage masonry buildings. Buildings 2022, 12, 194. [Google Scholar] [CrossRef] [Scilit]
- Lovell, L.; Davies, R.; Hunt, D. The Application of Historic Building Information Modelling (HBIM) to Cultural Heritage: A Review. Heritage 2023, 6, 6691–6717. [Google Scholar] [CrossRef] [Scilit]
- Liu, J.; Li, B. Heritage Building Information Modelling (HBIM): A Review of Published Case Studies. Int. Arch. Photogramm. Remote Sens. Spat. Inf. Sci. 2024, XLVIII-1-2024, 387–393. [Google Scholar] [CrossRef] [Scilit]
- Parente, M.; Bruno, N.; Ottoni, F. HBIM and Information Management for Knowledge and Conservation of Architectural Heritage: A Review. Heritage 2025, 8, 306. [Google Scholar] [CrossRef] [Scilit]
- Alshawabkeh, Y.; Baik, A.; Miky, Y. HBIM for Conservation of Built Heritage. ISPRS Int. J. Geo-Inf. 2024, 13, 231. [Google Scholar] [CrossRef] [Scilit]
- Yanez Chura, R.; Meriggi, P.; Choueiri, C.; de Felice, G. Seismic assessment of churches through integration of digital survey, texture recognition and distinct element modelling. J. Build. Eng. 2024, 98, 111375. [Google Scholar] [CrossRef] [Scilit]
- Oreni, D.; Brumana, R.; Della Torre, S.; Banfi, F.; Barazzetti, L.; Previtali, M. Survey turned into HBIM: The restoration and the work involved concerning the Basilica di Collemaggio after the earthquake, L’Aquila. ISPRS Ann. Photogramm. Remote Sens. Spat. Inf. Sci. 2014, II-5, 267–273. [Google Scholar] [CrossRef] [Scilit]
- Zhang, S.; Teizer, J.; Lee, J.-K.; Eastman, C.M.; Venugopal, M. Building Information Modeling (BIM) and safety: Automatic safety checking of construction models and schedules. Autom. Constr. 2013, 29, 183–195. [Google Scholar] [CrossRef] [Scilit]
- Xiong, X.; Adan, A.; Akinci, B.; Huber, D. Automatic creation of semantically rich 3D building models from laser scanner data. Autom. Constr. 2013, 31, 325–337. [Google Scholar] [CrossRef] [Scilit]
- Yang, X.; Lu, Y.C.; Murtiyoso, A.; Koehl, M.; Grussenmeyer, P. HBIM modeling from the surface mesh and its extended capability of knowledge representation. ISPRS Int. J. Geo-Inf. 2019, 8, 301. [Google Scholar] [CrossRef] [Scilit]
- Zhuo, L.; Zhang, J.; Hong, X. Cultural heritage characteristics and damage analysis based on multidimensional data fusion and HBIM—Taking the former residence of HSBC bank in Xiamen, China as an example. Herit. Sci. 2024, 12, 128. [Google Scholar] [CrossRef] [Scilit]
- Carta del Rischio, Direzione Generale Sicurezza del Patrimonio Culturale. Available online: http://www.cartadelrischio.beniculturali.it (accessed on 6 May 2026). (In Italian)
- De Falco, A.; Gaglio, F.; Giuliani, F.; Martino, M.; Messina, V. An HBIM approach for structural diagnosis and intervention design in heritage constructions: The case of the Certosa di Pisa. Heritage 2024, 7, 1850–1869. [Google Scholar] [CrossRef] [Scilit]
- Pau, A.; De Sortis, A.; Marzellotta, R.; Vestroni, F. Health monitoring of cultural heritage using ambient and forced vibrations. WIT Trans. Built Environ. 2005, 82, 331–340. [Google Scholar]
- De Santis, S.; Sangirardi, M.; Altomare, V.; Meriggi, P.; de Felice, G. Computer vision-based dynamic identification of a reinforced concrete elevated water tank. J. Civ. Struct. Health Monit. 2025, 15, 105–125. [Google Scholar] [CrossRef] [Scilit]
- Guarino, P.; García-Macías, E.; Meoni, A.; Ubertini, F. Enhancing structural health monitoring through BIM-integrated finite element model updating. Procedia Struct. Integr. 2026, 78, 1561–1568. [Google Scholar] [CrossRef] [Scilit]
- Borkowski, A.S.; Kubrat, A. Integration of Laser Scanning, Digital Photogrammetry and BIM Technology: A Review and Case Studies. Eng 2024, 5, 2395–2409. [Google Scholar] [CrossRef] [Scilit]
- Escudero, P.A. Scan-to-HBIM: Automated Transformation of Point Clouds into 3D BIM Models for the Digitization and Preservation of Historic Buildings. VITRUVIO 2023, 8, 53–72. [Google Scholar] [CrossRef] [Scilit]
- Gil, A.; Arayici, Y.; Kumar, B.; Laing, R. Machine and Deep Learning Implementations for Heritage Building Information Modelling: A Critical Review of Theoretical and Applied Research. J. Comput. Cult. Herit. 2024, 17, 1–22. [Google Scholar] [CrossRef] [Scilit]
- Gil, A.; Arayici, Y. Image-Based Deep Learning Approaches for Point Cloud Classification for Heritage BIM Modelling. ISPRS Ann. Photogramm. Remote Sens. Spat. Inf. Sci. 2025, X-M-2-2025, 97–105. [Google Scholar] [CrossRef] [Scilit]
- Fassi, F.; Fregonese, L.; Ackermann, S.; De Troia, V. Comparison between laser scanning and automated 3D modelling techniques to reconstruct complex and extensive cultural heritage areas. Int. Arch. Photogramm. Remote Sens. Spat. Inf. Sci. 2013, XL-5/W1, 73–80. [Google Scholar] [CrossRef] [Scilit]
- Cardinali, V.; Ciuffreda, A.L.; Coli, M.; De Stefano, M.; Meli, F.; Tanganelli, M.; Trovatelli, F. An Oriented H-BIM Approach for the Seismic Assessment of Cultural Heritage Buildings: Palazzo Vecchio in Florence. Buildings 2023, 13, 913. [Google Scholar] [CrossRef] [Scilit]
- Sammartano, G.; Matrone, F.; Teppati Losè, L.; Spanò, A. Integrated HBIM-GIS Models for Multi-Scale Seismic Vul-nerability Assessment of Historical Buildings. Remote Sens. 2023, 15, 833. [Google Scholar] [CrossRef] [Scilit]
- Colucci, E.; Teppati Losè, L.; Su, P. Addressing Flood Risk Assessment and Heritage Conservation by Integrating HBIM and GIS: The Case Study of Castello del Valentino (Italy). ISPRS Ann. Photogramm. Remote Sens. Spat. Inf. Sci. 2025, X-M-2-2025, 65–72. [Google Scholar] [CrossRef] [Scilit]
- Arrighi, C.; De Lucia, C.; Castelli, F. Building-Scale Flood Hazard Modelling for Risk Assessment of Cultural Heritage. J. Flood Risk Manag. 2026, 19, e70220. [Google Scholar] [CrossRef] [Scilit]
- Barazzetti, L.; Banfi, F.; Brumana, R.; Gusmeroli, G.; Previtali, M.; Schiantarelli, G. Cloud-to-BIM-to-FEM: Structural simulation with accurate historic BIM from laser scans. Simul. Model. Pract. Theory 2015, 57, 71–87. [Google Scholar] [CrossRef] [Scilit]
- Dore, C.; Murphy, M. Integration of Historic Building Information Modeling, HBIM, and 3D GIS for recording and managing cultural heritage sites. In Proceedings of the 18th International Conference on Virtual Systems and Multimedia, Milan, Italy, 2–5 September 2012; IEEE: New York City, NY, USA, 2012; pp. 369–376. [Google Scholar] [CrossRef] [Scilit]
- Chand, M.; Karthik, D. An experimental study on connecting IoT sensors with Dynamo-based BIM modelling. Lect. Notes Civ. Eng. 2026, 719, 251–262. [Google Scholar] [CrossRef] [Scilit]
- Bertocci, S.; Parrinello, S. Experiences of digital documentation of Carsulae on the Flaminian Way in Umbria. SCIRES-IT Sci. Res. Inf. Technol. 2014, 4, 5–14. [Google Scholar] [CrossRef] [Scilit]
- Gasperini, M. Carsulae: The first excavation campaign near the Arch of San Damiano. Etruscan News 2013, 15, 16–17. [Google Scholar]
- Delatte, N.J. Lessons from Roman cement and concrete. J. Prof. Issues Eng. Educ. Pract. 2001, 127, 109–115. [Google Scholar] [CrossRef] [Scilit]
- Huang, M.; Ninić, J.; Zhang, Q. BIM, machine learning and computer vision techniques in underground construction: Current status and future perspectives. Tunn. Undergr. Space Technol. 2021, 108, 103677. [Google Scholar] [CrossRef] [Scilit]
- Quinci, G.; Gagliardi, V.; Pallante, L.; Manalo, D.R.J.; Napolitano, A.; Bertolini, L.; Bianchini Ciampoli, L.; Meriggi, P.; D’Amico, F.; Paolacci, F. A novel bridge monitoring system implementing ground-based, structural and remote sensing information into a GIS-based catalogue. In Proceedings of SPIE 12268, Earth Resources and Environmental Remote Sensing/GIS Applications XIII, Berlin, Germany, 5–8 September 2022; SPIE: Bellingham, WA, USA, 2022; p. 122680H. [Google Scholar] [CrossRef] [Scilit]
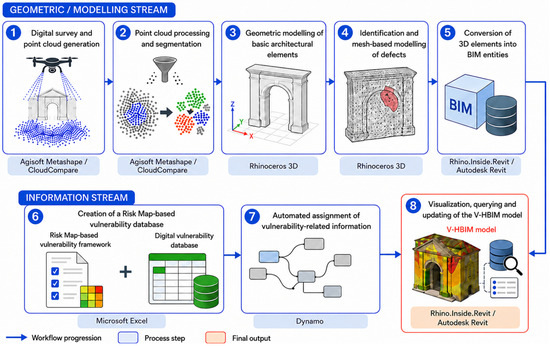
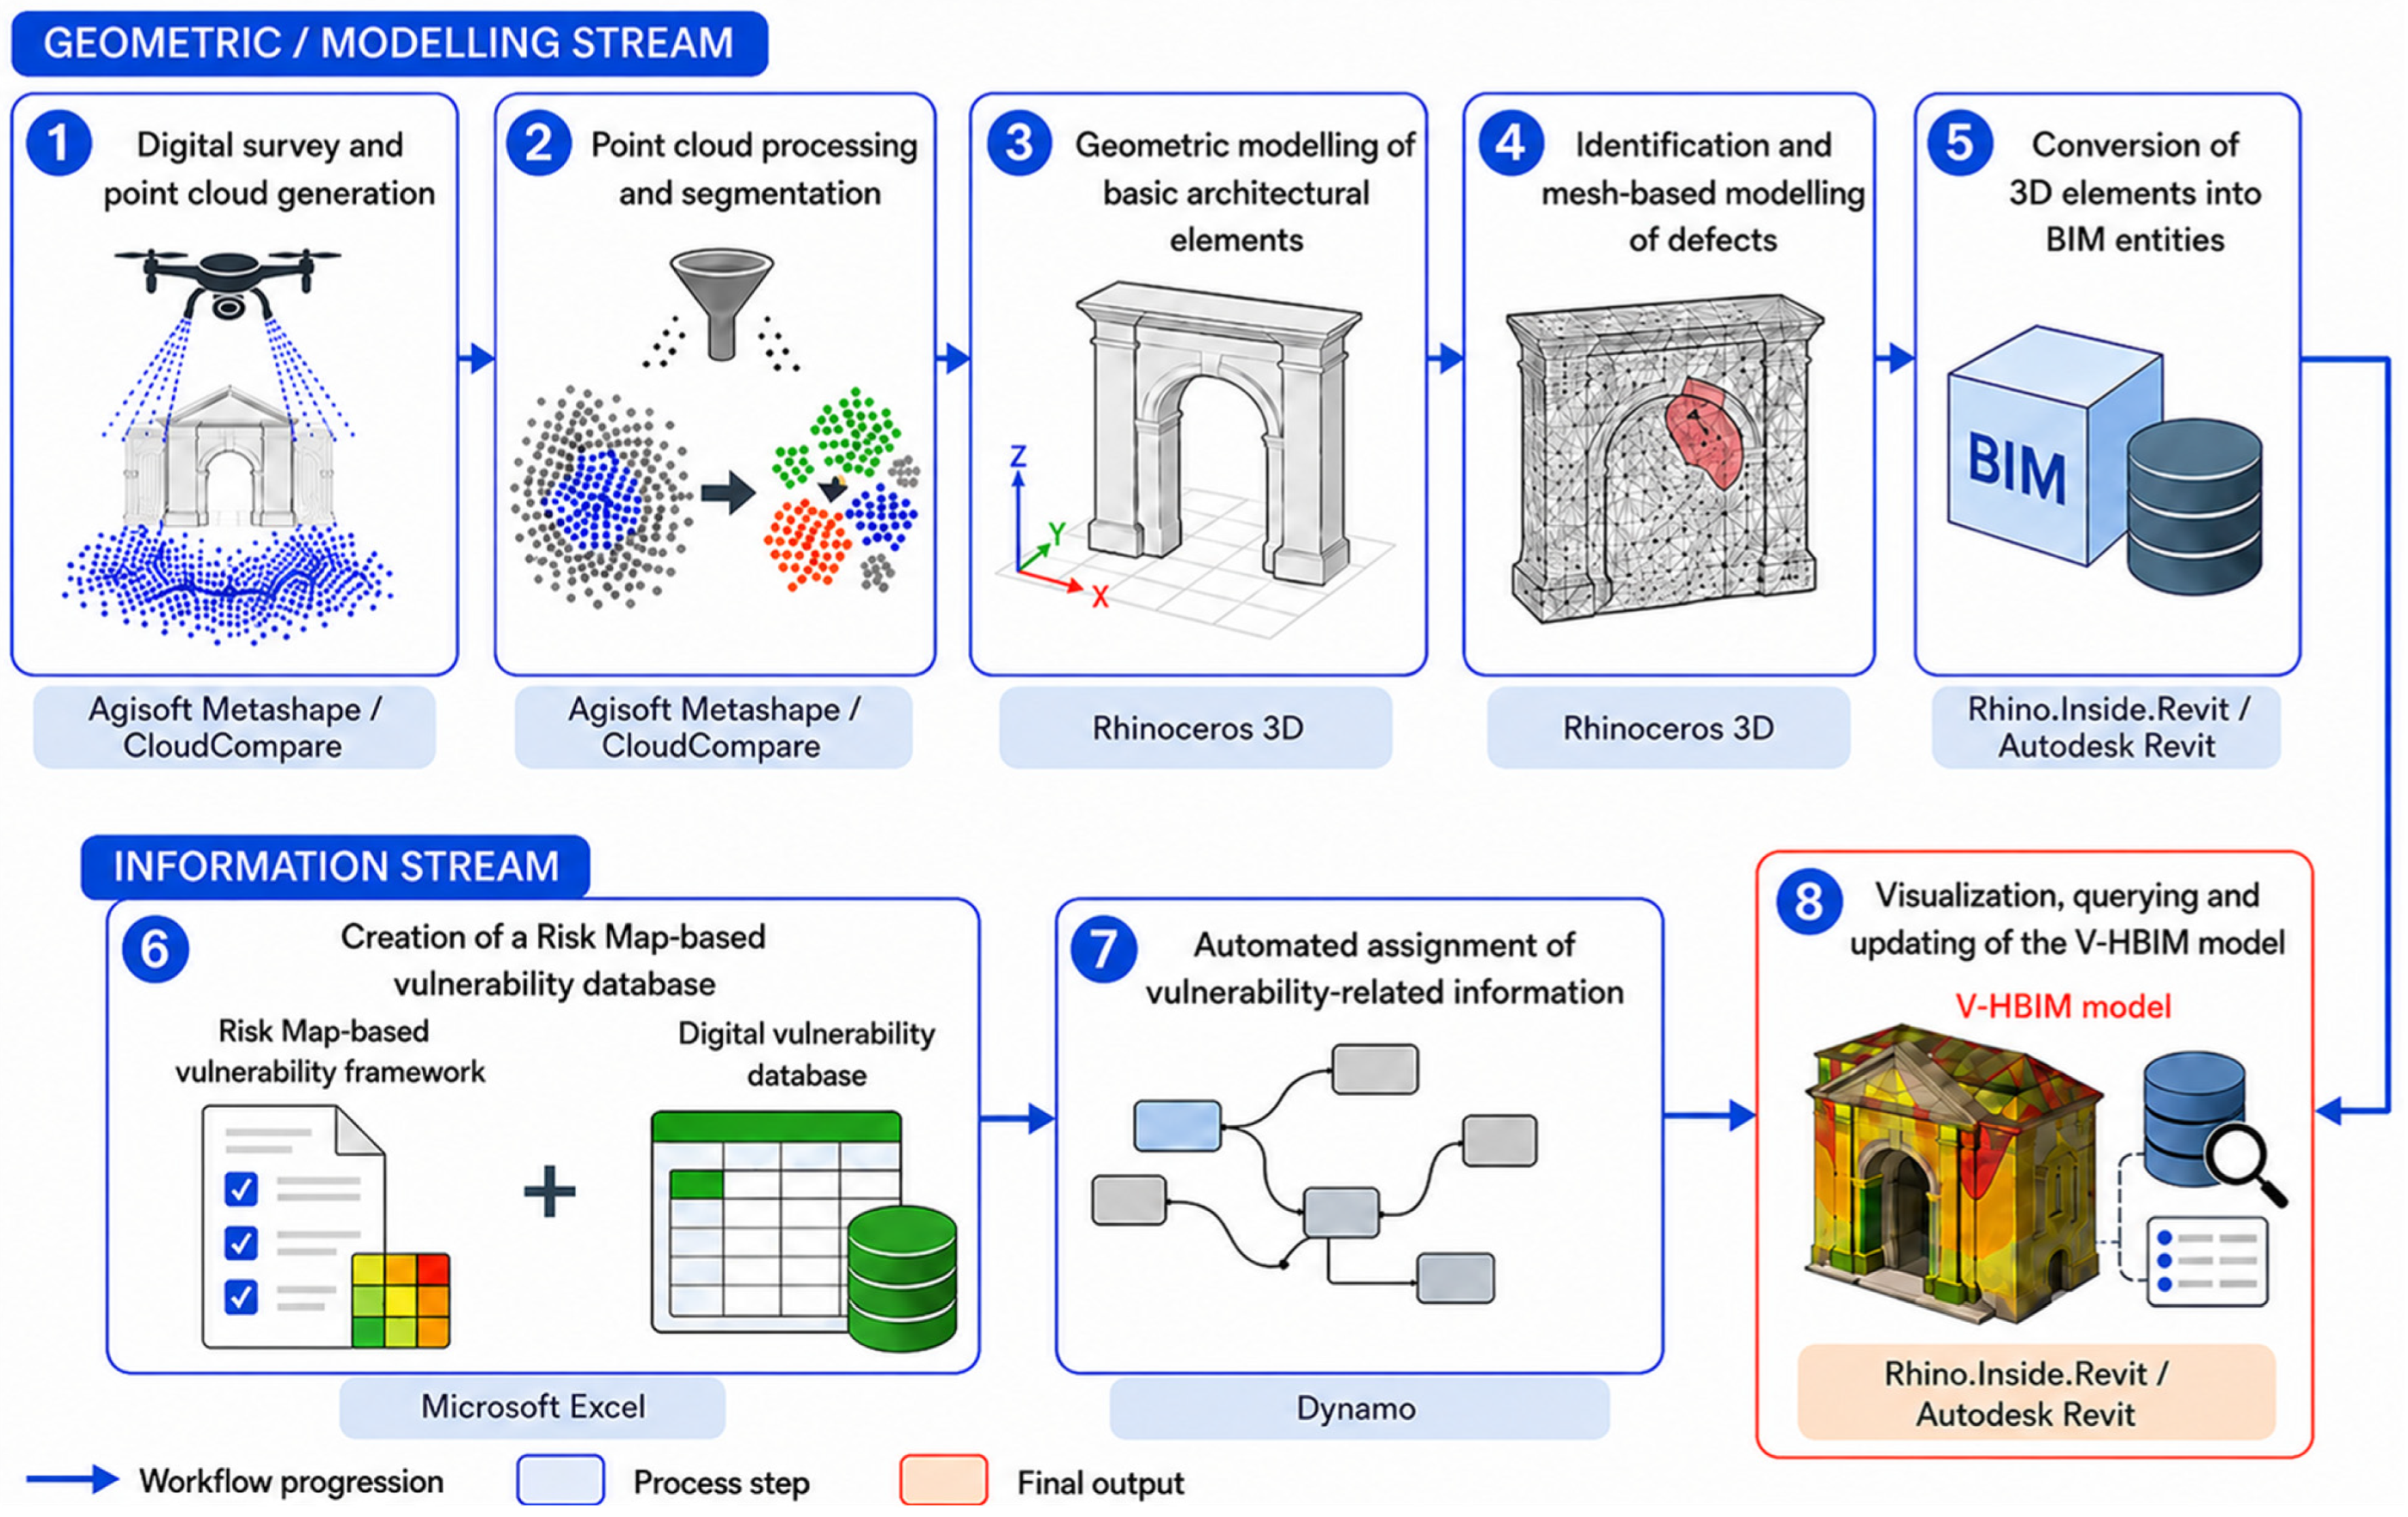
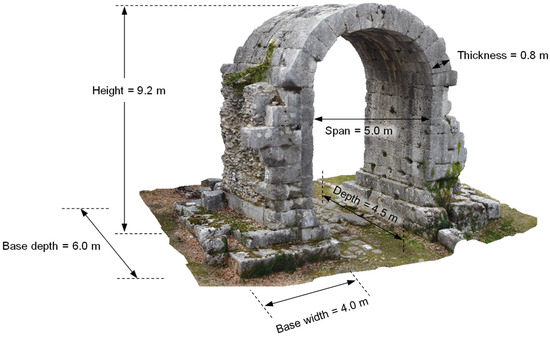
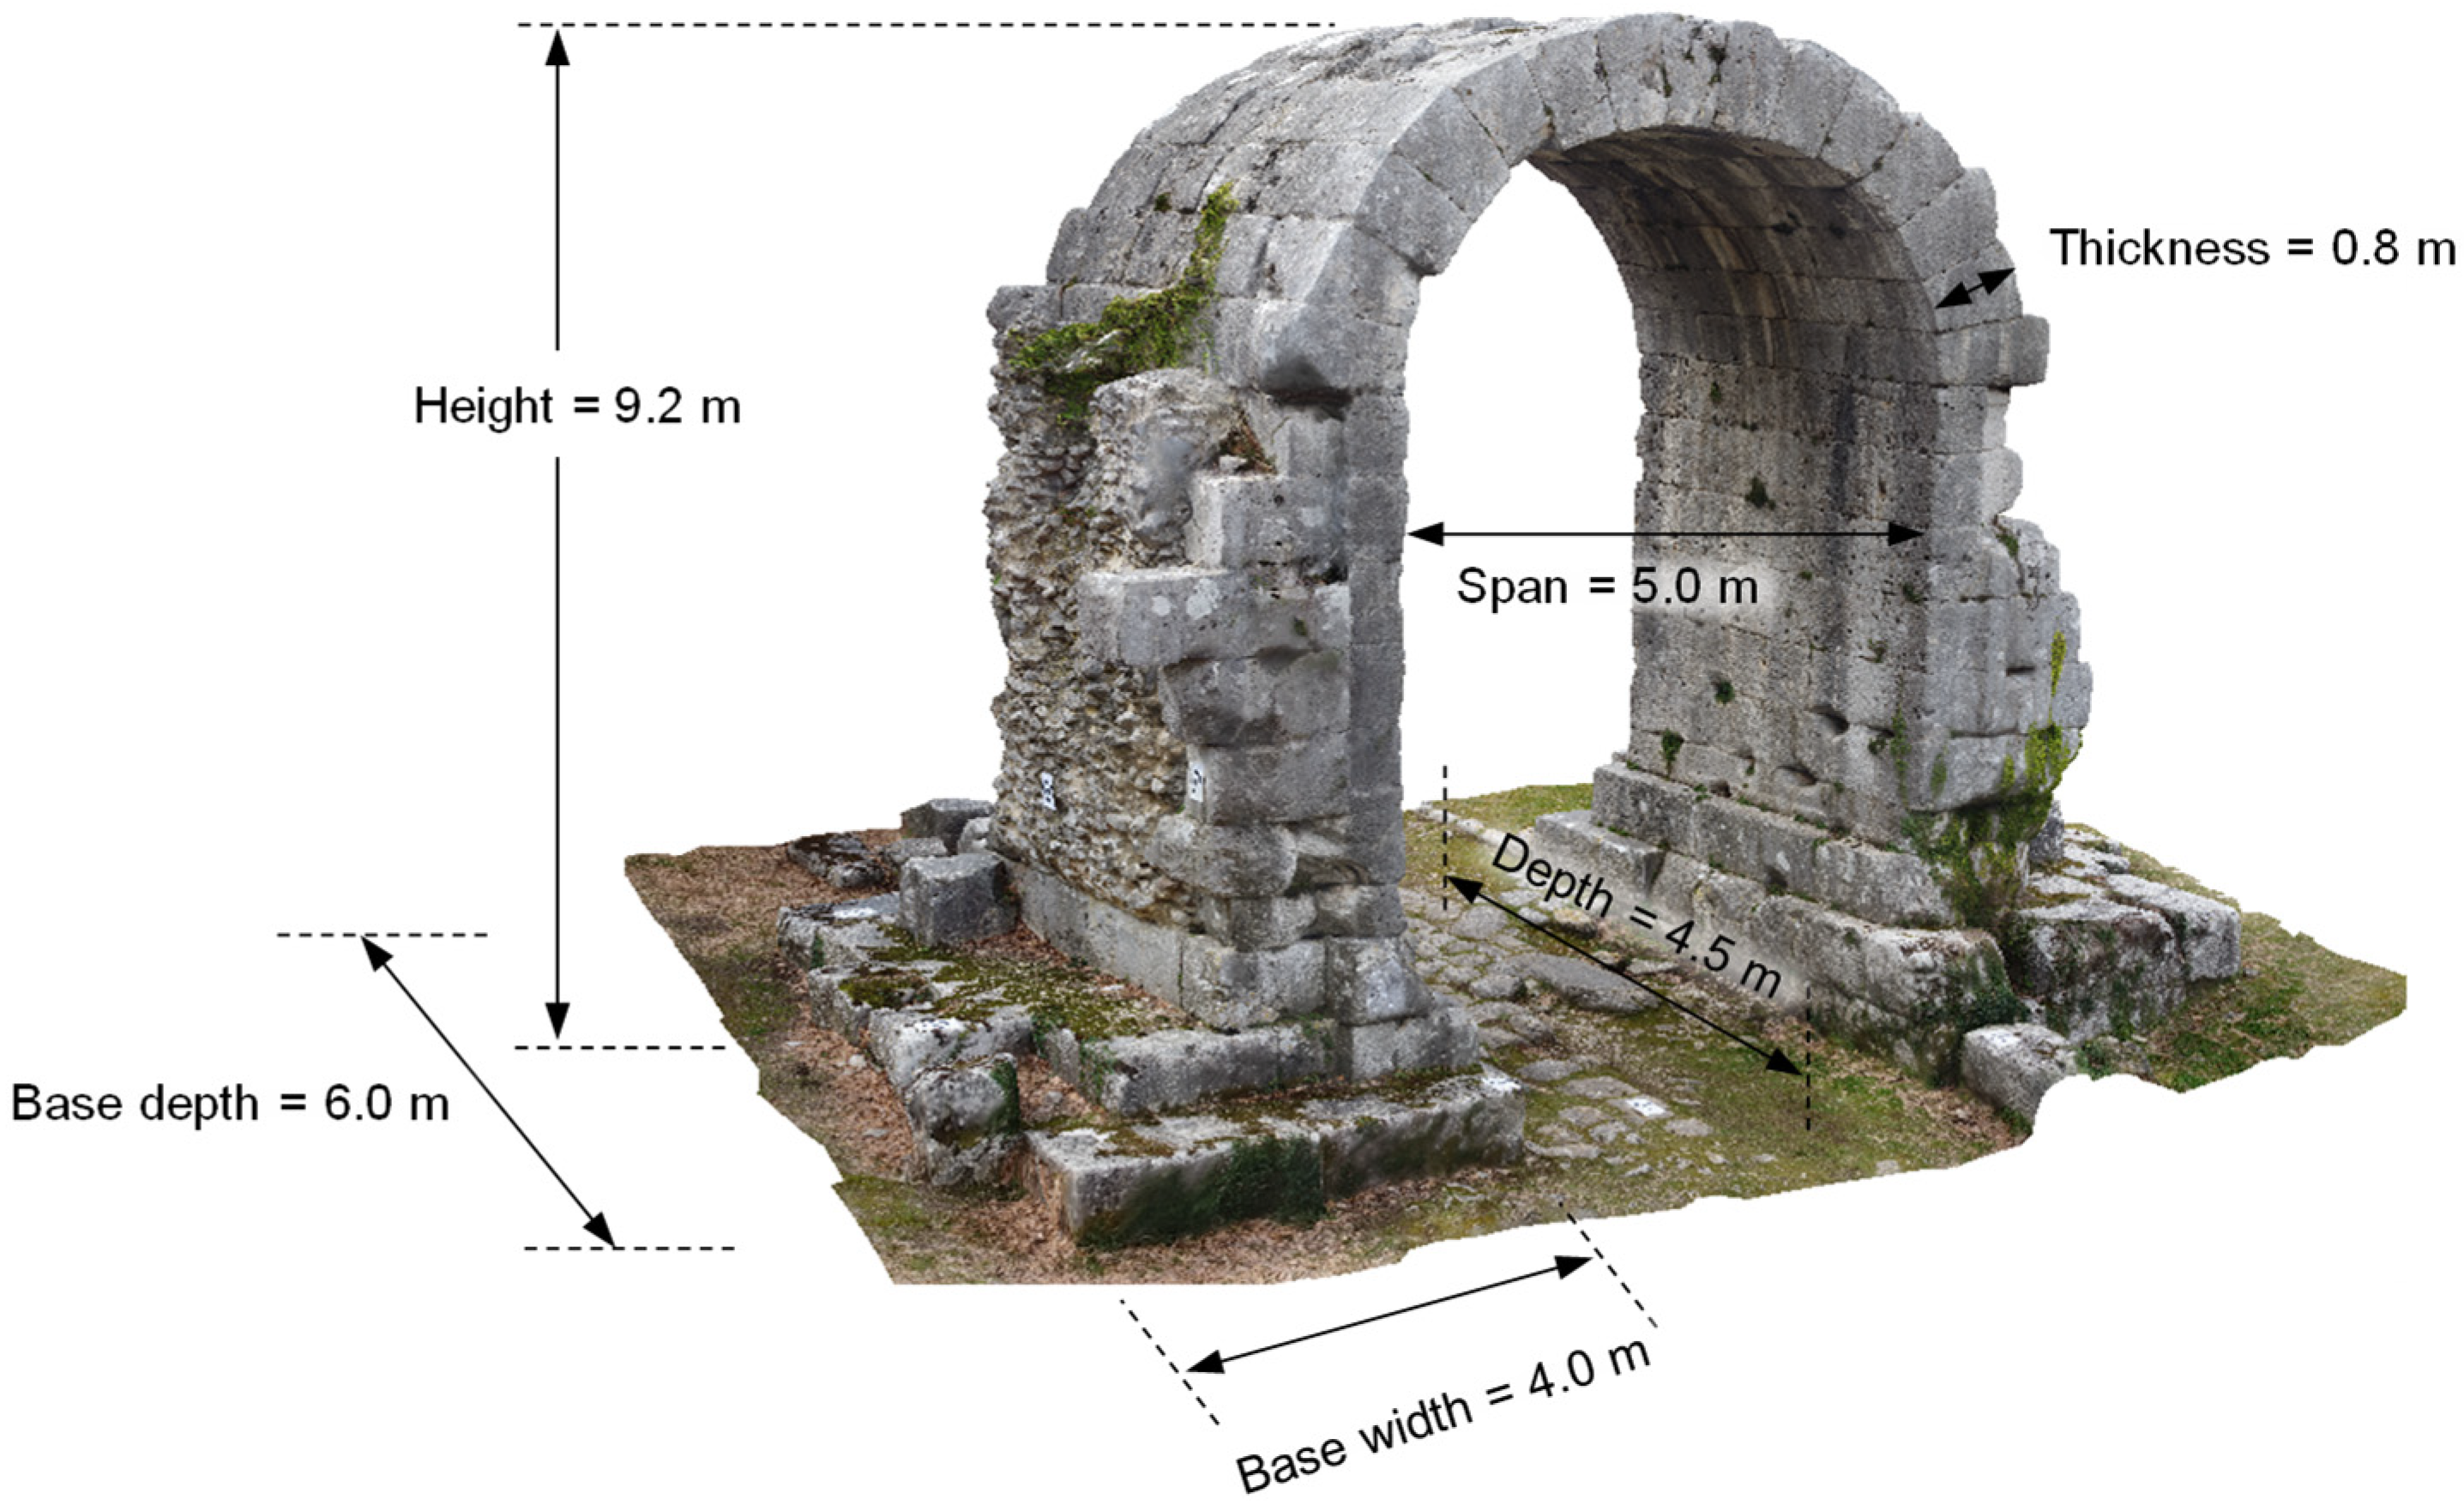
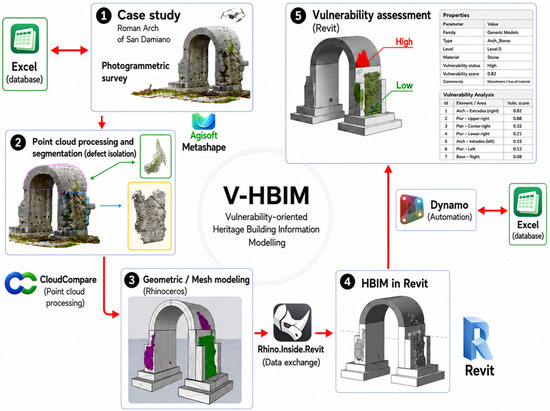
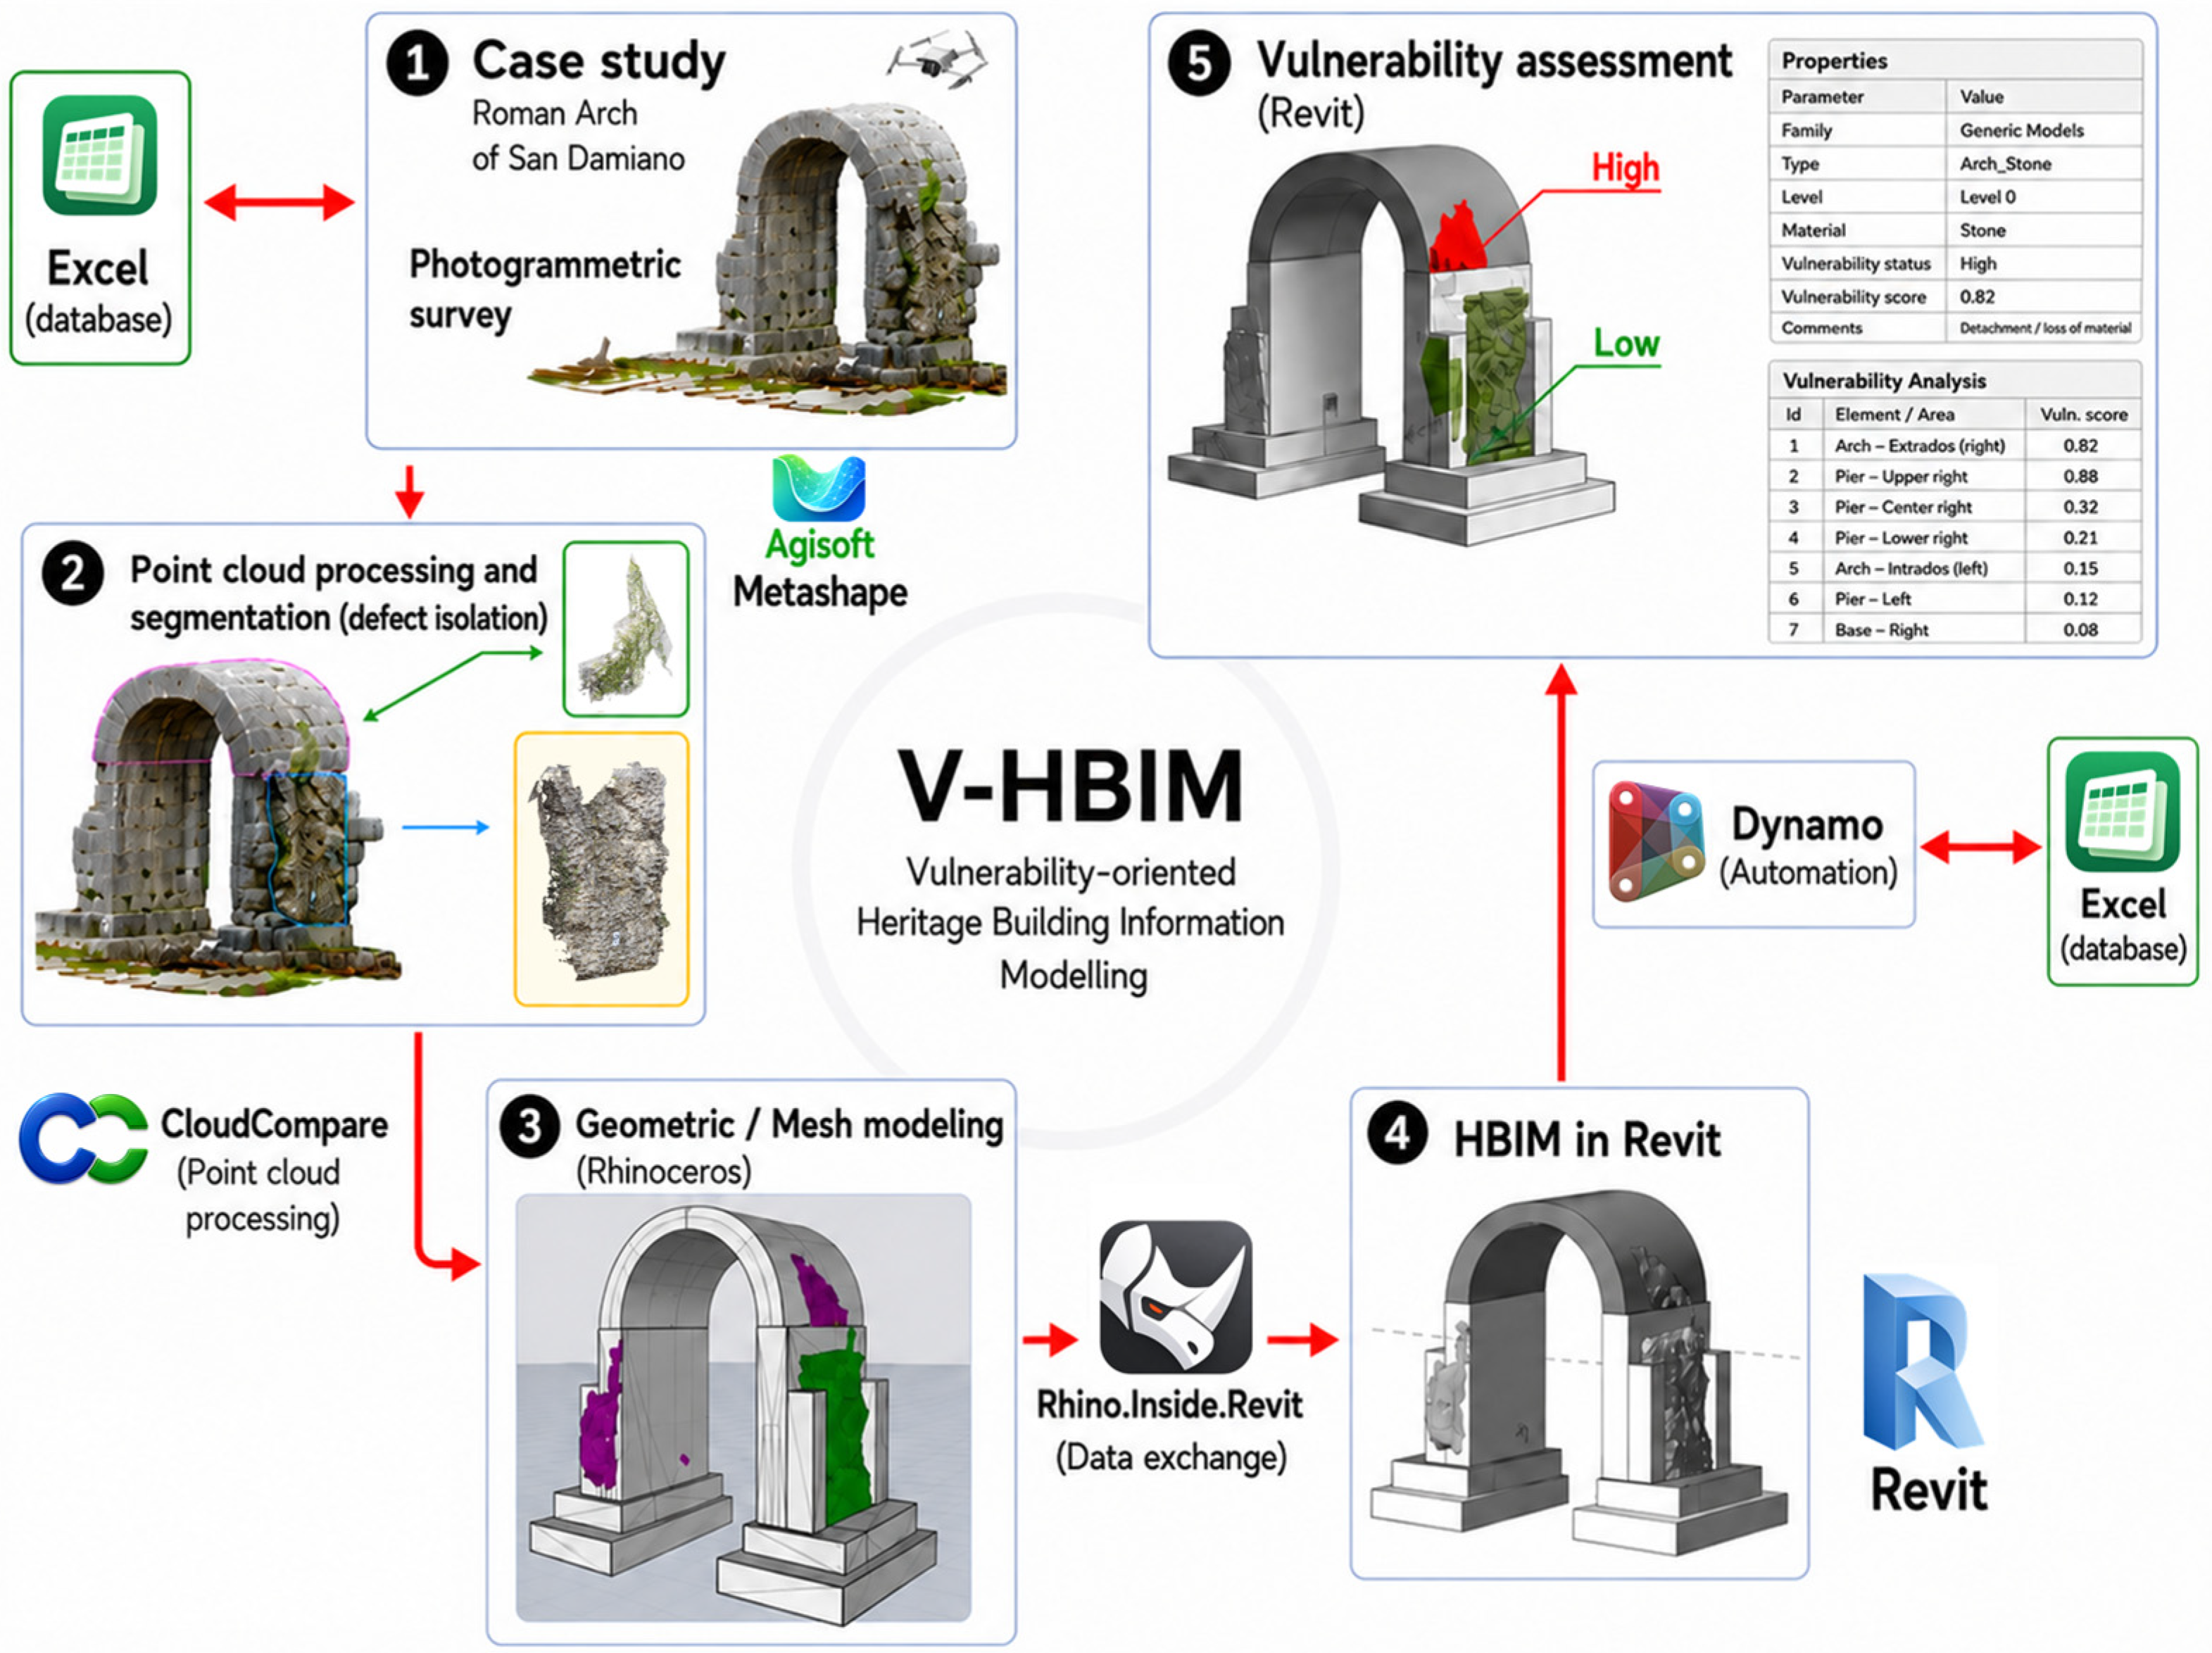
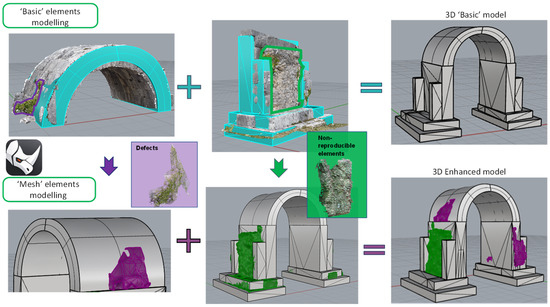
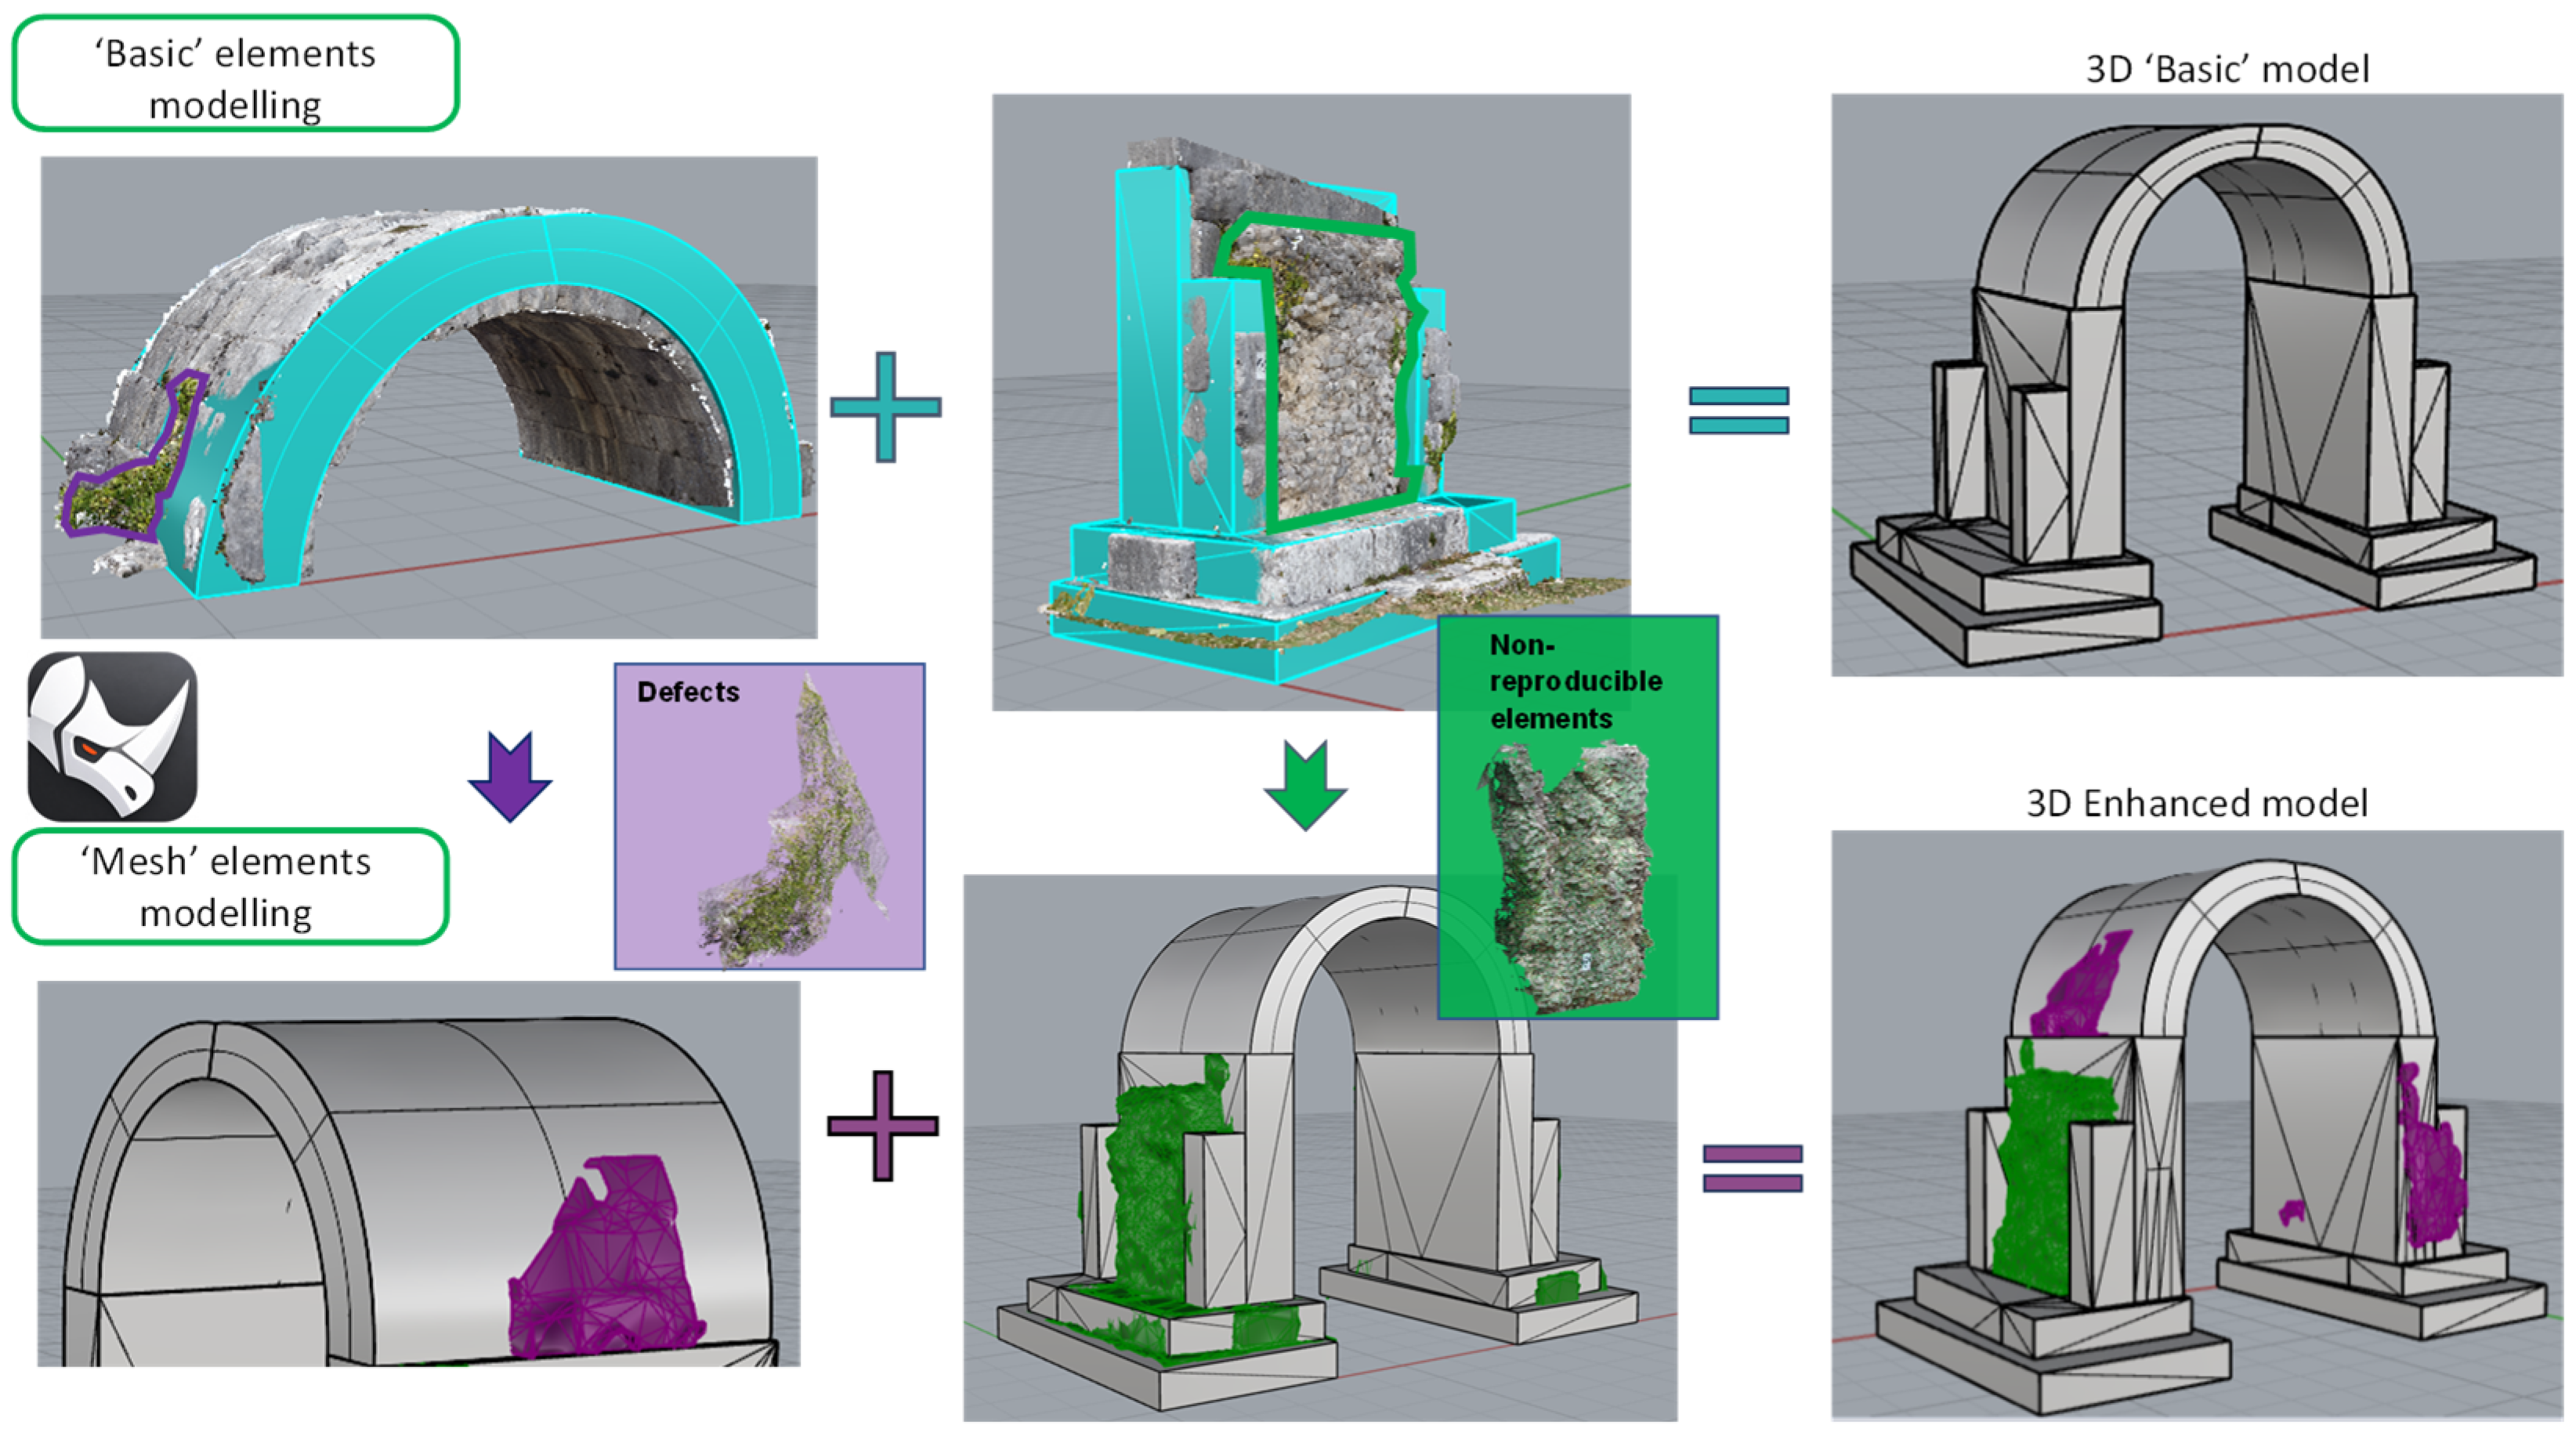
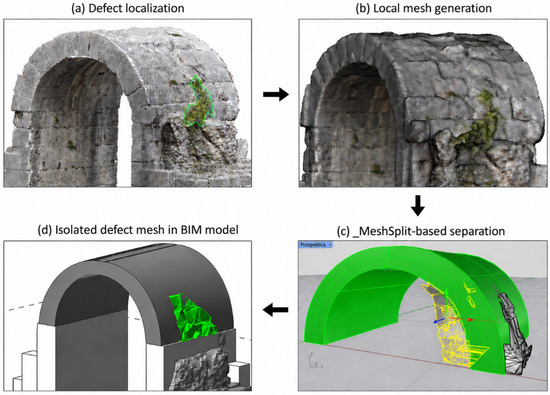
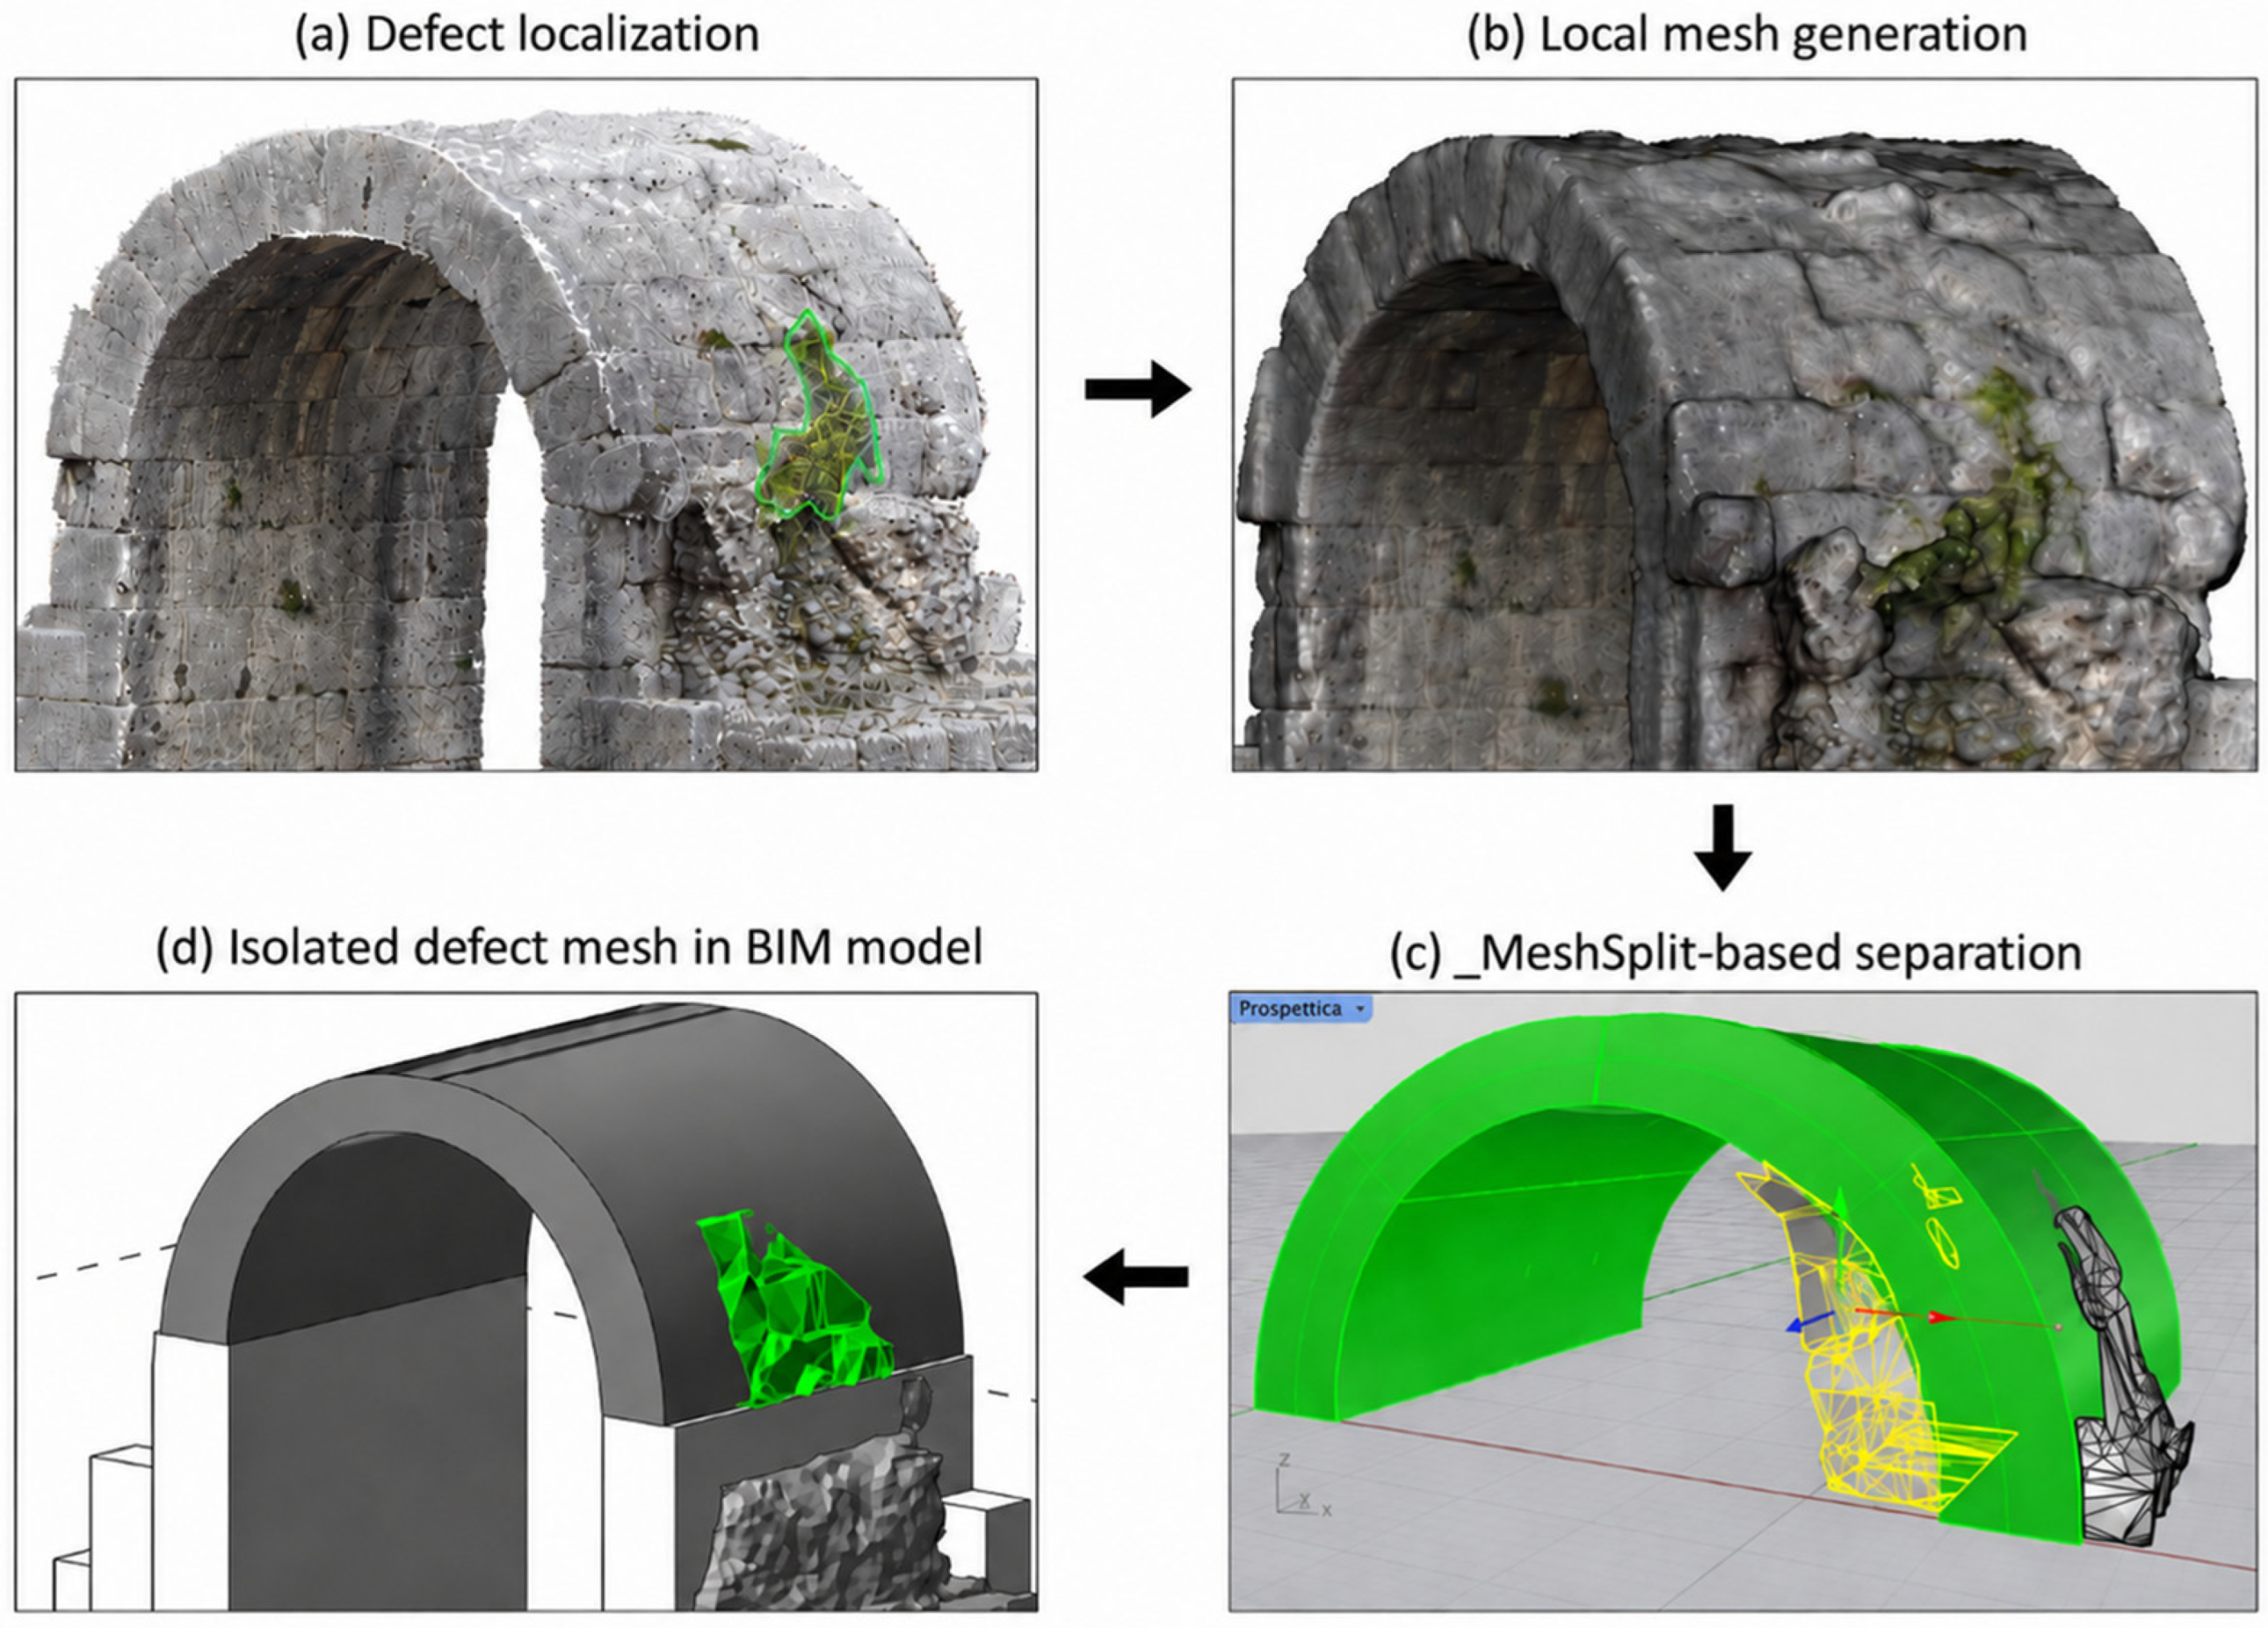
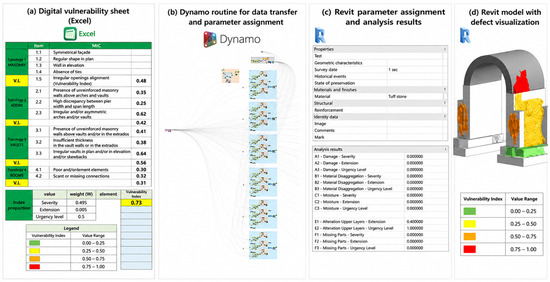
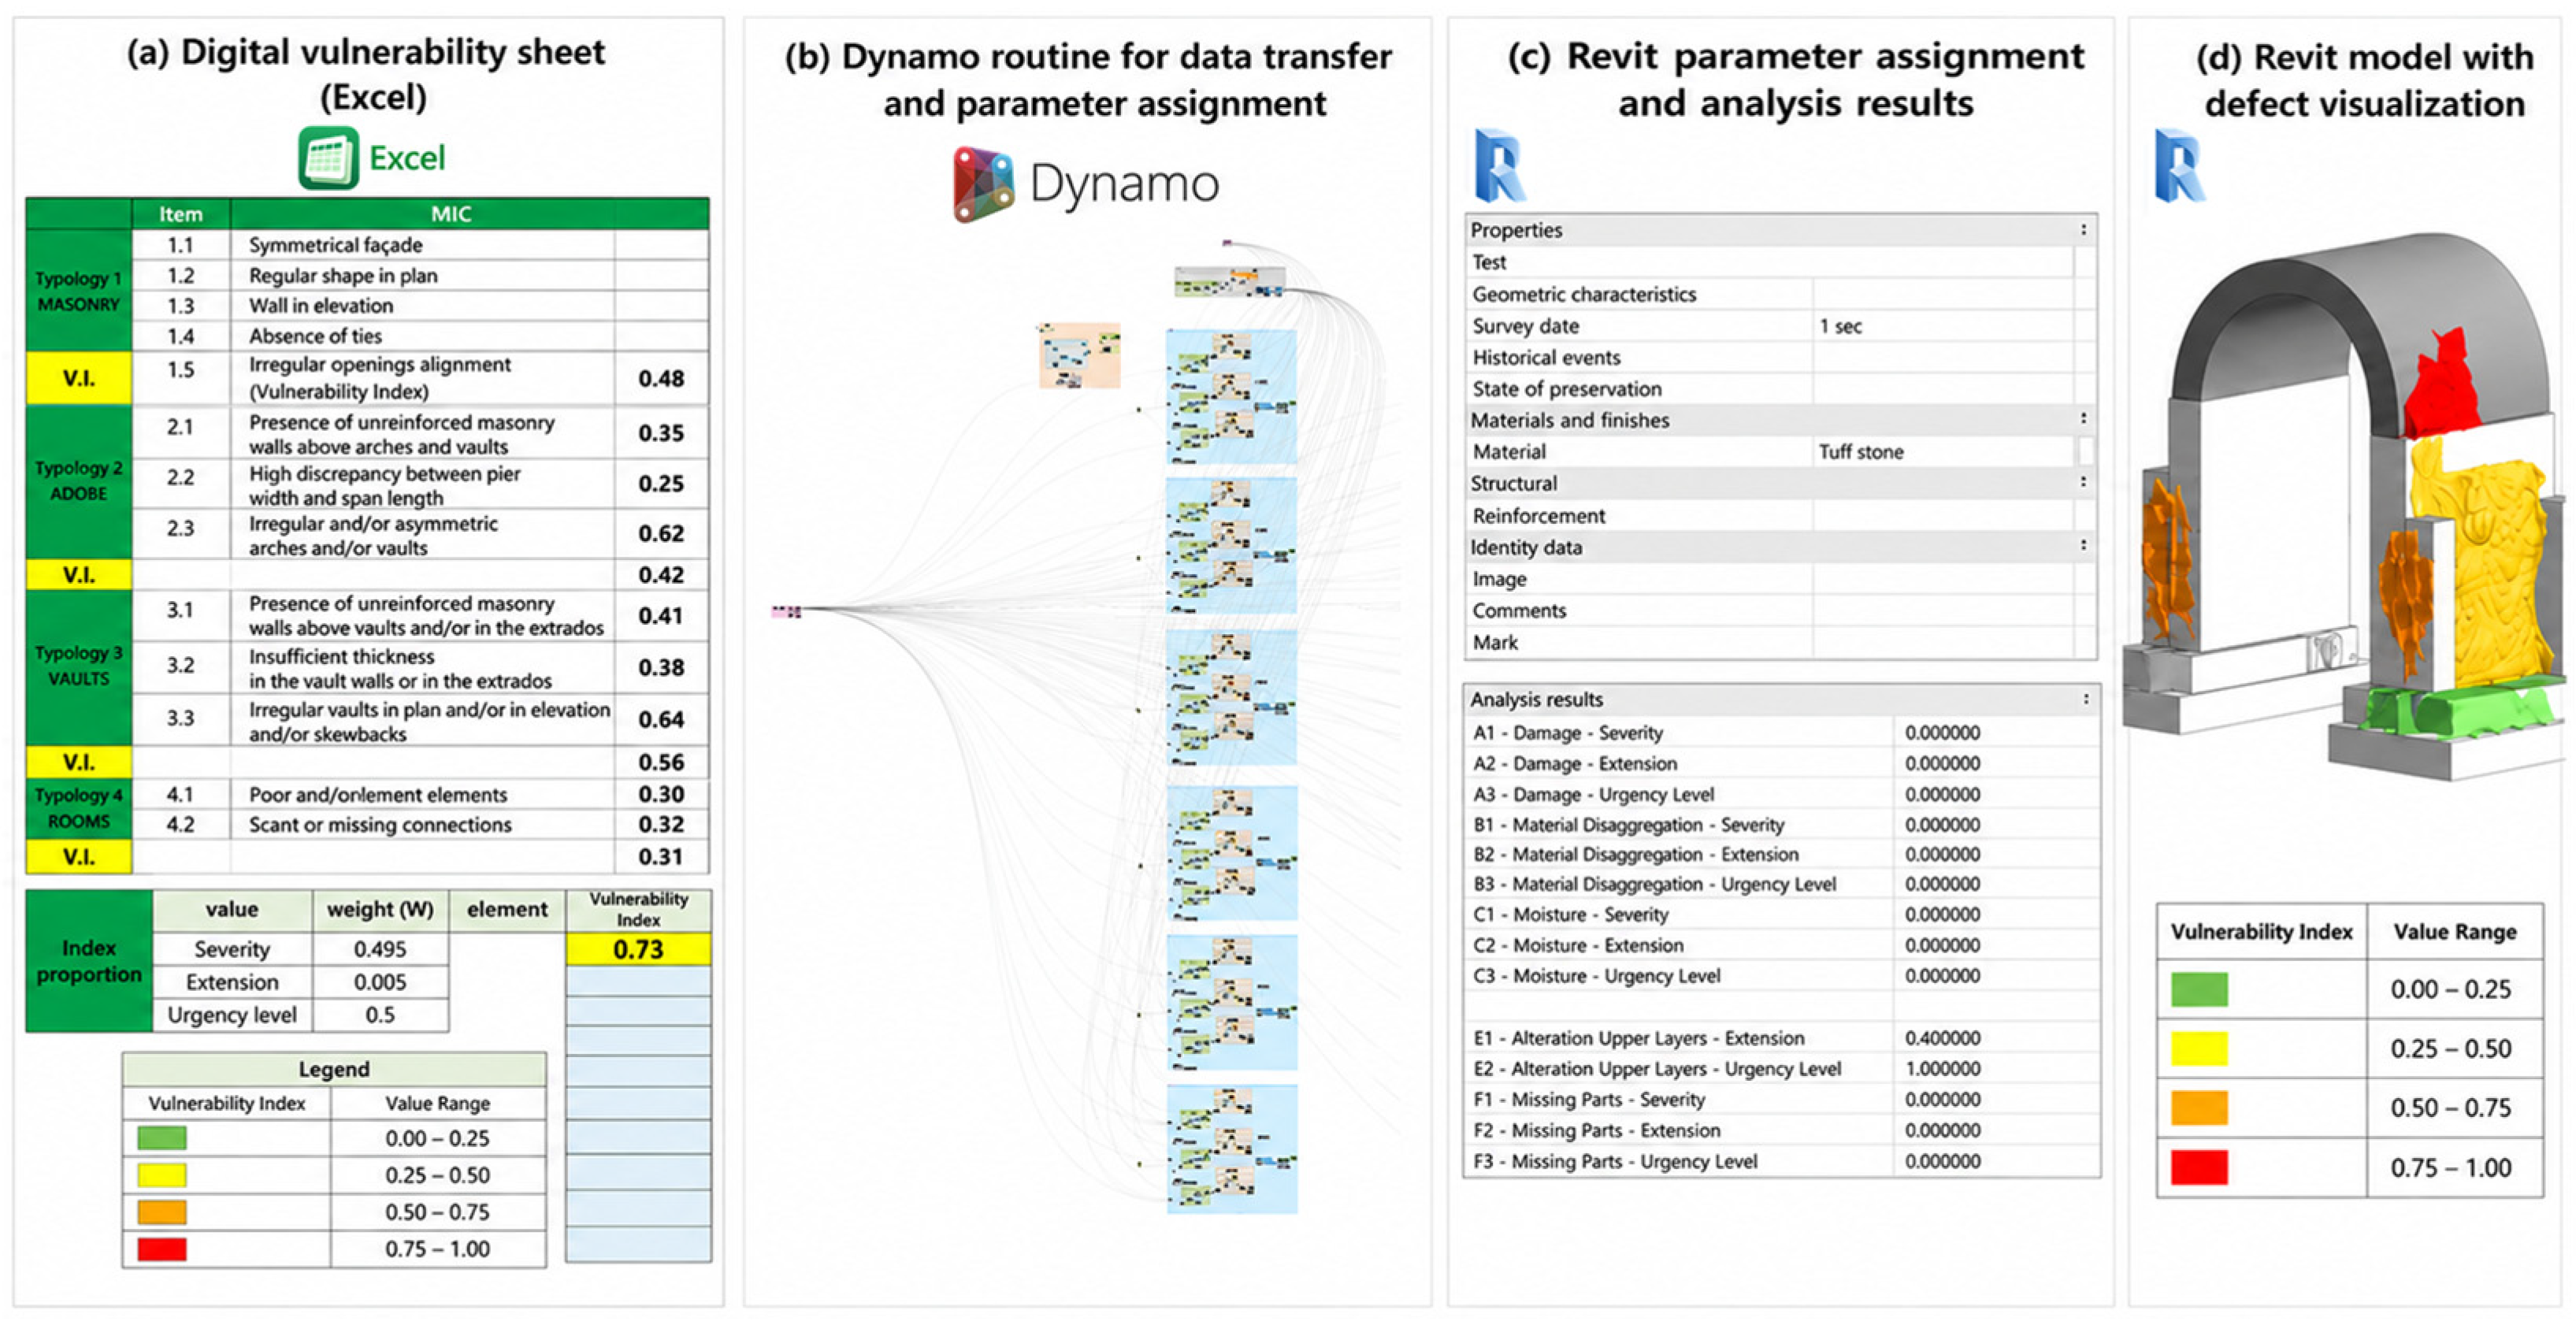

Disclaimer/Publisher’s Note: The statements, opinions and data contained in all publications are solely those of the individual author(s) and contributor(s) and not of MDPI and/or the editor(s). MDPI and/or the editor(s) disclaim responsibility for any injury to people or property resulting from any ideas, methods, instructions or products referred to in the content. |
© 2026 by the authors. Licensee MDPI, Basel, Switzerland. This article is an open access article distributed under the terms and conditions of the Creative Commons Attribution (CC BY) license.