Article

Machine Learning for Wind Speed Estimation

1
Department of Architecture, Faculty of Art, Design and Architecture, Sakarya University, 54050 Sakarya, Türkiye
2
Department of Architecture, Faculty of Architecture, Bursa Uludağ University, 16059 Bursa, Türkiye
*
Author to whom correspondence should be addressed.
Buildings 2025, 15(9), 1541; https://doi.org/10.3390/buildings15091541
Submission received: 13 March 2025 / Revised: 28 April 2025 / Accepted: 29 April 2025 / Published: 2 May 2025
(This article belongs to the Section Building Energy, Physics, Environment, and Systems)

Abstract

For more than two decades, computational analysis has been pivotal in expanding architectural capabilities, enabling sustainable design through detailed environmental analysis. Central to creating sustainable environments is the profound understanding of wind dynamics, which significantly influence comfort levels around buildings. Traditionally, wind tunnel experiments, in situ measurements, and computational fluid dynamics (CFD) simulations have been employed to assess wind speeds in urban settings. However, the advent of machine learning (ML) has introduced innovative methodologies that extend beyond these conventional approaches, offering new insights and applications in architectural design. This study focuses on evaluating pedestrian-level wind speeds using ML techniques, with a comparative analysis against traditional in situ measurements and CFD simulations. Our findings reveal that ML can predict wind speeds with sufficient accuracy for preliminary design phases. One of the primary challenges addressed is the integration of visual outputs from ML models with quantitative data, a necessary step to enhance model reliability and applicability. By developing novel techniques for this integration, our research marks a significant contribution to the field, benchmarking the effectiveness of ML against established methods. The results validate the ML model’s capability to accurately estimate wind speeds, thereby supporting the design of more sustainable and comfortable urban environments.

Graphical Abstract

1. Introduction

Smart cities and architecture are associated with wind measurement due to its contribution to sustainable cities and architecture, cost-effective and health-conscious architectural solutions, and energy efficiency. The potential of this system lies in its ability to decrease energy expenses by utilizing natural ventilation and passive cooling while also ensuring a comfortable urban environment [1,2]. Wind speed is affected by urban planning, which subsequently impacts pedestrian wind comfort, thermal comfort, and emission dispersion [3,4,5,6,7,8,9,10]. Therefore, there is a need for increased research on urban planning and enhanced cooperation between wind engineers, architects, and urban planners [11]. The form and arrangement of buildings need to be considered [7,12,13,14,15,16,17,18,19,20] as airflow patterns caused by structures can prevent mobility and result in discomfort [1,21].
The process of integrating wind solutions for pedestrian comfort into cities involves several key stages, such as assessing wind impacts, identifying critical areas and quality standards, and translating desired qualities and large-scale solutions into actionable guidelines. The approaches utilized to assess wind conditions in urban areas can be classified as in situ measurements, wind tunnel experiments, and CFD analyses [16,17,19,21,22,23,24]. Using modeling and simulations throughout the design phase improves labor and efficiency of time. Although wind tunnels have advantages in terms of optimizing designs, their installation is burdensome and time-consuming, resulting in a preference for numerical simulations such as CFD to evaluate thermal comfort and ventilation. CFD, which is highly regarded for its accuracy and economic nature, offers comprehensive insights into wind analysis, the effects of building geometry, and outdoor pedestrian comfort [1]. Also, combining the methodology through the validation of CFD results with in situ measurements enhances the assessment accuracy [25,26,27,28,29]. The combination of CFD and wind tunnel measurements is another methodology used in many studies [11,30,31,32]. However, a scarcity of research is identified regarding the comparison of CFD simulations and in situ measurements for assessing pedestrian-level wind speed, as previous studies [25,33] have also stated. Therefore, the comparison of CFD simulations with in situ measurements is valuable in terms of accuracy [34].
Several studies have made use of CFD simulations to predict the wind environment encountered by pedestrians [6,27,32,35,36,37,38]. Numerous studies [11,24,30,39] have increased the precision of predictions by combining CFD simulations with wind tunnel experiments or in situ measurements. Guidelines for the use of CFD and field measurements for accurate predictions have been published by the AIJ (Architectural Institute of Japan), COST (European Cooperation in Science and Technology), and CoL (City of London) [29,40,41]. The AIJ and COST have produced the most comprehensive versions of the guidelines, with greater emphasis on architectural and urban design. To produce CFD guidelines, the AIJ validated CFD simulations with in situ and wind tunnel measurements to predict the wind environment in urban areas.
Ref. [19] developed a model that combines statistical meteorological data, aerodynamic information, and pedestrian-level wind speed and validates CFD results with in situ measurements. According to them, CFD simulation and in situ measurements are compatible within acceptable parameters. Ref. [7] also integrated CFD simulations and in situ measurements for accurate wind resource evaluation in complex terrain and found that the micro-scale topography effects of CFD were well aligned with the in situ data. Ref. [35] noted the accuracy of CFD with in situ data and merged these methods for high-resolution evaluations. Their work highlights the advancement of combined methods for accurate wind resource assessments [42].
For validating simulations and assessing pedestrian-level wind speeds, the relevant literature suggests combining CFD with in situ measurements. While CFD accurately estimates wind speeds during the design phase, its computational restrictions may pose a disadvantage [43]. In other words, costly hardware equipment, engineering expertise, and domain knowledge are essential components of the CFD method, which necessitates an extended time investment [17,21,38,44,45]. As an alternative, the incorporation of ML models can optimize design decision-making and accelerate this process. The limitations of conventional methods, such as knowledge requirements and time-consuming processes, have led to the increased use of ML in wind analysis and prediction in design. During the initial phases of the design, ML offers the benefit of promptly supplying a cost-effective estimation. However, knowledge and training data are restricted to case studies, which are its limitations. With this respect, this study is driven by a critical research question: how does the accuracy of ML models in predicting pedestrian-level wind speeds compare to traditional computational fluid dynamics (CFD) and in situ measurement techniques? This question addresses a significant gap in current architectural research, focusing on the potential of newer, technology-driven approaches to enhance sustainable urban design.
The following section provides an in-depth examination of ML applications in architectural and urban design, with a particular focus on wind analysis. This detailed exploration includes the ways in which ML is being used to innovate and improve design processes, decision-making, and environmental assessments in the built environment. Special attention is given to how ML algorithms predict wind patterns, thereby informing sustainable and comfortable urban spaces.

2. Analysis of Wind Research Utilizing Machine Learning in Built Environment

Over the last decade, a substantial quantity of studies have been carried out to examine the application of ML tools in the field of architectural and urban design. Techniques include artificial neural networks (ANNs), the creation of design intent data, ML-based tools for architectural and urban design, and the application of ML as a tool at the intersection of architecture and art [46,47,48,49,50,51]. Furthermore, ML techniques are applied to produce design options for the construction of buildings that prioritize comfort and performance [8,52,53,54,55,56]. To assess the effect of different design alternatives on user comfort, high-fidelity numerical simulations, such as CFD, are utilized. Methods that necessitate significant parameter and data inputs are currently inefficient, according to developments in computing [57,58]. ML approaches are increasingly popular among end users since these tools do not require extensive knowledge compared to CFD. To clarify, while ML tools often come with user-friendly interfaces that may reduce the barrier to entry for non-experts, effectively employing these tools still requires a thorough understanding of the underlying algorithms, model training, and data interpretation processes.
Currently, several ML tools aim to estimate wind speeds in various urban scenarios. For instance, Orbital Stack uses urban climate data to predict the wind environment at the pedestrian level [59]. The Intelligent Framework for Resilient Design (InFraReD), created by the Austrian Institute of Technology’s City Intelligence Lab, is another ML tool used for simulating urban microclimates [60]. InFraReD uses ML to predict the environmental performance of buildings and uses augmented reality and generative design to support wind-related design decisions.
Building upon the advancements showcased by tools like Orbital Stack and InFraReD, the process of ML unfolds through five critical stages: data collection, data preparation, model training, model evaluation, and parameter optimization. This structured approach allows ML models to leverage data from experimental research, numerical simulations, and analytical methods, or extensive empirical observations. As a result, these models gain the ability to anticipate outcomes in novel scenarios, extending their predictive power beyond the initial conditions of their training data. This feature of ML highlights its important role in improving the environmental performance of urban designs, including the optimization of wind speeds around buildings, through predictive analysis.
ML-based predictions in the built environment primarily focus on wind speed, wind pressure, wind direction, and wind comfort, aiming to enhance ventilation and thermal comfort [7,32,45,58,61,62]. There has been a growing utilization of ML to assess urban air quality and estimate wind loads [5,63,64,65]. The main areas of ML research related to the impact of wind on buildings and urban areas are categorized in Table 1 as wind speed and flow, wind comfort, wind and microclimate effects, and wind interference.
To incorporate wind considerations into urban design, ref. [6] proposed Wind-Sensitive Urban Design. This study highlights the necessity for improved wind assessment methods. Ref. [54] investigated the impact of streets and buildings on wind flow through the utilization of NN and regression trees. This study revealed that flow patterns are influenced by building characteristics and proposed to include a variety of geographical characteristics and wind orientations for future research. Ref. [62] utilized a Spatial-Frequency Generative Adversarial Network (SFGAN) to estimate pedestrian wind flow. This network combines wind frequency and support architects in evaluating wind comfort across various building configurations. Ref. [16] reconstructed urban wind patterns from sparse sensor data using a GCN and auto-encoder architecture. The findings indicate that incorporating physical information and improving relationships between sensors and environments decreased prediction errors; however, the model, not validated with real-world data, can produce inaccurate results. Ref. [79] used categorization and U-Net regression models to forecast wind comfort. Their study shows that ML can reduce computing time from 26 h to seconds. While they demonstrate accuracy, further improvements, simulations, and training are required for applicability to diverse scenarios [79].
The use of ML for wind speed estimation has also been investigated in previous studies [7,55]. This research indicates that ML might be a trustworthy option for the use of CFD simulation in urban research. Ref. [21] assessed the utilization of InFraRed in CFD for wind comfort in urban design through Grasshopper v1 for the Rhino v8. According to the authors, potential limitations of InFraRed include the requirement for extrusion-based over-simplified modeling and the inability to consider terrain [21]. They also demonstrated that InFraRed can be used from the very beginning of the design process to enhance outdoor wind comfort. Ref. [70] also utilized deep learning to enhance the spatial design of urban systems by predicting microclimate parameters like wind speed and thermal comfort. Their study shows that incorporating ML-based estimations into the design process has become easier due to reduced computation time. According to the author’s report, including various performance criteria allows for the formulation of more objectives.
This literature review shows that the use of CFD with in situ measurements improves the assessment of wind speed and validates ML techniques through comparisons with both CFD and in situ measurements. ML-based estimation is also cost-effective and easy to implement; therefore, ML methods are beginning to be applied to wind flow estimations, pedestrian comfort, and the microclimate surrounding buildings [57,58,74]. However, the adaptation of ML models to different scenarios and locations is limited by the limited availability of training data in case studies. Moreover, there is a limited amount of scientific research focused on predicting wind speeds to improve outdoor comfort and comparing ML models with in situ measurements. Therefore, it is important to evaluate ML models over an urban scenario to contribute to the relevant literature.

3. Materials and Methods

The details of this study’s methodology and materials are presented in separate parts in this section. The subject material’s descriptions and selection criteria are listed in the first part. The technique and methodology used to assess the material are covered in the second part.

3.1. Material

In the context of our study, the Bursa Uludag University campus serves as a key site for assessing urban wind comfort due to its diverse architectural features and significant pedestrian traffic. The campus includes critical areas such as the Faculties of Engineering and Architecture, which are particularly relevant due to their exposed locations and the resultant wind patterns they influence. Each faculty, except for the three-story Faculty of Industrial Engineering, is housed in two-story buildings with courtyards. The case study area is a hub for students who use the outdoor spaces extensively for various activities. The preferred spots for this study are shown in Figure 1.

3.2. Method

Analysis of climate data is typically the first step in assessing pedestrian-level wind. Consequently, it is necessary to have a comprehensive knowledge of the local climate by a meticulous investigation of long-term meteorological data (at least 30 years) [31]. In general, open spaces, typical locations for meteorological stations, are utilized for wind speed monitoring. At these stations, wind speeds are recorded at a height of 10 m, capturing hourly mean wind speed measurements. The wind data utilized in this study, sourced from the Turkish Meteorological Organization, include long-term historical wind speed and direction records collected over 30 years. This dataset was crucial for establishing the baseline wind conditions for our analysis. We incorporated these data into our CFD and ML simulations to ensure consistency with real-world wind patterns observed around the study area. To determine wind speed values at the pedestrian level, which is often taken to be 1.75 m, these meteorological data are delivered to the case study site and utilized as the inlet boundary condition for the wind analysis.
For a more detailed alignment, the windrose diagrams (Figure 2) include the seasonal variation in wind direction and speed. This is pivotal as it illustrates how annual wind data may differ from seasonal wind data, emphasizing the distinct characteristics of each period. Moreover, given the significance of winter conditions in terms of wind discomfort, we have conducted a direct comparison between the winter wind data from the Turkish Meteorological Organization and the in situ measurements collected during the winter season. This comparative analysis is crucial for validating the accuracy of our simulations. By closely aligning the meteorological data with in situ measurements, we aim to demonstrate the consistency and reliability of our CFD and ML simulations in replicating real-world wind conditions around the building.
In the following subsections, the methodology section will be examined in detail for each form of analysis: in situ measurement (i), CFD (ii), and ML (iii). Finally, the method for a comparison of all analyses is given (iv).

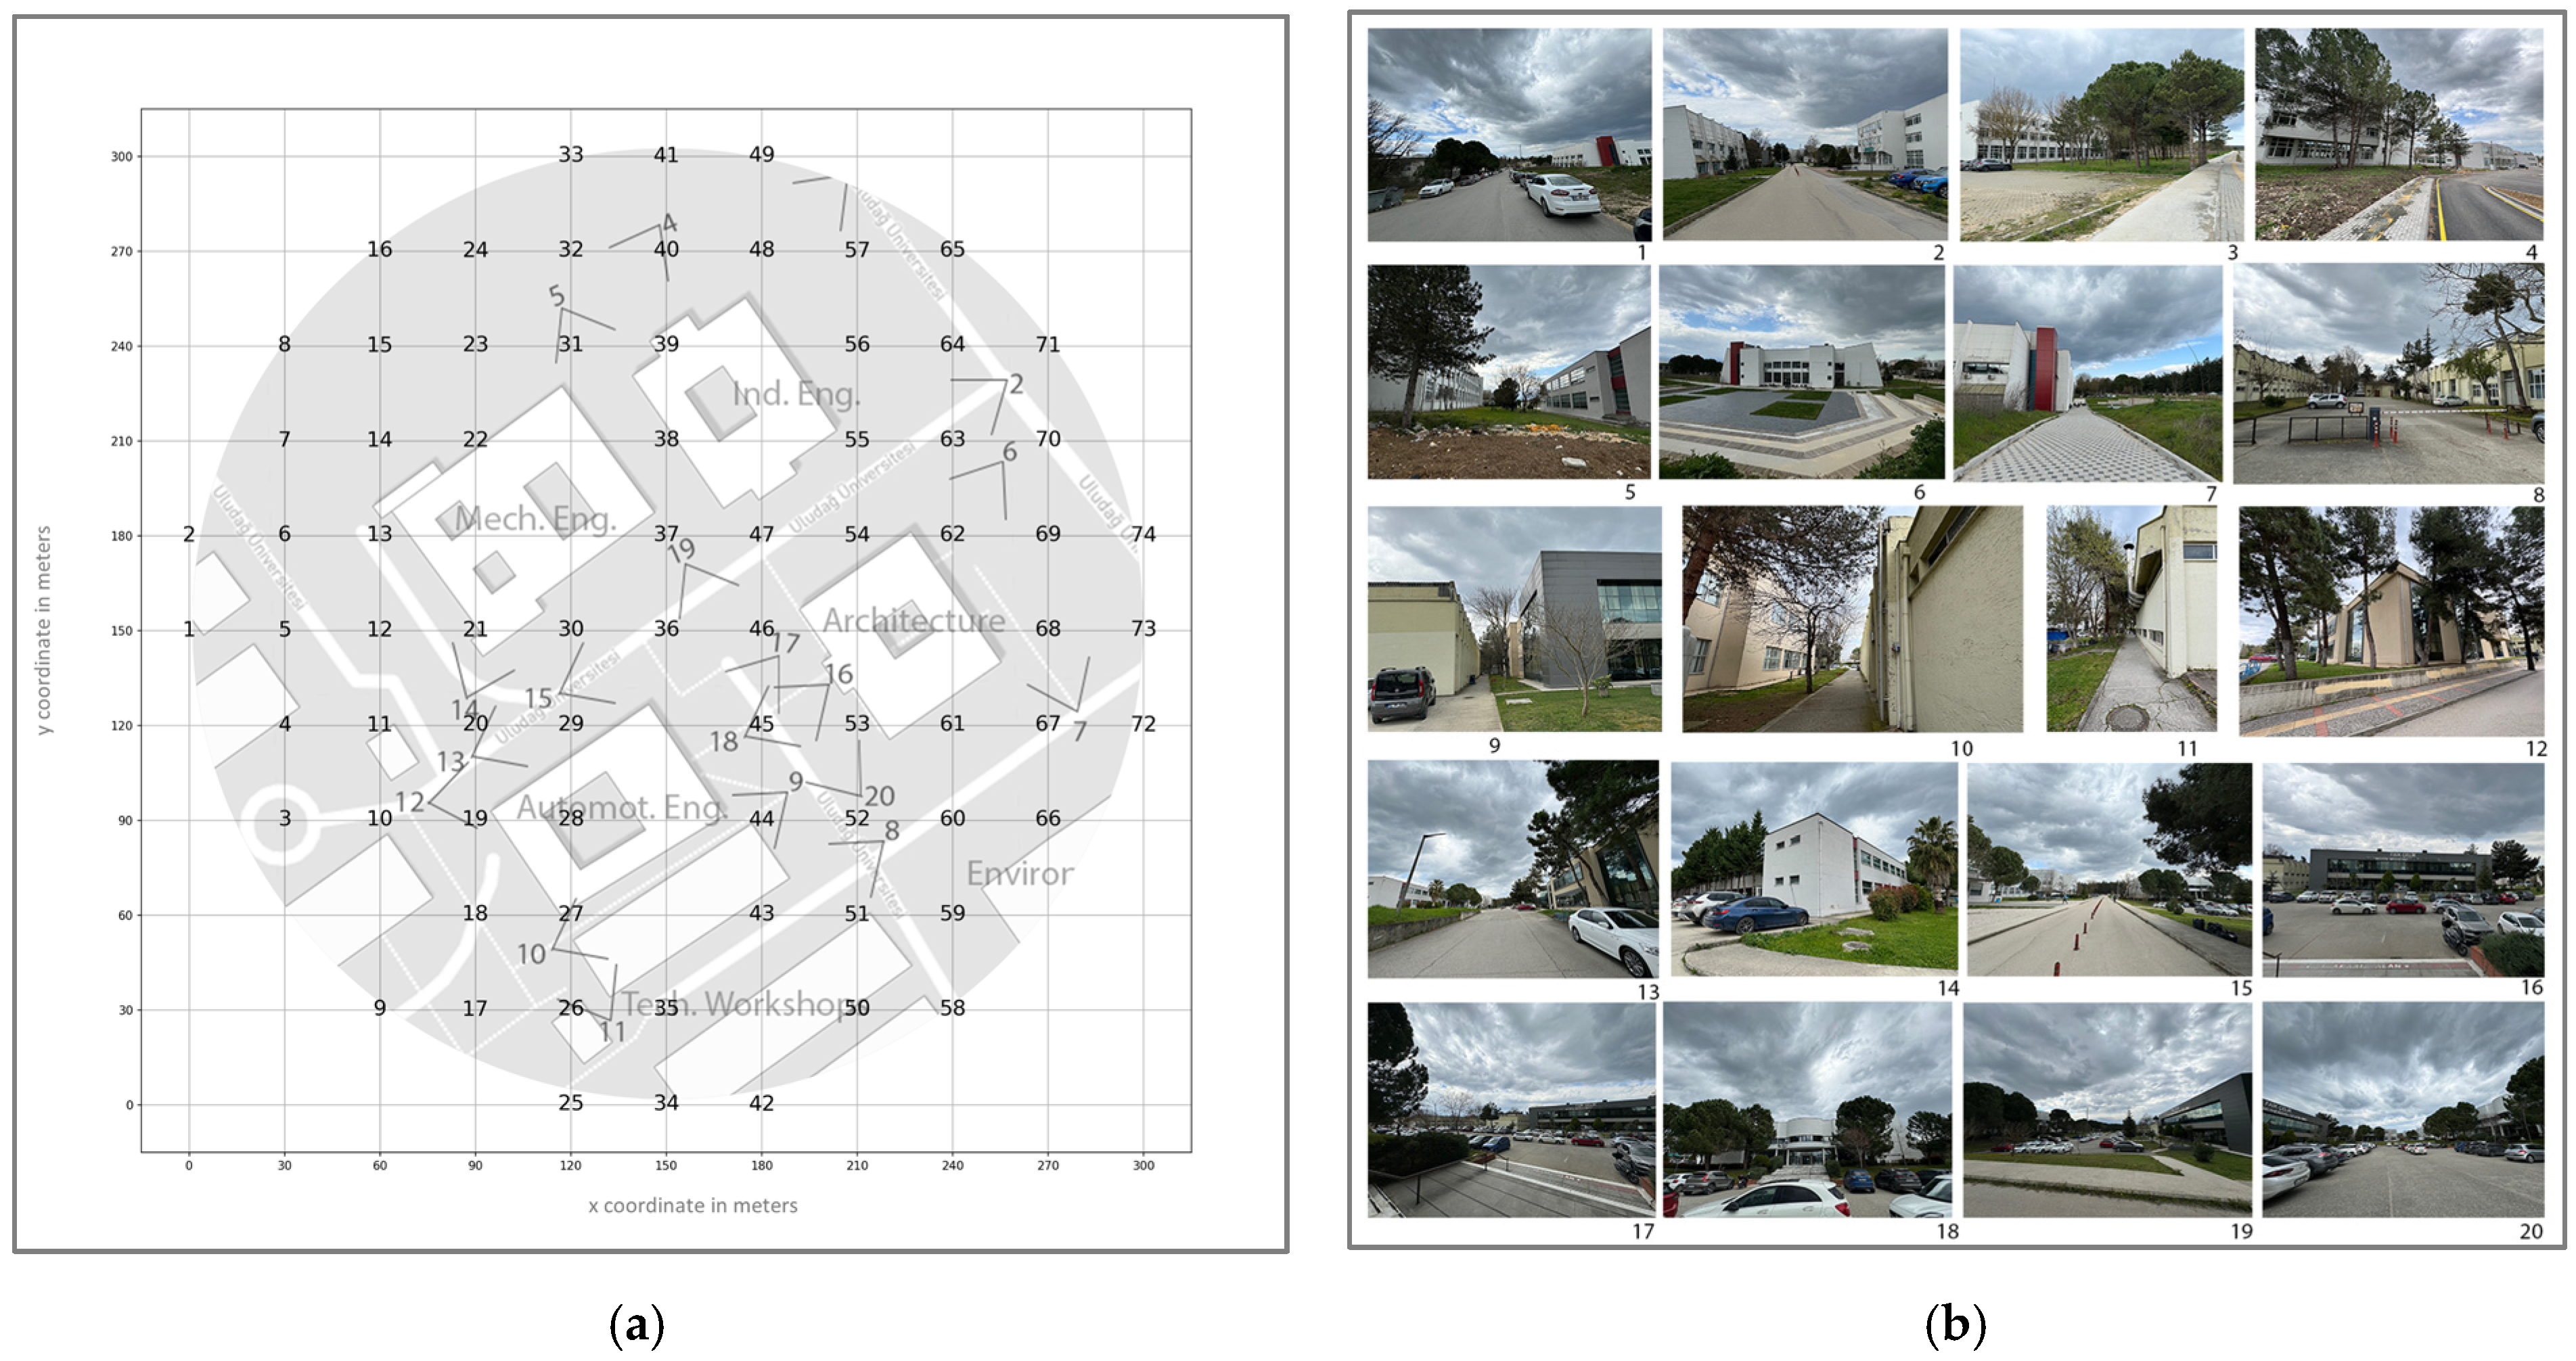
3.2.1. Method for In Situ Measurements

As indicated in the literature review, in situ measurements are one of the most reliable options for assessing wind speeds around buildings. Accordingly, this study selected 74 measurement points that completely cover the critical areas around the buildings (Figure 3). The in situ measurement was performed for each selected point in the year 2024 from early January to mid-March. The selected winter period is the most critical in terms of wind discomfort. Measurements were taken for up to two hours (12:00 am to 2:00 pm), corresponding to the busiest hours for pedestrians.
To collect wind speed data, portable three-cup anemometers (Davis Instruments 6410 or equivalent, Davis Instruments Corp., Hayward, CA, USA) were employed. These devices are widely used in meteorological and environmental studies due to their fast implementation and dependable accuracy. With a typical measurement accuracy of ±0.2 m/s, they are well suited for evaluating pedestrian-level wind conditions. During in situ measurements, the anemometers were mounted on Davis Instruments 7716 Tripod Mounting Kits, which include three-legged support and pole extensions, allowing for stable and repeatable setups in outdoor environments. Each instrument was placed at a standardized height of 1.75 m above ground level, corresponding to the requirements for an average pedestrian-level comfort study. The devices were carefully positioned in open areas, away from nearby obstructions, to prevent wind flow distortion and ensure accurate and representative data collection.

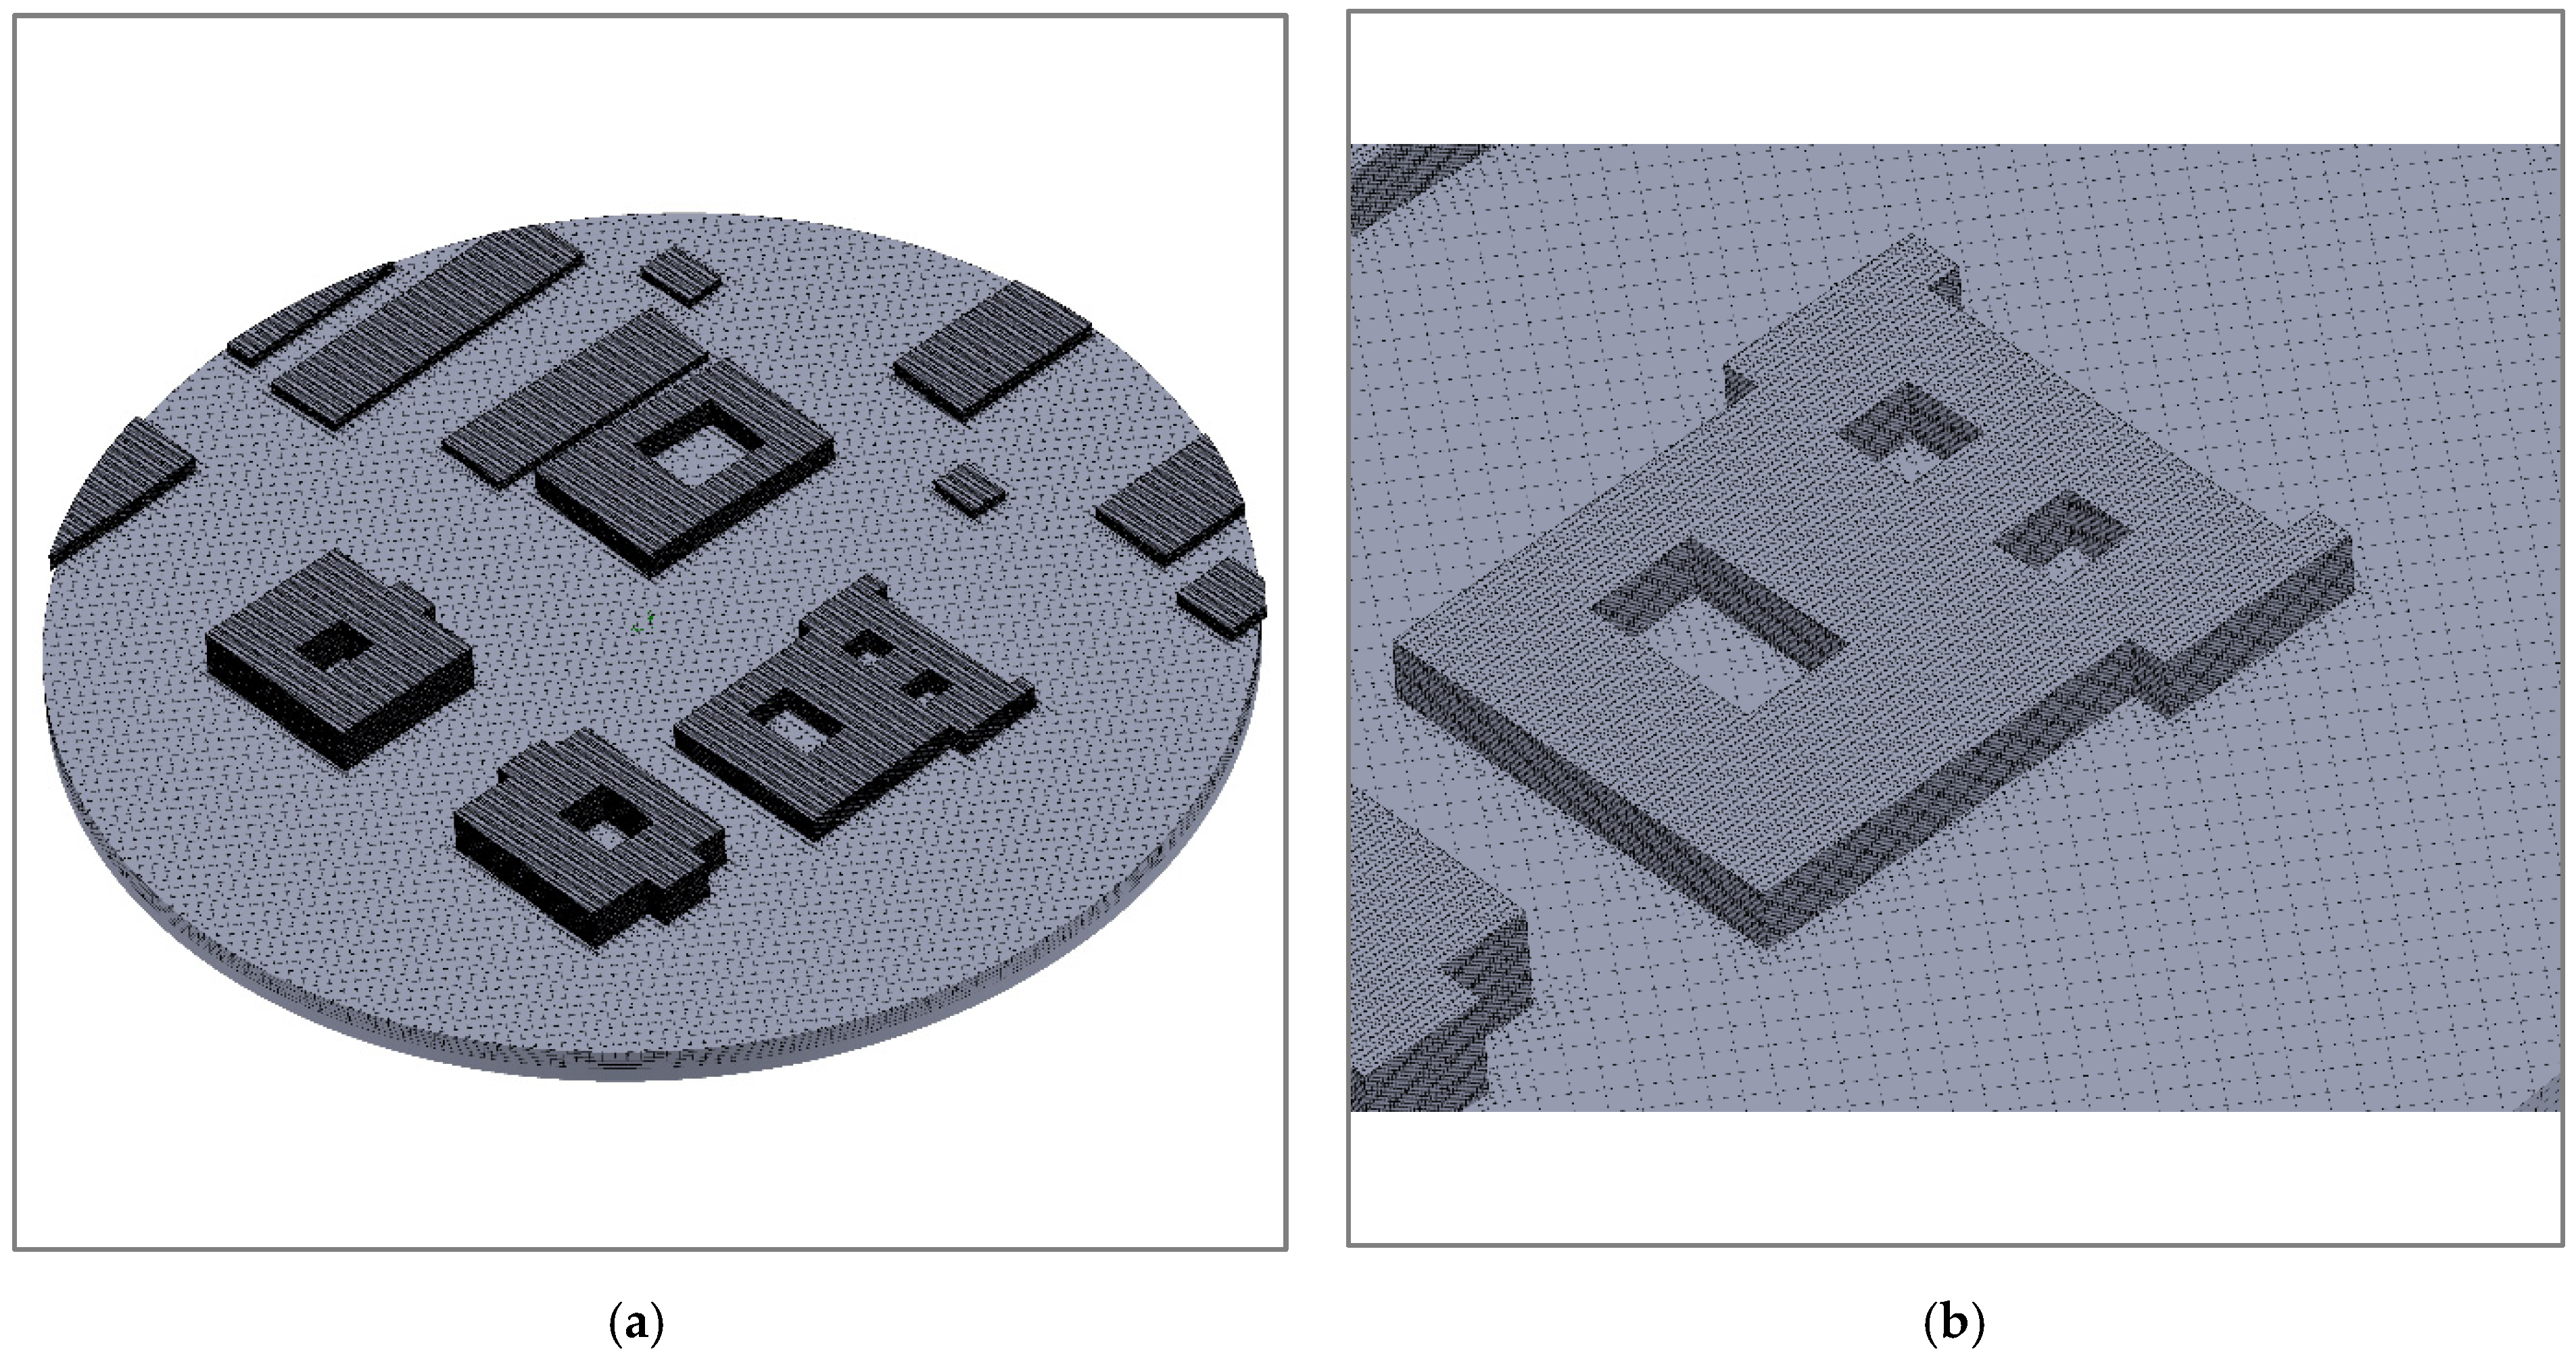
3.2.2. Computational Fluid Dynamics Analysis Method

Navier–Stokes equations are typically used to solve turbulent flow in urban environments [20]. Therefore, 3D steady-state Equations for Reynolds-Averaged Navier–Stokes (RANS) as an economical solution are preferred. To solve these equations, a CFD code that is open-source OpenFOAM v2412 is used, typically seen in fluid dynamics engineering applications. The solver makes the assumption that the flow is incompressible and steady. This is consistent with the industry’s state of the art for urban wind assessments. As suggested by the CFD guidelines, the realizable k-Epsilon turbulence model is selected [80]. Although turbulence modeling is a separate field of study, this model is expected to produce results that provide accurate results for urban wind simulations.
To ensure the accuracy and reliability of our CFD simulations, a mesh independence study was conducted. This study evaluated three different mesh sizes to determine the impact of grid refinement on the simulation results, particularly focusing on the areas near the buildings where high-resolution data are critical, as indicated in Table 2. The final grid size chosen for the simulations consisted of approximately 10 million cells, with a minimum cell size of 50 cm near the building surfaces to capture the complex flow patterns effectively. We used a workstation equipped with 128 GB of RAM and a multi-core processor (32 cores) to efficiently perform the simulation. Such a setup enables reasonable computation times for simulations that involve complex urban aerodynamics. In contrast, the ML simulations conducted using the Autodesk Forma platform do not require the user to have access to such hardware. These simulations are processed on cloud-based servers, where the computational load is managed by the service provider.
An additional crucial numerical simulation element of CFD is the convergence criteria. According to the AIJ’s CFD rules, it is critical to verify that a solution remains constant by tracking variables at intervals or by overlaying the contours of the calculation results at various calculation steps [29]. Thus, the simulation ends if the solution converges, and the error estimate is low using the selected turbulence model. Therefore, the simulations were considered converged when the residuals for velocity and pressure fell below 10−6, and no significant changes in airflow patterns were observed with further iterations.
A computational model was constructed for simulation, and the computational domain was separated into various zones based on aerodynamic roughness lengths, crucial for modeling wind flow dynamics around urban areas. An aerodynamic roughness length of y0 = 0.75 m is used to implicitly represent the far-field, which includes nearby buildings, while the near-field surrounding the place of interest is explicitly modeled. The area with structures that were expressly modeled has a diameter of 300 m. As advised by the guidelines, the domain was left with a 15H downstream domain extension and a 5H upstream domain extension in the inlet, where H is the height of the tallest building in the area of interest. The buildings are detailed using cells that are smaller than those at the boundaries of the explicitly modeled region [41]. To attain quick convergence, a high-quality, high-resolution grid made entirely of cut cells was created (Figure 4). The computational domain’s boundary was represented by a neutral atmospheric boundary layer. For this study, a logarithmic mean wind speed profile was used, with a reference wind velocity of 4 m/s at u10 (10 m above the ground) considering the atmospheric boundary layer thickness and surface roughness characteristics. This profile was derived from the historical meteorological data provided by the Turkish Meteorological Organization, ensuring that the simulations reflected realistic wind conditions. At the domain’s outlet, zero static pressure is applied when ambient pressure is applied at the inlet. As a result, the flow developed fully throughout the entire domain. Furthermore, zero normal gradients of all variables and zero normal velocity were used to model the domain’s top and sides. Airflow friction was therefore absent at these domain borders.
Finally, the wind speed corresponding to the in situ measurement locations at 1.75 m above the ground was exported in numerical format for visualization as a contour map. The exported data are also used for statistical purposes through a box plot.

3.2.3. Machine Learning-Based Analysis Method

This study makes use of Autodesk Forma, an ML-based analytic tool. This tool uses a multivariate model based on an artificial neural network (ANN) for wind speed estimation. The machine learning model underlying Autodesk Forma operates as a surrogate artificial neural network (ANN), as the developers mentioned in the user’s forum. According to our conclusions, the model predicts output variables (ŷ) based on input features (x) through a neural network f(x; θ). The model parameters are optimized by minimizing a loss function (N denotes the number of training samples), typically the mean squared error (MSE), as shown below:
𝓛(θ) = (1/N) Σi (yi − f(xi; θ))2
Moreover, the model assumably employs continual learning, updating the parameters incrementally as new user data become available (η represents the learning rate, and ∇θ 𝓛tt) denotes the gradient of the loss function with respect to the model parameters):
θt+1 = θt − η ∇θ 𝓛tt)
This approach ensures that the surrogate model remains representative of evolving urban and building configurations. The analysis is instantaneous and gives results from wind simulations that show how wind conditions vary according to the design. A simplified version of real-world situations is reflected in the ML model, which is trained on simulation data with a constant wind speed of 3 m/s and considers 8 distinct wind directions for each location. By using real-world projects, the model may be trained to understand wind flow dynamics at various locations with varying building types and topographies, considering nearby structures and planned buildings. When the wind speed is altered, the existing 3 m/s forecast is scaled to the selected speed without requiring a new forecast to be run.
Loss factor computations are used to measure the trained model’s efficacy. A scalar value that measures the difference between a model’s projected outputs and the actual values in the training data is commonly referred to as the “loss factor” in ML. The loss measures the difference between simulation and prediction for every pixel and is expressed in meters per second (m/s). The average of these point-by-point comparisons across the whole prediction domain is the mean loss for a specific site. However, because commercial ML models are usually not made publicly available due to confidentiality and financial considerations, their black-box nature poses a substantial research challenge. Because of this, researchers are unable to quantitatively evaluate these models in a variety of settings, especially when evaluating loss factors. This situation is also a crucial place to start this research.
It is important to clarify the capabilities and relevance of this tool within the context of our research:
Autodesk Forma is accessible via an educational account, which is freely available to researchers. This accessibility makes it an excellent tool for educational and research institutions worldwide, ensuring that advanced ML capabilities are not restricted to those with funding. Additionally, the platform is particularly beneficial for researchers and practitioners lacking extensive coding skills, enabling them to leverage advanced ML tools effectively.
Unlike static ML models, Autodesk Forma learns and improves continuously. It adapts based on new data and user interactions, which means that with each simulation, it refines its algorithms and enhances its predictive accuracy.
For ongoing validation, Autodesk employs a real-time strategy: the surrogate model is triggered during wind analyses and its output is compared with the expected results. This ensures that the model stays aligned with how users currently model buildings and their surroundings. Consequently, the surrogate models offer timely, context-aware approximations, making them effective within the Autodesk Forma environment but less so outside of it. Still, the model maintains diversity and relevance by incorporating a wide range of urban and climatic inputs from users.
The use of a dynamic, widely accessible ML tool is significant not only for its immediate analytical capabilities but also for its implications in democratizing advanced computational tools in architecture. This aligns with our research goal of exploring practical, accessible solutions for enhancing urban wind comfort.
The ML model is predictive in nature, contrasting with CFD analysis that meticulously replicates airflow around buildings. Instead of mimicking the wind’s movement directly, it leverages knowledge of building aerodynamics to predict ground-level wind at each grid point. Consequently, the wind comfort results from the ML tool tend to be more surface-level compared to the simulation-based results from the CFD analysis, as they rely on predictions. Therefore, the ML model is primarily employed during the initial phases of architectural design.
Although the findings focus on the pedestrian level, it is often necessary to assess comfort levels in areas above open or semi-open spaces, such as roofs, balconies, and terraces. Furthermore, the ML model’s output is limited to image files, offering no numerical data (i). Additionally, unlike CFD simulations, the ML model does not provide a streamline view option for analyzing airflow patterns in depth, although the results are visible for specific wind directions (ii).

3.2.4. Comparison of CFD and ML to In Situ Measurements

The effectiveness of the CFD and ML model is measured using several assessment measures following a manual examination of the output quality. As previously indicated, ML analysis cannot directly yield numerical results due to Autodesk Forma’s constraints. Consequently, the most practical choice at this point is an image-based data reading technique. A comprehensive approach is used to read the wind speed values at the locations corresponding to the in situ measurement points. By default, the Autodesk Forma GUI (Graphical User Interface) provides an editable wind speed legend. The user can arrange the interval of wind speeds in the analysis plot. This allows even a 0.1 m/s interval to be selected for each wind speed contour. After obtaining this image output, a Python 3.10 script is written to read RGB values from the ML plot (i) and then convert these values to wind speeds using the colors of the wind speed legend (ii).
The unique aspect of this technology is how it handles color and transparency in PNG images. It does this by excluding transparent pixels from the comparison using alpha channel information, assuring that only the area under the analysis is included as data. This method is particularly useful in ML applications where the output images may have areas of transparency or different levels of noise and contrast changes. Moreover, the pixels corresponding to the buildings themselves are also excluded.
In short, this approach offers a thorough comprehension of ML model performance in the context of CFD analysis and in situ measurements. It also advances the methods for image processing and comparison in the quickly developing field of ML by providing accurate comparisons to established benchmarks. Last, all the numerical values will be given in a graphical plot to enable a comparison of CFD, ML, and in situ measurements. In addition, a box plot will be given to compare this large amount of data statistically.

4. Analysis and Results

In this section, the outputs of the wind analysis studies are presented as distinct subsections. As has been indicated previously, the pedestrian wind speed values are utilized to assess how pedestrians are affected by wind interference brought on by the built environment. Generally, the output of this analysis is visualized as a wind speed contour plot on an exported site map. With respect to this, the output of the in situ measurements is shown and discussed in the first subsection. The second one presents the results of the CFD study, and the third one discusses the results of the ML-based analysis. In the final section, the outcomes from these three approaches are compared.

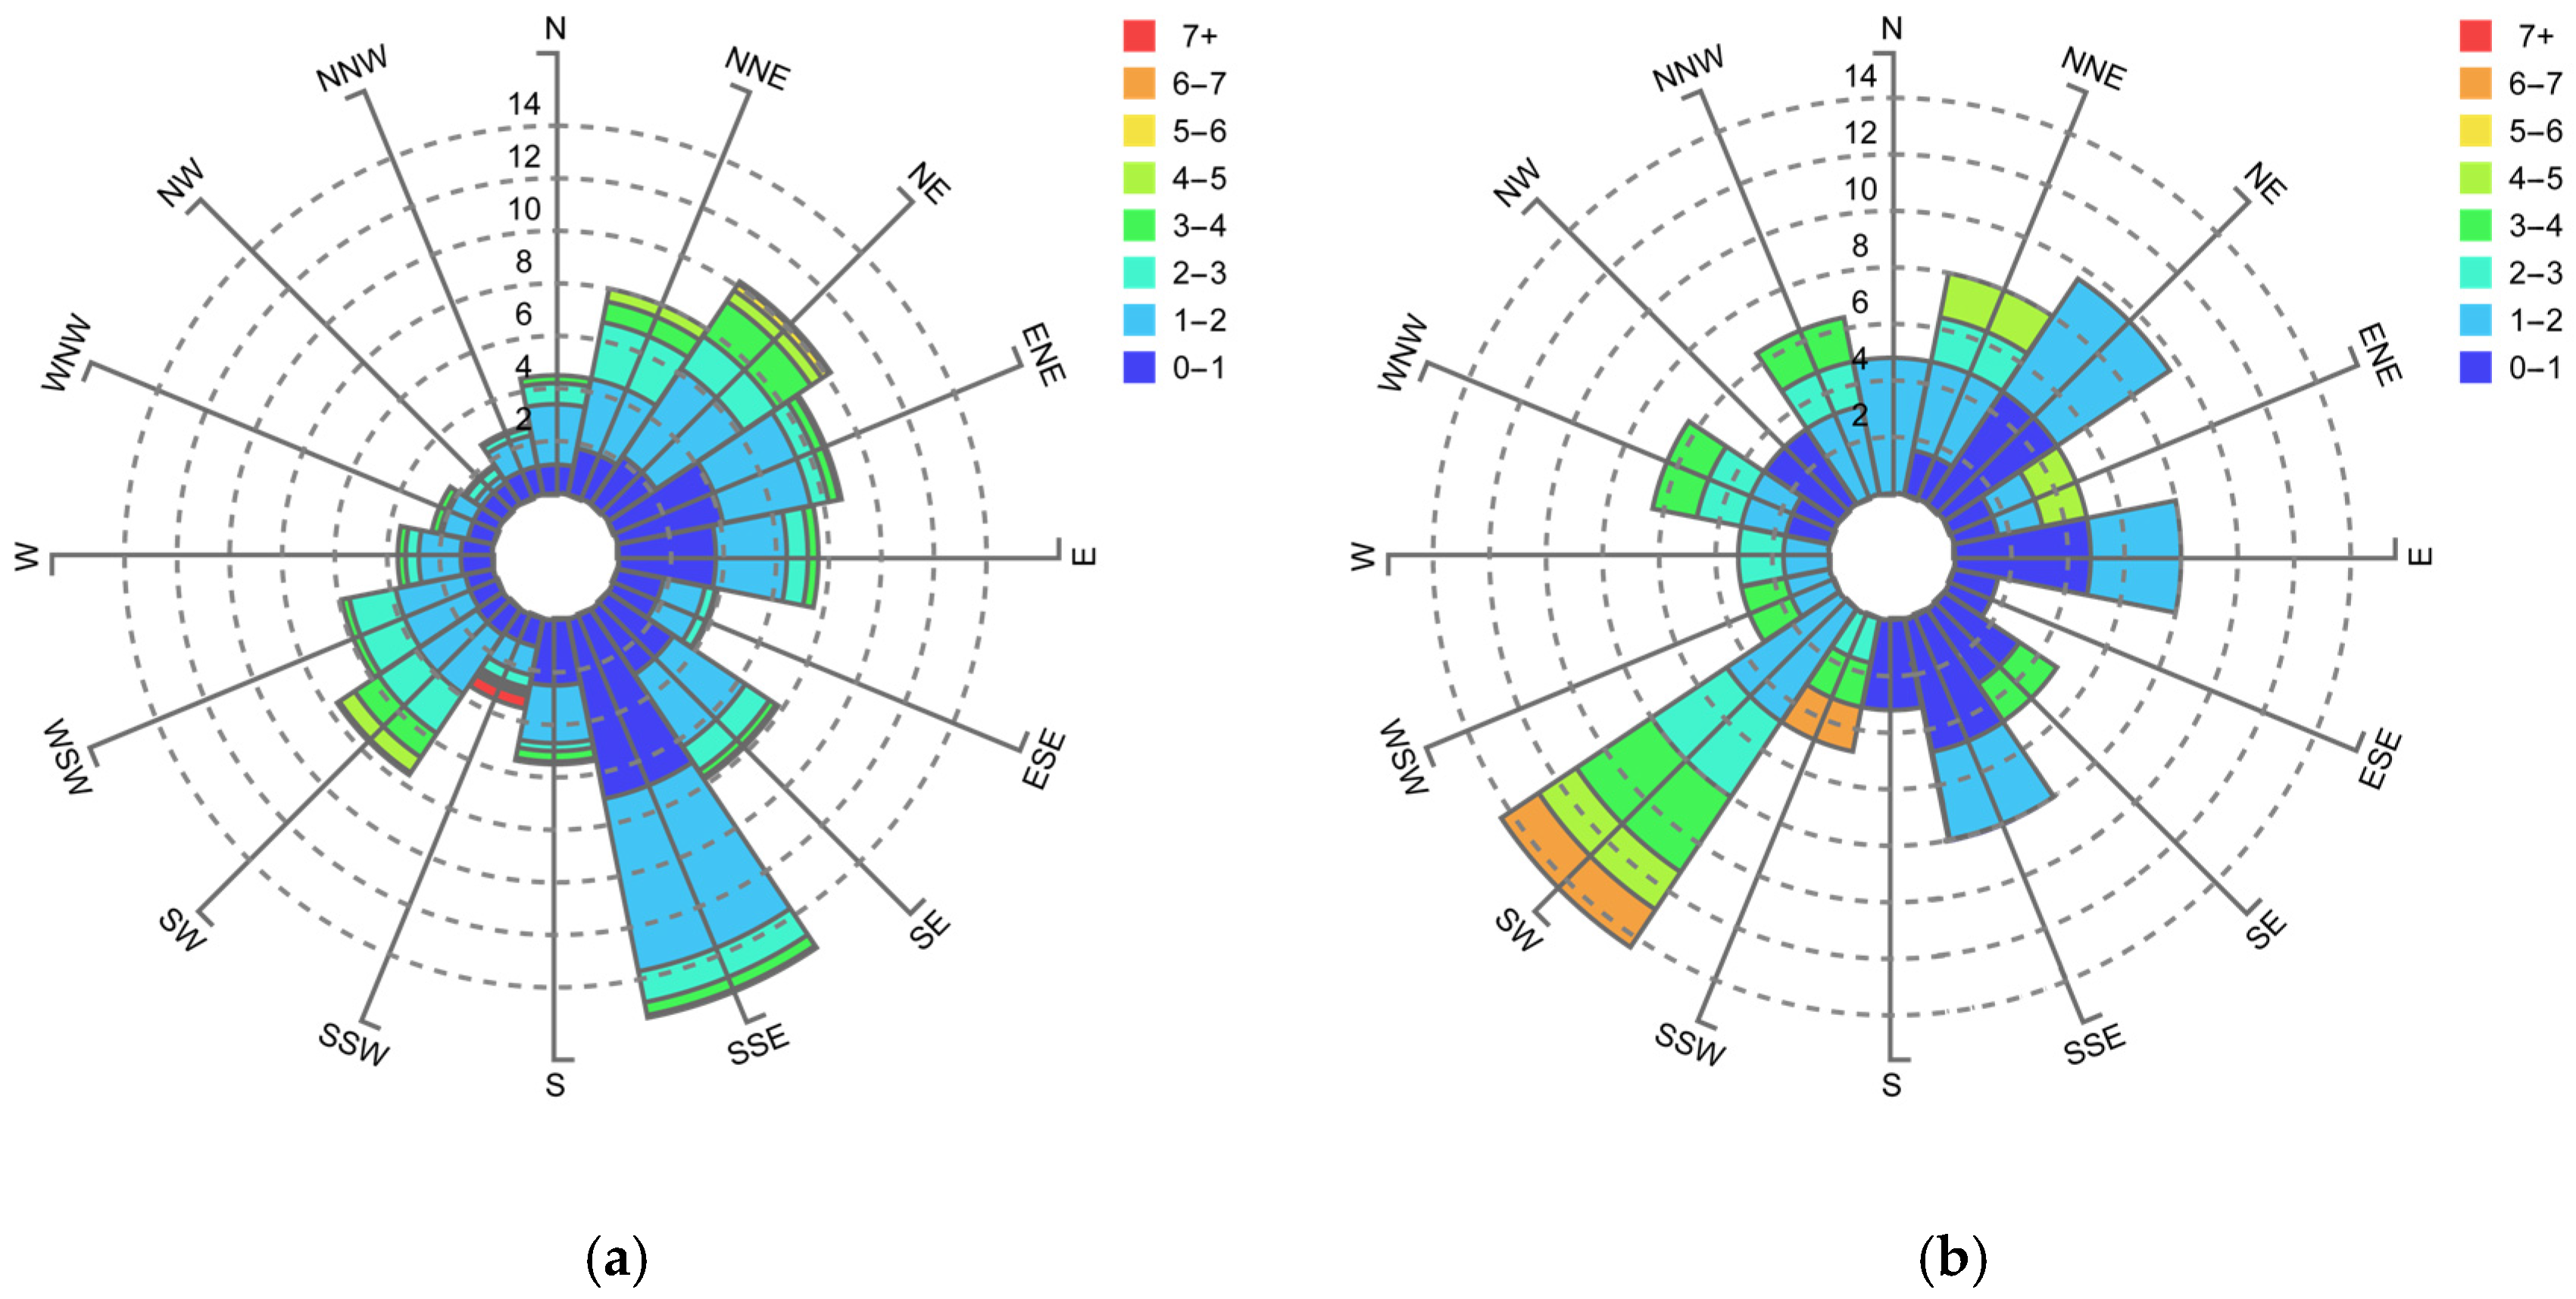
4.1. Results of the In Situ Measurements

To acquire precise wind data, particularly for upcoming planning scenarios, in situ measurements are essential. As mentioned in the methodology chapter, wind speeds are measured at 74 locations. The output of the in situ measurements, showing the regions by a colored comfort scale, is visible in Figure 5.

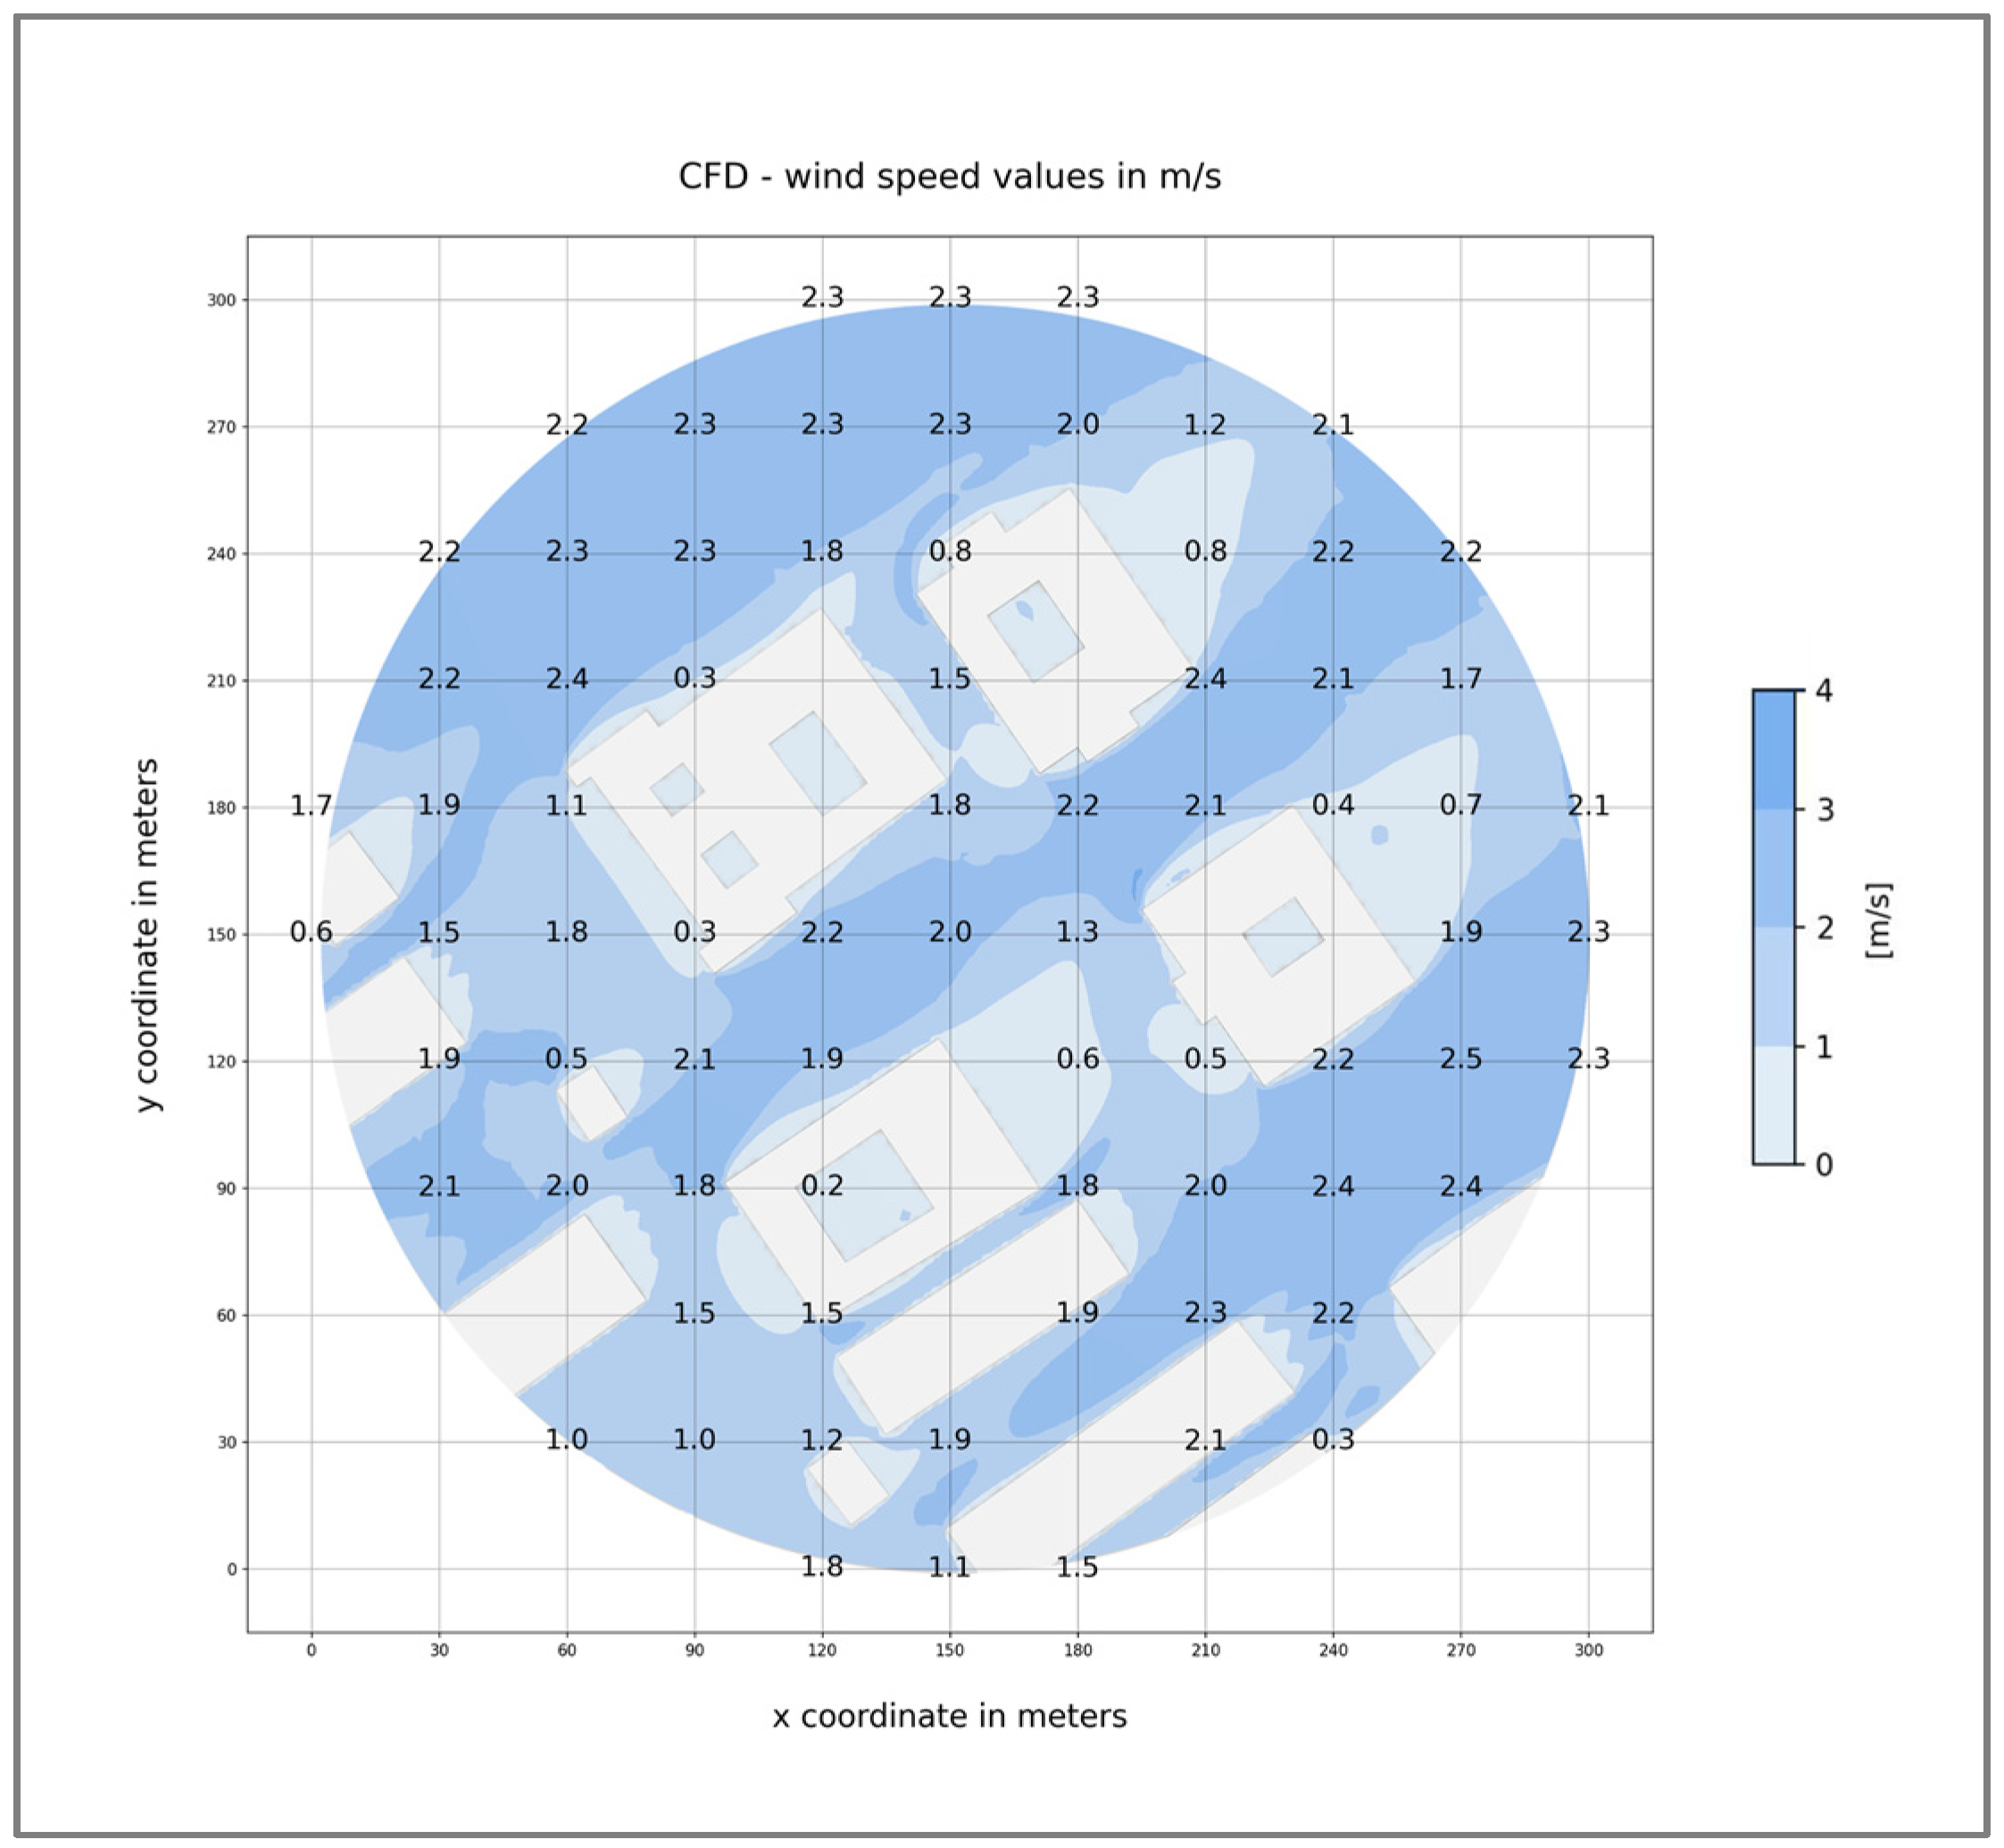
4.2. Results of the CFD Analysis

Since in situ measurements for multiple sites are very labor-intensive, CFD with the help of simulation programs has become very helpful in research and practice. Wind conditions significantly affect personal comfort and the microclimate in urban settings. The CFD analysis’s output, which shows the regions with a colored wind speed scale, is thus provided in Figure 6.
The three-dimensional layout and positioning of building volumes within cities allow for the experience of regions with strong winds and turbulence. Among these effects are the Venturi (channel) effect (i) and corner acceleration (ii). These impacts can frequently result in high-velocity ground-level winds that can create serious disruptions. The theme of wind movement might provide crucial hints about what direction is uncomfortable for pedestrians. It may be difficult to infer from the comfort analysis results alone that some areas of the site are vulnerable to wind coming from a particular direction. Therefore, a directional analysis is conducted for the southwest to see the effects of the prevailing wind direction.
It is evident from choosing the southwest wind direction and displaying streamlines passing through the point of interest that the high-wind (darker-colored) areas at the architecture faculty’s corner are the result of a pressure differential brought on by the large building facade’s obstruction effect in the direction of the approaching wind (Figure 7).
The Venturi effect is observed between buildings when wind passes through a narrow section, leading to a drop in pressure and an increase in velocity within this space. Consequently, certain areas become significantly windier for pedestrians, as illustrated in Figure 8.

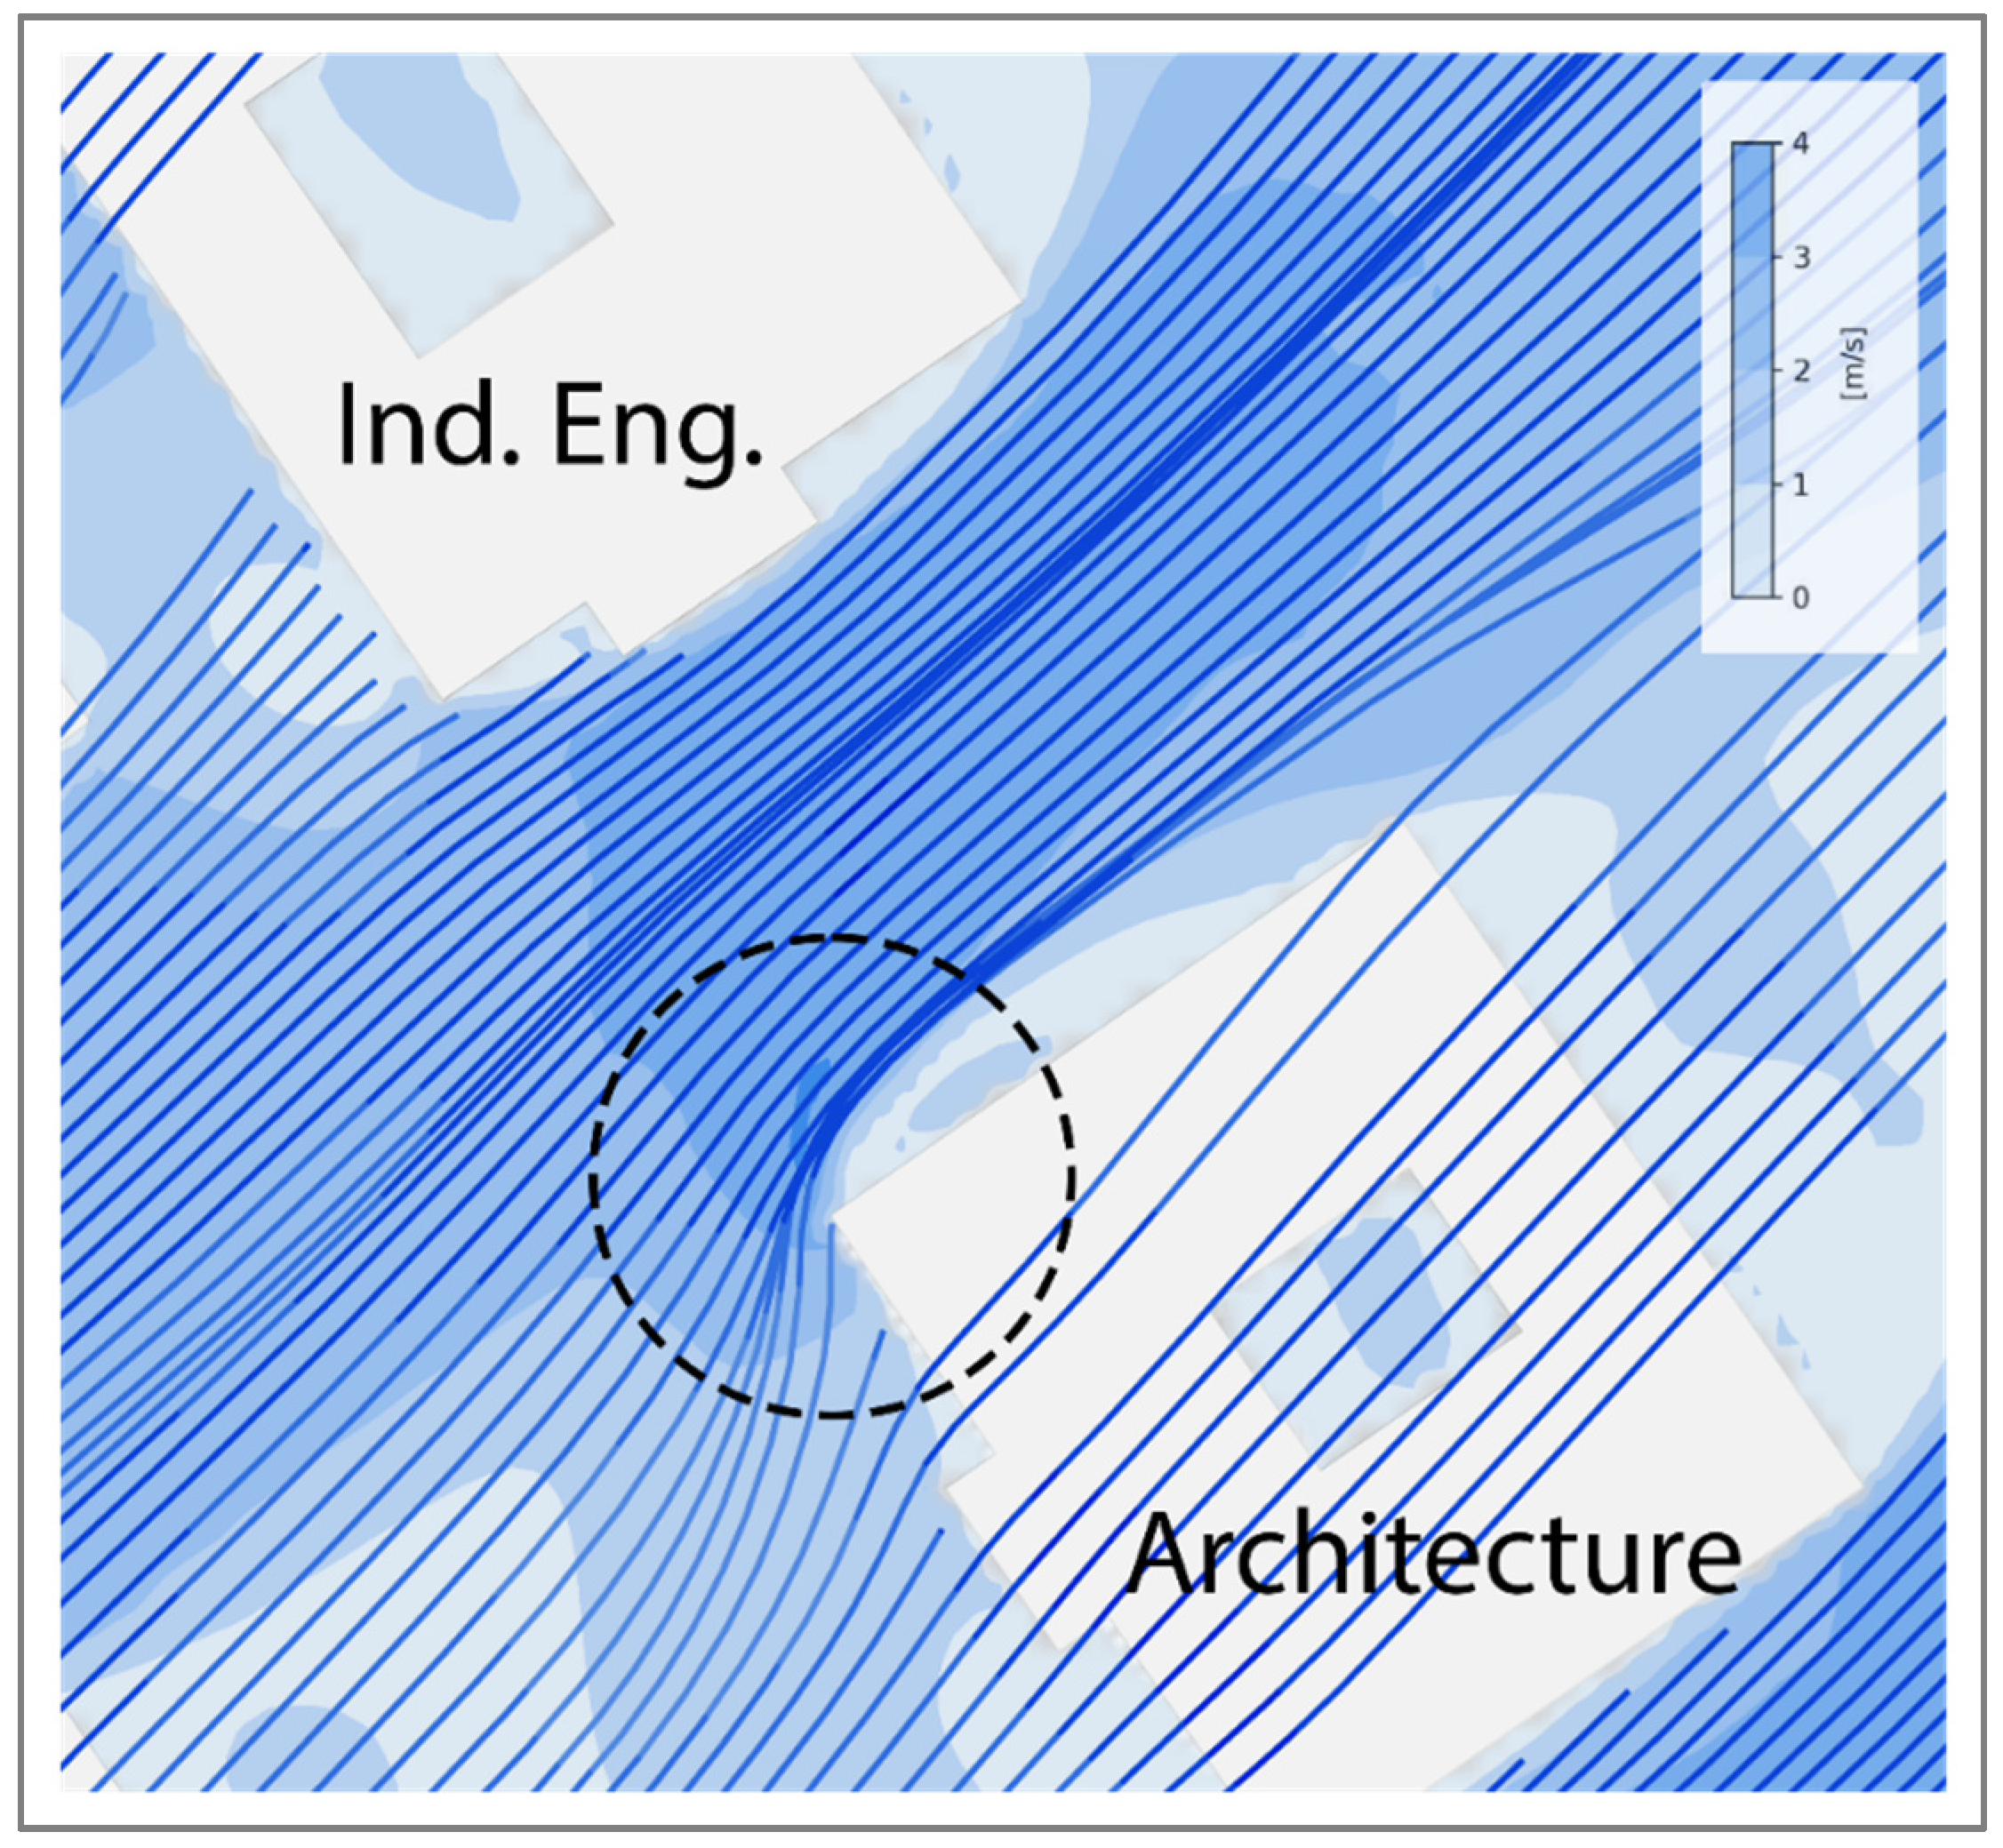
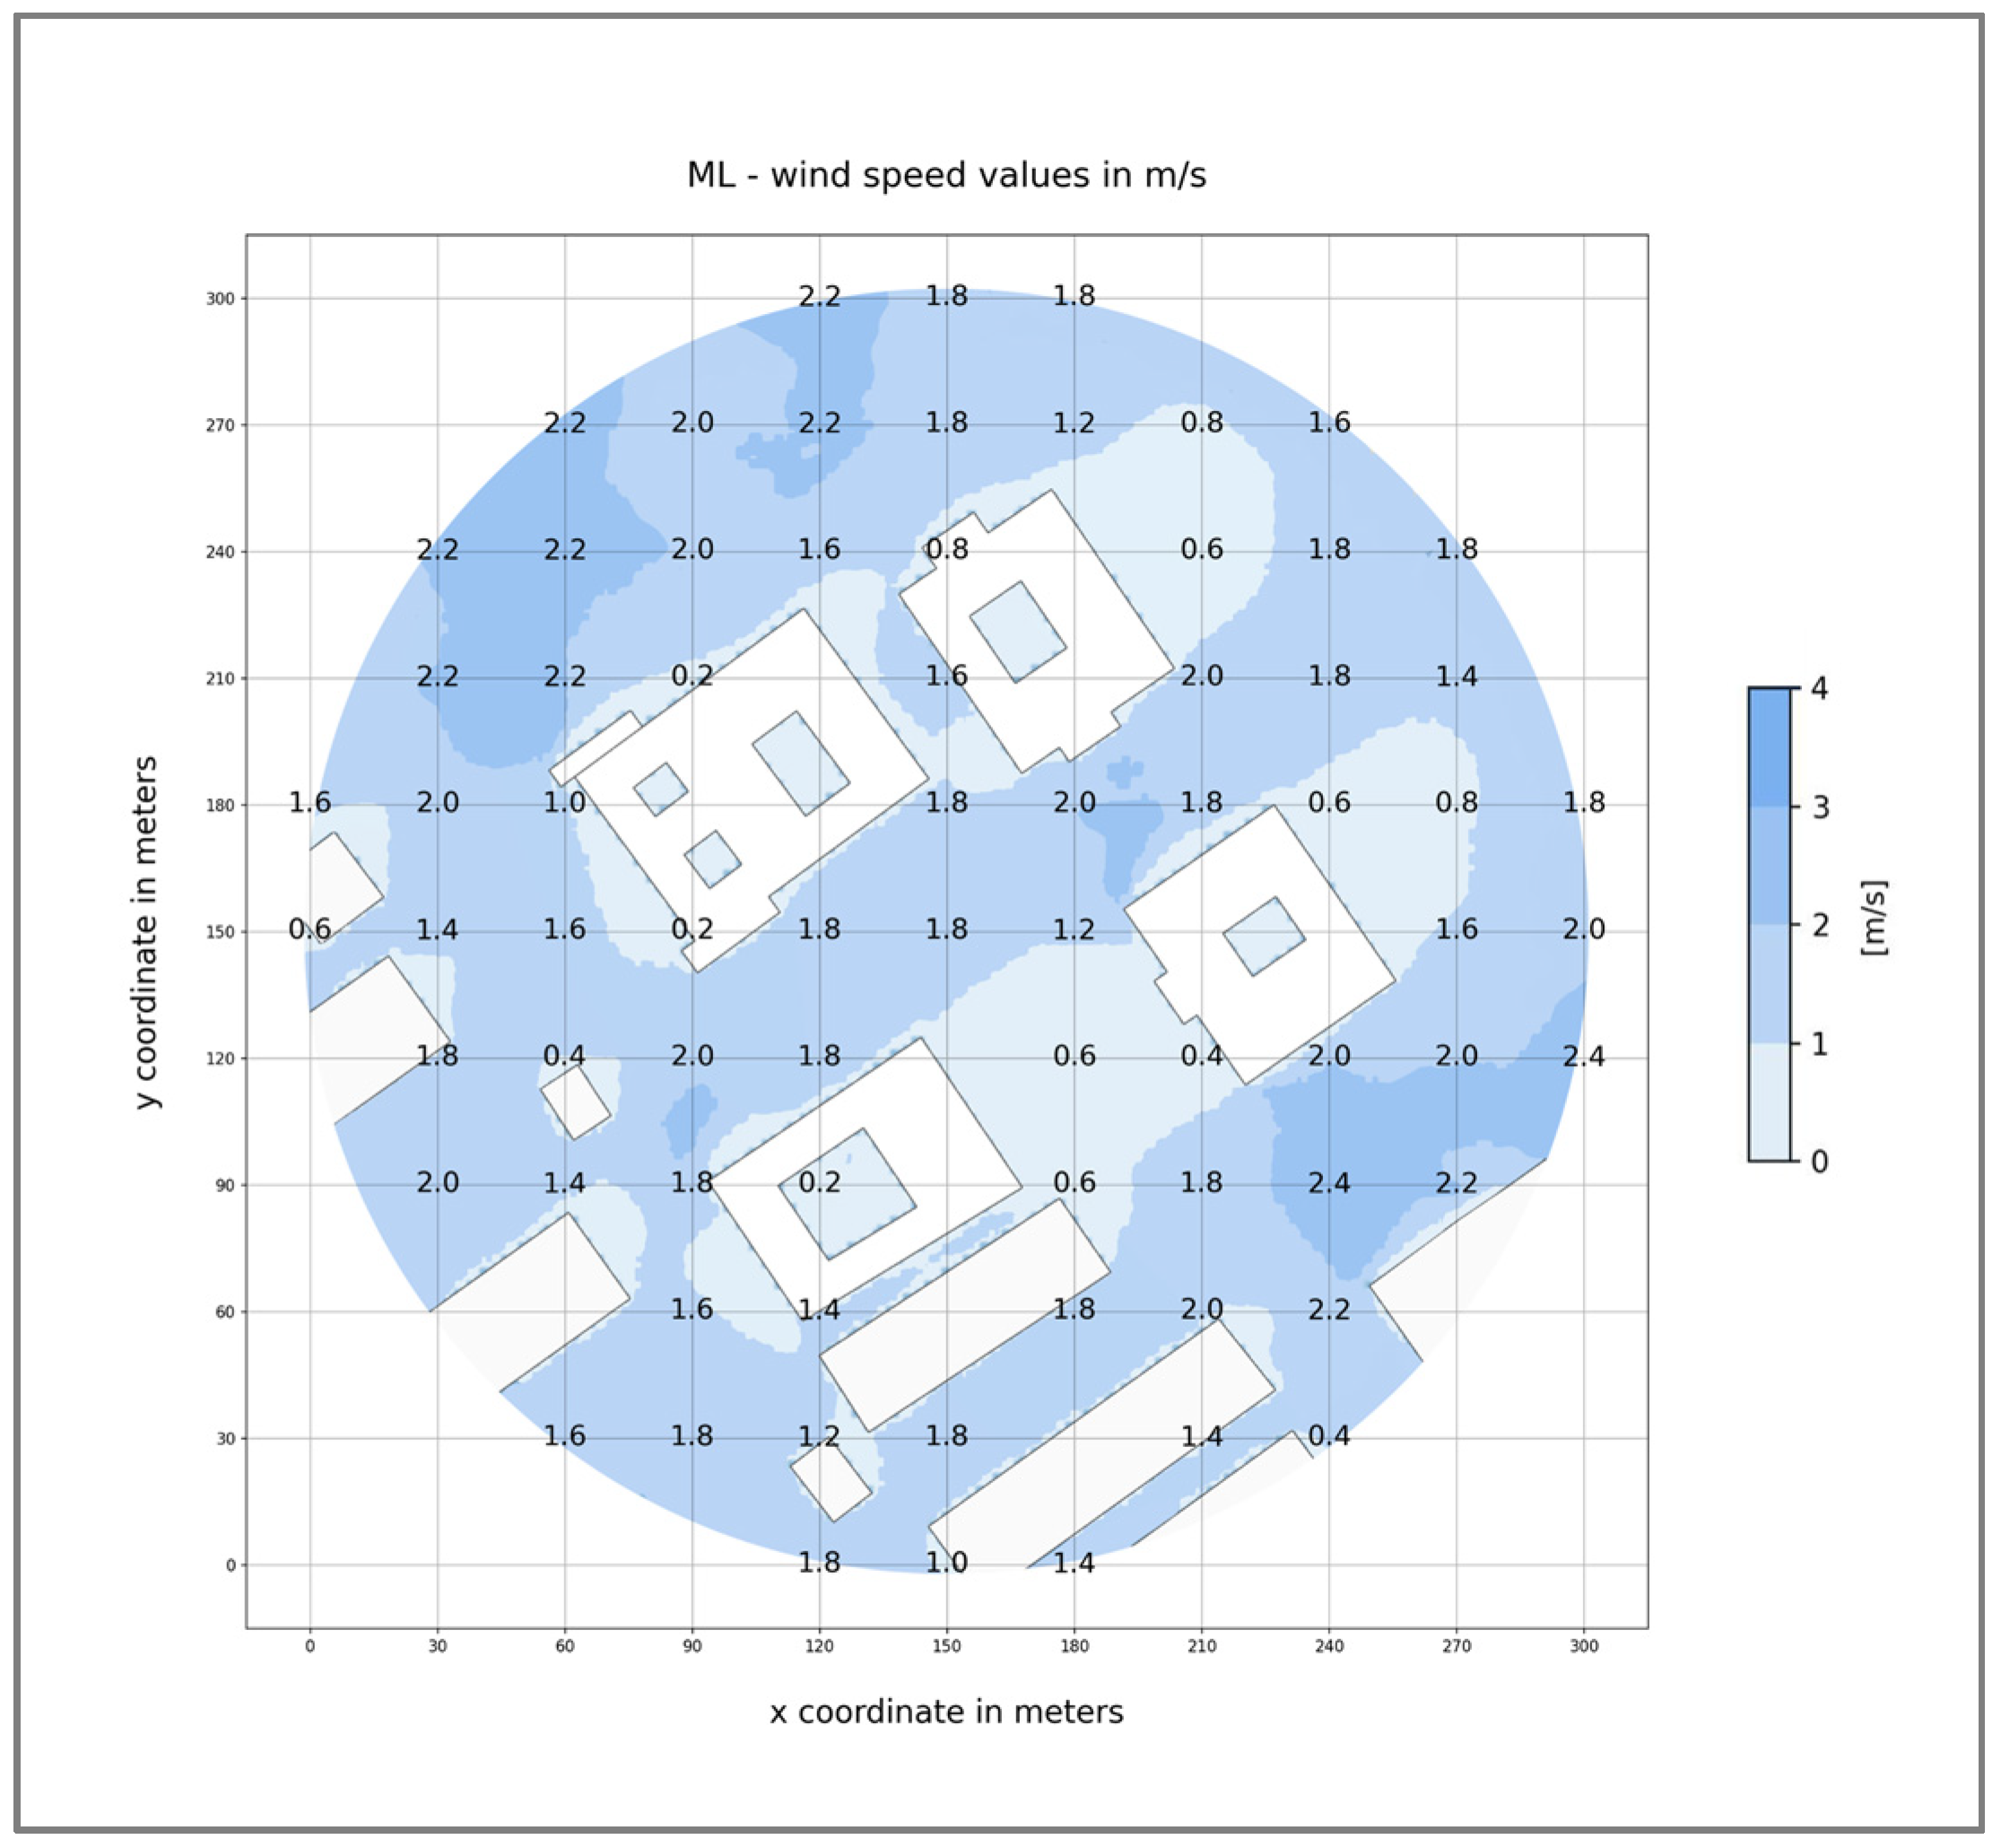
4.3. Results of the ML-Based Analysis

The ML-based analysis is designed to offer guidance during the early stages of the design process by instantly running wind simulations. These simulations predict changes in wind conditions influenced by various design choices. Given that these rapid results are predictive, they serve more as directional insights rather than detailed analyses found in simulation-based methods.
ML analysis was performed to obtain a quick idea of how wind conditions are impacted by the building masses in the case study area. Instant feedback makes it simple to identify regions with high and low wind speeds (Figure 9). Like the CFD results, an area with relatively high wind speeds (colored in darker shades of blue) is being seen between the Architecture Faculty and Ind. Eng. buildings. However, the wind speed values of this area are smaller than those in CFD. This may lead to the incorrect estimation of comfortable areas. However, the Venturi effect and corner acceleration are very similar to the CFD results. But there is a large uncomfortable area with high wind speeds between the Architecture and Ind. Eng. buildings, which the ML result does not fully display but is evident in the CFD study. This could suggest that the ML-based method is not sufficiently sensitive for detecting regions with significant wind speeds. It should be highlighted, though, that further research will require numerous additional comparisons to validate this.
Finally, as previously mentioned, the capability of this ML tool is restricted. There is no numerical output from Autodesk Forma; instead, it just produces an image file. For this reason, a data reading technique based on images is used to extract numerical values.

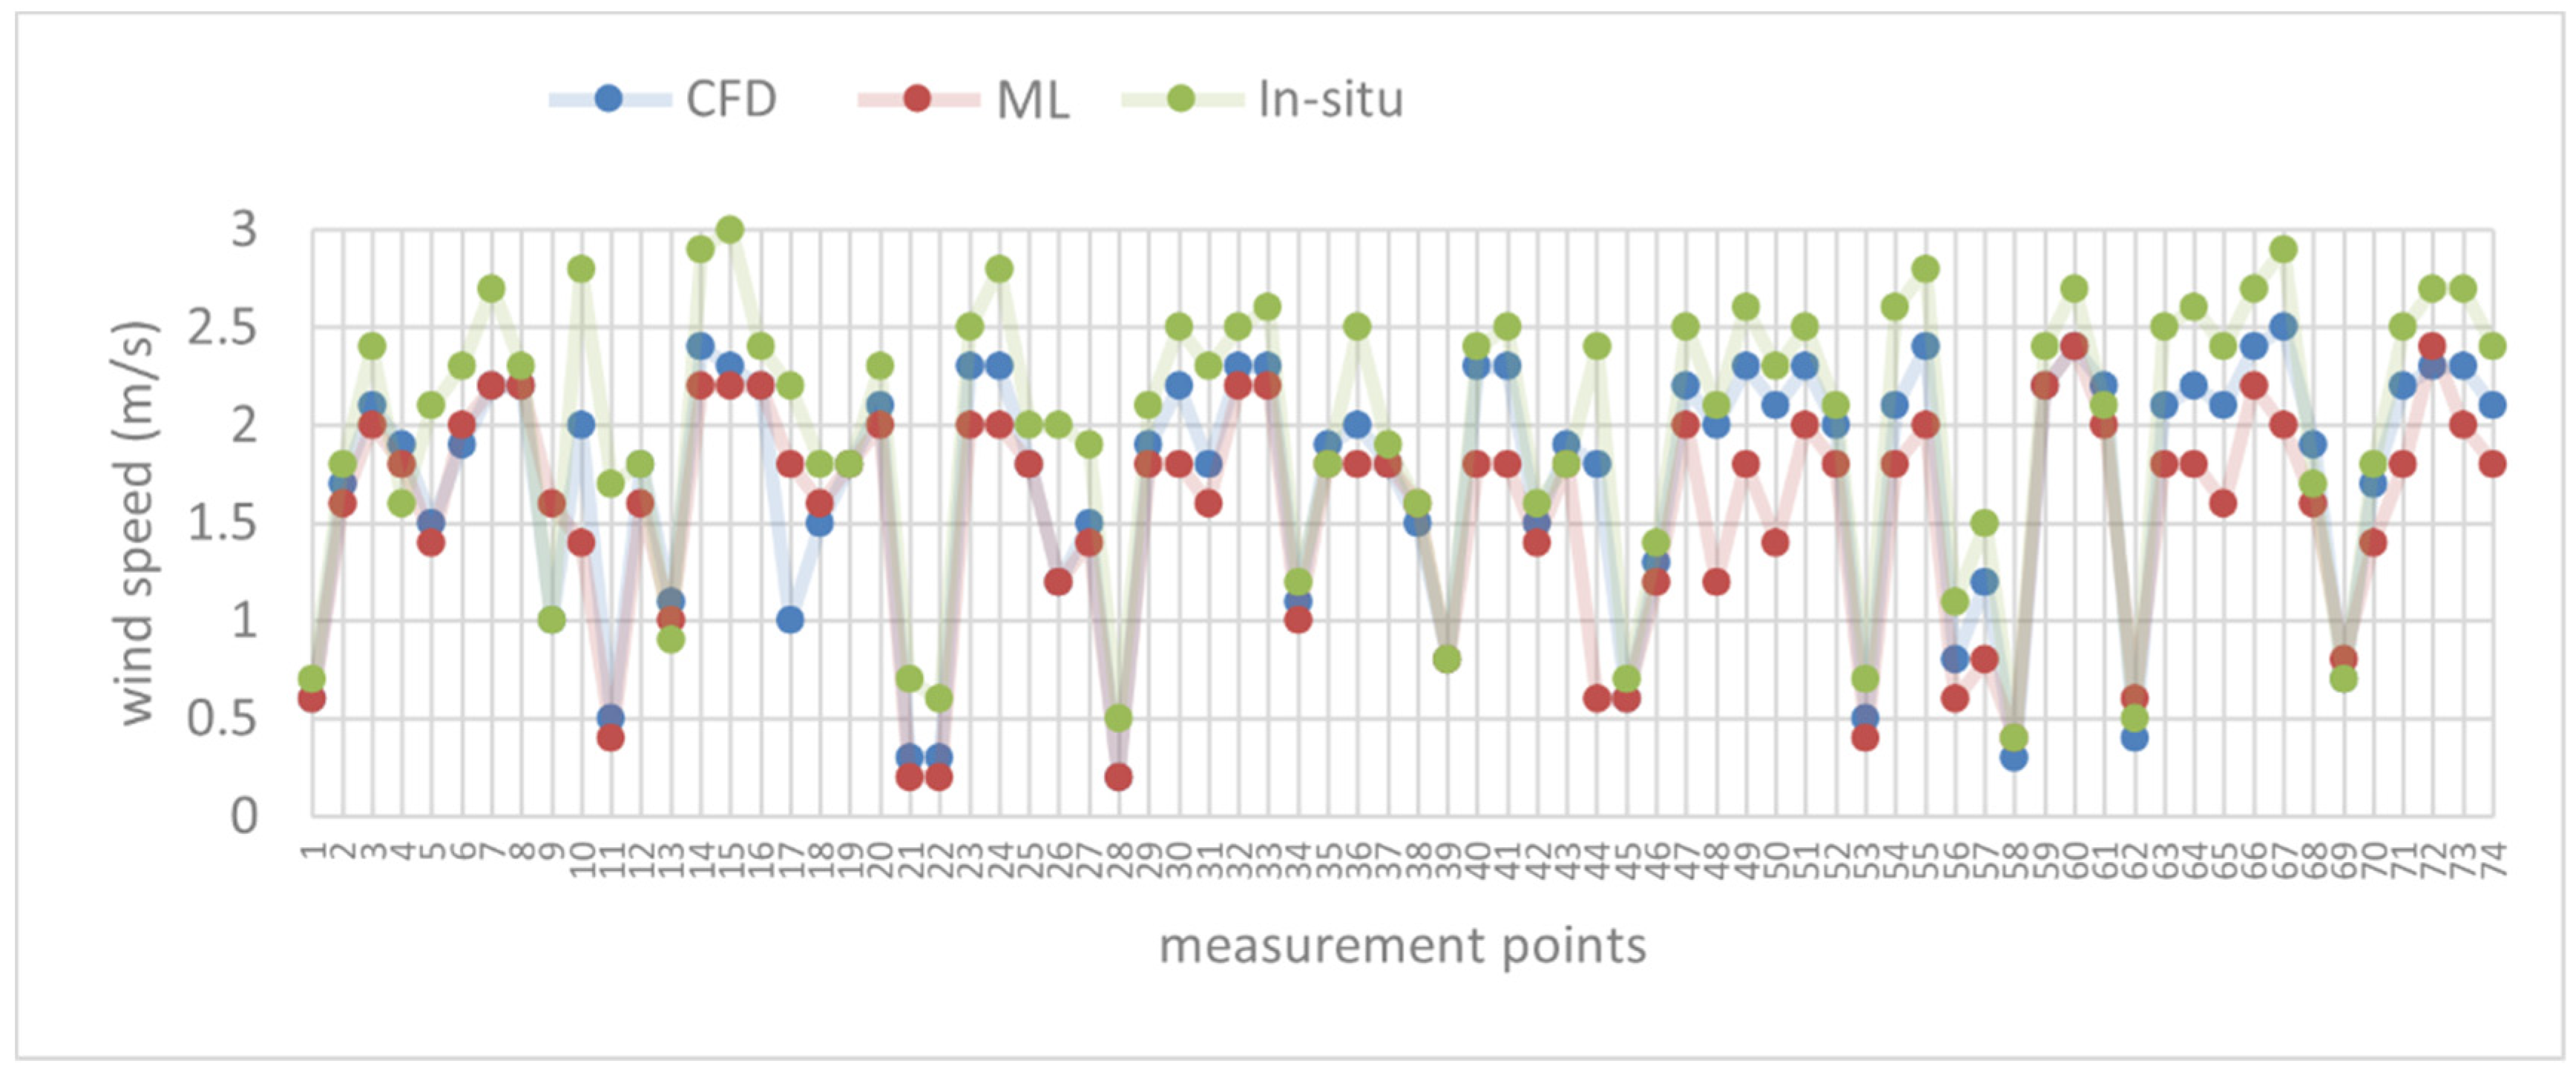
4.4. Comparison of the CFD and ML-Based Analysis with In Situ Measurements

A qualitative evaluation of the results has been provided in detail up to this section. Now, the effectiveness of the ML model and the CFD simulation is measured using several metrics for evaluation. The wind speed values from the output image of the ML model are calculated utilizing a Python-based script specified in the chapter on methodology and written by the researchers. The output of the in situ measurements is approved as the comparison point. Only wind speed graphs are included in the processed outputs of both CFD and ML-based analyses. In addition, the in situ measurements are linearly interpolated to produce a contour plot for a better understanding of the results. The comparison results in the contour plot style are shown in Figure 10.
The outputs from CFD and ML exhibit remarkable similarity with the in situ measurement. The CFD output was much closer to the in situ measurement values, while the values obtained from the ML model were relatively lower. However, the ML side results are encouraging, especially given the quick millisecond output speed, indicating a high chance of success in the initial design phase studies (Figure 11).
Lastly, a box plot was employed to compare in situ measurements with the outcomes obtained from CFD and ML techniques (Figure 12). This comparative visualization offers insights into the statistical alignment and the spread of wind speed values generated by each method. Specifically, the CFD results show a narrow interquartile range and median values that closely align with those of the in situ measurements, indicating high precision and low variability. This is expected given CFD’s physical-based modeling approach, which incorporates site-specific boundary conditions and turbulence modeling. In contrast, the ML results demonstrate a broader interquartile range and a slightly lower median, suggesting that while ML predictions are generally consistent with the overall trend of wind behavior, they tend to underestimate peak values. This is likely due to the simplified assumptions embedded in the ML model and the use of fixed training wind speeds, which limit the resolution of localized high-velocity areas.
The box plot also serves to emphasize that CFD achieves better conformity with in situ measurements, while ML offers a sufficiently accurate and computationally efficient alternative for preliminary assessments. Importantly, the figure illustrates a full-site comparison, evaluating performance not at a single location but across the entire campus, which strengthens the robustness of the findings.
The findings from this comparative analysis can be used to inform urban design decisions, particularly in the context of enhancing pedestrian wind comfort. For example, areas identified as having elevated wind speeds in both CFD and in situ measurements could benefit from interventions such as the strategic placement of vegetation, semi-permeable screens, or modifications to building geometry to deflect or diffuse airflow. Conversely, the ML-based analysis—though limited in precision—can still serve as a rapid feedback tool during the early stages of design, helping architects and planners identify potential problem zones without the need for intensive simulation setups. These insights contribute to more resilient and comfortable urban environments, especially in educational campuses and urban areas open to high-turbulent wind conditions.

5. Discussion and Limitations

This study provides valuable insights into the effects of wind comfort around urban buildings, emphasizing the importance of comprehensive wind assessment in urban planning. It is crucial, however, to acknowledge the limitations that accompany our findings. One primary limitation involves the seasonal restriction of our in situ measurements to only the winter months. Due to logistical constraints, this choice may affect the generalizability of our results to other seasons, which might exhibit different wind patterns. To address this limitation, we supplemented our direct measurements with extensive historical data from the Turkish Meteorological Organization. This addition provides a multi-year perspective, helping to validate our observations and analyses based on winter-only measurements.
Another notable limitation is the relatively brief duration of each in situ measurement session. The inherent variability of wind suggests that longer measurement periods might capture a more representative range of conditions. To strengthen future research, it would be beneficial to extend the duration and frequency of the measurements, ideally across different seasons, to enhance the robustness and applicability of the data. Moreover, as mentioned before, the ML analyses were conducted using Autodesk Forma, a tool that simplifies the simulation of wind effects in urban environments. While Autodesk Forma enables rapid visualization and preliminary assessments, it inherently lacks the flexibility to adjust the underlying ML algorithms or to comprehensively model the variability of wind speeds and the detailed aerodynamics influenced by complex urban geometries. This limitation is significant as it constrains this study to a predefined set of parameters and capabilities dictated by the software.
Lastly, while this study provides insights into the mean wind speeds in an urban setting, we must acknowledge a significant limitation in our analysis, the exclusion of detailed turbulence metrics. Due to the constraints at the time of our data collection and the analytical tools available, our study could not encompass the turbulent aspects of the wind fields, which are useful for a comprehensive understanding of urban wind behavior. Future studies may aim to incorporate measurements of turbulence intensity to provide a more complete illustration of the wind dynamics influenced by urban environments.

6. Conclusions

This study explores the integration of computational fluid dynamics (CFD) and ML for assessing pedestrian-level wind speeds in an educational campus environment, aiming to address the lack of comparative studies between data-driven predictions and simulation-based modeling. The findings confirm that CFD simulations demonstrate strong alignment with in situ measurements, reinforcing their established credibility for accurate environmental analysis. Meanwhile, ML-based results, though slightly underestimating wind speeds, produced a remarkably similar trend to CFD and in situ data, suggesting that ML holds strong potential for rapid assessments during the early stages of urban design. These results are particularly important for early decision-making processes, where quick yet informed estimations can significantly streamline urban comfort evaluations.
A key innovation of this work lies in the development of a novel image-processing technique that enables the extraction of numerical wind speed data from visual-only outputs generated by black-box ML models. By leveraging alpha channel filtering to isolate and quantify relevant data, this method improves the comparability of ML-generated outputs with conventional CFD results, despite the absence of raw numerical data. This methodological advancement significantly enhances the reliability and applicability of commercial ML tools in practical urban planning scenarios, especially when numerical precision is needed but direct output is unavailable.
This study demonstrates that ML tools, while currently limited in terms of transparency and customizability, can offer significant value in design workflows that prioritize speed and accessibility. Their use is especially advantageous in large-scale preliminary studies where high-resolution CFD simulations may not be feasible. Moreover, the ability to generate fast feedback loops can aid iterative design processes and support more responsive environmental planning. Nonetheless, minor deviations between ML, CFD, and field data highlight the need for cautious interpretation, especially in highly regulated urban zones.
Future efforts should focus on expanding the functionality of ML tools to include direct numerical outputs and refining model sensitivity to site-specific parameters. Further application of the image-based comparison technique across different case studies and climatic contexts will be essential to validate its broader relevance and improve the integration of ML-driven modeling in architectural and urban design practices. Strengthening this methodological foundation can lead to more accurate and adaptable ML-based environmental assessment tools, bridging the gap between simulation accuracy and design efficiency.

Author Contributions

Conceptualization, I.K. and M.G.; methodology, I.K. and M.G.; software, I.K. and M.G.; validation, I.K. and M.G.; writing—review and editing, I.K. and M.G. All authors have read and agreed to the published version of the manuscript.

Funding

This research received no external funding.

Data Availability Statement

All research data supporting the findings of this article are included within the article itself. No additional datasets were generated or analyzed beyond those presented in the manuscript.

Conflicts of Interest

The authors declare no conflicts of interest.

Abbreviations

The following abbreviations are used in this manuscript:
AIJArchitectural Institute of Japan
ANNsArtificial Neural Networks
CFDComputational fluid dynamics
CoLCity of London
COSTEuropean Cooperation in Science and Technology
DLDeep learning
FNNFeedforward Neural Network
GANsGenerative Adversarial Networks
GISGeographic Information System
KNNsk-Nearest Neighbors
MLMachine learning
NARNon-Autoregressive
NARXNonlinear Autoregressive with eXogenous Inputs
NNNNearest Neighbor Network
RBFNNRadial Basis Function Neural Network
SFGANSpatial-Frequency Generative Adversarial Network
U-NetU-shaped Convolutional Neural Network

References

  1. Chen, Q. Using Computational Tools to Factor Wind into Architectural Environment Design. Energy Build. 2004, 36, 1197–1209. [Google Scholar] [CrossRef]
  2. Carrilho da Graça, G.; Linden, P. Ten Questions About Natural Ventilation of Non-Domestic Buildings. Build. Environ. 2016, 107, 263–273. [Google Scholar] [CrossRef]
  3. Zhang, R.; Liu, D.; Shi, L. Thermal-Comfort Optimization Design Method for Semi-Outdoor Stadium Using Machine Learning. Build. Environ. 2022, 215, 108890. [Google Scholar] [CrossRef]
  4. Tablada, A.; Blocken, B.; Carmeliet, J.; Zurich, E.; Troyer, F.; Verschure, H. The Influence of Courtyard Geometry on Air Flow and Thermal Comfort: CFD and Thermal Comfort Simulations. In Proceedings of the 22nd Conference on Passive and Low Energy Architecture, Beirut, Lebanon, 13–16 November 2005. [Google Scholar]
  5. Ngarambe, J.; Yun, G.Y.; Santamouris, M. The Use of Artificial Intelligence (AI) Methods in the Prediction of Thermal Comfort in Buildings: Energy Implications of AI-Based Thermal Comfort Controls. Energy Build. 2020, 211, 109807. [Google Scholar] [CrossRef]
  6. Gençer, F.; Karadağ, İ. Numerical Evaluation of Pedestrian-Level Wind and Indoor Thermal Comfort of a Historical Monument, Muğla, Türkiye; Open House International: Fairfiled, CA, USA, 2022; Volume 47. [Google Scholar]
  7. Eslamirad, N.; Luca, F.; Sakari Lylykangas, K.; Ben Yahia, S. Data Generative Machine Learning Model for the Assessment of Outdoor Thermal and Wind Comfort in a Northern Urban Environment. Front. Archit. Res. 2023, 12, 541–555. [Google Scholar] [CrossRef]
  8. Kastner, P.; Dogan, T. Eddy3D: A Toolkit for Decoupled Outdoor Thermal Comfort Simulations in Urban Areas. Build. Environ. 2022, 212, 108639. [Google Scholar] [CrossRef]
  9. Gülmüş, S.; Alaçam, S.; Güzelci, O.Z. Harran Earthen Houses as a Precedent for Environmental Comfort. J. Cult. Herit. Manag. Sustain. Dev. 2024. ahead-of-print. [Google Scholar] [CrossRef]
  10. Young, E.; Kastner, P.; Dogan, T.; Chokhachian, A.; Mokhtar, S.; Reinhart, C. Modeling Outdoor Thermal Comfort along Cycling Routes at Varying Levels of Physical Accuracy to Predict Bike Ridership in Cambridge, MA. Build. Environ. 2022, 208, 108577. [Google Scholar] [CrossRef]
  11. Willemsen, E.; Wisse, J.A. Design for Wind Comfort in The Netherlands: Procedures, Criteria and Open Research Issues. J. Wind Eng. Ind. Aerodyn. 2007, 95, 1541–1550. [Google Scholar] [CrossRef]
  12. Urban Design and Landscape Architecture Planning and Development Services; RWDI. UDLAPDS Pedestrian Level Wind Study Terms of Reference Guide; Urban Design and Landscape Architecture Planning and Development Services: Niagara Falls, ON, Canada, 2023. [Google Scholar]
  13. Zhang, X.; Tse, K.T.; Weerasuriya, A.U.; Li, S.W.; Kwok, K.C.S.; Mak, C.M.; Niu, J.; Lin, Z. Evaluation of Pedestrian Wind Comfort near ‘Lift-up’ Buildings with Different Aspect Ratios and Central Core Modifications. Build. Environ. 2017, 124, 245–257. [Google Scholar] [CrossRef]
  14. Mittal, H.; Sharma, A.; Gairola, A. A Review on the Study of Urban Wind at the Pedestrian Level around Buildings. J. Build. Eng. 2018, 18, 154–163. [Google Scholar] [CrossRef]
  15. Mazauric, L.; Demers, C.M.; Potvin, A. Climate Form Finding for Architectural Inhabitability. Ambiances 2018, 4, 1–29. [Google Scholar] [CrossRef]
  16. Gao, H.; Hu, G.; Zhang, D.; Jiang, W.; Tse, K.T.; Kwok, K.C.S.; Kareem, A. Urban Wind Field Prediction Based on Sparse Sensors and Physics-Informed Graph-Assisted Auto-Encoder. Comput.-Aided Civ. Infrastruct. Eng. 2024, 39, 1409–1430. [Google Scholar] [CrossRef]
  17. He, Y.; Liu, Z.; Ng, E. Parametrization of Irregularity of Urban Morphologies for Designing Better Pedestrian Wind Environment in High-Density Cities—A Wind Tunnel Study. Build. Environ. 2022, 226, 109692. [Google Scholar] [CrossRef]
  18. Zaki, S.A.; Azid, N.S.; Shahidan, M.F.; Hassan, M.Z.; Md Daud, M.Y.; Abu Bakar, N.A.; Ali, M.S.M.; Yakub, F. Analysis of Urban Morphological Effect on the Microclimate of the Urban Residential Area of Kampung Baru in Kuala Lumpur Using a Geospatial Approach. Sustainability 2020, 12, 7301. [Google Scholar] [CrossRef]
  19. Gao, Y.; Yao, R.; Li, B.; Turkbeyler, E.; Luo, Q.; Short, A. Field Studies on the Effect of Built Forms on Urban Wind Environments. Renew Energy 2012, 46, 148–154. [Google Scholar] [CrossRef]
  20. Murakami, S.; Zeng, J.; Hayashi, T. CFD Analysis of Wind Environment around a Human Body. J. Wind Eng. Ind. Aerodyn. 1999, 83, 393–408. [Google Scholar] [CrossRef]
  21. Kabošová, L.; Chronis, A.; Galanos, T. Fast Wind Prediction Incorporated in Urban City Planning. Int. J. Archit. Comput. 2022, 20, 511–527. [Google Scholar] [CrossRef]
  22. Knipe, W.; Petersen, N. Pedestrian Level Wind Study; Gradient Wind Engineering Inc.: Toronto, ON, Canada, 2023. [Google Scholar]
  23. Terry, E.Q.X. Wind Design in Smart Cities. Landsc. Archit. 2020, 27, 64–70. [Google Scholar]
  24. Zhang, A.; Gao, C.; Zhang, L. Numerical Simulation of the Wind Field around Different Building Arrangements. J. Wind Eng. Ind. Aerodyn. 2005, 93, 891–904. [Google Scholar] [CrossRef]
  25. Blocken, B.; Persoon, J. Pedestrian Wind Comfort around a Large Football Stadium in an Urban Environment: CFD Simulation, Validation and Application of the New Dutch Wind Nuisance Standard. J. Wind Eng. Ind. Aerodyn. 2009, 97, 255–270. [Google Scholar] [CrossRef]
  26. Blocken, B.; Janssen, W.D.; van Hooff, T. CFD Simulation for Pedestrian Wind Comfort and Wind Safety in Urban Areas: General Decision Framework and Case Study for the Eindhoven University Campus. Environ. Model. Softw. 2012, 30, 15–34. [Google Scholar] [CrossRef]
  27. Montazeri, H.; Blocken, B.; Janssen, W.D.; van Hooff, T. CFD Evaluation of New Second-Skin Facade Concept for Wind Comfort on Building Balconies: Case Study for the Park Tower in Antwerp. Build. Environ. 2013, 68, 179–192. [Google Scholar] [CrossRef]
  28. Tang, X.; Stoevesandt, B.; Fan, B.; Li, S.; Yang, Q.; Tayjasanant, T.; Sun, Y. An On-Site Measurement Coupled CFD Based Approach for Wind Resource Assessment over Complex Terrains. In Proceedings of the IEEE Instrumentation and Measurement Society Technology Conference, Houston, TX, USA, 14–17 May 2018; pp. 1–6. [Google Scholar]
  29. Tominaga, Y.; Mochida, A.; Yoshie, R.; Kataoka, H.; Nozu, T.; Yoshikawa, M.; Shirasawa, T. AIJ Guidelines for Practical Applications of CFD to Pedestrian Wind Environment around Buildings. J. Wind Eng. Ind. Aerodyn. 2008, 96, 1749–1761. [Google Scholar] [CrossRef]
  30. Bottema, M.; Leene, J.A.; Wisse, J.A. Towards Forecasting of Wind Comfort. J. Wind Eng. Ind. Aerodyn. 1992, 44, 2365–2376. [Google Scholar] [CrossRef]
  31. Wu, H.; Kriksic, F. Designing for Pedestrian Comfort in Response to Local Climate. J. Wind Eng. Ind. Aerodyn. 2012, 104–106, 397–407. [Google Scholar] [CrossRef]
  32. Stathopoulos, T. Computational Wind Engineering: Past Achievements and Future Challenges. J. Wind Eng. Ind. Aerodyn. 1997, 67–68, 509–532. [Google Scholar] [CrossRef]
  33. Janssen, W.D.; Blocken, B.; Hooff, T. Pedestrian Wind Comfort around Buildings: Comparison of Wind Comfort Criteria Based on Whole-Flow Field Data for a Complex Case Study. Build. Environ. 2013, 59, 547–562. [Google Scholar] [CrossRef]
  34. Juan, Y.H.; Wen, C.Y.; Li, Z.; Yang, A.S. A Combined Framework of Integrating Optimized Half-Open Spaces into Buildings and an Application to a Realistic Case Study on Urban Ventilation and Air Pollutant Dispersion. J. Build. Eng. 2021, 44, 102975. [Google Scholar] [CrossRef]
  35. Murakami, S.; Ooka, R.; Mochida, A.; Yoshida, S.; Kim, S. CFD Analysis of Wind Climate from Human Scale to Urban Scale. J. Wind Eng. Ind. Aerodyn. 1999, 81, 57–81. [Google Scholar] [CrossRef]
  36. Yoshie, R.; Mochida, A.; Tominaga, Y.; Kataoka, H.; Harimoto, K.; Nozu, T.; Shirasawa, T. Cooperative Project for CFD Prediction of Pedestrian Wind Environment in the Architectural Institute of Japan. J. Wind Eng. Ind. Aerodyn. 2007, 95, 1551–1578. [Google Scholar] [CrossRef]
  37. Blocken, B.; Roels, S.; Carmeliet, J. Modification of Pedestrian Wind Comfort in the Silvertop Tower Passages by an Automatic Control System. J. Wind Eng. Ind. Aerodyn. 2004, 92, 849–873. [Google Scholar] [CrossRef]
  38. Liu, J.; Niu, J. CFD Simulation of the Wind Environment around an Isolated High-Rise Building: An Evaluation of SRANS, LES and DES Models. Build Environ. 2016, 96, 91–106. [Google Scholar] [CrossRef]
  39. Karadağ, İ.; Serteser, N. An Algorithm for Estimation of Wind-Building Interaction in the Early Design Stage; Faculty of Architecture, MEGARON/Yıldız Technical University: Istanbul, Türkiye, 2019. [Google Scholar]
  40. City of London Corporation. Wind Microclimate Guidelines; City of London Corporation: London, UK, 2019. [Google Scholar]
  41. Franke, J.; Hellsten, A.; Sclünzen, H.; Carissimo, B. Cost Action 732 in Combination with the European Science Foundation at Hamburg, Germany, 2005; European Science Foundation: Hamburg, Germany, 2007. [Google Scholar]
  42. Yan, B.W.; Li, Q.S. Coupled On-Site Measurement/CFD Based Approach for High-Resolution Wind Resource Assessment over Complex Terrains. Energy Convers. Manag. 2016, 117, 351–366. [Google Scholar] [CrossRef]
  43. Wang, Z.J.; Fidkowski, K.; Abgrall, R.; Bassi, F.; Caraeni, D.; Cary, A.; Deconinck, H.; Hartmann, R.; Hillewaert, K.; Huynh, H.T.; et al. High-Order CFD Methods: Current Status and Perspective. Int. J. Numer. Methods Fluids 2013, 72, 811–845. [Google Scholar] [CrossRef]
  44. Ding, C.; Lam, K.P. Data-Driven Model for Cross Ventilation Potential in High-Density Cities Based on Coupled CFD Simulation and Machine Learning. Build. Environ. 2019, 165, 106394. [Google Scholar] [CrossRef]
  45. Liu, Y.S.; Yigitcanlar, T.; Guaralda, M.; Degirmenci, K.; Liu, A.; Kane, M. Leveraging the Opportunities of Wind for Cities through Urban Planning and Design: A PRISMA Review. Sustainability 2022, 14, 11665. [Google Scholar] [CrossRef]
  46. Tamke, M.; Nicholas, P.; Zwierzycki, M. Machine Learning for Architectural Design: Practices and Infrastructure. Int. J. Archit. Comput. 2018, 16, 123–143. [Google Scholar] [CrossRef]
  47. Karadag, I.; Güzelci, O.Z.; Alaçam, S. EDU-AI: A Twofold Machine Learning Model to Support Classroom Layout Generation. Constr. Innov. 2023, 23, 898–914. [Google Scholar] [CrossRef]
  48. Khean, N.; Fabbri, A.; Haeusler, M.H. Learning Machine Learning as an Architect, How to? Presenting and Evaluating a Grasshopper Based Platform to Teach Architecture Students Machine Learning. In Proceedings of the 36th eCAADe Conference—Volume 1, Lodz University of Technology, Lodz, Poland, 19–21 September 2018. [Google Scholar]
  49. Alaçam, S.; Karadag, I.; Zeynel Güzelci, O. Reciprocal Style and Information Transfer between Historical Istanbul Pervititch Maps and Satellite Views Using Machine Learning. Estoa 2022, 11, 71–81. [Google Scholar] [CrossRef]
  50. Güzelci, O.Z.; Alaçam, S.; Bekiroğlu, B.; Karadag, I. A Machine Learning-Based Prediction Model for Architectural Heritage: The Case of Domed Sinan Mosques. Digit. Appl. Archaeol. Cult. Herit. 2024, 35, e00370. [Google Scholar] [CrossRef]
  51. KURUÇAY, E.; KARADAĞ, İ. Computational Approaches in 21st Century Architectural Design: Defining Digital Representation Methods. Düzce Üniv. Bilim Teknol. Derg. 2022, 10, 1201–1217. [Google Scholar] [CrossRef]
  52. Zheng, H.; Yuan, P.F. A Generative Architectural and Urban Design Method through Artificial Neural Networks. Build. Environ. 2021, 205, 108178. [Google Scholar] [CrossRef]
  53. Su, S.; Zang, Z.; Yuan, J.; Pan, X.; Shan, M. Considering Critical Building Materials for Embodied Carbon Emissions in Buildings: A Machine Learning-Based Prediction Model and Tool. Case Stud. Constr. Mater. 2024, 20, e02887. [Google Scholar] [CrossRef]
  54. Yan, B.; Ding, W.; Jin, Z.; Zhang, L.; Wang, L.; Du, M.; Yang, Q.; He, Y. Explainable Machine Learning-Based Prediction for Aerodynamic Interference of a Low-Rise Building on a High-Rise Building. J. Build. Eng. 2024, 82, 108285. [Google Scholar] [CrossRef]
  55. Kastner, P.; Dogan, T. A GAN-Based Surrogate Model for Instantaneous Urban Wind Flow Prediction. Build. Environ. 2023, 242, 110384. [Google Scholar] [CrossRef]
  56. Gür, M.; Karadag, I. Machine Learning for Pedestrian-Level Wind Comfort Analysis. Buildings 2024, 14, 1845. [Google Scholar] [CrossRef]
  57. Low, S.J.; Venugopalan; Raghavan, S.G.; Gopalan, H.; Wong, J.C.; Yeoh, J.; Ooi, C.C. FastFlow: AI for Fast Urban Wind Velocity Prediction. In Proceedings of the 2022 IEEE International Conference on Data Mining Workshops (ICDMW), Orlando, FL, USA, 8 February 2023. [Google Scholar]
  58. Blocken, B.; Stathopoulos, T.; van Beeck, J.P.A.J. Pedestrian-Level Wind Conditions around Buildings: Review of Wind-Tunnel and CFD Techniques and Their Accuracy for Wind Comfort Assessment. Build. Environ. 2016, 100, 50–81. [Google Scholar] [CrossRef]
  59. Wind Comfort Analysis. Available online: https://orbitalstack.com/ai-powered-wind-simulations/ (accessed on 15 March 2025).
  60. Chronis, A.; Aichinger, A.; Duering, S.; Galanos, T.; Fink, T.; Vesely, O. Infrared an Intelligent Framework for Resilient Design. In Proceedings of the International Conference of the Association for Computer-Aided Architectural Design Research in Asia (CAADRIA), Bangkok, Thailand, 5–6 August 2020. [Google Scholar]
  61. Khosravi, A.; Koury, R.N.N.; Machado, L.; Pabon, J.J.G. Prediction of Wind Speed and Wind Direction Using Artificial Neural Network, Support Vector Regression and Adaptive Neuro-Fuzzy Inference System. Sustain. Energy Technol. Assess. 2018, 25, 146–160. [Google Scholar] [CrossRef]
  62. Blanchard, T.; Samanta, B. Wind Speed Forecasting Using Neural Networks. Wind Eng. 2020, 44, 33–48. [Google Scholar] [CrossRef]
  63. Takhmasib, M.; Lee, H.J.; Yi, H. Machine-Learned Kinetic Façade: Construction and Artificial Intelligence Enabled Predictive Control for Visual Comfort. Autom. Constr. 2023, 156, 105093. [Google Scholar] [CrossRef]
  64. Zhang, A.; Zhang, L. RBF Neural Networks for the Prediction of Building Interference Effects. Comput. Struct. 2004, 82, 2333–2339. [Google Scholar] [CrossRef]
  65. Park, H.; Park, D.Y. Comparative Analysis on Predictability of Natural Ventilation Rate Based on Machine Learning Algorithms. Build. Environ. 2021, 195, 107744. [Google Scholar] [CrossRef]
  66. BenMoshe, N.; Fattal, E.; Leitl, B.; Arav, Y. Using Machine Learning to Predict Wind Flow in Urban Areas. Atmosphere 2023, 14, 990. [Google Scholar] [CrossRef]
  67. Dongmei, H.; Shiqing, H.; Xuhui, H.; Xue, Z. Prediction of Wind Loads on High-Rise Building Using a BP Neural Network Combined with POD. J. Wind Eng. Ind. Aerodyn. 2017, 170, 1–17. [Google Scholar] [CrossRef]
  68. Tian, J.; Gurley, K.R.; Diaz, M.T.; Fernández-Cabán, P.L.; Masters, F.J.; Fang, R. Low-Rise Gable Roof Buildings Pressure Prediction Using Deep Neural Networks. J. Wind Eng. Ind. Aerodyn. 2020, 196, 104026. [Google Scholar] [CrossRef]
  69. Fu, D.Q.; Zhu, B.Z.; Zhu, H.L.; Zhang, H.X.; Xie, Y.H.; Jiang, W.B.; Zhao, X.D.; Luo, Y.B. Prediction of Wind Loads on a Large Flat Roof Using Fuzzy Neural Networks. Eng. Struct. 2006, 28, 153–161. [Google Scholar] [CrossRef]
  70. Duering, S.; Chronis, A.; Koenig, R. Optimizing Urban Systems: Integrated Optimization of Spatial Configurations. In Proceedings of the SimAUD (Symposium on Simulation in Architecture Urban Design), Online, 25–27 May 2020; pp. 503–509. [Google Scholar]
  71. English, E.C.; Fricke, F.R. The Interference Index and Its Prediction Using a Neural Network Analysis of Wind-Tunnel Data. J. Wind Eng. Ind. Aerodyn. 1999, 83, 567–575. [Google Scholar] [CrossRef]
  72. Higgins, S.; Stathopoulos, T. Application of Artificial Intelligence to Urban Wind Energy. Build. Environ. 2021, 197, 107848. [Google Scholar] [CrossRef]
  73. Begam, K.M.; Deepa, S.N. Optimized Nonlinear Neural Network Architectural Models for Multistep Wind Speed Forecasting. Comput. Electr. Eng. 2019, 78, 32–49. [Google Scholar] [CrossRef]
  74. Wang, P.; Guo, M.; Cao, Y.; Hao, S.; Zhou, X.; Zhao, L. Pedestrian Wind Flow Prediction Using Spatial-Frequency Generative Adversarial Network. Build. Simul. 2023, 17, 319–334. [Google Scholar] [CrossRef]
  75. Kong, M.; Yu, M.; Liu, N.; Gao, P.; Wang, Y.; Zhang, J. Combined Gis, Cfd and Neural Network Multi-Zone Model for Urban Planning and Building Simulation. In Proceedings of the Building Simulation Conference Proceedings, San Francisco, CA, USA, 7–9 August 2017; International Building Performance Simulation Association: Britton, SD, USA, 2017; Volume 5, pp. 2392–2397. [Google Scholar]
  76. Khanduri, A.C.; Brdard, C.; Stathopoulos, T. Modelling Wind-Induced Interference Effects Using Backpropagation Neural Networks. J. Wind. Eng. Ind. Aerodyn. 1997, 72, 71–79. [Google Scholar] [CrossRef]
  77. Mortezazadeh, M.; Zou, J.; Hosseini, M.; Yang, S.; Wang, L. Estimating Urban Wind Speeds and Wind Power Potentials Based on Machine Learning with City Fast Fluid Dynamics Training Data. Atmosphere 2022, 13, 214. [Google Scholar] [CrossRef]
  78. Demolli, H.; Dokuz, A.S.; Ecemis, A.; Gokcek, M. Wind Power Forecasting Based on Daily Wind Speed Data Using Machine Learning Algorithms. Energy Convers. Manag. 2019, 198, 111823. [Google Scholar] [CrossRef]
  79. Werner, J.; Nowak, D.; Hunger, F.; Johnson, T.; Mark, A.; Gösta, A.; Edelvik, F. Predicting Wind Comfort in an Urban Area: A Comparison of a Regression- with a Classification-CNN for General Wind Rose Statistics. Mach. Learn. Knowl. Extr. 2024, 6, 98–125. [Google Scholar] [CrossRef]
  80. Kabošová, L.; Chronis, A.; Galanos, T.; Kmeť, S.; Katunský, D. Shape Optimization during Design for Improving Outdoor Wind Comfort and Solar Radiation in Cities. Build. Environ. 2022, 226, 109668. [Google Scholar] [CrossRef]
Figure 1. The case study area’s site plan (a); aerial imagery of the same area (b).
Buildings 15 01541 g001
Figure 2. Windrose of annual mean wind speed per hour (a); windrose of winter mean wind speed per hour (b) (based on weather data from the Turkish Meteorological Organization over 30 years).
Buildings 15 01541 g002
Figure 3. In situ measurement locations (a); photography of the site (b).
Buildings 15 01541 g003
Figure 4. Computational domain with meshing (a); high-resolution meshing on and around buildings (b).
Buildings 15 01541 g004
Figure 5. Wind analysis of the case study area at the pedestrian level by in situ measurement.
Buildings 15 01541 g005
Figure 6. Analysis of the case study area’s pedestrian-level wind speed using CFD software (OpenFOAM).
Buildings 15 01541 g006
Figure 7. The corner effect caused by the Faculty of Architecture Building (evaluated for the southwest wind direction by using OpenFOAM).
Buildings 15 01541 g007
Figure 8. The Venturi effect caused by buildings (evaluated for the east wind direction by using OpenFOAM).
Buildings 15 01541 g008
Figure 9. Analysis of the case study area’s pedestrian-level wind speed using an ML-based technique (the numerical values are achieved over a specialized python script developed by the authors).
Buildings 15 01541 g009
Figure 10. Comparing in situ data with CFD and ML-based analyses.
Buildings 15 01541 g010
Figure 11. Numerical comparison of the CFD and ML-based analysis with in situ measurements for every measurement point.
Buildings 15 01541 g011
Figure 12. Box plot of the comparison of the CFD and ML-based analysis, and in situ measurements across the entire study area.
Buildings 15 01541 g012
Table 1. ML-based studies of buildings, structures, and urban areas in relation to wind effects [57,62,66,67,68,69,70,71,72,73,74,75,76,77,78].
Focus AreaAuthorAim/FocusMethodologyFindings
Wind speed–wind flowBegam and Deepa (2019) [73]Forecasting wind speed with accuracyNNNThe NNN model works well for predicting wind speed.
Blanchard and Samanta (2020) [62]Predicting wind speedNAR, NARXThe NARX model performed better.
Low et al. (2023) [57]Simulations of outdoor wind speedsU-NetThe model of U-Net serves as a standard for predicting wind flow.
Wang et al. (2023) [74]Wind flow prediction for pedestriansGAN based SFGANSFGAN increases the precision of predictions.
BenMoshe et al. (2023) [66]Examine how buildings and additional aspects of cities affect wind flowTechniques such as regression using k-Nearest Neighbors (kNNs)kNN regression is the most accurate method.
Gao et al. (2024) [16]Fast urban wind field reconstruction DL modelThe DL model works well in predicting wind flow.
Wind comfortWerner et al., 2024 [79]Forecasts wind comfortU-NetWhile ML models are effective at making predictions, pedestrian safety must be improved.
Kabošová et al. (2022) [21]To optimize exposure to sun radiation and outside wind comfort, compare CFD with InFraRed InFraRedWhen making wind-related decisions, InFraRed is effective.
Kabošová et al. (2022) [80]Used InFraRed techniques to forecast wind in design Early in the design process, InFraRed can improve outdoor wind comfort.
Eslamirad et al. (2023) [7]Analyzing the connection between environmental factors and wind and thermal comfort levels ML modelML can be a trustworthy addition to CFD modeling.
Wind load-microclimate around buildingsFu et al., 2006 [69]Predicts wind loads on buildingsFNNThe FNN approach could be used to generalize the functional connection of wind loads that change with the incident direction of wind and spatial positions on the roof.
Kong et al., 2017 [75]Predicts the surrounding microclimate of buildingsGIS, CFD, and ANNA combined approach may be able to forecast microclimates.
Duering et al. (2020) [70]Integrates several simulation engines to optimize the spatial arrangement of urban systems. DLIt has been shown that DL-based estimations provide advantages in the design process.
Wind-induced interferenceKhanduri et al., 1997 [76]Investigate interference effects caused by wind on buildingsANNAn ANN technique is created to evaluate the effects of wind-induced interference on structures.
English and Fricke, 1999 [71]Quantify the effects of shielding in various geometric configurations ANNused ANN to forecast the effects of wind in urban settings.
Zhang and Zhang, 2004 [64]Assessed the impact of interference between nearby buildings ANN, RBF neural network (RBFNN)When it comes to modeling and forecasting intricate wind interference between tall buildings, RBFNN is effective.
Table 2. Summary of mesh independence study results.
Mesh TypeNumber of CellsMin Cell Size Near BuildingMax Wind Speed @ 1.75 m (m/s)Mean Wind Speed @ 1.75 m (m/s)Difference from Fine Mesh (%)
Coarse~3 million1.0 m5.202.606.8%
Medium~6 million0.75 m5.342.682.9%
Fine (used)~10 million0.50 m5.402.76-
Disclaimer/Publisher’s Note: The statements, opinions and data contained in all publications are solely those of the individual author(s) and contributor(s) and not of MDPI and/or the editor(s). MDPI and/or the editor(s) disclaim responsibility for any injury to people or property resulting from any ideas, methods, instructions or products referred to in the content.

