1. Introduction
In recent years, the impact of wind-driven rain (WDR) on building facades has become a critical area of study in the safety assessment of structural engineering [
1,
2,
3]. WDR occurs when precipitation is propelled by wind, creating complex interactions between the rain, wind, and building surfaces. This phenomenon can significantly affect the durability, safety, and overall performance of building envelopes [
4,
5,
6], highlighting the importance of architects and engineers understanding its dynamics. In particular, cities in southeastern China, northern America, and parts of northern Europe are frequently exposed to extreme rainfall coupled with high wind speeds [
2,
7,
8]. Water penetrates into building materials, along with trapped moisture, and can lead to damage from freeze–thaw cycles, material decay, and mold growth, all of which weaken structural integrity [
9,
10,
11] and pose a risk of significant economic loss. For example, Shi [
12] and Chen [
13] reported that the repair cost of building envelope failures caused by rain penetration in Shanghai during 1960–2009 could reach billions of USD. As urban environments evolve and climate change intensifies weather patterns [
14,
15,
16], the need for resilient facade designs has never been more urgent in building structures or other engineering fields, such as bifacial photovoltaic facade design [
17,
18].
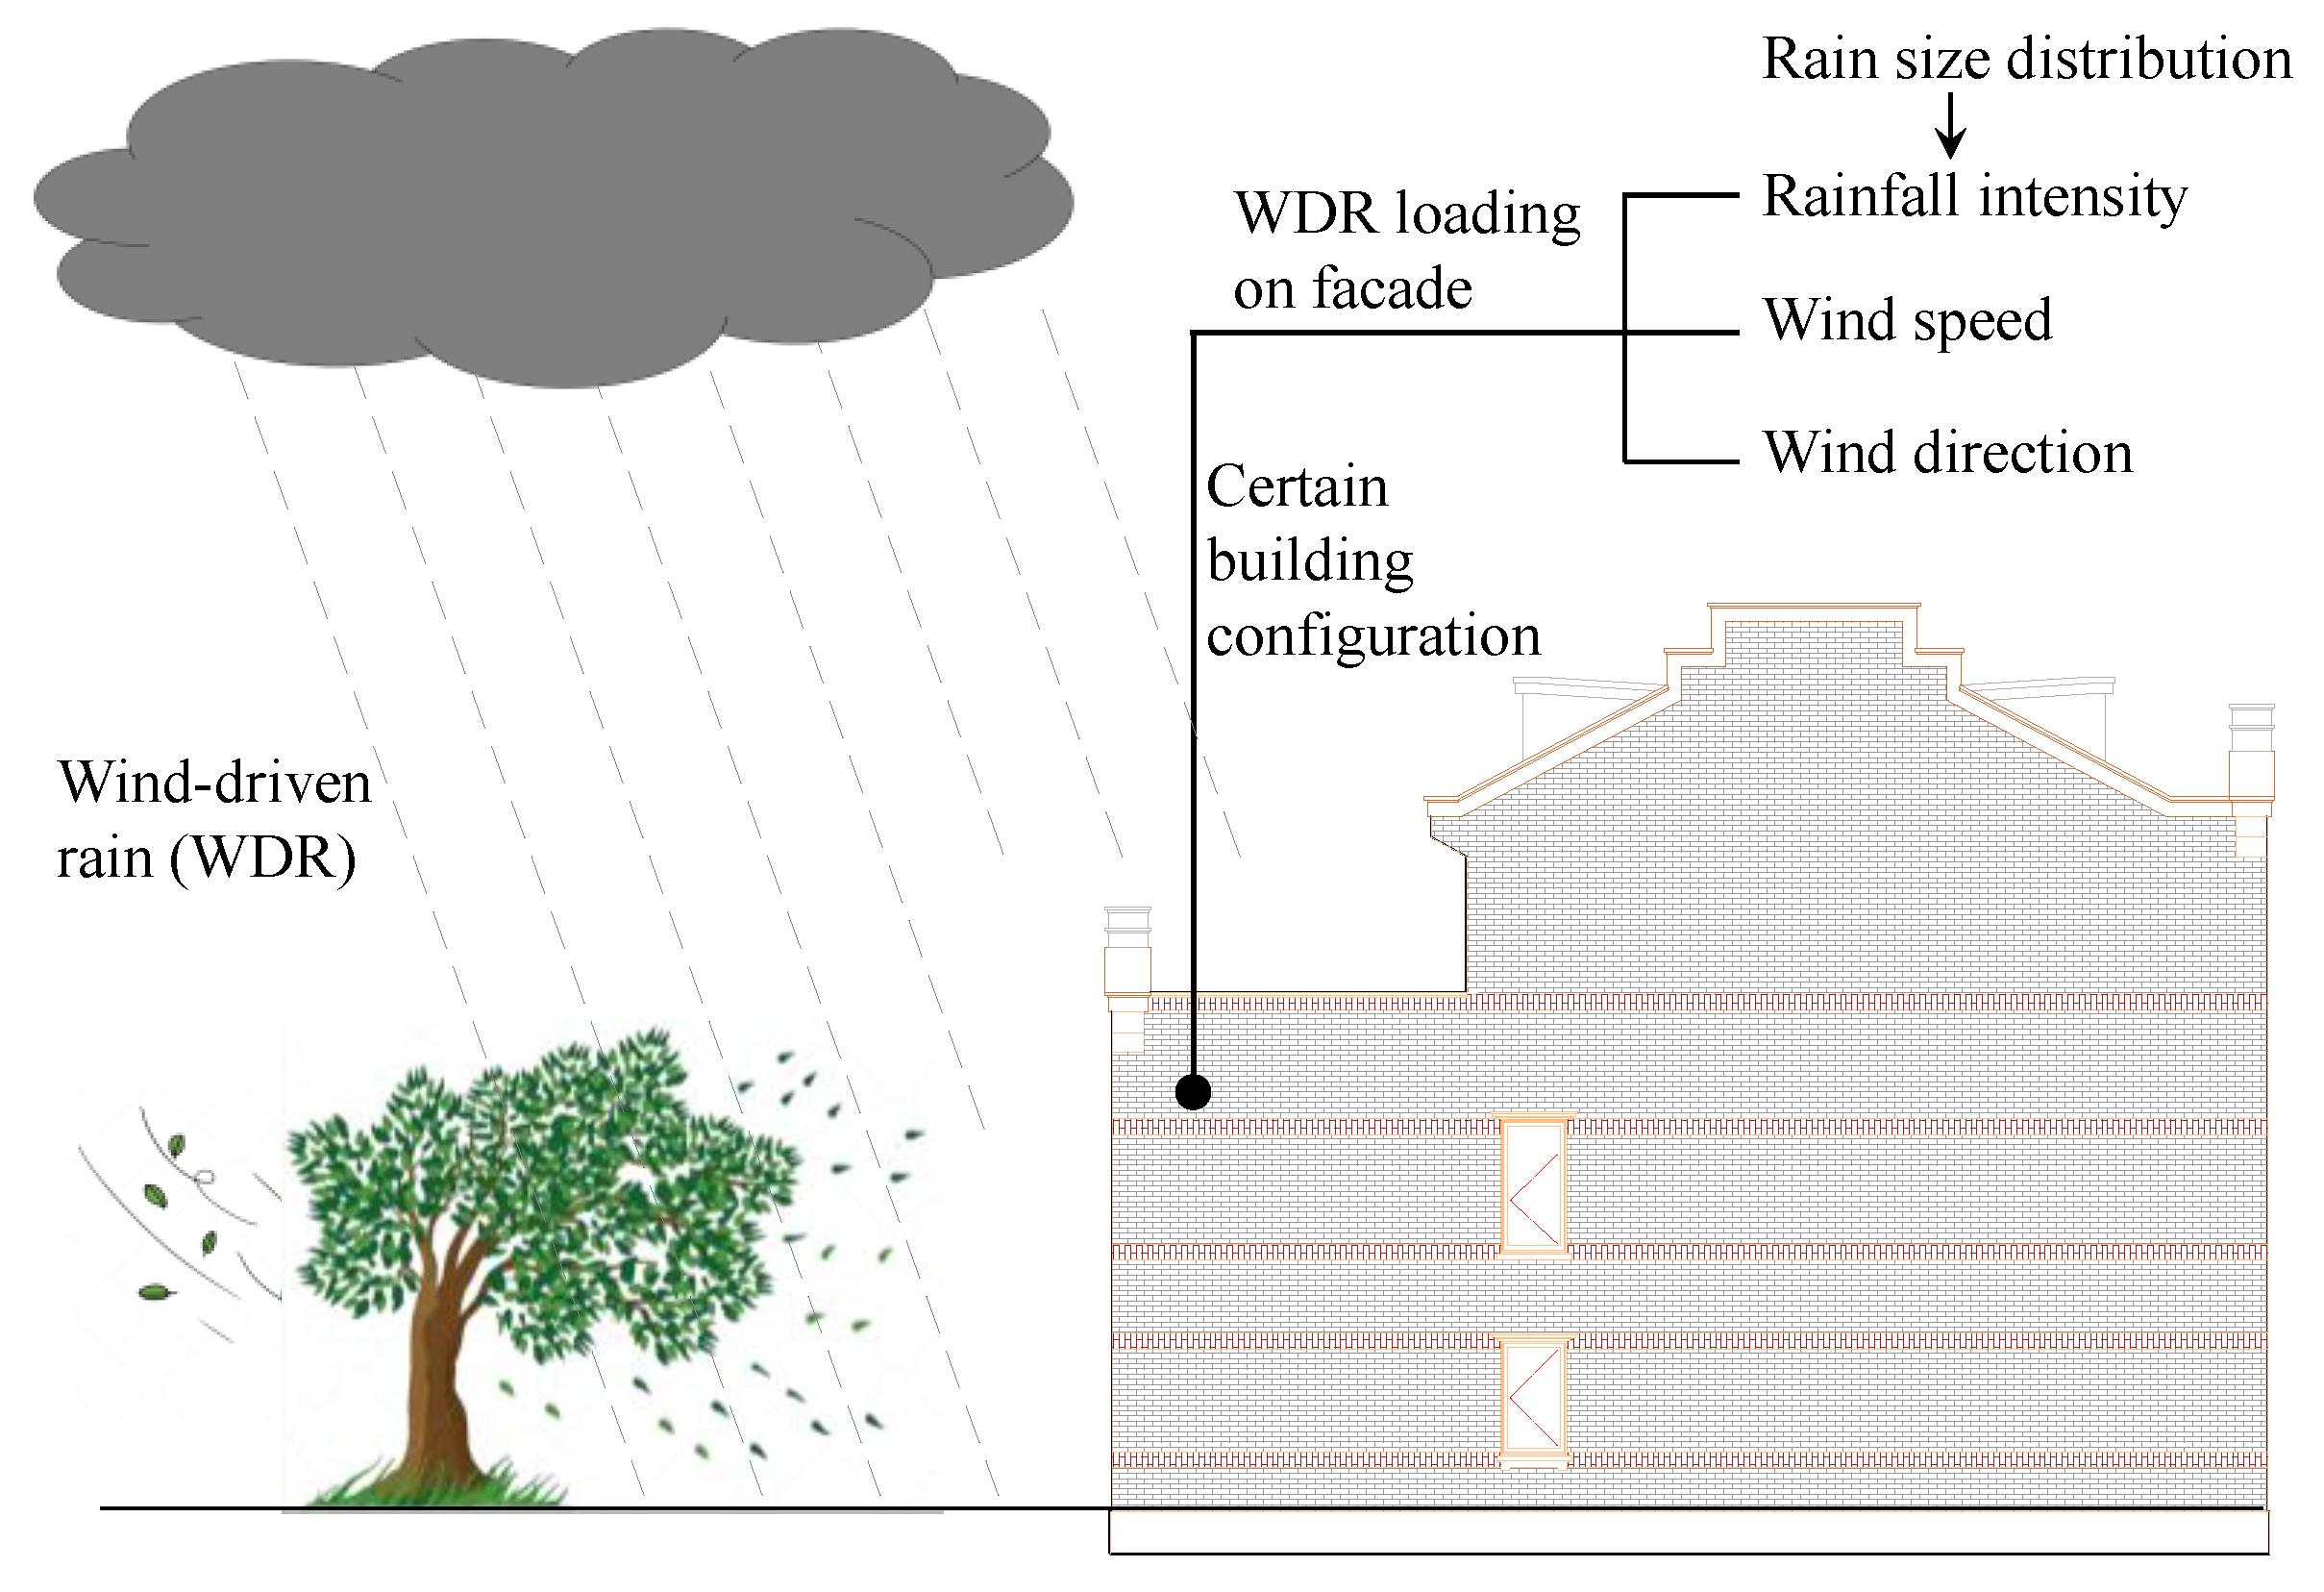
Numerous studies have been dedicated to elucidating WDR exposure worldwide; the most studied subjects have been rainfall intensity, wind speed, and wind direction coupled with different building configuration (see
Figure 1). For rainfall intensity, studies [
19,
20,
21] have shown that a higher rainfall intensity corresponds to a wider range of raindrops, and that its mode can be fitted by a modified normal distribution [
22]. For wind speed, both numerical studies [
23,
24,
25] and field measurements [
8,
26] indicate that it plays the most crucial role in WDR exposure, and such influence has been described using catch ratios [
27]. As for wind direction, due to the complexity of its interaction with different building configurations, numerical approaches, such as computational fluid dynamics (CFD) simulations [
28,
29,
30], have generally been adopted. Delicate models contribute to the analysis of wind pressure distribution under complex shapes. However, it is worthy of note that they are rather expensive and time-consuming to construct, and highly dependent on the accuracy of hypothetical meteorological parameters [
31,
32,
33].
On the other hand, in engineering practice, a watertightness test will be conducted to realize the early detection of weaknesses before the completion of a building. The test involves subjecting the exterior face of specimens to continuous water spray while applying static, cyclical, or pulsating pressure differences [
34,
35]. However, problems arise as the standard values for such tests vary across different international standards. For example, the European EN 12155 [
36] test specifies a 5 min water spray with a discharge volume of 2 mm/min, while the Chinese JGJ/T 299-2013 [
37] test specifies a pump pressure of 300–500 kPa with a spray distance of 0.3–0.5 m. Since the standardized test parameters do not correspond to the extreme conditions expected for each facade, it remains unclear how to assess facade performance in real-world scenarios. As a result, neither conventional WDR studies nor current watertightness tests facilitate a quantitative method for assessment.
To tackle this challenge, the Bayesian Performance-Based (BPB) method [
38] was proposed to establish a connection between the standardized exposure parameters employed in testing and the real-world exposure conditions of facades. In addition to specific location, height, and surroundings, this method considered the recurrence of the tested parameters (e.g., return period) for any given facade. Accordingly, this approach is commonly adopted to consider the impact of exposure duration in watertightness tests on return period estimation [
39,
40]. However, it is important to note that the BPB method still faces limitations when used for facade assessment in China [
41,
42]: (a) the challenge of acquiring the necessary records of rainfall and wind speed with comprehensive recording intervals; (b) the uncertainty in calculating return periods based on wind speed data that do not account for their simultaneous occurrence with rainfall events; and, especially, (c) the knowledge gap in the relationship between key parameters of field tests, such as pump pressure and spray distance, and the corresponding WDR exposure for facades during the standard Chinese watertightness test [
2,
43].
To address the above problem, this study makes several significant contributions to the field of building facade watertightness assessment against wind-driven rain (WDR): (a) The development of a quantitative assessment method, a method that quantitatively links key inspection parameters (pump pressure, water spray distance) to WDR characteristics (wind speed, rainfall intensity) using statistical return periods. This method bridges the gap between standardized test conditions and real-world exposure, providing a more accurate and reliable assessment of facade performance. (b) It explores the empirical relationship between test parameters and WDR exposure, including the empirical relationship between key parameters in field tests (such as pump pressure and spray distance) and the corresponding WDR pressure differential on facades during watertightness tests. This relationship was previously unknown and represents a crucial advancement in understanding how test parameters reflect real-world conditions. (c) It provides a practical implementation framework, a robust framework for translating environmental data into actionable inspection criteria. This framework enables specification-compliant performance assessment and tailored inspection protocols, directly applicable to engineering practice. Through case studies on two Shanghai buildings, it is demonstrated how the method can be implemented in real-world scenarios. The results provide valuable insights for building maintenance and renovation decisions.
2. Research Method
The research method as well as the outline of this study are arranged as below:
- (a)
Calculation of key assessment parameters:
The calculation method for key assessment parameters, such as pressure differential and rain amount on the building surface caused by WDR, were derived using climatic parameters such as wind speed and rainfall intensity. The pressure differential was calculated based on the dynamic pressure formula, considering wind speed and the angle of incidence on the building surface. The rain amount was calculated by integrating rainfall intensity over time, considering the duration and distribution of rainfall events.
- (b)
Return period calculation based on BPB method:
Based on the BPB method, where the return period is derived considering the occurrence probability of climatic parameters, the return period was calculated by analyzing the frequency and intensity of extreme weather events, such as high wind speeds and heavy rainfall, using statistical methods. This involved fitting probability distributions to historical climate data and estimating the recurrence intervals for different levels of WDR exposure.
- (c)
Analysis of weather records and regression models:
Based on the weather records, least-squares regression analysis was adopted to fit the key climatic parameters in Shanghai. The regression models were developed to correlate extreme rainfall and wind velocity values over sub-daily intervals. Additionally, an extrapolation method considering any sub-daily recording intervals and the concurrence of rainfall intensity and wind speed was investigated.
- (d)
Field tests and empirical relationships:
Through a series of water-spraying field tests, the relationship between key assessment parameters of the facade and key factors in Chinese watertightness tests, such as pump pressure and spray distance, was determined using empirical equations. The field tests were conducted at 10 m up a residential building on a clear and windless day (humidity 74%, 16–27 °C) within 8 h, thus eliminating the interference of weather factors such as wind and rain. The total flow rate was kept constant, and the pump pressure was adjusted through the opening of the pump outlet valve. Five minutes of steady drenching was performed for each test variable to fully collect test data.
- (e)
Assessment of watertightness performance:
Based on specific testing provisions, it was possible to assess whether the performance of the facade was met by identifying key factors for the watertightness test. This involved comparing the test results with the calculated return periods and determining if the facade could withstand the expected WDR conditions for the desired performance level.
- (f)
Case study implementation:
Through case studies on two Shanghai buildings, the implementation of the proposed method was demonstrated. The case studies included detailed descriptions of the buildings, the data collection process, the application of the assessment method, and the results obtained. The results provide valuable insights for building maintenance and renovation decisions, showing how the method can be applied in real-world scenarios to improve facade design and regulatory compliance.
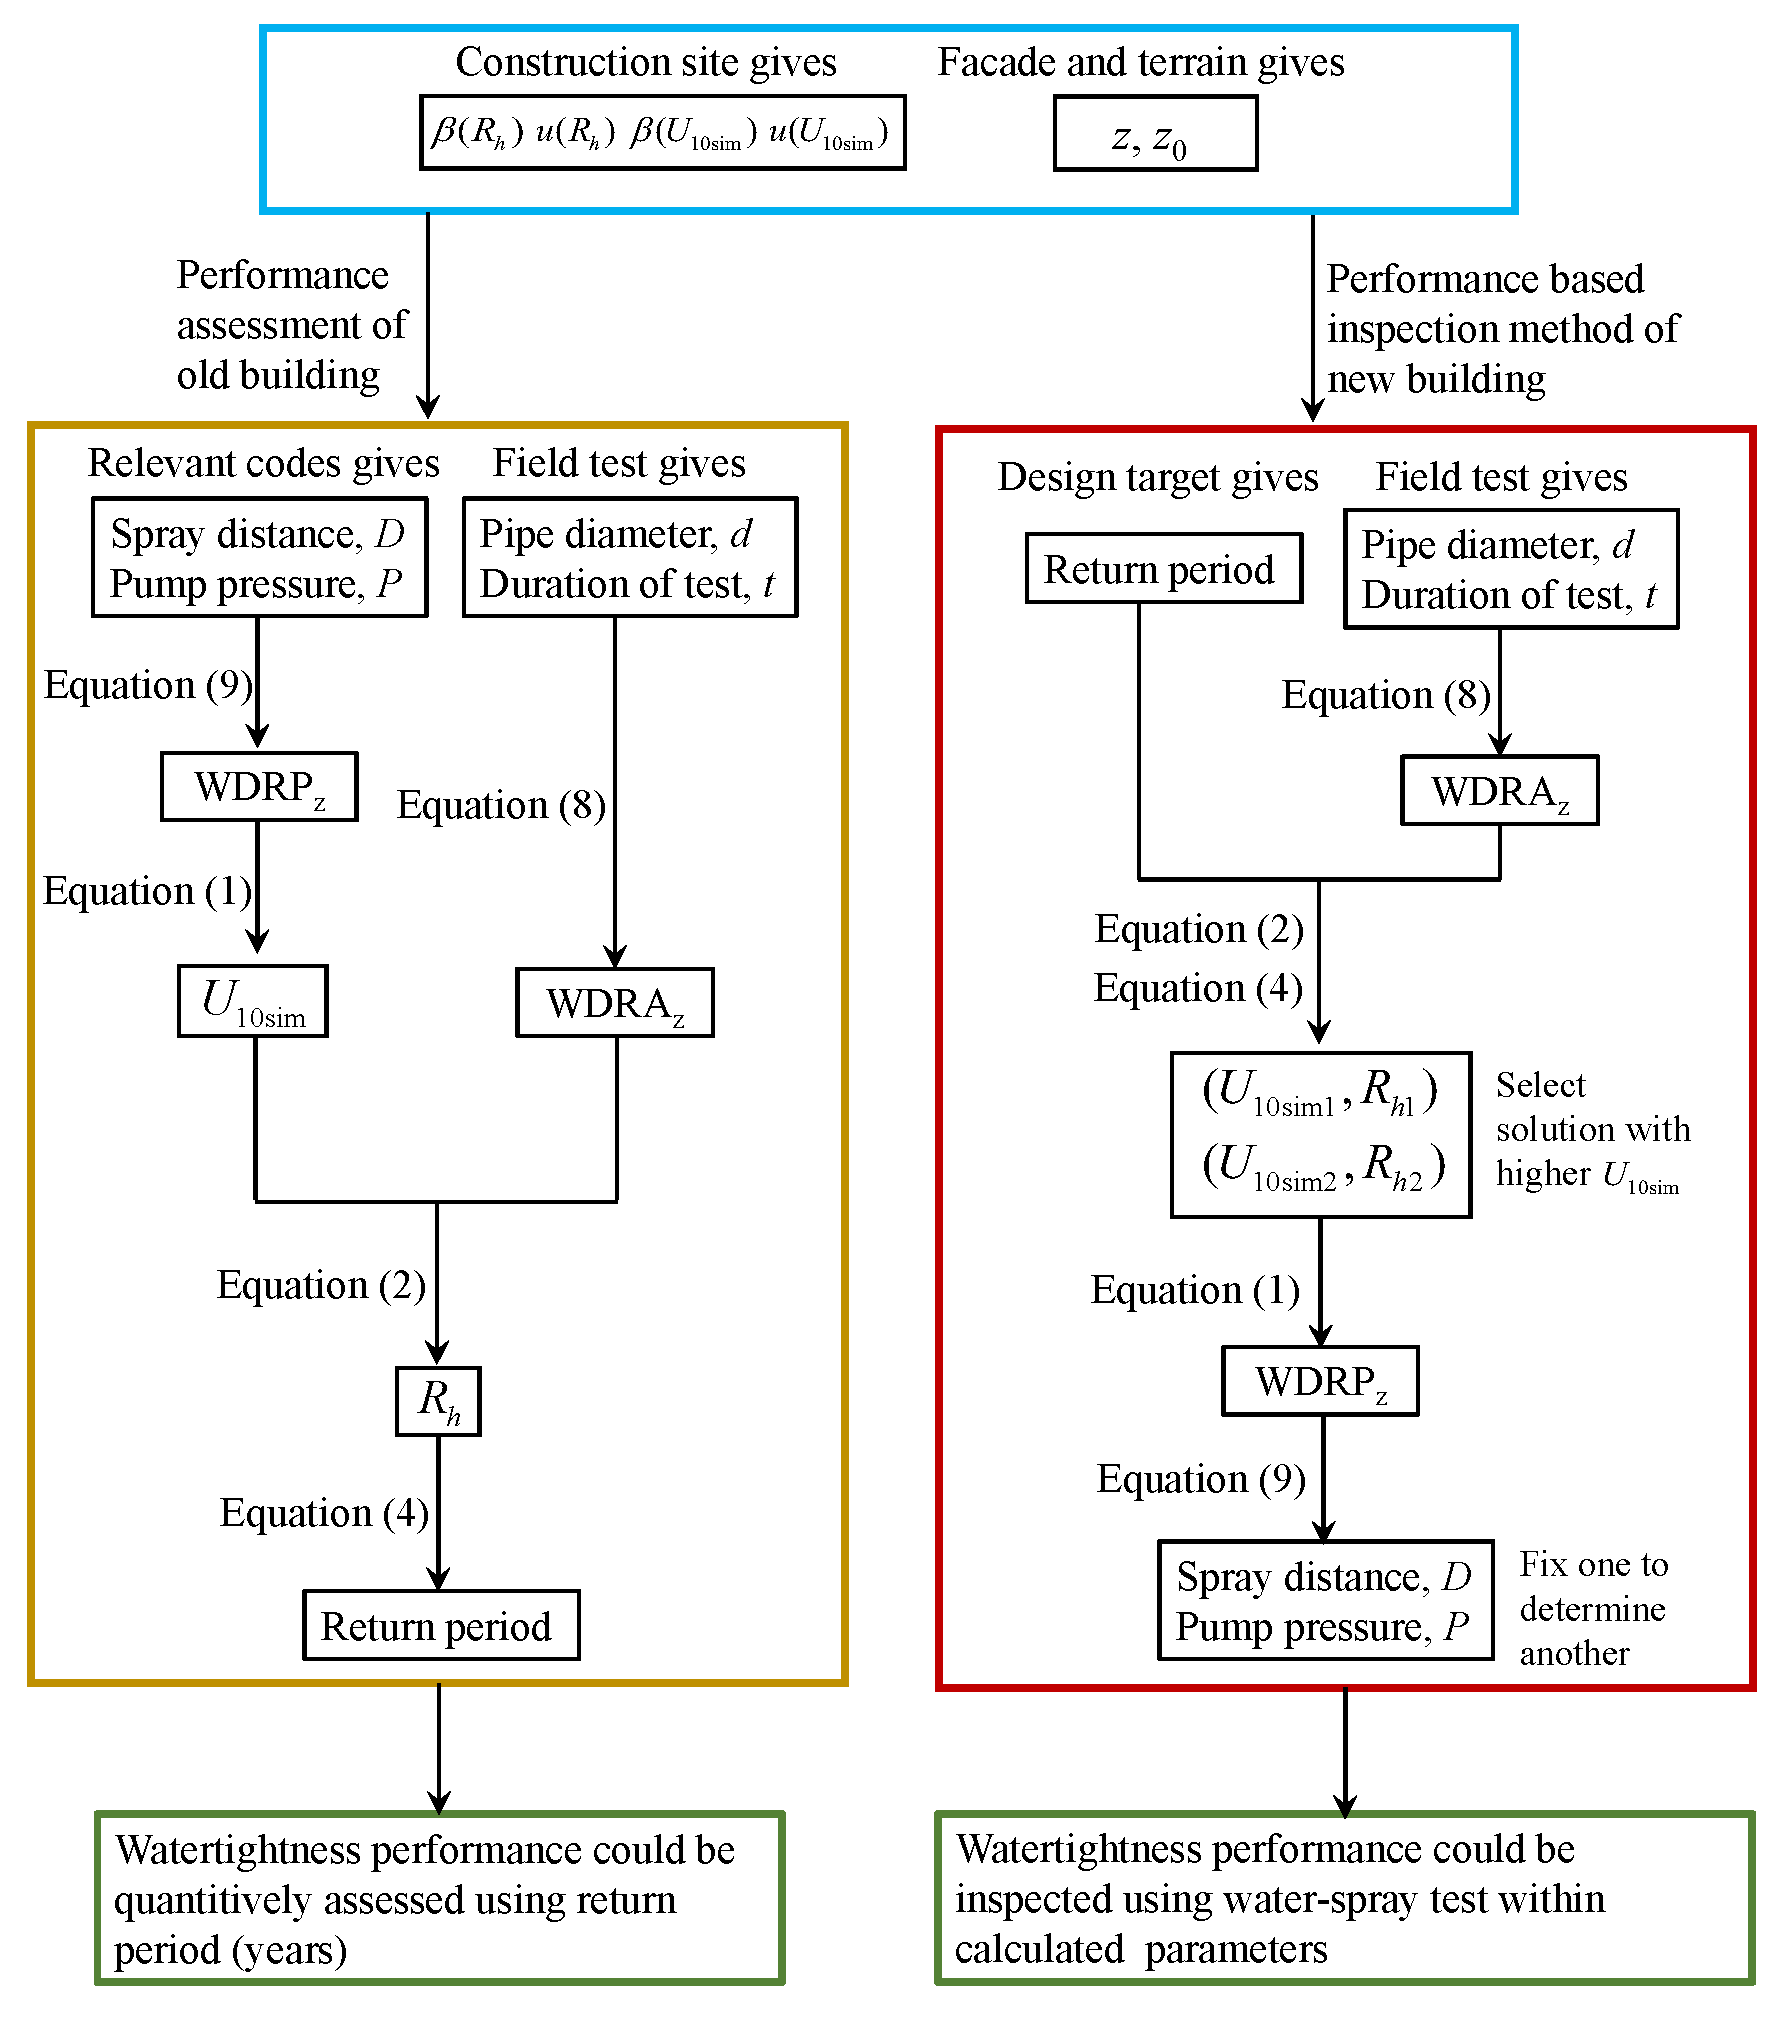
According to the above procedures, a quantitative assessment and inspection method for watertightness performance of building facades under wind-driven rain could be implemented, as shown in
Figure 2. The symbols and equations used in
Figure 2 are explained and derived in the next sections.
3. Derivation of Key Climatic Parameters for Facade Assessment
Despite the various climatic variables, a rainfall event would affect the target facade mainly through two factors: the wind-driven rain pressure acting on its run-off (WDRP) and the wind-driven rain amount on the building surface (WDRA). Those two factors are also the key climatic parameters that engineers are concerned with in the performance-based facade assessment and watertightness inspection. Moreover, it is axiomatic that the watertightness of a building cannot be enhanced indefinitely due to cost constraints; thus, the exceedance probability (also known as recurrence) of the WDR load must be considered. This recurrence is defined as a return period which depends on the test exposure surpassed (the higher its magnitude and duration, the greater the severity and corresponding return period) [
43].
According to the Bernoulli equation, the WDRP on the facade could be semi-estimated using Equation (1), where
(Pa) denotes the wind-driven rain pressure at facade height
z (m),
denotes the density of air flow, which was taken as 1.2 kg/m
3. Conservatively assuming that the wind direction is perpendicular to the facade, the pressure coefficient could be calculated as
= 1.
(m/s) denotes the simultaneous wind speed recorded during precipitation, collected under reference conditions (open areas and at a height of 10 m above ground level for conventional meteorological records).
(m) denotes the roughness length of the surrounding terrain, which reflects the friction coefficient of the wind through an empirical estimation that is suitable for unstable atmospheric conditions. These roughness lengths are summarized in ref. [
44].
Based on previous studies [
45,
46], the WDRA could be calculated using Equation (2), where
(mm) denotes the wind-driven rain amount collected over the facade during a specific recording interval at facade height
z (m) and
(mm/min) denotes the rainfall during a specific recording interval. Conservatively assuming a wind direction perpendicular to the facade and that the blowing target zone is the uppermost corner of the building (the most unfavorable area), the admittance factor could be considered as
RAF = 0.9.
Subsequently, under the spirit of Bayes’ theorem, the return period (years) considering the probability of the simultaneous occurrence of WDRP and WDRA values could be calculated. Note that, for a specific case, roughness length
and admittance factor
RAF would be a given constant. Accordingly, the
depends only on the
; when the prior wind speed
occurs, the
depends only on the rainfall intensity
. Therefore, the occurrence probability of
and
values could be transformed using the BPB method into a probability calculation of the independent variables
and
, as shown in Equation (3).
To calculate the probabilities
and
, extreme value analysis (the probabilities of certain factors were determined by statistically analyzing a series of annual maximum values for the corresponding factor) is recommended [
47], as shown in Equation (4).
and
denote the mode of both series, and
and
are the dispersion parameters.
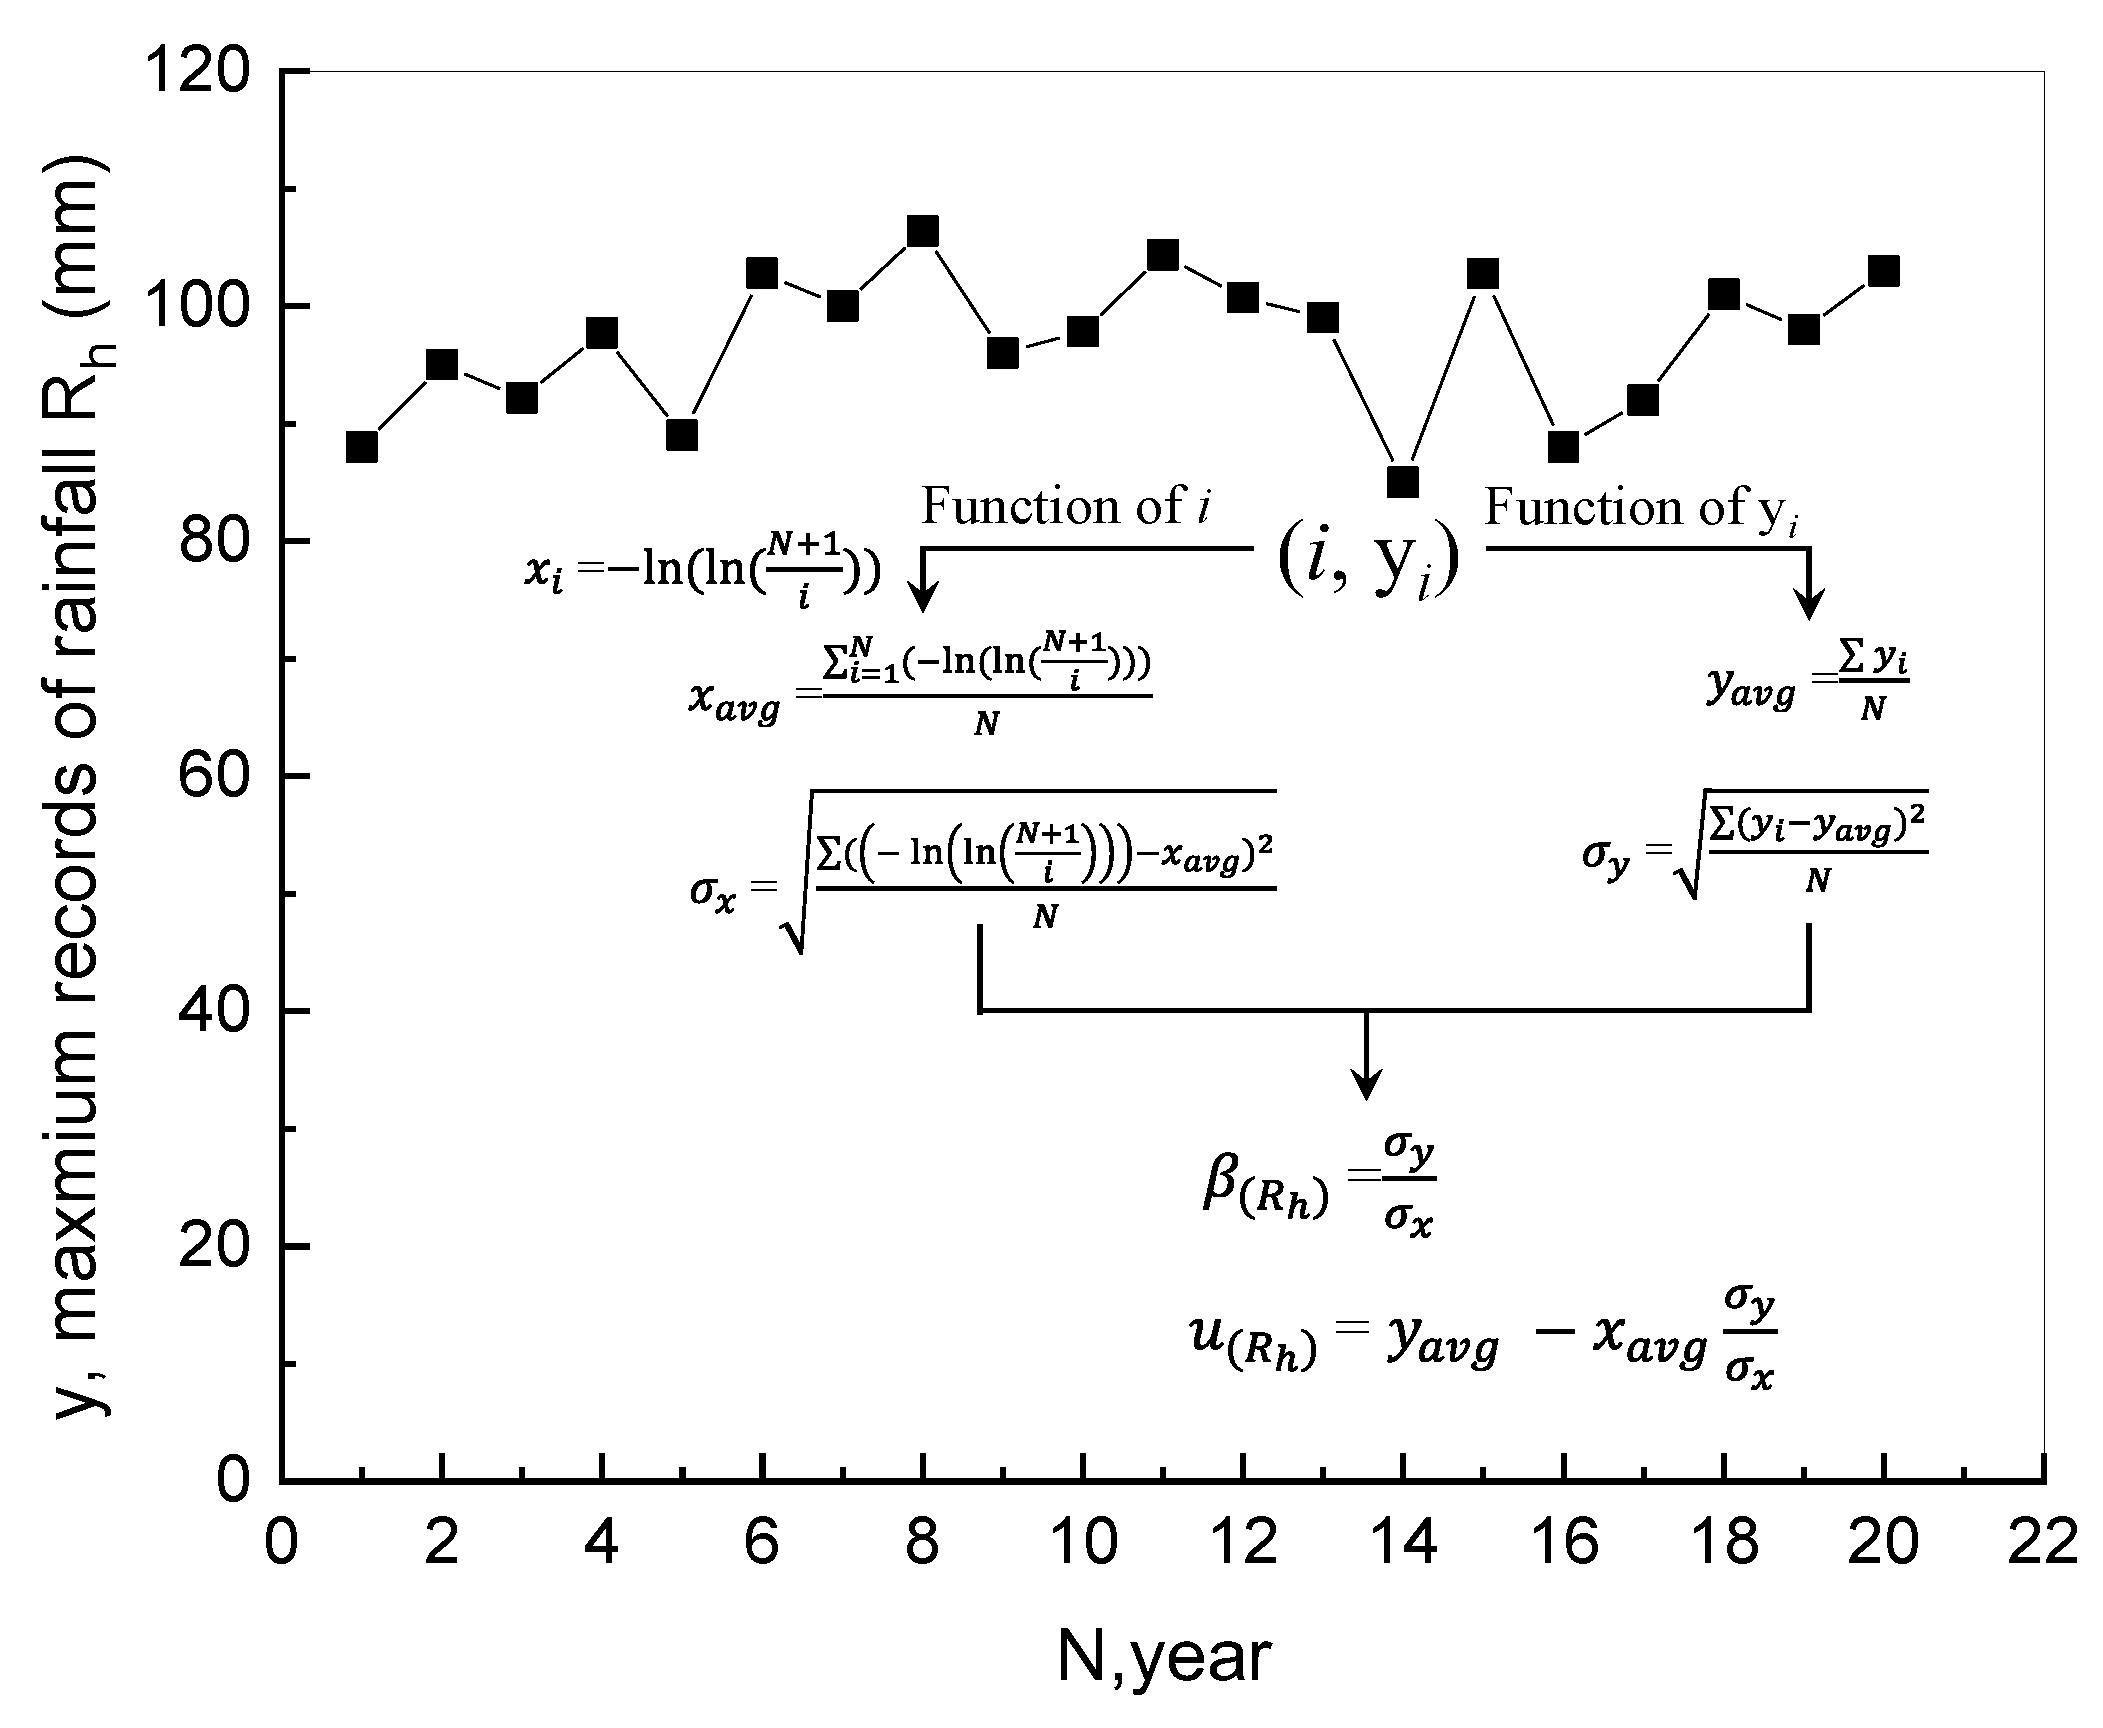
Taking
as an example, as shown in
Figure 3, for a variable under analysis (
), the maximum values of the variable (marked as y
i) within a specific recording interval (marked as
i) were collected as a series of data points with number count of
N. The average value of the data (y
avg) and the standard deviation of the data (
σy) can be calculated using equations in
Figure 3. For each data point, the reduced variable x
i can be calculated as
; accordingly, the average value of the reduced variable (x
avg) and the standard deviation of the reduced variable (
σx) can be calculated using the equations in
Figure 3. Therefore, the mode
and dispersion parameters
can be obtained as shown in
Figure 3.
Note that the distribution parameters
and
are determined by the available weather records. However, when the time durations of the watertightness tests (which usually range from 5 min to 15 min) do not align with the available recording interval (usually in hours or days), a functional approach could be adopted to extrapolate the extreme values of rainfall intensity (mm/min) and wind speed (m/s) across sub-daily recording intervals [
48,
49]. This approach uses a least-squares regression analysis (LSRA) to identify the best-fit regression that allows for an accurate prediction of the maximum values for certain interval. For rainfall intensity, a regression based on potential function yields the most precise fitting. This is shown in Equation (5), where
(mm/min) denotes the maximum rainfall intensity associated with any specific t-minute recording interval (without distinguishing concurrence with wind speed) and
a and
b denote the fitting parameters determined by specific locations. For wind speed, a regression based on logarithmic function yields the most precise fitting. This is shown in Equation (6), where
(m/s) denotes the maximum wind speed associated with any specific t-minute recording interval (without distinguishing concurrence with rainfall intensity) and
c and
d denote the fitting parameters determined at specific locations. The best-fit relationships based on LSRA for
and
in Shanghai are shown in
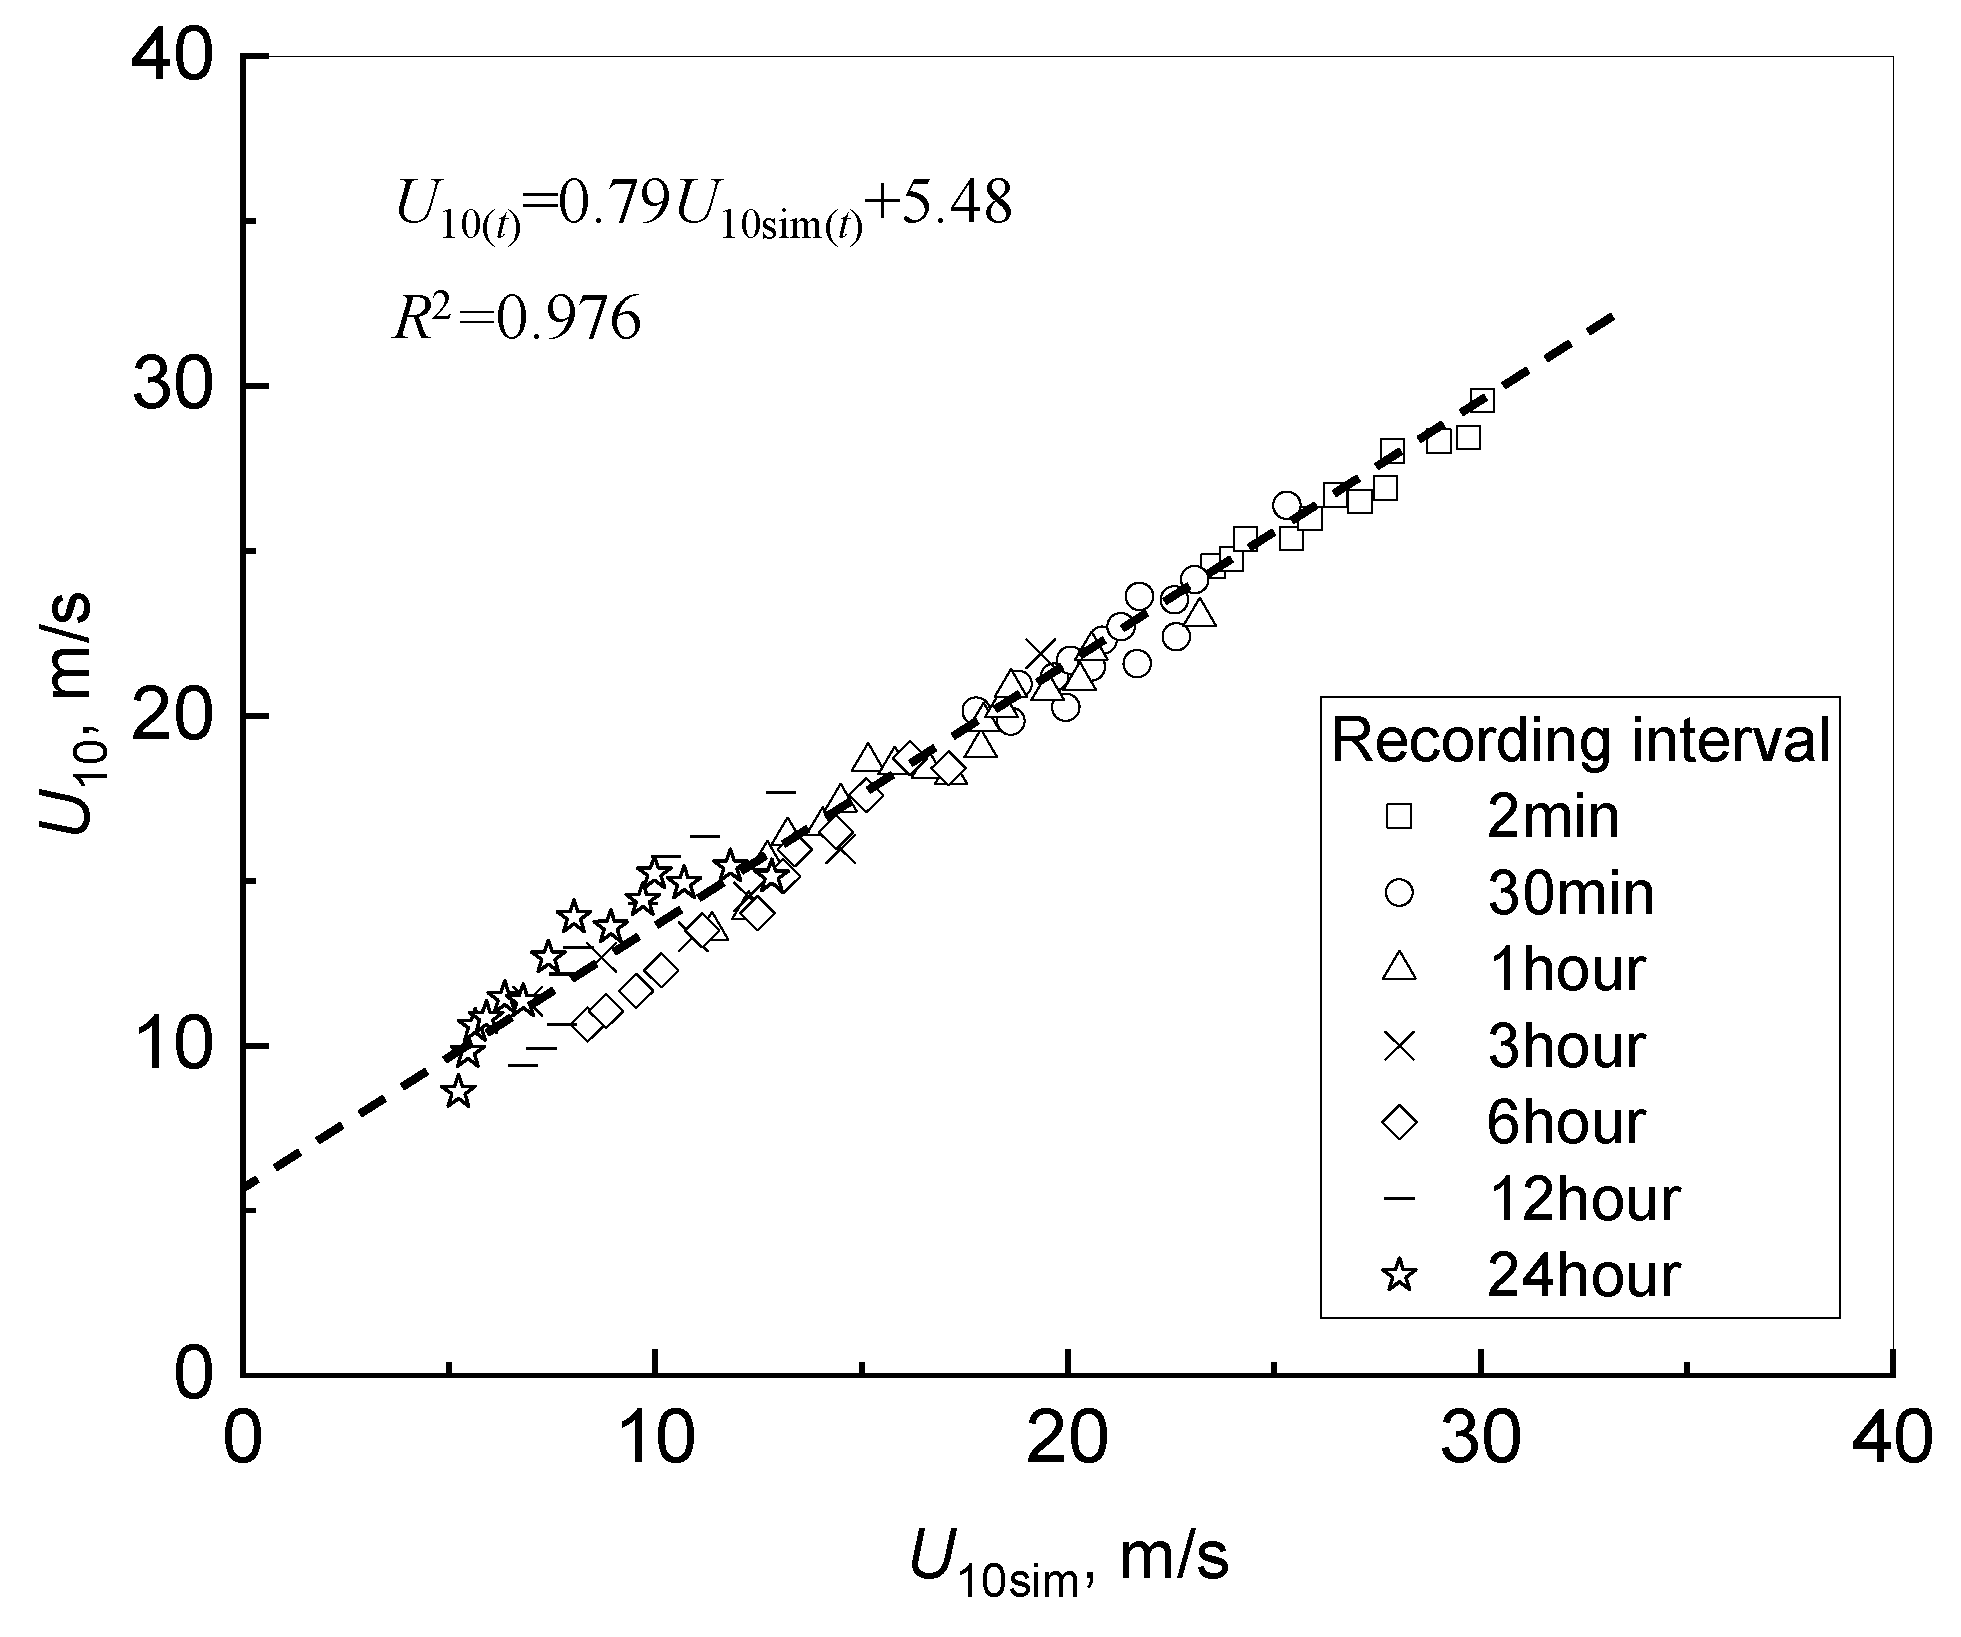
Figure 4; the data were collected at longitude 121.17 and latitude 31.40 by the Shanghai Bao-shan District weather station.
As described in the above content, the regression method did not consider the concurrence of maximum rainfall intensity and wind speed; this issue could be addressed by the linear regression proposed in [
43], as shown in Equation (7), where
denotes the common recording results of maximum wind speed, while
denotes the equivalent wind speed concurrent with rainfall. The validity of Equation (7) was verified based on the statistical analysis of Shanghai weather data, as shown in
Figure 5.
In practice, the potential-type regression in Equation (5), logarithmic-type regression in Equation (6), and linear-type regression in Equation (7) can all be identified based on only three sub-daily recording intervals and applying an LSRA to their averages, resulting in a reduced calculation effort for extrapolation.
4. Relationship Between Climatic Parameters and Watertightness Test Parameters
As mentioned in the introduction, the watertightness test in China is conducted based on pump pressure P (kPa) and spray distance D (m). To bridge the knowledge gap between these test parameters and the climatic parameters used in facade assessment, a series of water-spraying field tests were conducted on a building facade, where pump pressures and spray distances were systematically varied. This scheme enabled the detailed monitoring of the pressure exerted on the facade, providing valuable data on its response to controlled spraying.
The background project for the water-spraying field test was a seven-story residential building in Yangpu District, Shanghai (see
Figure 6a). The WDRA of the building facade during the test process could be calculated based on the proportion of total water intake, given that watertightness tests are generally conducted at the construction site and the velocity of waterflow in the main supplying pipeline of these sites is commonly 1.5 m/s in Shanghai. Denoting the nominal diameter for the feed pipeline of the spray test as
d (m) and the test duration as
t (min), the WDRA (mm) could be estimated using Equation (8).
On the other hand, the WDRP on the building facade during the test process is measured using distributed thin-film pressure sensors, which operate on a piezoresistive mechanism. The resistance value of the sensitive unit varies with the contact force, so the measurements of pressure can be realized through recording the change in the resistance of each sensitive lattice. The spray equipment has 30 nozzles, each with a diameter of 1.5 mm. Each spray region is equipped with a 4 × 4 array of thin-film pressure sensors (see
Figure 6c), and data are transmitted wirelessly via Bluetooth at a frequency of 10 Hz. Some relevant parameters of the sensor are summarized in
Table 1.
Considering a common pump pressure of 400 kPa [
37,
50] and a common spray distance of 0.4 m in watertightness tests in China, the experimental procedure was accordingly designed as shown in
Table 2.
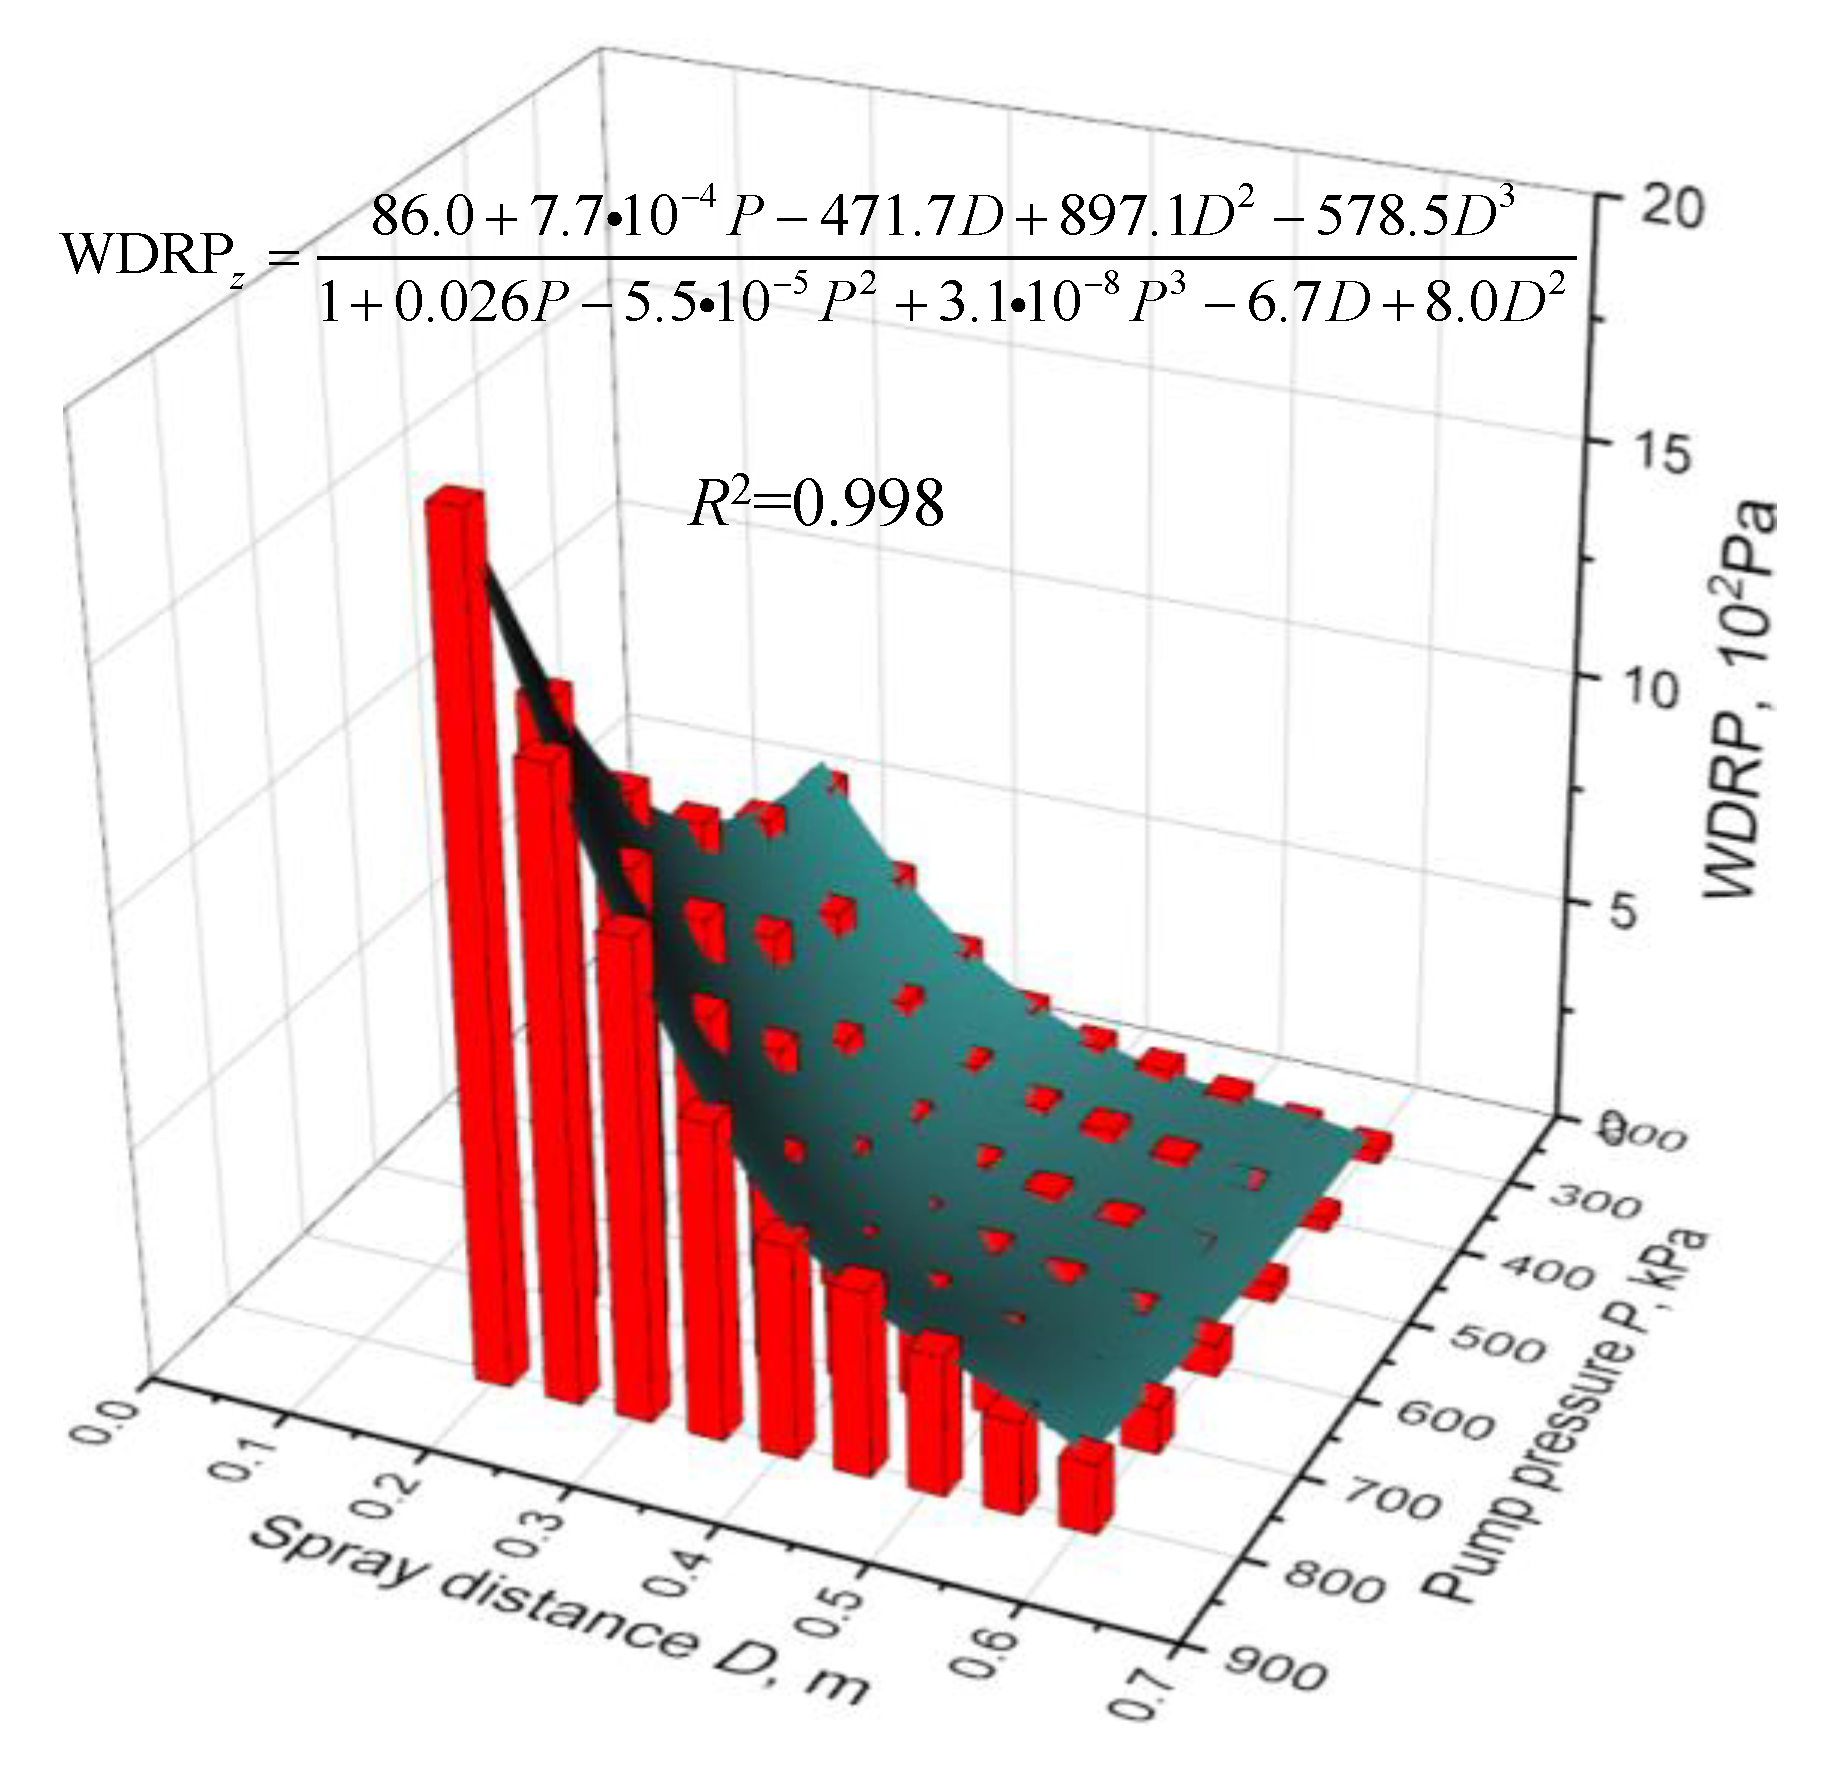
It is worthy of note that the conical dispersion of the spray body caused a certain degree of fluctuation in the monitoring results of the WDRP on the building surface. In order to accurately reflect the true level of the pressure differential and avoid underestimating its value due to data fluctuations, the 90th percentile value (that is, among all the data, 90% of the data are lower than this value) was determined as the representative value during the data processing. The field measurements of WDRP are shown in
Figure 7. As expected, the pressure differential on the building facade rapidly decreased with increasing spray distance, while it increased with higher pump pressure. Based on the monitored dataset, an empirical equation which describes the relationship between
, pump pressure
P, and spray distance
D is proposed in Equation (9). The empirical regression adopted the Rational 2D built-in fitting function in OriginLab software (Version 2018). The correlation coefficient
R2 was 0.998 (the closer the coefficient is to 1, the stronger the data correlation). Note that, within the allowable margin of error, the calculated result of Equation (9) is smaller than the actual value. In other words, this empirical formula provides a conservative estimation of
, which is beneficial to its practical usage, as a pressure differential on the building facade larger than the desired requirements would guarantee a longer return period.
5. Performance-Based Assessment and Inspection Method
In engineering practice in Shanghai, there are two main challenges professionals face when evaluating the performance of building facades under the current watertightness test provisions: (a) how to quantitatively assess the watertightness of existing buildings and (b) how to determine whether the facades of new buildings meet the performance requirements. Based on the knowledge from
Section 2 and
Section 3, a performance-based assessment and inspection method for building facades under wind-driven rain can be implemented.
When assessing the watertightness of the facade of an existing old building, the facade is subjected to water spraying during the inspection process until the desired leakage occurs. The known data of spray distance D (m), pump pressure P (kPa), pipe diameter d (m), and test duration t (min) used in testing can be used to calculate the corresponding values of and using Equation (8) and Equation (9), respectively. Accordingly, the and values can be calculated using Equation (1) and Equation (2), respectively. Therefore, the return period can be determined using Equation (4), and the watertightness performance of the façade configuration under WDR can be quantified by the return period associated with the maximum exposure it can withstand.
When assessing the watertightness of the facade of a new building, a target return period is initially set, which represents the desired years of watertightness to be achieved based on regulatory requirements and design decisions. Using Equation (8), the product of pipe diameter and test duration (the two parameters that are predetermined for each international watertightness test) gives the value of . Accordingly, the specified return period and allows us to obtain the and using Equations (2) and (4). Note that the equation system of Equations (2) and (4) has two solutions: a combination of high with low and a combination of high with low . Only the solution with a higher is of interest since it yields a higher WDRP value, which leads to a higher risk of rain penetration. Therefore, the can be determined using Equation (1), and the spray distance D and pump pressure P can be decided using Equation (9) with one of the values fixed. Finally, if no leakage occurs during the specific test parameters, this indicates a facade that fulfills the performance requirements. Through the inspection process, the water-proofing characteristics of different materials can also be assessed under different test factors.
6. Case Application
The proposed assessment and inspection method was adopted in two buildings in Yangpu District of Shanghai (core urban area, where the roughness length
= 1.6 m), see
Figure 8. Building A was a six-story residential building constructed in 1980, and the aim was to quantify the watertightness performance of the facade at a 12 m height. Building B was a newly designed office building with a height of 30 m, and its curtain wall should be capable of providing 50 years of watertightness. The study area subsection belonged to the Yangpu District of Shanghai, which has a humid subtropical climate featuring four distinct seasons. The monthly average temperature ranges from 2.1 °C to 32.2 °C, and humidity fluctuates between 70% and 90%.
For the analysis of building A, the facade was assumed to withstand a water spray with pump pressure 300 kPa, a spray distance of 0.3 m, and a testing duration of 5 min during the JGJ/T299 test (the diameter of pipeline was specified as 0.02 m and the spray equipment has 30 nozzles with a diameter of 1.5 mm). Although the Chinese standard was selected for the case application to be coherent with the location during case analysis, any other international watertightness test could be applied to this procedure by applying its specific testing duration and water spray amount. For the sake of generality, the maximum annual records of rainfall and wind speed relating to hourly, 360 min, and daily recording intervals were adopted in the analysis, which were the three most commonly collected records all over the world.
Table 3 summarizes the data related to the calculation (note that the
and
values were obtained from the hourly recording interval); the data were the average annual maximum values obtained from 2013 to 2023, collected at the Shanghai Bao-shan District weather station. The fit regression was obtained as shown in
Figure 9. Despite the fact that reasonable analysis results could be obtained from limited weather data, it is worthy of note that a more detailed weather record leads to a more precise result. Weather records of multiple sub-daily intervals are recommended in the analysis if possible.
For the assessment of watertightness of building A (more calculation details can be found in
Supplementary Materials), a pump pressure of 300 kPa together with a spray distance of 0.3 m leads to a pressure differential (
) of 290 Pa, calculated from Equation (9); a pipeline diameter of 0.02 m together with a spray duration of 5 min gives a rain amount (
) of 141.4 mm, calculated from Equation (8). Accordingly, the corresponding meteorological parameters can be calculated as
= 21.17 m/s and
= 45.97 mm. Due to the fact that the
and
values were obtained from values that did not consider their concurrency with rainfall, the linear regression in Equation (7) was adopted to obtain the equivalent values of wind speed concurrent with rainfall, where
= 0.8·21.17 + 5.5 = 22.44 m/s.
In addition, as the and values were obtained from an hourly recording interval, it was necessary to apply Equations (5) and (6) to transfer the 5 min values of and to 1 h values. The results were and . Subsequently, the 1 h values were substituted into Equation (4) to determine the return period, and it was calculated as 1.02 years. According to this result, the watertightness performance of the facade of building A within a return period of 1.02 years could be evaluated under the provisions of JGJ/T299; it seems that the provisions for the watertightness could be improved for more severe and infrequent WDR exposure.
For the analysis of building B, since the facade was assumed to be able to withstand 50 years of WDR exposure, Equations (2) and (4) define a two-equation system through which the values of unknown
and
can be solved. As mentioned in the case of building A, the water supply established for the watertightness test (rain amount WDRA
z) was 141.4 mm. The 1 h values of the meteorological parameters could be obtained as shown in
Figure S1 in Supplementary Materials.
Subsequently, the solutions with a larger value for wind speed were selected as the results of interest, which were
= 49.39 m/s and
= 13.82 mm = 2.76 mm/min. Accordingly, the pressure to be surpassed during the watertightness test could be calculated as
= 2310 Pa, as shown in Equation (10).
Therefore, given a pump pressure of 900 kPa, the spray distance could be obtained using Equation (11) as 0.15 m. In summary, under the watertightness test with the key factors of pump pressure = 900 kPa, spray distance = 0.15 m, pipeline diameter = 0.02 m, and a spray duration of 5 min, it could be evaluated whether the watertightness performance of the facade met the requirements of the designed return period under the provisions of JGJ/T299.
Furthermore, considering the big picture of climate change, a safety coefficient should be considered in the analysis according to the weather conditions of various locations, as well as the hypothetical deviations resulting from the availability of limited weather data. However, with the increasement in automatic weather stations and a higher demand for exhaustive data, more and more rainfall records that align with wind speed data will emerge in the future, bringing simpler application models and a more promising application space for the proposed performance-based assessment and inspection method.
7. Conclusions
This study introduces an assessment and inspection method for evaluating the watertightness performance of building facades in Shanghai when subjected to wind-driven rain. Anchored in the BPB method, a quantitative relationship is established between assessment parameters (e.g., WDRP and WDRA) and key wind-driven rain parameters, such as wind speed and rainfall intensity. The calculation process encompasses regression models that correlate extreme rainfall and wind velocity values over sub-daily intervals, as well as a method for extrapolating maximum wind velocities using wind data coinciding with rainfall events.
To bridge the gap between key factors in Chinese watertightness test provisions and the calculation method for pressure differentials on facades, a series of water-spray tests were executed. An empirical equation linking WDRP to pump pressure and spray distance was subsequently formulated.
With this method, the watertightness performance of facades can be quantitatively assessed based on the return period when inspection tests are conducted in accordance with Chinese code requirements. Moreover, the inspection method can be tailored by identifying key inspection factors through the proposed approach under any specific test provisions. To demonstrate the implementation of the proposed method, two buildings in Shanghai were chosen for a case study. The calculation process was demonstrated using commonly recorded weather data, including hourly and daily records, to ensure its broad applicability. For an old residential building, its watertightness performance was quantified as a return period of 1.02 years using the proposed method. In contrast, for a new office building, the desired 50-year waterproofing performance could be inspected under a pump pressure of 900 kPa and a spraying distance of 0.15 m using the proposed method. These case studies highlight the practicality of the proposed method.
The results of this study represent a significant advancement in addressing the current lack of correlation between assessment methods and actual watertightness test factors specified by the Chinese code. Future work should focus on further elaborating climate models (such as snow) using richer weather data and applying the proposed method to different types of buildings (such as high-rise buildings and historical buildings) to test and optimize its applicability.
Author Contributions
Conceptualization, F.R. and L.L.; methodology, F.R.; validation, Y.M., J.X. and Q.F.; formal analysis, F.R.; investigation, S.X. and Q.X.; resources, Y.M., J.X. and Q.F.; data curation, S.X. and Q.X.; writing—original draft preparation, F.R.; writing—review and editing, F.R. and L.L.; visualization, F.R.; supervision, L.L.; project administration, L.L.; funding acquisition, L.L. All authors have read and agreed to the published version of the manuscript.
Funding
This research was funded by the National Key R&D Program of China, grant number 2022YFF0609200, and the Shanghai Sailing Program, grant number 23YF1418400.
Data Availability Statement
The data presented in this study are available on request from the corresponding author due to the confidentiality policy of the National Meteorological Science Data Center of China.
Acknowledgments
The authors appreciate the weather data authorized by the National Meteorological Science Data Center of China.
Conflicts of Interest
Authors Libo Long, Fengrui Rao, Yueqiang Ma, Jinhu Xi and Qiushi Fu were employed by the company Shanghai Construction No. 2 (Group) Co., Ltd. Authors Shun Xiao and Qingfeng Xu were employed by the company Shanghai Key Laboratory of Engineering Structure Safety, Shanghai Research Institute of Building Sciences Co., Ltd. All authors declare that the research was conducted in the absence of any commercial or financial relationships that could be construed as a potential conflict of interest.
Abbreviations
| wind-driven rain pressure at facade height z |
| density of air flow |
| θ | angle of wind direction to facade |
| Cp | pressure coefficient of winds |
| simultaneous wind speed recorded during precipitation |
| maximum wind speed without considering co-occurrence of rainfall |
| roughness length of surrounding terrain |
| wind-driven rain amount at facade height z |
| rainfall during specific recording interval, also known as rainfall intensity |
| RAF | rain admittance factor |
| P(·) | probability of variable |
| u(·) | mode of data series in extreme analysis |
| β(·) | dispersion of data series in extreme analysis |
| t | specific time interval |
| a,b,c,d,e,f | fitting parameters |
| P | pump pressure of water-feeding pump in watertightness test |
| D | spray distance from nozzle to facade in watertightness test |
References
- Alawode, K.J.; Vutukuru, K.S.; Elawady, A.; Lee, S.J.; Chowdhury, A.G.; Lori, G. Wind-Induced Vibration and Wind-Driven Rain Performance of a Full-Scale Single-Skin Facade Unit with Vertical Protrusions. J. Archit. Eng. 2023, 29, 04023003. [Google Scholar] [CrossRef]
- Zhou, X.; Kubilay, A.; Derome, D.; Carmeliet, J. Comparison of Wind-Driven Rain Load on Building Facades in the Urban Environment and Open Field: A Case Study on Two Buildings in Zurich, Switzerland. Build. Environ. 2023, 233, 110038. [Google Scholar] [CrossRef]
- Luo, Y.; Yang, M.; Ni, P.; Peng, X.; Yuan, X. Degradation of Rammed Earth under Wind-Driven Rain: The Case of Fujian Tulou, China. Constr. Build. Mater. 2020, 261, 119989. [Google Scholar] [CrossRef]
- Ouyang, Z.; Spence, S.M.J. A Performance-Based Wind Engineering Framework for Envelope Systems of Engineered Buildings Subject to Directional Wind and Rain Hazards. J. Struct. Eng. 2020, 146, 04020049. [Google Scholar] [CrossRef]
- D’Ayala, D.; Zhu, H.; Aktas, Y. The Impact of Wind-Driven Rain on Surface Waterproofed Brick Cavity Walls. Buildings 2024, 14, 447. [Google Scholar] [CrossRef]
- Yu, S.; Liu, X.; Li, Y.; He, S.; Yao, Y.; Sun, S. Experimental and Numerical Simulation Study on Hygrothermal Migration of Damaged Envelope Walls during Wind-Driven Rain. Build. Environ. 2023, 243, 110653. [Google Scholar] [CrossRef]
- Abu-Zidan, Y.; Nguyen, K.; Mendis, P. Influence of Building Shape on Wind-Driven Rain Exposure in Tall Buildings. J. Archit. Eng. 2021, 27, 04021027. [Google Scholar] [CrossRef]
- Wang, X.J.; Li, Q.S.; Li, J.C. Field Measurements and Numerical Simulations of Wind-Driven Rain on a Low-Rise Building during Typhoons. J. Wind. Eng. Ind. Aerodyn. 2020, 204, 104274. [Google Scholar] [CrossRef]
- Aktas, Y.D.; D’Ayala, D.; Blades, N.; Calnan, C. An Assessment of Moisture Induced Damage in Blickling Hall in Norfolk, England, via Environmental Monitoring. Herit. Sci. 2017, 5, 5. [Google Scholar] [CrossRef]
- Lü, X. Modelling of Heat and Moisture Transfer in Buildings. Energy Build. 2002, 34, 1033–1043. [Google Scholar] [CrossRef]
- Aktas, Y.D.; Shi, J.; Blades, N.; D’Ayala, D. Indoor Mould Testing in a Historic Building: Blickling Hall. Herit. Sci. 2018, 6, 51. [Google Scholar] [CrossRef] [PubMed]
- Shi, J.; Cui, L. Characteristics of High Impact Weather and Meteorological Disaster in Shanghai, China. Nat. Hazards 2012, 60, 951–969. [Google Scholar] [CrossRef]
- Chen, R.; Zhang, Y.; Xu, D.; Liu, M. Climate Change and Coastal Megacities: Disaster Risk Assessment and Responses in Shanghai City. In Climate Change, Extreme Events and Disaster Risk Reduction; Mal, S., Singh, R.B., Huggel, C., Eds.; Sustainable Development Goals Series; Springer International Publishing: Cham, Switzerland, 2018; pp. 203–216. ISBN 978-3-319-56468-5. [Google Scholar]
- Masson, V.; Lemonsu, A.; Hidalgo, J.; Voogt, J. Urban Climates and Climate Change. Annu. Rev. Environ. Resour. 2020, 45, 411–444. [Google Scholar] [CrossRef]
- Bourcet, J.; Kubilay, A.; Derome, D.; Carmeliet, J. Representative Meteorological Data for Long-Term Wind-Driven Rain Obtained from Latin Hypercube Sampling—Application to Impact Analysis of Climate Change. Build. Environ. 2023, 228, 109875. [Google Scholar] [CrossRef]
- Clarke, B.; Otto, F.; Stuart-Smith, R.; Harrington, L. Extreme Weather Impacts of Climate Change: An Attribution Perspective. Environ. Res. Clim. 2022, 1, 012001. [Google Scholar] [CrossRef]
- Zhong, J.; Zhang, W.; Xie, L.; Zhao, O.; Wu, X.; Zeng, X.; Guo, J. Development and Challenges of Bifacial Photovoltaic Technology and Application in Buildings: A Review. Renew. Sustain. Energy Rev. 2023, 187, 113706. [Google Scholar] [CrossRef]
- Zhang, W.; Zhao, O.; Xie, L.; Li, Z.; Wu, X.; Zhong, J.; Zeng, X.; Zou, R. Factors Influence Analysis and Life Cycle Assessment of Innovative Bifacial Photovoltaic Applied on Building Facade. Energy 2023, 279, 128082. [Google Scholar] [CrossRef]
- Tang, W.; Davidson, C.I. Erosion of Limestone Building Surfaces Caused by Wind-Driven Rain: 2. Numerical Modeling. Atmos. Environ. 2004, 38, 5601–5609. [Google Scholar] [CrossRef]
- Adirosi, E.; Volpi, E.; Lombardo, F.; Baldini, L. Raindrop Size Distribution: Fitting Performance of Common Theoretical Models. Adv. Water Resour. 2016, 96, 290–305. [Google Scholar] [CrossRef]
- Thomas, A.; Kanawade, V.P.; Chakravarty, K.; Srivastava, A.K. Characterization of Raindrop Size Distributions and Its Response to Cloud Microphysical Properties. Atmos. Res. 2021, 249, 105292. [Google Scholar] [CrossRef]
- Blocken, B.; Carmeliet, J. Driving Rain on Building Envelopes- I. Numerical Estimation and Full-Scale Experimental Verification. J. Therm. Envel. Build. Sci. 2000, 24, 61–85. [Google Scholar] [CrossRef]
- Choi, E.C.C. Parameters Affecting the Intensity of Wind-Driven Rain on the Front Face of a Building. J. Wind. Eng. Ind. Aerodyn. 1994, 53, 1–17. [Google Scholar] [CrossRef]
- Bai, X.; Gao, Y.; Di, Y.; Guan, J.; Jiang, L.; Fan, Z.; Hu, G. Analysis of Numerical Simulations and Semi-Empirical Models on Distribution Characteristics of Wind-Driven Rain on Low-Rise Building Facades. Build. Environ. 2024, 263, 111904. [Google Scholar] [CrossRef]
- Ooi, C.; Ge, Z.; Poh, H.J.; Xu, G. Assessing Effectiveness of Physical Barriers against Wind-Driven Rain for Different Raindrop Sizes. Eng. Anal. Bound. Elem. 2020, 111, 186–194. [Google Scholar] [CrossRef]
- Choi, E.C.C. Simulation of Wind-Driven-Rain around a Building. J. Wind. Eng. Ind. Aerodyn. 1993, 46–47, 721–729. [Google Scholar] [CrossRef]
- Abuku, M.; Blocken, B.; Nore, K.; Thue, J.V.; Carmeliet, J.; Roels, S. On the Validity of Numerical Wind-Driven Rain Simulation on a Rectangular Low-Rise Building under Various Oblique Winds. Build. Environ. 2009, 44, 621–632. [Google Scholar] [CrossRef]
- Wang, H.; Song, W.; Chen, Y. Numerical Simulation of Wind-Driven Rain Distribution on Building Facades under Combination Layout. J. Wind. Eng. Ind. Aerodyn. 2019, 188, 375–383. [Google Scholar] [CrossRef]
- Kubilay, A.; Derome, D.; Blocken, B.; Carmeliet, J. Numerical Simulations of Wind-Driven Rain on an Array of Low-Rise Cubic Buildings and Validation by Field Measurements. Build. Environ. 2014, 81, 283–295. [Google Scholar] [CrossRef]
- Huang, S.H.; Li, Q.S. Numerical Simulations of Wind-Driven Rain on Building Envelopes Based on Eulerian Multiphase Model. J. Wind. Eng. Ind. Aerodyn. 2010, 98, 843–857. [Google Scholar] [CrossRef]
- Mohaddes Foroushani, S.S.; Ge, H.; Naylor, D. Effects of Roof Overhangs on Wind-Driven Rain Wetting of a Low-Rise Cubic Building: A Numerical Study. J. Wind. Eng. Ind. Aerodyn. 2014, 125, 38–51. [Google Scholar] [CrossRef]
- Shin, J.; Son, S.; Cha, Y. Spatial Distribution Modeling of Customer Complaints Using Machine Learning for Indoor Water Leakage Management. Sustain. Cities Soc. 2022, 87, 104255. [Google Scholar] [CrossRef]
- Carretero-Ayuso, M.J.; Moreno-Cansado, A.; García-Sanz-Calcedo, J. Occurrence of Faults in Water Installations of Residential Buildings: An Analysis Based on User Complaints. J. Build. Eng. 2020, 27, 100958. [Google Scholar] [CrossRef]
- ASTM E547-00(2016); Test Method for Water Penetration of Exterior Windows, Skylights, Doors, and Curtain Walls by Cyclic Static Air Pressure Difference. E06 Committee ASTM International: West Conshohocken, PA, USA, 2024. [CrossRef]
- ASTM E514/E514M-20; Test Method for Water Penetration and Leakage Through Masonry. C15 Committee ASTM International: West Conshohocken, PA, USA, 2020. [CrossRef]
- EN 12155; Curtain Walling—Watertightness—Laboratory Test under Static Pressure. European Committee for Standardization: Brussels, Belgium, 2000.
- JGJ/T 299-2013; Technical Code for In-Site Testing of Building Waterproof Engineering. Ministry of Housing and Urban-Rural Development: Beijing, China, 2013.
- Pérez-Bella, J.M.; Domínguez-Hernández, J.; Rodríguez-Soria, B.; Del Coz-Díaz, J.J.; Cano-Suñén, E. A New Method for Determining the Water Tightness of Building Facades. Build. Res. Inf. 2013, 41, 401–414. [Google Scholar] [CrossRef]
- Pérez-Bella, J.M.; Domínguez-Hernández, J.; Rodríguez-Soria, B.; Del Coz-Díaz, J.J.; Cano-Suñén, E.; Navarro-Manso, A. An Extended Method for Comparing Watertightness Tests for Facades. Build. Res. Inf. 2013, 41, 706–721. [Google Scholar] [CrossRef]
- Pérez-Bella, J.M.; Domínguez-Hernández, J.; Cano-Suñén, E.; Del Coz-Díaz, J.J.; Álvarez Rabanal, F.P. Improvement Alternatives for Determining the Watertightness Performance of Building Facades. Build. Res. Inf. 2015, 43, 723–736. [Google Scholar] [CrossRef]
- Pu, S.; Zhang, H.; Feng, C.; Qian, T. Analyzing Exposure Risk and Change Characteristics of Wind-Driven Rain in China under Future Climate Scenarios. J. Wind. Eng. Ind. Aerodyn. 2023, 241, 105544. [Google Scholar] [CrossRef]
- Qian, T.; Zhang, H. Assessment of Long-Term and Extreme Exposure to Wind-Driven Rain for Buildings in Various Regions of China. Build. Environ. 2021, 189, 107524. [Google Scholar] [CrossRef]
- Pérez-Bella, J.M.; Domínguez-Hernández, J.; López-Julián, P.L.; Salesa-Bordabana, Á.; Orna-Carmona, M. Closing the Gap between Traditional Wind-Driven Rain Studies and the Performance-Based Design of Building Façades: Case Study of the Netherlands. Build. Environ. 2024, 248, 111083. [Google Scholar] [CrossRef]
- Bañuelos-Ruedas, F.; Angeles-Camacho, C.; Rios-Marcuello, S. Analysis and Validation of the Methodology Used in the Extrapolation of Wind Speed Data at Different Heights. Renew. Sustain. Energy Rev. 2010, 14, 2383–2391. [Google Scholar] [CrossRef]
- Dingle, N.; Lee, Y. Terminal Fallspeeds of Raindrops. J. Appl. Meteorol. 1972, 11, 877–879. [Google Scholar] [CrossRef]
- Van Den Bossche, N.; Lacasse, M.A.; Janssens, A. A Uniform Methodology to Establish Test Parameters for Watertightness Testing Part II: Pareto Front Analysis on Co-Occurring Rain and Wind. Build. Environ. 2013, 63, 157–167. [Google Scholar] [CrossRef]
- Cornick, S.; Lacasse, M. A Review of Climate Loads Relevant to Assessing the Watertightness Performance of Walls, Windows, and Wall-Window Interfaces. J. ASTM Int. 2005, 2, 1–15. [Google Scholar] [CrossRef]
- Pérez-Bella, J.M.; Domínguez-Hernández, J.; Martínez-Martínez, J.E.; Alonso-Martínez, M.; Del Coz-Díaz, J.J. An Alternative Approach to Estimate Any Subdaily Extreme of Rainfall and Wind from Usually Available Records. Stoch. Environ. Res. Risk Assess 2022, 36, 1819–1833. [Google Scholar] [CrossRef]
- Chen, C.; Zhang, H.; Feng, C.; Xuan, Y.; Qian, T.; Xie, J. Analysis of Wind-Driven Rain Characteristics Acting on Building Surfaces in Shanghai Based on Long-Term Measurements. J. Build. Eng. 2022, 45, 103572. [Google Scholar] [CrossRef]
- GB/T 21086-2007; Curtain Wall for Building. Standardization Administration of China: Beijing, China, 2007.
| Disclaimer/Publisher’s Note: The statements, opinions and data contained in all publications are solely those of the individual author(s) and contributor(s) and not of MDPI and/or the editor(s). MDPI and/or the editor(s) disclaim responsibility for any injury to people or property resulting from any ideas, methods, instructions or products referred to in the content. |
© 2025 by the authors. Licensee MDPI, Basel, Switzerland. This article is an open access article distributed under the terms and conditions of the Creative Commons Attribution (CC BY) license (https://creativecommons.org/licenses/by/4.0/).


 ,
, 


