Article

Investigation of Mix Proportion Optimization and Anti-Scouring Performance of Pervious Concrete Base

1
Wuhan Comprehensive Transportation Research Institute Co., Ltd., Wuhan 430014, China
2
Institute of Highway Engineering, RWTH Aachen University, 52074 Aachen, Germany
3
School of Transportation, Changsha University of Science & Technology, Changsha 410114, China
*
Author to whom correspondence should be addressed.
Buildings 2025, 15(9), 1485; https://doi.org/10.3390/buildings15091485
Submission received: 19 March 2025 / Revised: 23 April 2025 / Accepted: 24 April 2025 / Published: 27 April 2025

Abstract

Internal drainage is crucial for preventing water damage in pavement structures. Pervious concrete is widely used in road projects due to its excellent drainage capacity, scour resistance, and durability. This study optimizes the mix design of pervious concrete by considering gradation (three levels), water-cement ratio (0.3, 0.35, 0.4), and target porosity (15%, 18%, 21%). The 7-day unconfined compressive strength, permeability coefficient, and elastic modulus were selected as evaluation indices. Response Surface Analysis (RSA) and Analysis of Variance (ANOVA) were applied to determine the optimal mix proportion. Scour resistance tests were conducted based on the optimal mix design to analyze the effects of scour time, frequency, and impact force on strength and modulus variation. The results indicate that the optimal mix ratio is Grade I, with a water-cement ratio of 0.35 and a target porosity of 18%. This yielded a 7-day compressive strength of 5.1 MPa, a rebound modulus of 2170.7 MPa, a permeability coefficient of 49 mL/s, and a hydraulic conductivity of 0.0027–0.0054 m2/s. Under standard scour conditions, compressive strength, splitting strength, dynamic rebound modulus, and splitting rebound modulus decreased by 16%, 33%, 40%, and 16%, respectively. Compared to cement-stabilized gravel (53% strength loss), pervious concrete exhibited lower strength loss (16%) due to its interconnected porosity, which mitigates internal water pressure during scouring. Overall, pervious concrete outperforms cement-stabilized gravel in mechanical properties and scour resistance, providing theoretical guidance for engineering applications.

1. Introduction

As of the end of 2024, the total length of highways in China is approximately 5.441 million kilometers, including 190,000 km of expressways. Notably, China’s expressway network ranks first in the world in terms of total mileage [1]. Under high-frequency and heavy-duty traffic conditions, the load-bearing capacity of highway asphalt pavements faces increasingly higher demands.
The pavement structure, from top to bottom, consists mainly of a wearing course, a base course, a subbase (optional), and a subgrade. Inadequate scour resistance of the base material is a major cause of pavement distress, including dehiscence, slurry, cracks, and subsidence [2]. Traditional subgrade materials mainly include graded gravel, cement-stabilized gravel, and asphalt-stabilized gravel base. Different traditional materials have their advantages, but they also have many shortcomings. For example, the friction between particles of graded gravel decreases after being infiltrated by rainwater, which can easily lead to the phenomenon of “scouring and hollowing”, resulting in structural damage to the base layer, and cement-stabilized gravel has poor fatigue resistance and is prone to forming reflective cracks, as well as having a dense structure that prevents rainwater from infiltrating, which exacerbates the risk of flooding and freezing and thawing damage to the roadway surface. Asphalt-stabilized grass-roots level is prone to rutting and deformation in summer and is expensive. However, pervious concrete can be used not only as a base for cement pavements but also as a base for asphalt pavements. Moreover, pervious concrete has the advantages of high strength, good resistance to water damage, and scour resistance.
Under traffic loading, infiltrating water that penetrates the pavement structure repeatedly scours the base layer, leading to the deterioration of the sub-base and compromising the stability of the road structure [3]. The scouring process of the subgrade can be categorized into three stages: immersion and weakening due to unbound water, solubilization under static water pressure, and erosion induced by dynamic water forces [4]. While a significant portion of surface water is discharged through drainage systems, excess water that cannot be removed in time infiltrates through cracks, seeps into the pavement structure, and accumulates at the subgrade base. This weakens the subgrade material and reduces the cohesion between its particles, leading to further deterioration [5,6]. Under traffic loading, water within the cracks continues to erode the base layer, reducing its load-bearing capacity and ultimately shortening pavement service life [7,8]. Therefore, addressing water damage in semi-rigid subgrades is crucial for extending pavement longevity and improving structural durability.
Water-permeable aggregate mixture (also known as fine-free or porous aggregate mixture) is highly regarded for its drainage capacity. As a drainage base material, it exhibits excellent strength and permeability and is widely applied in sponge city construction projects, enhancing urban water storage by facilitating rainwater infiltration, absorption, and reuse. This effectively drains accumulated water from the structural layer and mitigates pavement base damage [9,10,11].
As a subgrade drainage material, it provides high drainage efficiency, scour resistance, and mechanical strength, effectively removing stagnant water from structural layers and reducing subgrade deterioration. Initially developed in Europe, America, and Japan, it has been widely used in complex drainage systems and water retention areas [12,13]. Unlike traditional concrete, water-permeable aggregate mixtures have distinct aggregate grading, containing little to no fine aggregates [14,15]. Designed to maintain a high air void (AV) of 15–30%, these mixtures achieve permeability rates of 1.0–47.7 mm/sec, allowing for rapid drainage and effective mitigation of subgrade water damage [16,17,18].
Due to its environmentally friendly properties, pervious concrete has become a key research focus [19,20]. Yang J. et al. [21] and Goran Adil et al. [22] significantly improved its mechanical properties by incorporating silica fume and water-reducing agents, making it applicable to both sidewalks and pavement base layers. Wang Qijia [23] found that increasing base thickness enhances structural permeability, with sandy soils exhibiting higher permeability, making them better suited for permeable asphalt pavement construction. Zhong R. et al. [24] developed high-performance pervious concrete, improving mechanical durability without sacrificing hydraulic conductivity, thus expanding its application range.
Chandrappa A. K. et al. [25] reviewed research on the mechanical, hydrological, and durability characteristics of permeable cement-based materials, confirming their effectiveness in reducing pavement deterioration and their suitability for arterial roads and freeways. Yang Fenglin et al. [26] studied permeability performance using X-CT technology, revealing that increasing the water-cement ratio reduces permeability and connected porosity, while higher aggregate ratios and larger particle sizes increase permeability. Vahid et al. [27] comprehensively analyzed the effects of modified materials on pervious concrete, including auxiliary cement-like substances, high-molecular compounds, fiber reinforcements, rubber, nanomaterials, and reclaimed materials, demonstrating their impact on performance enhancement.
Qin Huimin et al. [28] discovered that the smaller the coarse aggregate particle size, the stronger the mechanical properties of pervious concrete, but the water permeability decreases. Xia Qun et al. [29] revealed that the addition of an appropriate amount of fly ash to pervious concrete can improve the frost resistance effect. Zhou Dafu et al. [30] showed that the water-cement ratio has a significant effect on the porosity, permeability coefficient, and compressive strength through the analysis of polarity and variance. Behlul Furkan Ozel et al. [31] analyzed the effect of different aggregates and fiber types on the mechanical and permeability properties of pervious concrete and found that similar results were obtained for granite and limestone, while steel and polypropylene fibers improved the abrasion resistance and permeability properties of pervious concrete, respectively. A comprehensive review of existing studies shows that many researchers have analyzed the mechanical and permeability properties of pervious concrete from the perspectives of aggregate type, gradation, and admixtures. However, limited attention has been given to the optimization of mix proportions and the improvement of scour resistance. Therefore, further investigation into mix design and scour resistance is warranted. Pervious concrete must function as both a reliable drainage material and a durable pavement component. Although extensive research has examined key influencing factors, such as water-cement ratio (w/c), void percentage, cement paste characteristics, coarse aggregate volume, and particle size, the optimal conditions for producing high-performance porous concrete remain undetermined [32].
This study addresses the above research gap by integrating Response Surface Methodology (RSM) and Analysis of Variance (ANOVA) to determine the optimal mix design parameters for pervious concrete. The main goal is to achieve a balance between mechanical strength and hydraulic performance. In the absence of universally accepted mix design guidelines, this study uses RSM to explore the optimal combination of material proportions. Mechanical performance indicators such as compressive strength and resilient modulus, as well as scour resistance, are systematically evaluated. Furthermore, the effects of scour time, frequency, and impact force on performance degradation are examined. The resulting variation in strength and modulus under different scouring conditions offers practical insights into improving the erosion resistance of pavement base materials and their engineering applications.

2. Materials and Experiments

2.1. Raw Materials and Specimens

2.1.1. Cement

In this research, the cementitious material employed turned out to be Portland cement (Changsha space Golden Road and Bridge Material Co., Ltd., Changsha, China) of grade 42.5 for general use (P.O. 42.5). Its properties were examined by testing for the degree of fineness, a test to determine the setting time, a test assessing the stability, and a test measuring the strength. The technical characteristics are presented in Table 1.

2.1.2. Coarse Aggregate

Compared to ordinary concrete, it is the case that pervious concrete has either no fine aggregate or an extremely small quantity of it, so the strength exhibited by pervious concrete hinges on the strength derived from coarse aggregate itself and the bonding effect of the paste made of cement. Within this paper, based on related literature search research and considering the drainage performance and economy of pervious concrete as the base layer, the selected limestone coarse aggregate (Changsha space Golden Road and Bridge Material Co. Ltd., Changsha, China) particle size is 4.75 mm–26.5 mm [33]. The results of the performance test of coarse aggregate according to the “Test Specifications for Aggregates in Highway Engineering” are shown in Table 2. The basic performance of raw materials meets the requirements of the specification.

2.1.3. Specimen Preparation
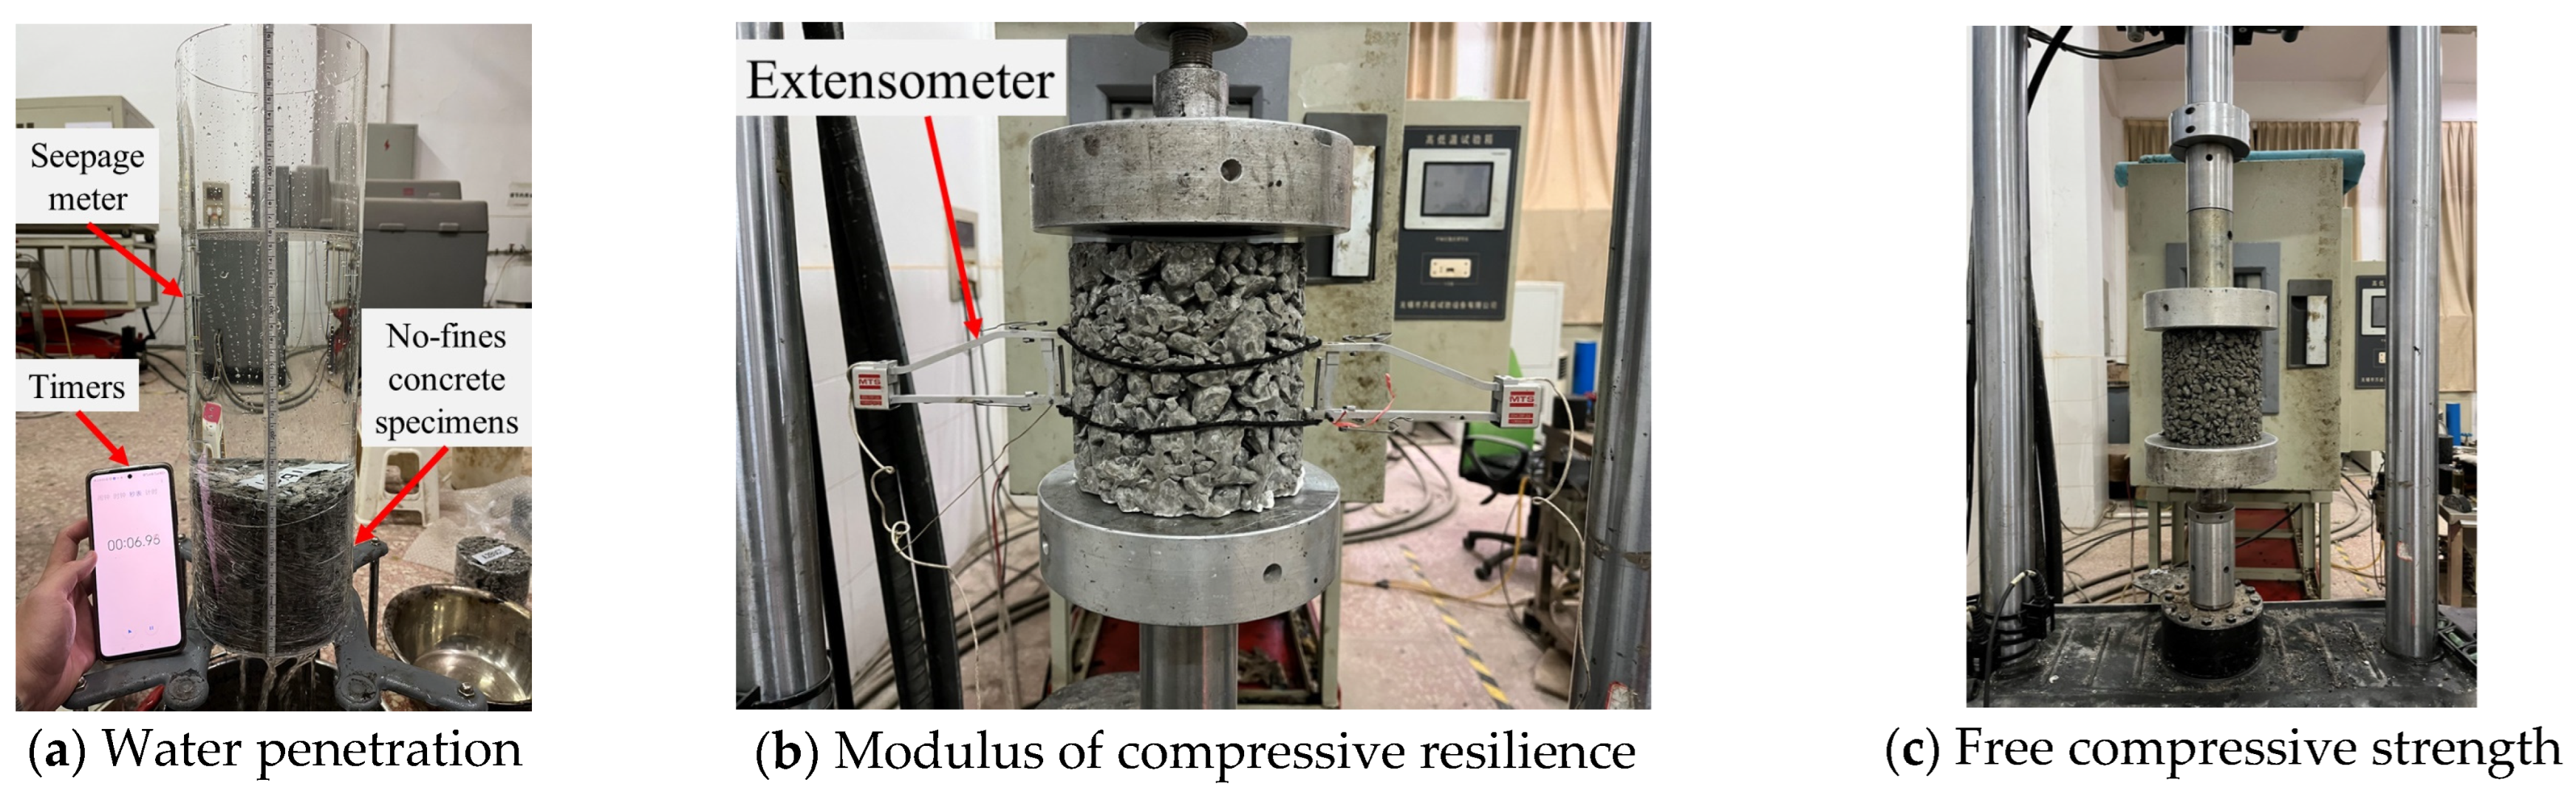
In this paper, based on reviewed related literature at home and abroad [34], three distinct water-cement ratios, specifically 0.3, 0.35, and 0.4, are involved in the experiment, three target porosities of 15%, 18%, and 21%, and three gradation curves are shown in Figure 1.
Each aggregate grade was well mixed within its specified gradation range, and the apparent density, surface dry density, gross bulk density, and vibration density of the mixed aggregates were determined. The mass of each component of pervious concrete per unit volume was calculated using the volumetric method of the specification [35]. The specific calculation process is presented in Equations (1)–(3).
m g = α ρ 0
V c + w = K 1 K
m c / ρ c + m w / ρ w = K 1 K
where α is the coarse aggregate mass reduction factor (0.98); mg represents the mass of the pervious concrete (g); mc corresponds to the mass of cement in the cement paste (g); mw is the mass of liquid in the cement paste (g); ρ0 is the compacted density associated with the mixed aggregates (g/cm3); ρc is the density of cement (g/cm3); ρw is the water density (g/cm3); K1 is the skeletal porosity that the pervious concrete has; K is the target porosity that the pervious concrete has; and Vc+w is the magnitude of the cement paste that exists in the infiltrative cement-based material (cm3).
After the above calculation process, the cement paste volume Vc+w shows a negative correlation with the target porosity K when it comes to porous cementitious composite skeleton porosity K1. Meanwhile, under the premise of determining the value of K, it is possible to calculate the volume of cement paste within a unit volume of pervious concrete. Finally, once the water-cement ratio w/c has been ascertained, the mass of each component of the pervious concrete per unit volume can be calculated according to the above three equations.
The effect of the concrete vibration and compaction process has a major impact on the quality of molding [36]. It has been proven that it is more reasonable to use the indoor vibration and compaction molding method for the design of cement-stabilized aggregates [37]. Based on the calculated proportion results and in accordance with the experimental methods in the specifications [38], those specimens being studied were molded by the compaction approach using vibration, and the diameter and height of the cylindrical specimens were 150 mm. Wait 2–6 h at room temperature before demolding to allow the pervious concrete to fully hydrate and develop sufficient strength to prevent deformation during demolding. Then it was moved into the standard curing room (temperature: 20 ± 2 °C, humidity: 95 ± 5%), one by one with a set of bags for curing.

2.2. Test Methods

It is the two aspects that have a determining influence on the strength of concrete: the correct design of the proportion and the standardized construction and curing process [39]. The response surface method is a commonly used statistical method in which each response is correlated with the number of variables gauging the effects, relationships, and interdependencies between the parameters [40]. Therefore, throughout this piece of writing, we make use of the response surface method to design the grading (A), the ratio between the amount of water and the amount of cement (B), and the porosity (C) that the pervious concrete aims to achieve to obtain their optimum combinations. Table 3 presents the magnitude of each test factor at different levels, while Table 4 details the test program. The compressive strength (T0805-2024), compressive resilience modulus (T0808-1994), and water penetration test (T0859-2009) were carried out on pervious concrete [38], and the trial procedure can be seen in Figure 2. Those samples being tested were cured for a one-week period and 90 days and submerged in the aquatic medium for a full 24-h period preceding the test. The water penetration test specimens were maintained for 28 days and air-dried at room temperature before the test.
Based on the optimal mix combination obtained from the response surface method, a scouring test was conducted on pervious concrete using China’s T0860-2009 test method (as shown in Figure 3) [38]. The specimens underwent 28 days of standard curing and were submerged in water for 24 h before testing.
To evaluate scour resistance, a comparative analysis was conducted between pervious concrete and cement-stabilized crushed stone subgrade materials, referencing relevant studies [41,42,43,44,45]. The scour mass loss rates of both materials were compared under standard scouring conditions: a force magnitude of 0.5 MPa, a scouring frequency of 10 Hz, and a scouring duration of 30 min.
Following the erosion test, the unconfined compressive strength and splitting tensile strength of pervious concrete were tested using T0805-2024 and T0806-1994, while the dynamic compressive resilience modulus and splitting resilience modulus were assessed using T0857-2009 and T0852-2009 [38]. The results of the splitting tests are presented in Figure 4.

3. Results and Discussions

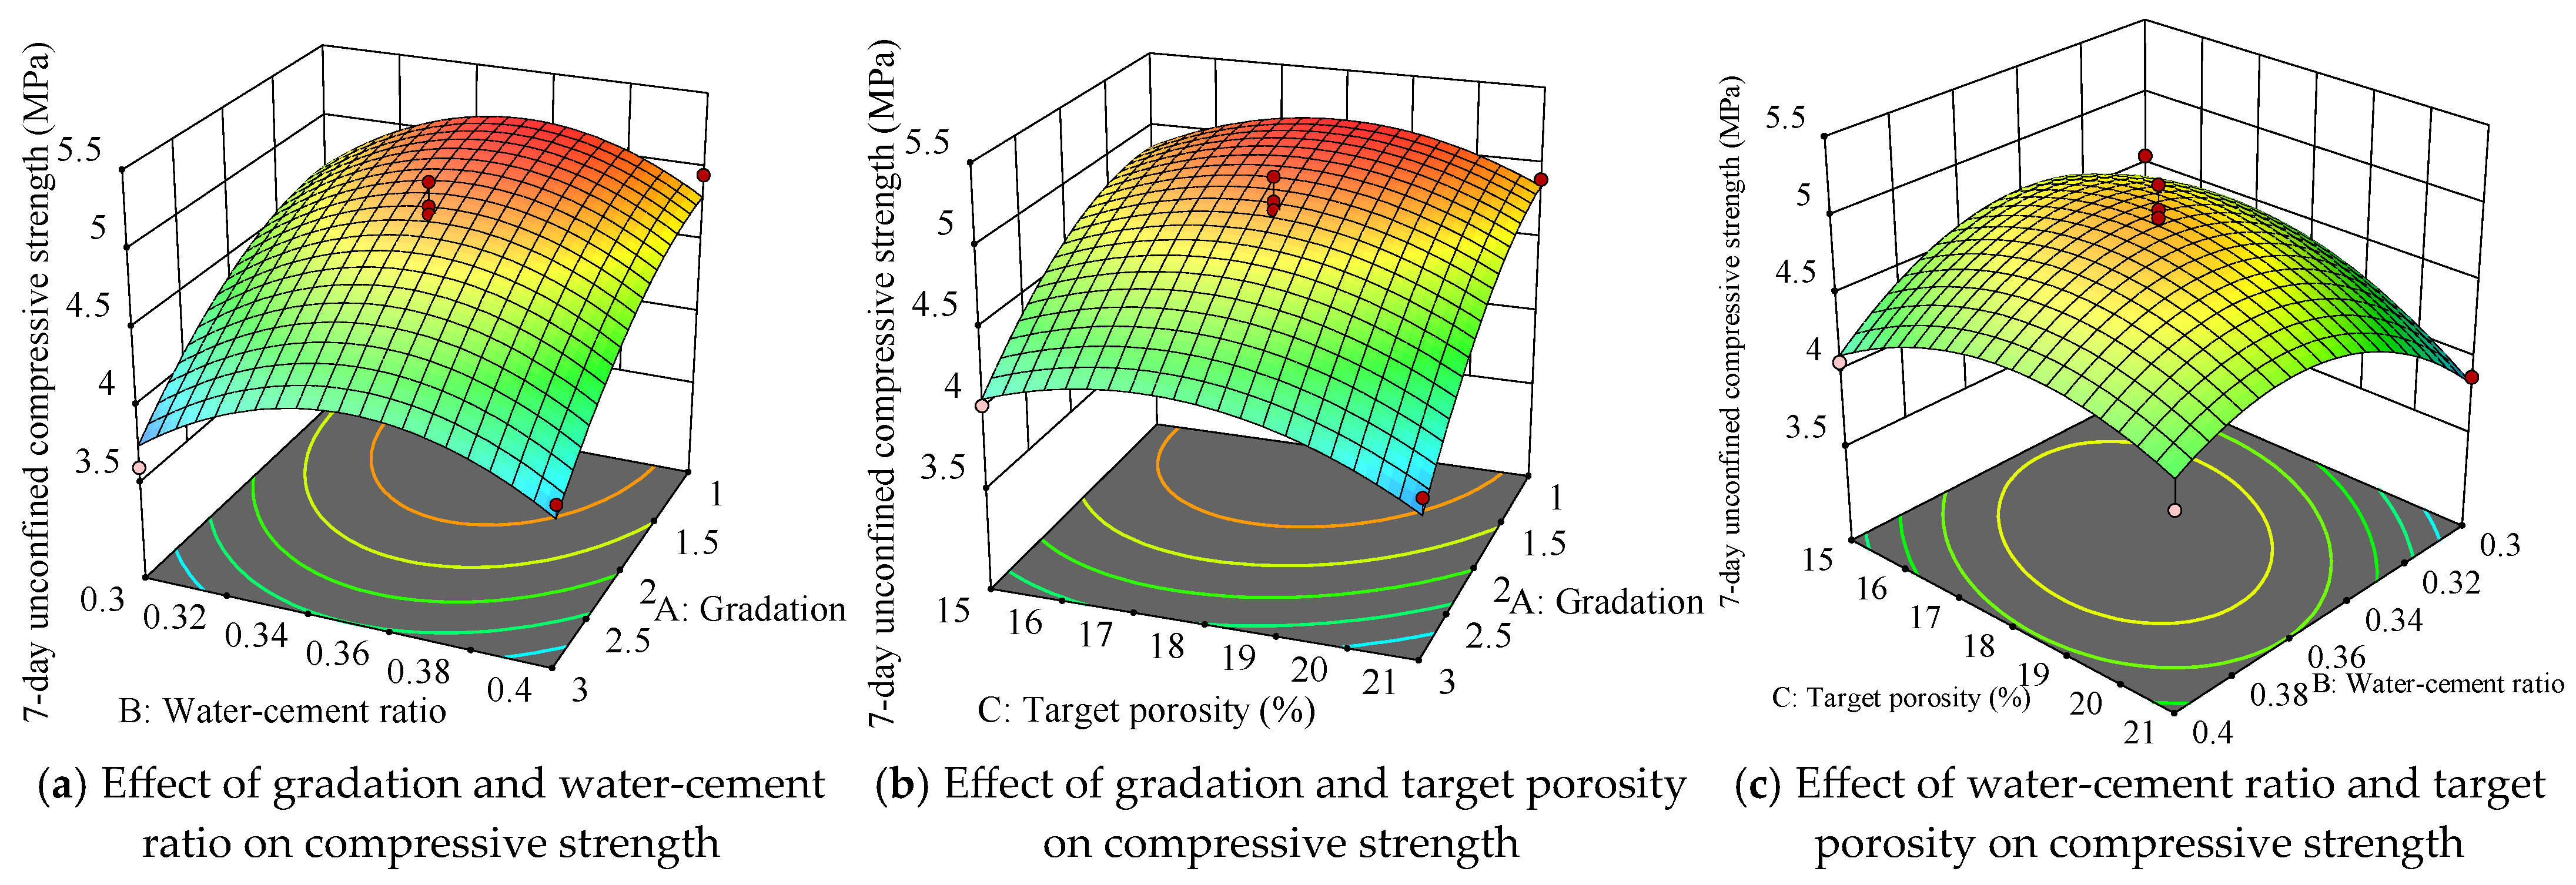
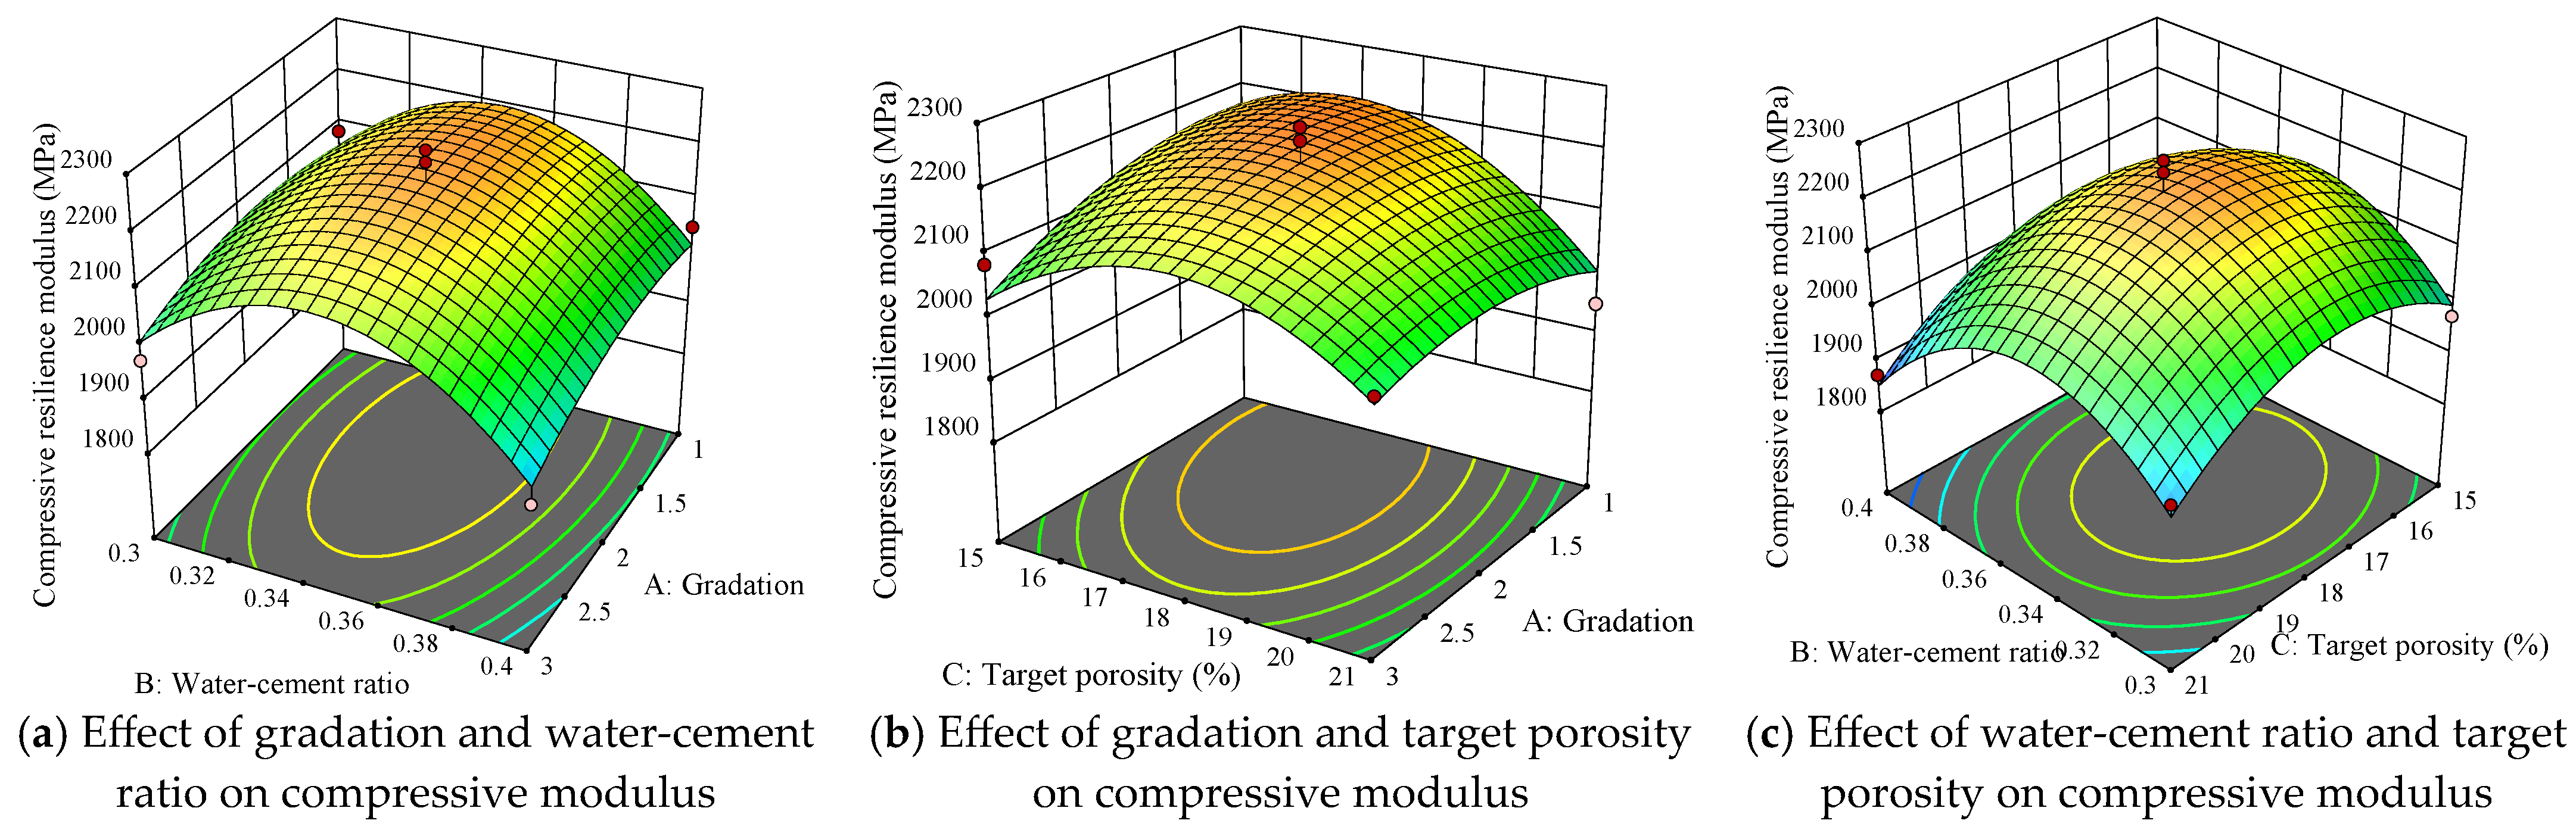
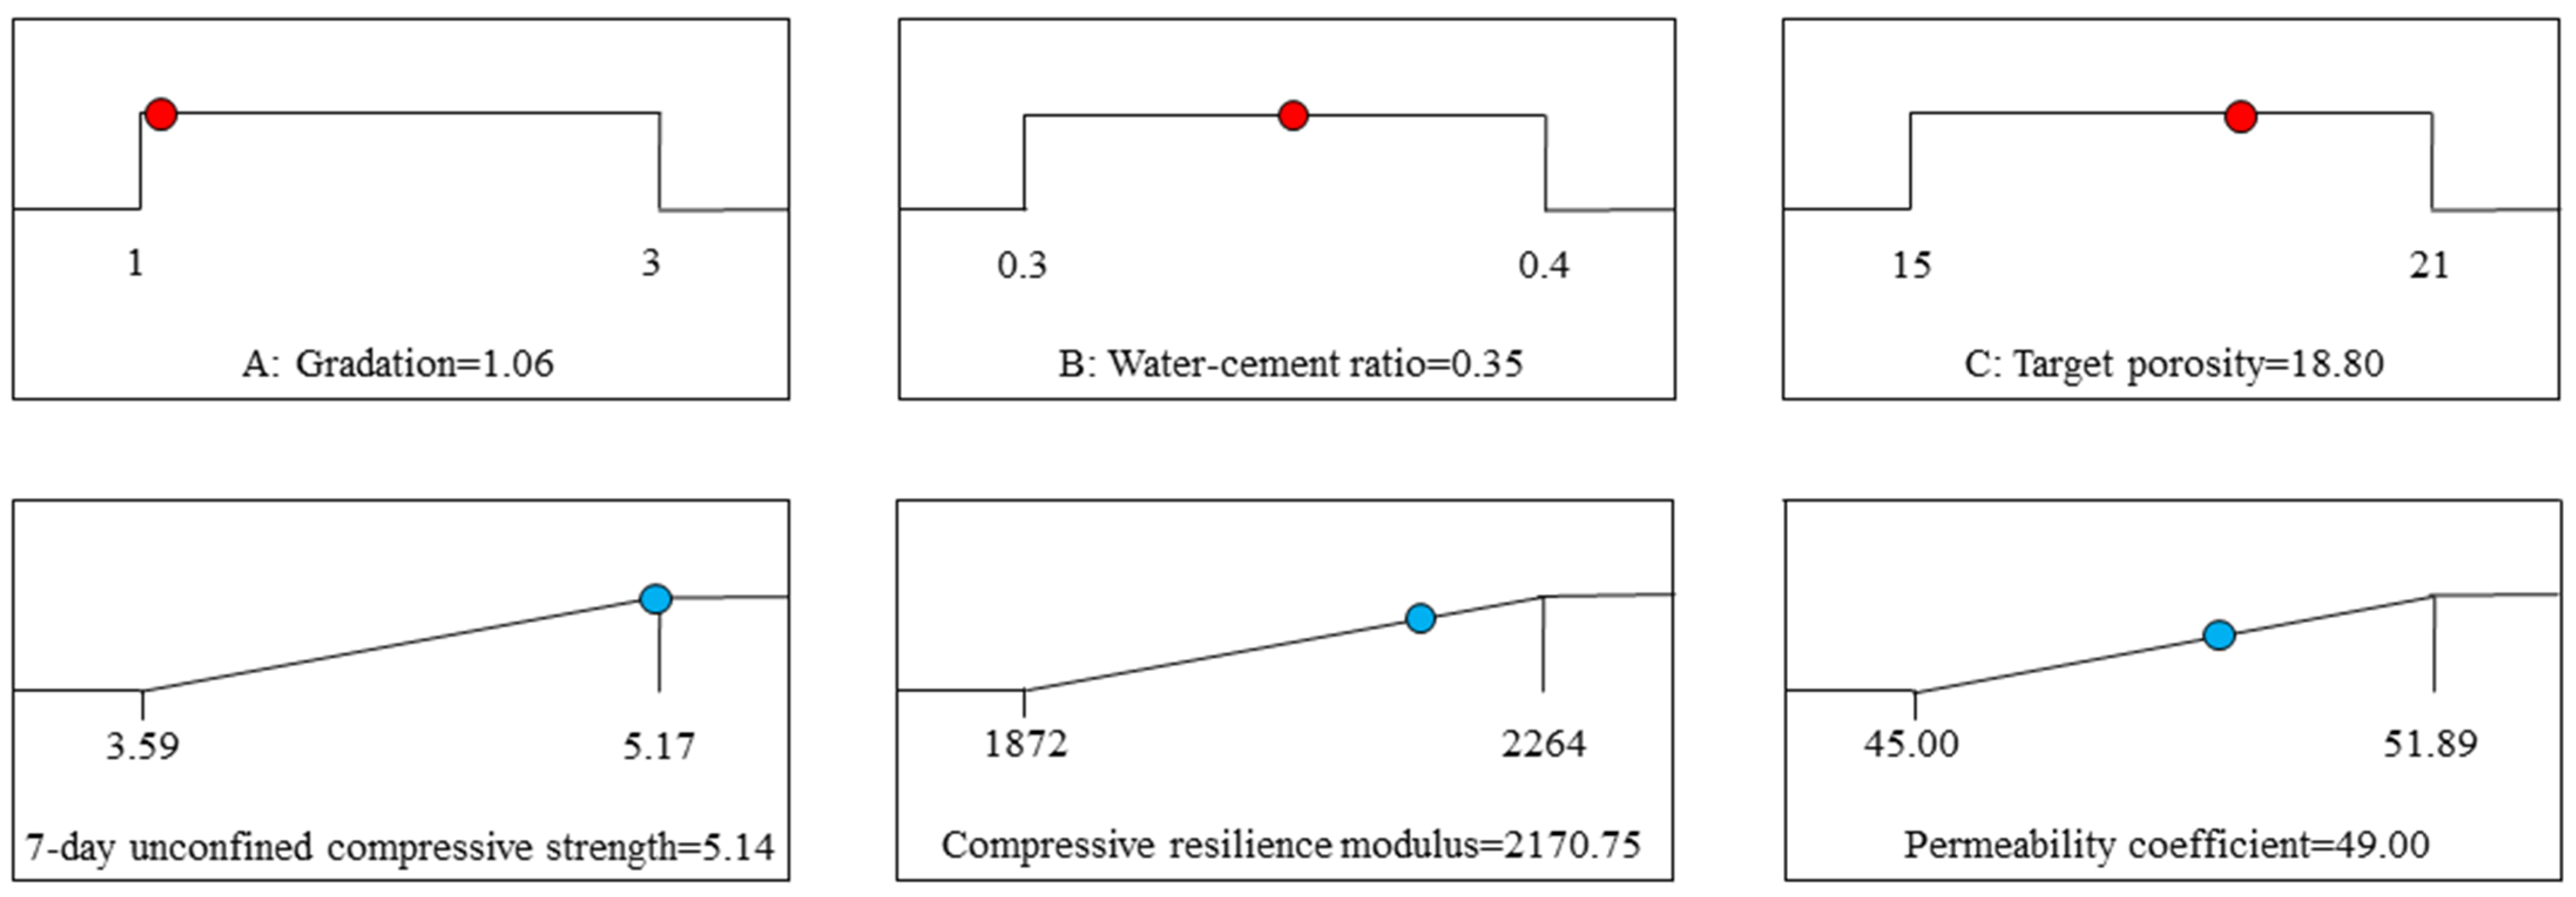
3.1. Optimized Design of Fit Ratio Based on Response Surface Methodology

Response surface methodology represents a frequently utilized statistical approach where each response is associated with several variables to ascertain the impacts, connections, and interplays among the variables. Various kinds of design frameworks can be employed in response surface examination to formulate statistical associations between responses and independent parameters. These design frameworks consist of central composite design, Box-Behnken design, historical record design, and others. The selection of the model hinges on the parameter and variance configurations for each factor being considered [46].
In this research, the outcomes of the response surface experiments are presented in Table 5. The response surface regression model was built by respectively using the unconfined compressive strength measured at the 7-day mark, the modulus of compressive resilience, and the permeability factor as the response variables, and the particle-size gradation (A), the ratio of water to cement (B), and the intended porosity (C) in the role of the independent items, respectively. With Design Expert 13.0 software, the response surface model can be obtained as shown in Equations (4)–(6):
R c = 4.91 0.4761 A + 0.0559 B 0.0835 C 0.022 A B 0.0808 A C + 0.1883 B C 0.2181 A 2 0.4415 B 2 0.3128 C 2
E c = 2208.8 30 A 27.12 B 43.88 C 7.75 A B + 38.75 A C 9 B C 41.4 A 2 165.15 B 2 112.65 C 2
K = 47.88 0.532 A + 0.1519 B + 2.31 C
where RC represents the compressive strength without lateral constraints measured over 7 days (MPa); EC denotes the modulus of resilience under compressive forces (MPa); K indicates the coefficient representing the rate of fluid passage through a porous medium (mL/s); A symbolizes the gradation, which is the distribution of particle sizes in a mixture; B represents the ratio of the mass of water to the mass of cement in a cement-based mixture; C stands for the target porosity, expressed as a percentage, which is the ratio of the volume of voids to the total volume of a material.
The response surface regression model was analyzed by ANOVA, and the outcomes are shown from the sixth table to the eighth table. In which the nonlinear regression models fitted for 7-day compressive strength without lateral confinement and modulus of resilience under compression had goodness-of-fit of 0.9097 and 0.9192, respectively, and this demonstrated that the models exhibited a high degree of fitting with reliability. The results of permeability coefficient fitting were linear regression models; moreover, the value of the permeability coefficient was directly linked to the size of the porosity that was targeted for (C) the concrete with permeability characteristics; the gradation (A) and the water-cement quotient (B) had a small effect on the permeability coefficient, and there was no interaction between the factors.
As can be seen from Table 6 and Table 7, the magnitude of the F-value of each factor is different, indicating that there are differences in their effects on 7-day crushing strength without lateral restraint and the modulus of resilience under compression. Among them, the order of influence on 7-day unconfined compressive strength is gradation (A) > target porosity (C) > water-cement ratio (B), while the order of influence on compressive resilient modulus is target porosity (C) > gradation (A) > water-cement ratio (B). In the analysis of variance of the regression equation of the permeability coefficient (Table 6), the p-value of target porosity was <0.0001, which was linearly related to the permeability coefficient (Table 8).
The 7-day unconfined compressive strength response surface is shown in Figure 5, and the compressive resilience modulus response surface is shown in Figure 6.
When the slope of the response surface is steeper, the interaction between the two factors has a greater impact on the response outcome; conversely, a smaller slope indicates a less pronounced effect. As shown in Figure 5 and Figure 6 (response surface plots) and Table 6 and Table 7 (ANOVA results), the interaction effects on 7-day unconfined compressive strength follow the order: water-cement ratio and target porosity (BC) > gradation and target porosity (AC) > gradation and water-cement ratio (AB). Similarly, the modulus of resilience during compression follows the order: gradation and target porosity (AC) > water-cement ratio and target porosity (BC) > gradation and water-cement ratio (AB).
Water-cement ratio and target porosity have the most significant influence on the response value, followed by gradation and target porosity, whereas the interaction between gradation and water-cement ratio has the least effect. In the response surface analysis of permeability, the response surface is an oblique plane, indicating no interaction between the factors; therefore, the response surface plot for the permeability coefficient is omitted.
According to the response surface method (RSM) fitting model and analysis results (Figure 7), the optimal combination of gradation (A), water-cement ratio (B), and target porosity (C) is determined as gradation I, water-cement ratio of 0.35, and target porosity of 18%. Under these conditions, the 7-day unconfined compressive strength is 5.1 MPa, the static compressive rebound modulus is 2171 MPa, and the permeability coefficient is 49 mL/s.
Referring to the specification of permeable cement concrete pavement [47], the thickness of the pervious concrete base is generally 15~30 cm. Based on the permeability coefficient obtained from the above optimal mix, combined with Darcy’s law and the thickness of pervious concrete as a base layer (15~30 cm), the hydraulic conductivity of pervious concrete can be calculated as 0.0027~0.0054 m2/s.

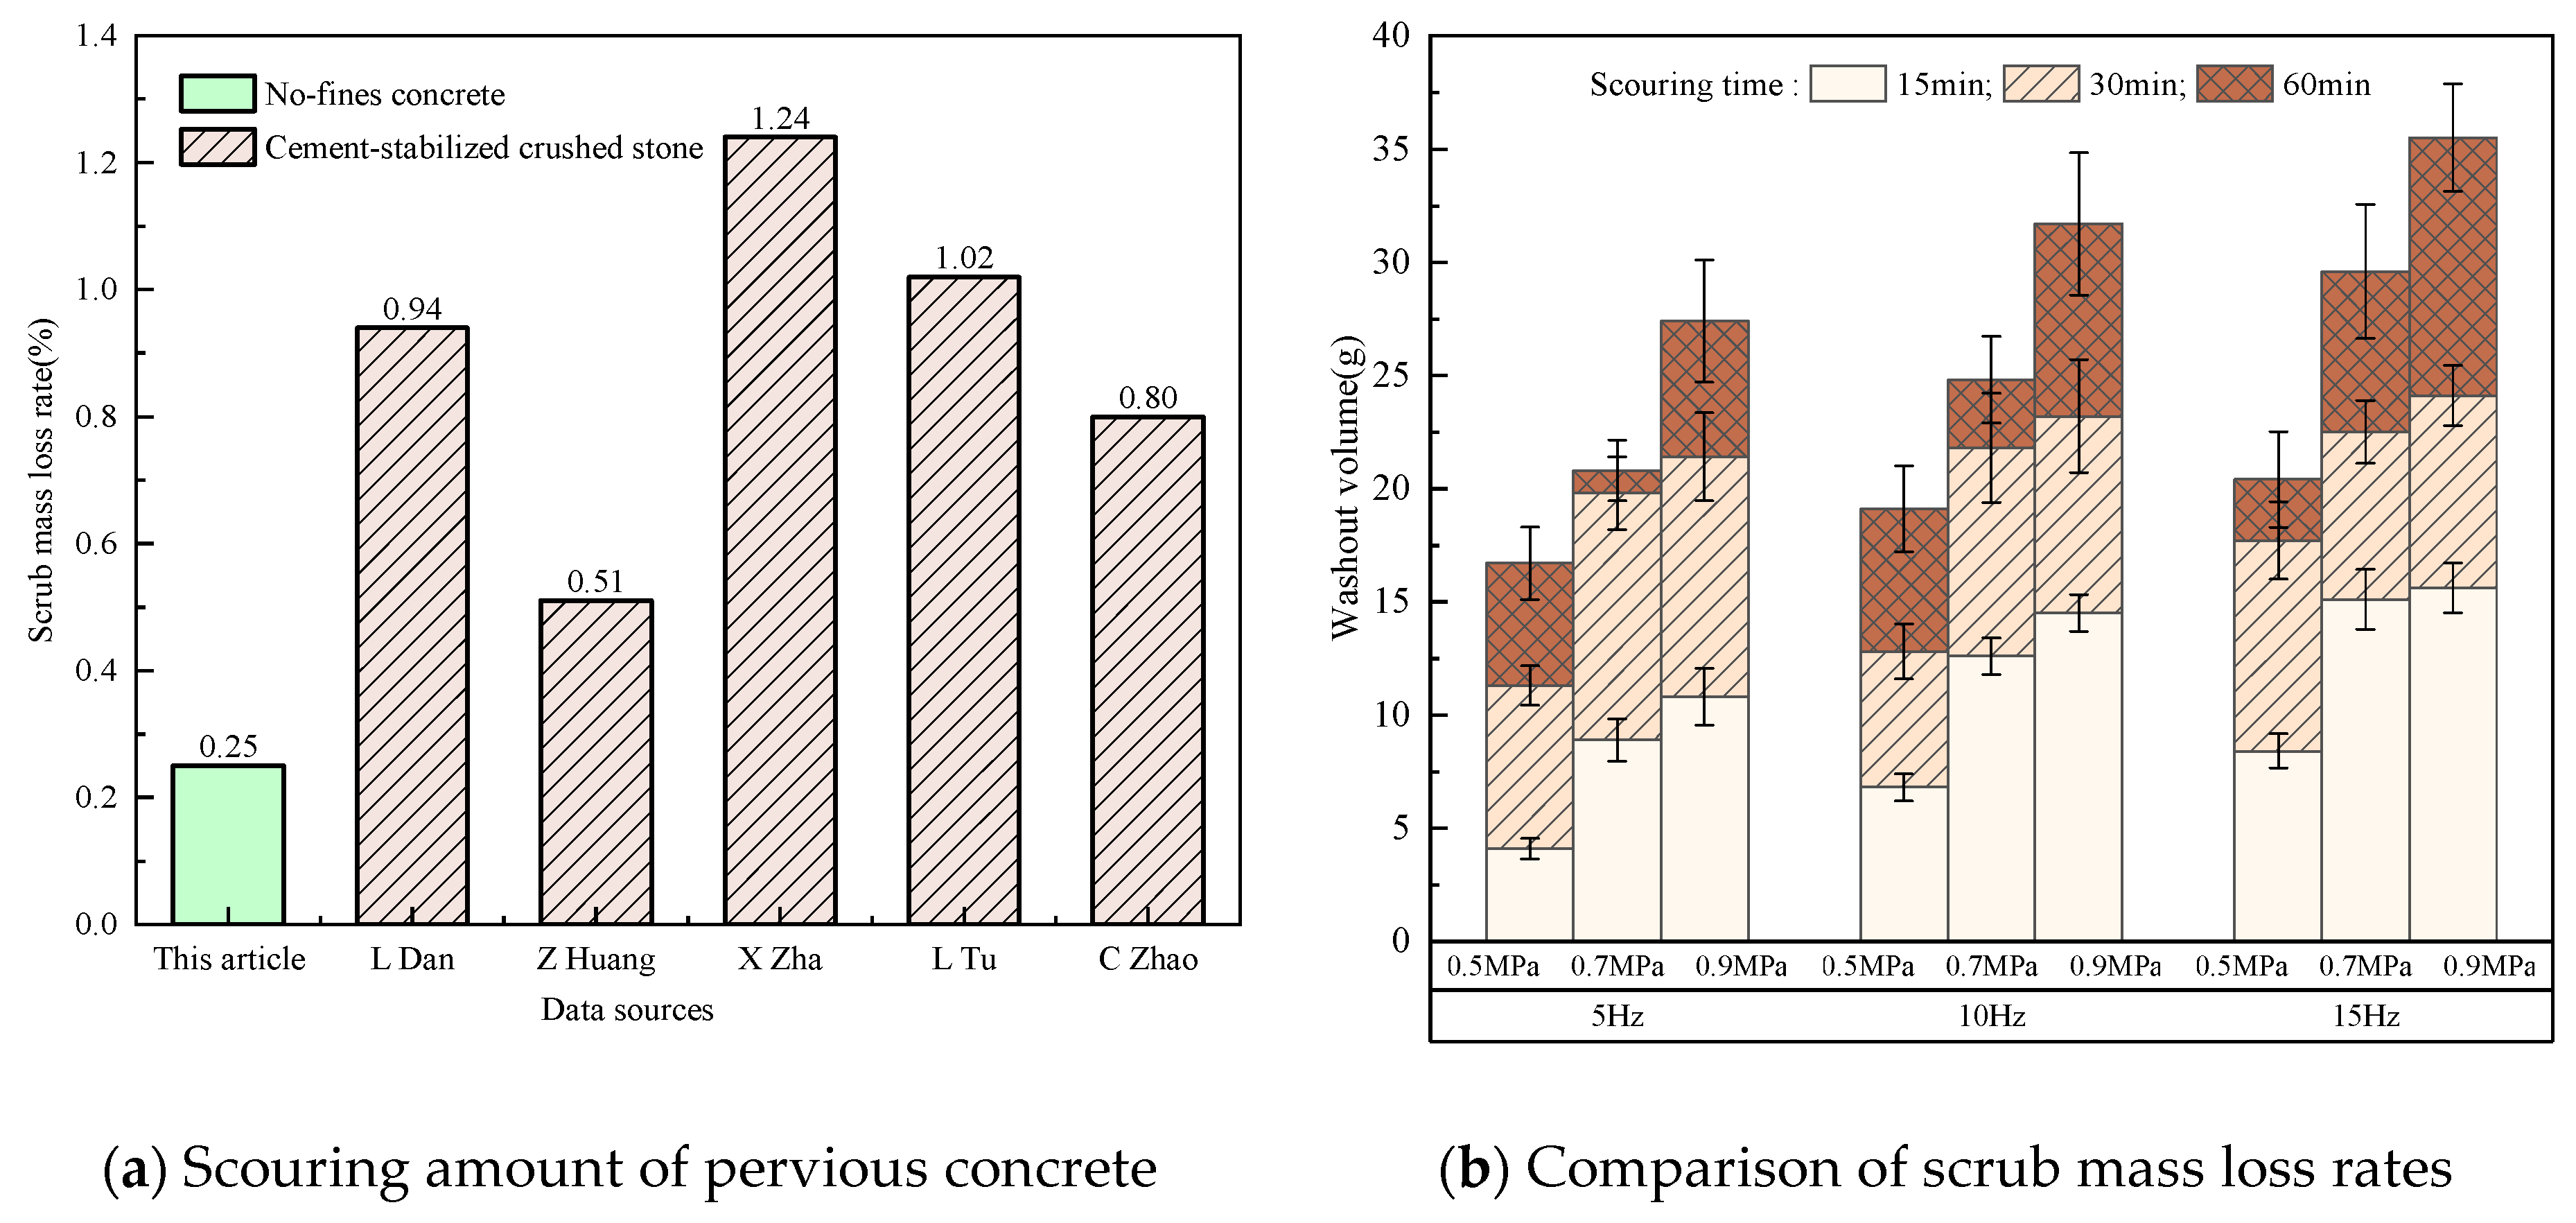
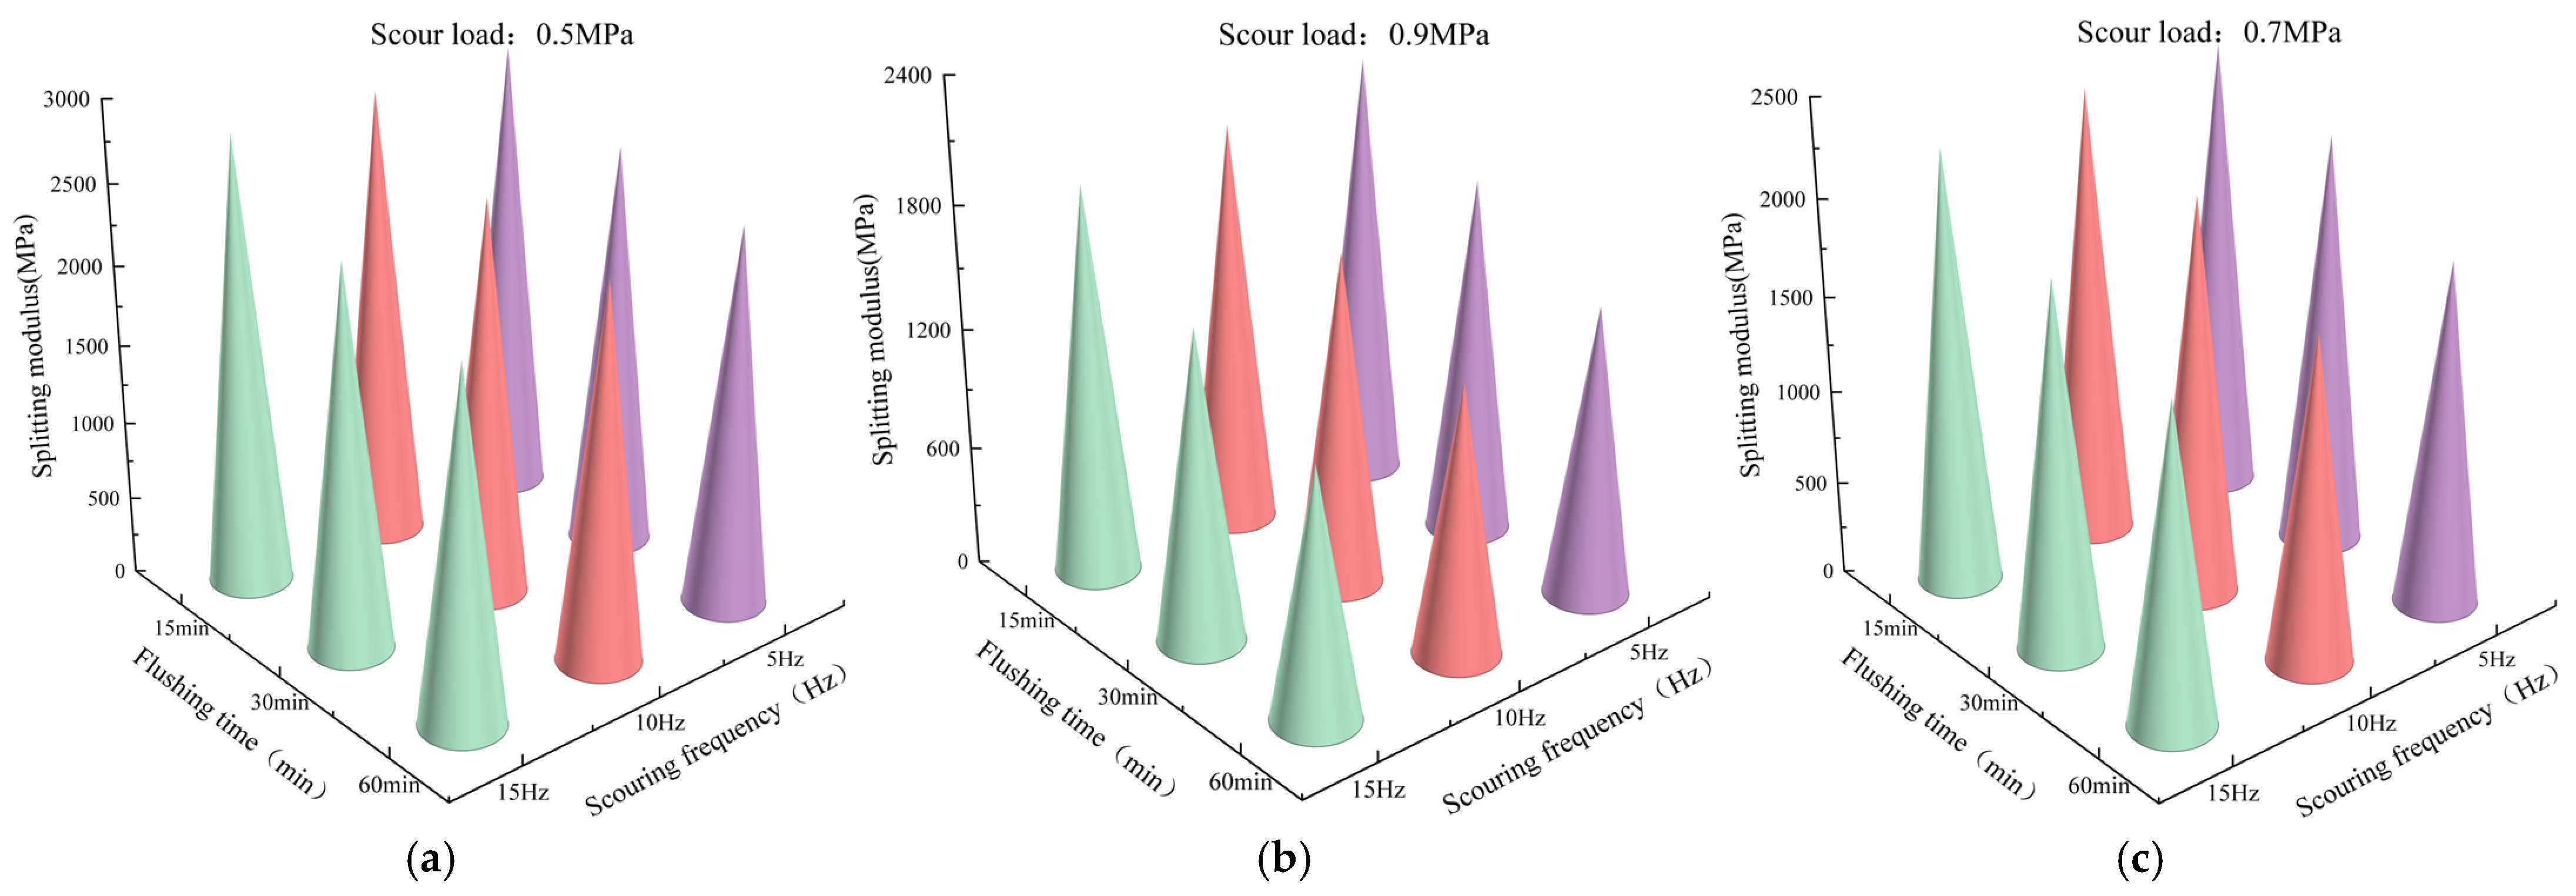
3.2. Analysis of Scour Resistance and Results of Strength and Modulus Under Different Scour Conditions

Based on the response surface method to obtain the optimal combination, the scouring test and the strength and modulus test under different scouring conditions were conducted on the pervious concrete specimens to obtain the scouring resistance and the mechanical property attenuation law of the open-graded concrete. The scour amount of open-graded concrete under different scour conditions is shown in Figure 8a, and the comparison of scour mass loss rate between pervious concrete and cement-stabilized aggregates under standard scour conditions is shown in Figure 8b.
As manifested in Figure 8a, under different scouring conditions, the scouring amount of pervious concrete shows a relatively consistent upward trend. The scour amount at 30 min scouring is larger than that at 15 min scouring, and the scour amount at 60 min scouring tends to be flat. With the increase in scouring time, the surface of the base material is first scoured with the looser aggregate, and the remaining aggregate is not easily damaged by dynamic water scouring due to the large internal friction resistance.
From Figure 8b, it can be seen that the scour mass loss rate of pervious concrete under standard scour conditions is 0.25%, while cement-stabilized crushed stone reaches an average scour mass loss rate of 0.9% in different literatures. This shows that pervious concrete has better scour resistance than cement-stabilized aggregates.
Fit a linear regression model to mf about t, f, and p as shown in Equation (7). Based on this regression model, the residual ε and the studentized residual ri are found, and the typical QQ graph of the studentized errors and the residual plot of the fitted values mf are made as shown in Figure 1.
m f = 14.312 + 0.301 t + 0.531 f + 24.156 p
where mf is the flushing amount, g; t is the flushing time, min; f is the flushing frequency, Hz; p is the impact force, MPa.
The Q-Q scatter plot of the residuals of the regression model (Figure 9a) shows that most of the points are basically on the theoretical straight line of the normal distribution except for a few points, and it can be concluded that the residuals of the model of regression obey the distribution with a characteristic symmetric bell curve. In addition, the residual plots (Figure 9b) about the 3 independent variables do not show any obvious trend. Therefore, by analyzing the residuals, it can be concluded that the linear regression model between mf, and t, f and p is more reasonable. The regression of a linear nature relationship is significant, and the square of the correlation index is R2 = 0.883, i.e., the linear part describes the vast majority of the amount of change in mf. According to the optimum combination obtained by the response surface method, strength and modulus tests took place using the pervious concrete specimens after standard scouring action. The test findings of unconfined crushing strength and dynamic compressive resilient moduli are presented in Figure 10. The test findings of split strength and split resilient moduli are presented in Figure 11.
Judging from Figure 10 and Figure 11, the decrease in unconfined compressive strength and dynamic compressive resilient modulus between 30 and 60 min of scouring is smaller than that between 15 and 30 min. This is primarily due to the high porosity of pervious concrete, which allows for small internal displacements under cyclic loading, leading to structural densification. As a result, the decline in unconfined compressive strength and dynamic resilient modulus gradually stabilizes with increased scouring time.
The average unconfined compressive strength and dynamic compressive resilient modulus of open-graded pervious concrete before scouring were 5.6 MPa and 22,526 MPa, respectively. After standard scouring, these values decreased to 4.7 MPa and 13,541 MPa, representing reductions of 16% and 40%, respectively. In comparison, the mean unconfined compressive strength and dynamic resilient modulus of cement-stabilized crushed stone were 4.3 MPa and 18,923 MPa, respectively. After standard scouring, these values dropped to 2.0 MPa and 9336 MPa, showing reductions of 53% and 51% [48,49].
The lower strength loss of pervious concrete (16%) compared to cement-stabilized gravel (53%) can be attributed to its interconnected porosity, which mitigates internal water pressure during scouring, thereby enhancing its scour resistance.
Judging from Figure 12 and Figure 13, the decay patterns of splitting tensile strength and splitting tensile rebound modulus are generally consistent. As scouring time increases, both splitting tensile strength and splitting tensile rebound modulus decrease, and the rate of decay gradually slows. The average 28-day splitting tensile strength and splitting tensile rebound modulus of pervious concrete were 1.5 MPa and 2986 MPa, respectively. After standard scouring conditions, these values decreased to 1.0 MPa and 2506 MPa, representing reductions of 33% and 16%, respectively. In contrast, the splitting tensile strength of cement-stabilized gravel after 28 days of curing ranged from 0.2 to 0.5 MPa [50,51], and it turned out that the splitting strength of infiltrating concrete was still 2–5 times higher than that of cement-stabilized gravel even after standard scouring conditions. Therefore, compared with cement-stabilized gravel, pervious concrete base material has more excellent mechanical properties and scour resistance.

4. Conclusions

In this study, the response surface analysis method is based on the pervious concrete for the optimization of the design of the proportion. The scouring test of infiltrating concrete was implemented to analyze the variation rule of mechanical parameters of infiltrating concrete after different scouring conditions. The principal conclusions are outlined as follows:
(1)
The optimal mix proportion of pervious concrete was determined as Grade I, a water-cement ratio of 0.35, and a target porosity of 18% based on a three-factor, three-level optimization framework. This proportion achieves a balance between hydraulic conductivity, mechanical strength, and durability, providing a reliable reference for practical applications.
(2)
Under standard scour conditions, the scour mass loss of pervious concrete was 0.25%, showing a 72% improvement in scour resistance compared to cement-stabilized aggregates. Due to its excellent resistance to scour-induced deterioration, pervious concrete effectively mitigates water-related pavement damage, ensuring long-term structural stability and offering a cost-effective solution for high-traffic pavement bases.
(3)
After scouring, the compressive strength, splitting tensile strength, dynamic compressive resilience modulus, and splitting resilience modulus of pervious concrete decreased by 16%, 33%, 40%, and 16%, respectively. Compared with cement-stabilized gravel (53% strength loss), pervious concrete exhibited significantly lower strength loss (16%) due to its interconnected porosity, which reduces internal water pressure during scouring. Overall, pervious concrete outperforms cement-stabilized gravel in mechanical strength, scour resistance, and durability, making it a promising material for high-load road base applications.
(4)
This study optimized the mix design of pervious concrete using RSA and ANOVA and evaluated its mechanical performance and scour resistance under different conditions. Future research will focus on field validation, long-term durability assessments, and integrating numerical simulations and machine learning to optimize mix design and predict material behavior.

Author Contributions

X.D.: Conceptualization, Writing—original draft; Investigation; Formal analysis. X.P.: Methodology, writing, review, and editing. H.L.: Resources, Writing—review and editing, Supervision. All authors have read and agreed to the published version of the manuscript.

Funding

This research was funded by the programs of Wuhan Comprehensive Transportation Research Institute Co., Ltd. [020200-120441], [020200-120442].

Data Availability Statement

Some or all data, models, or codes that support the findings of this study are available from the corresponding author upon reasonable request.

Conflicts of Interest

Author Xiaoxuan Du was employed by the company Wuhan Comprehensive Transportation Research Institute Co., Ltd. The remaining authors declare that the research was conducted in the absence of any commercial or financial relationships that could be construed as a potential conflict of interest.

Correction Statement

This article has been republished with a minor correction to the existing affiliation information. This change does not affect the scientific content of the article.

References

  1. Ministry of Transport of the People’s Republic of China. 2023 Transportation Industry Development Statistics Bulletin. China Communications New, 18 June 2024. [Google Scholar] [CrossRef]
  2. Zhu, T.; Tan, Z.; Zhou, Y. Experimental Research on Erosion-Resistance Performances of Semi-rigid Base Materials. J. Build. Mater. 2013, 16, 608–613. [Google Scholar] [CrossRef]
  3. Guo, R.; Nian, T.; Li, P.; Fu, J.; Guo, H. Anti-erosion performance of asphalt pavement with a sub-base of cement-treated mixtures. Constr. Build. Mater. 2019, 223, 278–287. [Google Scholar] [CrossRef]
  4. Li, S.; Wu, G.; Shi, H. Acoustic emission characteristics of semi-rigid bases with three moisture conditions during bending tests. Road Mater. Pavement Des. 2019, 20, 187–198. [Google Scholar] [CrossRef]
  5. Sheng, Y.; Chen, S.; Wang, D.; Wang, L. Pore water pressure characteristics of semi-rigid base for cement concrete pavement. J. Traffic Transp. Eng. 2012, 12, 6–12. [Google Scholar] [CrossRef]
  6. Zhao, M.; Xu, X.; Liu, Y.; Wu, C.; Sun, Q.; Pei, Y. Microcracking treatment mechanism of semi-rigid base asphalt pavement with discrete-continuous coupling simulation. Case Stud. Constr. Mater. 2024, 20, e2850. [Google Scholar] [CrossRef]
  7. Rokitowski, P.; Bzówka, J.; Grygierek, M. Influence of high moisture content on road pavement structure: A Polish case study. Case Stud. Constr. Mater. 2021, 15, e594. [Google Scholar] [CrossRef]
  8. Sha, A. Material characteristics of semi-rigid base. China J. Highw. Transp. 2008, 21, 1–5. [Google Scholar] [CrossRef]
  9. Cai, J.; Liu, Z.; Xu, G.; Tian, Q.; Shen, W.; Li, B.; Chen, T. Mix design methods for pervious concrete based on the mesostructure: Progress, existing problems and recommendation for future improvement. Case Stud. Constr. Mater. 2022, 17, e1253. [Google Scholar] [CrossRef]
  10. Cai, J.; Chen, J.; Shi, J.; Tian, Q.; Xu, G.; Du, Y. A novel approach to evaluate the clogging resistance of pervious concrete. Case Stud. Constr. Mater. 2022, 16, e864. [Google Scholar] [CrossRef]
  11. Li, F.; Liu, C.H.; Wu, T.; Li, Z.W.; Shi, J.Q.; Lu, J.X. Optimization of mixing ratio of pervious concrete. Build. Mater. World 2024, 45, 46–51. [Google Scholar]
  12. Wang, C.; Zhang, T.; Xie, X.; Li, B.; Yang, D. Mix Proportion Design Method of Pervious Concrete Based on Aggregate Sphericity. J. Build. Mater. 2022, 25, 235–241. [Google Scholar] [CrossRef]
  13. Cosic, K.; Korat, L.; Ducman, V.; Netinger, I. Influence of aggregate type and size on properties of pervious concrete. Constr. Build. Mater. 2015, 78, 69–76. [Google Scholar] [CrossRef]
  14. Moretti, L.; Di Mascio, P.; Fusco, C. Porous concrete for pedestrian pavements. Water 2019, 11, 2105. [Google Scholar] [CrossRef]
  15. Song, H.; Yao, J.; Xiang, J. The role of aggregate and cement paste in the deterioration of the transitional interface zone of pervious concrete during freeze-thaw cycles. Case Stud. Constr. Mater. 2022, 16, e1086. [Google Scholar] [CrossRef]
  16. Rangelov, M.; Nassiri, S.; Haselbach, L.; Englund, K. Using carbon fiber composites for reinforcing pervious concrete. Constr. Build. Mater. 2016, 126, 875–885. [Google Scholar] [CrossRef]
  17. Giustozzi, F. Polymer-modified pervious concrete for durable and sustainable transportation infrastructures. Constr. Build. Mater. 2016, 111, 502–512. [Google Scholar] [CrossRef]
  18. Elizondo-Martínez, E.; Andres-Valeri, V.; Jato-Espino, D.; Rodriguez-Hernandez, J. Review of porous concrete as multifunctional and sustainable pavement. J. Build. Eng. 2020, 27, 100967. [Google Scholar] [CrossRef]
  19. Yu, F.; Guo, J.; Liu, J.; Cai, H.; Huang, Y. A review of the pore structure of pervious concrete: Analyzing method, characterization parameters and the effect on performance. Constr. Build. Mater. 2023, 365, 129971. [Google Scholar] [CrossRef]
  20. Singh, A.; Sampath, P.V.; Biligiri, K.P. A review of sustainable pervious concrete systems: Emphasis on clogging, material characterization, and environmental aspects. Constr. Build. Mater. 2020, 261, 120491. [Google Scholar] [CrossRef]
  21. Yang, J.; Jiang, G. Experimental study on properties of pervious concrete pavement materials. Cem. Concr. Res. 2003, 33, 381–386. [Google Scholar] [CrossRef]
  22. Adil, G.; Kevern, J.T.; Mann, D. Influence of silica fume on mechanical and durability of pervious concrete. Constr. Build. Mater. 2020, 247, 118453. [Google Scholar] [CrossRef]
  23. Wang, Q. Research on the structure of permeable asphalt pavement for urban roads. Eng. Constr. Des. 2025, 1, 128–130. [Google Scholar] [CrossRef]
  24. Zhong, R.; Wille, K. Material design and characterization of high performance pervious concrete. Constr. Build. Mater. 2015, 98, 51–60. [Google Scholar] [CrossRef]
  25. Chandrappa, A.K.; Biligiri, K.P. Pervious concrete as a sustainable pavement material–Research findings and future prospects: A state-of-the-art review. Constr. Build. Mater. 2016, 111, 262–274. [Google Scholar] [CrossRef]
  26. Yang, F.; Zhao, Y.; Ni, K.; Yang, F.; Gao, J. Research on water permeability performance of permeable concrete based on X-CT technology. Concr. Cem. Prod. 2025, 1, 1–6. [Google Scholar] [CrossRef]
  27. Alimohammadi, V.; Maghfouri, M.; Nourmohammadi, D.; Azarsa, P.; Gupta, R.; Saberian, M. Stormwater runoff treatment using pervious concrete modified with various nanomaterials: A comprehensive review. Sustainability 2021, 13, 8552. [Google Scholar] [CrossRef]
  28. Qin, H.; Li, W.; Zhang, Y. Effects of rough aggregate particle size and grade on performance of permeable concrete. Concrete 2025, 185–187+192. [Google Scholar] [CrossRef]
  29. Xia, Q.; Zhao, C.; Zhu, P.; Yan, X.; Wang, S.; Zhu, X. Influence of fly ash on salt-freezing resistance and permeability of recycled permeable concrete with straight channels. Concrete 2024, 95–99+110. [Google Scholar] [CrossRef]
  30. Zhou, D.; Chen, D.; Yang, F.; Yao, Y.; Mei, J.; Wang, X. Study on the influence of material composition on the properties of permeable concrete. Concrete 2024, 120–124. [Google Scholar] [CrossRef]
  31. Ozel, B.F.; Sakallı, Ş.; Şahin, Y. The effects of aggregate and fiber characteristics on the properties of pervious concrete. Constr. Build. Mater. 2022, 356, 129294. [Google Scholar] [CrossRef]
  32. Ramadhansyah, P.J.; Ibrahim, M.Y.M.; Hainin, M.R.; Ibrahim, M.H.W. A review of porous concrete pavement: Applications and engineering properties. Appl. Mech. Mater. 2014, 554, 37–41. [Google Scholar] [CrossRef]
  33. Qu, G.; Yan, Z.; Zhen, M.; Liu, H.; Yuan, Y. Performance Prediction of Porous Concrete Based on Neural Network and Regression Analysis. J. Jilin Univ. (Eng. Technol. Ed.) 2024, 55, 269–282. [Google Scholar] [CrossRef]
  34. Yang, Z.; Ma, W.; Shen, W.; Zhou, M. The aggregate gradation for the porous concrete pervious road base material. J. Wuhan Univ. Technol.-Mater. Sci. Ed 2008, 23, 391–394. [Google Scholar] [CrossRef]
  35. JTG/T F30-2014; Technical Guidelines for Construction of Highway Cement Concrete Pavements. Ministry of Transport of the People’s Republic of China: Beijing, China, 2014.
  36. Tian, Z.; Ma, Y.; Li, J. Research Progress on Vibration Compaction of Concrete. J. Build. Mater. 2024, 27, 46–57. [Google Scholar] [CrossRef]
  37. Li, Z.; Liu, J.; Jing, H.; Wu, W.; Sun, Y. Vibration Compaction Time of Cement-Stabilized Crushed Rock Material Based on Micro-skeleton Indices. J. Build. Mater. 2019, 22, 553–558. [Google Scholar] [CrossRef]
  38. JTG 3441-2024; Test Methods of Materials Stabilized with Inorganic Binders for Highway Engineering. Ministry of Transport of the People’s Republic of China: Beijing, China, 2024.
  39. Wang, S.; Hu, P.; Chen, S.; Xiao, Y. Prediction of Concrete Compressive Strength Based on Coupled BAS-MLP. J. Build. Mater. 2023, 26, 705–715. [Google Scholar] [CrossRef]
  40. Huang, M.; Cai, S.; Liu, Q. Optimization of mining filling material ratios by coupling orthogonal testing and response surface methodology. Exp. Technol. Manag. 2023, 40, 35–41. [Google Scholar] [CrossRef]
  41. Huang, Z.; Xiao, M.; Peng, B.; Yu, X.; Zhu, Y. Study of Cement Stabilized Macadam Properties based on Fine Aggregate Filling Coefficient. Highway 2017, 62, 29–35. [Google Scholar]
  42. Dan, Z.; Chen, F.; Chen, W.; Wang, Q.; Wang, Q. Road Performance Study of Cement Stabilized Gravel Mixture Based on Vibratory Mixing Technology. Technol. Highw. Transp. 2018, 34, 21–26. [Google Scholar] [CrossRef]
  43. Tu, L.; Xu, M.; Fan, L.; Wang, L.; Liu, Z. Research on Mechanical Properties of Recycled Cement Stabilized Crushed Stone Based on Vibration Mode. J. Wuhan Univ. Technol. 2022, 44, 20–26. [Google Scholar]
  44. Zha, X.; Cao, Y.; Liu, G. Research on mix design and pavement performances for anti-crack cement stabilized macadam. J. Chang. Univ. Sci. Technol. (Nat. Sci.) 2013, 10, 1–6. [Google Scholar] [CrossRef]
  45. Zhang, C. Test and Analysis on the Performance of the Cement Treated Permeable Base. Highway 2014, 59, 161–164. [Google Scholar]
  46. Adamu, M.; Ayeni, K.O.; Haruna, S.I.; Mansour, Y.E.I.; Haruna, S. Durability performance of pervious concrete containing rice husk ash and calcium carbide: A response surface methodology approach. Case Stud. Constr. Mater. 2021, 14, e547. [Google Scholar] [CrossRef]
  47. CJJ/T 135-2009; Technical specification for pervious cement concrete pavement. Ministry of Housing and Urban-Rural Development of the People’s Republic of China: Beijing, China, 2009.
  48. Guo, R.; Jiang, H.; Liu, C.; Chen, W. Experimental Study on Scour Resistance of Semi-Rigid Subgrade for Pavements. J. Shaanxi Univ. Technol. (Nat. Sci. Ed.) 2018, 34, 17–22. [Google Scholar] [CrossRef]
  49. Liu, J.; Wang, S.; Shi, K.; Zhang, C. Anti-erosion Performance and Fatigue Characteristics of Cement Concrete Pavement Base Materials. J. Highw. Transp. Res. Dev. 2022, 39, 43–49. [Google Scholar] [CrossRef]
  50. Han, H.; Li, J. Experimental Study on Strength Properties of Cement Stabilized Aggregate Base. Road Mach. Constr. Mech. 2016, 33, 41–45. [Google Scholar] [CrossRef]
  51. Zhou, R.; Yan, G.; Wang, J. Study on mechanical properties of water-stabilized gravel under moisturizing and nourishing membrane nourishment. Highw. Transp. Sci. Technol. (Appl. Technol. Ed.) 2016, 12, 205–206. [Google Scholar]
Figure 1. Gradation curve related to pervious concrete.
Buildings 15 01485 g001
Figure 2. Water penetration, the measurement factor of compressive resilience, and the ability to withstand compressive forces are tests related to the pervious concrete.
Buildings 15 01485 g002
Figure 3. Scouring test for pervious concrete.
Buildings 15 01485 g003
Figure 4. The tests for pervious concrete covering splitting strength and splitting resilient modulus are of great significance.
Buildings 15 01485 g004
Figure 5. 7-day unconfined compressive strength response surface plot.
Buildings 15 01485 g005
Figure 6. Response surface of compressive resilient modulus.
Buildings 15 01485 g006
Figure 7. Ramp view with optimized pervious concrete mix ratio.
Buildings 15 01485 g007
Figure 8. Scouring amount and mass loss rate of pervious concrete.
Buildings 15 01485 g008
Figure 9. QQ scatter plot of the residuals of the regression model and the residuals of the fitted values of mf.
Buildings 15 01485 g009
Figure 10. Compressive strength of pervious concrete under different scour conditions.
Buildings 15 01485 g010
Figure 11. Dynamic compressive resilient modulus of pervious concrete under different scour conditions.
Buildings 15 01485 g011
Figure 12. Splitting strength of pervious concrete under different scour conditions.
Buildings 15 01485 g012
Figure 13. Resilience modulus of pervious concrete under different scour conditions.
Buildings 15 01485 g013
Table 1. Main engineering-related properties of cement.
Test ItemsTest Outcomes Technical SpecificationsTest Procedures
Fineness detection (%)0.5≤10%T0502-2005
Time to Set (in minutes)Initial Set284≥180T0502-2005
Final Set403≥360T0502-2005
Specific surface area (m2/kg)382300 m2/kg~450 m2/kgT0504-2005
Stability (mm)3≤5T0505-2020
Cement Mortar Strength (MPa)Flexural Strength (3 Days)4.6≥2.5T0506-2005
Compressive Strength (3 Days)19.5≥10T0506-2005
Table 2. The technical indexes and results obtained from the tests on coarse aggregate.
Aggregate Size (mm)Densities (g/cm2)Mud Content (%)Content of Needle and Flake Particles (%)Crushing Value (%)
Apparent DensitySuperficial Dry DensityGross Bulk CompactnessTest FindingsTechnical ConditionTest FindingsTechnical ConditionTest FindingsTechnical Condition
26.5~192.8432.8122.8030.38≤13.3≤157.8≤28
19~162.8352.8112.8010.495.2
16~13.22.8302.8082.7970.657.4
13.2~9.52.8272.8042.7940.818.6
9.5~4.752.8252.7982.7910.9310.1
Table 3. RSM test factors and levels of pervious concrete mix ratio optimization.
FactorLevel
−101
A Gradation123
B Water-cement ratio0.30.350.4
C Target porosity (%)151821
Table 4. RSM test scheme for mix proportion optimization of pervious concrete.
Serial NumberCoding LevelVariable Value
A GradationB Water-Cement RatioC Target Porosity (%)A GradationB Water-Cement RatioC Target Porosity (%)
101−1II0.415
2000II0.3518
30−11II0.321
4110III0.418
5011II0.421
6101III0.3521
7000II0.3518
810−1III0.3515
9−101I0.3521
10000II0.3518
11000II0.3518
120−1−1II0.315
13−110I0.418
141−10III0.318
15000II0.3518
16−1−10I0.318
17−10−1I0.3515
Table 5. RSM test results of pervious concrete mix ratio optimization.
Serial NumberA GradationB Water-Cement RatioC Target Porosity (%)Rc 7-day Unconfined Compressive Strength (MPa)Ec Compressive Resilience Modulus (MPa)K Permeability Coefficient (mL/s)
1II0.4154.5208448.1
2II0.35183.5197446.5
3II0.3214.9204647.2
4III0.4183.8190547.5
5II0.4214.7215646.4
6III0.35214.0208445.0
7II0.35184.8194851.8
8III0.35153.8203150.4
9I0.35214.5197245.0
10II0.35184.0193546.5
11II0.35183.8194549.8
12II0.3154.1187249.3
13I0.4185.1226448.1
14III0.3185.0224348.1
15II0.35184.5218447.1
16I0.3184.8215847.4
17I0.35154.9219548.8
Table 6. Analysis of variance of the regression equation for 7-day unconfined compressive strength.
SourceSquared SumDegree of FreedomSquared MeanF-Valuep-ValueSignificance
Mould3.6590.40537.840.0064**
A Gradation1.8111.8135.070.0006**
B Water-cement ratio0.02510.0250.4830.5095
C Target porosity (%)0.055810.05581.080.3335
AB0.001910.00190.03740.8521
AC0.026110.02610.50440.5005
BC0.141810.14182.740.1417
A 2 0.200210.20023.870.0898
B 2 0.820910.820915.880.0053**
C 2 0.41210.4127.970.0257*
Deviation0.36270.0517
Fit Failure0.16130.05371.070.4563
Unexplained error0.20140.0502
Full correlation4.0116
R2 = 0.9097, RAdj2 = 0.7937, *: Significant difference (p < 0.05), **: Difference highly significant (p < 0.01).
Table 7. Variance analysis of the regression equation for compressive resilient modulus.
SourceSquared SumDegree of FreedomSquared MeanF-Valuep-ValueSignificance
Mould2.26 × 105925,082.738.850.0045**
A Gradation7200172002.540.155
B Water-cement ratio5886.1215886.122.080.1927
C Target porosity (%)15,400.13115,400.135.430.0525
AB240.251240.250.08480.7794
AC6006.2516006.252.120.1888
BC32413240.11430.7452
A 2 7216.6717216.672.550.1546
B 2 1.15 × 10511.15 × 10540.520.0004**
C 2 53,431.67153,431.6718.850.0034**
Residual19,839.5572834.22
Lack of fit12,236.7534078.922.150.2372
Pure error7602.841900.7
Cor total2.46 × 10516
R2 = 0.9192, RAdj2 = 0.8153, **: Difference highly significant (p < 0.01).
Table 8. Analysis of Variance (ANOVA) for the regression equation of infiltration coefficient.
SourceSquared SumDegree of FreedomSquared MeanF-Valuep-ValueSignificance
Mould45.18315.0625.31<0.0001**
A Gradation2.2612.263.80.073
B Water-cement ratio0.184510.18450.31010.5871
C Target porosity (%)42.73142.7371.81<0.0001**
Residual7.74130.5951
Lack of fit5.9690.66231.490.371
Pure error1.7840.4438
Cor total52.9216
R2 = 0.8538, RAdj2 = 0.8201, **: Difference highly significant (p < 0.01).
Disclaimer/Publisher’s Note: The statements, opinions and data contained in all publications are solely those of the individual author(s) and contributor(s) and not of MDPI and/or the editor(s). MDPI and/or the editor(s) disclaim responsibility for any injury to people or property resulting from any ideas, methods, instructions or products referred to in the content.

