Article

Research on the Shear Performance of Concrete Beams Strengthened with Lateral External Prestressing

1
Hunan Provincial Key Laboratory of Intelligent Disaster Prevention–Mitigation and Ecological Restoration in Civil Engineering, Hunan Institute of Engineering, Xiangtan 411104, China
2
College of Civil Engineering, Chongqing University, Chongqing 400045, China
*
Author to whom correspondence should be addressed.
Buildings 2025, 15(9), 1482; https://doi.org/10.3390/buildings15091482
Submission received: 4 April 2025 / Revised: 23 April 2025 / Accepted: 24 April 2025 / Published: 27 April 2025
(This article belongs to the Collection Advanced Concrete Structures in Civil Engineering)

Abstract

Urban renewal and improving the structural resilience of infrastructure are the hotspots of attention in all walks of life. The structural resilience of existing infrastructure and engineering structures is deteriorating with the increase in service life. In order to quickly improve the structural resilience and service life of existing engineering structures, a new method of rapid reinforcement for in-service concrete beams is proposed in this paper, which is the external prestressed reinforcement method of the side façade. The specific procedure involves creating a penetration hole at each end of the side surface of the concrete beam, inserting a prestressed support rod into the hole and subsequently installing a prestressed long bolt within the support rod. External prestress is applied to the side façade of the concrete beam through prestressed bolts. A total of 21 reinforced concrete beams were designed and manufactured, including 3 contrast beams of ordinary concrete, 9 concrete beams reinforced with traditional external prestressing steel and 9 concrete beams reinforced with externally prestressed steel on side façades. Different initial prestressing forces were applied to the reinforced beams, and flexural shear tests and numerical analyses were carried out on the concrete beams. The failure modes and shear resistances were analyzed. This research demonstrates that, in comparison with the control beam, the ultimate bearing capacity of the traditionally externally prestressed concrete beams increased by 137.8% to 140.8%, depending on the initial prestress difference. For the externally prestressed concrete beams applied to the side façade, these increases range from 42.6% to 52.0%. Furthermore, the cracking load and yield load of the reinforced concrete beams are significantly enhanced, thereby improving their operational performance. Additionally, the numerical results confirm that the theoretical calculations align well with the experimental findings.

1. Introduction

As the service life of engineering structures increases, there is a concomitant deterioration in their structural resilience, which leads to cracks, spalling, and other forms of damage. However, these structures do not yet meet the criteria for demolition or scrapping [1,2,3,4,5]. Consequently, the implementation of a reinforcement method is recommended in order to sustain their load-bearing capacity. However, it should be noted that the conventional reinforcement approach results in an augmentation of the dead weight of the beam, thereby exerting an adverse effect on the stability and functionality of the original structure. This requires removing stressed components or making major structural modifications, which in turn has a detrimental effect on the intended utilization [6,7,8,9,10]. In this study, a novel external prestressed reinforcement technique for the side façades of a beam was invented (ZL 2019 2 1264085.9) [11], which is characterized by its simplicity in terms of construction and cost-effectiveness. This technology facilitates the online strengthening of damaged components without increasing the structure’s self-weight, thereby enhancing the cracking resistance, bearing capacity, stiffness and stability of the components. Additionally, it reduces the deformation of the components, ensuring enhanced safety and reliability of the structure. The technology has been demonstrated to reduce the frequency and costs of post-maintenance repairs, operation and maintenance.
The external prestressing reinforcement technology originated in France and was further developed and refined by the German engineer Franz Dischinger. This technology primarily addresses the performance issues of concrete components during their service life and has evolved through several stages, including theoretical research, material innovation, and intelligent development. With ongoing technological advancements and the broadening of its application scope, external prestressed reinforcement technology has emerged as a critical method for modern structural reinforcement [12,13,14,15,16,17]. Conventional concrete beam design frequently prioritizes the bending strength, with a comparatively limited emphasis on the shear performance. However, the shear performance constitutes a pivotal factor influencing the safety and reliability of structures. As structural loads increase and environmental usage conditions evolve, the issue of shear performance in concrete beams becomes increasingly pronounced [18,19,20,21,22,23]. Consequently, researchers must undertake in-depth research on the mechanical behavior and shear performance of external prestressed concrete members and establish more accurate calculation models and design methods.
The study of the shear resistance of concrete members commenced in the 1920s, with a predominant focus on the theoretical underpinnings of the shear foundation of concrete beams. Subsequently, in the 1930s, Moor and Weil elucidated the fundamental mechanisms governing shear failure [24]. The 1980s witnessed a significant advancement in experimental technology, prompting numerous researchers to undertake exhaustive studies on the shear performance of concrete beams through experimental means [25]. In the 1990s, a design method based on the shear and bending moment balance was proposed to improve the shear design theory [26,27,28]. In recent years, the introduction of intelligent sensors and monitoring technology has enabled the real-time monitoring of the shear performance of concrete beams, and the application of big data and artificial intelligence has enhanced the prediction and analysis capabilities of this technology.
The novel external prestressing technology of side façades proposed in this paper has the potential to address the challenges associated with the strengthening of concrete members, enhancing safety and economic efficiency in construction engineering. In this study, the finite element model of externally prestressed reinforced concrete beams with side façades was established using ABAQUS (v2023) software. The correctness of the finite element model was validated by comparing it with the experimental results, which indirectly confirmed the validity of the test findings. Furthermore, the force mechanism was investigated, and an improved design calculation method was proposed. Additionally, to explore the influencing factors on the shear performance of externally prestressed concrete beams with side façades, parametric analyses were conducted by varying the component parameters to identify the underlying reasons.

2. Experimental Design

2.1. Materials and Their Properties

The materials utilized in the test, along with their associated parameters, are presented in Table 1.

2.2. Experimental Design and Parameters

A total of 21 concrete beams were successfully cast. The types, quantities, numbers, and reinforcement details of the beams utilized in the tests are presented in Table 2.
Figure 1 shows the cross-section dimensions of the beam specimen and the layout of the reinforcement.

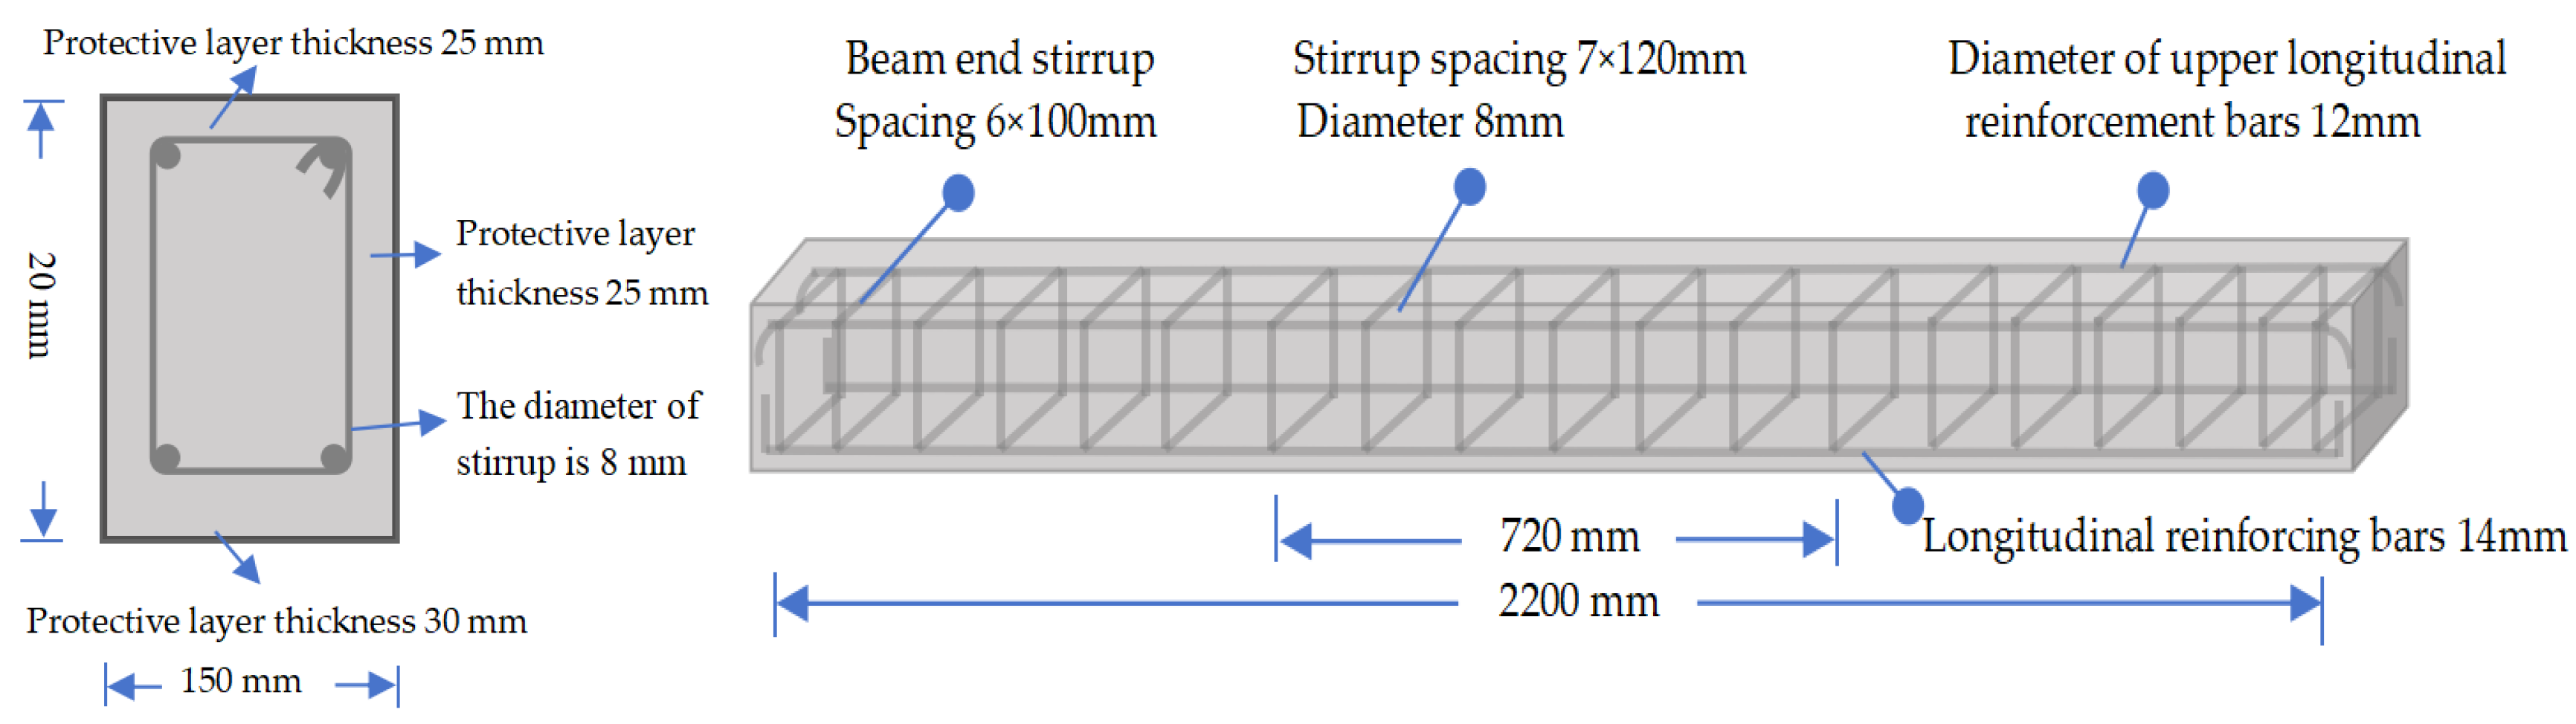
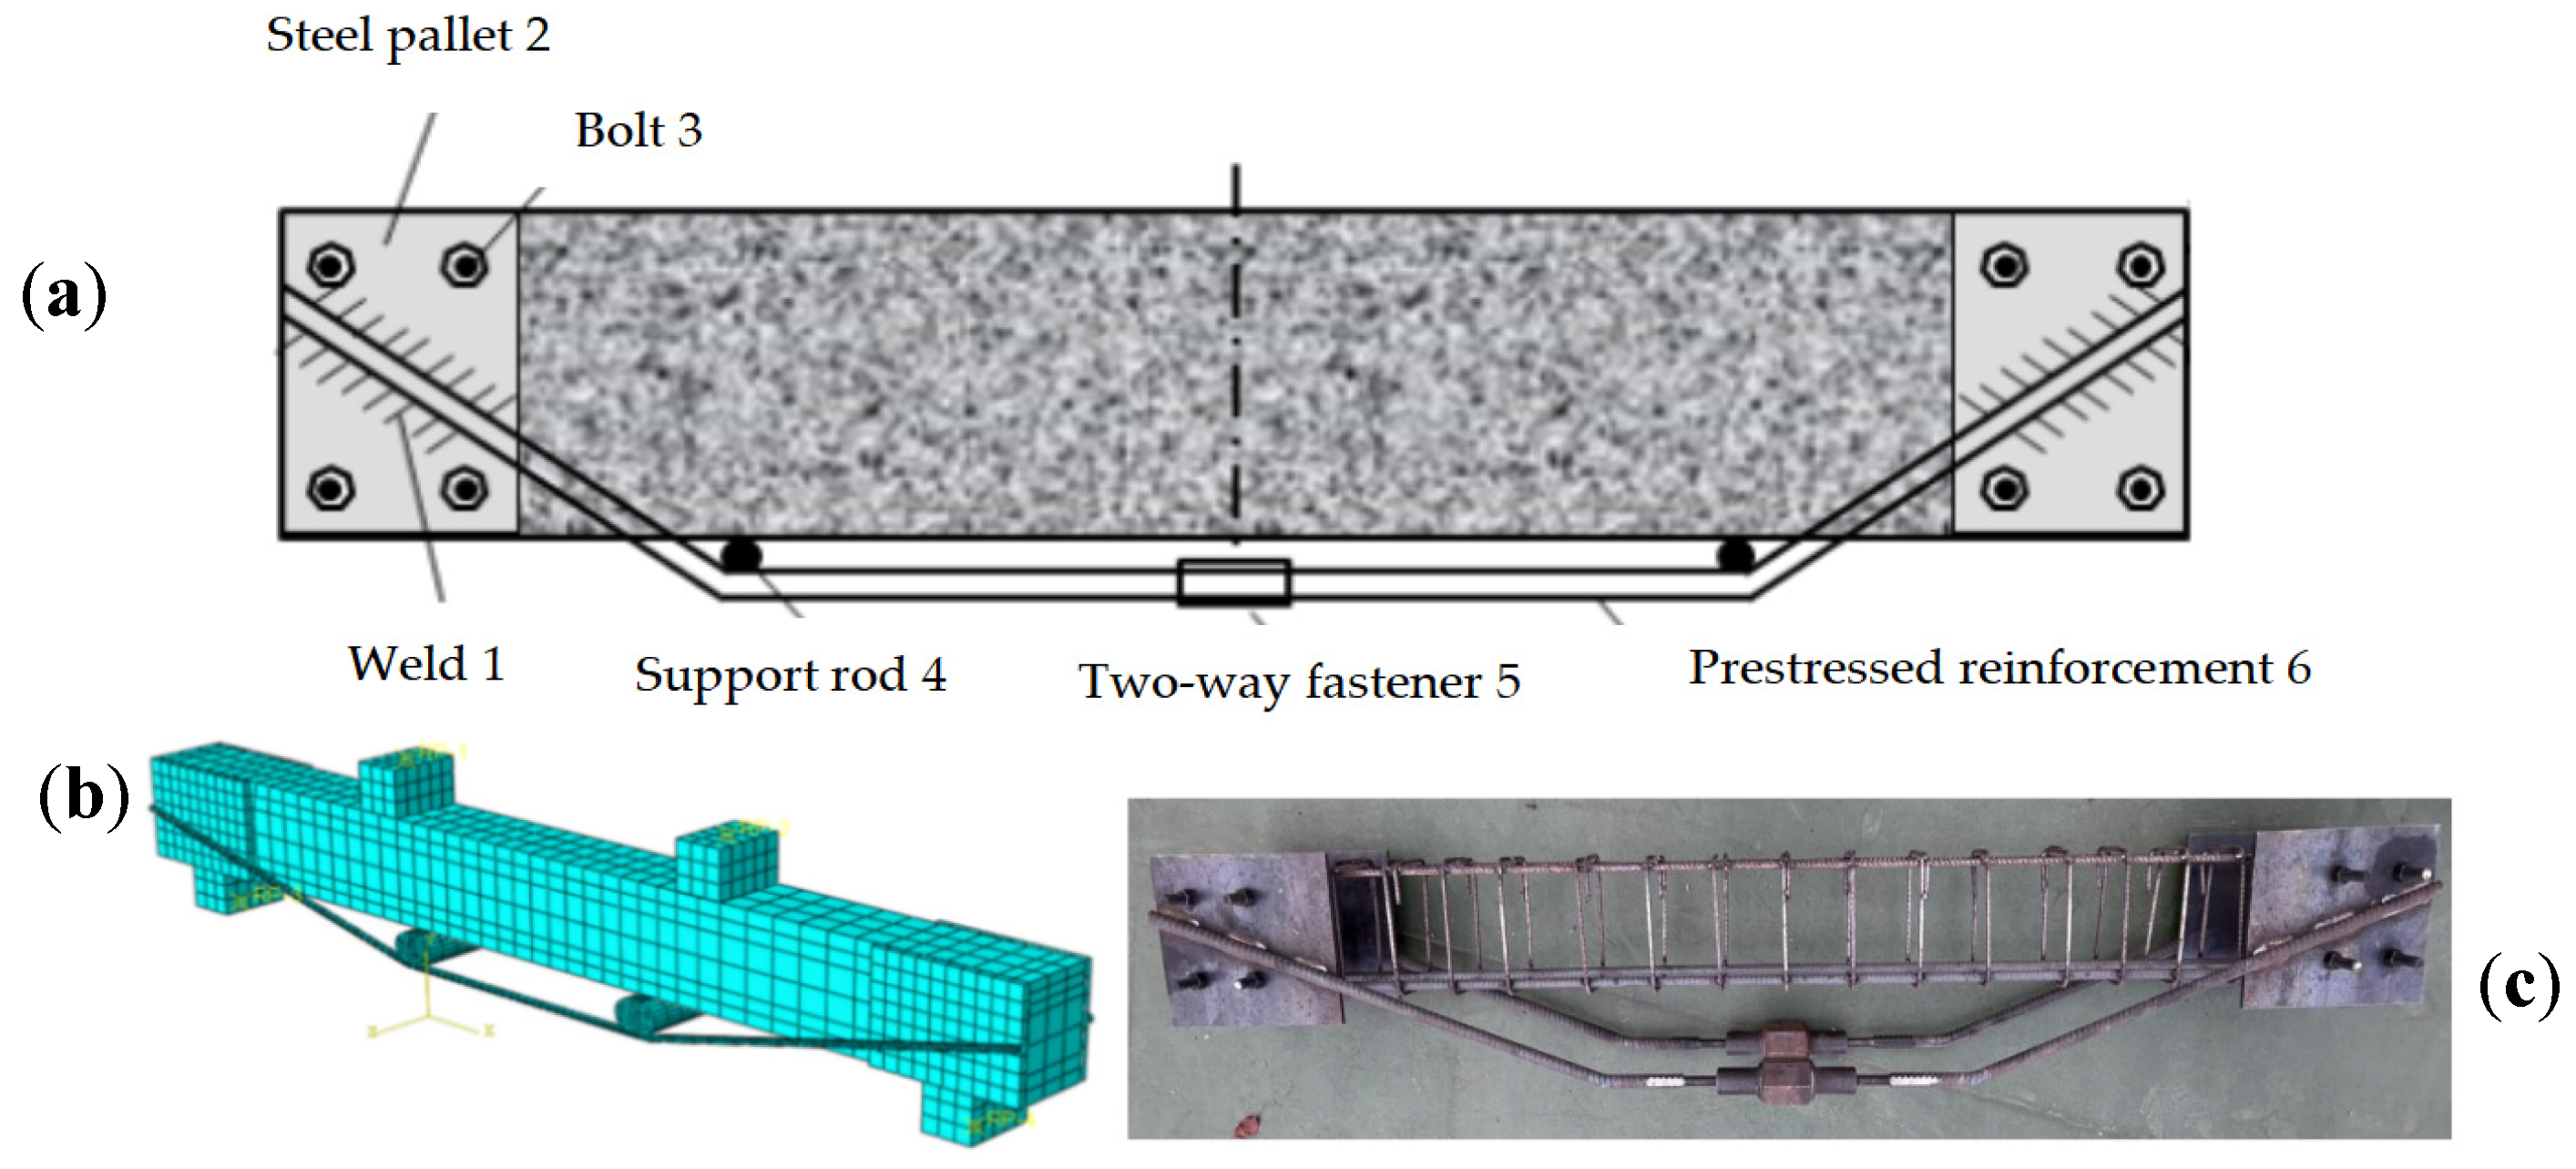
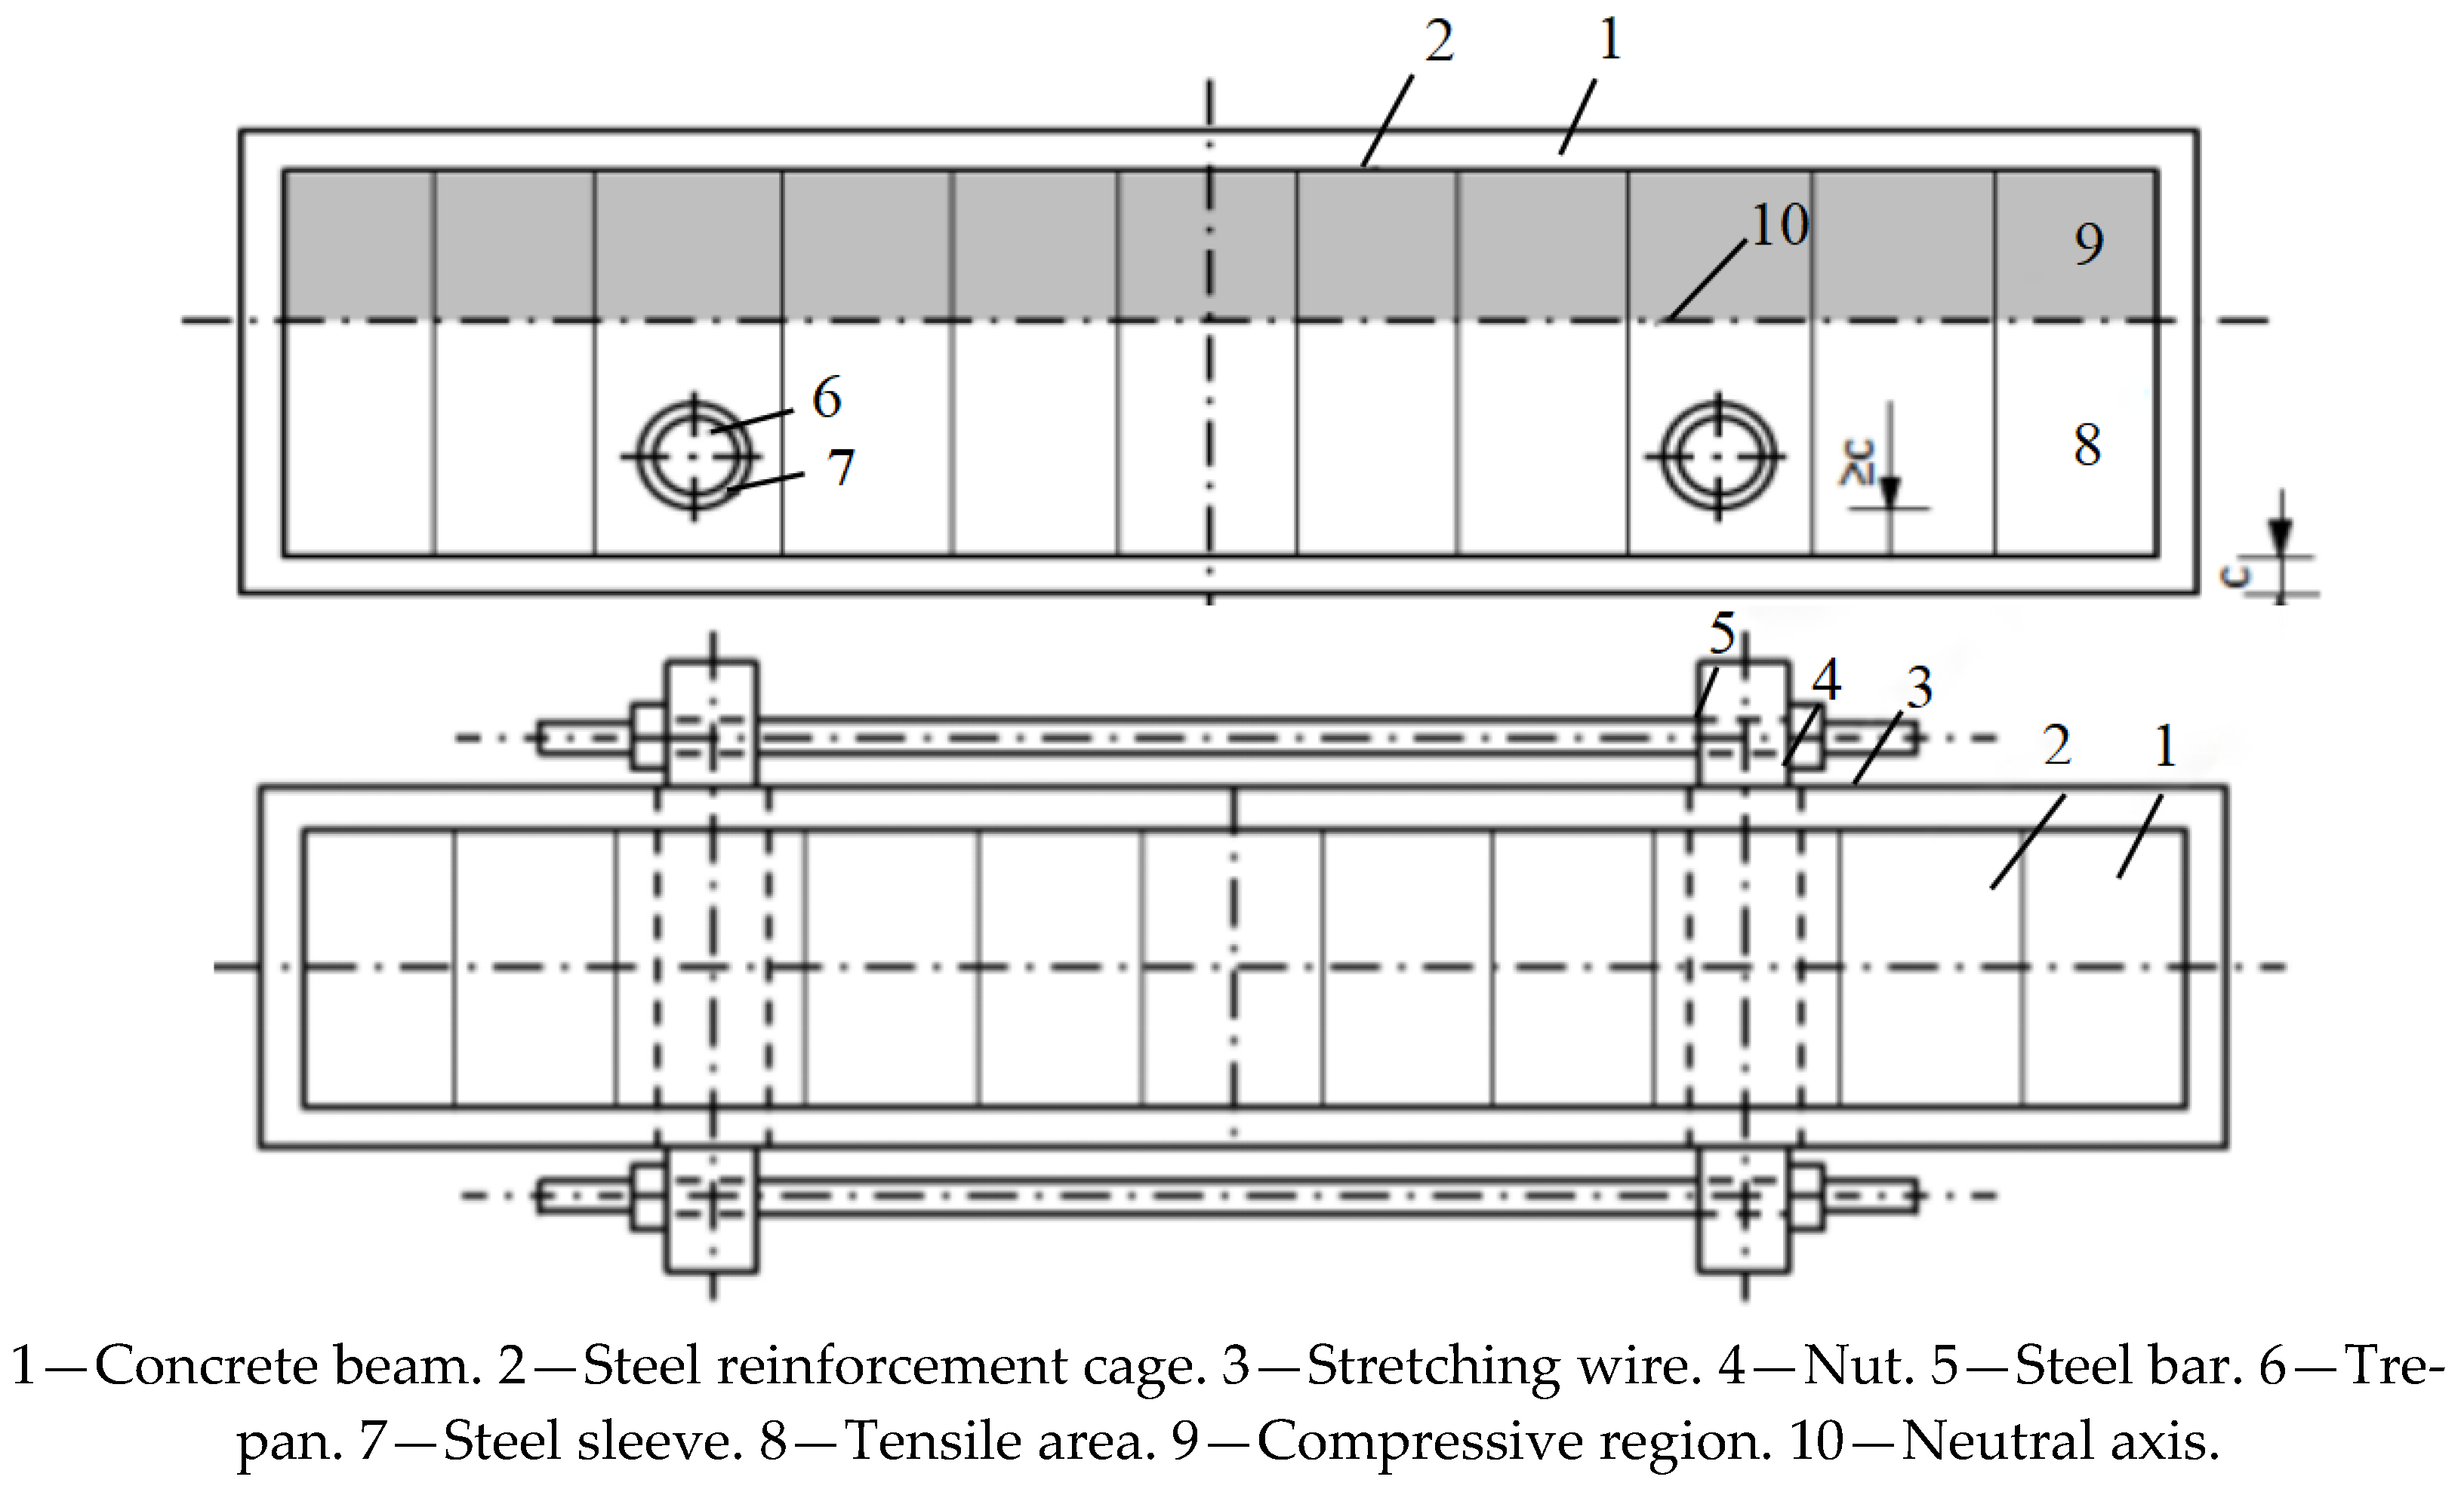
2.3. Reinforcement Scheme for the Beam

The reinforcement design of the conventional external prestressed beam is illustrated in Figure 2. The sequence of steps involved in the process of reinforcement is given as follows: (1) prior to the pouring of concrete, it is necessary to weld steel sleeves onto the steel cage in order to affix bolts 3; (2) subsequent to the pouring and subsequent solidification of the concrete beam, four steel plates 2 are to be fixed at both extremities of the concrete beam by bolts 3 through the steel sleeves reserved at both extremities; (3) the pre-processed prestressing steel bar 6 is then welded onto steel plate 2 through weld 1; and (4) the two-way fastener 5 is twisted with the force measuring wrench to apply prestress to the concrete beam.
As illustrated in Figure 3, the external prestressing reinforcement design of the side elevation involves the creation of apertures 6 between the two vertical stirrups in the symmetric position across the middle line of the tension zone of the beam. The subsequent insertion of inner steel sleeve 7 into these apertures, followed by the insertion of steel rod 5 into the sleeve, constitutes a key step in the overall process. Subsequent to the installation of the steel rod, tension steel bar (3) with threads at both ends is inserted into the round hole of the steel rod. The tension steel bar is then tightened with a force measuring wrench and nut (4). The concrete beam is made to bear external prestressing force on the side façade, and the direction of the prestress is opposite to the direction of the main tensile stress of the beam itself, so as to effectively improve the working performance of the beam and enhance its carrying capacity.

2.4. Test Equipment and Loading Scheme

The four-point bending static load test was adopted in this study, and the test device is shown in Figure 4. The test utilized graded loading, with the pre-loading value not exceeding 70% of the cracking load of the concrete beam. The normal loading value was set at 10 kN as the first level, and when an inclined crack became visible, the loading was reduced to 5 kN as the first level until the test beam was damaged.

3. Test Result Analysis

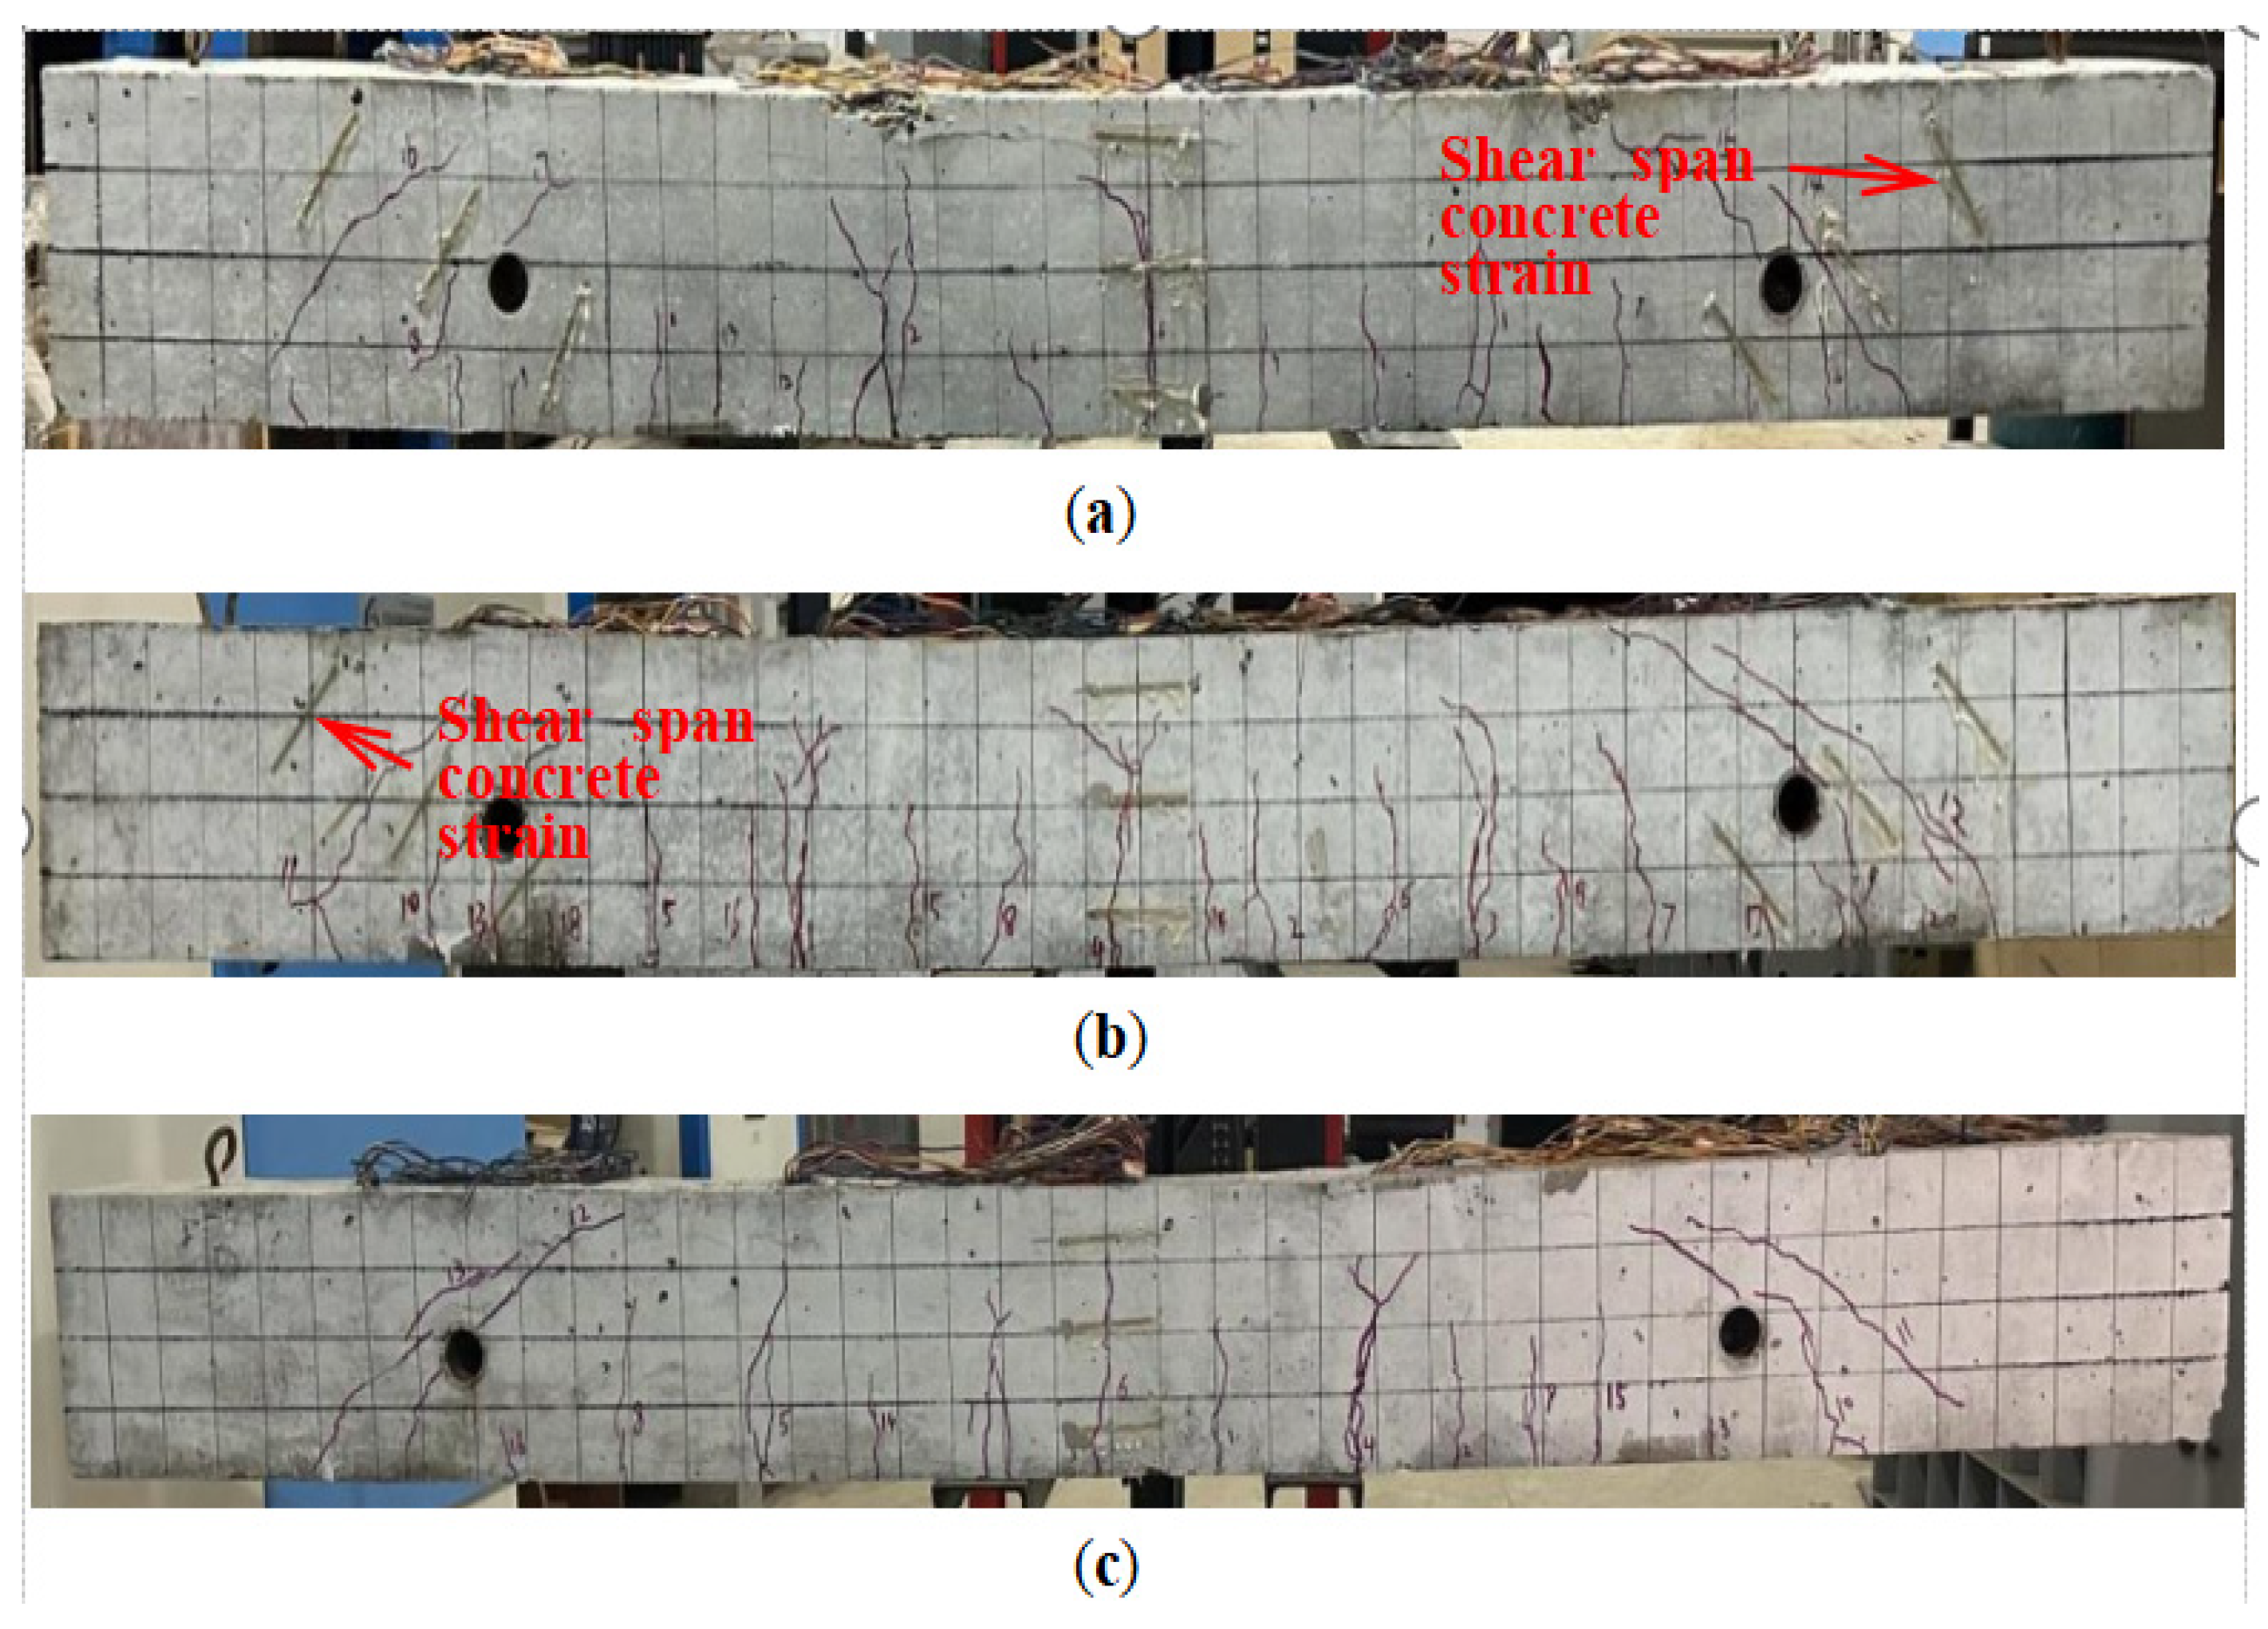
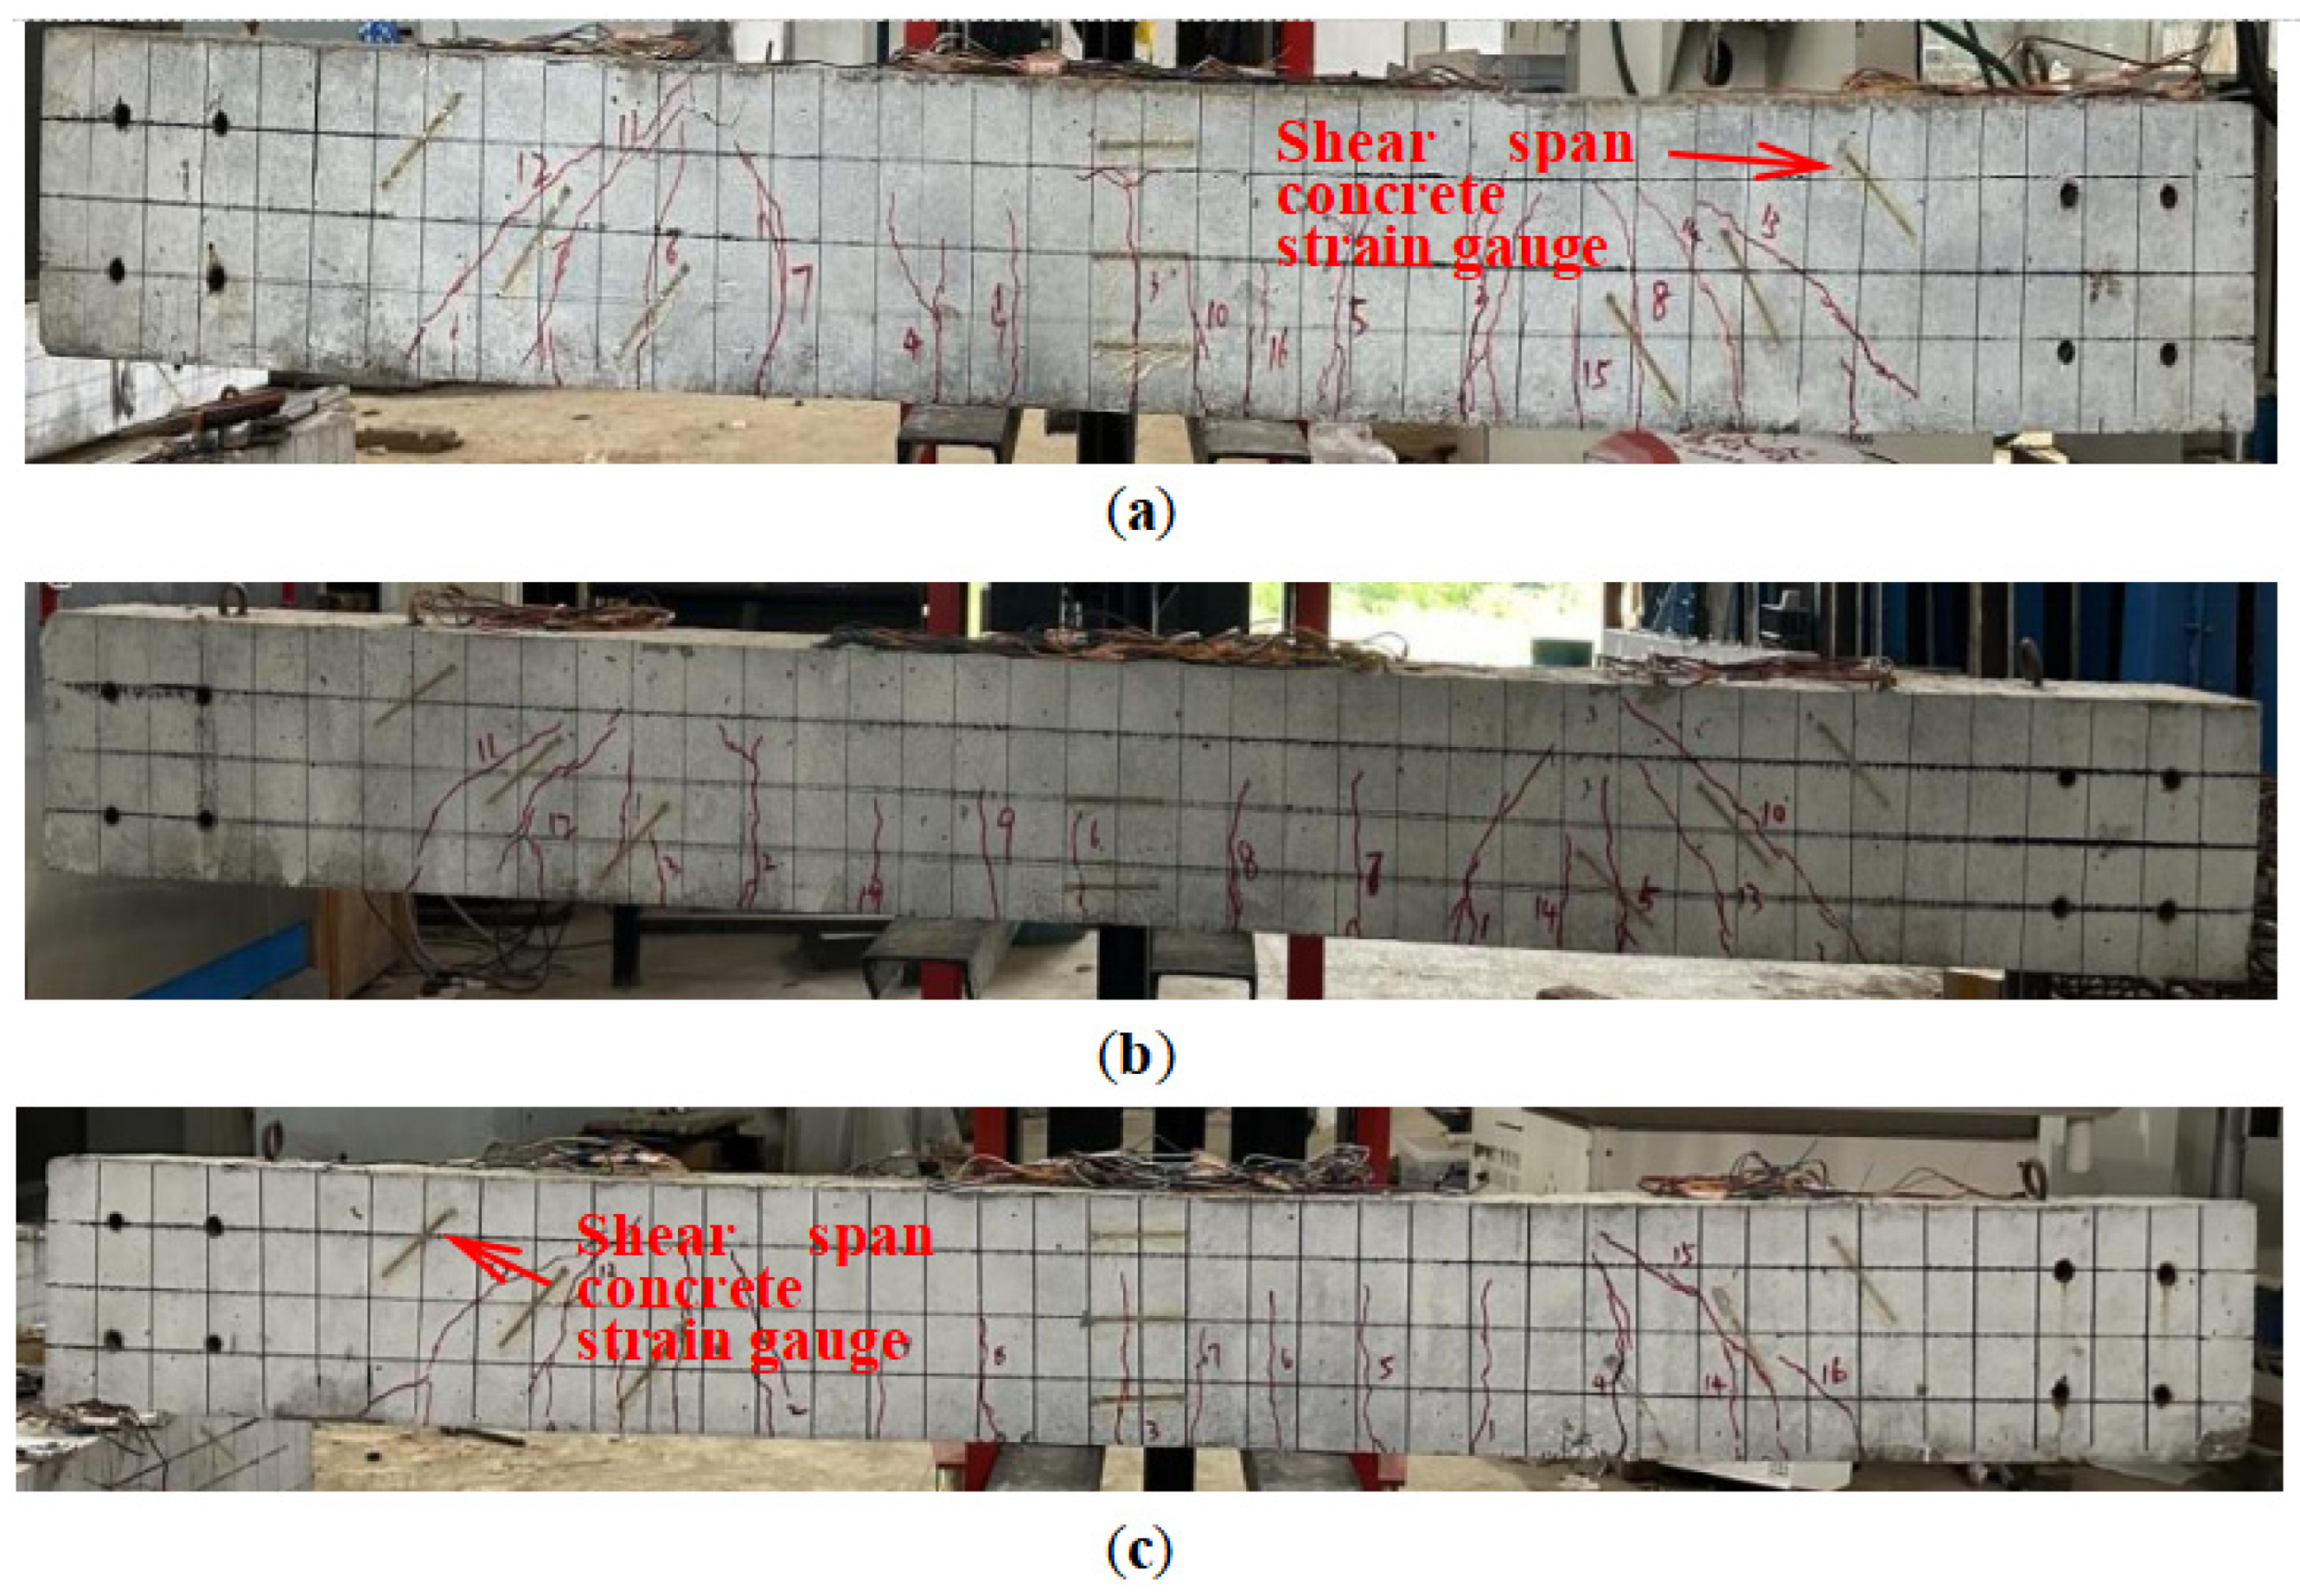
3.1. Summary of Failure Process and Results of Specimens

As illustrated in Figure 5, the failure modes of the contrast beams (OB-1 to OB-3) are evident. At an applied load of 19.3 kN, initial cracks emerge, with their widths measured below 0.05 mm. Subsequently, at an external load of 65 kN, inclined cracks with widths of approximately 0.05 mm and a substantial length manifest within the shear span area. With the increase in the external load, the inclined crack develops from the support to the loading point, and the stirrup stress increases continuously. When the external load is loaded to 95 kN, the longest oblique crack penetrates the concrete beam, the maximum width reaches 0.6 mm, and the stirrup begins to yield. When the load is increased to 96.7 kN, the limit condition is reached, and the springback phenomenon will occur if the load continues.
The cracks in the OB beam are mainly flexural cracks, which are evenly distributed with a spacing of approximately 10 cm. There are relatively developed shear cracks at the right end of the beam. The maximum width of the cracks is about 0.6 mm, and the longest crack is about 40 cm, almost spanning the entire height of the beam.
Figure 6 shows the SRB failure modes. The crack loads of the SRB-50-2, SRB-75-3 and SRB-100-2 beams are 33.1 kN, 39.2 kN and 44.4 kN, respectively. When the external load is increased to 58.9 kN, 61.7 kN and 63.4 kN, respectively, oblique cracks appear in the beam shear cross area with a width of approximately 0.05 mm and a large length. As the external load continues to increase, the oblique crack develops steadily from the support to the loading point, and the stirrup stress continues to increase. The ultimate bearing capacities of the beam are found to be 137.9 kN, 142.3 kN and 147 kN, respectively, at stirrup yield in the shear span area.
Compared to the OB beam, the cracking loads of the SRB beams are substantially enhanced, indicating a delayed onset of cracking. Nevertheless, the crack distribution remains analogous to that of the OB beam, predominantly featuring bending cracks. Due to the increased ultimate bearing capacity, the length of these cracks exceeds that of the OB beam.
As illustrated in Figure 7, the TRB failure modes are essentially analogous to that of the OB beam. The cracking loads of the TRB-30-2, TRB-35-1 and TRB-40-2 beams are 70.2 kN, 72.1 kN and 78.9 kN, respectively. As the external load increases to 107.4 kN, 109.8 kN and 113.5 kN, respectively, oblique cracks appear in the shear cross area of each specimen beam, with these cracks having considerable lengths. With the continuous increase of the external load, oblique cracks develop steadily from the support to the loading point, and the stirrup stress continues to increase. The analysis indicates that when the longest oblique crack traverses the beam body, the stirrup yield in the shear span zone is attained, and the loads are maintained at 214.6 kN, 226.8 kN and 229.9 kN, respectively. Subsequent to this, the load remains stable and undergoes a slight increase, ultimately reaching 230.0 kN, 231.2 kN and 232.9 kN, respectively.
Compared to both the OB and SRB beams, the TRB beams exhibit substantially higher cracking loads while demonstrating significantly reduced numbers of cracks.
As demonstrated in Table 3, the experimental findings reveal that, in comparison with the OB, the bearing capacities of the SRBs are enhanced, while those of the TRBs are notably elevated. Furthermore, it is evident that the bearing capacities of both prestressed reinforcement methods are substantially augmented with the increasing initial external prestressed stress.
In comparison with OB-2, the initial bending cracking loads for the SRB-50-2, SRB-75-3 and SRB-100-2 beams increase by 71.5%, 103.1% and 130.1%, respectively, and the initial inclined cracking loads decrease by 9.4%, 5.1% and 2.5%, respectively. Furthermore, it is determined that when the crack width reaches 0.2 mm, the corresponding inclined cracking loads increase by 0.3%, 2.8% and 6.4%, respectively. Additionally, when the crack width reaches 0.4 mm, the corresponding inclined cracking loads increase by 35.8%, 38.4% and 42.6%, respectively. The ultimate loads increase by 42.6%, 47.2% and 52.0%, respectively. It is evident that the mid-span deflections remain below the optimal value (OB), and the external prestressing of the side façade is found to be an effective measure for reducing the deformation of the trabeculars. It is further observed that the efficacy of this method of deformation restraint is directly proportional to the magnitude of prestress applied.
In comparison with OB-2, the oblique initial cracking loads for the TRB-30-2, TRB-35-1 and TRB-40-2 beams increase by 65.2%, 68.9% and 74.6%, respectively. Furthermore, it is observed that when the crack width reaches 0.2 mm, the corresponding inclined cracking loads increase by 148.7%, 150.6% and 154.4%, respectively. Similarly, when the crack width reaches 0.4 mm, the corresponding loads increase by 151.4%, 153.3% and 160.0%, respectively. The ultimate loads are found to be 137.8%, 139.1% and 140.8% higher than that of the OB, respectively. The corresponding mid-span deflection ratios to that of the OB decrease, and external prestressing can effectively reduce the deformation of the trabeculars. It is evident that the greater the prestressing, the more effectively it can restrain the deformation and cracks of beams.
As illustrated in Table 2, the reinforcing effect of the SRB series of beams is found to be inferior to that of the TRB series of beams. The cracking loads of the SRB series of beams do not exhibit significant increases, and the cracking loads of the inclined cracks remain reduced. This is attributed to the proximity of the axis of prestressing tendons to the neutral axis, thereby diminishing the crack control effect of the concrete beams. Furthermore, it is demonstrated that the development of the tip of the crack will be adversely affected if it exceeds the axis of the prestressed tendon. This indicates that when the prestressing tendons are arranged, the axis should be as far away from the neutral axis as possible.

3.2. Stress Analysis of Specimens

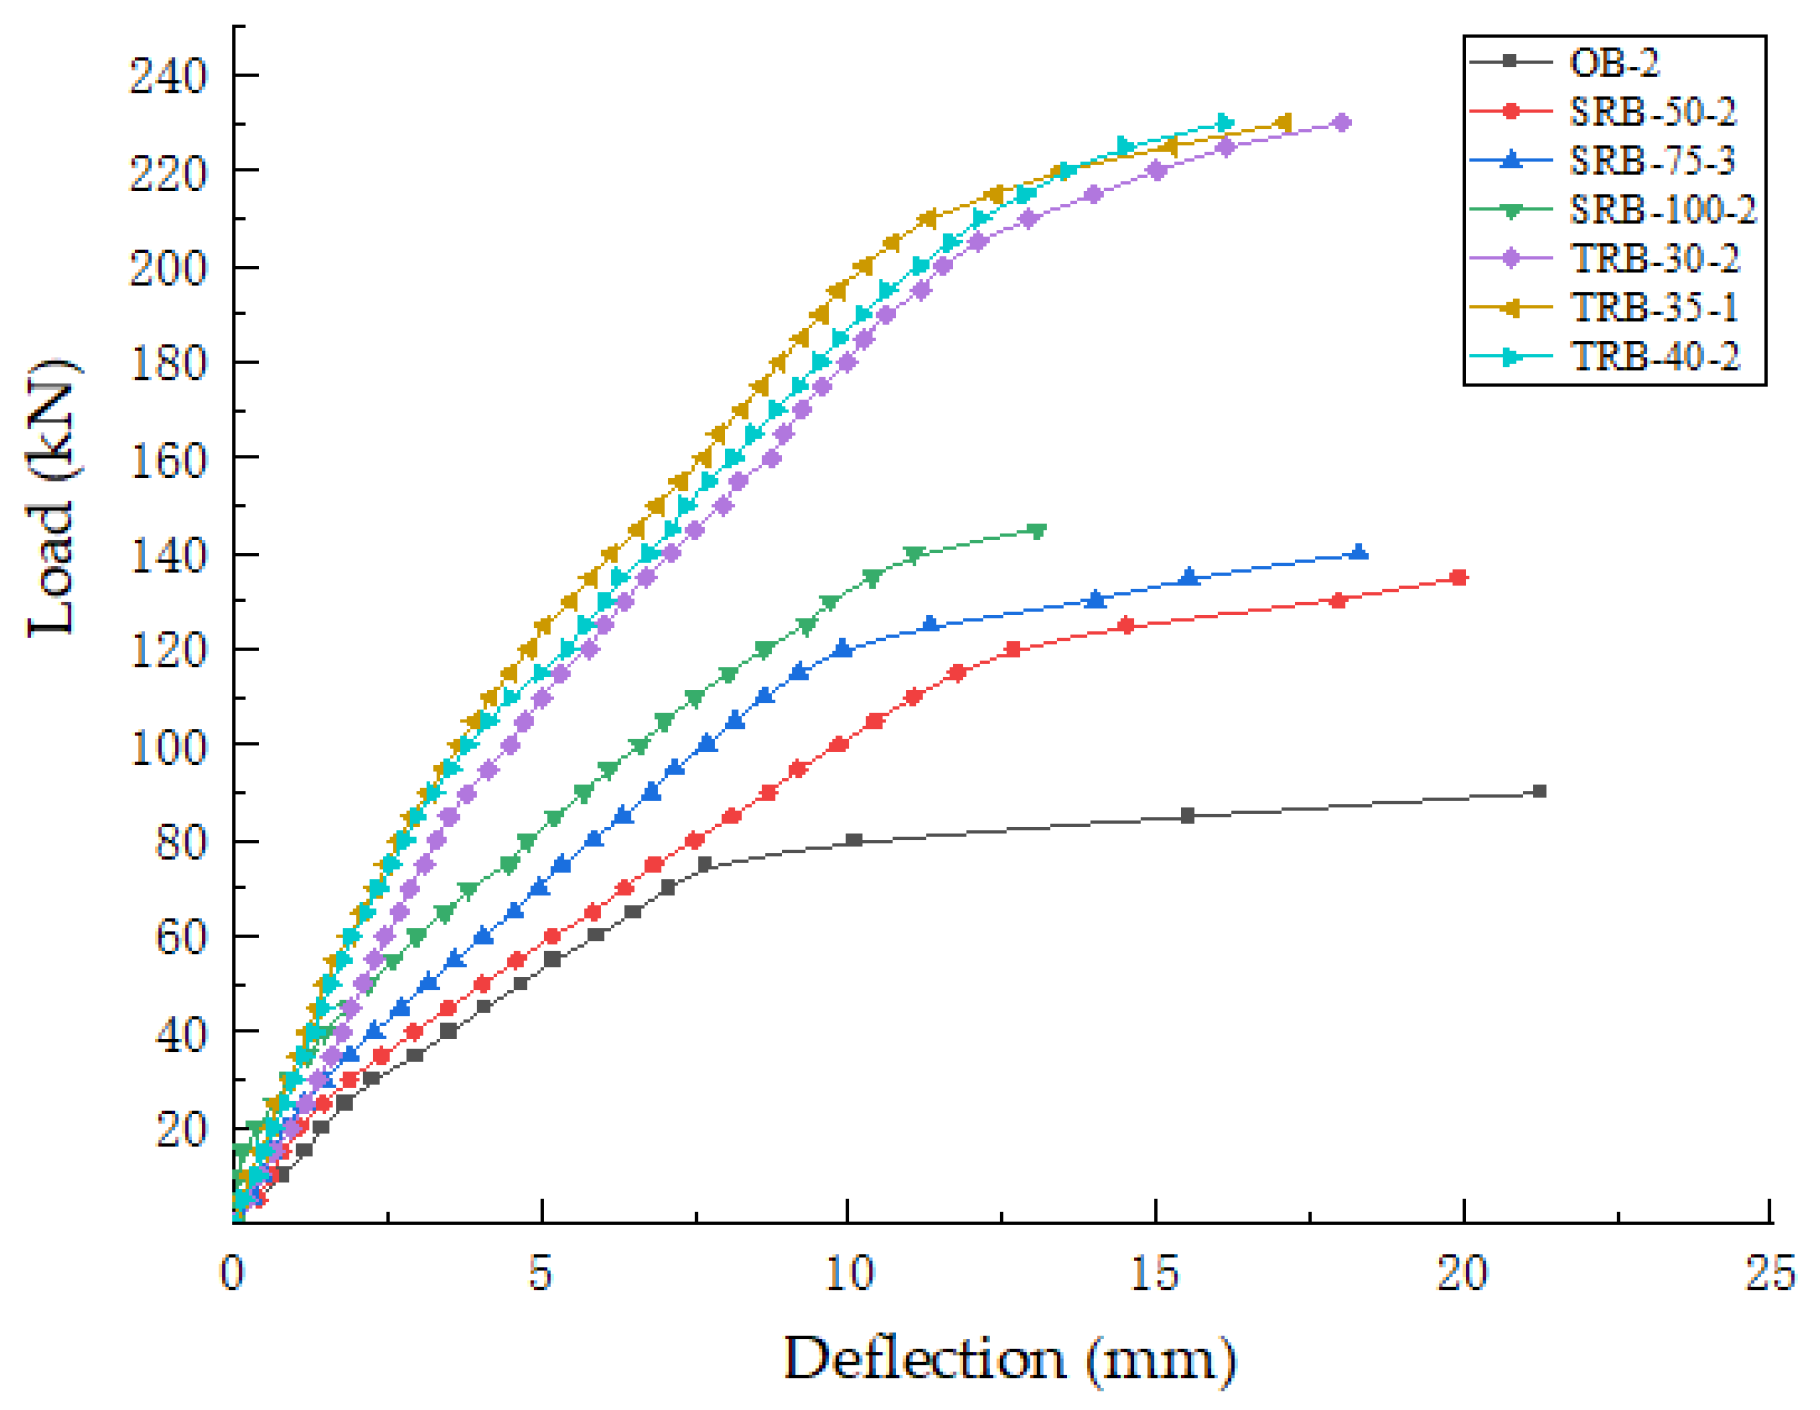
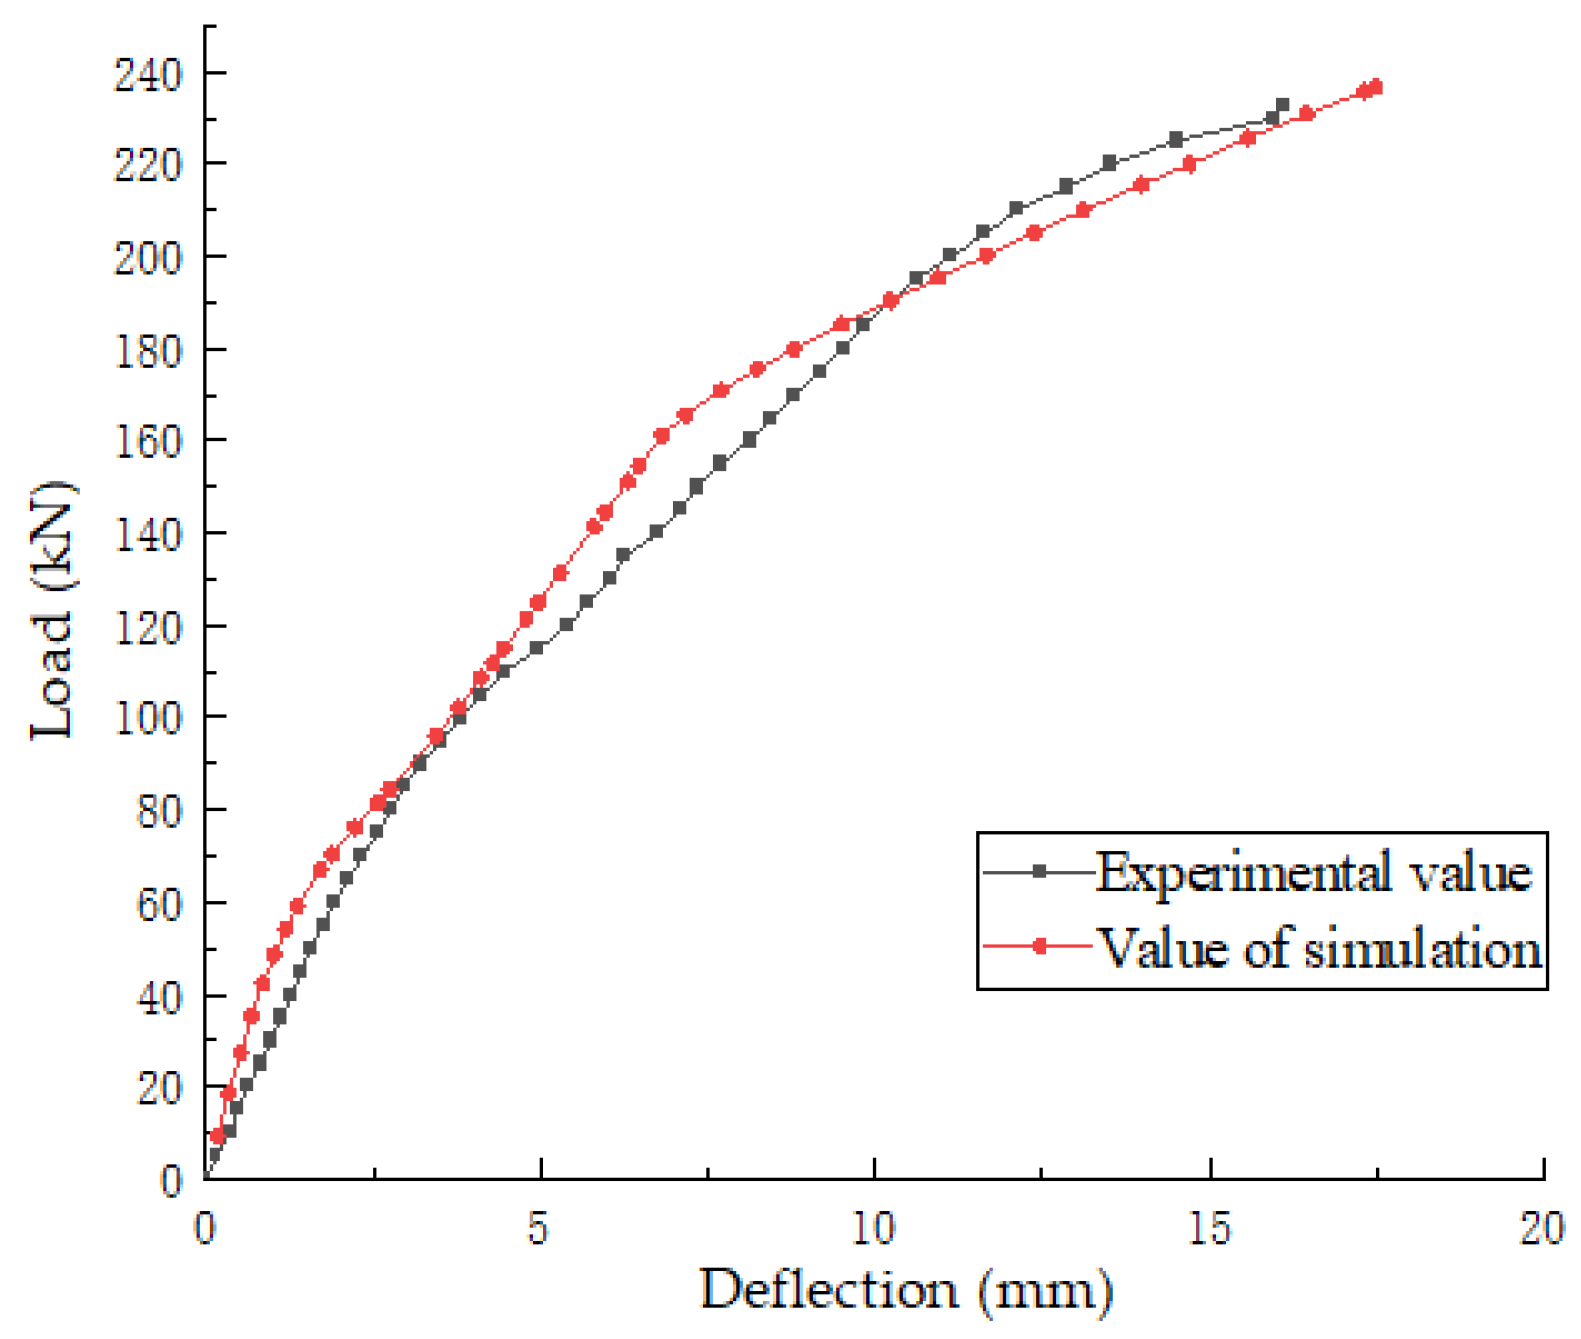
3.2.1. Analysis of Load–Deflection Curves

As illustrated in Figure 8, the load–deflection curves of all the specimens are compared, demonstrating that, in general, the load–deflection curves of all the beams are in good agreement with the experimental curves of classical concrete beams. At the beginning of the test, the deflections of the beams were linear to the load, showing elastic characteristics, and the larger the stiffness of the beam, the smaller the deformation. However, as the load increased to a critical threshold, flexural or inclined cracks emerged within the tension area of the beam, resulting in a slight increase in displacement. Subsequent to this, as the load continued to increase, the crack length and width expanded, the beam stiffness decreased further, and the displacement increased rapidly. Concurrently, additional cracks emerged within the shear span, leading to a progressive weakening of the beam’s shear resistance. This results in an evident nonlinear load–displacement curve, a rapid acceleration in deformation, and an upward trend in the curve. Subsequent to the yielding of the primary reinforcement, the beam’s stiffness underwent a rapid decline, thereby slowing or even halting the rate of increase in the load. Upon reaching its ultimate load, the beam sustained damage, leading to a sharp increase in displacement. The main oblique crack traversed the beam’s core, resulting in concrete rupture and the yielding or breaking of the steel bars and ultimately leading to the failure of the concrete beam. A comparison of the three sets of curves reveals that the ultimate displacements of the three types of concrete beams are similar, with the traditional external prestressed concrete beams exhibiting the highest ultimate bearing capacities.

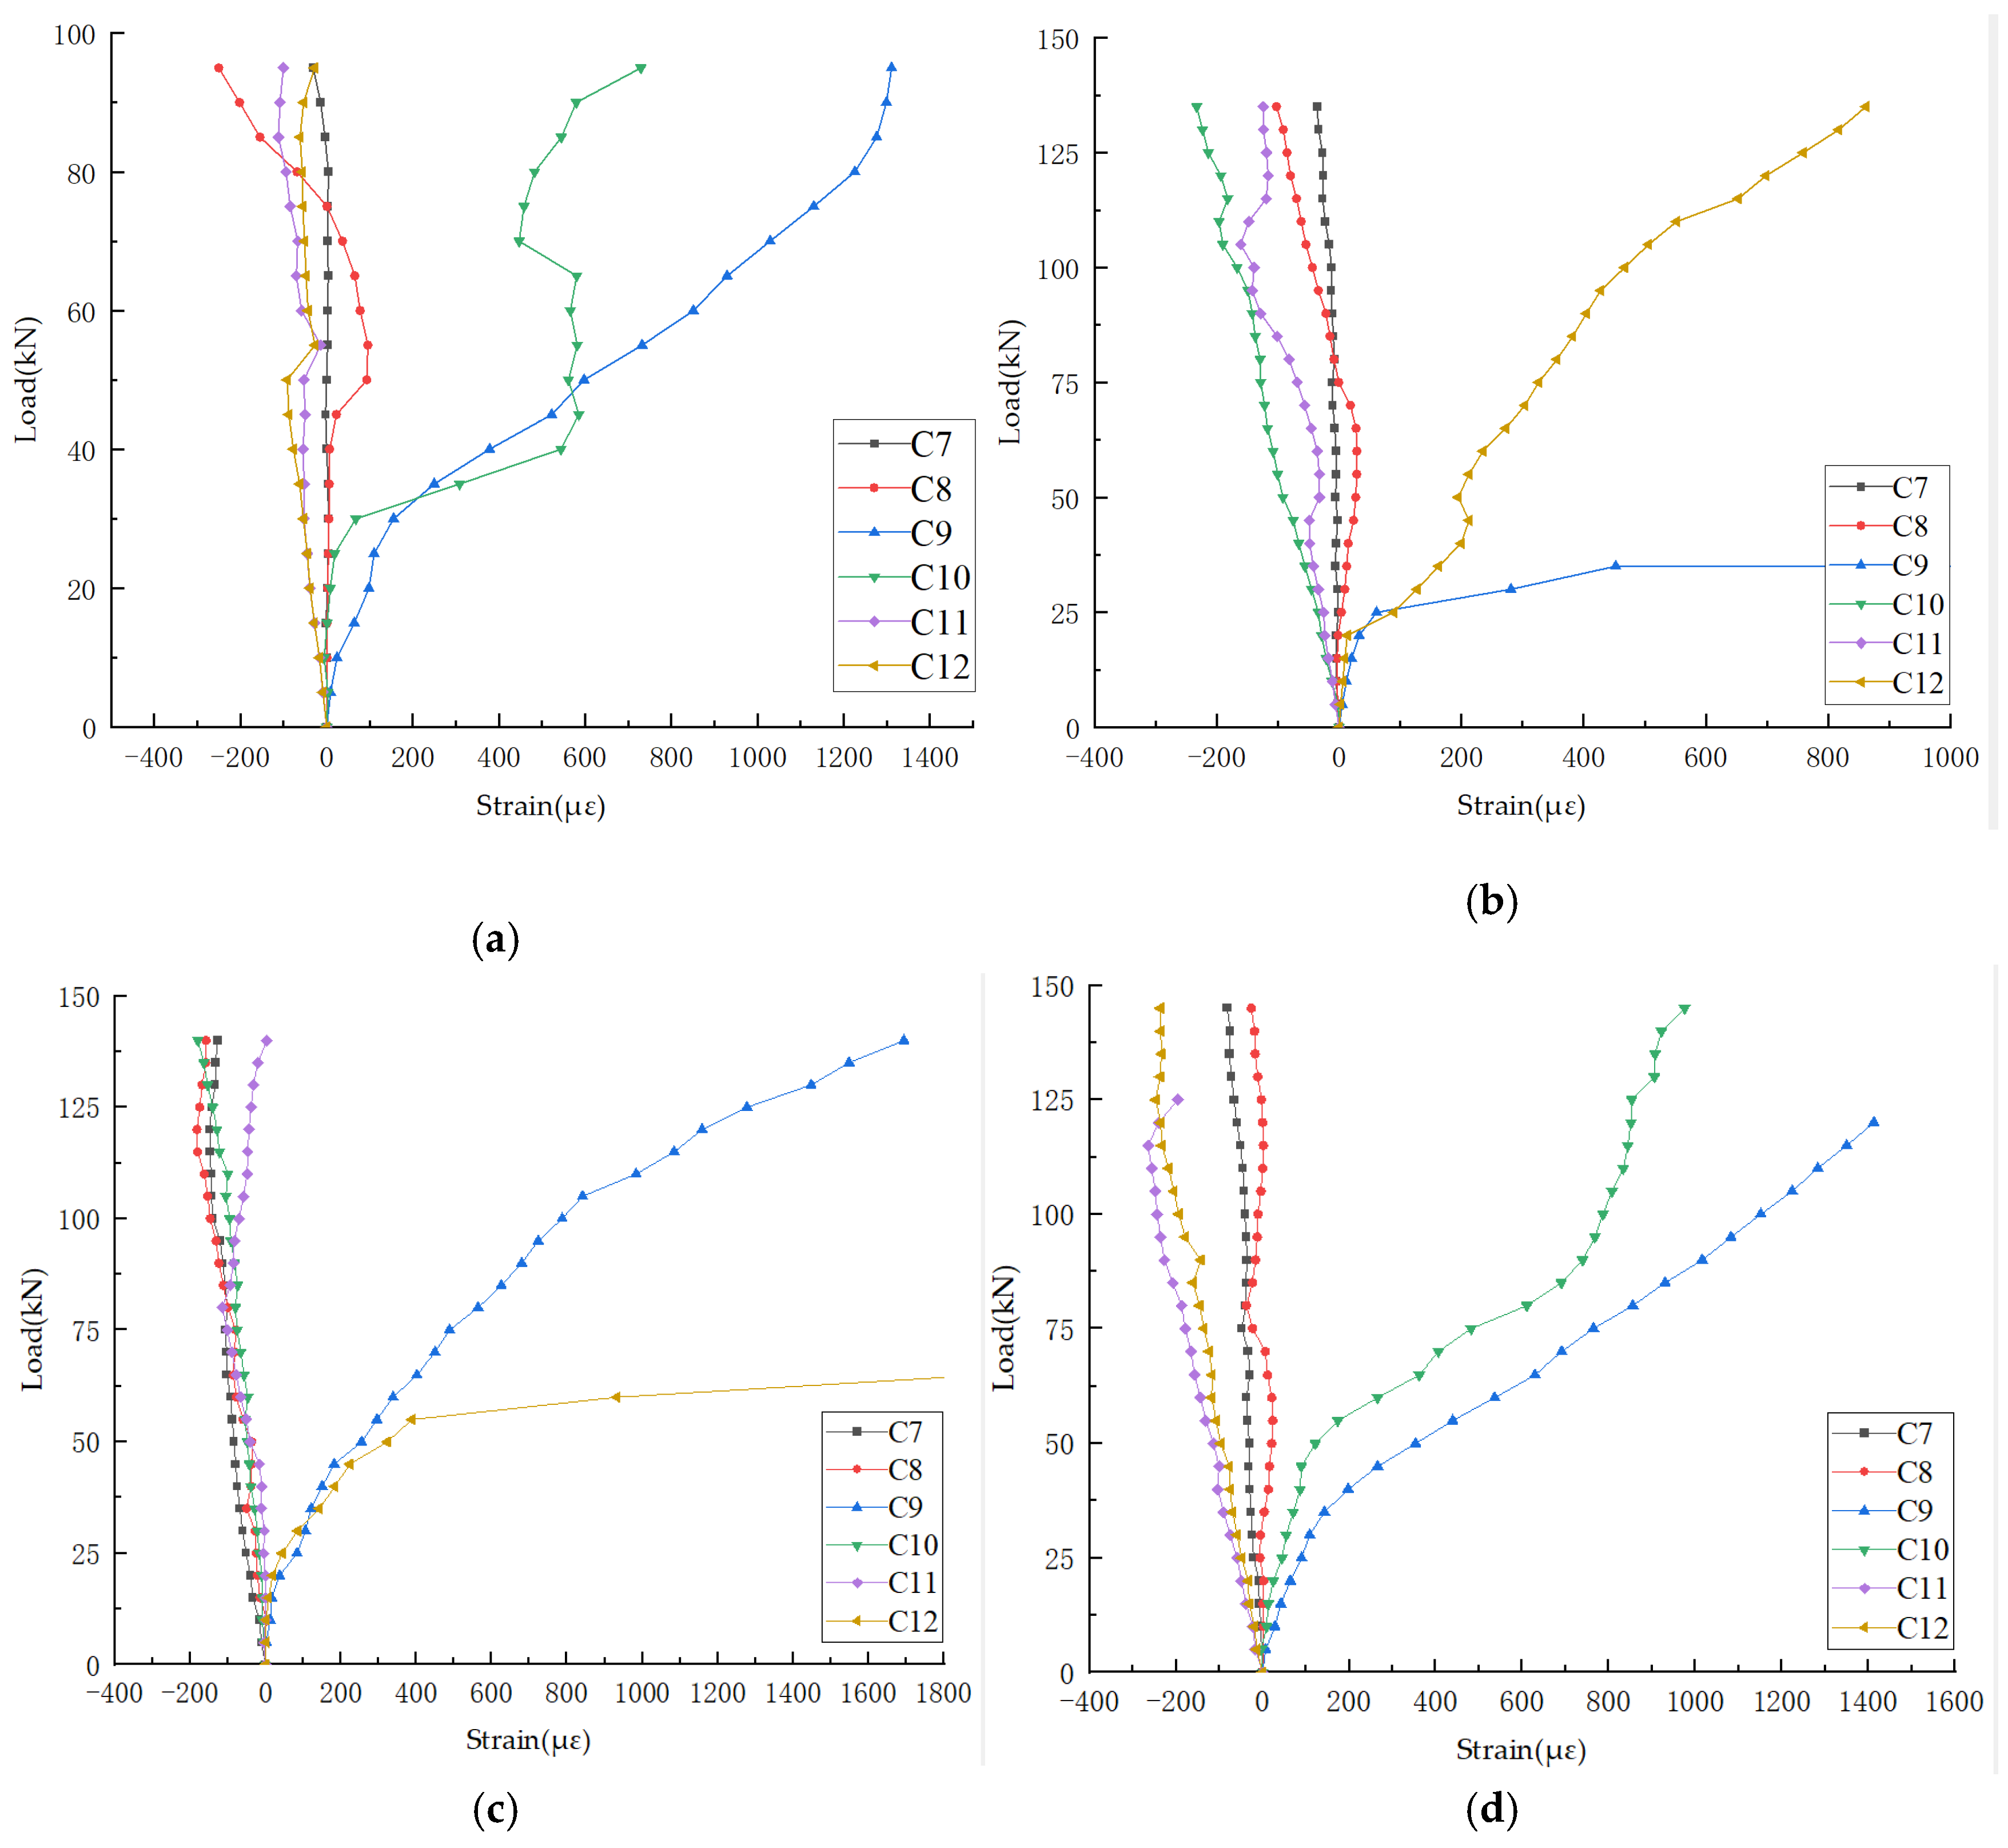
3.2.2. Stirrup Strain Responses

Stirrups play a pivotal role in the resistance of beams to shear forces, with the potential to impede the propagation of shear cracks. Through the examination of the strains experienced by the stirrups, the stress state of the component can be ascertained, thereby facilitating the estimation of the shear bearing capacity of the beam. The judicious arrangement of stirrups, coupled with effective strain monitoring, has been shown to retard the progression of concrete cracks and enhance the shear resistance of concrete beams.
As illustrated in Figure 9, the load–stirrup strain curves of the test specimens demonstrate pronounced upward trends at the initial stage of small strains. This observation indicates that the stirrups are operating within the elastic range at this stage, effectively resisting the applied load and exhibiting minimal deformation.
However, as the load increased, inclined cracks developed in the specimen, leading to a withdrawal of concrete from the working area. Consequently, the shear resistance was assumed by the stirrup. The steel bar then began to slowly yield, entering the strengthening stage, and the shear resistance of the beam reached its limit, approaching the failure point. Finally, the strain of the stirrup increased sharply until the specimen failed. When all the beam specimens reached their ultimate loads, part of the stirrup reached yield. During loading, there was a slip between the stirrup and the concrete, which led to damage to the strain gauge. It is important to note that when the strain value exceeded 3500–4000 με, the strain gauges were no longer a reliable basis for the calculation of the stirrup stress.

3.2.3. Stress Analysis of Prestressing Steel Bars

As illustrated in Figure 10, the external load–strain curves of the prestressing tendons of the test beams reveal that, while the initial prestress values of the SRB beams exceeded those of the TRB beams, the strain growth rates of the prestressed tendons of the SRB beams surpassed those of the TRB beams. This phenomenon can be attributed to the lower cracking loads of the SRB beams compared to those of the TRB beams, resulting in more significant crack expansion and, consequently, higher strain increments in the prestressed tendons. Overall, the stress levels of the prestressed tendons remained relatively low.

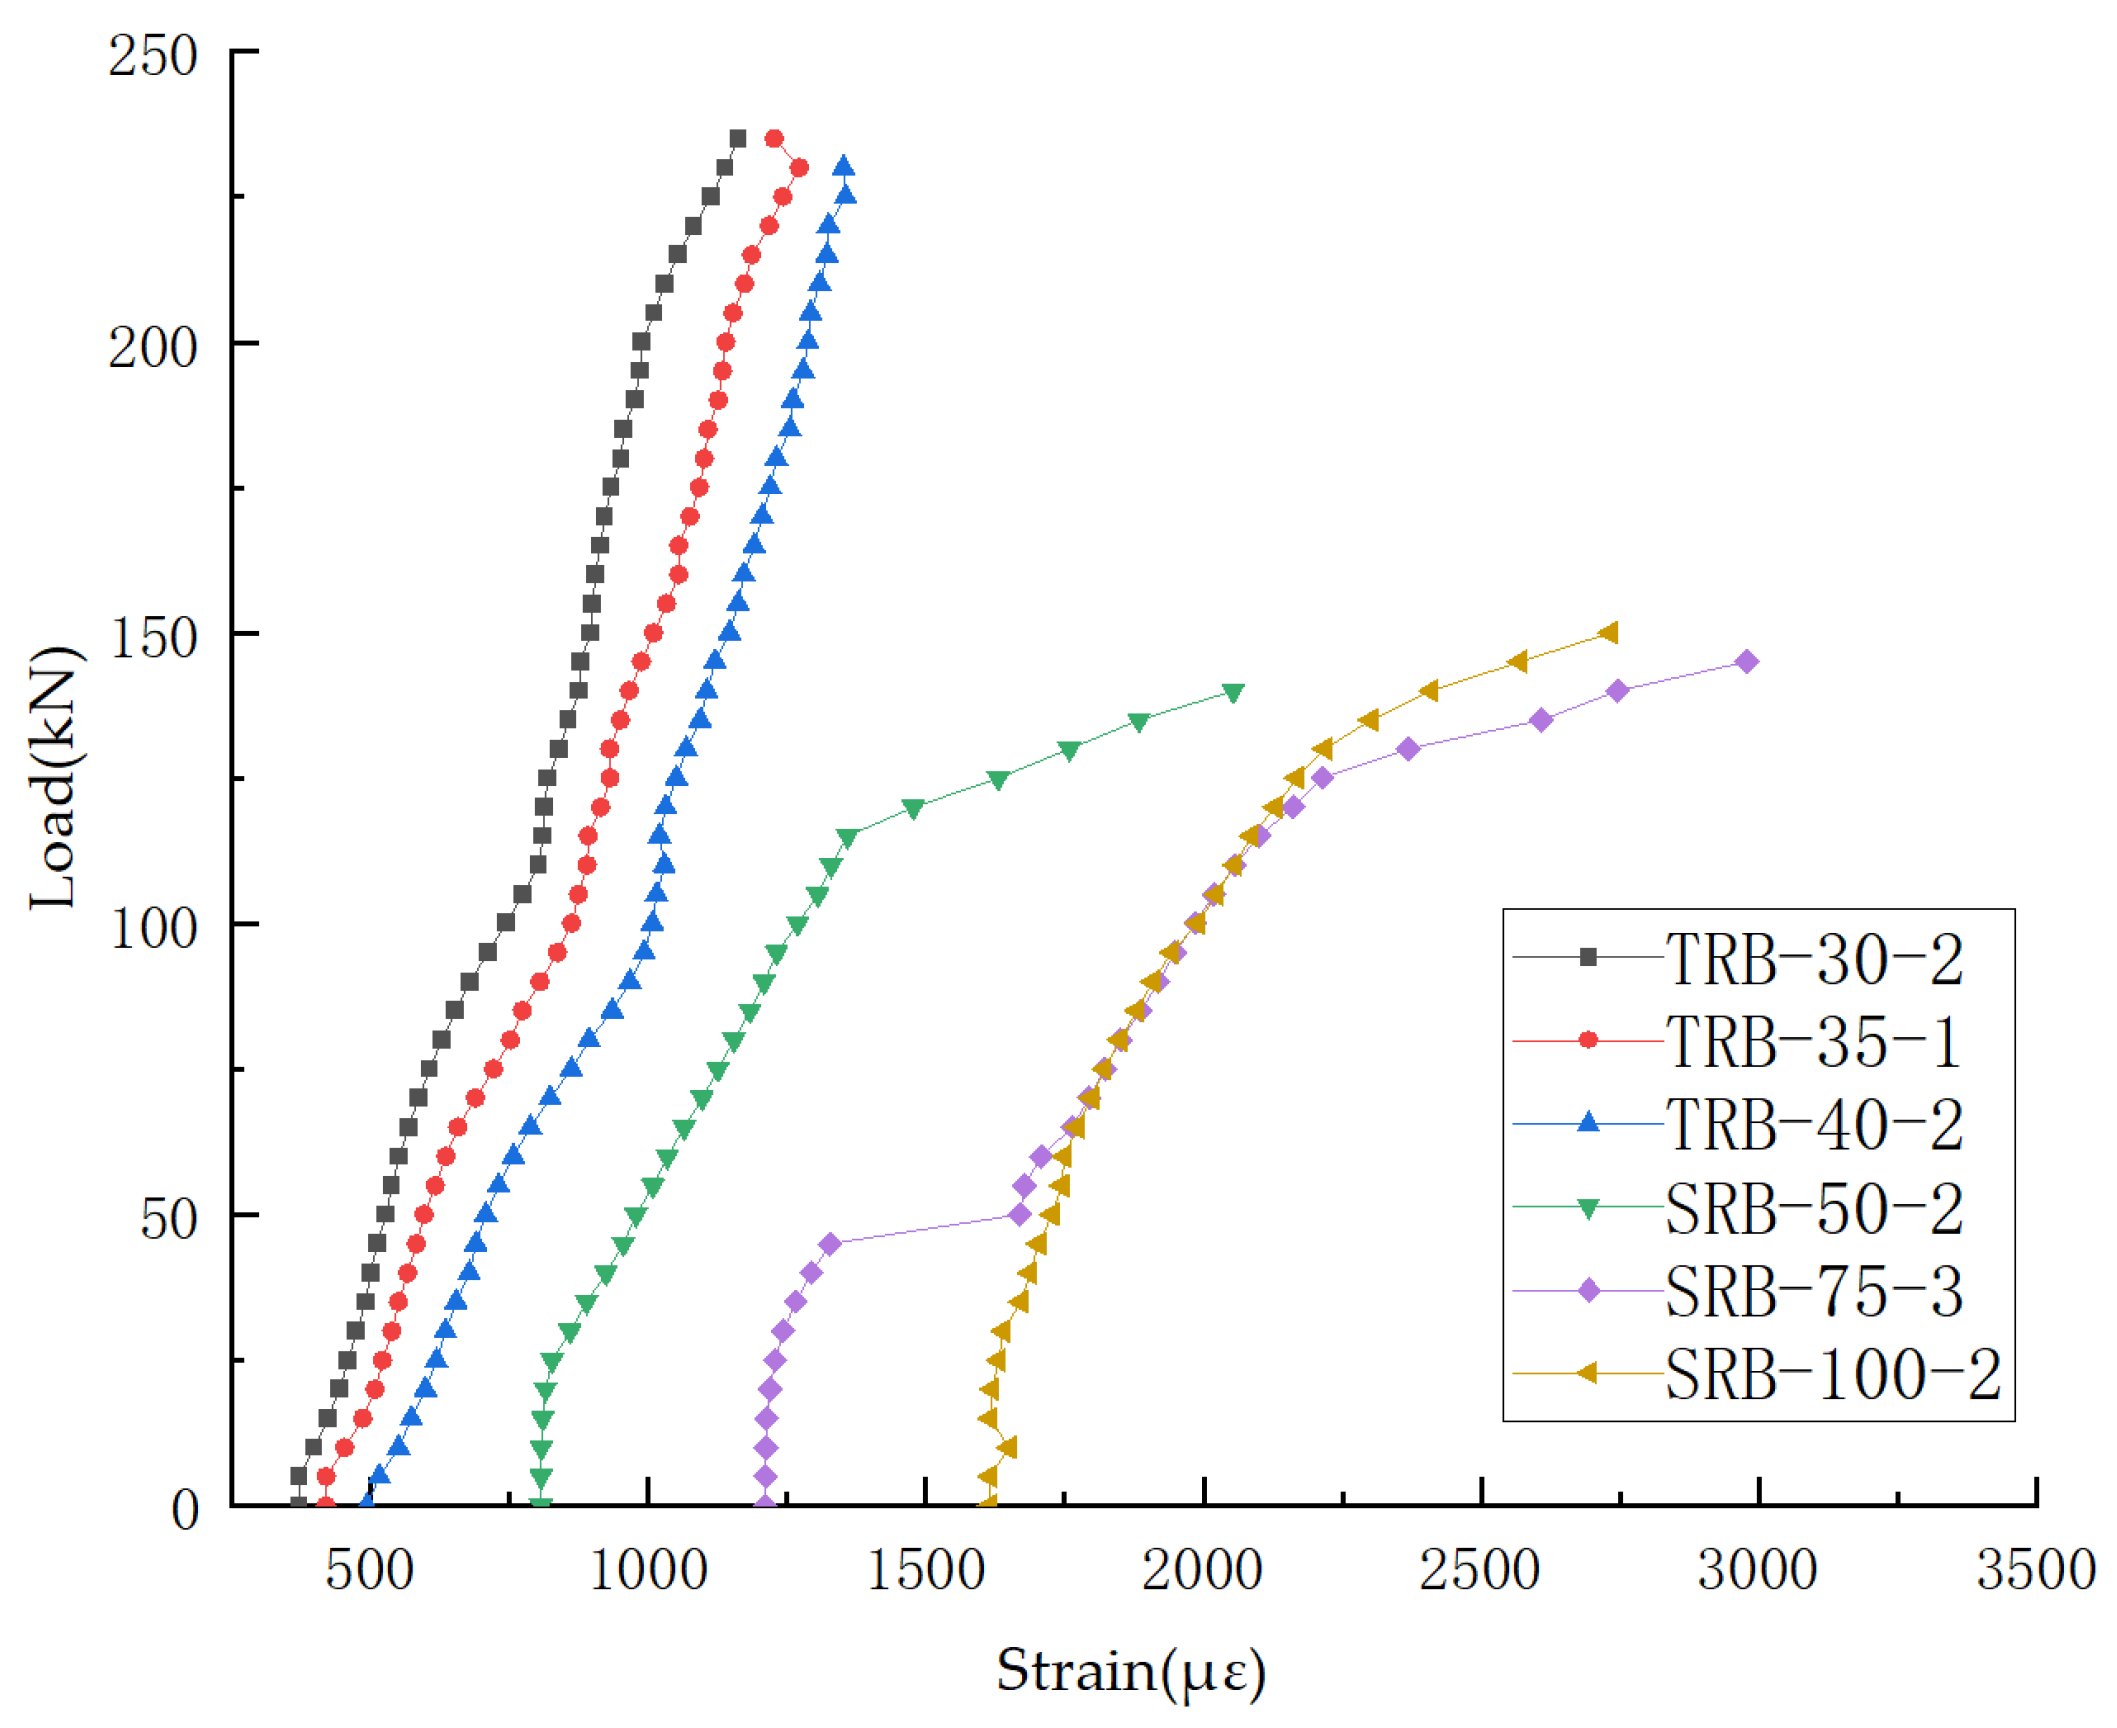
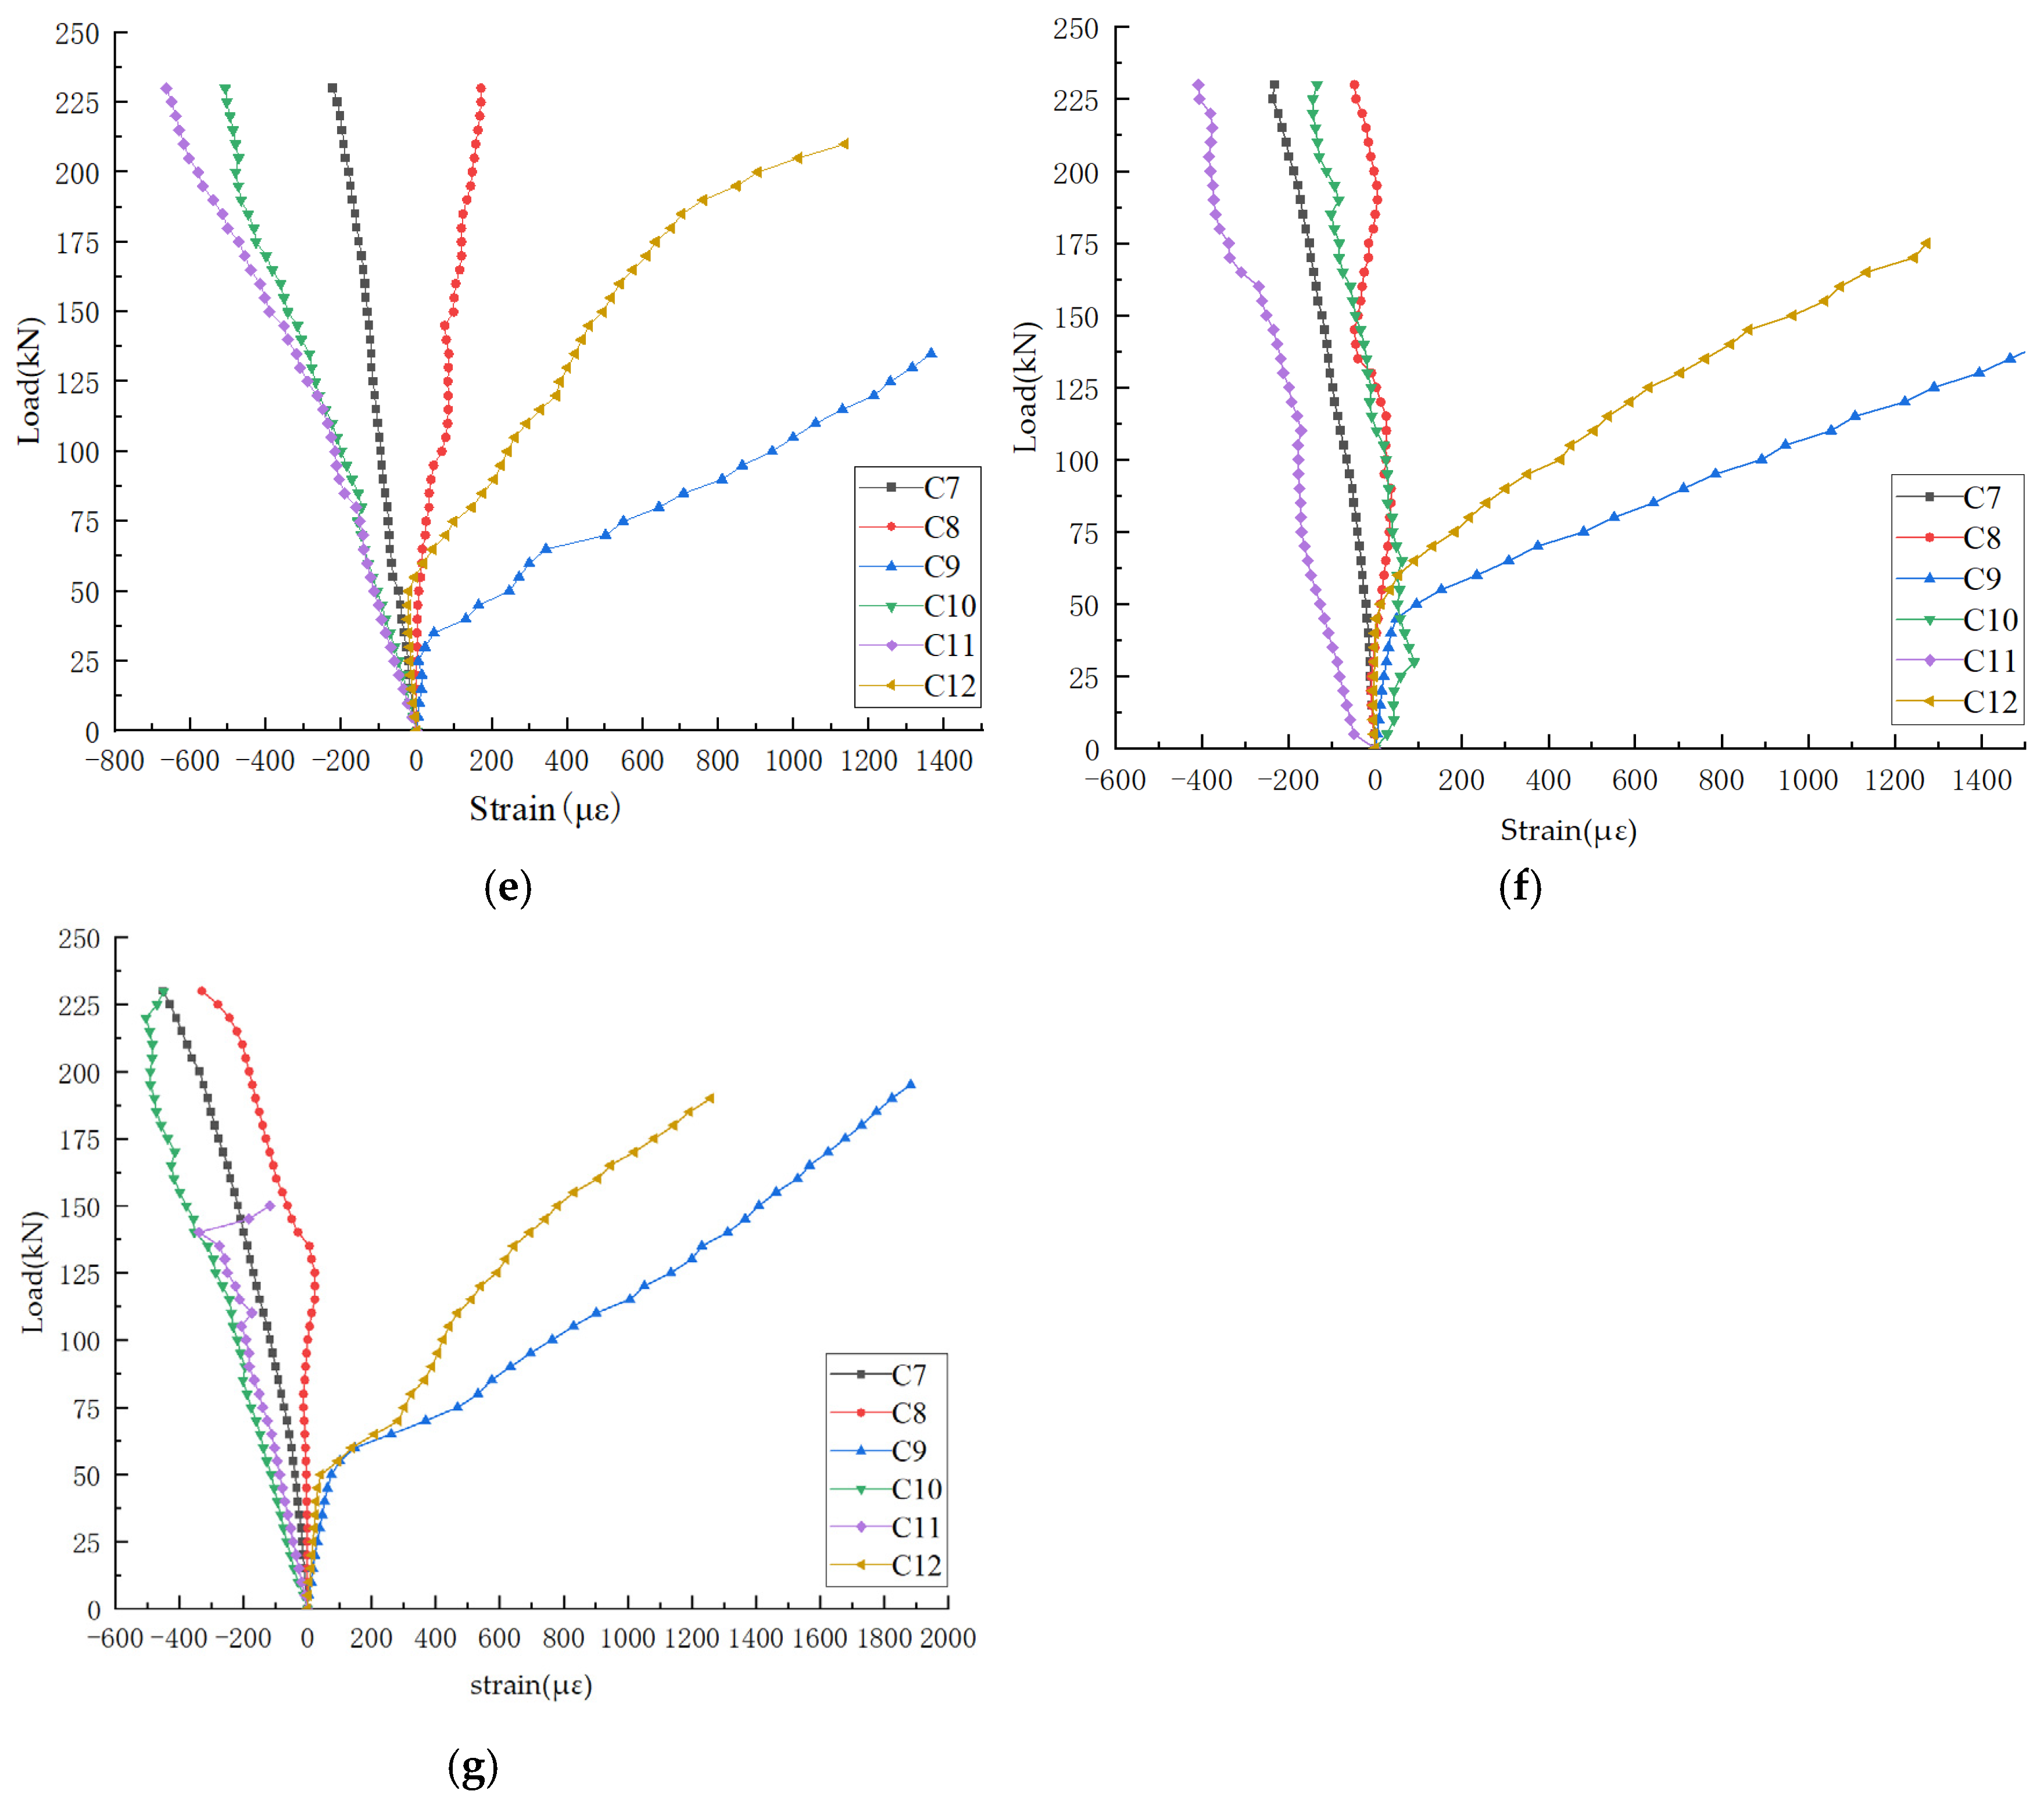
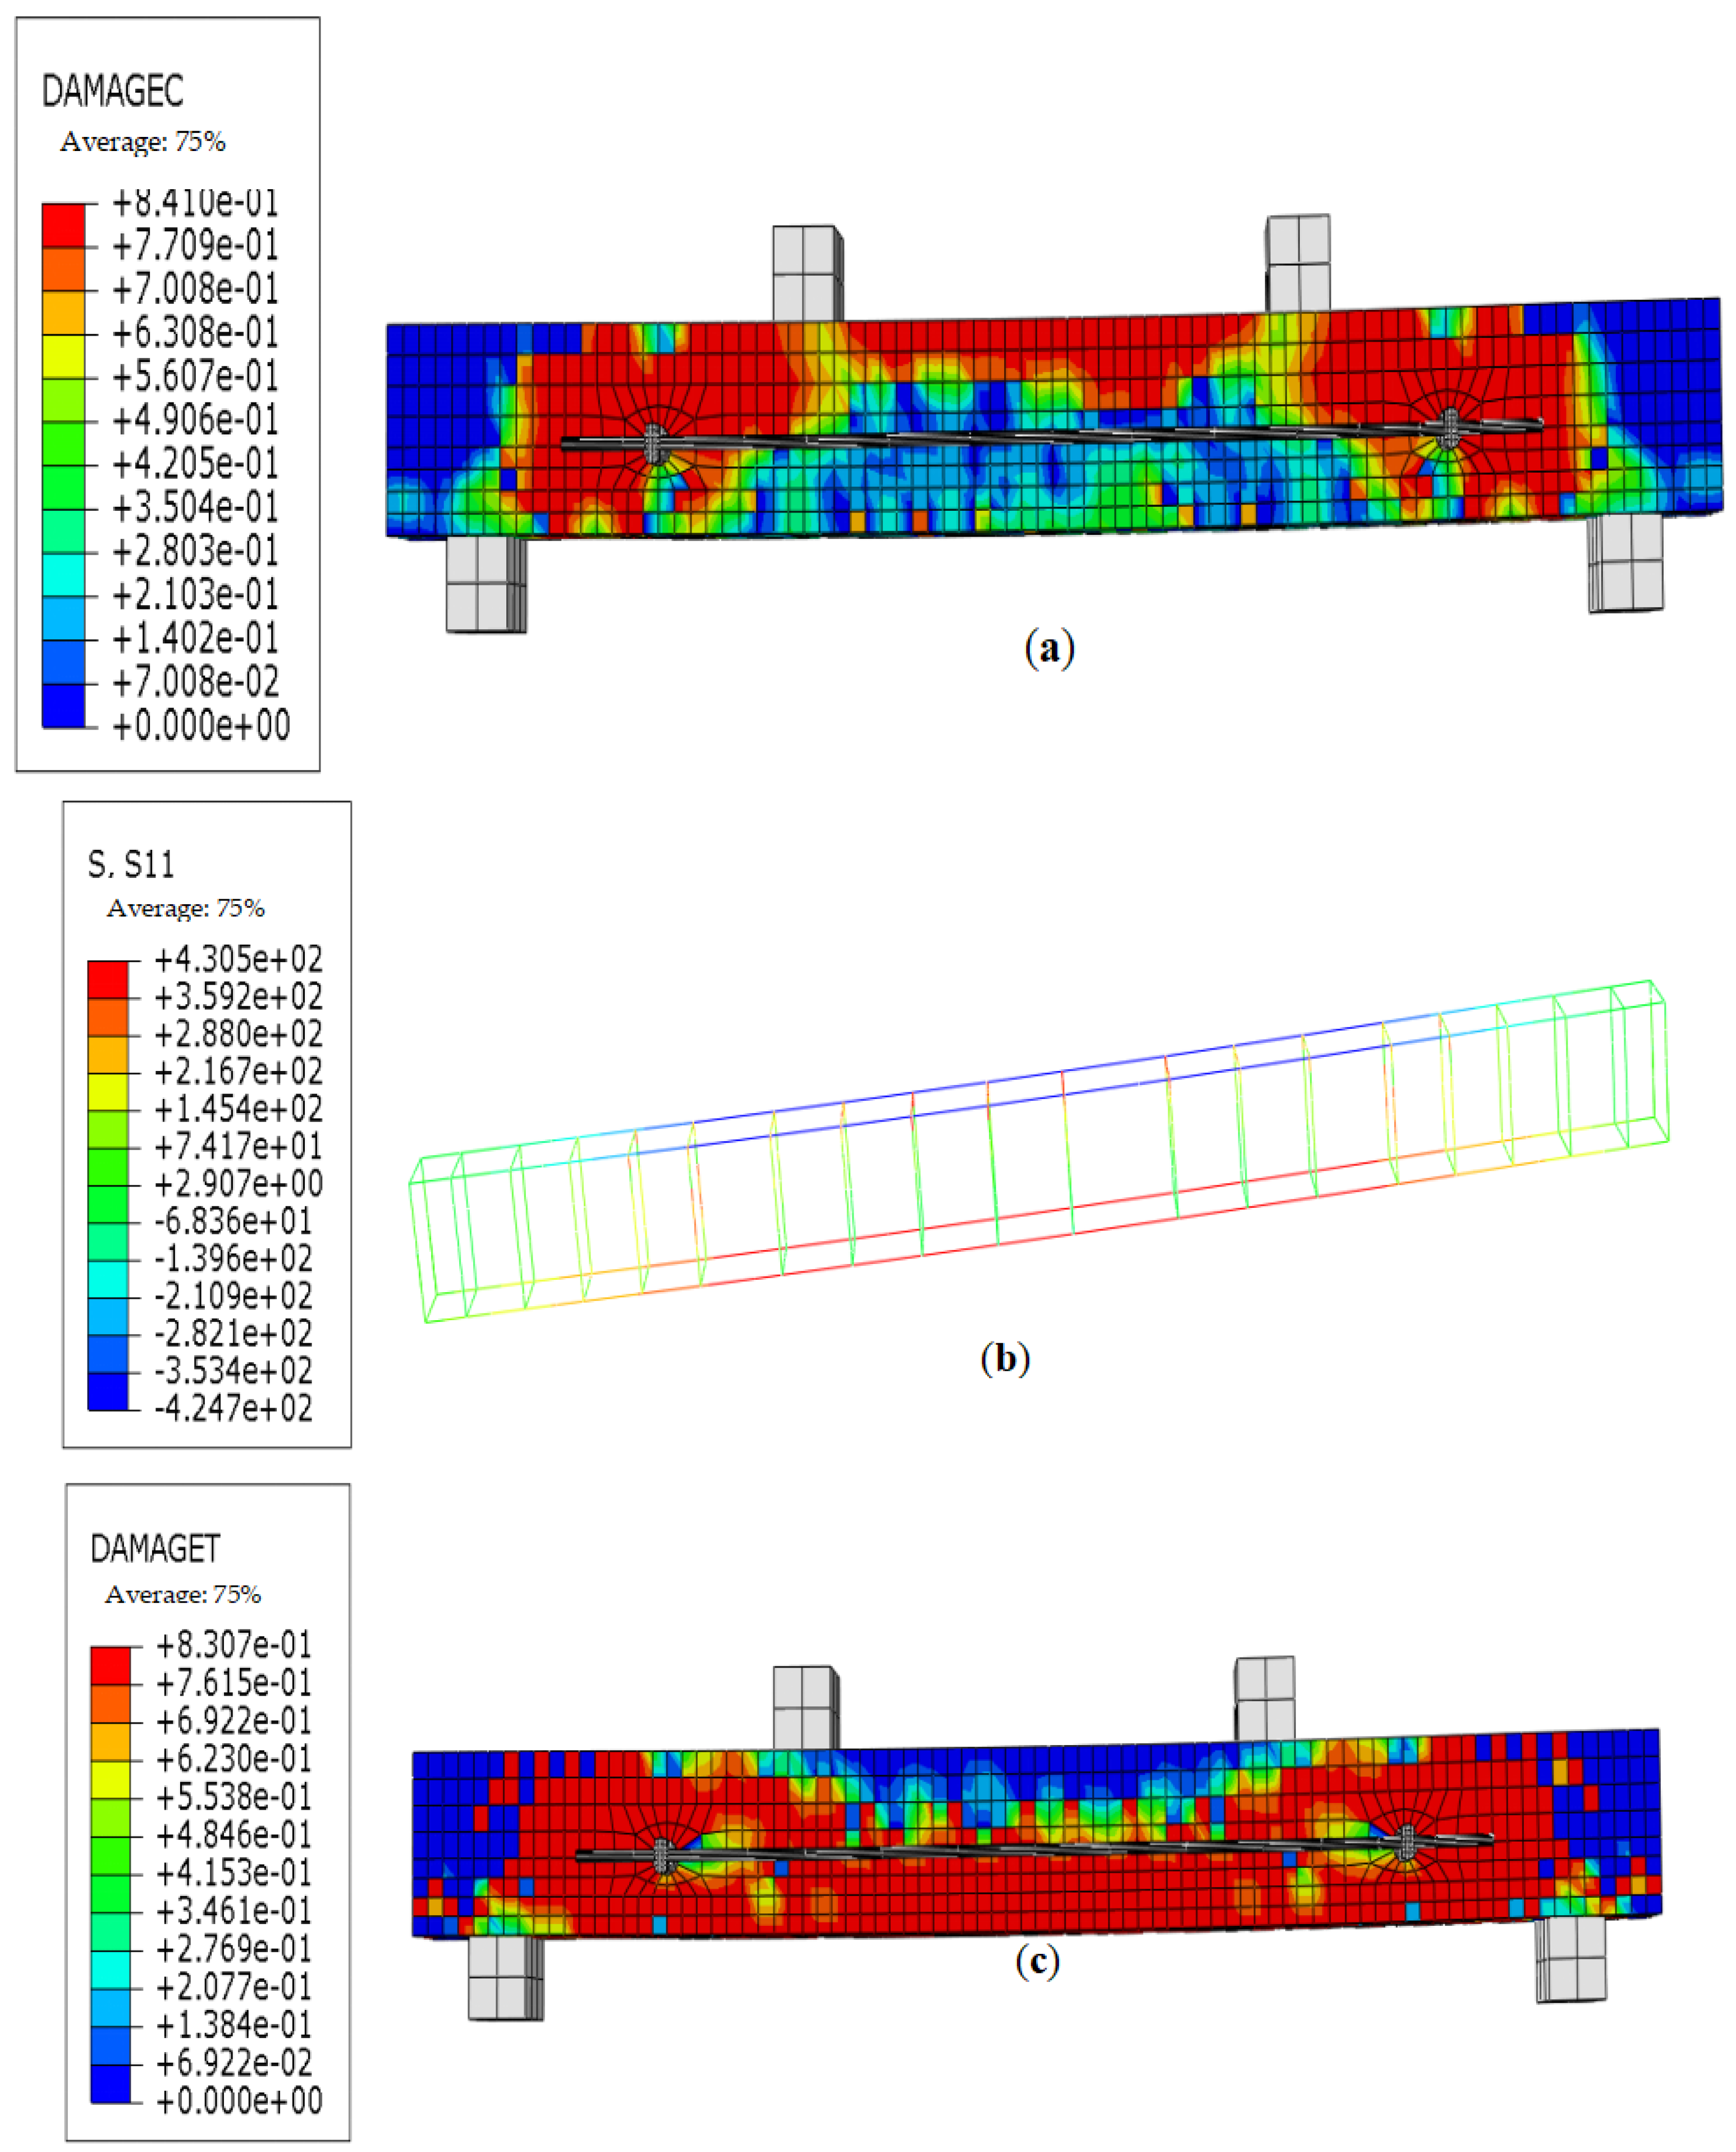
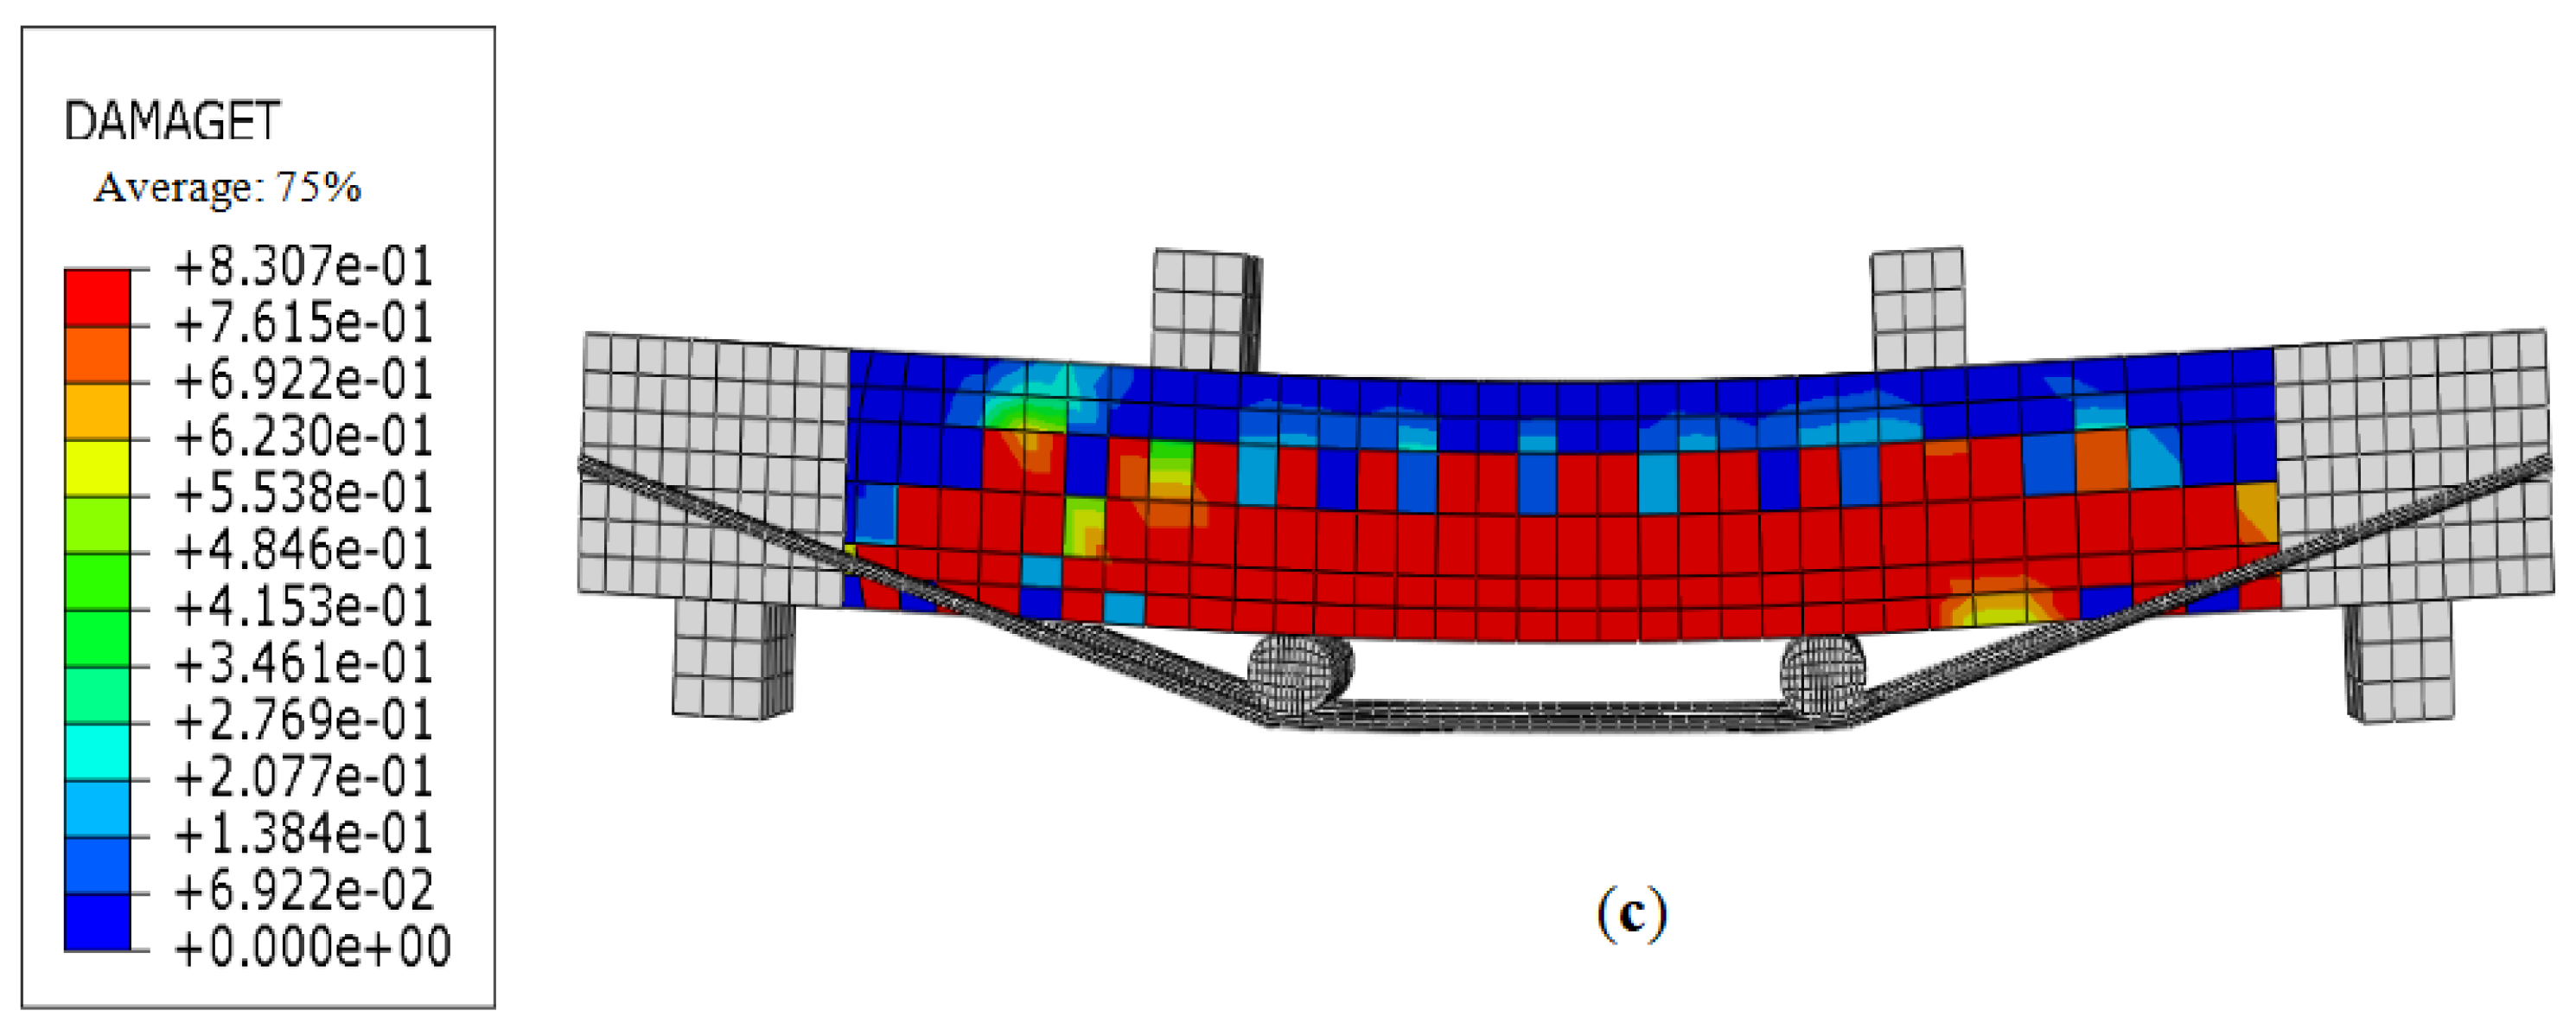
3.2.4. Analysis of Concrete Stresses

In Figure 11, the load–strain curves of the concrete in the shear span area are shown, with the measuring points distributed along the connection between the loading point and the support (Figure 5, Figure 6 and Figure 7). The analysis of the curves reveals significant variations in the stress characteristics of the concrete in the shear span zone. The concrete below the neutral axis of the concrete beam is in a tensile state, while the concrete above the neutral axis of the concrete beam is in a compressive state. This is consistent with the typical stress characteristics of concrete beams. With an increase in load, the tensile stress in the middle tensile zone of the beam span increases, which eventually leads to the cracking of the concrete, and the concrete near the support continues to bear greater compressive stress. In terms of the strain distribution, the critical zero point strain of the concrete in the beam span can be further predicted. The zero point strain is defined as the strain point at which the concrete transitions from compression to tension. It is typically located between the middle span and the support.

4. Finite Element Analysis of External Prestressed Reinforced Concrete Beams

There are numerous calculation methods for analyzing concrete composite beams. Wang et al. [32] proposed the finite difference method, presenting a novel framework for stress analysis of three-dimensional (3D) composite (multi-layered) elastic materials. Additionally, Kabir and Aghdam [33] introduced the Bézier multi-step method. In their study, an accurate Bézier-based multi-step approach was developed and implemented to determine the nonlinear vibration and post-buckling configurations of Euler–Bernoulli composite beams reinforced with graphene nano-platelets (GnPs).
ABAQUS is capable of accurately simulating the nonlinear behavior of concrete beams during the stress process, including cracking, steel yielding, and concrete crushing, among other complex phenomena. Drawing upon the analysis, research, and calculations conducted by Kazemi et al. [34] and their research team, the ABAQUS software was utilized to simulate the failure process and shear capacity of the test concrete beams. The simulated results were then compared with the experimental results.

4.1. Establishment of ABAQUS Finite Element Model

4.1.1. Steel Constitutive Model

The standard reinforcement constitutive model employs the stress–strain curve model as outlined in specification [35]. The mean yield strength and ultimate strength of the steel bar are determined by the following calculations:
f y m = f y k / ( 1 1.645 δ s )
f stm = f stk / ( 1 1.645 δ s )
where fyk and fym are the standard value and average value of the yield strength of the steel bar; fstk and fstm are the standard value and average value of the ultimate strength of the steel bar; and δ s is the coefficient of variation of the steel bar strength.
The stress–strain constitutive relationship model of reinforcement is given as follows:
σ s = E s ε s f y , r f y , r + k ( ε s ε u y ) 0 ε s ε y ε y < ε s ε u y ε u y < ε s ε u ε s > ε u
where E s is the elastic modulus of the steel bar; σ s is the reinforcement stress; ε s is the reinforcement strain; fy,r is the representative value of the yield strength of the steel bar; fst,r is the representative value of the ultimate strength of the steel bar; ε y is the yield strain of the corresponding steel bar to fy,r; ε u y is the starting strain of the reinforcement hardening; ε u is the yield strain of the corresponding steel bar to fst,r; and k is the slope of the hardening section of the steel bar.

4.1.2. Constitutive Model of Long Bolts

The yield strength and ultimate strength of the 8.8 grade long bolts are greater than those of the ordinary steel bars utilized in the tests, and the bolts do not yield for the final beam failure time, thus enabling the constant constitutive model to be employed for the tension model σ s = E s ε s .

4.1.3. Concrete Constitutive Model

The constitutive relation model of concrete is affected by multiple factors, including the stress, strain, time, environment and loading history. In order to ensure better convergence, the canonical constitutive model [30] is adopted in this study. The specification provides a formula for expressing the uniaxial stress–strain curves of concrete as follows:
(1)
Under a uniaxial tensile load:
ρ t = f t . r E c ε t . r
d t = 1 ρ t 1.2 0.2 x 5 x     1
d t = 1 ρ t α t x 1 1.7 + x x   >   1
ε = x ε t . r
σ = 1 d t E c ε
where α t = 0.312 f t . r 2 ; ε t . r = 6.5 f t . r 0.54 × 10 6 ; f t . r = 0.1 f c . r .
(2)
Under uniaxial pressure:
ρ c = f c . r E c ε c . r
n = E c ε c . r E c ε c . r f c . r
d c = 1 ρ c n n 1 + x n x     1
d c = 1 ρ t α c x 1 2 + x x   >   1
ε = x ε c . r
σ = 1 d c E c ε
where α c = 0.157 f c . r 0.785 0.905 ; ε c . r = 700 + 172 f c × 10 6 ; dt and dc are the uniaxial tensile and compression damage parameters of concrete, respectively; f c . r is the representative value of the uniaxial compressive strength of concrete; and f t . r is the representative value of the uniaxial tensile strength of concrete.

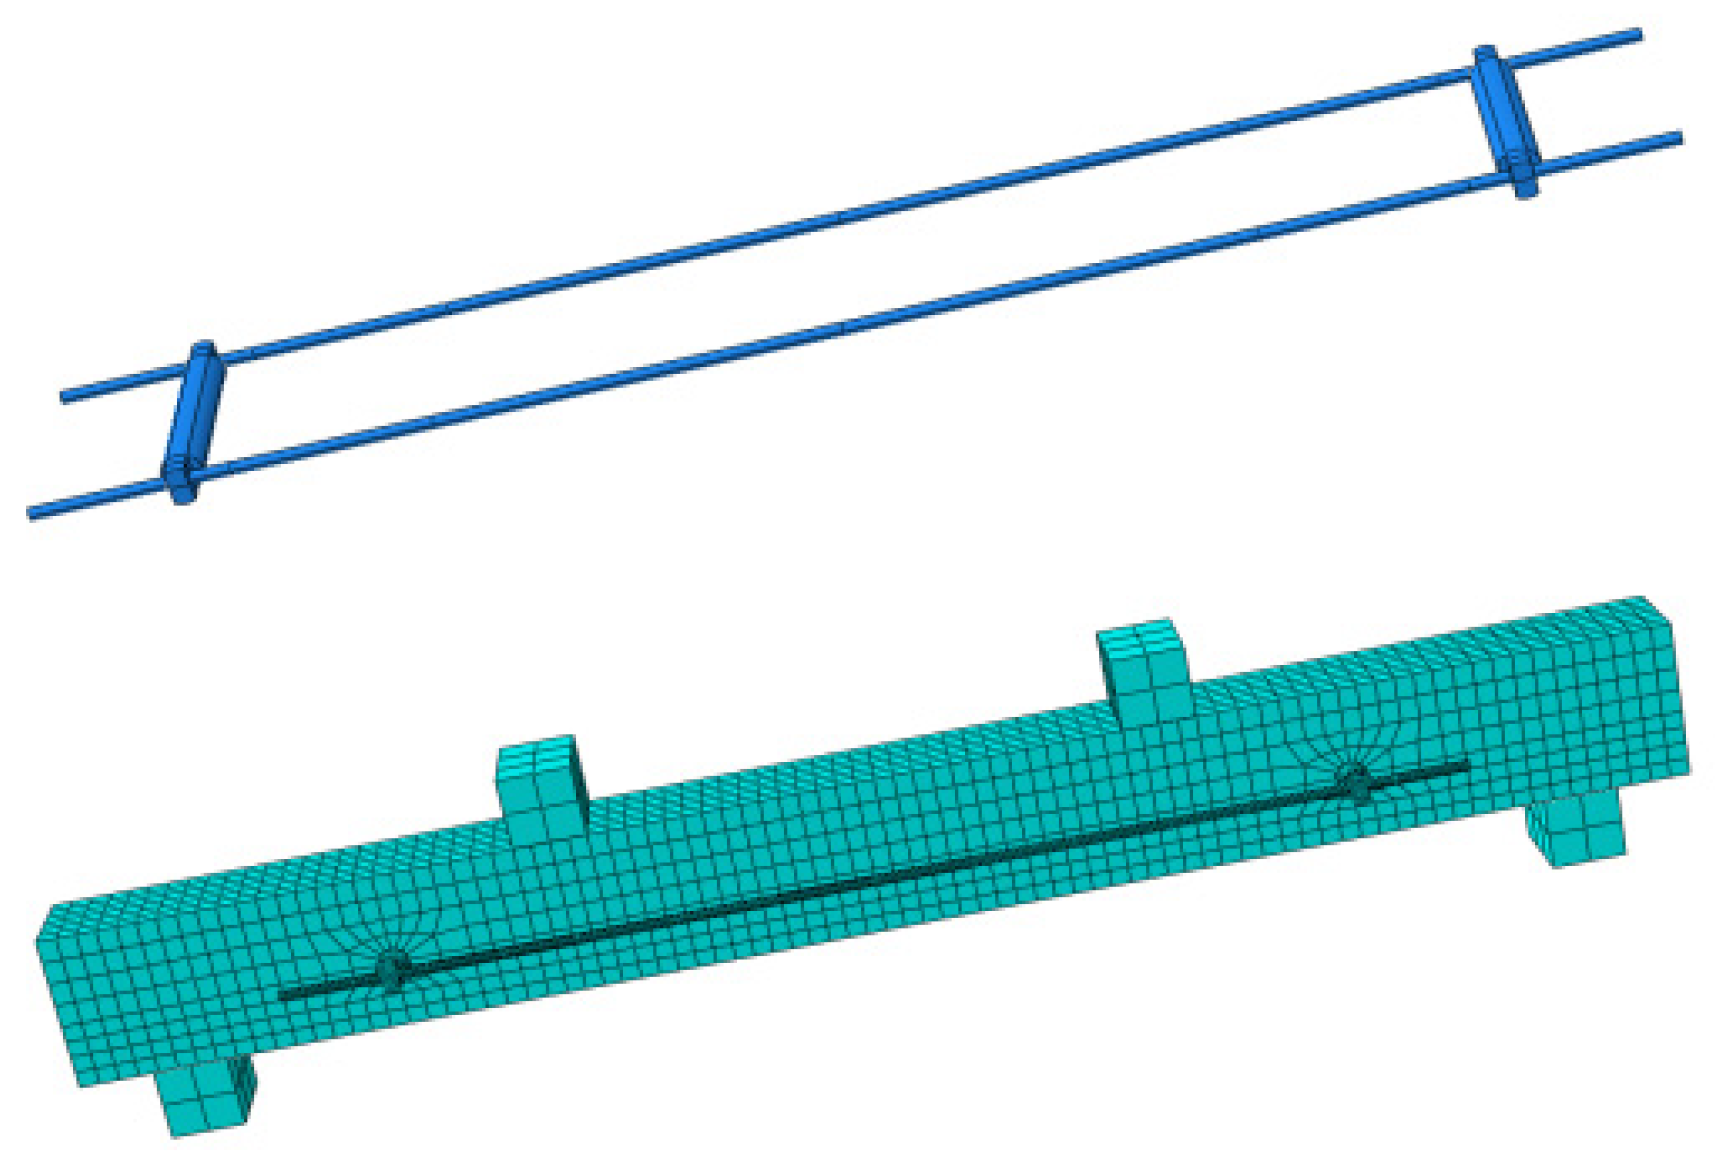
4.1.4. Establish Model and Mesh Division

In Figure 12, the overall model and grid division of external prestressed reinforced concrete beams with side facades are demonstrated. The installation of pad blocks with high stiffness at the support and loading points can effectively avoid stress concentration. Solid element C3D8R, which is suitable for complex three-dimensional structural solid units, is selected for the concrete and pad blocks, while T3D2 truss units are selected for the steel bars and prestressed tendons.
The concrete model employs a damage plasticity model. The concrete material is modeled using C3D8 solid elements with a solid shape representation, while the reinforcing bars are represented by T3D2 truss elements. In the ABAQUS Mesh module, the structured partitioning method is selected to ensure efficient meshing of geometrically regular areas within the model. The boundary conditions are defined in the Load module of ABAQUS.

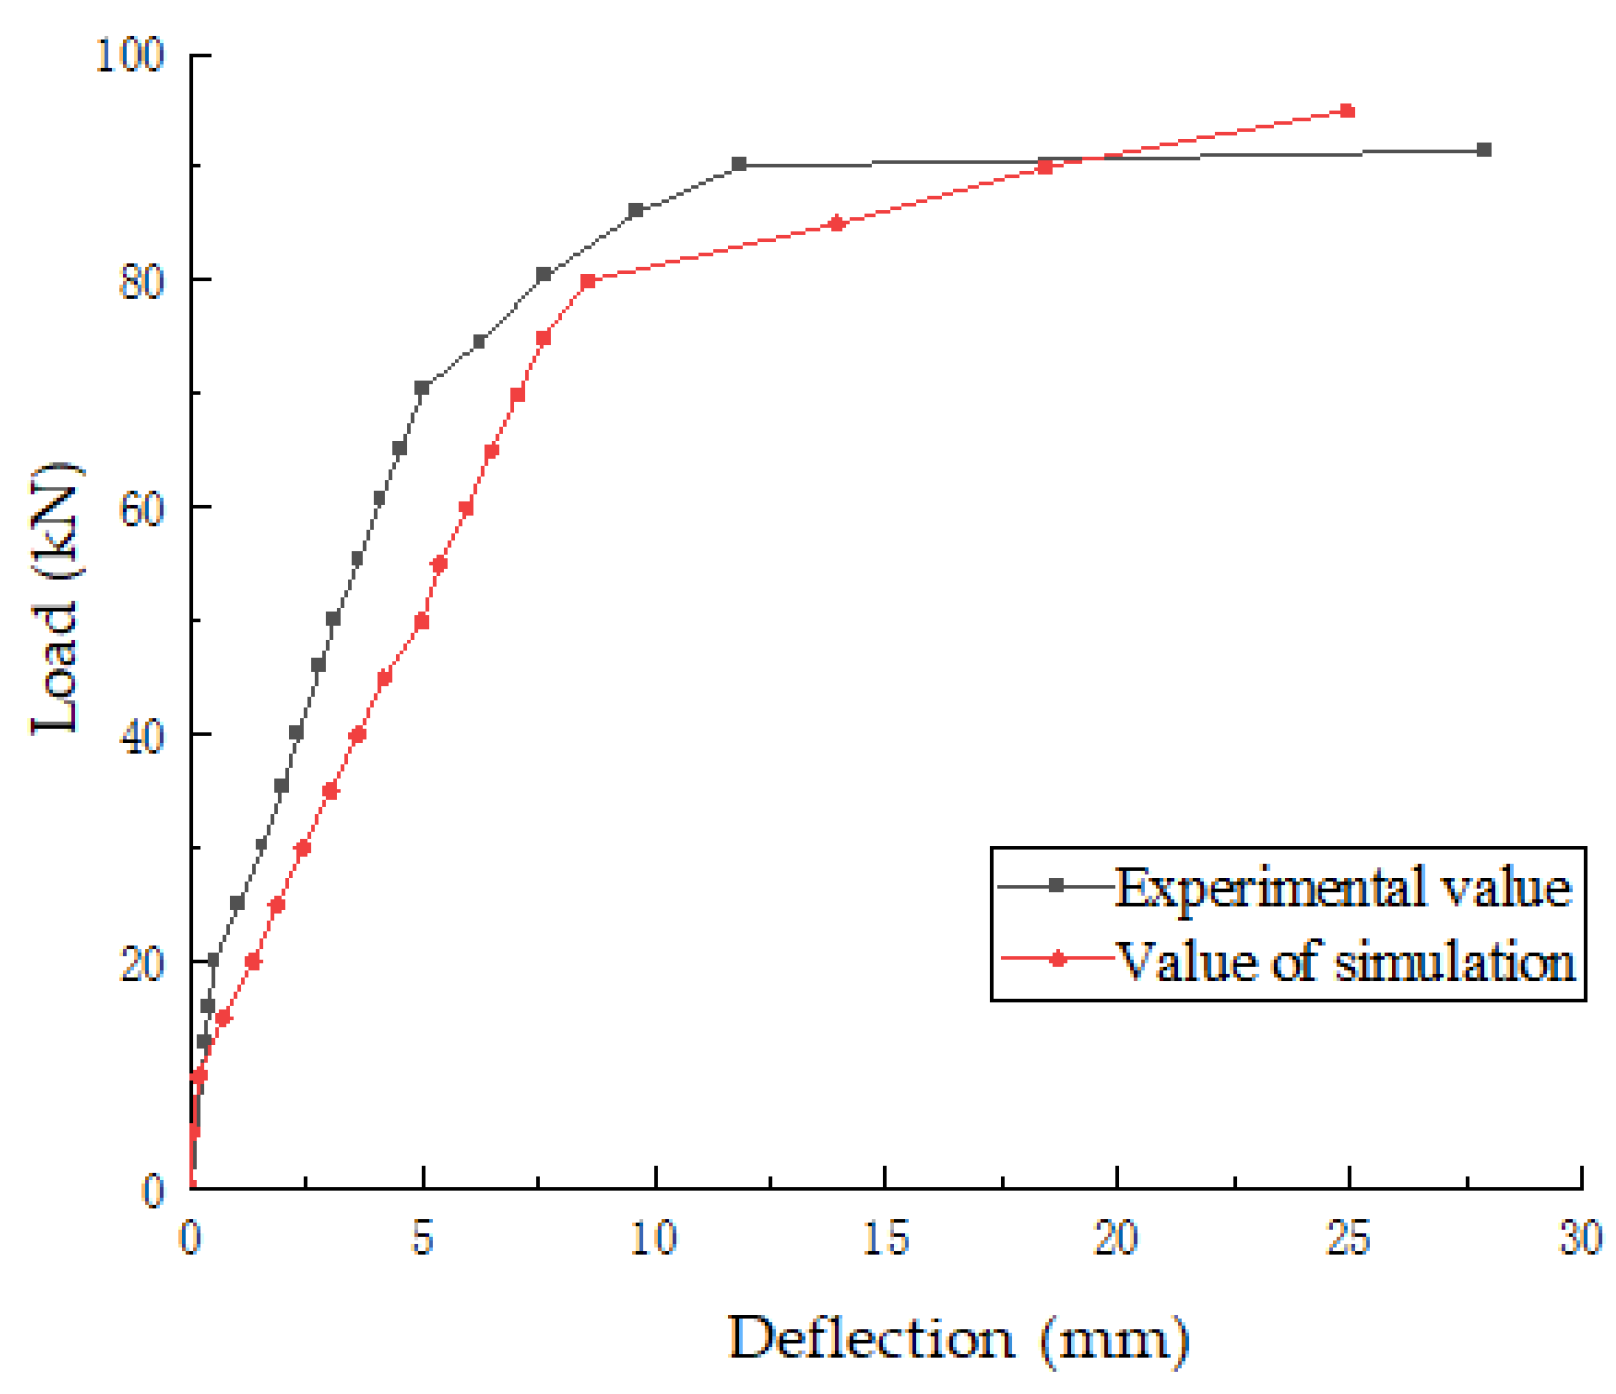
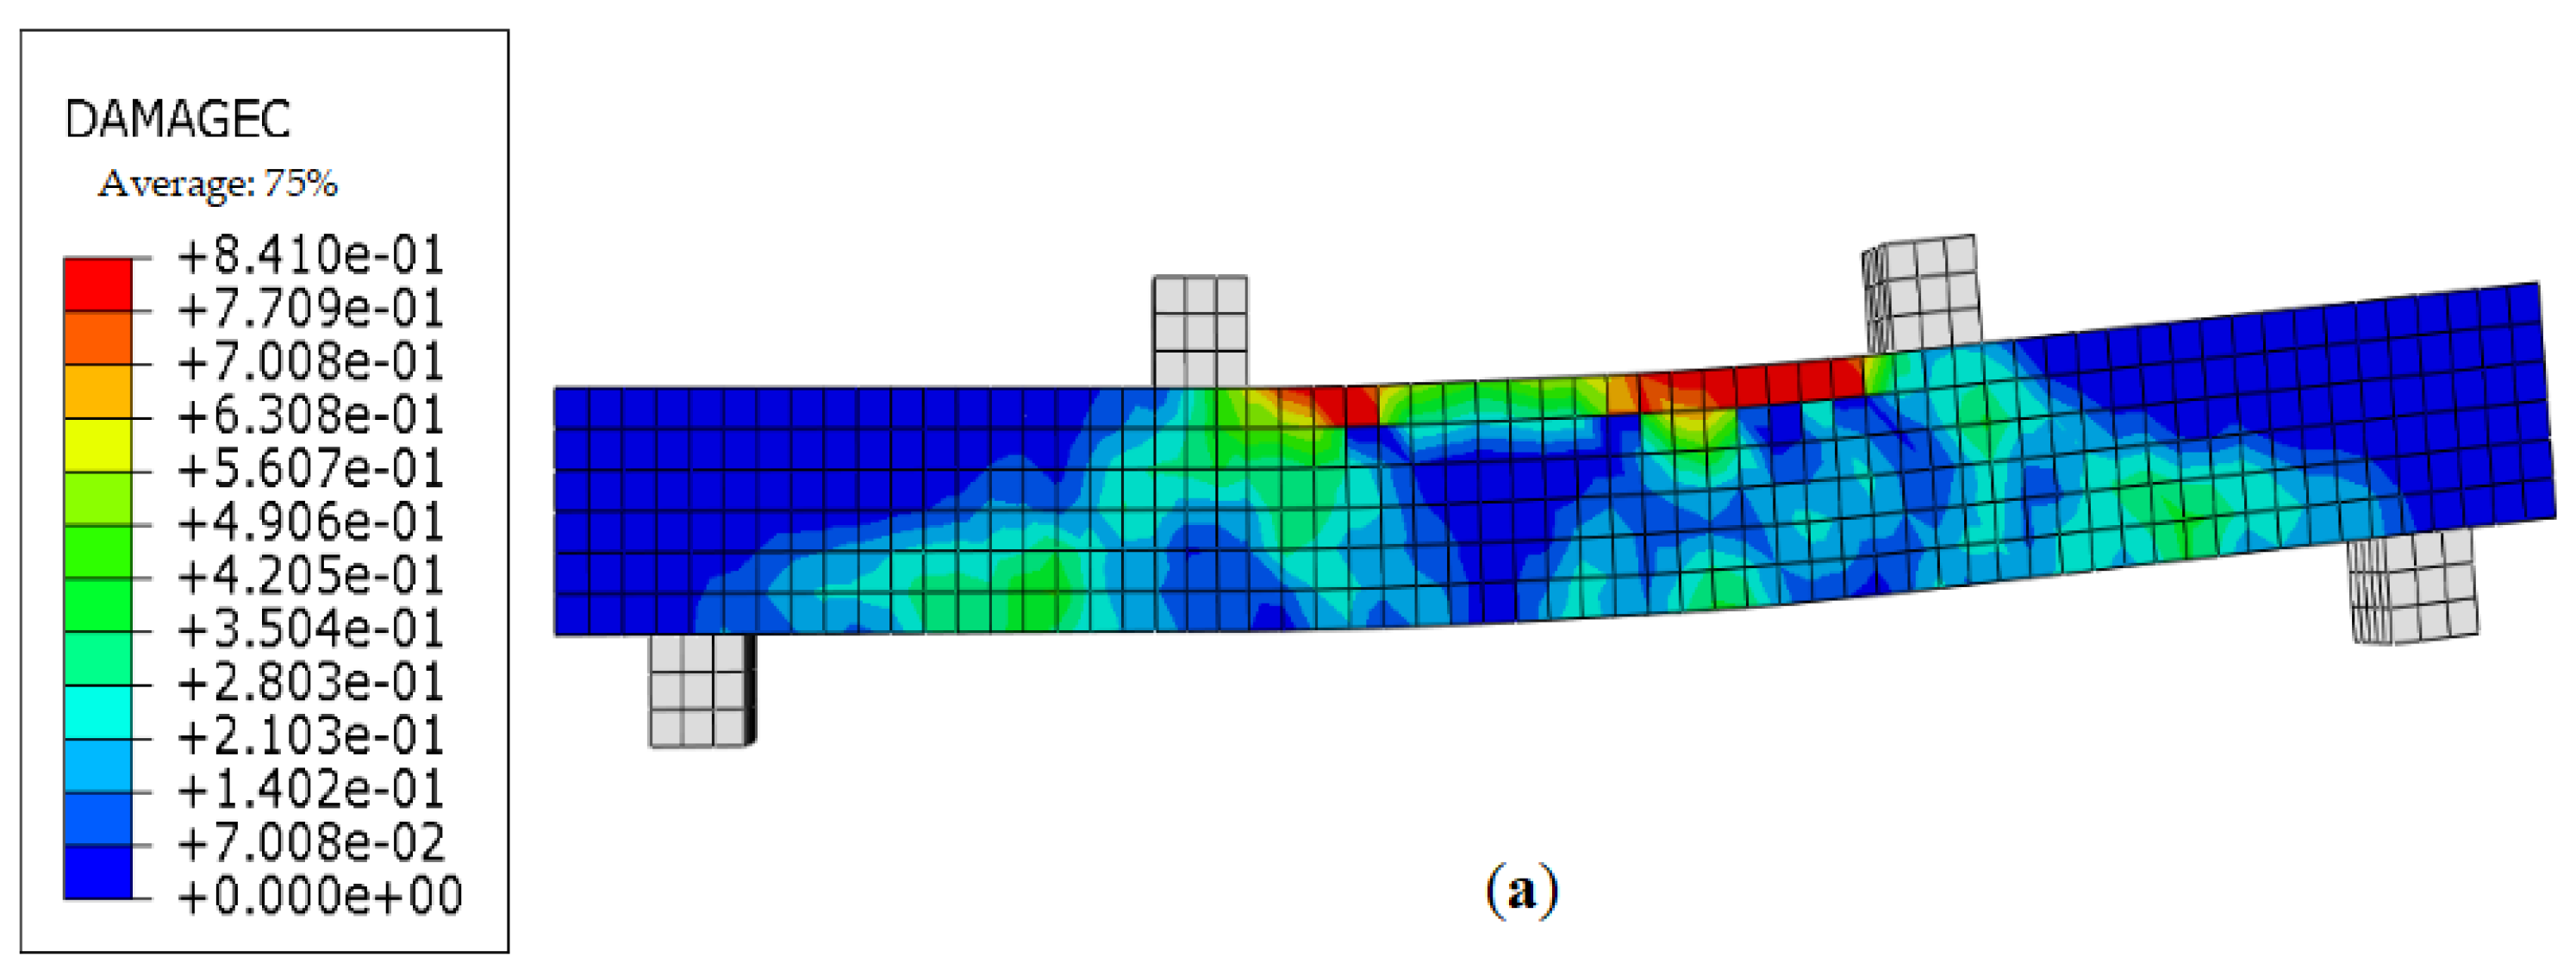
4.1.5. Verification of Software Analysis Results

In Figure 13, the load–displacement curves of the test values and simulated values of OB-2 are presented. The deformation of the test beam is found to be essentially congruent with the simulation results, thereby validating the adequacy of the selected model.
A comparison of the simulation results with the test data reveals that the beam exhibits similar behavior in the elastic stage prior to cracking. This finding can be used to preliminarily ensure the reliability of the simulation. However, it should be noted that differences in construction technology, randomness in concrete, and the complexity of damage, among other factors, result in a slight discrepancy between the two loads once the ultimate load is reached.
As illustrated in Figure 14, the compression damage diagram of the concrete under the ultimate load of OB-2 demonstrates that when the upper concrete reaches its ultimate compressive strength, it undergoes cracking, a phenomenon that is consistent with the observations made during the test. Figure 14b,c presents the stress contour of the concrete beam reinforcement and the tensile damage stress contour of the concrete under the limit state. A comparison of this diagram with the actual crack distribution diagram reveals that the position and shape of the oblique cracks are consistent.
As illustrated in Figure 15, the load–displacement curves of the SRB-50-2 test value and simulation value demonstrate that the simulated ultimate load is 137.9 kN, with a corresponding displacement of 19.6 mm. The ultimate load obtained by the experiment is 126.0 kN, with the corresponding failure displacement of 23.5 mm. It is evident that, upon reaching the ultimate load, the simulated value exhibits a slight increase compared to the experimental value. While a discrepancy exists between the maximum loads of the test and simulation values, the margin of error remains less than 10%, signifying the reliability of the numerical simulation results. At the commencement of the loading process, both the test and simulation values are in the linear elastic stage. However, the slope of the test value exhibits a slight increase over that of the simulated value, suggesting the necessity for refinement of the model. In summary, the discrepancy between the test and simulation values falls within the prescribed specification limits.
As demonstrated in Figure 16, the concrete tensile damage and compression damage diagrams of beam SRB-50-2 and the stress contour of the reinforcement illustrate the distributions of the maximum stresses in the simulated beam. The figure reveals that the maximum stresses are predominantly concentrated at the base of the concrete, in proximity to the points of connection between the support and the loading point. The distribution position and configuration of the cracks observed in the figure correspond to the test results. The failure of the test beam in the stress contour of the prestressed high-strength steel bar can be verified, and these characteristics are consistent with the test results.
As demonstrated in Figure 17, the load–displacement curves of the test and simulated values of TRB-40-2 reveal that the ultimate load measured by the test is 232.9 kN, with a corresponding displacement of 16.11 mm. In comparison, the ultimate load of the numerical simulation is 236.6 kN, accompanied by a displacement of 17.5 mm. The error margin of 1.6% observed between the two methods indicates the high accuracy and reliability of the software simulation results. It is noteworthy that, upon reaching the ultimate load, the numerical simulation value exhibits a marginal increase over the test value. This discrepancy may be attributed to the exclusion of the sliding effect between the steel bar and the concrete in the simulation process. However, this difference is negligible and falls within the margin of error.
As demonstrated in Figure 18, the TRB-40-2 tensile damage, compression damage and reinforcement stress contours reveal that the maximum stress during the failure of the experimental beam is primarily concentrated at the base of the concrete, in close proximity to the connection between the support and the loading point. The distribution positions and configurations of the cracks are consistent with the test. The failure of the test beam in the stress contour of the prestressed high-strength steel bar can be verified to be consistent with the test values, thus confirming that the high-strength steel bar fails to yield.
The modeling of the beams complies with the test condition. The steel plate is securely fastened to the concrete beam via bolting through the steel sleeves at both ends, as shown in Figure 2c. Subsequently, two high-strength steel rods are firmly attached to the steel plate by welding, with their midpoint interconnected using a bidirectional fastener, as depicted in Figure 2a. Additionally, two cylindrical pads are positioned at the bends of the high-strength steel rods to serve as steering blocks. The principle of prestress application in the external prestressing device involves providing horizontal prestress for tightening the bidirectional fastener located at the center, while the cylindrical pads enhance the vertical component force. The prestressed tendons are equipped with strain gauges, and the initial prestress as well as the subsequent prestress tests of the tendons are conducted using these strain gauges. The magnitudes of the initial prestressing forces are presented in Table 3.
Figure 19 shows the relationships between the shear capacity and the concrete strength grade for beams OB-2 and SRB-50-2. It can be seen that the shear capacity increases with the increasing concrete strength grade. Also, the shear capacities for beam SRB-50-2 always show higher values.

5. Suggested Formula for Shear Capacity

A comparison and analysis were conducted on the calculation formulas for shear strength in national codes with the test results. This study revealed that the calculated values in the codes were, in general, lower than the actual test values. However, the calculated results of the codes were found to be different and exhibited clear discreteness. This discreteness has the potential to impact the accuracy and economic efficiency of the design, particularly in cases involving different material properties, structural forms, and loading conditions. Consequently, the development of a formula for calculating the shear capacity of reinforced concrete beams with external prestressed side façades is imperative. This formula should be based on the existing codes and experimental data. The analysis of the SRB and OB bearing capacities in this study demonstrates that active reinforcement of the side façade can significantly enhance the shear bearing capacity of the beam. However, the influence of improving the prestress level on the shear resistance is relatively weak.

5.1. Analysis of Influencing Factors on Shear Performance

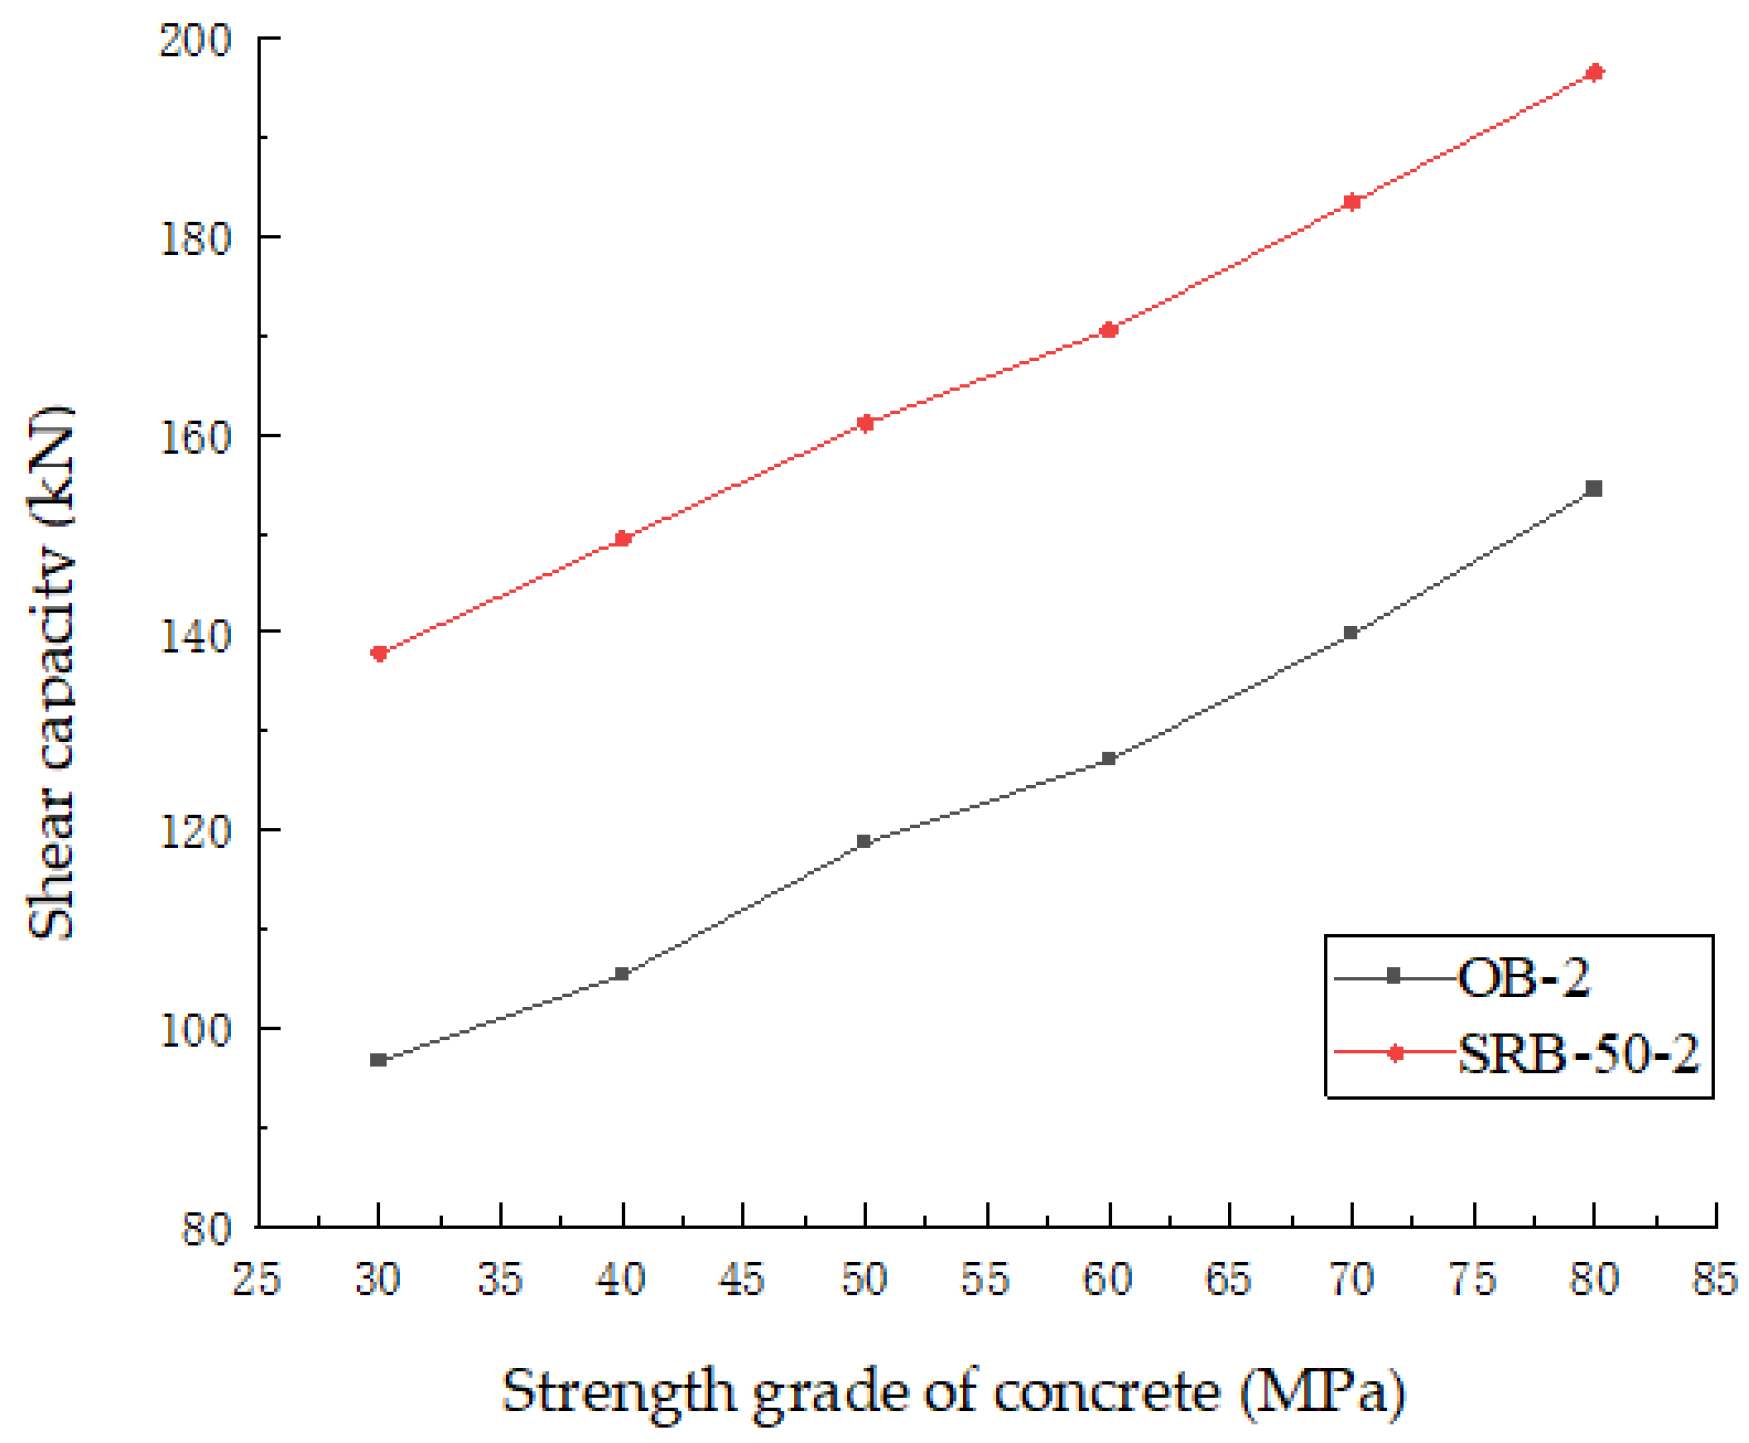
5.1.1. Concrete Strength

Utilizing the findings regarding the OB-2 and SRB-50-2 beams, it is evident that the sole modification pertains to the strength grade of the concrete, while all the other parameters remain constant. The numerical simulation results, depicted in Figure 19, reveal a direct correlation between the concrete strength grade and the shear capacity of the specimen beam. It is observed that as the concrete strength grade increases, the shear capacity of the specimen beam also rises. This outcome demonstrates that the concrete grade exerts a significant influence on the shear performance of the SRB reinforced beams. However, it is also evident that high-strength concrete beams are more prone to brittle shear failure, which can occur more rapidly and abruptly once the limit state is attained. Consequently, it is imperative to judiciously regulate the concrete strength to prevent brittle shear failure and ensure the structural integrity of beams.

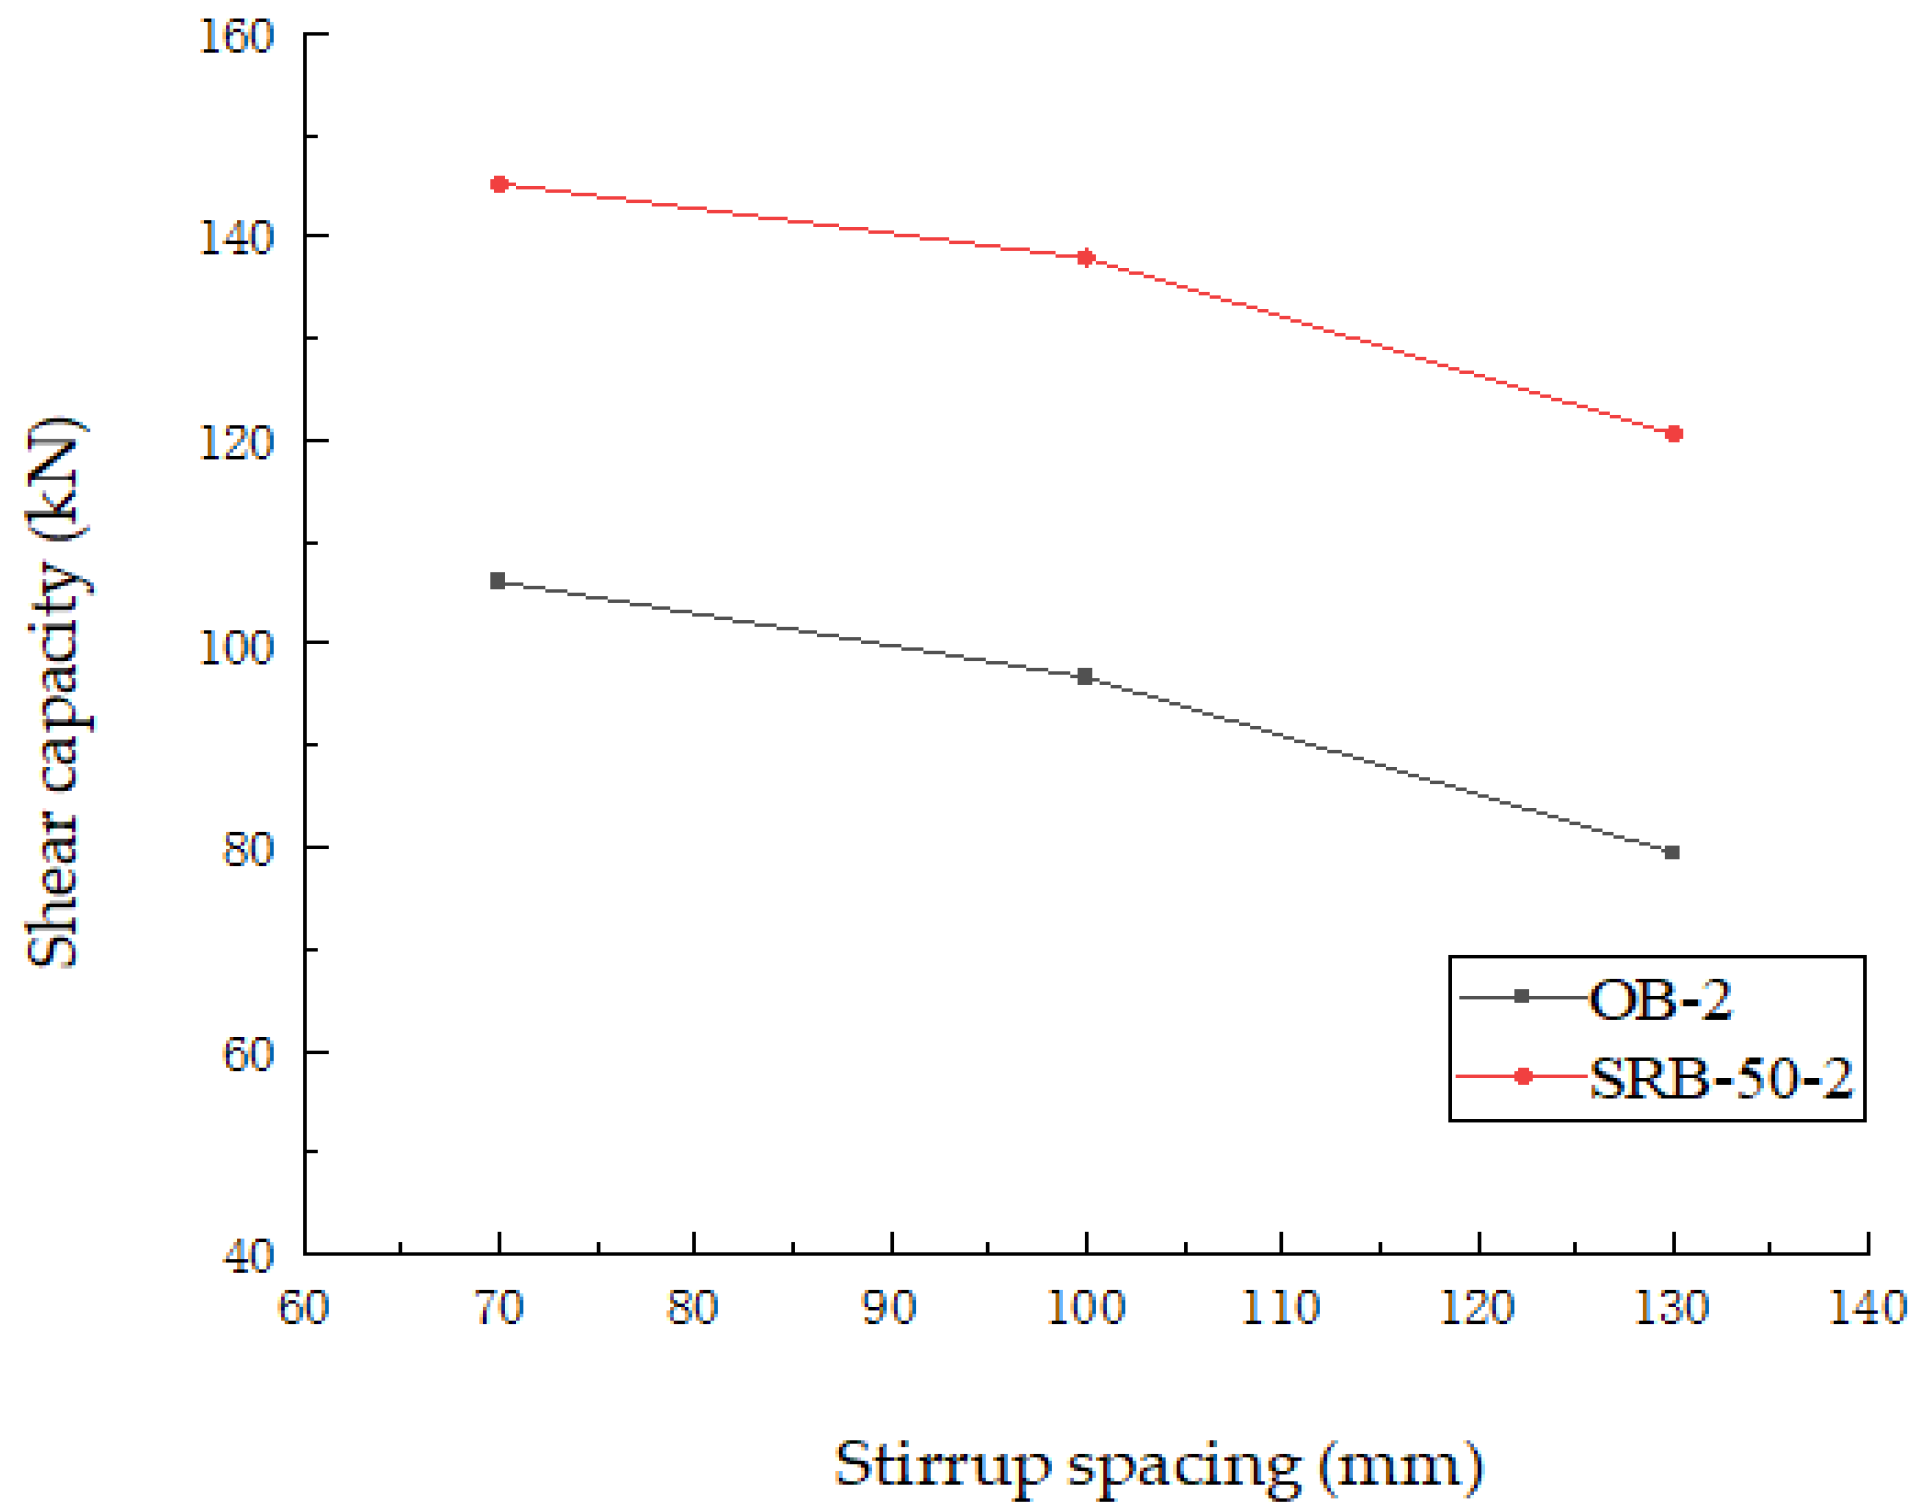
5.1.2. Stirrup Spacing

The stirrup spacings of the test beams are 70 mm, 100 mm and 130 mm, respectively, and all the other parameters are consistent. The shear capacities of the OB-2 and SRB-50-2 beams are shown in Figure 20. As is evident in the figure, with an increase in the stirrup spacing, the shear capacities of the beams in the oblique section exhibit downward trends, indicating that a reduction in the stirrup ratio leads to a weakening of the shear capacity. Consequently, it can be concluded that the stirrup spacing exerts a substantial influence on the shear strength of the beam. It is evident that a reduction in the stirrup spacing can shift the failure mode of the test beam from shear failure to ductile failure, thereby enhancing its deformation capability and improving its energy dissipation and ductility performance. However, when considering the construction costs, a balance must be struck between safety and economy in the design process, and the optimal stirrup spacing can be determined based on the specific load and safety requirements.

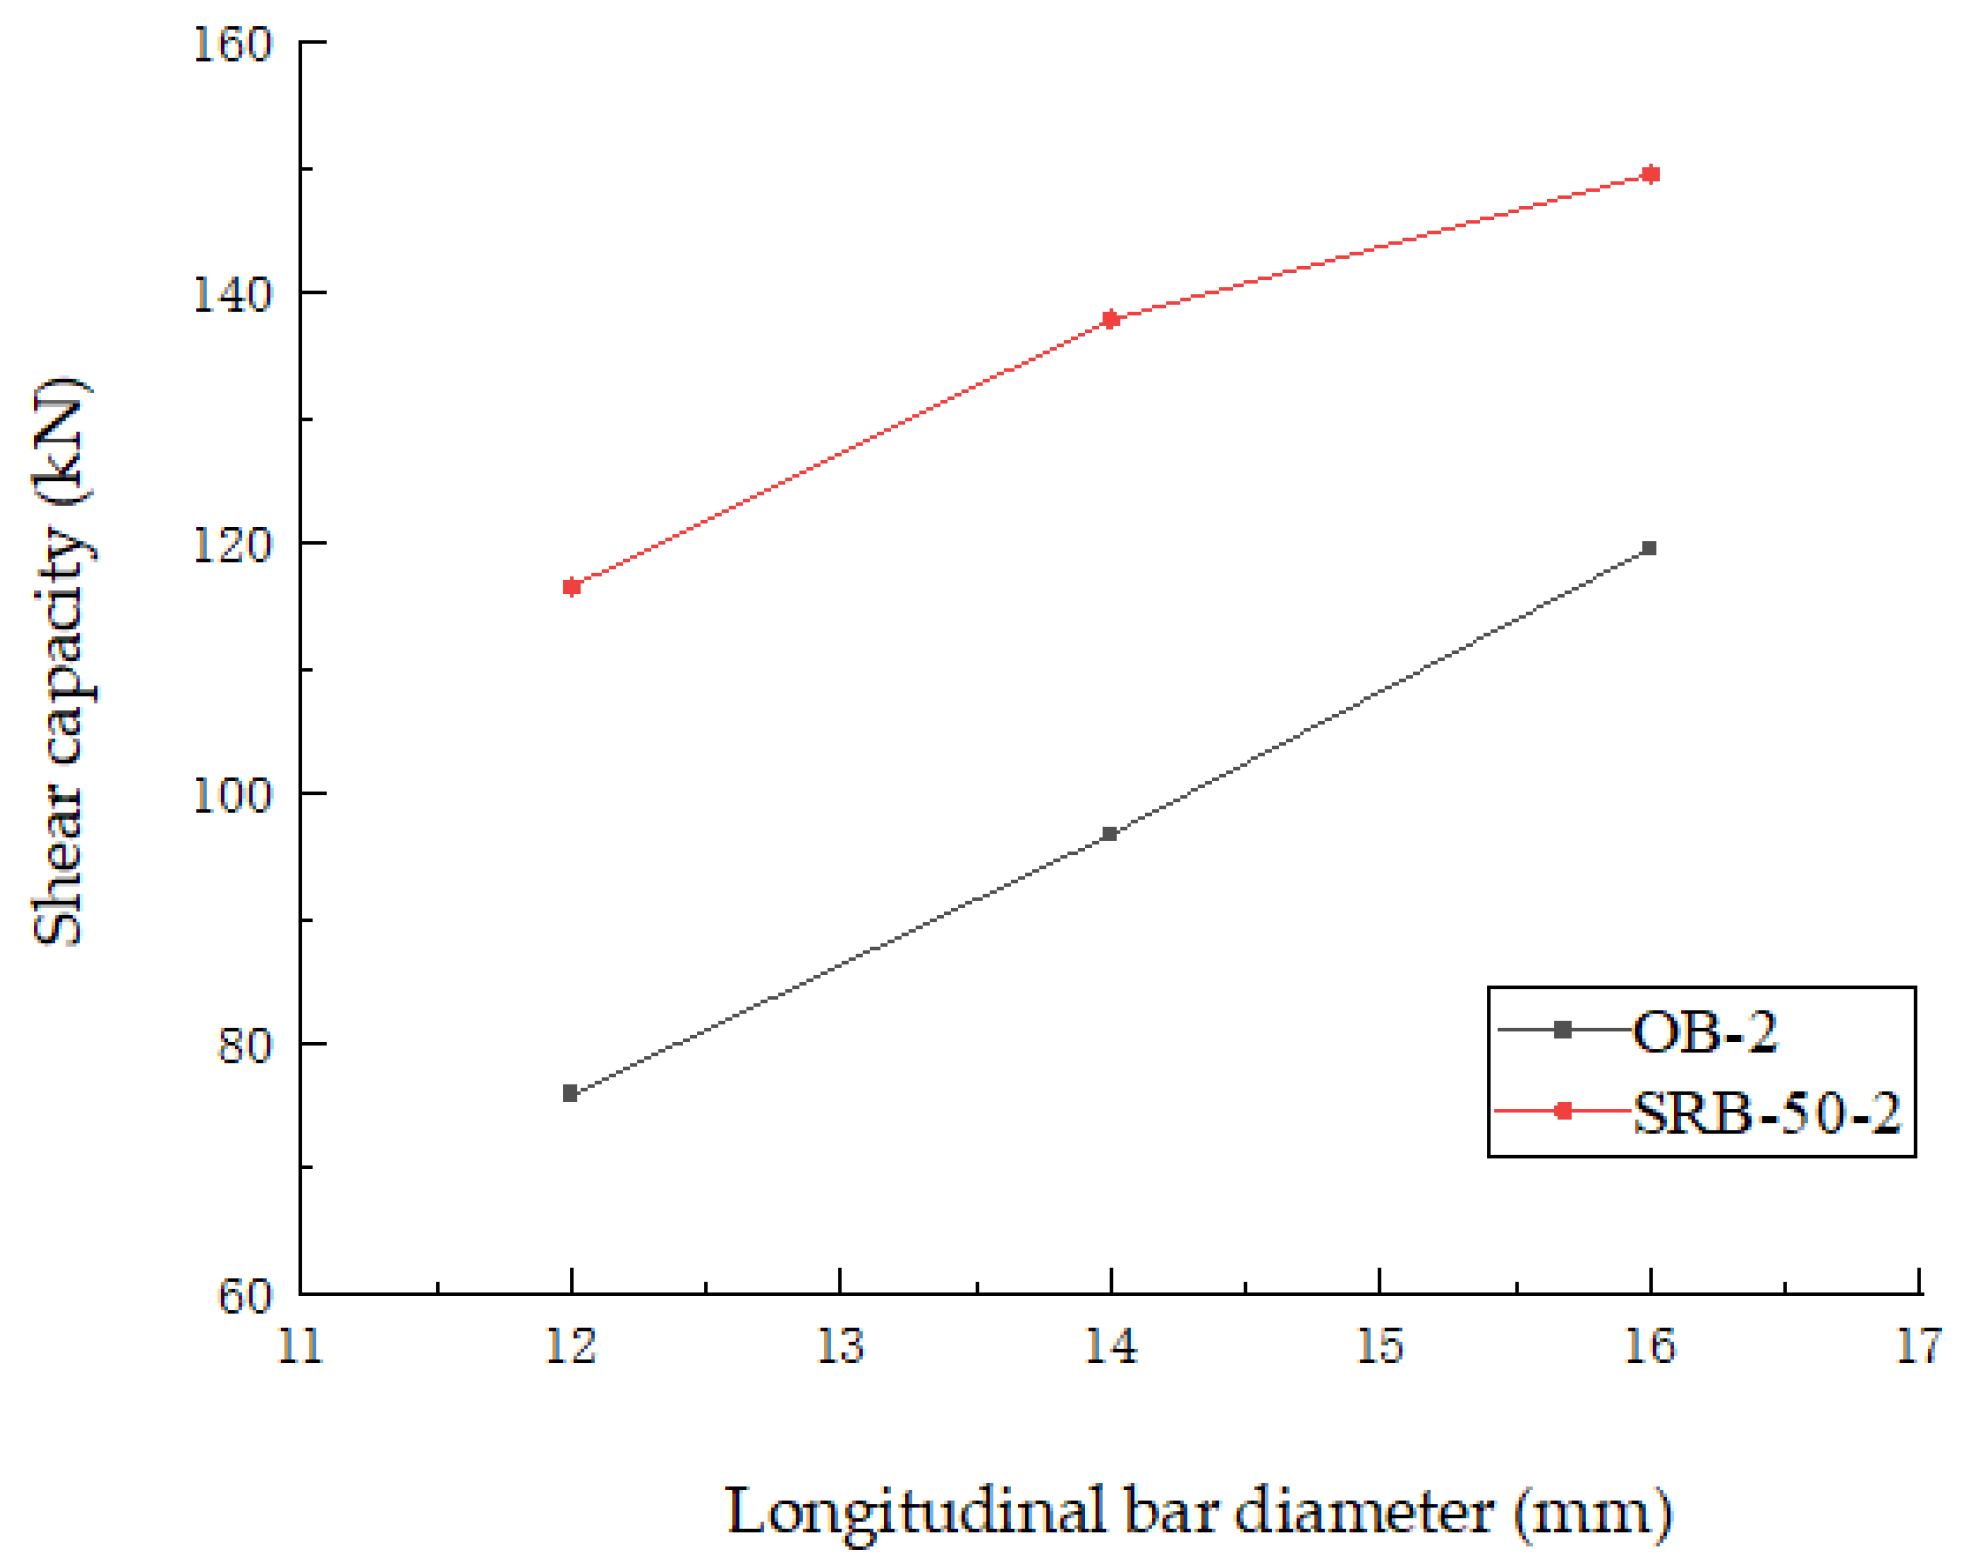
5.1.3. Diameter of Longitudinal Reinforcement

In order to study the effect of longitudinal reinforcement on the shear capacity of external prestressed concrete beams with lateral façades, the other parameters for the OB-2 and SRB-50-2 beams were kept unchanged and only the diameter of the reinforcement was changed in the numerical simulation. In Figure 21, the influence of lower longitudinal bars of beams with different diameters (10 mm, 12 mm and 14 mm) on the shear strength is shown. The results demonstrate that the shear capacity of the beam is directly proportional to the diameter of the longitudinal bar, with larger diameters resulting in higher capacities. This is due to the larger diameter of the longitudinal bar providing greater pin force and limiting the expansion of the oblique crack, thereby increasing the height of the pressure relief zone. Increasing the diameter or number of the longitudinal bars can alter the shear failure mode of the beam, making it more susceptible to ductile failure. It is therefore concluded that by increasing the shear resistance of the beam, the longitudinal reinforcement can control the expansion of the shear crack, thus improving the deformation and warning abilities of the beam before failure.

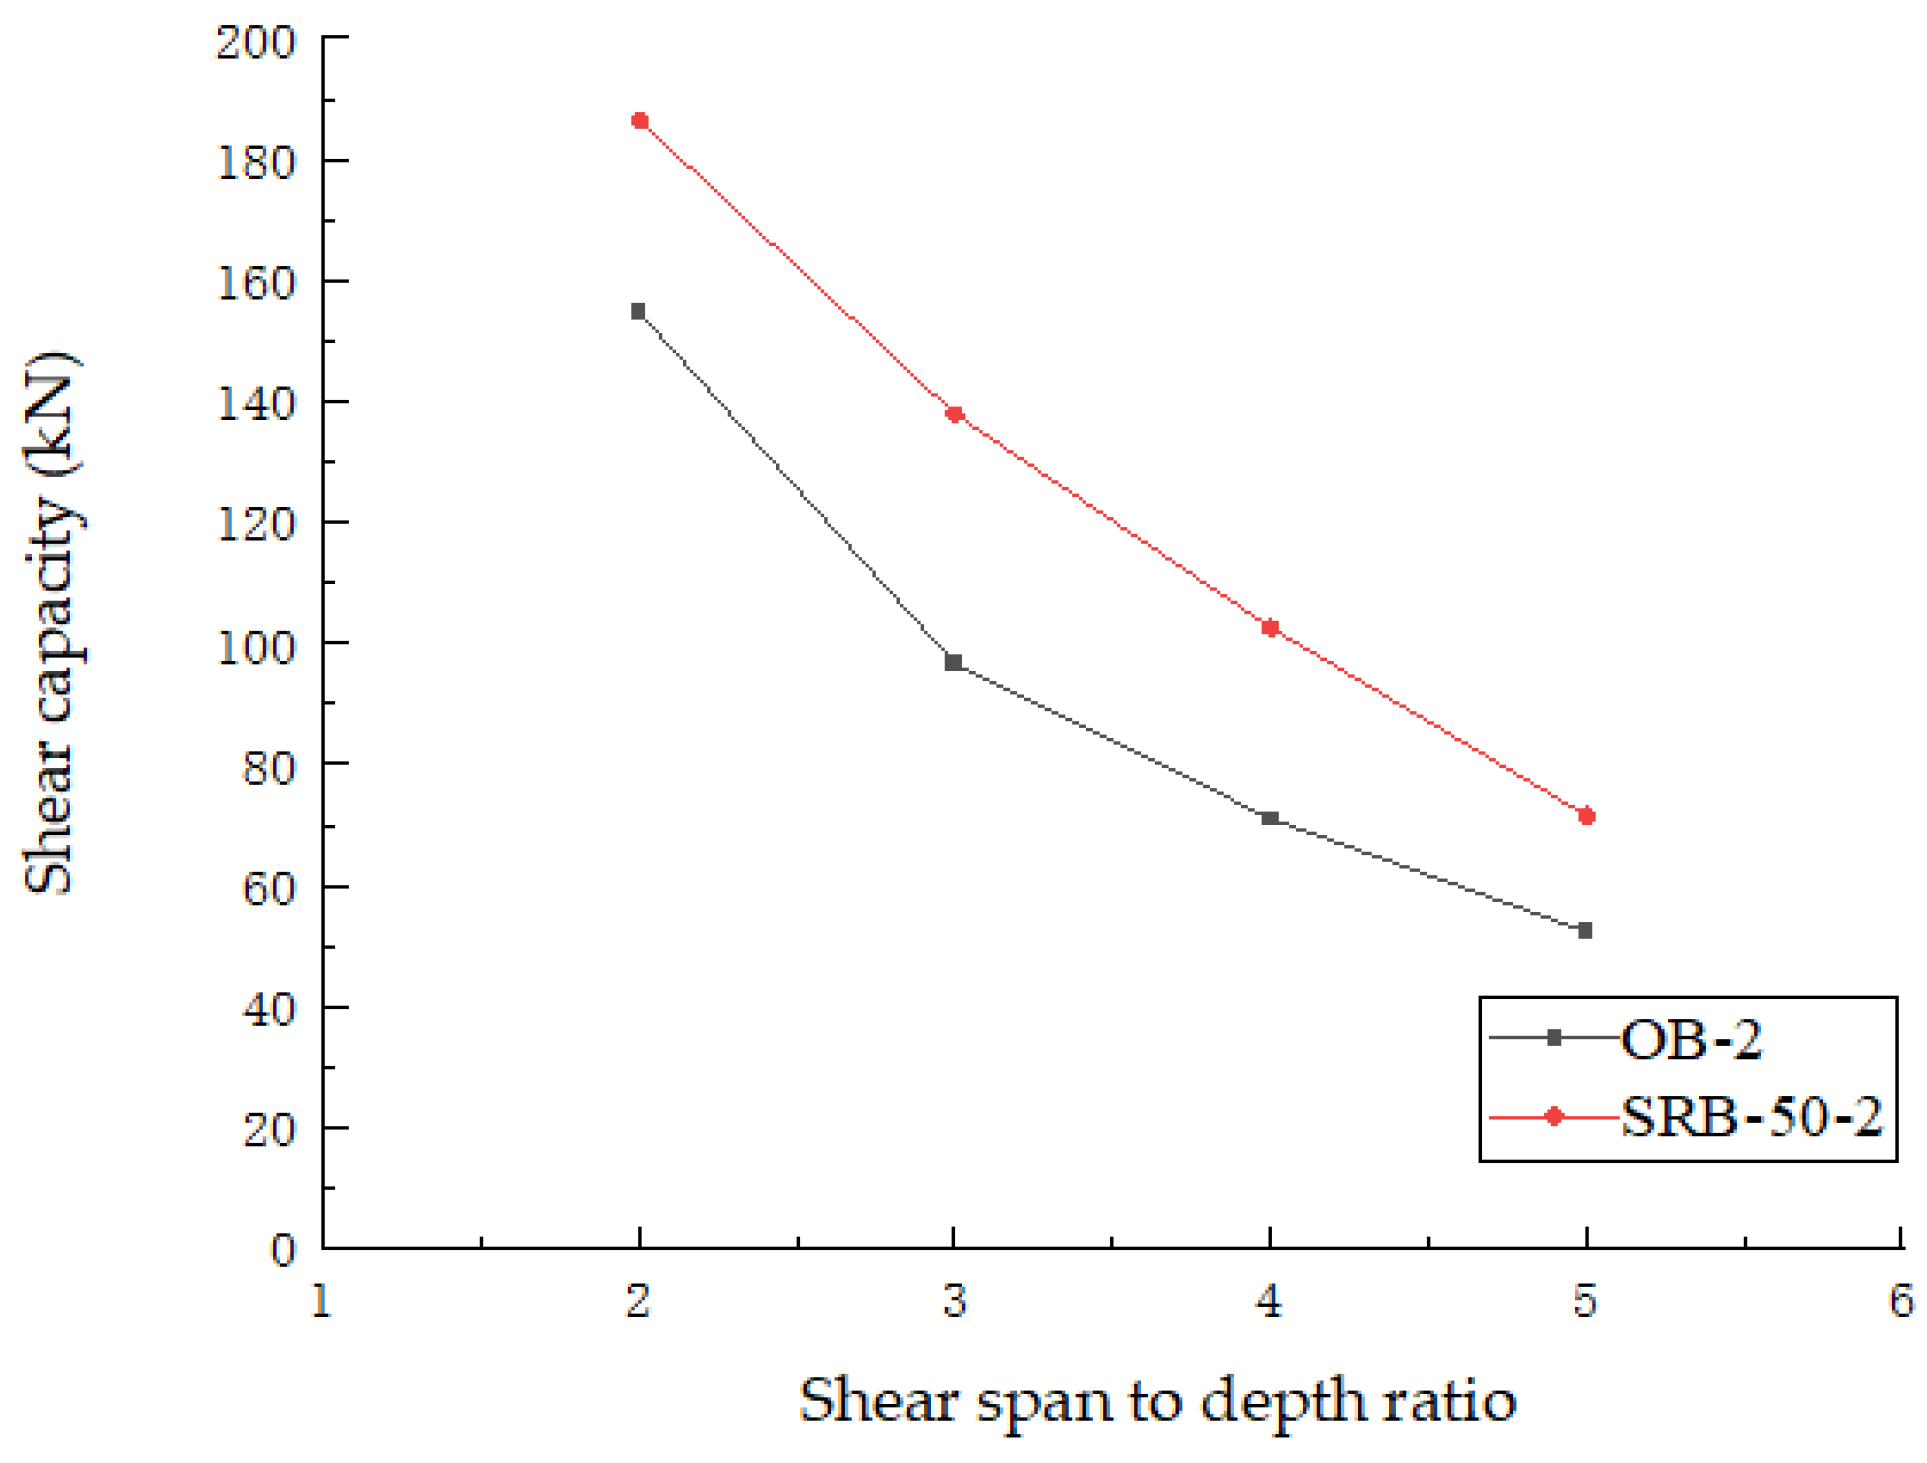
5.1.4. Ratio of Shear Span to Depth

The ratio of shear span to depth is a pivotal factor in determining the shear resistance of concrete beams. In the design and construction of concrete beams, it is imperative to consider the influence of the shear span to depth ratio on the shear resistance, and to implement appropriate reinforcement and optimization measures to ensure the safety and stability of the structure. In this study, the influence of the shear span to depth ratio on the shear capacity was investigated by altering the positions of the OB-2 and SRB-50-2 loads. In Figure 22, the shear capacity of the beam is shown to decrease in proportion to the increase in the shear span to depth ratio. It is evident from the figure that as the shear span to depth ratio rises, the beam’s effective height decreases, resulting in an increased susceptibility to cracking under shearing forces and a reduction in shear resistance. This observation underscores the critical impact of the shear span to depth ratio on the shear capacity of prestressed concrete beams.

5.2. Shear Resistance Provided by Concrete

As the strength grade of concrete increases, so does its shear strength. However, the numerical analysis results in Section 4 demonstrate that the relationships between these parameters are not straightforwardly linear; rather, they exhibit parabolic tendencies. Numerous studies have indicated that the concrete tensile strength f t should be considered as the primary factor influencing its shear strength. Consequently, this paper has opted to utilize the tensile strength of concrete as the governing factor in the assessment of its shear strength.
The shear bearing capacity of the beam is found to decrease with an increase in the shear span to depth ratio. However, the shear bearing capacity remains largely unaffected when the shear span to depth ratio λ > 3. In accordance with the stipulations outlined in the code, the form of x λ + y can be utilized as the influence coefficient of the shear span to depth ratio, thereby affecting the shear strength of the beam. This paper proposes a regression analysis of this coefficient by numerical simulation, which enables the determination of 2 λ + 0.8 [36].
The aforementioned concrete shear capacity does not take into account the influence of the prestressing force on the concrete shear resistance, and the influence of the effective prestress on γ is expressed according to the prestress degree V c proposed by Zheng [37].
The prestress degree is classified according to three stress states: (1) the transverse prestressed reinforcement does not reach the compressive strain limit of concrete; (2) the main tensile strain of concrete does not reach the ultimate tensile strain of concrete; and (3) the tensile strain of concrete is not limited. In summary, the prestress degree is used to express the improvement coefficient of prestress on the concrete shear resistance:
α = 1 + γ
where α is the enhancement coefficient of prestress on the concrete shear capacity; and γ is the prestress degree (ratio of cracking moment to breaking moment).

5.3. Shear Resistance Provided by Stirrups and Prestressing Tendons

A substantial body of research, including contributions from numerous researchers and a wide range of reviews of the relevant literature, has consistently demonstrated that the influence coefficient of prestress on the shear strength of stirrups is negligible. Consequently, this paper has opted to disregard the effect of prestress on the shear strength of the stirrups.
In order to investigate the enhancement of the shear resistance of the stirrups by the shear span to depth ratio, a meticulous analysis of the horizontal projection length of the oblique cracks has been conducted. This analysis has revealed a linear relationship between the aforementioned crack length and the shear span to depth ratio, as well as the effective height of the concrete beam.
C = k λ h 0
where C is the horizontal projection length between the intersection point of the longitudinal bar and the oblique crack and the tip of the oblique crack; and λ and h0 are the shear span to depth ratio and the effective height of beam section.
In the context of the impact of effective prestress on the shear capacity of beams, certain codes adopt a simplistic approach by increasing the coefficient. The experimental data presented in this paper utilize regression linear analysis, which reveals that when λ = 3, the increase coefficient of prestress on the shear resistance of the concrete beams ranges from 0.088 to 0.094. In accordance with the findings reported in the literature [38], the relationship between the shear span to depth ratio and the prestress, in terms of their effects on the shear bearing capacity of the beams, can be expressed as follows:
V p = 0.273 λ N p 0

5.4. Proposed Formula

It is proposed that the shear elements of the lateral façade reinforced concrete beams should be composed of the stirrup, concrete and prestress, as expressed by the following formula:
V u = V c + V s + V p
The formula for calculating the shear capacity of concrete is as follows:
V c = α x λ + y f t b h 0
α = 1 + γ = 1 + M 0 M u
The following variables are to be considered. Here, α is the increase coefficient of the prestress on the concrete shear resistance; x λ + y is the influence coefficient of the shear span to depth ratio on the shear strength of the beam, where x = 2 and y = 0.5; f t is the tensile strength of the concrete; M o is the bending moment of the compressive zone of the prestressed concrete; and M u is the bending moment of the specimen beam when it is damaged.
The formulas for calculating the shear capacities provided by the stirrup and prestress are given as follows:
V s = k λ h 0 f y v A s v s
V p = 0.273 λ N p 0
The formula for calculating the shear capacity of the external prestressed reinforced concrete beams with side façades is therefore given as follows:
V = α x λ + y f t b h 0 + k λ h 0 f y v A s v s + 0.273 λ N p 0
or   V = ( 1 + M 0 M u ) 2 λ + 0.5 f t b h 0 + k λ h 0 b ρ s v f s v + 0.273 λ N p 0
As illustrated in Table 4, a comparison has been made between the proposed formula for the shear capacity of the lateral façade reinforced concrete beam and the data obtained from the test, together with the results of the theoretical analysis and calculation. It is evident from the comparison results that the suggested formula is in good agreement with the test data and the overall trend is consistent. When compared with the experimental results, the maximum error of the proposed formula is only 3%, and when compared with the experimental results, the maximum error is only 6%. The proposed formula provides a calculation method that is both relatively accurate and reasonable for the calculation of the shear capacity of external prestressed reinforced concrete beams with side façades. It can therefore be considered a valuable reference for practical engineering design and construction.

6. Conclusions

In this paper, a novel reinforcement method for concrete beams, referred to as the external prestressing of side façades, is introduced. Based on the results of flexural and shear tests conducted on concrete beams reinforced with lateral façades and traditional external prestressing, along with finite element numerical simulations and theoretical analyses of the shear performance of the concrete beams, and in accordance with existing standards, a formula for calculating the shear capacity of concrete beams reinforced using this new method is proposed. The following preliminary conclusions are drawn.
(1)
The external prestressing reinforcement method on the side face can effectively enhance the shear bearing capacity of concrete beams and improve their working performance. Compared with the OB, the cracking loads of the side face external prestressing reinforced beams SRB-50-2, SRB-75-3 and SRB-100-2 increased by 71.5%, 103.1% and 130.1%, respectively, but the cracking loads of their oblique cracks decreased by 9.4%, 5.1% and 2.5%, respectively. The external prestressing on the side face has a certain inhibitory effect on the initial cracking of concrete beams.
(2)
The reinforcing effect of traditional external prestressing on concrete beams is superior to that of side façade external prestressing. Specifically, the oblique crack loads of the TRB-30-2, TRB-35-1 and TRB-40-2 beams increased by 68.9%, 74.6% and 65.2%, respectively. This improvement can be attributed to the fact that in the traditional prestressed reinforcement method, the axis of the prestressed tendons is positioned outside the edge of the concrete beam and at a considerable distance from the neutral axis of the concrete. Conversely, the axis of the external prestressing tendons on the side façade is closer to the neutral axis, which has a limited influence on crack control in the concrete beam. Furthermore, once the crack tip development surpasses the axis of the prestressed tendons, it may adversely affect crack propagation. Therefore, when arranging prestressing tendons, their axis should ideally be as far from the neutral axis as possible to enhance the reinforcement efficiency.
(3)
Parameters such as the concrete strength, stirrup spacing, shear span to depth ratio, and reinforcement ratio of longitudinal reinforcement exert varying degrees of influence on the shear capacity of reinforced concrete beams. The numerical simulation results indicate that the shear capacity of the concrete beams exhibited a slight increase with enhanced concrete strength, a significant increase with a reduced shear span to depth ratio, and an increase associated with both a higher longitudinal reinforcement ratio and decreased stirrup spacing.
(4)
The formula for calculating the shear capacity of externally prestressed reinforced concrete beams with side façades was derived through a systematic and rigorous methodology that integrated test data, simulation outcomes, and advanced numerical analysis. The accuracy of this formula has been thoroughly validated by comparing it with the experimental results, revealing a maximum deviation of only 3%. This substantiates the formula’s reliability as a critical reference for practical engineering design and construction.

Author Contributions

Conceptualization, Z.R. and X.D.; methodology, Z.R. and X.Z.; software, Y.W.; validation, Y.W.; formal analysis, Z.R. and X.Z.; investigation, Z.R.; resources, Z.R. and X.Z.; data calculation, Y.W.; writing—original draft preparation, Z.R. and X.Z.; writing—review and editing, Z.R. and X.Z.; visualization, Y.W.; supervision, Z.R. and W.C.; project administration, Z.R. and X.Z.; funding acquisition, Z.R. All authors have read and agreed to the published version of the manuscript.

Funding

This project was supported by the Hunan Key Laboratory of Intelligent Disaster Prevention and Mitigation and Ecological Restoration in Civil Engineering, under the Construct Program of Applied Specialty Disciplines in Hunan Province (Hunan Institute Engineering). This project was funded by the National Natural Science Foundation of China (Grant No. 52478311), the Hunan Provincial Science and Technology Promotion Talent Project (Grant No. 2022TJ-Q17), and the Science and Technology Innovation Program of Hunan Province (Grant No. 2022RC4032).

Data Availability Statement

All data used to support the study are included within the article.

Conflicts of Interest

The authors declare no conflicts of interest.

References

  1. Zeng, X.T.; Zeng, Y.X.; Ren, Z.H. Research on the rigidity of wide gap concrete beams strengthened with externally bonded CFRP plates based on the quasi plane assumption. J. Railw. Sci. Eng. 2021, 18, 1846–1851. [Google Scholar]
  2. Ren, Z.H.; Zeng, X.T. Cracks of wide-notch concrete beams strengthened with near-surface mounted CFRP bars based on quasi-plane assumption. J. Build. Struct. 2019, 40, 88–95. [Google Scholar]
  3. Yang, Y.Z. Research on External Prestressing Reinforcement Technology of Long-Span PC Continuous Rigid Frame Bridge. Master’s Thesis, Chongqing Jiaotong University, Chongqing, China, 2020. [Google Scholar]
  4. Zhang, S.Y. Research on Technology and Engineering Application of External Prestressing Strengthening Continuous Rigid Frame Bridge. Master’s Thesis, Anhui University of Science and Technology, Huainan, China, 2022. [Google Scholar]
  5. Ren, Z.H.; Zeng, X.T.; Yan, Q. Calculation method for interface slip of wide-notch concrete beam strengthened with carbon fiber reinforced plastics plate. J. Build. Struct. 2018, 39, 119–128. [Google Scholar]
  6. Huang, Z.; Shen, J.; Lin, B.; Miao, X.; Cheng, Z.H. Experimental and numerical investigation on shear behavior of concrete beams reinforced with CFRP grid shear reinforcements. J. Compos. Struct. 2024, 349–350, 118552. [Google Scholar] [CrossRef]
  7. Li, W.; Din, E.B.A.; Mansour, W.; Fayed, S. Improving shear performance of regular web openings concrete beams using steel mesh reinforced strain hardening cementitious composites: An experimental and numerical study. J. Eng. Struct. 2024, 314, 118344. [Google Scholar] [CrossRef]
  8. Fan, T. Calculation and Finite Element Analysis of Steel-Encased Reinforced Concrete Members. Master’s Thesis, Southwest Jiaotong University, Chengdu, China, 2006. [Google Scholar]
  9. Ren, H.T. Study on the Basic Mechanical Properties and Long-Term Mechanical Properties of Concrete Structures Strengthened with Fiber Reinforced Composite Materials. Ph.D. Thesis, Dalian University of Technology, Dalian, China, 2003. [Google Scholar]
  10. Ibrahim, K.S.; Rad, M.M. Optimal elasto-plastic analysis of prestressed concrete beams by applying residual plastic deformation limitations. J. Sustain. 2023, 15, 5742. [Google Scholar]
  11. Ren, Z.H.; Zeng, X.T.; Chi, Q.H.; Zeng, Y.X. An External Prestressed Loading Structure on the Side Facade of a Concrete Beam. CN201921264085.9, 9 June 2020. Available online: https://pss-system.cponline.cnipa.gov.cn/conventionalSearch (accessed on 3 April 2025).
  12. Zhang, X.Y. Design method of reinforced concrete beams with post-tensioned external tendons. J. Build. Struct. 1985, 3, 44–57. [Google Scholar]
  13. Zhang, S.D. Development of post-tensioned prestressed concrete without bonding in vitro. J. Highw. 1988, 5, 11–14. [Google Scholar]
  14. Qian, Z.S. Design and calculation of external prestressed composite beams of reinforced concrete. J. Archit. Anhui 1994, S1, 46–50. [Google Scholar]
  15. Xu, M.H.; Wang, X.J.; Zhang, G.M.; Chen, J.W.; Zhang, Z.Y. Experimental investigation on the dynamic compression properties of Kevlar fiber-reinforced composite laminates. J. Exp. Mech. 2001, 1, 26–33. [Google Scholar]
  16. Niu, J. Experimental Study and Finite Element Analysis of Reinforced Concrete T-Shaped Column with Bonded Steel Plate and Carbon Fiber Sheet. Master’s Thesis, Hebei University of Technology, Tianjin, China, 2011. [Google Scholar]
  17. Xing, L.Y. Experimental Study on Axial Compression of Damaged RC Short Columns Reinforced by GFRP and Steel Fiber Mortar. Master’s Thesis, Xi’an University of Technology, Xi’an, China, 2020. [Google Scholar]
  18. Wang, X.; Shi, J.; Wu, G.; Yang, L.; Wu, Z. Effectiveness of basalt FRP tendons for strengthening of RC beams through the external prestressing technique. J. Eng. Struct. 2015, 101, 34–44. [Google Scholar] [CrossRef]
  19. Wan, Z.W. Theoretical Study of External Prestressing Technology in Bridge Reinforcement. Master’s Thesis, Wuhan University of Technology, Wuhan, China, 2011. [Google Scholar]
  20. Gao, X.L.; Yin, C.L.; Guo, J.Y.; Chen, G.X.; Huang, H.R. Experimental and theoretical study on the shear behaviors of an innovative precast UHPC composite beams reinforced with inverted T-shaped steel. J. Build. Eng. 2024, 96, 110504. [Google Scholar] [CrossRef]
  21. Liao, B.Q.; Du, Y.X.; Ma, G.; Zhou, R.; Zhu, D.J. Shear behavior of seawater sea-sand concrete beams reinforced with BFRP bars after seawater dry-wet cycling. J. Eng. Struct. 2024, 316, 118573. [Google Scholar] [CrossRef]
  22. Liu, C.W.; Yang, M.; Wang, P.F.; Ba, G.Z.; Miao, J.J. Effects of stirrup corrosion on the shear performance of reinforced concrete beams after fire exposure. J. Struct. Eng. 2024, 150, 04024093. [Google Scholar] [CrossRef]
  23. Moubarak, A.M.R.; Ibrahim, A.; Farouk, M.A.; Elwardany, H. Shear performance of glass fiber reinforced concrete beams with diverse embedded GFRP trusses. J. Case Stud. Constr. Mater. 2023, 18, e02195. [Google Scholar] [CrossRef]
  24. ACI 318-02/ACI 318R-02; Building Code Requirements for Structural Concrete (and Commentary). American Concrete Institute: Farmington Hills, MI, USA, 2002.
  25. Shu, C.Q.; Wei, M.H. Discussion on shear strength of reinforced concrete cantilever beam under indirect loading. J. Guizhou Inst. Technol. 1985, 03, 74–85. [Google Scholar]
  26. Su, X.Z.; Haldance, D.; Kutab, A.S. A mechanism of shear resistance of reinforced concrete beams. J. Fuzhou Univ. (Nat. Sci. Ed.) 1996, S1, 99–103. [Google Scholar]
  27. Zeng, Q.X.; He, G.M.; Yu, J.H. Shear Strength of concrete bidirectional flexural members. In Proceedings of the 5th National Conference on Structural Engineering, Haikou, China, 25 November 1996; Volume 2. [Google Scholar]
  28. Jiang, H.B.; Che, H.M.; Zhang, K.J. Application of classical truss model to fatigue shear analysis of reinforced concrete and prestressed concrete beams. J. Bridge Constr. 1996, 2, 71–73. [Google Scholar]
  29. GB/T21839-2008; Test Method for Steel Used in Prestressed Concrete. National Standard of the People’s Republic of China: Beijing, China, 2008.
  30. GB/T50081-2019; Standard for Test Methods of Physical and Mechanical Properties of Concrete. National Standard of the People’s Republic of China: Beijing, China, 2019.
  31. GB/T28900-2012; Steel Test Method for Reinforced Concrete. National Standard of the People’s Republic of China: Beijing, China, 2012.
  32. Wang, Y.Y.; Gu, Y.; Liu, J.L. A domain-decomposition generalized finite difference method for stress analysis in three-dimensional composite materials. Appl. Math. Lett. 2020, 104, 106226. [Google Scholar] [CrossRef]
  33. Kabir, H.; Aghdam, M.M. A robust Bézier based solution for nonlinear vibration and post-buckling of random checkerboard graphene nano-platelets reinforced composite beams. Compos. Struct. 2019, 212, 184–198. [Google Scholar] [CrossRef]
  34. Kazemi, F.; Asgarkhani, N.; Shafighfard, T.; Jankowski, R.; Yoo, D.-Y. Machine-learning methods for estimating performance of structural concrete members reinforced with fiber-reinforced polymers. Arch. Comput. Methods Eng. 2024, 32, 1–33. [Google Scholar] [CrossRef]
  35. GB 50010-2010; The Ministry of Housing and Urban-Rural Development of the People’s Republic of China—Code for Design of Concrete Structures. China Construction Industry Press: Beijing, China, 2014.
  36. Chen, B. Study on Shear Behavior of Prestressed RPC Beams. Master’s Thesis, Hunan University, Changsha, China, 2007. [Google Scholar]
  37. Zheng, S.B. Experimental Study on Shear Behavior of Transversely Tensioned Prestressed Concrete Beams. Master’s Thesis, Chongqing Jiaotong University, Chongqing, China, 2003. [Google Scholar]
  38. Zhao, S.B.; Zhao, G.F.; Huang, C.K. Test and calculation method of bearing capacity of oblique section of prestressed steel fiber reinforced concrete beams. J. Civ. Eng. 1999, 32, 28–33. [Google Scholar]
Figure 1. Beam section dimensions and reinforcement diagram.
Buildings 15 01482 g001
Figure 2. Traditional prestressed reinforcement. (a) Lateral perspective. (b) Grid-based diagram. (c) Reinforcement frame design drawing.
Buildings 15 01482 g002
Figure 3. Extracorporeal prestressing reinforcement program for side elevations.
Buildings 15 01482 g003
Figure 4. Test device arrangement.
Buildings 15 01482 g004
Figure 5. OB beam failure mode.
Buildings 15 01482 g005
Figure 6. Failure modes of externally prestressed beams reinforced on the side façade. (a) SRB-50-2. (b) SRB-75-3. (c) SRB-100-2.
Buildings 15 01482 g006
Figure 7. Failure modes of the externally prestressed beams reinforced on the side facade. (a) TRB-30-2. (b) TRB-35-1. (c) TRB-40-2.
Buildings 15 01482 g007
Figure 8. Comparison of the load–deflection curves at the mid-span of the test beams.
Buildings 15 01482 g008
Figure 9. Load–stirrup strain curves of the test beams.
Buildings 15 01482 g009
Figure 10. Load–strain curves of the prestressing reinforcement.
Buildings 15 01482 g010
Figure 11. Load–strain curves of shear span concrete. (a) OB-2. (b) SRB-50-2. (c) SRB-75-3. (d) SRB-100-2. (e) TRB-30-2. (f) TRB-35-1. (g) TRB-40-2.
Buildings 15 01482 g011aBuildings 15 01482 g011b
Figure 12. Concrete beam model.
Buildings 15 01482 g012
Figure 13. Load–displacement curves of OB-2.
Buildings 15 01482 g013
Figure 14. OB-2 numerical simulation diagrams. (a) Stress contour of compressive damage of concrete beams. (b) Stress contour of reinforcement. (c) Compressive damage contour of concrete beam.
Buildings 15 01482 g014aBuildings 15 01482 g014b
Figure 15. Load–displacement curve of SRB-50-2.
Buildings 15 01482 g015
Figure 16. SRB-50-2 numerical simulation diagrams. (a) Stress contour of compressive damage of concrete beams. (b) Stress contour of reinforcement. (c) Strain damage contour of SRB concrete beam.
Buildings 15 01482 g016
Figure 17. Load–displacement curve of TRB-40-2.
Buildings 15 01482 g017
Figure 18. TRB-40-2 numerical simulation diagrams. (a) Stress contour of compressive damage of concrete beam. (b) Stress contour of reinforcement. (c) TRB tensile damage contour.
Buildings 15 01482 g018aBuildings 15 01482 g018b
Figure 19. Relationship between shear capacity and concrete grade strength.
Buildings 15 01482 g019
Figure 20. Relationships between shear capacity and stirrup spacing.
Buildings 15 01482 g020
Figure 21. Relationships between shear capacity and longitudinal reinforcement diameter.
Buildings 15 01482 g021
Figure 22. Relationships between shear capacity and shear span to depth ratio.
Buildings 15 01482 g022
Table 1. Material parameters of the mechanical properties.
Materials Ultimate Strength/MPaYield Strength/MPaElasticity Modulus/MPaTypeRemarks
Concrete35.97 (Compressive)C30Actual measurement
RebarΦ8435.8 (Tensile)381.62.05 × 105HRB400
RebarΦ10443.5 (Tensile)389.72.02 × 105HRB400
RebarΦ14469.6 (Tensile)401.22.0 × 105HRB400
Rebar φ T 14903.6 (Tensile)693.41.98 × 1058.8 Long boltsActual measurement Prestressed bar [29]
Note: The standard for the compressive testing of concrete is the Standard for Test Method of Physical and Mechanical Properties of Concrete (GB/T50081-2019) [30]. The standard for the tensile testing of steel bars is the ‘Test Method for Steel Used in Reinforced Concrete’ (GB/T28900-2012) [31].
Table 2. The design parameters of the concrete beams (mm).
No.Stirrup DiameterDiameter of Prestressed BarDiameter of Upper Longitudinal BarDiameter of Lower Longitudinal BarRatio of ReinforcementNumbers
OB810141.4%3
TRB81410141.4%9
SRB81410141.4%9
Remarks: Explanation of the prestressing application and numbering of the beams. ① There are 3 ordinary beams (OBs), numbered OB-1, OB-2 and OB-3. ② The initial prestressing forces (kN) of the traditional prestressed reinforced concrete beams (TRBs) are 30, 35 and 40. When the prestressing force is 30 kN, the three beams are numbered TRB-30-1, TRB-30-2 and TRB-30-3, and so on. ③ The initial prestress forces (kN) of the side elevation of externally prestressed reinforced concrete beams (SRBs) are 50, 75 and 100. When the prestress is 50 kN, the three beams are numbered SRB-50-1, SRB-50-2 and SRB-50-3, and so on.
Table 3. Test results of the test beams.
No. P o r / kN P c r / kN P 0.2 / kN P 0.4 / kN P u / kN Δ u / mm
OB-219.365.070.683.996.724.9
SRB-50-233.158.970.8113.9137.919.6
SRB-75-339.261.772.6116.1142.317.9
SRB-100-244.463.475.1119.6147.013.1
TRB-30-270.2107.4175.6210.5230.018.0
TRB-35-172.0109.8176.9212.5231.217.1
TRB-40-278.9113.5179.6218.1232.916.1
Remarks: Por is the initial cracking load of the beam bending crack; Pcr is the initial cracking load of the inclined crack of the beam; P0.2 and P0.4 are the loads corresponding to the width of the inclined crack at crack widths of 0.2 mm and 0.4 mm; Pu is the ultimate load when the beam is damaged; and Δu is the mid-span deflection when the beam is broken.
Table 4. Comparisons of the experimental results with the suggested formulas.
No.Experimental Value (kN)Calculated Value (kN)Simulated Value (kN)Simulated Value/
Calculated Value
Experimental Value/
Calculated Value
SRB-50-268.5066.6662.540.941.03
SRB-75-371.1568.9465.680.951.03
SRB-100-273.5071.2168.480.961.03
Disclaimer/Publisher’s Note: The statements, opinions and data contained in all publications are solely those of the individual author(s) and contributor(s) and not of MDPI and/or the editor(s). MDPI and/or the editor(s) disclaim responsibility for any injury to people or property resulting from any ideas, methods, instructions or products referred to in the content.

