1. Introduction
Campus tree-lined boulevards are essential landscapes characterized by continuous rows of trees along pathways. These boulevards can effectively reduce surface temperature, ambient air temperature, and heat absorption due to shading effects in hot summer and cold winter regions [
1]. “Microclimate” refers to the localized climate conditions within a specific area, which significantly differ from the surrounding environment in terms of air temperature, humidity, and airflow, either horizontally or vertically [
2]. Key factors that influence the formation of a campus microclimate include air temperature, relative humidity, solar radiation, and the spatial and temporal distribution of meteorological elements such as wind [
3]. Studies have demonstrated that the microclimate of campus tree-lined boulevards is shaped not only by regional climatic conditions and urban morphological factors [
4], but also by local landscape elements such as green spaces, road layout, and water features [
5], as well as the arrangement of buildings [
6]. Enhancing the thermal comfort of these boulevards can be achieved through the thoughtful design of tree placements, the arrangement of surrounding vegetation, and the choice of road layout [
7].
With the growing emphasis on interdisciplinary research, studies related to microclimates have investigated human thermal comfort [
8], environmental pollutants [
9], building energy-saving performance [
10], and the interaction relationship between the human environment and the microclimate [
11]. Present research objectives mainly focus on water spaces [
12], building courtyards [
13], and recreational areas [
14]. However, rare studies pay attention to interaction relationships between tree-lined boulevards and microclimates. Tree-lined boulevards are a crucial element of campus design, serving as the primary source of shading for campus pathways [
15]. The related studies have shown that irrational spatial configurations of campus tree-lined boulevards in cold regions affect local microclimates [
16]. Sun et al. [
17] emphasized that optimizing building layout, wind, and thermal environments enhances outdoor comfort in cold winters. Jiang et al. [
18] highlighted that campus microclimate was influenced by factors such as underlying surface type, plant canopy density, and building shade. To sum up, previous studies have investigated the effects of landscape layout on microclimates in cold regions [
19,
20,
21]. However, the influence relationship between the spatial form of tree-lined boulevards and microclimates in hot summers and cold winters have not been thoroughly investigated.
ENVI-met simulation was the most widely used in studies related to the field of outdoor thermal comfort [
22,
23,
24,
25]. ENVI-met can comprehensively consider the complex interactions between vegetation characteristics, surface conditions, and meteorological factors [
26,
27,
28]. Srivanit [
29] validated the ability of the ENVI-met 3D model to simulate microclimates by integrating complex environmental factors. Altunkasa et al. [
30] used the ENVI-met 3D model to assess the impact of different tree species configurations on the microclimate of campus tree-lined boulevards. The results showed that tree locations based on tree species characteristics could effectively enhance the cooling effect of tree-lined boulevards in the summer. Forouzandeh et al. [
31] analyzed the landscape layouts and building layouts in different campuses. They found that surrounding building layouts and road orientations had the greatest impact on the microenvironment. In summary, previous researchers have studied the effects of tree species configurations, landscape layouts, and building layouts on microenvironments. However, existing studies have not clarified the effects of the spatial form of tree-lined boulevards on microenvironments in campuses.
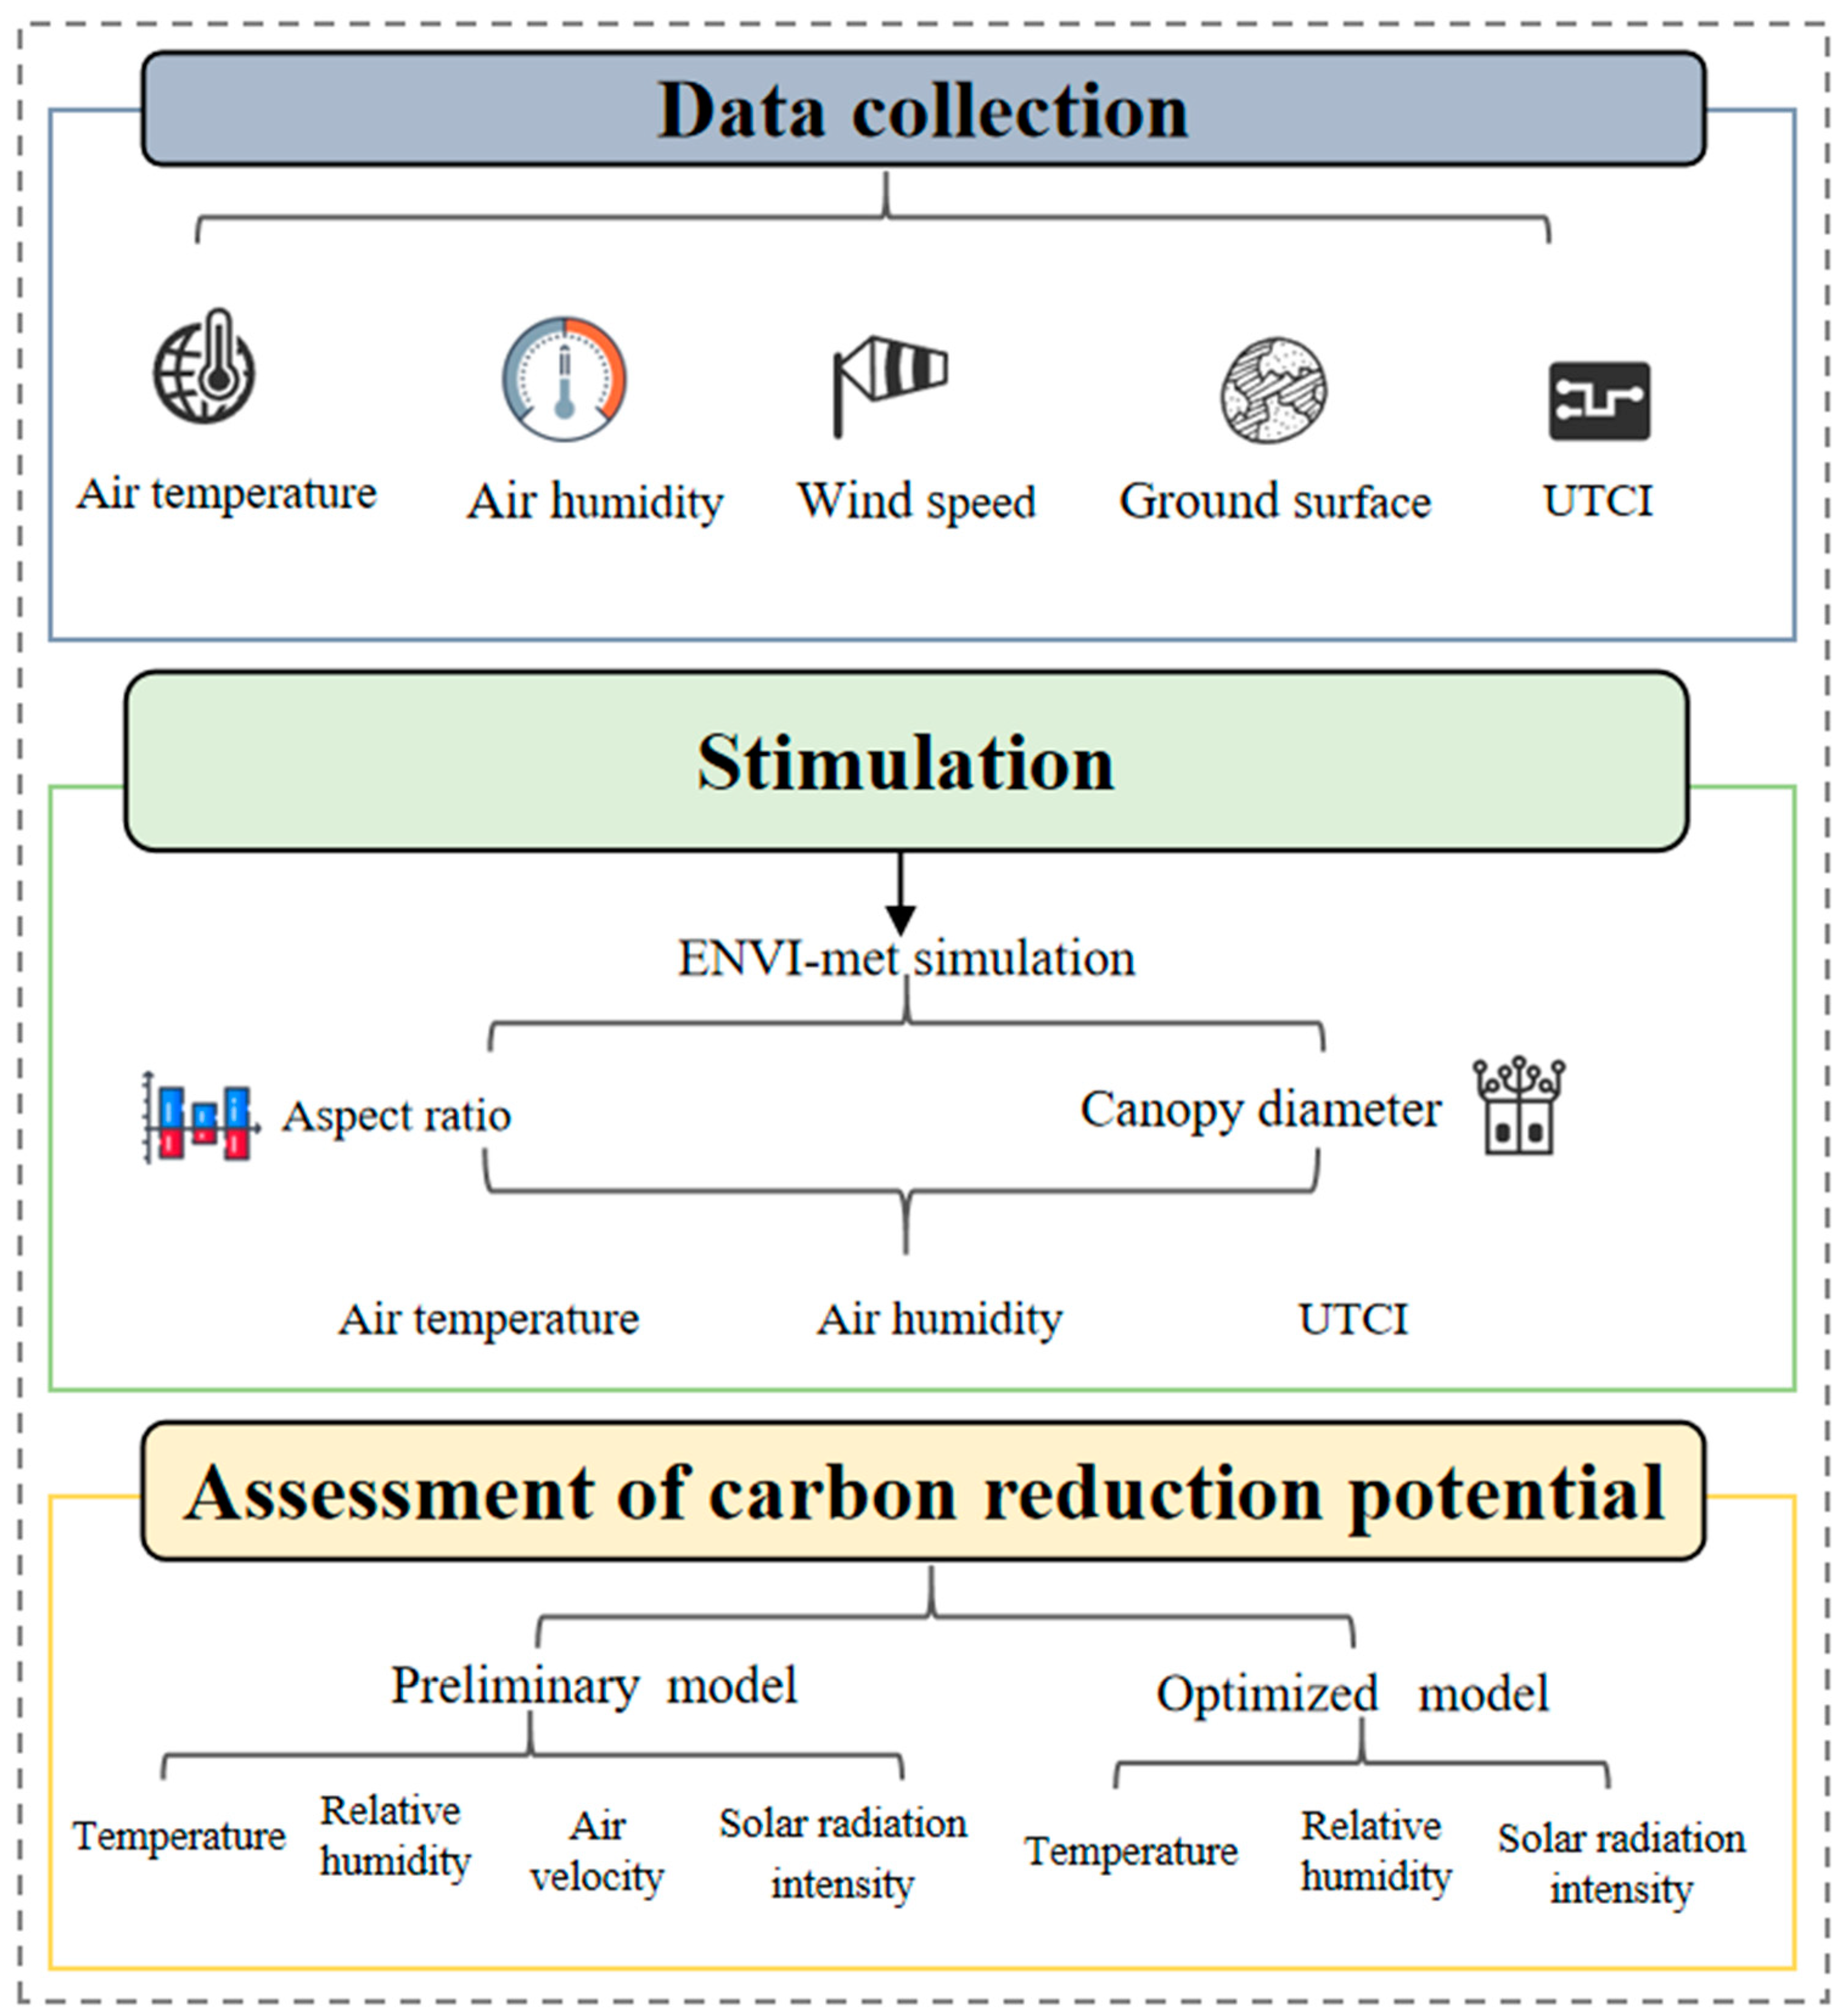
To address the limitations of previous research, this study applied experimental and simulation methods to investigate the effects of tree-lined boulevards on microclimates in hot summer and cold winter regions. Numerical simulations were conducted with ENVI-met software to study the effects of the aspect ratio and canopy diameter of double-row open-canopy boulevards on microclimates. Moreover, a thermal comfort-evaluation model for campus tree-lined boulevards in hot summer and cold winter regions was proposed. The research framework is shown in
Figure 1. The novelties of this study are as follows:
(1) This study revealed the interaction relationship between tree-lined boulevards and microclimates in hot summer and cold winter regions. The effects of the aspect ratio of the road and the canopy diameter of street trees on microclimates were studied. The abovementioned interaction relationship can provide insights into the design of tree-lined boulevards in hot summer and cold winter regions.
(2) This study proposed a multidimensional model based on the universal thermal climate index (UTCI) to evaluate the thermal comfort for tree-lined boulevards in hot summer and cold winter regions. The model can provide a basis for evaluating the thermal comfort in campus tree-lined space.
2. Methodology
2.1. Experimental System
2.1.1. Climate Description
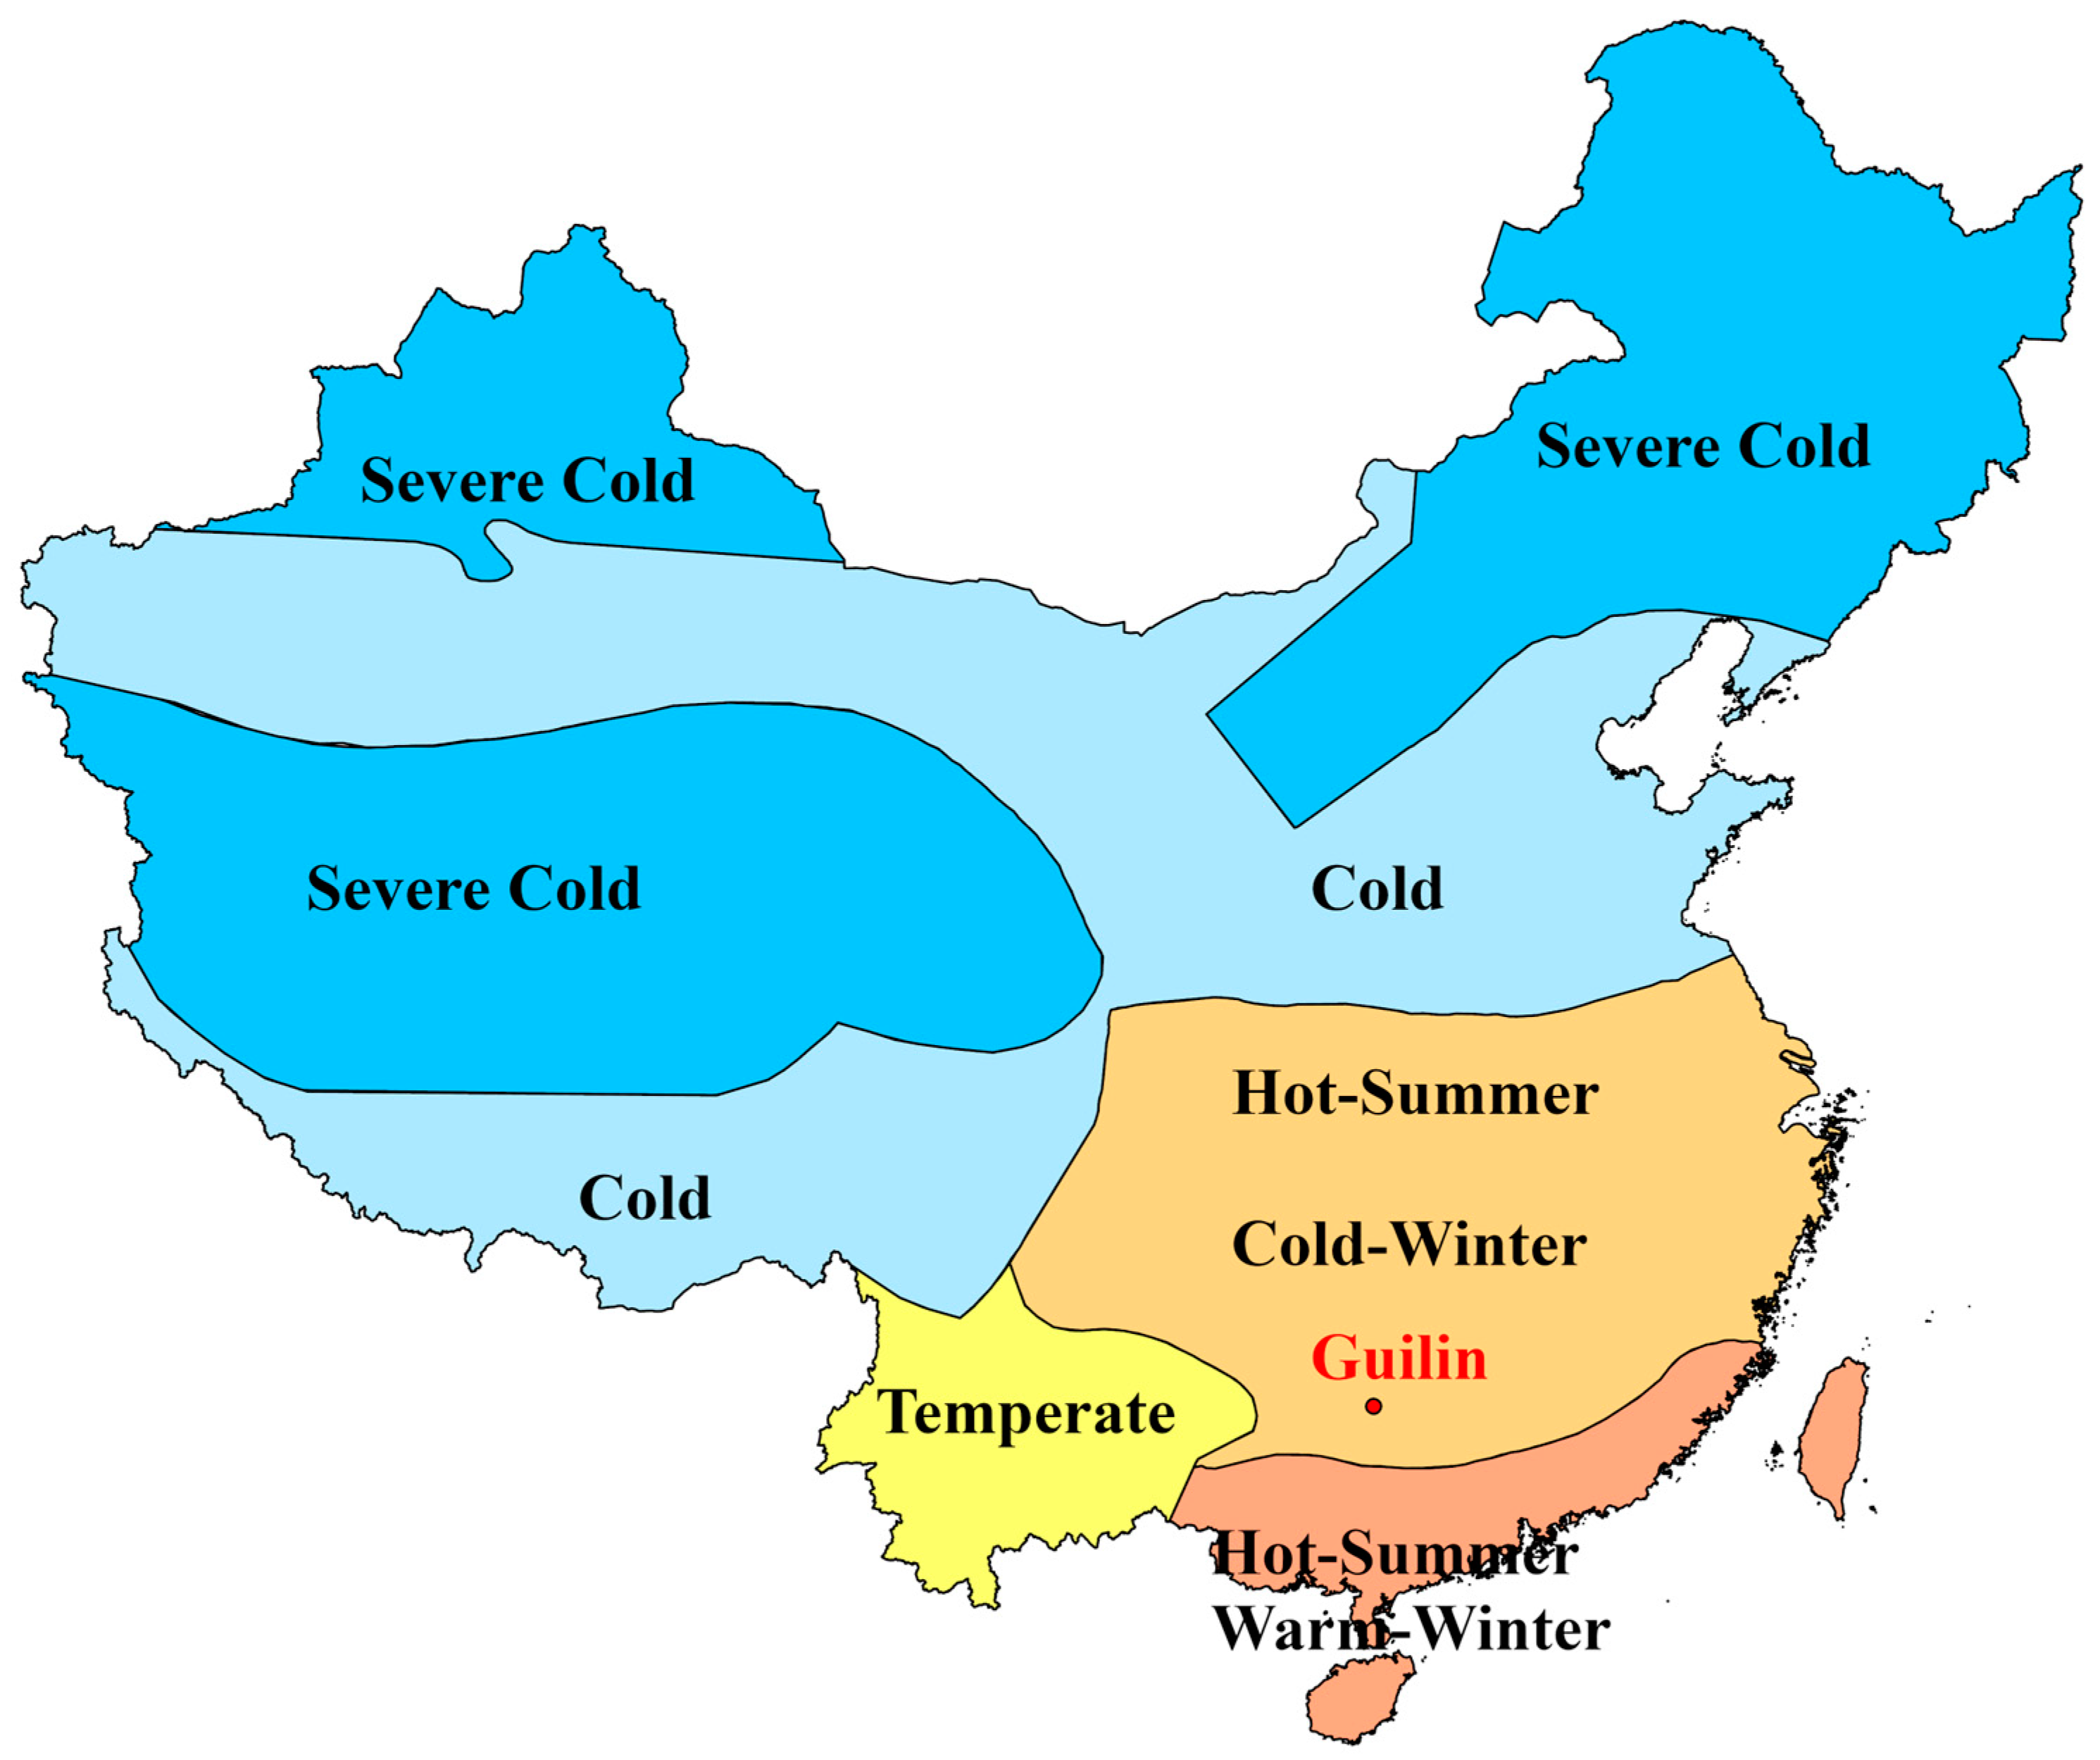
Figure 2 shows the climate classification for building design in China. The interaction relationship between tree-lined boulevards and microclimates in hot summer and cold winter regions has not been investigated. Guilin as a typical hot summer and cold winter region selected as research object. Guilin is in the hot summer and cold winter climate zone, with the hottest months being July and August, where the maximum temperature reaches 39.4 °C. The coldest months are January and February, with the minimum temperature dropping to −5.8 °C. The annual average temperature is 19.1 °C, and temperatures generally remain above 0 °C throughout the year, with frequent rainfall. The average number of rainy days per year is approximately 167 days, with an annual rainfall of about 1931.6 mm and an average annual relative humidity of 78% [
32]. The detail location is Jinjiling campus of Guilin University of Electronic Technology in Guilin, China. The area of tree-lined boulevards accounts for more than 50% of the total area, which serves as the primary source of shade along the region’s roads. Consequently, the study and analysis of thermal comfort in outdoor tree-lined boulevards are significant for the evaluation and improvement of the outdoor thermal environment [
33].
2.1.2. Data Collection
This study selects a double-row open-canopy boulevard in the Jinjiling campus of Guilin University of Electronic Technology as the research object. This tree-lined boulevard serves as a main thoroughfare within the campus. Thus, the effect of thermal pollution caused by cars typically on the microenvironment of tree-lined boulevards can be neglected. The boulevard provides functions for resting, walking, and jogging, fulfilling the needs of students on campus while also offering a space for leisure and recreation for nearby residents, making it highly representative.
Figure 3 shows six measurement points arranged within the double-row open-canopy boulevard. Considering the landscaping arrangement of the boulevard, the first row of measurement points is placed under the canopy of both camphor trees and large-leaved boxwood trees, while the second row is located under the canopy of camphor trees alone. The wet bulb temperature, wind speed, solar radiation, and surface temperature can be obtained from six measurement points.
The field measurements in this study were conducted from 15 July to 17 July 2021, with clear weather conditions throughout the period and no rainfall within the 24 h prior to the measurements. Guilin is located at the southern end of the hot summer and cold winter zone, close to the hot summer and warm winter zone, and has significant heat protection needs [
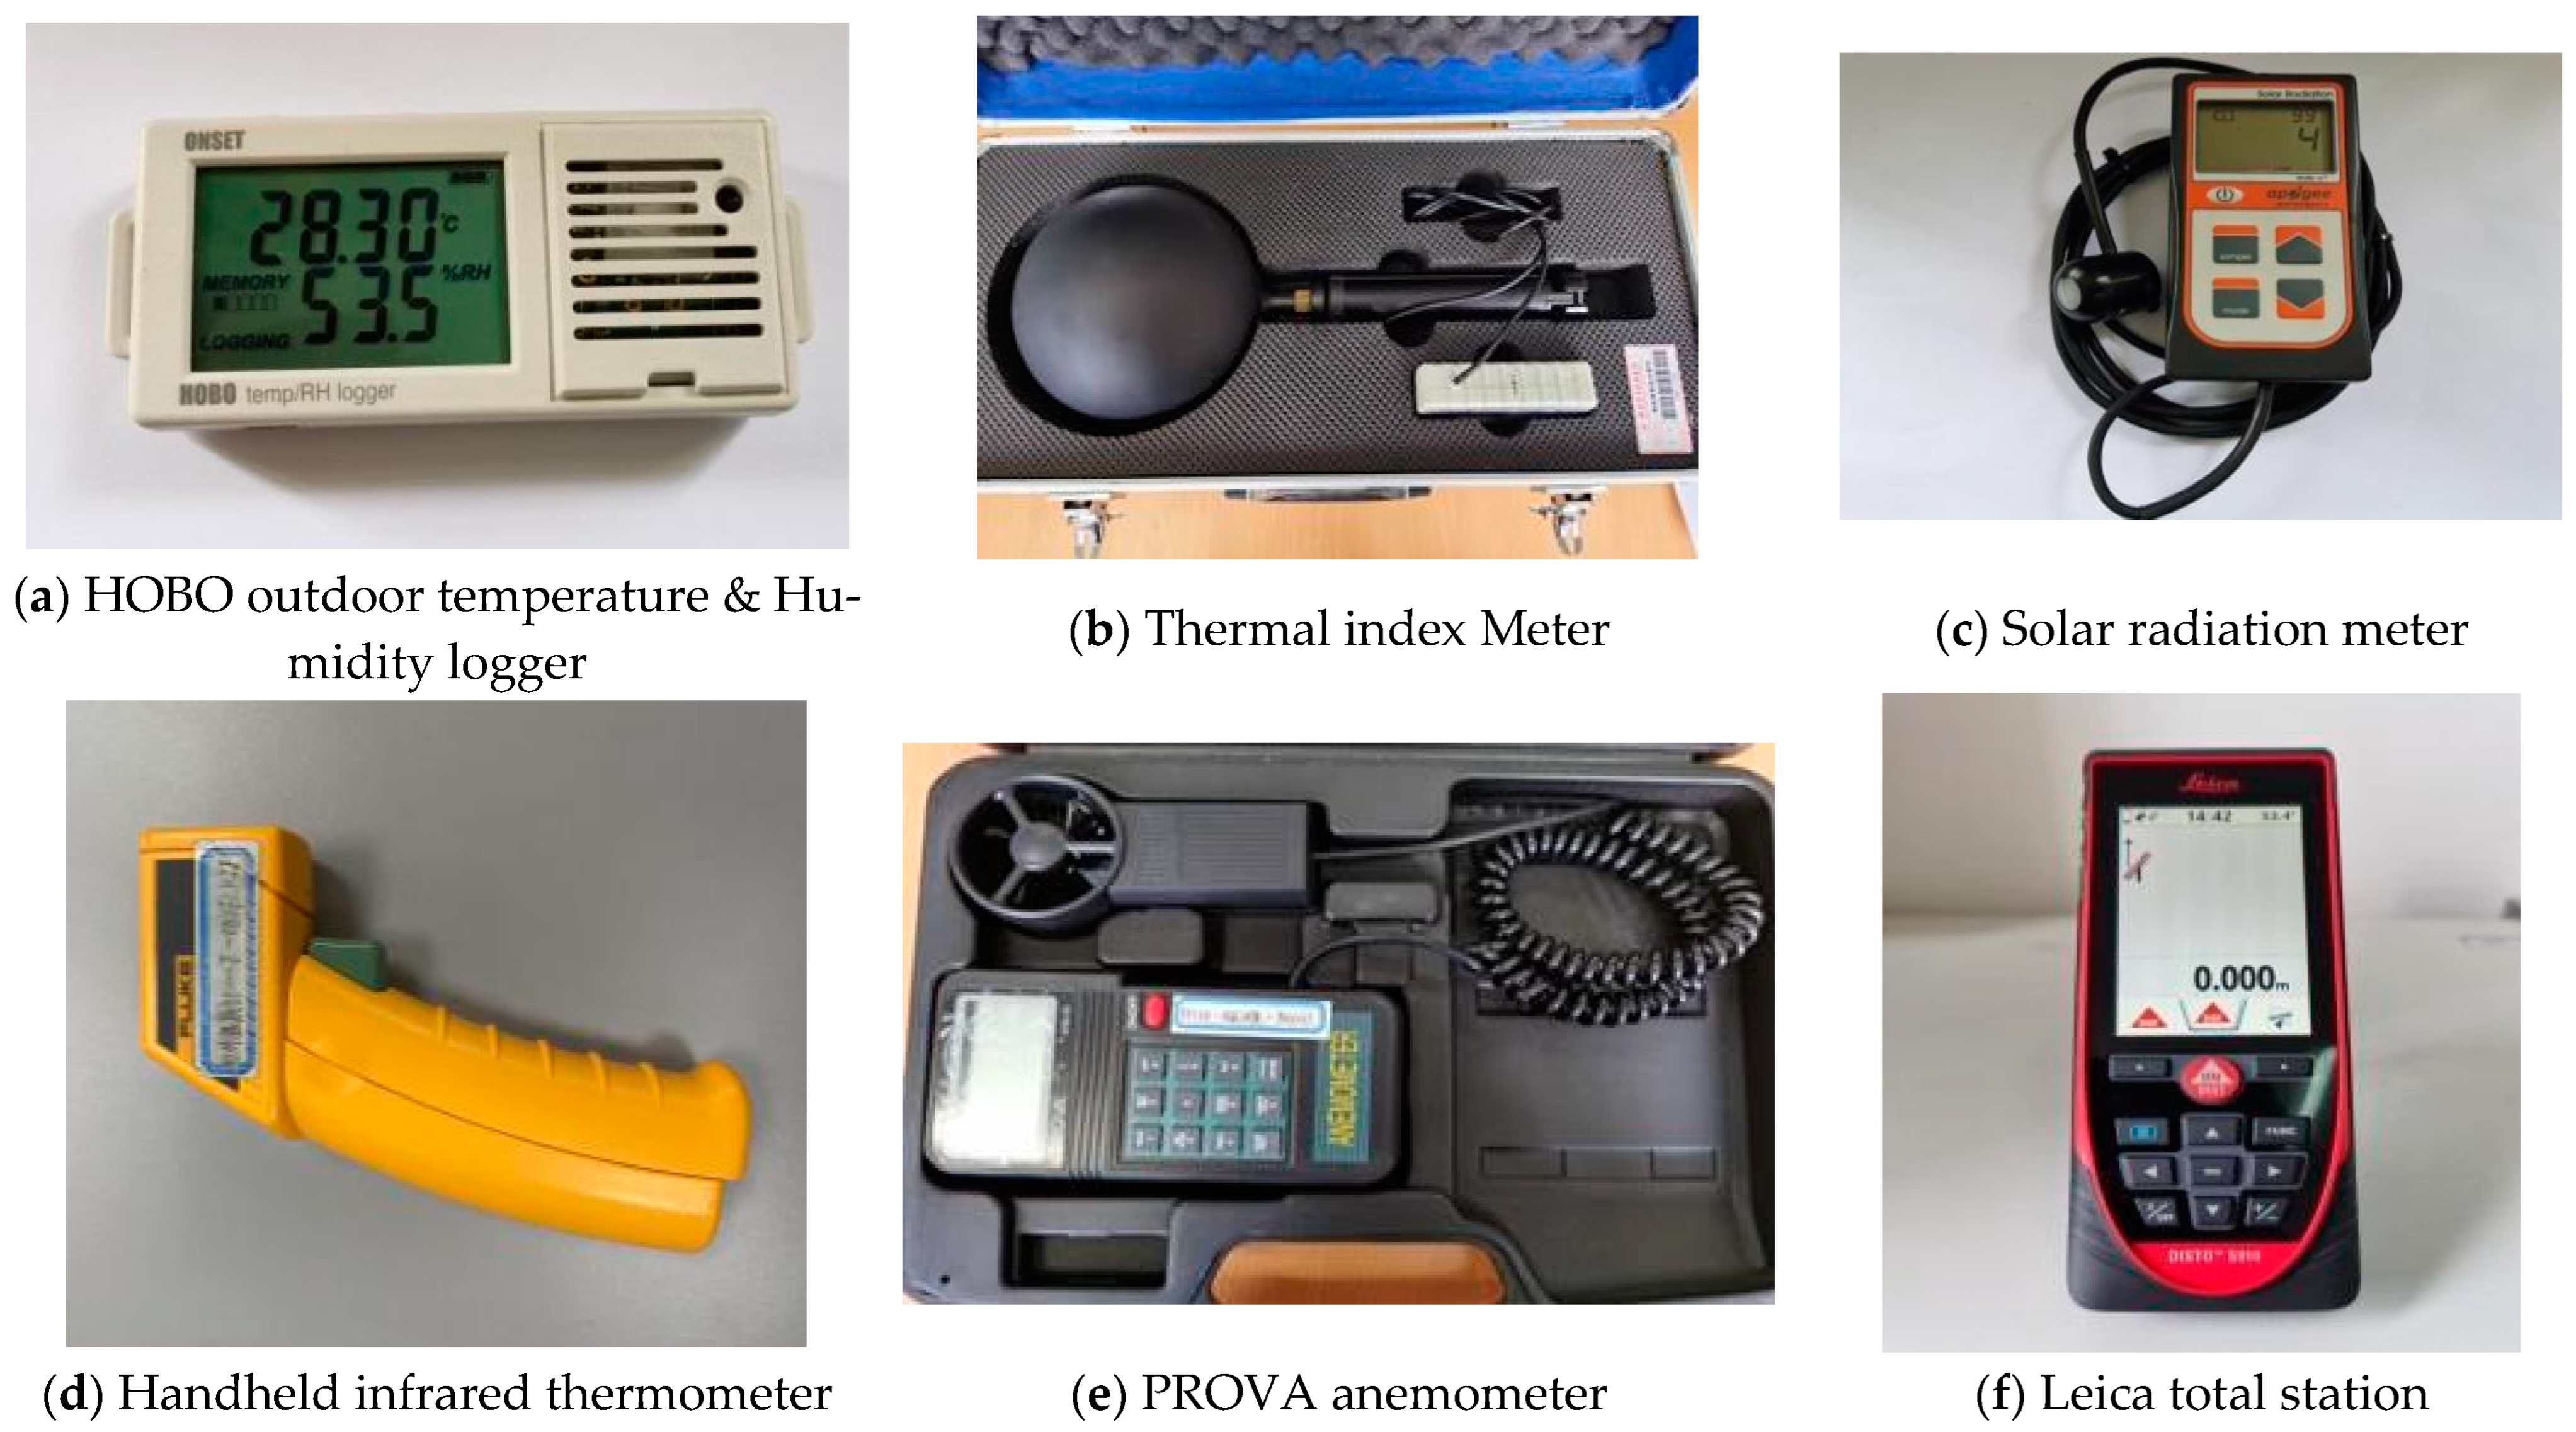
34]. Therefore, the highest temperature day among the three days was selected for data analysis. The testing period lasted from 7:00 to 20:00 each day, with temperature and relative humidity measured at 30 s intervals using an instrument with automatic data logging. Wet bulb temperature, wind speed, solar radiation, and surface temperature were measured at 30 min intervals, and data were recorded manually. The measurement devices and details are listed in
Table 1 and
Figure 4.
2.2. Simulation Model
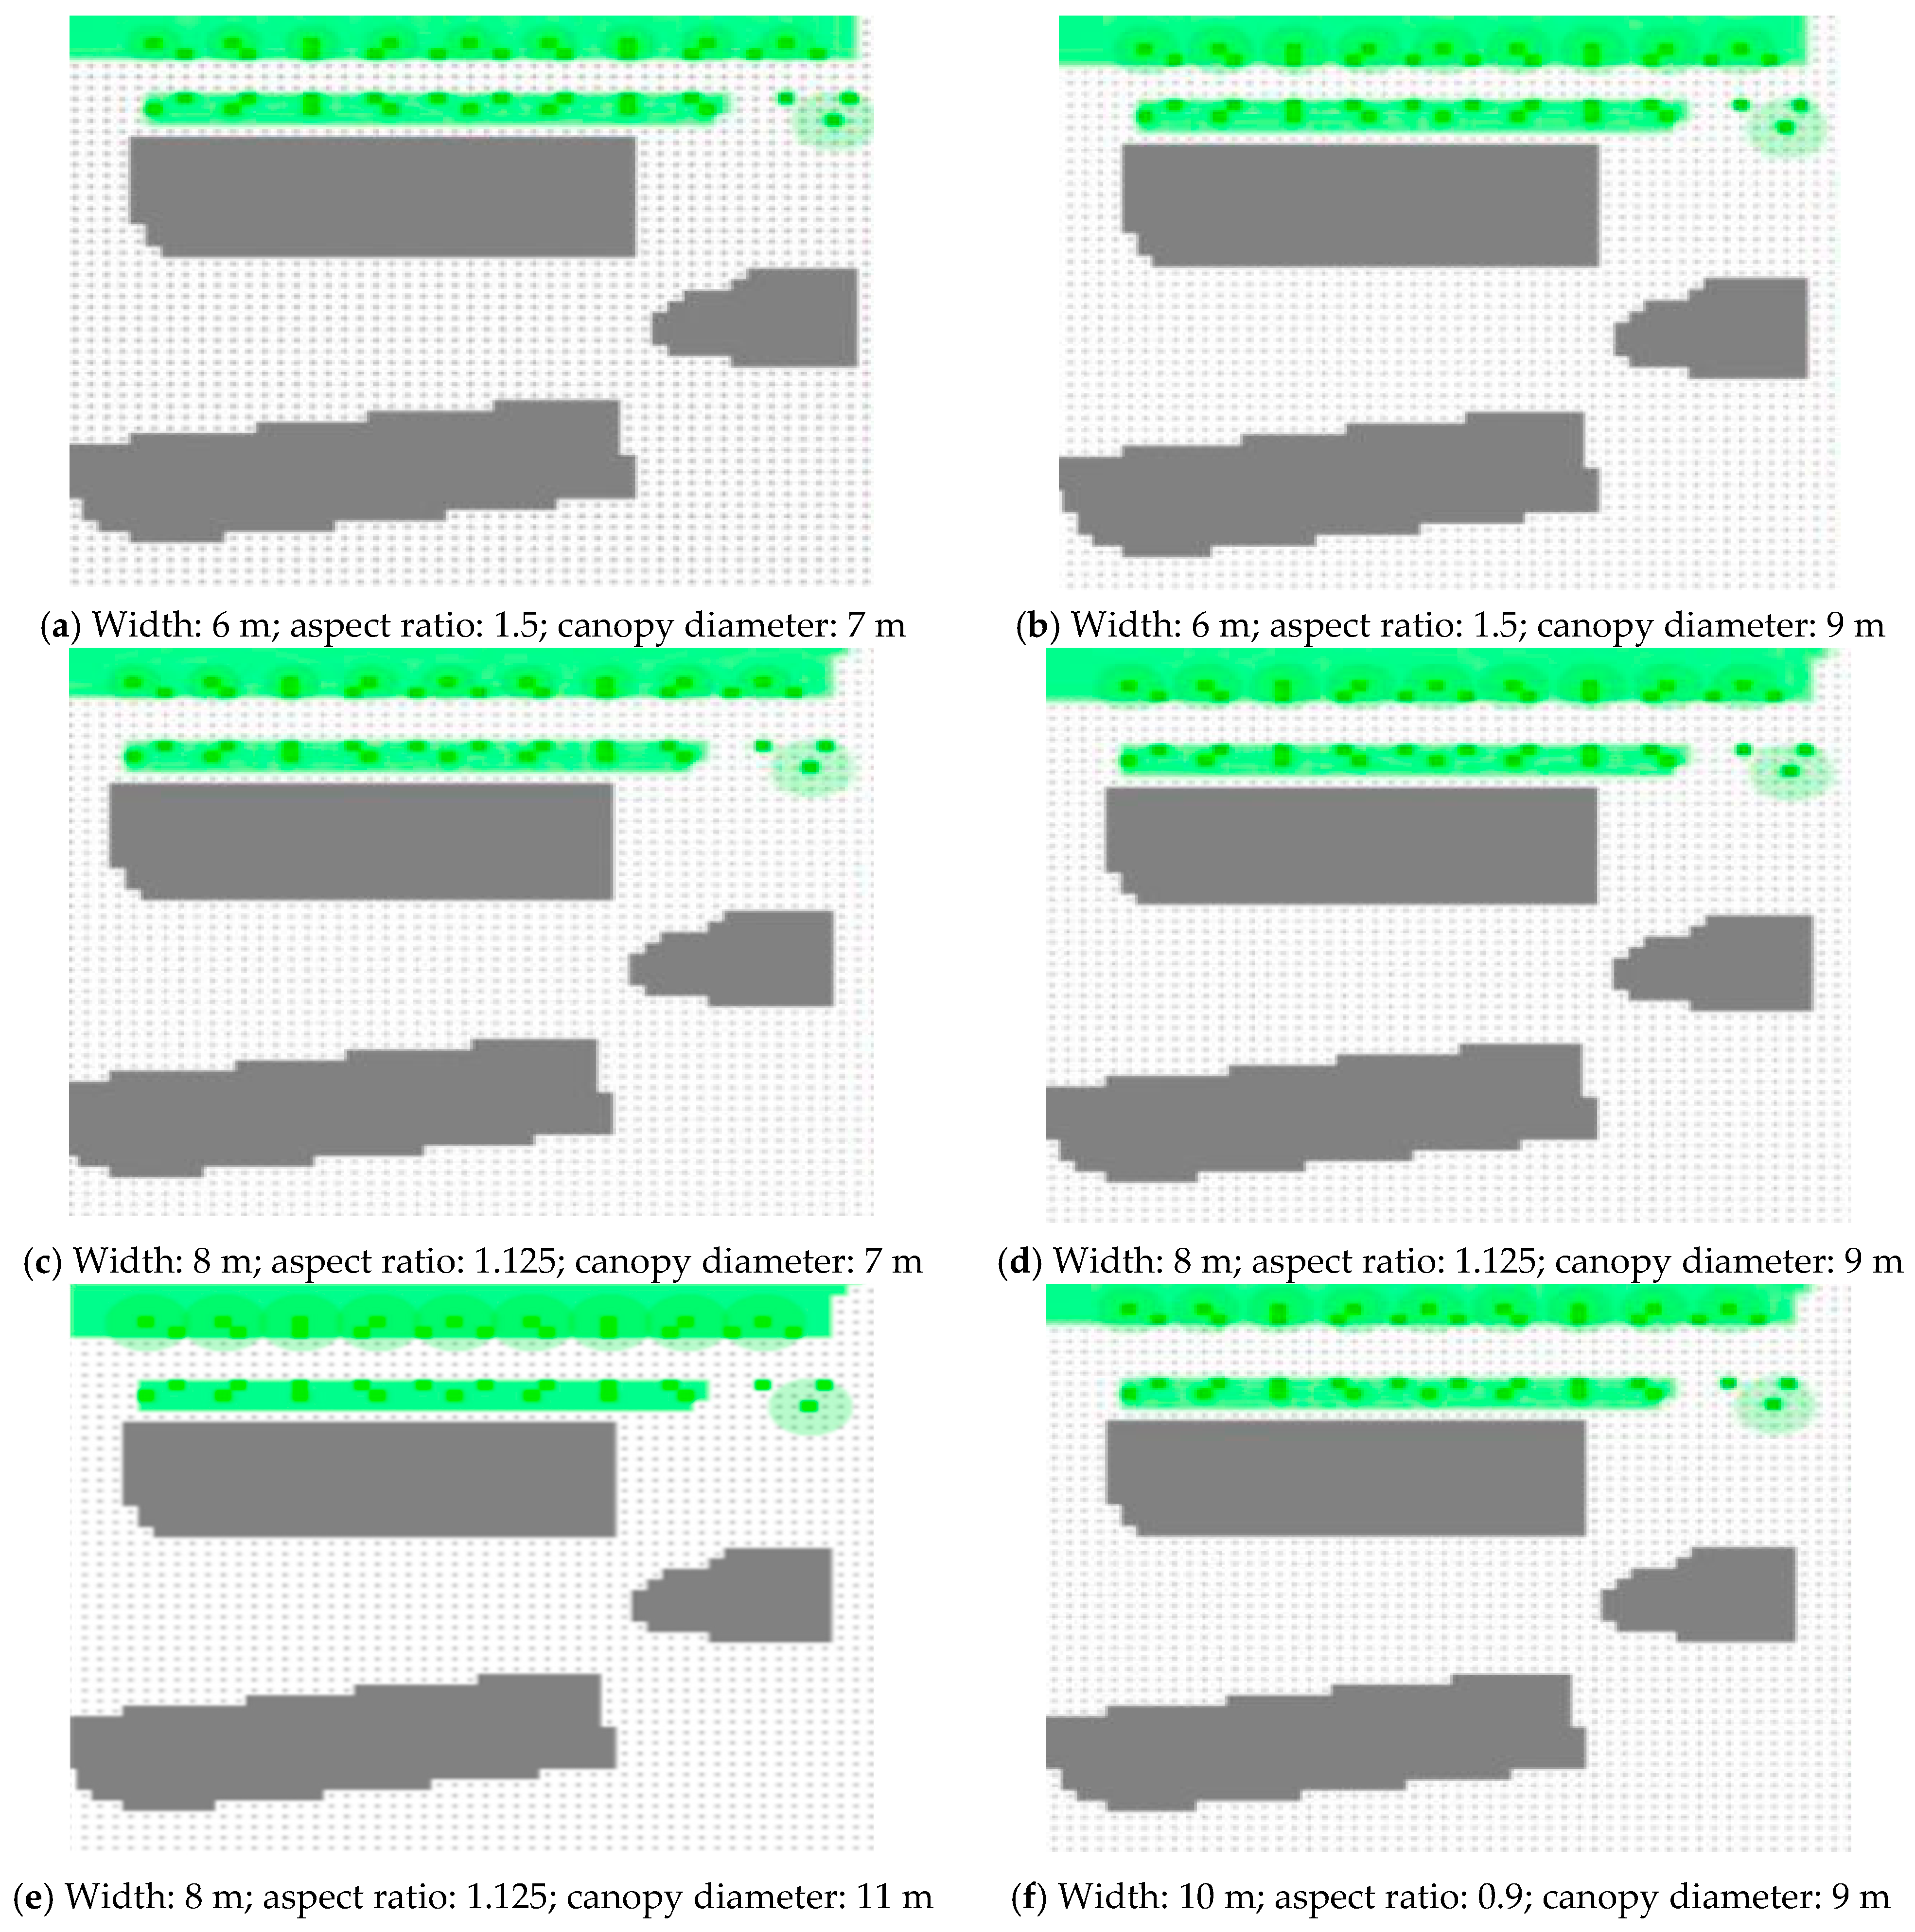
The ENVI-met software is applied to study the effects of the aspect ratio of the road and the canopy diameter of street trees on the microclimate, and six physical models are shown in
Figure 5. The double-row open-canopy boulevard has a cement concrete surface, with an east–west orientation. The road dimensions are 110 m in length and 6 m in width. On both sides of the road, there are large-leaved boxwood and camphor trees, with a spacing of 5 m between the trees, arranged in a staggered pattern. The shading effect of the tree canopy is moderate, and most of the road surface is exposed to direct sunlight. The actual spatial configuration of the campus tree-lined boulevard serves as the base scheme, with the road width remaining constant while the canopy diameter is scaled by a factor of 1.25, resulting in Scheme 2. Taking Scheme 1 and Scheme 2 as the base configurations, the canopy diameter of the street trees is held constant, while the road width is scaled by a factor of 1.25, resulting in Scheme 3 and Scheme 4. Using Scheme 4 as the base configuration, the canopy diameter is scaled by a factor of 1.25, yielding Scheme 5, while the road width is scaled by a factor of 1.25, resulting in Scheme 6. Given that the minimum grid diameter of the model is 1 m, all width measurements are rounded accordingly. The six distinct layout schemes are illustrated in
Figure 5.
The boundary conditions in this study are based on the meteorological parameters of the experiment. Temperature and relative humidity are set as the hourly average of the measured meteorological data, while wind speed and wind direction are summarized and analyzed from the daily data measured by the meteorological station. The simulated model is operated with a wind angle of 22.5° and a wind speed of 2.5 m/s at a height of 10 m. Solar radiation is calculated based on the latitude and longitude of the simulated region.
3. Results
3.1. The Results of the Field Measurement
3.1.1. Air Temperature
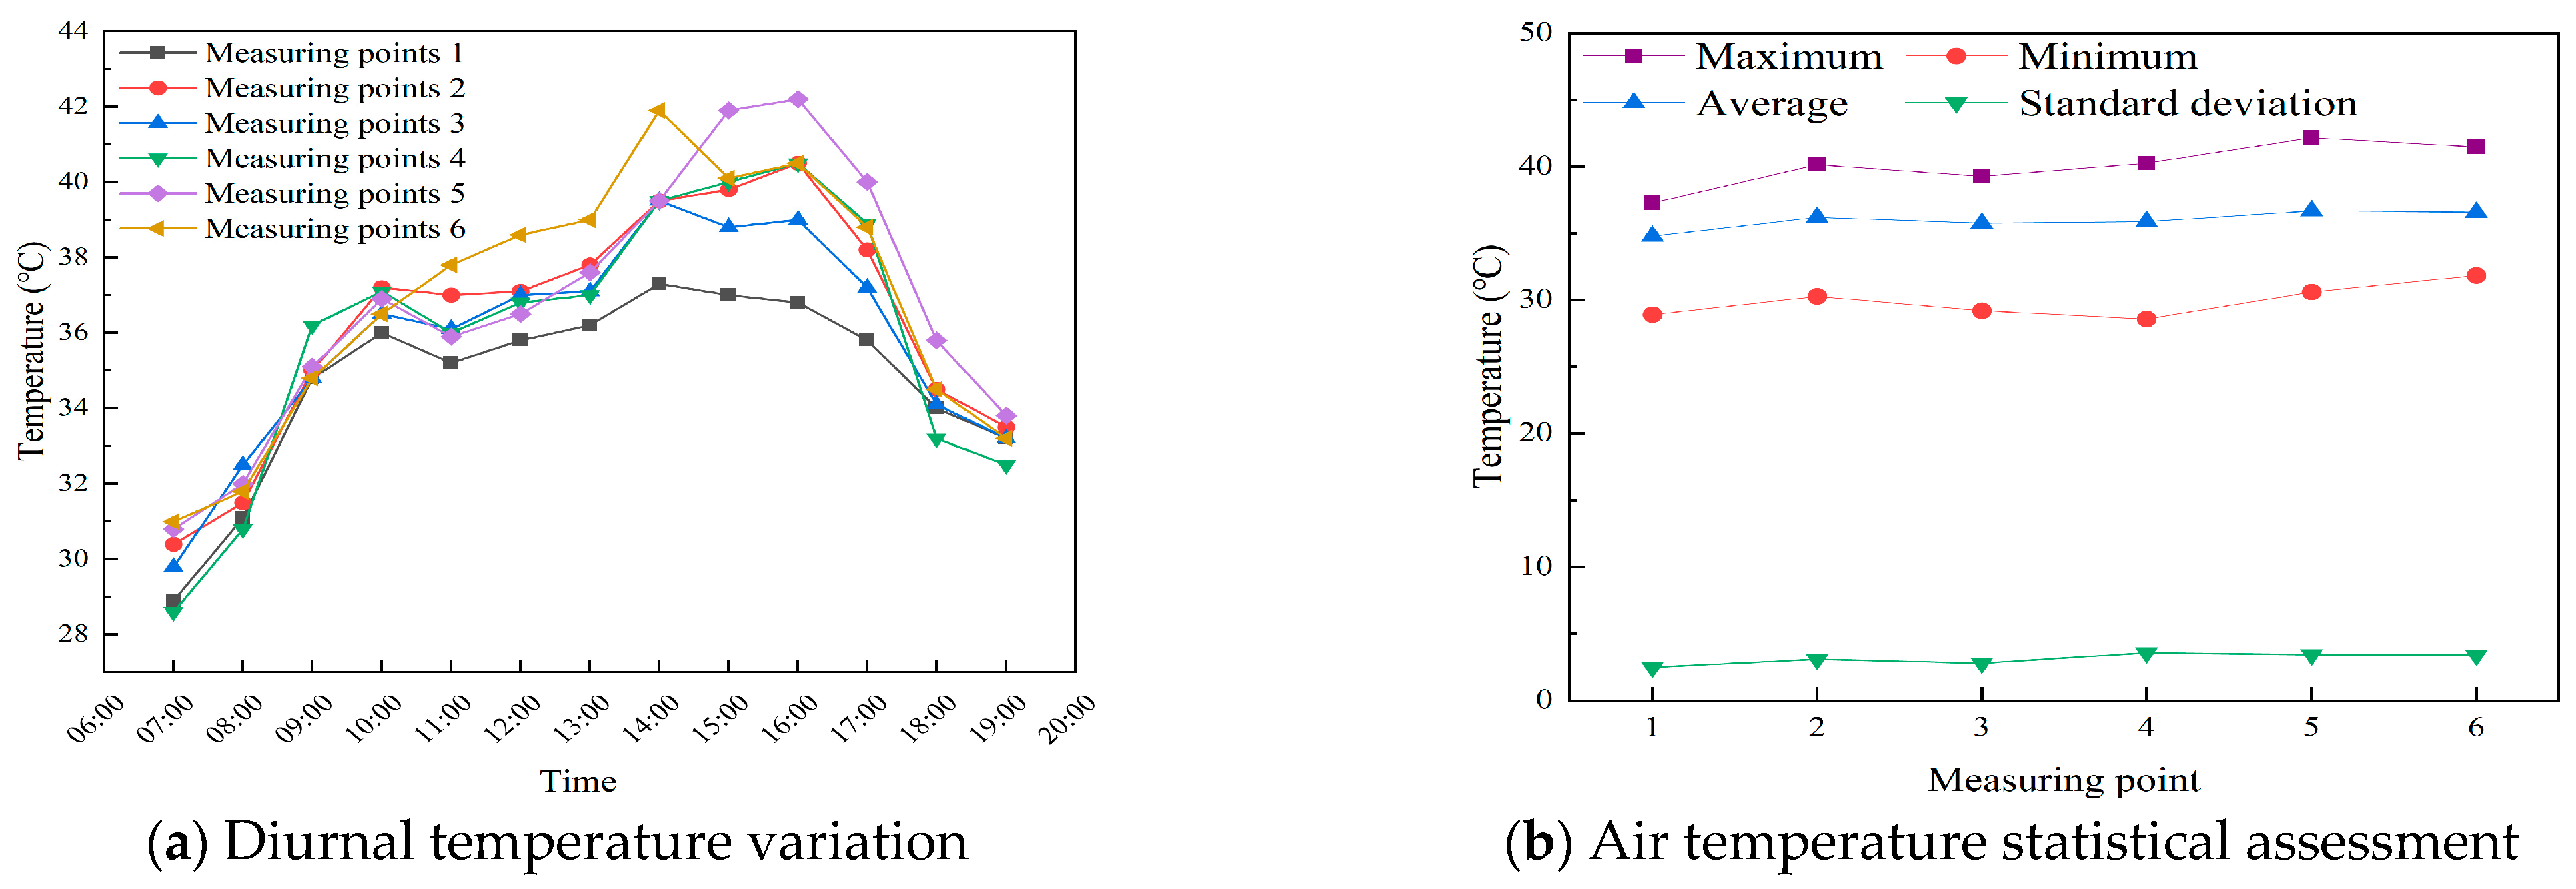
As shown in
Figure 6, the temperature of the double-row open-canopy boulevard is within 28.56~42.16 °C. The highest temperature occurs at measurement point 5 at 16:00, while the lowest temperature is recorded at measurement point 4 at 7:00. The daily maximum temperature at different measurement points occurs at 14:00 and 16:00, which are considered the hottest times of the day [
35]. The temperature of the tree-lined boulevard rises rapidly from 7:00 to 10:00, then experiences a noticeable drop between 10:00 and 11:00, before rising again until 14:00. Plant transpiration is influenced by leaf temperature, air temperature, and other environmental factors [
36]. When leaf temperature is 2–10 °C higher than the air temperature, the vapor pressure difference inside and outside the leaves increases, leading to a higher transpiration rate. When the air temperature becomes too high, the leaves lose excessive water, the stomata close, and transpiration decreases. From 10:00 to 11:00, plant transpiration is significant, causing the temperature to drop. After 11:00, solar radiation increases, leading to higher temperatures, and as the stomata of the leaves close, transpiration stops, causing the temperature to rise again.
The average temperature order of each measurement point Is as follows: 1 < 3 < 4 < 2 < 6 < 5. The measurement points 1 and 3 are located under the canopy of both small and large trees, providing significant shading. Measurement points 4 and 6 are located under the canopy of large trees alone, offering good shading. Points 2 and 5 are located at the center of the road, having relatively poor shading.
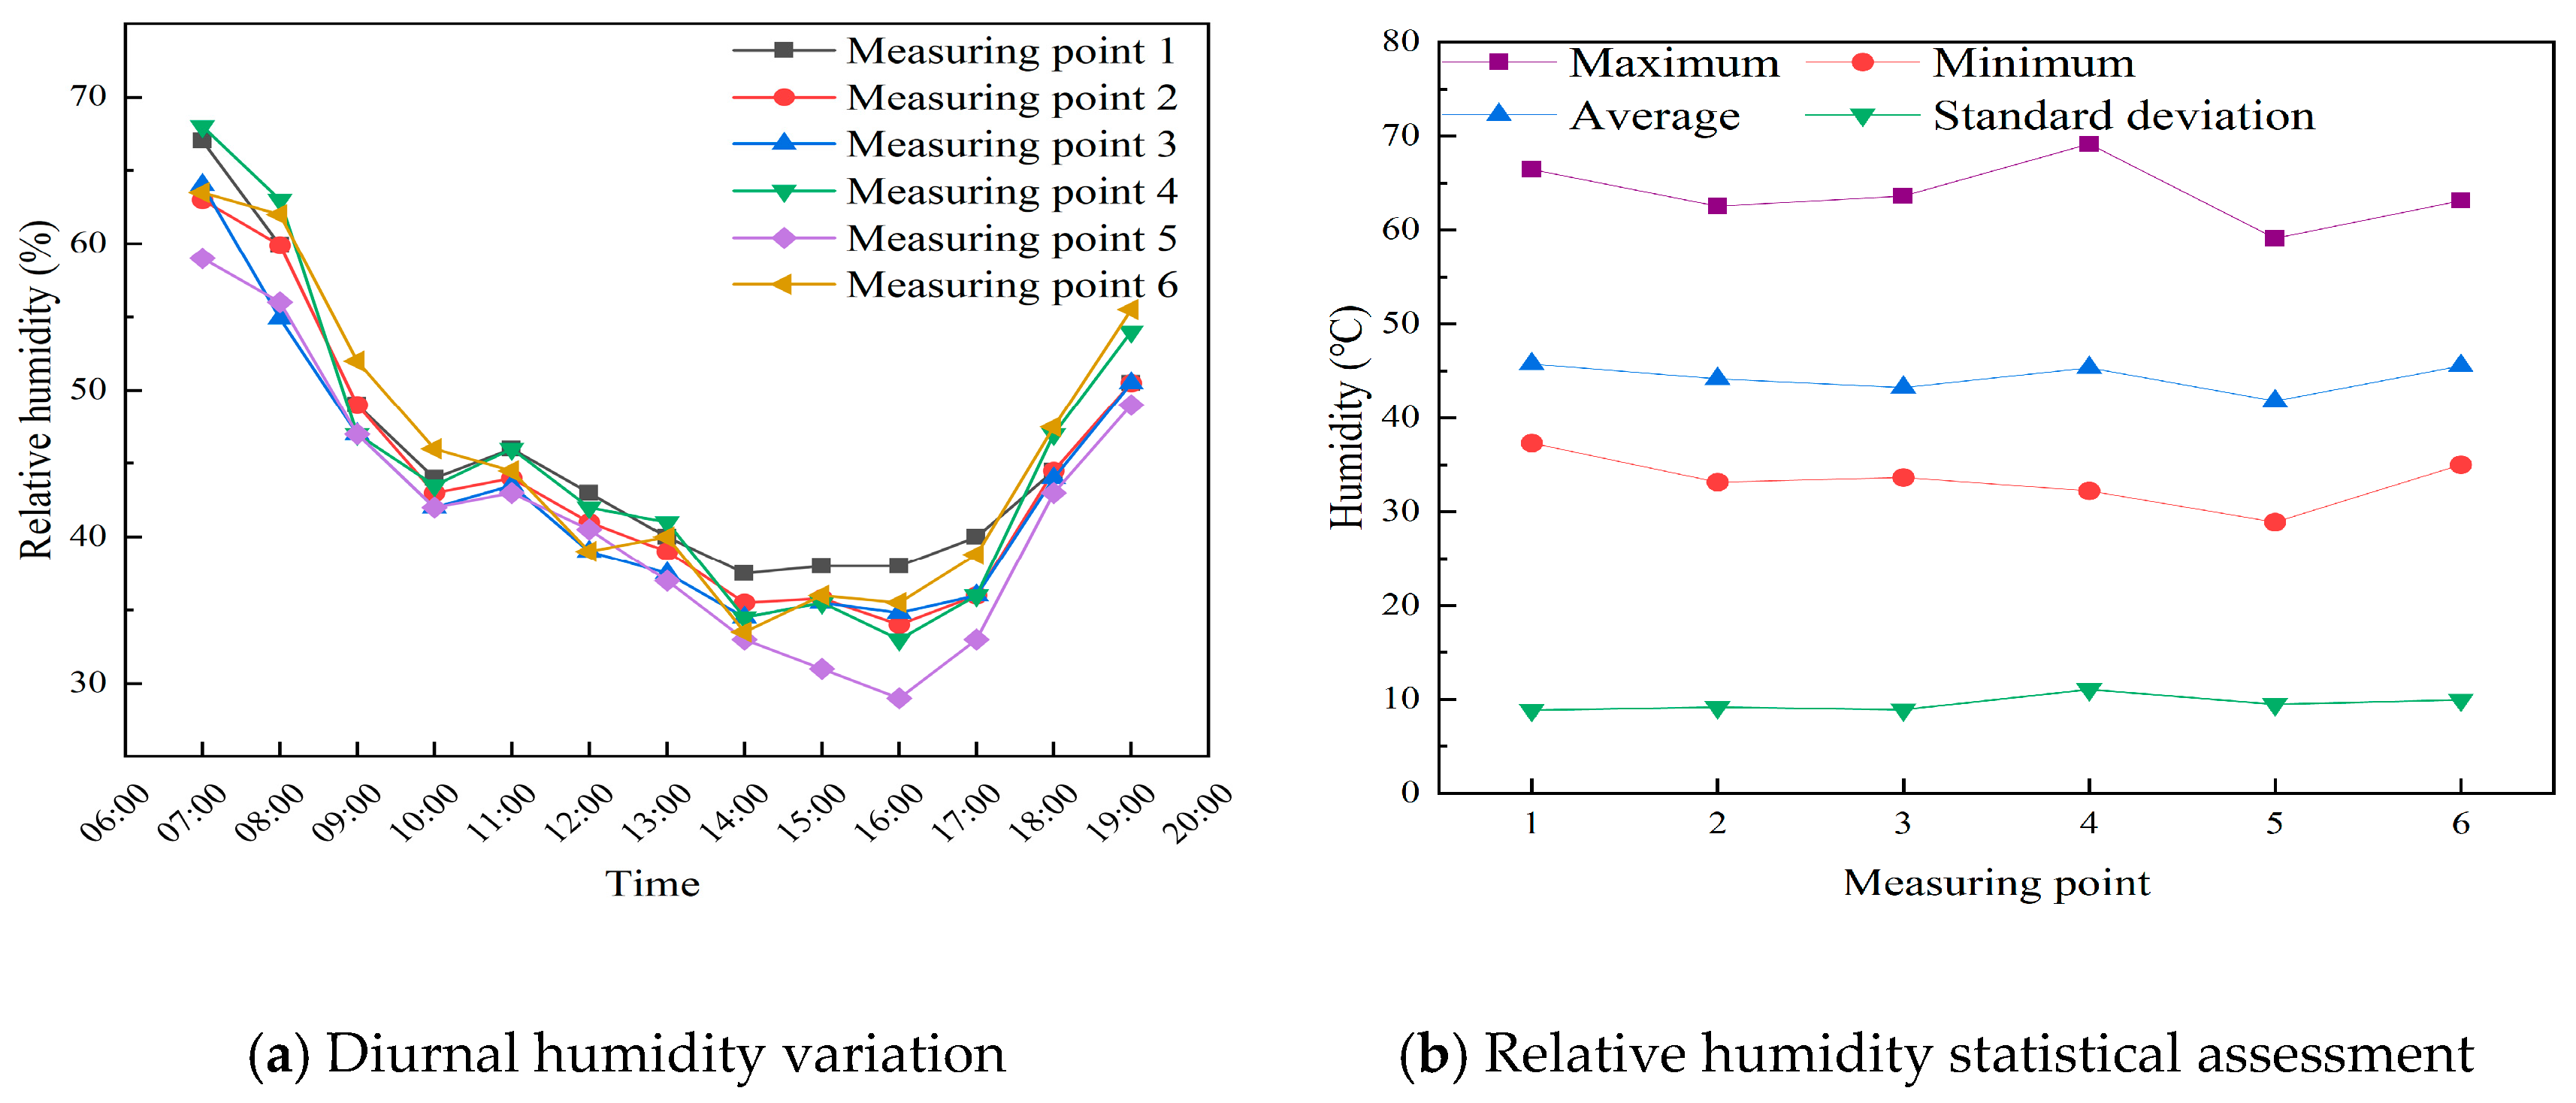
3.1.2. Air Humidity
Figure 7 shows the highest relative humidity occurs at 7:00. The maximum air relative humidity along the double-row open-canopy boulevard is 69.16%. The point with the highest humidity is located under the trees at the edge of the road, indicating that plants can influence the relative humidity of the surrounding environment. In closed tree-lined spaces, the humidifying effect is significant [
37]. The lowest relative humidity at each measurement point occurs at 14:00 and 16:00, with the lowest value of 28.89% recorded at measurement point 5. Measurement point 5 corresponds to the point with the highest temperature. Results indicate that there is a negative correlation between temperature and humidity in the tree-lined boulevard environment. The range of the standard deviation for the relative humidity along the double-row open-canopy boulevard is between 8.87% and 11.06%, with an average of 9.58%. The dispersion is relatively small, because the relative humidity is low, leading to faster evaporation of moisture in the air and a stagnation of tree transpiration, which suppresses changes in the environmental relative humidity.
3.1.3. Wind Speed
As shown in
Figure 8, the wind velocity during the daytime is higher than that during the nighttime. Within the double-row open-canopy boulevard space, the wind speed ranged from 0.05 to 2.11 m/s, with the highest wind speed recorded at measurement point 5 at 13:00. The highest wind speeds at all measurement points occurred at the center of the road, with peak values recorded at 11:00 and 13:00. The average wind speed across all measurement points on the double-row open-canopy boulevard was 0.45 m/s, with a standard deviation of 0.39 m/s.
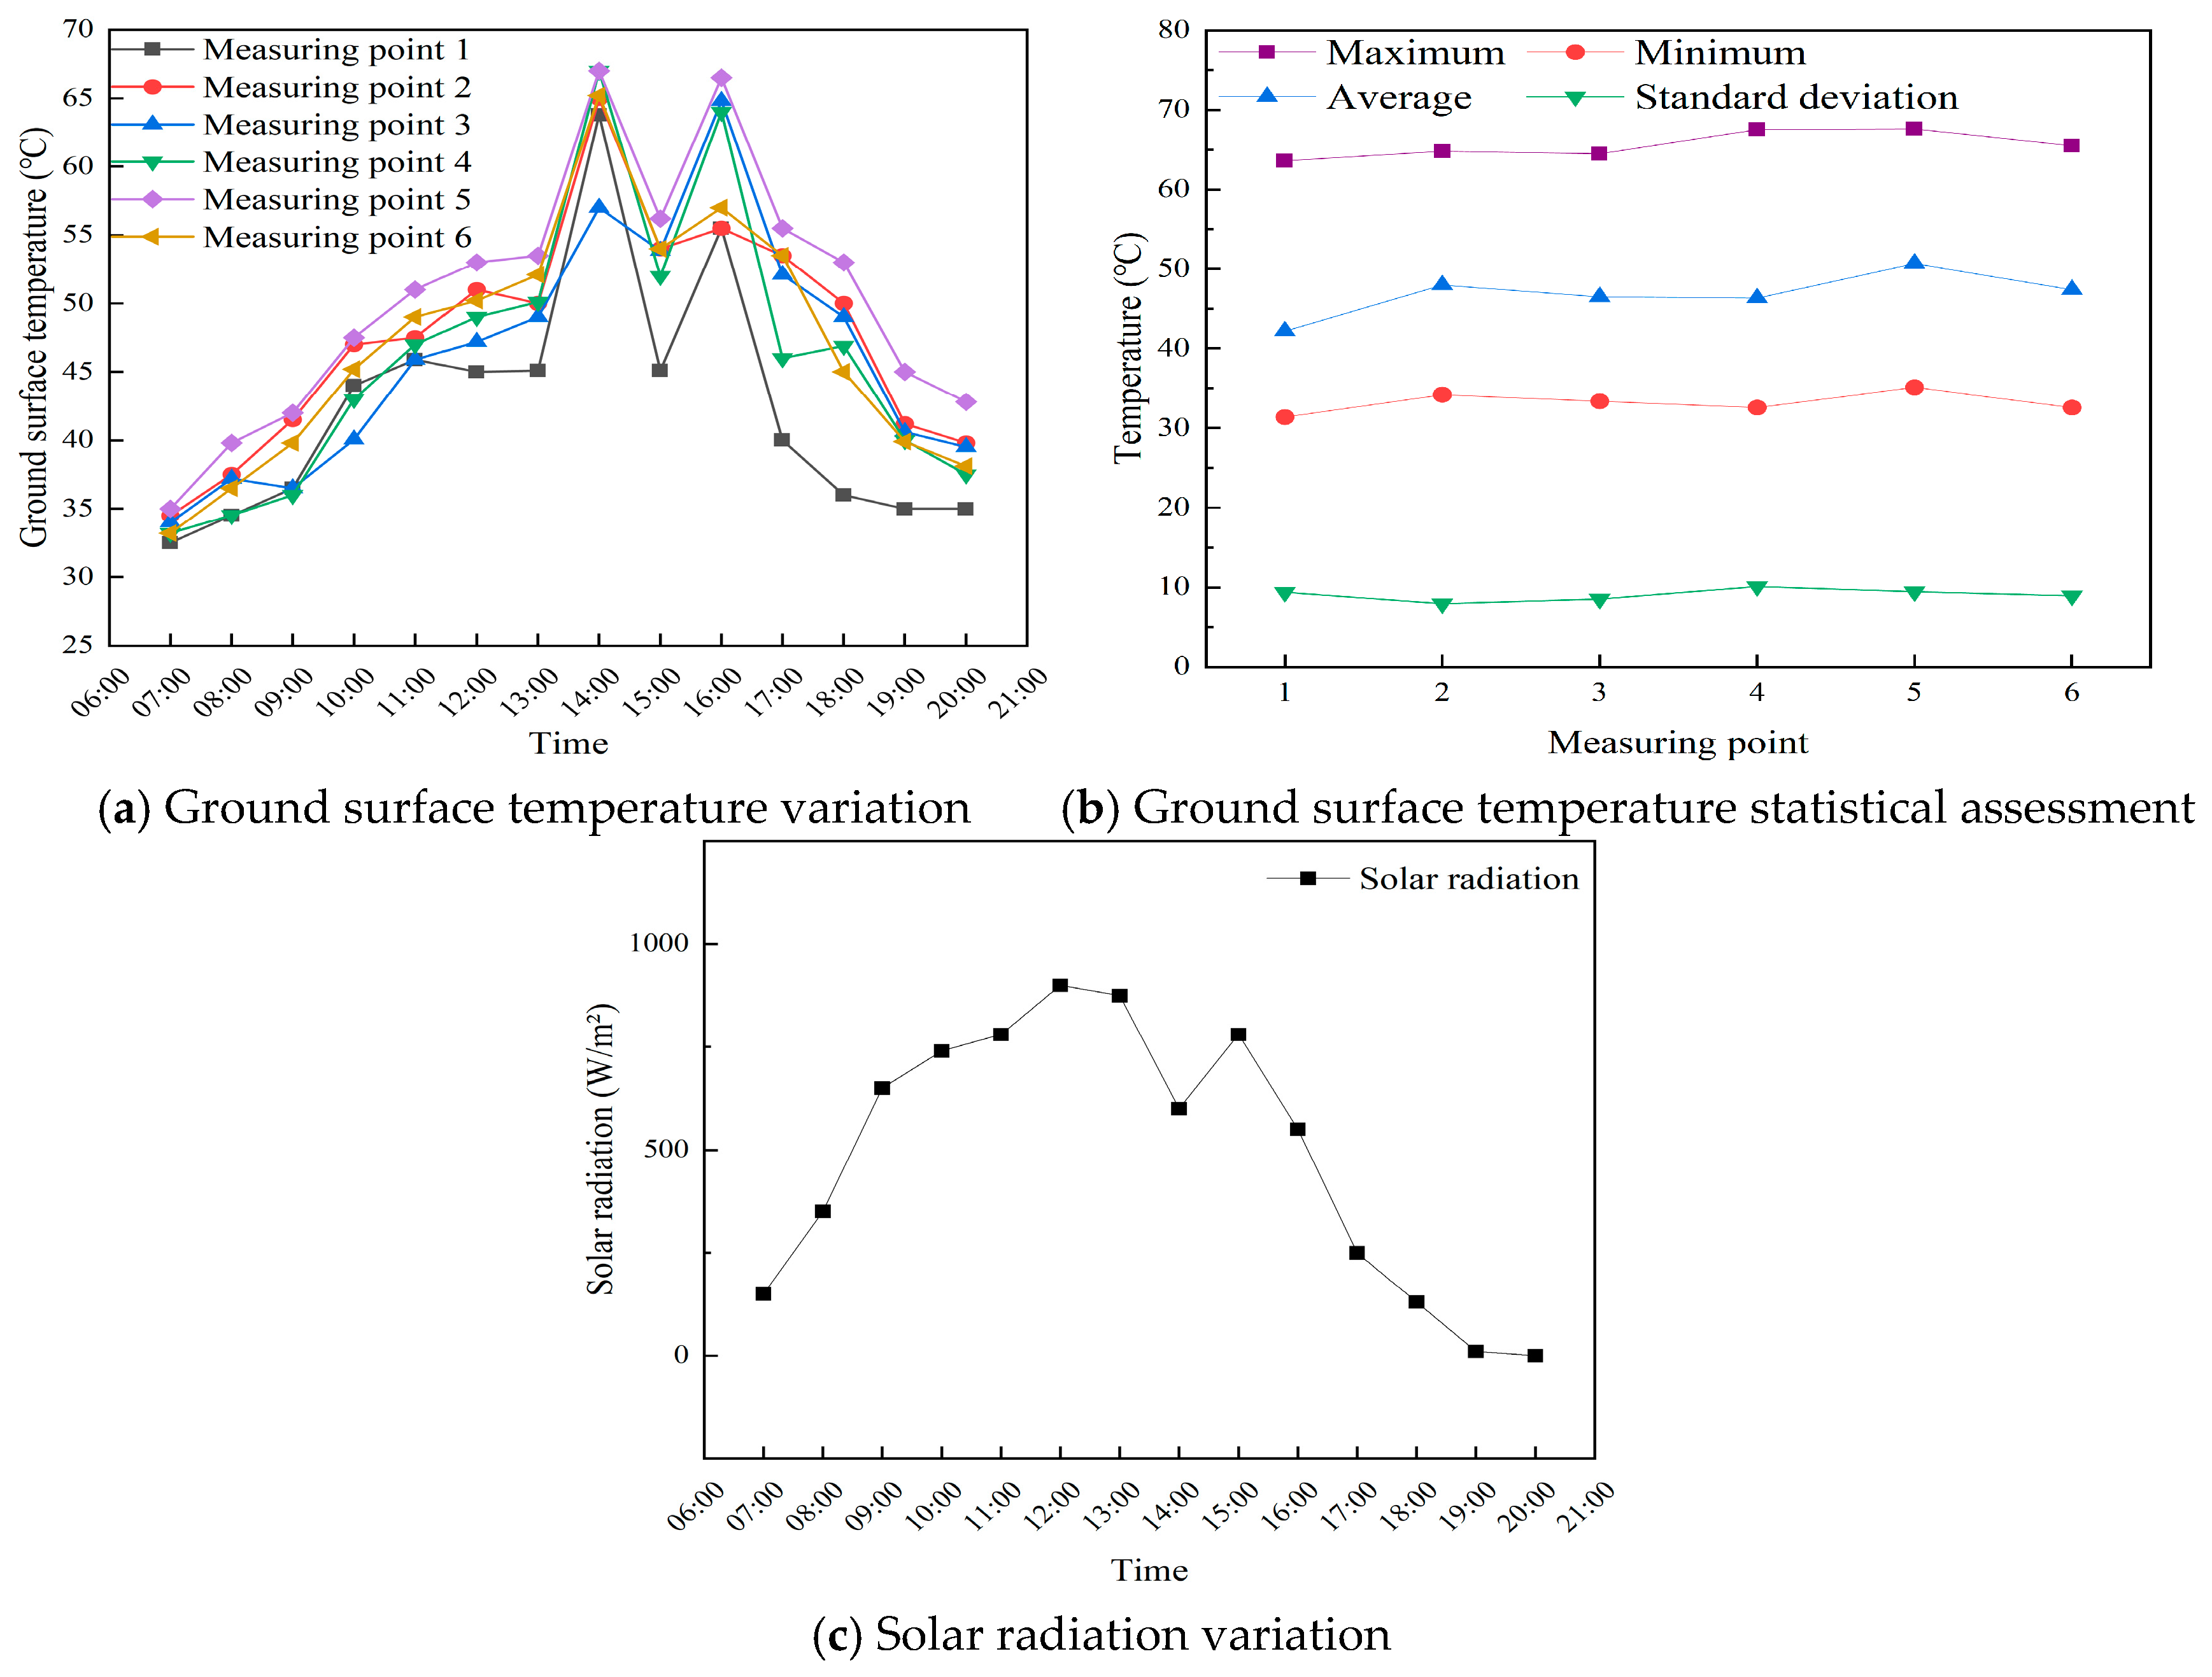
3.1.4. Ground Surface
As shown in
Figure 9, the highest surface temperature within the tree-lined boulevard space occurs at 14:00. The surface temperature follows the same trend as solar radiation during the testing period. The surface temperature ranges from 31.4 °C to 67.6 °C. The highest surface temperature at each measurement point occurs at 14:00. On the double-row open-canopy boulevard, the surface temperatures at the high-temperature periods range from 63.6 °C to 67.6 °C, with the highest temperature recorded at measurement point 5 and the lowest at measurement point 1. The average surface temperatures at the measurement points follow this order: 1 < 4 < 3 < 6 < 2 < 5. This indicates that the surface temperature at the center of the boulevard is higher than that at the sides. The surface temperatures in different points have the same change to the solar radiation. During 12:00 ~ 18:00, the surface temperature at each measurement point on the single-arch closed tree-lined boulevard shows no significant relationship with the solar radiation values. This is because the canopy diameter of different tree-lined boulevard types affects the surface temperature. On the double-row open-canopy boulevard, the canopy diameter is smaller, which results in a weaker shading effect against solar radiation, causing the surface temperature to vary significantly with changes in solar radiation.
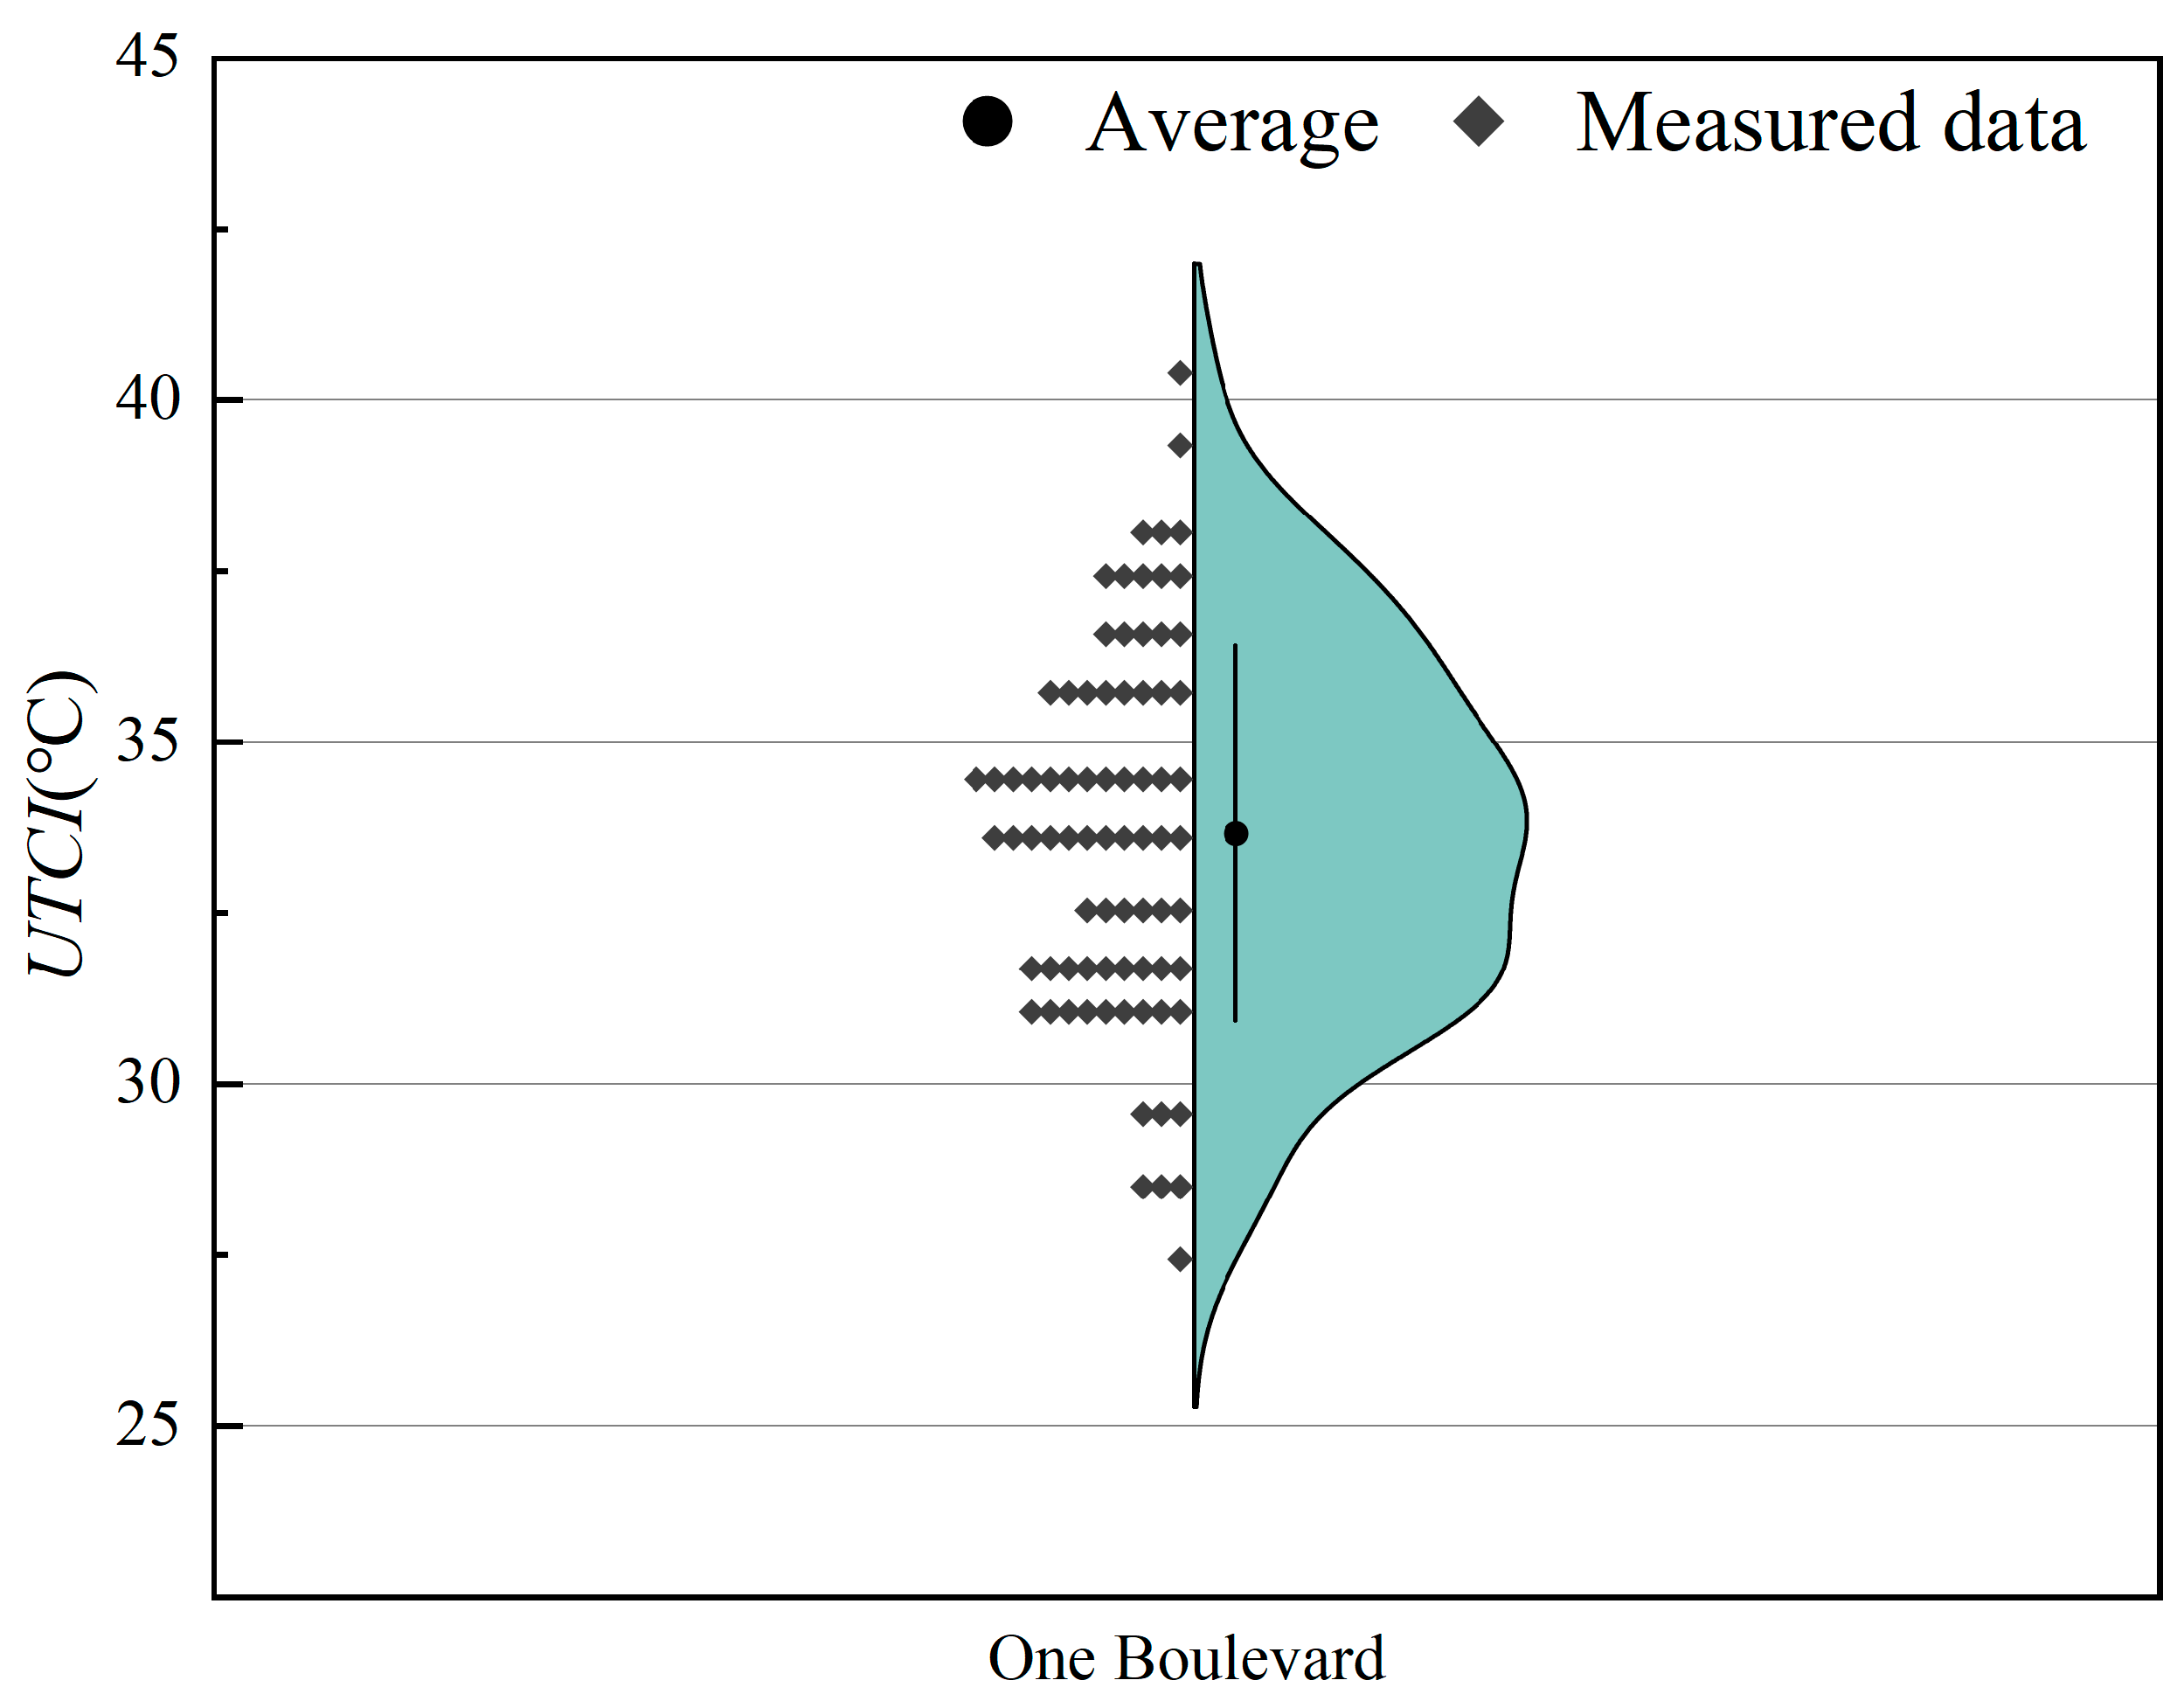
3.1.5. UTCI
UTCI values at different times for the tree-lined boulevard can be calculated based on the measured data. In
Figure 10 and
Table 2, the
UTCI categories corresponding to the thermal stress in the tree-lined spaces of the university campus during summer mainly fall under “intense thermal stress” and “moderate thermal stress”, which pose a certain level of discomfort for pedestrians. On rare occasions, the thermal stress category reaches “extreme thermal stress”, leading to a poor experience for individuals.
3.2. ENVI-Met Simulation
The temperature, relative humidity, and
UTCI value trends under nine different conditions for the double-row open-canopy boulevard are shown in
Figure 11. The temperature is within 28.76 °C~39.32 °C, and the highest temperature occurs at 15:00. The relative humidity varies between 32.41% and 67.86%, with the lowest value at 16:00. The
UTCI values range from 30.03 °C to 43.73 °C, with the maximum
UTCI value occurring at 15:00. Therefore, the environmental conditions at the high-temperature period (15:00) are selected as the boundary conditions in the following section.
3.2.1. Impact of Boulevard Aspect Ratio on Microclimate
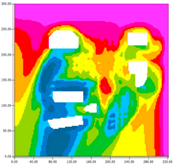
To investigate the impact of the boulevard aspect ratio on the microclimate, the temperature, humidity, and
UTCI of the Schemes 2, 4, and 6 are simulated and compared in
Table 3 and
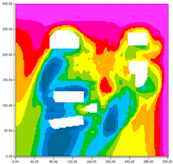
Figure 12. When the aspect ratio is reduced from 1.5 to 1.125, the average hourly temperature difference increases by 0.025 °C. When the aspect ratio is reduced from 1.5 to 0.9, the average hourly temperature difference increases by 0.047 °C. The maximum temperature difference occurs at 12:00, when Scheme 2 and Scheme 4 increase by 0.053 °C and 0.079 °C compared to Scheme 6, respectively. This is because increasing the ratio of the boulevard affects shading performance, which influences the air temperature within the boulevard. At 12:00, when the solar radiation intensity is at its peak, the effect is more pronounced.
When the aspect ratio is reduced from 1.5 to 1.125, the average hourly relative humidity difference decreases by 0.097%. When the aspect ratio is reduced from 1.5 to 0.9, the average hourly relative humidity difference decreases by 0.227%. From 12:00 to 15:00, the relative humidity difference diminishes.
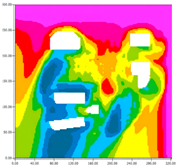
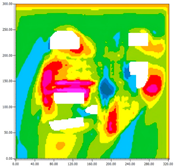
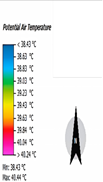
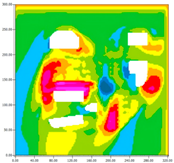
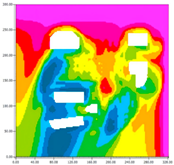
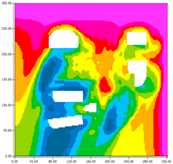
As the aspect ratio of the double-row open-canopy boulevard decreases, the UTCI value increases. Moreover, the UTCI value at the center of the boulevard space shows a significant rise with the increase in road width. When the aspect ratio is reduced from 1.5 to 1.125, the average hourly UTCI difference increases by 0.06 °C, with a maximum value of 0.17 °C. When the aspect ratio is reduced from 1.5 to 0.9, the average hourly UTCI difference increases by 0.21 °C. The maximum UTCI difference for Scheme 5, Scheme 8, and Scheme 2 occurs at 16:00 and 17:00, respectively. During the high-temperature period (15:00), the UTCI values for the three schemes are 42.69 °C, 42.77 °C, and 42.89 °C, with the heat stress category for all three being “extremely intense thermal stress”. In conclusion, reducing the aspect ratio of the road within the tree-lined space results in an increase in the UTCI value, thereby diminishing the thermal comfort experienced by pedestrians along the tree-lined boulevard.
3.2.2. Impact of Tree Canopy Diameter on Microclimate
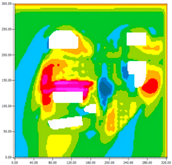
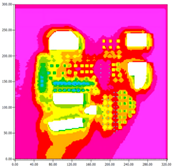
To investigate the impact of canopy diameter on the microclimate, the results of temperature, humidity, and
UTCI are compared for Schemes 3, 4, and 5 in
Table 4 and
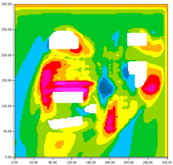
Figure 13. It can be observed that when the canopy diameter of the trees on both sides of the boulevard increases, the overall air temperature decreases. The temperature difference between the two schemes at the same time shows a similar trend. When the canopy diameter increases from 7 m to 9 m, the average hourly temperature difference decreases by 0.034 °C. When the canopy diameter increases from 7 m to 11 m, the average hourly temperature difference decreases by 0.064 °C. The maximum temperature difference occurs at 11:00, with decreases of 0.053 °C and 0.099 °C, while the minimum temperature difference occurs at 13:00. Because when the width of the boulevard remains unchanged, the tree canopy diameter increases, it affects the shading effect, which reduces the environmental temperature.
When the canopy diameter of the trees on both sides of the double-row open-canopy boulevard increases, the overall relative humidity increases. When the canopy diameter increases from 7 m to 9 m, the average hourly relative humidity difference increases by 0.127%. When the canopy diameter increases from 7 m to 11 m, the average hourly relative humidity difference increases by 0.245%. The maximum relative humidity difference occurs at 11:00, with increases of 0.196% and 0.391%, while the minimum relative humidity difference occurs at 13:00. The reason is that, with a constant road width, changing the canopy diameter of the trees in the boulevard affects the shading rate, and the larger the canopy diameter, the greater the humidifying effect.
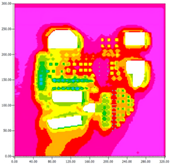
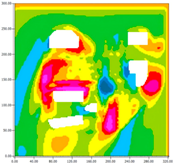
As the tree canopy diameter of the double-row open-canopy boulevard increases, the UTCI value decreases. With the increase in the canopy diameter on both sides, the area of the boulevard with lower UTCI values (blue areas) increases. When the canopy diameter increases from 7 m to 9 m, the average hourly UTCI difference decreases by 0.26 °C. When the canopy diameter increases from 7 m to 11 m, the average hourly UTCI difference decreases by 0.45 °C. The maximum UTCI difference for Scheme 5, Scheme 6, and Scheme 4 occurs at 11:00 and 10:00, with reductions of 0.43 °C and 0.82 °C, respectively. At 15:00, the UTCI values for the three schemes are 43.16 °C, 42.77 °C, and 42.5 °C, with the heat stress category for all three being “extremely intense thermal stress”. In conclusion, from 7:00 to 18:00, increasing the canopy diameter of the trees in a boulevard space lowers the UTCI in the boulevard, improving the pedestrian thermal comfort. However, from 19:00 to 20:00, when the canopy diameter increases, the UTCI value rises, and the pedestrian experience becomes worse.
3.3. Campus Tree-Lined Boulevard Environmental Thermal Comfort-Evaluation Model
3.3.1. Preliminary Thermal Comfort-Evaluation Model for Tree-Lined Boulevards
In this study, the temperature, relative humidity, wind speed, and solar radiation intensity data at different measurement points in the nine scenarios are used as variables in the thermal comfort-evaluation model. The
UTCI values are treated as the dependent variable. The preliminary thermal comfort-evaluation-prediction model is fitted by Equation (1). The relationship and partial correlation analysis between independent and dependent variables are listed in
Table 5.
where
,
,
, and
represent air temperature, air relative humidity, air velocity, and solar radiation intensity;
denotes the residual of the equation;
refers to the Durbin–Watson statistic of the equation.
Equation (1) and
Table 5 show that the Durbin–Watson statistic for the initial-stage
UTCI thermal comfort-prediction model of the tree-lined boulevard is 1.237, indicating good independence concerning the model’s independent variables. The fit coefficient
R² and the residual of the equation are 0.99 and 0.988, suggesting that the initial prediction model for
UTCI has a high degree of reliability. The significance coefficients of
UTCI with respect to the four independent factors are 0, 0, 0.204, and 0, respectively, and the partial correlation coefficients with respect to these four independent factors are 0.902, 0.77, −0.154, and 0.756. The analysis reveals that the temperature factor, relative humidity factor, and solar radiation intensity factor in the tree-lined boulevard environment have a significant impact on the
UTCI value, while the wind speed factor is insignificant. This indicates that wind speed has a low impact on the thermal comfort-evaluation model for the campus tree-lined boulevard and can be disregarded in the evaluation model.
3.3.2. Optimized Tree-Lined Boulevard Thermal Comfort-Evaluation Model
The initial-stage tree-lined boulevard thermal comfort-prediction model obtained above is optimized, excluding the consideration of the tree-lined boulevard’s aspect ratio. The independent variables for the prediction equation are the air temperature, relative humidity, air velocity, solar radiation intensity, and tree canopy diameter of the boulevard, with the
UTCI as the dependent variable to predict the thermal comfort-evaluation model for the campus tree-lined boulevard. The resulting optimized campus tree-lined boulevard thermal comfort-evaluation prediction model is represented by Equation (2). The significance of the relationship and partial correlation analysis between the independent and dependent variables is shown in
Table 5.
Equation (2) and
Table 6 show that the Durbin–Watson test coefficient of the optimized campus tree-lined boulevard thermal comfort-evaluation-prediction model for
UTCI is 1.25, the fitting coefficient
R2 is 0.99, and the residual of the equation is 0.99. Compared to the initial prediction model, the simulation fitting coefficient has not changed, but the Durbin–Watson test coefficient of the equation has increased by 0.013, and the residual has increased by 0.002. This indicates that the optimized prediction model for
UTCI still maintains a high level of credibility. The significance coefficients of
UTCI with respect to the three independent variables are all 0.000, and the partial correlation coefficients with the three variables are 0.905, 0.775, and 0.756, respectively. The impact of the temperature, relative humidity, and solar radiation factors on the
UTCI values of the tree-lined boulevard remains “significant”. Compared to the initial prediction model, the optimized model maintains a high level of credibility while simplifying the influencing factors. All the retained influencing factors have significant indicators. This indicates that the optimized thermal comfort-evaluation-prediction model for tree-lined boulevards has high accuracy. It can accurately calculate the thermal comfort of the boulevard environment based on the influencing factors and simplifies the independent variables, providing convenience for evaluating the thermal comfort of campus tree-lined environments.
4. Discussion
This study conducted on-site measurements of the microclimate in the tree-lined boulevards of a university campus in Guilin, obtaining corresponding microclimate data. An ENVI-met model was established to investigate the effects of the aspect ratio and tree canopy diameter of double-row open-canopy boulevards on the microclimate. Additionally, a thermal comfort-evaluation model was proposed to predict thermal comfort in hot summer and cold winter regions. Through on-site test and simulations, the study found that when the tree-lined boulevard space is fixed, the effect of tree canopy diameter on temperature, relative humidity, and UTCI is more obvious compared to the road aspect ratio.
The road characteristics of double-row open-canopy boulevards typically include smaller tree canopy diameters along both sides of the road, with the tree canopies not overlapping at the top of the road space. Studies have shown that adjusting the aspect ratio of tree-lined boulevards and increasing canopy diameter exhibit certain similarities in their microclimatic effects. By increasing these two parameters, the shading effect of trees can be enhanced, thereby reducing thermal radiation from the ground and surrounding air. Simultaneously, the enhancement of transpiration leads to an increase in relative humidity. A higher aspect ratio results in a denser arrangement of branches and foliage, while a larger canopy diameter expands the coverage of leaves and branches. Both factors contribute to wind mitigation, effectively reducing discomfort caused by strong winds. Therefore, the regulation of the microclimate in tree-lined boulevards can be improved through the design of spatial structures. When designing double-row open-canopy boulevards on university campuses, narrower roads with higher aspect ratios can be considered and larger canopy diameters to enhance thermal comfort.
Previous research on thermal comfort in universities primarily focused on indoor spaces, such as classrooms [
38] and offices [
39]. Studies on campus tree-lined boulevards have mainly examined plant species [
40] and green space configurations [
41]. This study aims to explore the effects of road aspect ratio and tree canopy diameter on the microclimate of tree-lined spaces and proposes a thermal comfort-evaluation model applicable to university campuses in hot summer–cold winter regions. High-precision instruments, such as the HOBO outdoor temperature and humidity logger (measurement accuracy: −20 to 70 °C) and heat index meter (measurement accuracy: 0 to 80 °C), were used for experimental measurements to ensure data reliability. In the simulation study, the ENVI-met software took into account the complex interactions between vegetation, surface conditions, and meteorological factors. The boundary conditions were set based on field measurement data to improve the accuracy of the simulation results. However, this study did not include microclimate measurements during the coldest month of winter, preventing an analysis of the seasonal impacts of deciduous and evergreen plants on the campus microclimate. ENVI-met simulations also have certain limitations. First, the model’s accuracy depends on the quality of the input data; inaccurate meteorological data or vegetation parameters can affect the results. Second, the model has limited ability to simulate complex terrains and building forms. In areas with significant topographical variation or complex building layouts, the simulation results may differ from actual conditions. Additionally, the model struggles to accurately simulate the impact of short-term extreme weather events, such as sudden storms or strong winds, which may cause the results to fail to reflect real microclimate changes. Additionally, the sample size is limited, and the findings may not fully represent the thermal comfort conditions of campus boulevards. Further studies incorporating more case studies and extensive data collection are needed to expand the research to a broader scope. In turn, more accurate research results are obtained to provide recommendations for building decision-makers and implementers. Campus planning policies should be based on technical standards for different climates. In new construction and renovation projects, key parameters for tree-lined avenues should be strictly regulated to optimize the campus microclimate. In hot summer regions, prioritize tree species with a canopy diameter of around 11 m to enhance shading and cooling. Increase the road aspect ratio to 1.5 to create a microclimate with dense canopy above and air circulation below. This prevents direct sunlight and promotes airflow. In cold winter regions, reduce the canopy diameter to 7–9 m to allow more sunlight. Adjust the road aspect ratio to 0.9–1.125, ensuring good ventilation while maximizing natural light to improve temperature. Finally, scientific calculations should determine planting density and road-greening ratios to maximize both ecological benefits and spatial efficiency.
5. Conclusions
This study conducted field climate tests on a double-row open-canopy boulevard at a university in Guilin and used ENVI-met to restore the real campus landscape and simulate different conditions. The study adjusted the aspect ratio of the boulevard and the tree canopy diameter to simulate the changes in various microclimate factors. It then used UTCI as an evaluation metric to study the thermal comfort of pedestrians in different tree-lined environments. A thermal comfort-evaluation model was proposed for campus boulevards in hot summer and cold winter regions, simplifying the influence factors while ensuring model accuracy, and providing recommendations for improving the boulevard environment on university campuses. The main conclusions are as follows:
(1) As the tree canopy diameter increased from 7 m to 9 m and 11 m, a corresponding decrease in temperature of 0.034 °C and 0.064 °C was observed. Additionally, relative humidity increased by 0.127% and 0.245%, respectively, while the UTCI decreased by 0.26 °C and 0.45 °C. When the tree canopy is larger, it has a better reflective and absorptive effect on solar radiation, significantly affecting the surface temperature of the boulevard and contributing to an enhancement of pedestrian thermal comfort.
(2) When the aspect ratio was reduced from 1.5 to 1.125 and 0.9, the temperature of the space increased by 0.025 °C and 0.047 °C. The relative humidity decreased by 0.01% and 0.227%, and the UTCI of the boulevard environment increased by 0.06 °C and 0.21°. This shows that a decrease in the aspect ratio leads to an increase in the UTCI, thereby diminishing the thermal comfort experienced by pedestrians.
(3) The optimization of the UTCI thermal comfort-evaluation model showed an increase in the Durbin–Watson test coefficient by 0.013, with the residual sum of squares increasing by 0.002. The significance coefficients for the three independent variables were all 0.000, and the partial correlation coefficients for these factors were 0.905, 0.775, and 0.756, respectively. This indicates that the model is highly accurate and can accurately calculate the thermal comfort of the boulevard environment based on the influencing factors, while simplifying the independent variables.
This study will further improve the microclimate measurements for campus boulevards during the coldest months of winter, fully considering the effects of deciduous and evergreen plants on the campus microclimate in different seasons. The sample size will be expanded, and the findings will be applied to the improvement and design of campus boulevards. The research findings can also be directly applied to optimize the surrounding environment of campus buildings. By adjusting the width-to-height ratio and canopy diameter of boulevards, microclimate conditions such as temperature, humidity, and wind speed around buildings can be improved. This, in turn, reduces building energy consumption, enhances indoor thermal comfort, and lowers reliance on mechanical ventilation and air conditioning systems, contributing to energy-saving goals while improving the overall campus environment quality.
Author Contributions
Data curation, L.B.; Investigation, Y.L. (Yinong Liu) and L.Y.; Methodology, Y.L. (Yinong Liu); Validation, L.B.; Writing—original draft, Y.L. (Yinong Liu) and Y.L. (Yuncheng Lan); Writing—review & editing, R.H., W.Z. and Y.L. (Yuncheng Lan). All authors have read and agreed to the published version of the manuscript.
Funding
This work was supported by Guangxi Natural Science Foundation, (2021GXNSFAA220080) and Guangxi University Young and middle-aged teachers’ scientific research basic ability improvement project (2025KY0255).
Data Availability Statement
The data presented in this study are available on request from the corresponding author due to privacy and property rights issues.
Conflicts of Interest
The authors declare no conflicts of interest.
References
- Zhao, T.F.; Fong, K.F. Characterization of Different Heat Mitigation Strategies in Landscape to Fight Against Heat Island and Improve Thermal Comfort in Hot–Humid Climate (Part I): Measurement and Modelling. Sustain. Cities Soc. 2017, 32, 523–531. [Google Scholar] [CrossRef]
- Jaafar, H.; Lakkis, I.; Yeretzian, A. Impact of Boundary Conditions in a Microclimate Model on Mitigation Strategies Affecting Temperature, Relative Humidity, and Wind Speed in a Mediterranean City. Build. Environ. 2022, 210, 108712. [Google Scholar] [CrossRef]
- Yenri, E.; Suhesti, E.; Said, A. Peranan Pohon dalam Membentuk Iklim Mikro. J. Kehutan. Indones. 2023, 3, 95–101. [Google Scholar] [CrossRef]
- Golany, G.S. Urban Design Morphology and Thermal Performance. Atmos. Environ. 1996, 30, 455–465. [Google Scholar] [CrossRef]
- Cordeiro, A.; Ornelas, A.; Lameiras, J.M. The Thermal Regulator Role of Urban Green Spaces: The Case of Coimbra (Portugal). Forests 2023, 14, 2351. [Google Scholar] [CrossRef]
- Gaspari, J.; Fabbri, K.; Lucchi, M. The Use of Outdoor Microclimate Analysis to Support Decision Making Process: Case Study of Bufalini Square in Cesena. Sustain. Cities Soc. 2018, 42, 206–215. [Google Scholar] [CrossRef]
- Al-Kodmany, K. Greenery-Covered Tall Buildings: A Review. Buildings 2023, 13, 2362. [Google Scholar] [CrossRef]
- He, B.J.; Wang, W.; Sharifi, A.; Liu, X. Progress, Knowledge Gap and Future Directions of Urban Heat Mitigation and Adaptation Research Through a Bibliometric Review of History and Evolution. Energy Build. 2023, 287, 112976. [Google Scholar] [CrossRef]
- Yang, S.; Wang, L.L.; Stathopoulos, T.; Marey, A.M. Urban Microclimate and Its Impact on Built Environment–A Review. Build. Environ. 2023, 238, 110334. [Google Scholar] [CrossRef]
- Ding, X.; Cui, Y.; Chen, Z.; Zhang, H. Energy Efficiency in Biophilic Architecture: A Systematic Literature Review and Visual Analysis Using CiteSpace and VOSviewer. Buildings 2024, 14, 3800. [Google Scholar] [CrossRef]
- Pioppi, B.; Pisello, A.L.; Ramamurthy, P. Wearable Sensing Techniques to Understand Pedestrian-Level Outdoor Microclimate Affecting Heat Related Risk in Urban Parks. Sol. Energy 2022, 242, 397–412. [Google Scholar] [CrossRef]
- Ampatzidis, P.; Kershaw, T. A Review of the Impact of Blue Space on the Urban Microclimate. Sci. Total Environ. 2020, 730, 139068. [Google Scholar] [CrossRef] [PubMed]
- Han, J.; Li, X.; Li, B.; Yang, W.; Yin, W.; Peng, Y.; Feng, T. Research on the Influence of Courtyard Space Layout on Building Microclimate and Its Optimal Design. Energy Build. 2023, 289, 113035. [Google Scholar] [CrossRef]
- Liu, M.; Yang, C.; Fan, Z.; Yuan, C. Prediction Approach on Pedestrian Outdoor Activity Preference Under Factors of Public Open Space Integrated Microclimate. Build. Environ. 2023, 244, 110761. [Google Scholar] [CrossRef]
- Sharifi, A. Resilient Urban Forms: A Review of Literature on Streets and Street Networks. Build. Environ. 2019, 147, 171–187. [Google Scholar] [CrossRef]
- Qiao, L.; Yan, X. Analysis of the Correlation Between Spatial Morphological Elements and Microclimate in the Higher Education Teaching Center Area. Atmosphere 2024, 15, 1330. [Google Scholar] [CrossRef]
- Sun, B.; Zhang, H.-J.; Zhao, L.; Qu, K.; Liu, W.; Zhuang, Z.; Ye, H. Microclimate Optimization of School Campus Landscape Based on Comfort Assessment. Buildings 2022, 12, 1375. [Google Scholar] [CrossRef]
- Jiang, Y.; Liu, C.; Wen, C.; Long, Y. Study of Summer Microclimate and PM2.5 Concentration in Campus Plant Communities. Sci. Rep. 2024, 14, 52508. [Google Scholar] [CrossRef]
- Mallen, E.; Bakin, J.; Stone, B.; Sivakumar, R.; Lanza, K. Thermal Impacts of Built and Vegetated Environments on Local Microclimates in an Urban University Campus. Urban. Clim. 2020, 32, 100640. [Google Scholar] [CrossRef]
- Han, J.-S.; Chong, A.; Lim, J.; Ramasamy, S.; Wong, N.H.; Biljecki, F. Microclimate Spatio-Temporal Prediction Using Deep Learning and Land Use Data. Build. Environ. 2024, 253, 111358. [Google Scholar] [CrossRef]
- Ambarwati, N.; Wijayanti Faida, L.R.; Marhaento, H. The Effects of Green Open Spaces on Microclimate and Thermal Comfort in Three Integrated Campus in Yogyakarta, Indonesia. Geoplan. J. Geomat. Plan. 2023, 10, 37–44. [Google Scholar] [CrossRef]
- Lin, C.; Zhang, S. Impact of Green Roofs and Walls on the Thermal Environment of Pedestrian Heights in Urban Villages. Buildings 2024, 14, 4063. [Google Scholar] [CrossRef]
- Rui, L.; Buccolieri, R.; Gao, Z.; Gatto, E.; Ding, W. Study of the Effect of Green Quantity and Structure on Thermal Comfort and Air Quality in an Urban-Like Residential District by ENVI-Met Modelling. Build. Simul. 2019, 12, 183–194. [Google Scholar] [CrossRef]
- Haeri, T.; Hassan, N.; Ghaffarianhoseini, A. Evaluation of Microclimate Mitigation Strategies in a Heterogenous Street Canyon in Kuala Lumpur from Outdoor Thermal Comfort Perspective Using Envi-Met. Urban. Clim. 2023, 52, 101719. [Google Scholar] [CrossRef]
- Perini, K.; Chokhachian, A.; Dong, S.; Auer, T. Modeling and Simulating Urban Outdoor Comfort: Coupling ENVI-Met and TRNSYS by Grasshopper. Energy Build. 2017, 152, 373–384. [Google Scholar] [CrossRef]
- Zhu, Y.; Xie, W.; Huang, H. Simulation of Latent and Sensible Heat Fluxes in the Heihe Forest and Boreal Forests Based on the Three-Dimensional Model ENVI-Met. Energy 2018, 35, 123–134. [Google Scholar]
- Lai, B.; Fu, J.-M.; Guo, C.-K.; Zhang, D.-Y.; Wu, Z.-G. Street Geometry Factors Influencing Outdoor Pedestrian Thermal Comfort in a Historic District. Buildings 2025, 15, 613. [Google Scholar] [CrossRef]
- Yang, L.; Liu, J.; Zhu, S. Evaluating the Effects of Different Improvement Strategies for the Outdoor Thermal Environment at a University Campus in the Summer: A Case Study in Northern China. Buildings 2022, 12, 2254. [Google Scholar] [CrossRef]
- Srivanit, M.; Hokao, K. Evaluating the Cooling Effects of Greening for Improving the Outdoor Thermal Environment at an Institutional Campus in the Summer. Build. Environ. 2013, 66, 158–172. [Google Scholar] [CrossRef]
- Altunkasa, C.; Uslu, C. Use of Outdoor Microclimate Simulation Maps for a Planting Design to Improve Thermal Comfort. Sustain. Cities Soc. 2020, 57, 102137. [Google Scholar] [CrossRef]
- Forouzandeh, A. Prediction of Surface Temperature of Building Surrounding Envelopes Using Holistic Microclimate ENVI-Met Model. Sustain. Cities Soc. 2021, 68, 102878. [Google Scholar] [CrossRef]
- China Weather Network. Introduction to the City of Guilin. China Weather Network 2025. Available online: https://www.weather.com.cn/cityintro/101300501.shtml (accessed on 20 February 2025).
- Qaid, A.; Bin Lamit, H.; Ossen, D.R.; Shahminan, R.N.R. Urban Heat Island and Thermal Comfort Conditions at Micro-Climate Scale in a Tropical Planned City. Energy Build. 2016, 133, 577–595. [Google Scholar] [CrossRef]
- Wan, K.K.; Li, D.H.; Yang, L.; Lam, J.C. Climate Classifications and Building Energy Use Implications in China. Energy Build. 2010, 42, 1463–1471. [Google Scholar] [CrossRef]
- Tam, B.Y.; Gough, W.A.; Mohsin, T. The Impact of Urbanization and the Urban Heat Island Effect on Day to Day Temperature Variation. Urban. Clim. 2015, 12, 1–10. [Google Scholar] [CrossRef]
- Lai, D.; Liu, W.; Gan, T.; Liu, K.; Chen, Q. A Review of Mitigating Strategies to Improve the Thermal Environment and Thermal Comfort in Urban Outdoor Spaces. Sci. Total Environ. 2019, 661, 337–353. [Google Scholar] [CrossRef]
- Gupta, S.K.; Ram, J.; Singh, H. Comparative Study of Transpiration in Cooling Effect of Tree Species in the Atmosphere. J. Geosci. Environ. Prot. 2018, 6, 151–166. [Google Scholar] [CrossRef]
- Taleghani, M.; Marshall, A.; Fitton, R.; Swan, W. Renaturing a Microclimate: The Impact of Greening a Neighbourhood on Indoor Thermal Comfort During a Heatwave in Manchester, UK. Sol. Energy 2019, 182, 245–255. [Google Scholar] [CrossRef]
- Yao, R.; Liu, J.; Li, B. Occupants’ Adaptive Responses and Perception of Thermal Environment in Naturally Conditioned University Classrooms. Appl. Energy 2010, 87, 1015–1022. [Google Scholar] [CrossRef]
- Bao, Y.; Gao, M.; Luo, D.; Zhou, X. The Influence of Plant Community Characteristics in Urban Parks on the Microclimate. Forests 2022, 13, 1342. [Google Scholar] [CrossRef]
- Battisti, A.; Laureti, F.; Zinzi, M.; Volpicelli, G. Climate Mitigation and Adaptation Strategies for Roofs and Pavements: A Case Study at Sapienza University Campus. Sustainability 2018, 10, 3788. [Google Scholar] [CrossRef]
Figure 1.
Research framework.
Figure 1.
Research framework.
Figure 2.
The climate classification for building design in China and the location.
Figure 2.
The climate classification for building design in China and the location.
Figure 3.
Schematic diagram of measurement point locations.
Figure 3.
Schematic diagram of measurement point locations.
Figure 4.
Main test device.
Figure 4.
Main test device.
Figure 5.
Physical models of tree-lined boulevard.
Figure 5.
Physical models of tree-lined boulevard.
Figure 6.
Results of air temperature.
Figure 6.
Results of air temperature.
Figure 7.
Results of relative humidity.
Figure 7.
Results of relative humidity.
Figure 8.
Results of wind speed.
Figure 8.
Results of wind speed.
Figure 9.
Results of surface.
Figure 9.
Results of surface.
Figure 10.
UTCI distribution of tree-lined boulevard.
Figure 10.
UTCI distribution of tree-lined boulevard.
Figure 11.
Variation trend plots of parameters for nine schemes.
Figure 11.
Variation trend plots of parameters for nine schemes.
Figure 12.
Temperature, relative humidity, and UTCI difference for Schemes 2, 4, and 6.
Figure 12.
Temperature, relative humidity, and UTCI difference for Schemes 2, 4, and 6.
Figure 13.
Temperature, relative humidity, and UTCI difference for Schemes 3, 4, and 5.
Figure 13.
Temperature, relative humidity, and UTCI difference for Schemes 3, 4, and 5.
Table 1.
Main test device information for the experiment.
Table 1.
Main test device information for the experiment.
| Type | Model | Measured Parameters | Measurement Interval | Measurement Accuracy |
|---|
| HOBO outdoor temperature and humidity logger | UX100-003 | Temperature, relative humidity | 30 s | −20~70 °C |
| Thermal index meter | WBGT-8778 | Wet bulb temperature | 30 min | 0~80 °C |
| Solar radiation meter | JTBQ-2C | Solar radiation | 30 min | 0~1999 W/m² |
| Handheld infrared thermometer | FLUKE-59 | Surface temperature | 30 min | −18~270 °C |
| PROVA anemometer | AVM-05 | Wind speed | 30 min | 0~45 m/s |
| Leica total station | DistoTMS910 | Boulevard dimensions | - | 0.05~300 m |
| Portable tripod | SIRUI E1005A | Instrument placement | 1.5 m | ±1.0 mm |
| Portable Stevenson screen | Stevenson Screen and Support | Instrument placement | 1.5 m | ±20 mm |
Table 2.
Measured UTCI grade distribution in the boulevard environment.
Table 2.
Measured UTCI grade distribution in the boulevard environment.
| Grade (°C) | Double-Row Open-Canopy Boulevard | Thermal Stress Category |
|---|
| +26~+32 | 32.1% | Moderate thermal stress |
| +32~+38 | 61.5% | Intense thermal stress |
| +38~+46 | 6.4% | Extreme thermal stress |
| UTCI | 33.55 | - |
Table 3.
Temperature, humidity, and UTCI cloud maps at 15:00 for Scheme 2, Scheme 4, and Scheme 6.
Table 4.
Temperature, humidity, and UTCI cloud maps at 15:00 for Scheme 3, Scheme 4, and Scheme 5.
Table 5.
Partial correlation analysis between UTCI values of the tree-lined boulevard and independent variable factors.
Table 5.
Partial correlation analysis between UTCI values of the tree-lined boulevard and independent variable factors.
| Independent Variable | Significance Coefficient | Significance Indicator | Partial Correlation Coefficient |
|---|
| Temperature | 0.00 | ** | 0.902 |
| Relative Humidity | 0.00 | ** | 0.77 |
| Air Velocity | 0.204 | | −0.154 |
| Solar Radiation Intensity | 0.00 | ** | 0.756 |
Table 6.
Partial correlation analysis between UTCI of the tree-lined boulevard and independent variable factors of the optimization model.
Table 6.
Partial correlation analysis between UTCI of the tree-lined boulevard and independent variable factors of the optimization model.
| Independent Variable | Significance Coefficient | Significance Indicator | Partial Correlation Coefficient |
|---|
| Air Temperature | 0.00 | ** | 0.905 |
| Relative Humidity | 0.00 | ** | 0.775 |
| Solar Radiation Intensity | 0.00 | ** | 0.756 |
| Disclaimer/Publisher’s Note: The statements, opinions and data contained in all publications are solely those of the individual author(s) and contributor(s) and not of MDPI and/or the editor(s). MDPI and/or the editor(s) disclaim responsibility for any injury to people or property resulting from any ideas, methods, instructions or products referred to in the content. |
© 2025 by the authors. Licensee MDPI, Basel, Switzerland. This article is an open access article distributed under the terms and conditions of the Creative Commons Attribution (CC BY) license (https://creativecommons.org/licenses/by/4.0/).


