1. Introduction
There has been significant progress in the field of thermal comfort research, a reason of which is the appearance of further development possibilities thanks to new tools spreading in sensor technology, data analytics.
These tools make procedures accessible also in everyday practice which can otherwise be achieved with resource-intensive, expensive equipment. One of these methods is the real-time thermal comfort assessment of spaces that respond to dynamically changing conditions. Despite its widespread use, the PMV (Predicted Mean Vote) model, standardized in ISO 7730:2005 [
1], does not account for such non-steady-state conditions. It assumes that the environment and the human body’s response remain constant over time. As a result, PMV-based tools may fail to reflect how people actually experience comfort, especially when conditions fluctuate.
1.1. Prior Work
We identified this gap during our previous work on the Comfort Map [
2], a tool that helps users find thermally suitable workstations. While the Comfort Map provides spatial insights, it relies on momentary measurements and cannot predict comfort accurately during transitions. Users often feel discomfort before these tools register a change.
To address this issue, we designed a method that estimates instantaneous thermal sensation by accounting for thermal inertia—the body’s delayed physiological response to environmental changes. This approach enables real-time comfort prediction in dynamic settings, where traditional models fall short. In our previous research, we developed a method to create a comfort map for the entire space using a small number of measurement points [
3].
Our prior results showed that better comfort representation can be achieved with a dynamically updated comfort map, as the climatic conditions of a comfort space are constantly and dynamically changing. In office environments, fan-coil [
4] or VRF heating [
5] and cooling systems are frequently used, where the heating or cooling capacity is controlled by the amount of airflow, i.e., the volumetric flow rate [
6]. In addition, some products use adjustable blades with varying deflection angles in order to obtain a homogeneous temperature distribution in the space [
7].
Based on those described above, it can be stated that the thermal sensation in these spaces is not constant and therefore not fully suitable for the determination of the Predicted Mean Vote (PMV) as defined in ISO 7730:2005. This is because the correlations used in the standardized methodology are based on research conducted under steady-state conditions [
8], which do not take into account the subjects’ thermal inertia [
9,
10,
11]. Therefore, the PMV value measured by various instruments cannot be interpreted at a given moment in time. In order to solve this problem, we aimed to develop a method that allows the determination of momentary PMV using physical parameters measured under non-stationary conditions with low thermal inertia, i.e., measured with fast response instruments.
1.2. Literature Review
ISO 7730:2005 relies on the PMV and PPD indices, both derived under the assumption of steady-state thermal conditions, where the environment and the physiological state of the occupants remain constant over time. However, numerous studies have shown that these assumptions rarely hold in real-world scenarios, especially in naturally ventilated buildings or dynamically controlled environments. Humphreys [
12] demonstrated that PMV consistently overestimates thermal sensation in everyday conditions, where occupants engage in behavioral adaptation, such as adjusting clothing or opening windows. This discrepancy stems from PMV’s insensitivity to temporal fluctuations and individual thermal history. Grignon-Massé et al. [
13] highlighted that PMV/PPD models, as formulated in ISO 7730:2005, are poorly suited to free-running buildings typical in European climates, where indoor temperatures vary with outdoor conditions. Similarly, Augusto et al. [
14] found that the PMV model fails to account for spatial non-uniformity, particularly near glazed surfaces where thermal gradients exist. Liu et al. [
15] further criticized the PMV model’s reliance on static inputs, such as fixed metabolic rates and clothing insulation, which do not reflect the dynamic nature of occupant activity. These findings support the shift toward adaptive comfort models, which consider non-steady-state conditions and occupant feedback, offering more accurate and context-sensitive assessments. While ISO 7730:2005 remains valuable for controlled environments, its direct application in non-steady-state contexts should be carefully reconsidered or complemented with adaptive methods.
2. Materials and Methods
We carried out the measurements in the laboratory of the Department of Building Services and Building Engineering at the Faculty of Engineering and Information Technology, University of Pécs. This laboratory is equipped with a controlled climate chamber to ensure the desired climatic conditions. The measuring chamber has the following dimensions: 4.00 m (length) × 3.51 m (width) × 3.03 m (ceiling height), with a floor area of 12.04 m
2 and a volume of 36.48 m
3. The chamber has no walls adjoining an external space. All internal surfaces of the climate chamber are equipped with surface heating and cooling solutions, where each surface can be heated or cooled in any combination. Surface temperatures of walls and floor can be kept constant. The measuring chamber and equipment layout can be seen in
Figure 1.
The research involved three main measurements:
Measurement of PMV using a thermal comfort measuring station with negligible thermal inertia;
Measurement of PMV with a thermal manikin having thermal inertia similar to that of the human body;
Measurement of AMV (Actual Mean Vote) using live subjects with questionnaires.
2.1. Measuring Instruments and Procedures Used
In the course of the research, several measuring instruments suitable for the standard measurement of thermal comfort parameters have been used. We placed the instruments in the climate chamber according to the EN ISO 15831:2004 standard [
16].
2.1.1. Thermal Comfort Measuring Station
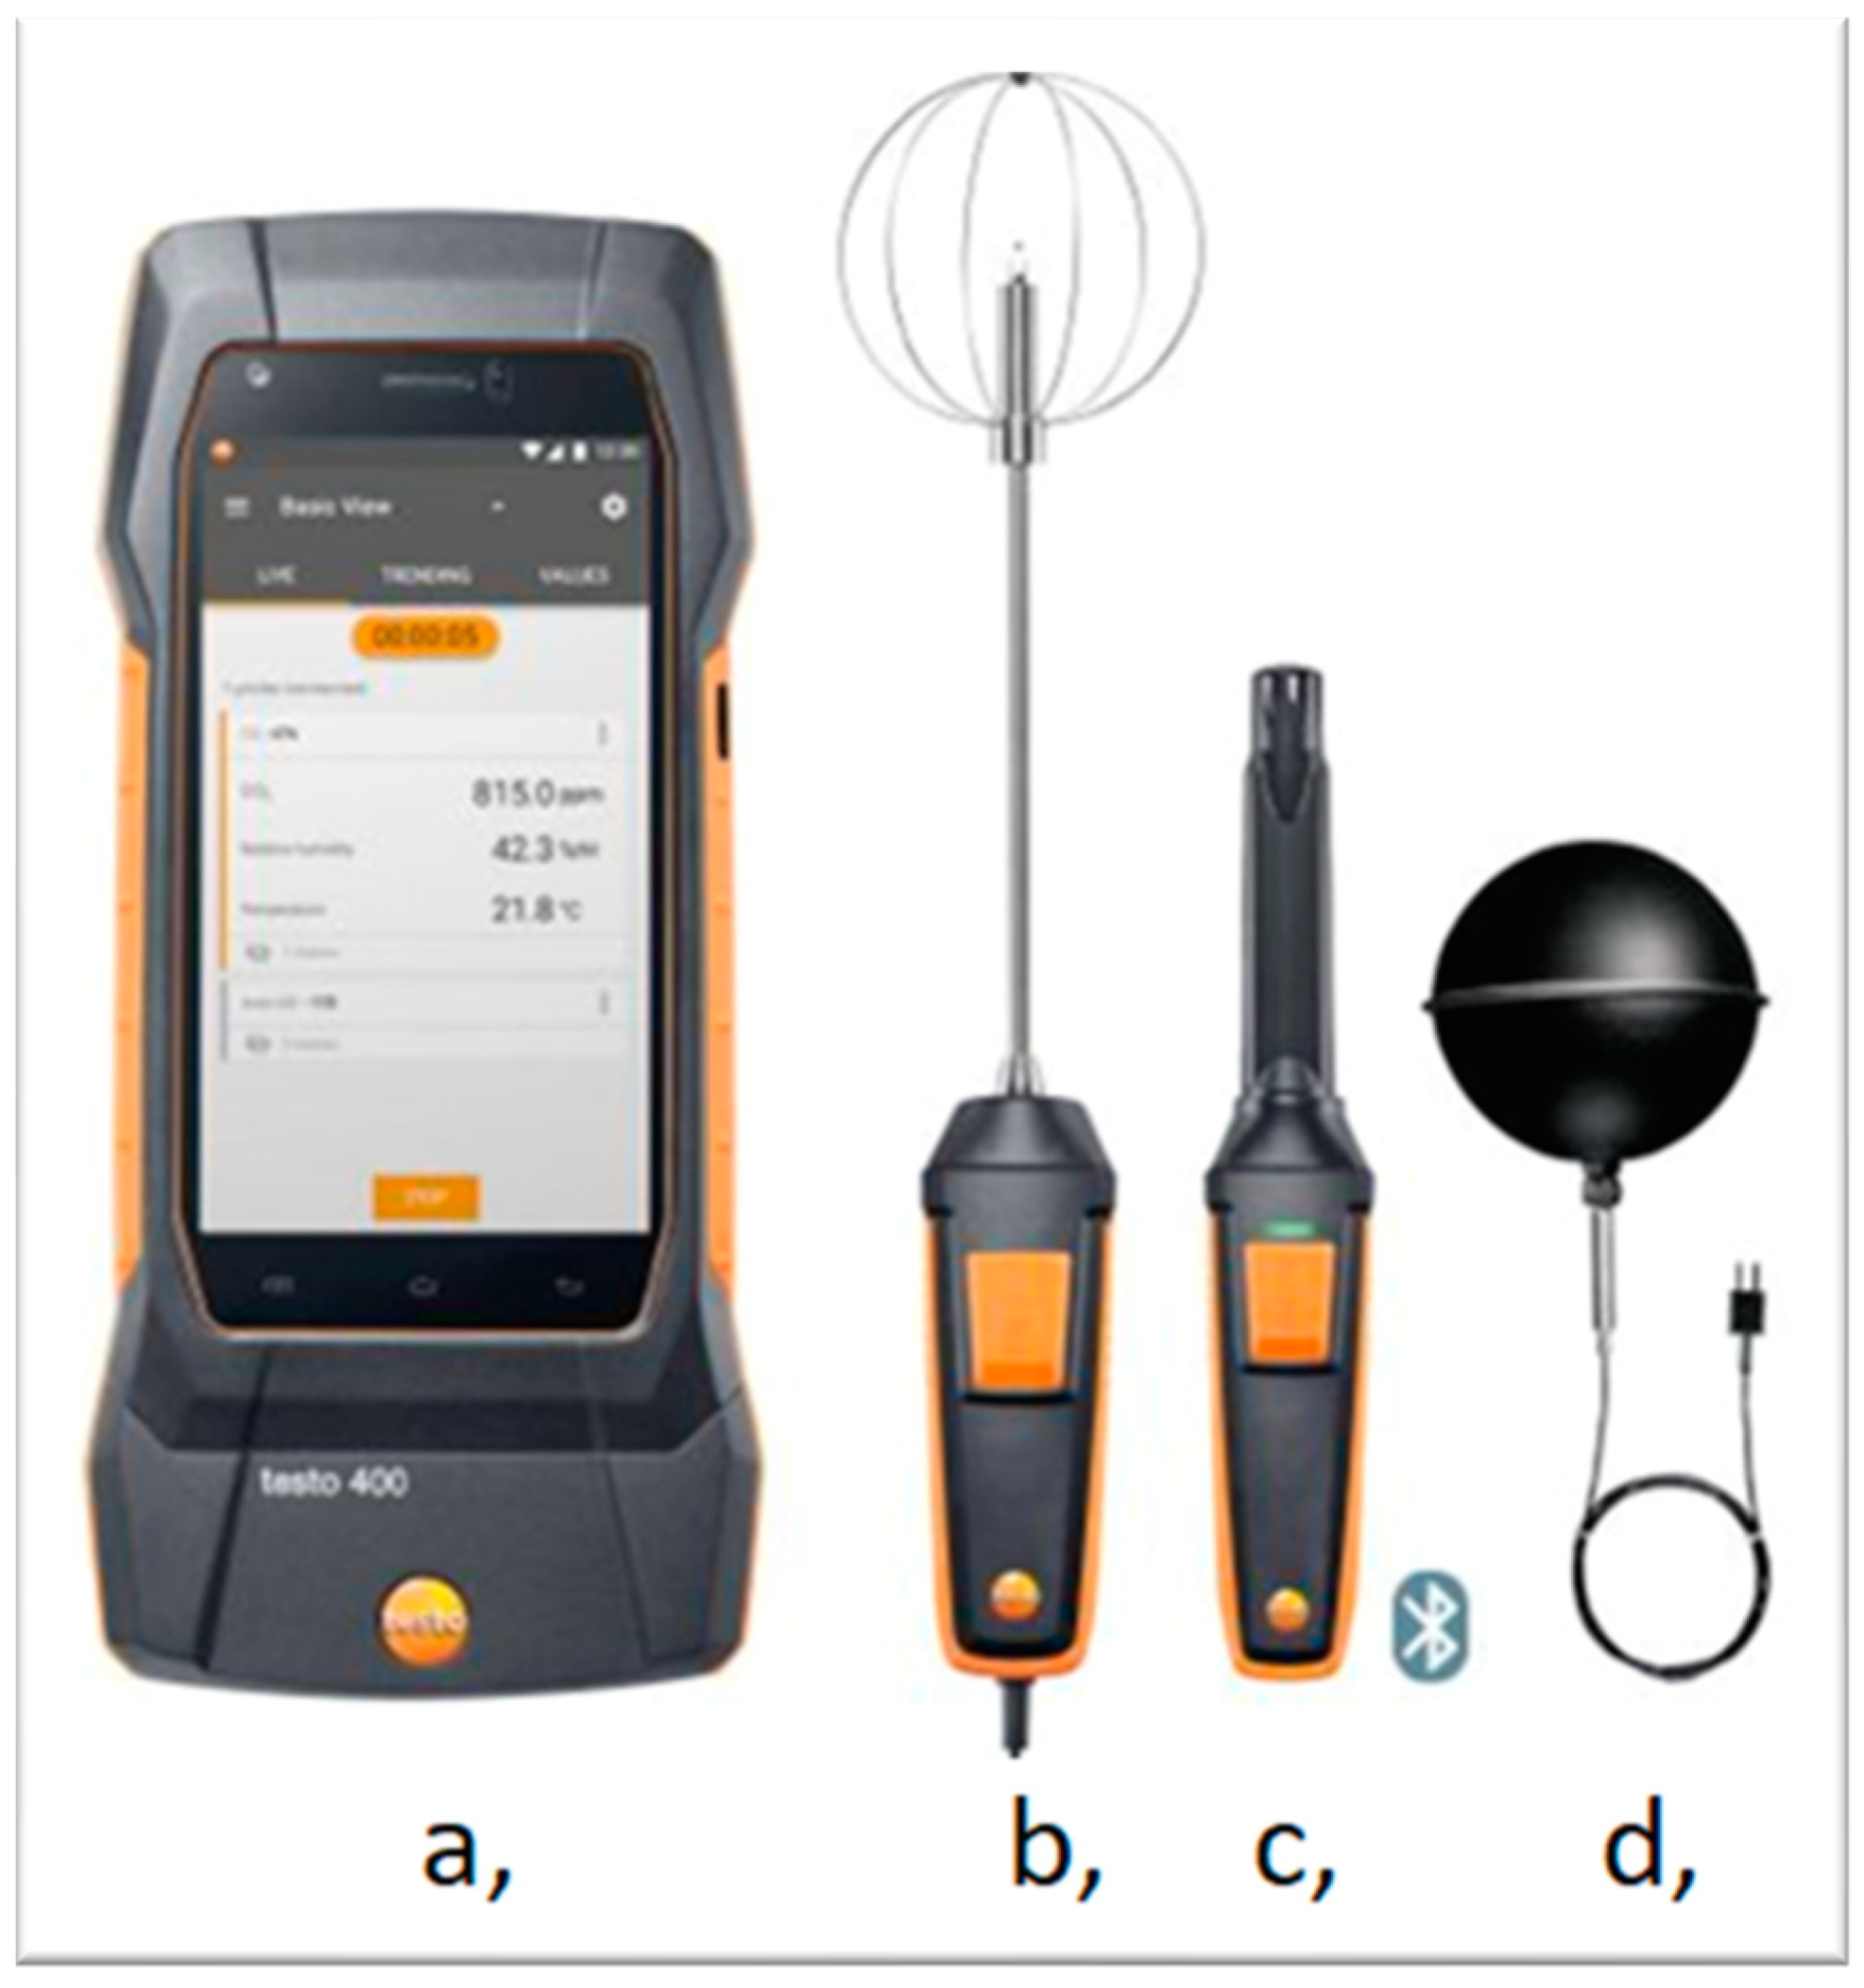
The equipment used is a universal Indoor Air Quality (IAQ) measuring instrument manufactured by TESTO (Titisee-Neustadt, Germany), which is able to measure all necessary comfort level parameters and calculate PMV and PPD values. Measurements have been carried out in line with ISO 7726:1998 [
17] and ISO 7730:2005 standards at a height of 1.1 m, corresponding to the activity of the occupants of the given space. The instrument seen in
Figure 2. measures the humidity, air velocity, air temperature, and other parameters with the high accuracy necessary to calculate the effective and corrected effective temperature.
2.1.2. Thermal Manikin
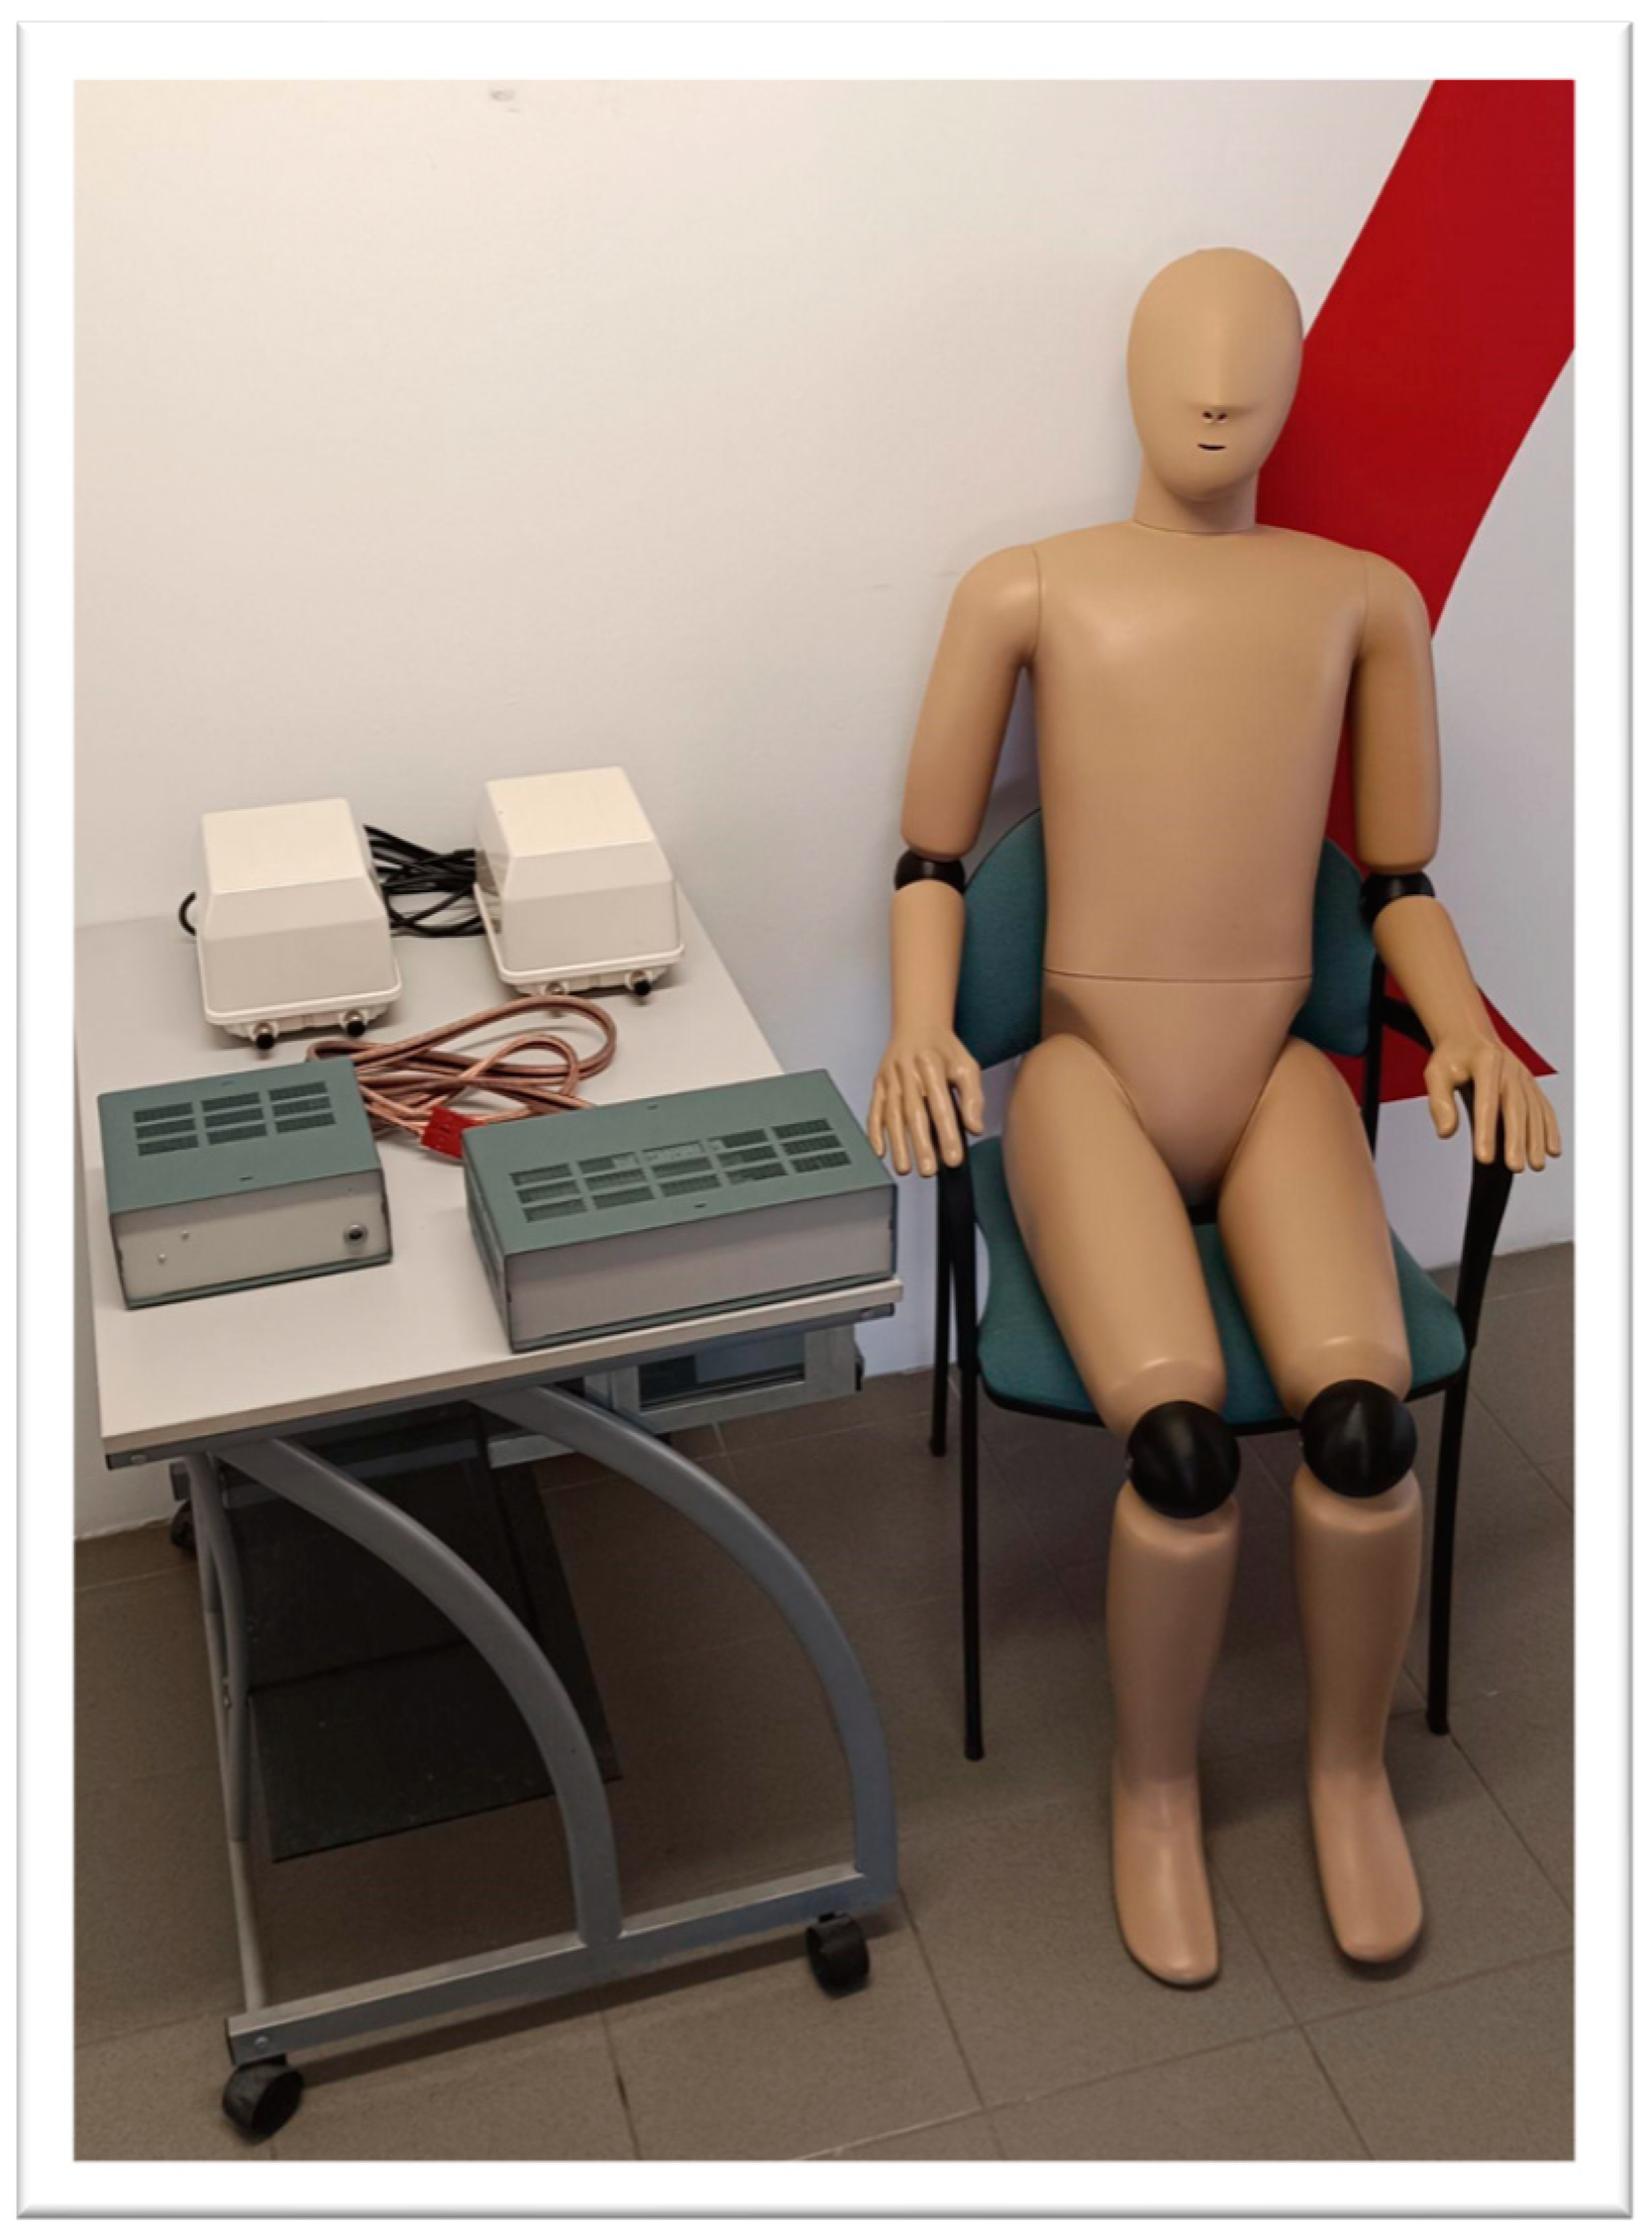
Our thermal manikin is able to simulate the local or entire body heat exchange of the human body. It can model all types of heat transfer processes between humans and their environment in all directions in space. It has the physical parameters of an average adult male as seen in
Figure 3, with a height of ~1.7 m and a body surface area of ~1.7 m
2 divided into 22 independently controllable body segments. It weighs 19 kg for ease of use, with a software-adjustable body weight correction of 70 kg in the default setting. Its limbs (including elbow and knee joints, hands and feet), torso, pelvic region and head can be adjusted to simulate different body positions.
The thermal manikin manufactured by PT-Teknik (Hillerød, Denmark) is suitable for measuring the thermal insulation performance (clo) of clothing, and for determining various thermal comfort indices including PMV and PPD values. One way of controlling the manikin is maintaining constant skin surface temperature on each body segment. It is also possible to conduct measurements at constant heating power. In the third case, the specific heating power of the body parts is set and maintained by the manikin. In this case, a comfort control mode is also available, which follows the heat production, heat dissipation and thermoregulation of the human body as closely as possible. This is achieved by keeping the core temperature constant. In this case, heat loss varies in almost the same way as for humans.
The thermal manikin is composed of the following main units: the thermal manikin body, a microcontroller, which is an integral part of the manikin, the power supply, lungs to simulate breathing, and a desktop PC (which is also the data processing unit) to run the software. The desktop computer is located outside the measuring chamber.
2.1.3. Assessing AMV Using Live Subjects and Questionnaires
Subjects have been asked to fill in a questionnaire at set intervals during the measurement. The questionnaire is based on EN ISO 10551:2019—the standard outlines the method of preparing a questionnaire to assess subjective thermal sensation and contains the definition of the subjective scale [
18]. It also provides guidelines for the wording of the questions asked in the questionnaire.
The standard covers the construction and use of the following rating scales:
thermal comfort scale (perception);
thermal comfort scale (rating);
thermal preference scale (expectation);
personal acceptability;
personal tolerance.
This standard contains examples for the questionnaire and describes the evaluation procedure, the method of determining the AMV. We adapted the questionnaire to the current research, with a special focus on the effect of draughts. The questionnaire has been prepared in Hungarian and English after several rounds of consultation and consisted of 13 questions in total, mainly on thermal sensation and air speed, in accordance with the GDPR data protection regulations.
Participants rated their thermal sensation on a 4, 5, 6, 7, or 9 point scale, depending on the question asked. The scales contain equally spaced markable points, with the corresponding level indicated.
2.2. Boundary Conditions
During our research, measurements were performed within the measurement range defined by the boundary conditions specified in ISO 7730:2005 standard, but for air velocity we consciously chose values outside the boundary conditions. In a study by S. Tanabe and K. Kimura [
19], ~50% of the subjects could sense air movement at an air velocity of 0.15 m/s, 80% felt airflow at an air velocity of 0.4 m/s and 10% of them felt uncomfortable. The preferred air velocity for men was 0.37 m/s and 0.28 m/s for women [
19]. Moreover, the aim of our research is to determine the expected thermal sensation even under intense fluctuations, as demonstrated by the fulfillment of the boundary conditions summarized in
Table 1.
2.3. Describing the Measurement
The choice of location, the environmental conditions, and the activities that can be carried out during the measurement and the duration of the test were determined according to the recommendations of EN ISO 10551:2020. The measurement has been carried out over 7 days, mostly with university students. Participation was voluntary and the participants were informed about the detailed procedure, the conditions, and the possible risks.
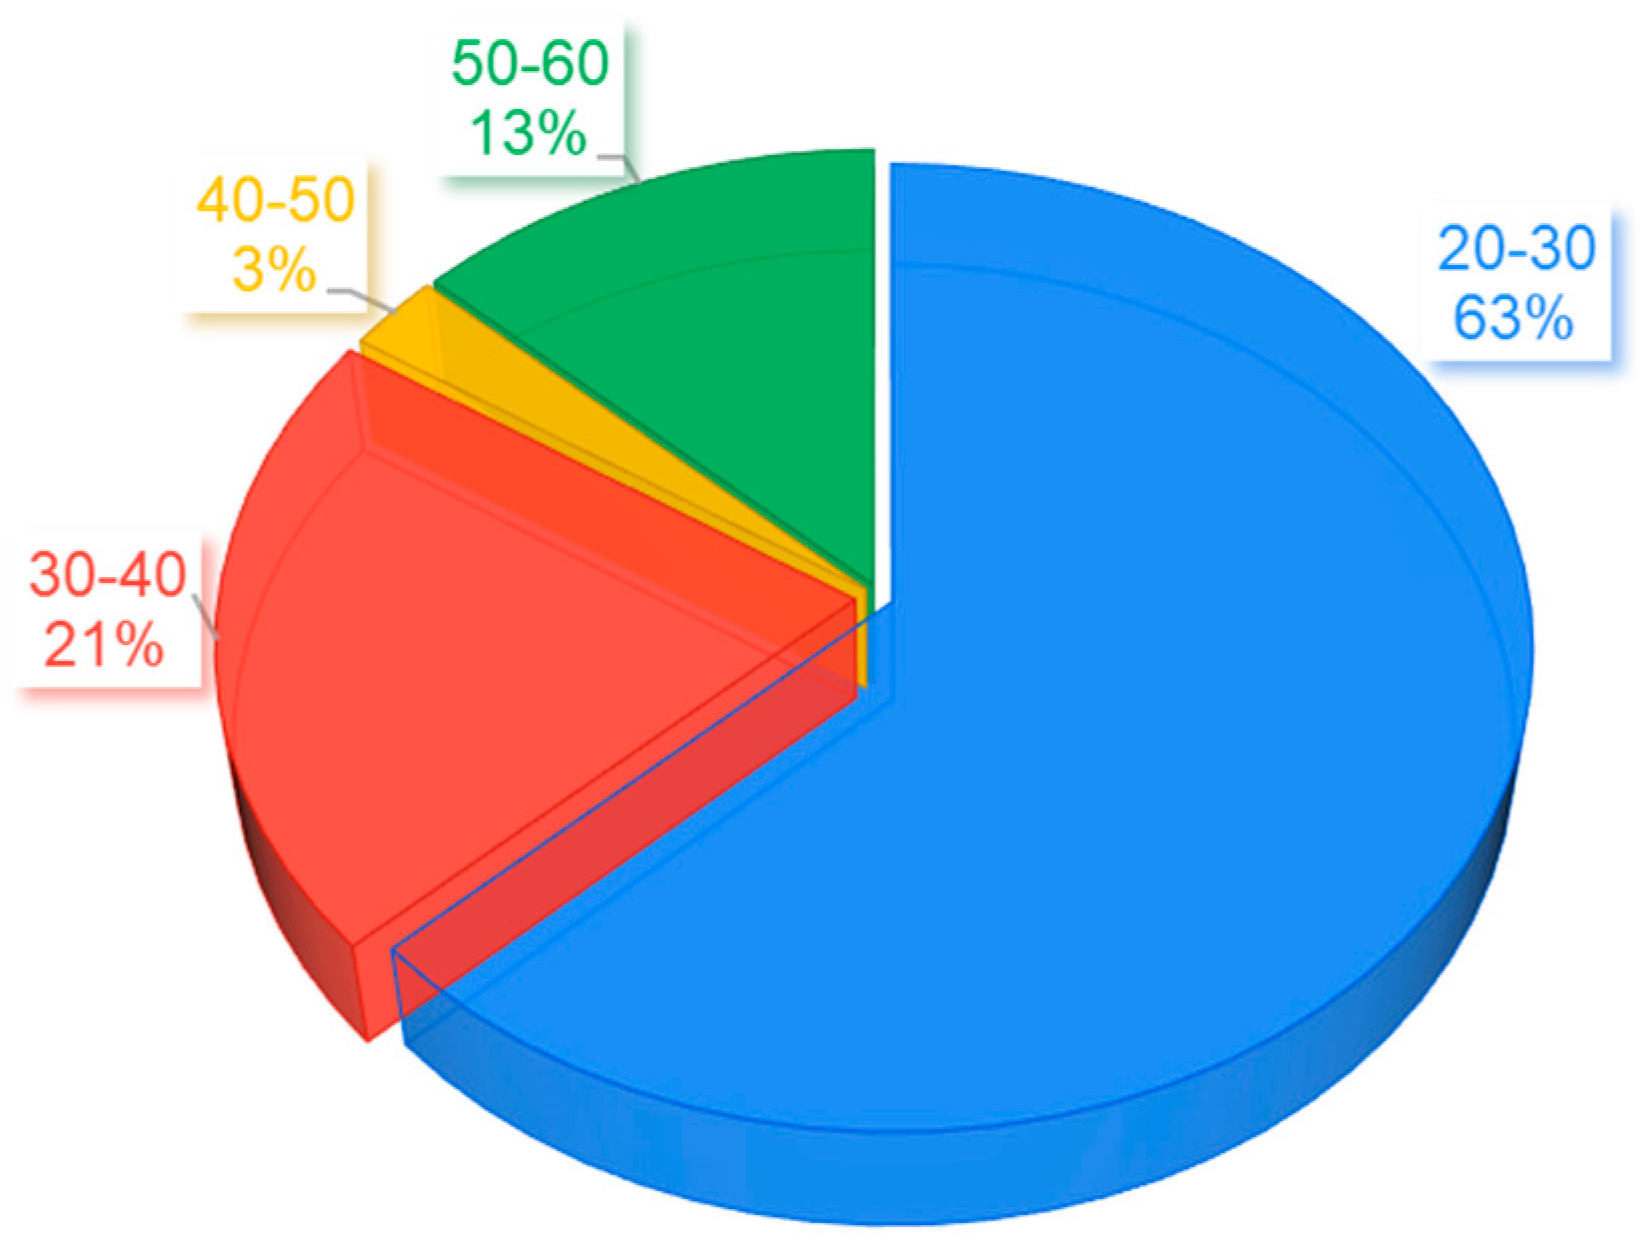
The study involved 38 live subjects, 29 men and 9 women. The age distribution is illustrated by the pie chart in
Figure 4.
The subjects were dressed in a controlled manner, all wearing the same type of clothing ensemble as the thermal manikin, with a thermal insulation value of 0.65 clo. In the study by Song et al. (2016) [
20], a clothing insulation value of 0.6 clo was used, representing typical light office attire, which reflects what many office workers wear in warm indoor environments. Participants did not change their clothing during the measurement. In order to ensure identical clothing, a change of clothing was provided for those who arrived in clothing that did not meet the specified parameters.
Various air velocity values were set throughout the measurement rounds according to recommendations in the literature [
21,
22] and the test was performed for 90 min, followed by a 30 min break between measurements. During the measurement, subjects were seated at the pre-set workstation.
2.4. Methodology for Processing the Measurement Data
We treated the time series data from all instruments and sources as discrete-time signals, suitable for analysis using signal processing techniques. The core of our method involves estimating manikin-based PMV values from fast-response IAQ sensor data using a finite impulse response (FIR) digital filter with an offset [
23]. This allows real-time compensation for the lack of thermal inertia in conventional measurement systems.
The thermal comfort station (TESTO IAQ) and the thermal manikin recorded data at a sampling rate of one sample every 5 s (0.2 Hz). We synchronized the internal clocks of both devices manually at the beginning of each measurement session and verified alignment using shared timestamps and recognizable environmental changes, such as air velocity adjustments. This manual synchronization was repeated and checked before each day’s measurements.
Human subject data were collected using the protocol outlined in
Table 2, with questionnaire responses taken at specific intervals during each measurement session. Each AMV response was linked to the corresponding measurement window by aligning it with the closest IAQ and manikin timestamps, accounting for short delays in perception and form completion. We averaged instrument data over a ±30 s window around each questionnaire submission time to match the temporal resolution of subjective responses.
All time-series data were processed offline using Python (Python 3.11.2) for data cleaning, synchronization, time-windowed averaging, and FIR filter implementation. We down-sampled the measurement signals to 1 min resolution for filter fitting and model evaluation.
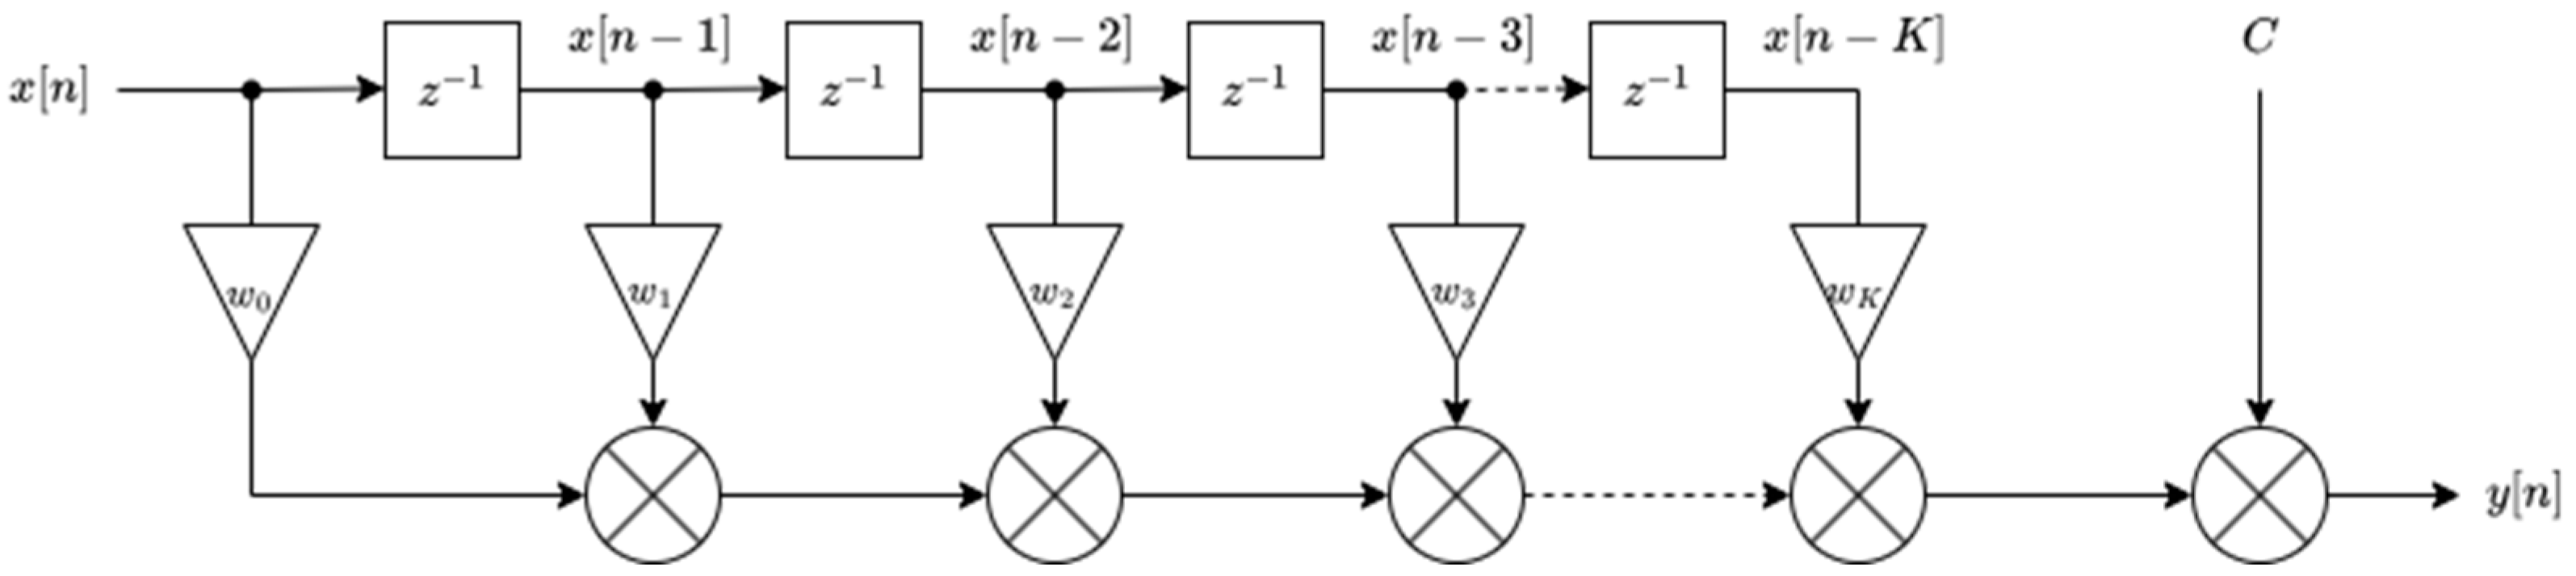
The measurement time series can be considered as a discrete-time signal and a discrete-time system can be used for its processing [
24]. A finite impulse response (FIR) digital filter with offset was used to estimate the data measured by the thermal manikin. The filter-based model allows the addition of a filter to the instrument to obtain a real-time estimate of what the manikin would measure. The filter is illustrated in
Figure 5.
In
Figure 5 x[n] is the instrumented data and y[n] is the estimated data for the manikin. Each block labeled z − 1 represents a unit delay, meaning it outputs the value of the input signal from one time step earlier. A chain of these delays stores a history of previous measurements, which are then combined using weighted summation. The delayed measurement values are summed with weight
wk,
C is a constant offset. These weighted results will be the estimate.
In summary, the operation can be described by the following formula.
where
∗ denotes discrete convolution,
n and k are time indices,
is the impulse response function of the filter,
is the k sample-delayed unit impulse.
Since the filter takes into account the previous measurement
K, it is able to highlight signal variation regularities. In the above relationship, the estimate is a linear combination of the current and previous samples. Hence, the weights
wk can be determined by fitting a linearizer between the sequence of samples and the measurement to be estimated. For this end data are required where both the instrument and the manikin are measuring the same environment with both varying and stationary quantities. A simple relationship that can be applied in engineering practice is described as follows.
where
is the current estimated PMV defined by the manikin,
is the PMV value of the TESTO IAQ instrument (Testo SE & Co. KGaA (Titisee-Neustadt, Germany)),
τ is previous time points,
and are the fitted parameters of the filter.
2.5. Statistical Methods
The Jamovi [
25,
26] statistical software package (version 2.6.17.0) has been used to evaluate the data. The aim of our analysis is to describe the relations between PMV calculated by each instrument and AMV values given by the subjects.
2.5.1. Filtering Outlier Values
Outlier values have been determined in two ways, examining each air velocity setting separately. In the first step, the PMV values calculated by the Testo IAQ instrument were plotted on a boxplot and the outlier cases per air velocity case were removed one by one. These are the cases where the Testo IAQ instrument measurements have been affected by some kind of interference in the laboratory. In a second step, inconsistent respondents were removed from the AMV responses.
2.5.2. Descriptive Results
Descriptive results are shown in the table below, where “T_PMV” is the PMV value from the Testo IAQ instrument, “P_PMV” is the estimate of the discrete compensation term from the Testo IAQ instrument results as described above, “M_PMV” is the PMV value calculated by the manikin, and “AMV” and “Air velocity subj.” are the responses of the human test subjects.
2.5.3. Hypothesis Testing
We first analyzed the responses of human subjects to verify whether they perceived differences between the experimental settings. To test statistically significant differences between multiple independent groups, we used the Kruskal–Wallis test, a non-parametric alternative to one-way ANOVA that does not assume normal distribution of the data.
When the Kruskal–Wallis test indicated a significant difference, we conducted a Dwass–Steel–Critchlow–Fligner (DSCF) post hoc test, which performs pairwise comparisons between groups while controlling the family-wise error rate in non-parametric settings.
3. Results
During our research, the main parameters measured were PMV and PPD values, but for validation purposes, all important physical parameters were measured: Air speed, air temperature, humidity, CO
2 concentration, globe temperature. The minimum, maximum and average values of the measured physical parameters are shown in
Table 3.
Referring to
Table 4, it can be observed that both the PMV result provided by the thermal manikin and the estimate calculated from the Testo IAQ instrument results are closer to the participants’ responses than the Testo IAQ instrument results in itself.
As shown in
Table 5, the non-parametric one-way ANOVA indicates significant differences in both AMV and subjective air velocity across the three air velocity settings.
Table 6 reveals that participants were able to distinguish between certain settings based on AMV. However,
Table 7 shows no significant differences in subjective air velocity ratings across the same air speed pairs within the comfort range. This suggests that while changes in air speed were detected and reflected in AMV, participants may have perceived these changes more as variations in temperature rather than as differences in airflow intensity.
As shown in
Table 8, the thermal parameters measured at different air velocity gradients indicate that, under steady-state conditions, there were no significant differences between the values obtained from the thermal manikin, the Testo IAQ instrument, and the subjective responses collected through the questionnaires. Therefore, the data measured with the thermal comfort station and the thermal manikin represent the real human thermal sensation. They are therefore suitable for determining the weights of the formula presented earlier.
To determine the weights, the experimental data were subsampled to 1 min resolution and then fitted with several linearizations at increasing
K. During the alignments, we found that the quadratic error did not decrease after including
K4 additional retrospective data. This corresponds to a five-minute time window, by definition. The optimal weights fitted to the experimental data are shown in
Table 9 up to
K = 4.
We observed that with increasing K, the weights wk are of the same order of magnitude and positive, which can be interpreted as an integrating effect, which is assumed to be related to the thermal inertia of the manikin.
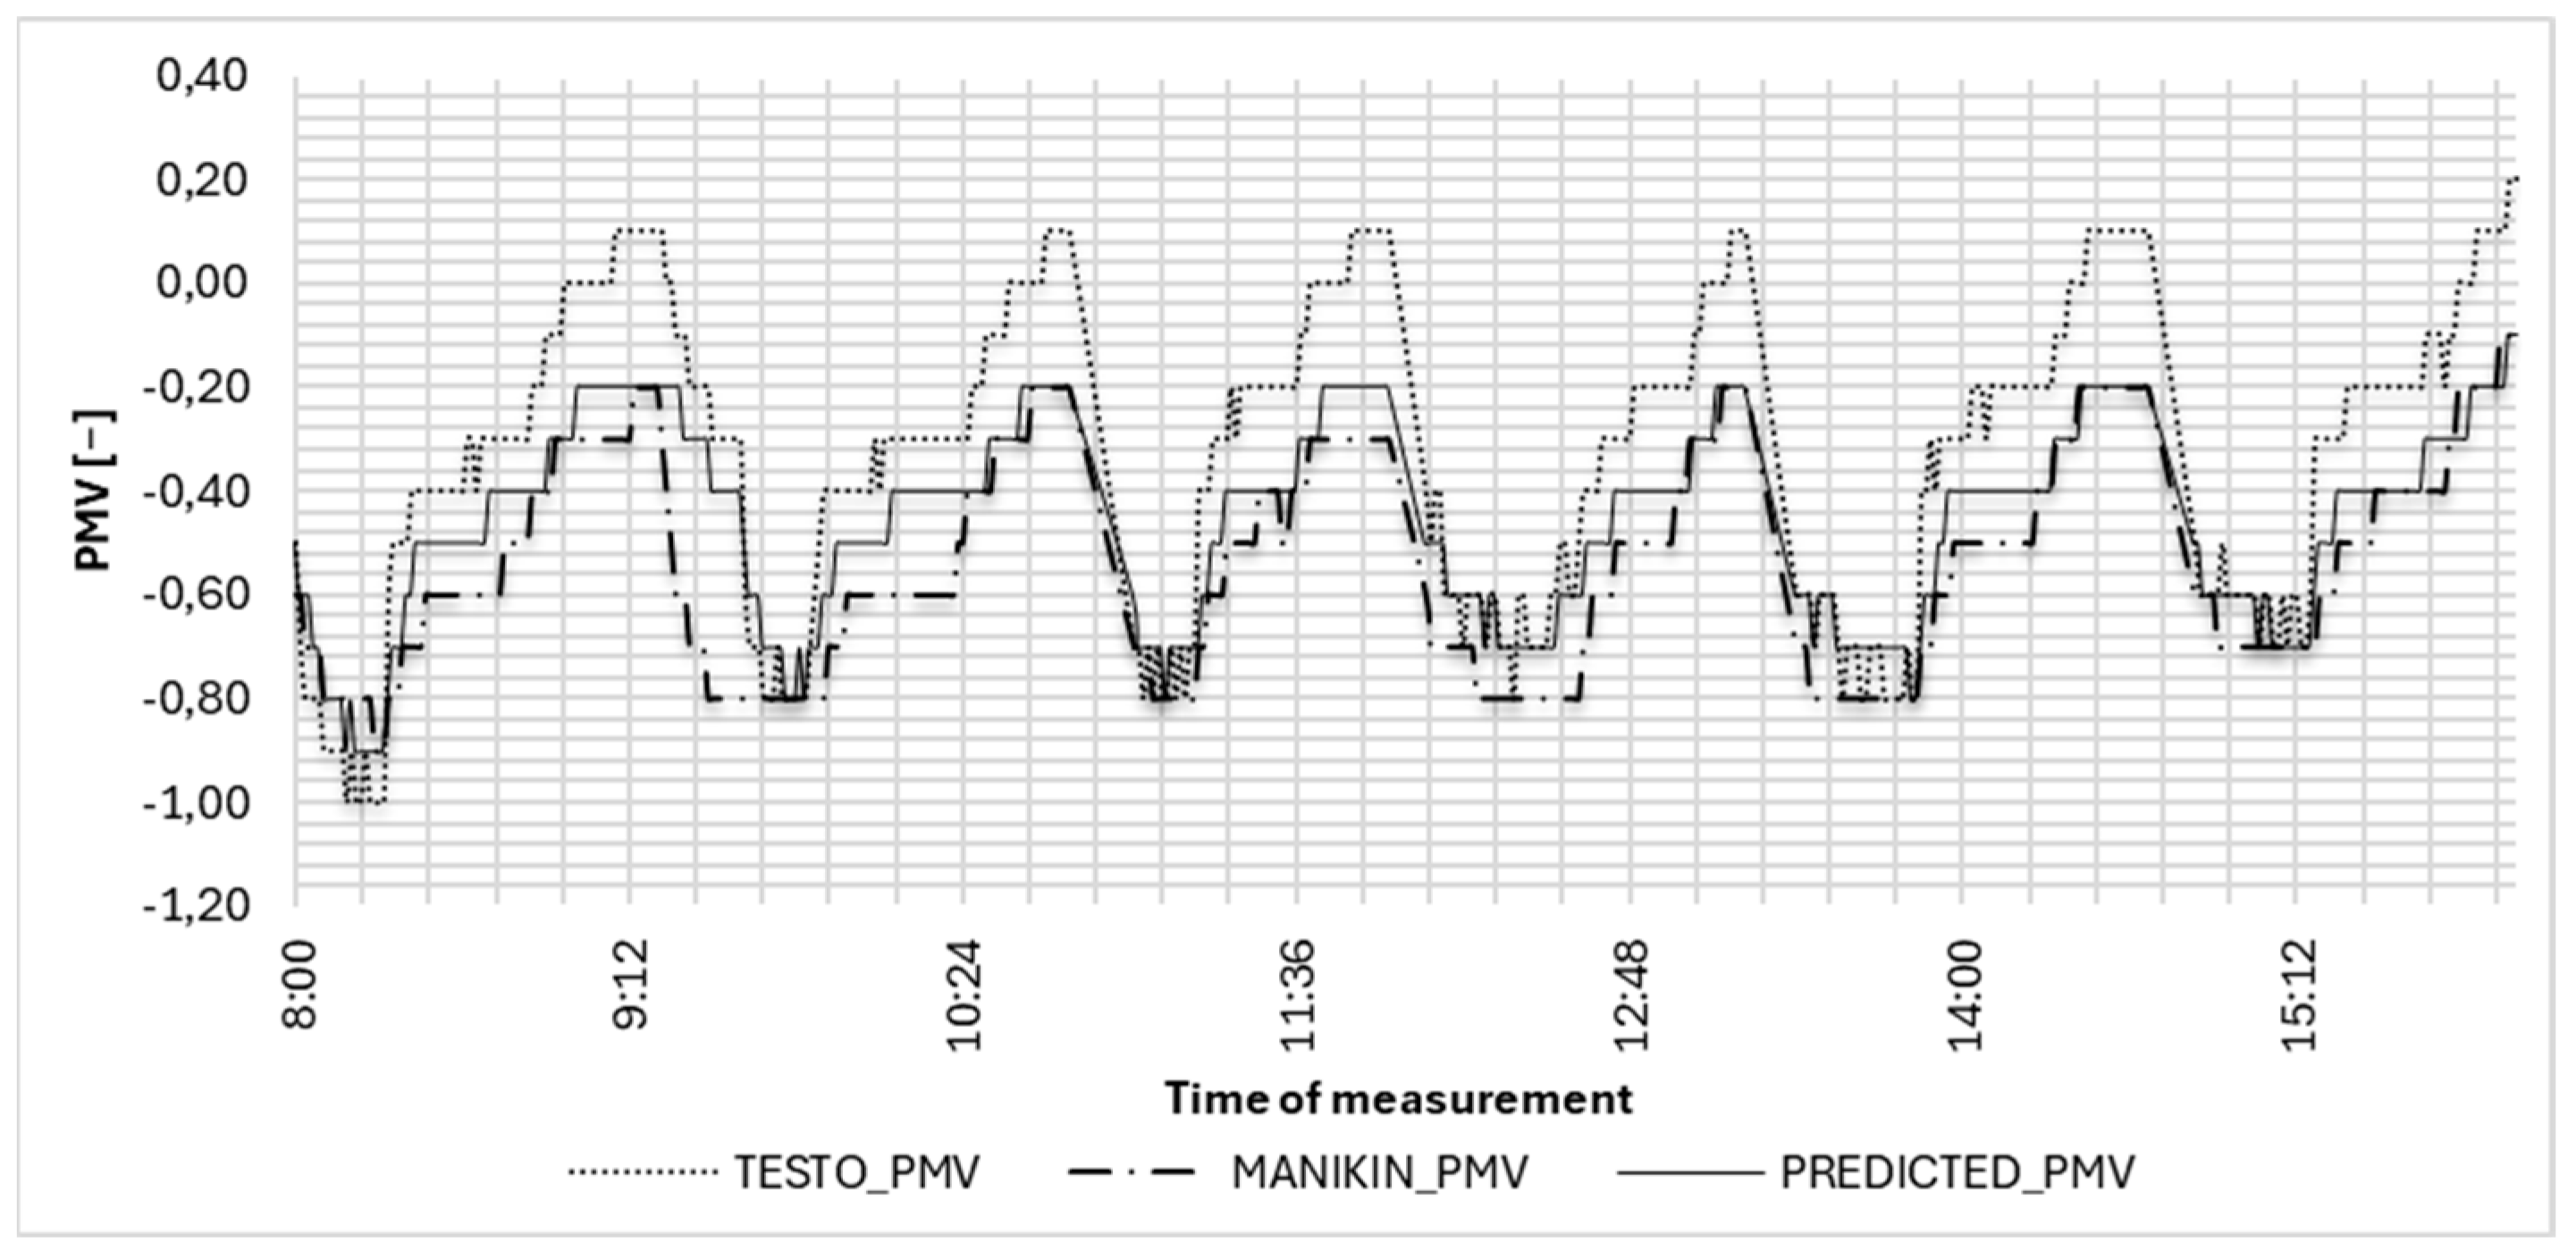
Also, for the
K = 4 time window,
Figure 6 shows the estimation curve for a one-day example. The figure shows two consequences of the integrating effect—in the static case the fluctuations of the Testo instrument disappear from the estimated curve, and in the dynamic case the larger run-ups or run-downs are less steep.
4. Discussion
Our results highlight a key limitation of the standard PMV model: it does not adequately reflect thermal sensation under dynamic environmental conditions. While PMV values measured by both the thermal manikin and the IAQ instrument showed good agreement with subjective ratings (AMV) in steady-state scenarios, their accuracy diverged under fluctuating conditions.
The thermal manikin, with its built-in thermal inertia, consistently produced PMV values that more closely matched human responses than the instantaneous readings of the IAQ instrument. This aligns with the findings of Huang and Togawa [
10], who demonstrated measurable delays in human thermal response due to the skin’s thermal inertia. Our FIR filter-based compensation method emulates this delay using sensor data alone, offering a practical and reproducible estimation strategy.
The filter’s effective time window—approximately five minutes—reflects the need to integrate short-term environmental history into comfort estimation. This result is consistent with observations by Ji et al. [
27], who found that thermal comfort evaluations depend strongly on recent thermal exposure. Unlike adaptive comfort models that rely on long-term adaptation or subjective preferences, our method focuses on short-term physical trends, making it suitable for real-time system integration.
Participants in our study reliably distinguished between measurement blocks with different thermal settings, based on their AMV responses. However, they did not perceive significant differences in airspeed within the comfort range. This supports findings by Tanabe and Kimura [
19], who observed that airflow at low velocities is often interpreted as a change in thermal sensation rather than mechanical airflow. Our results further confirm that subtle airspeed changes within comfortable limits affect perceived temperature more than airflow awareness.
We believe that the proposed method provides a simple yet robust way to improve thermal comfort prediction in real-world conditions. It enhances real-time estimation of perceived comfort using readily available sensor data, without requiring detailed physiological modeling or long-term adaptation profiles. In this sense, the method extends previous work on spatial comfort mapping by Borsos et al. [
2] and Cakó et al. [
3], by introducing a time-aware correction mechanism that captures the delayed nature of comfort perception in dynamic indoor environments.
5. Conclusions
In this study, we developed and validated a method for estimating instantaneous thermal sensation under non-stationary conditions by incorporating the effects of thermal inertia. Traditional PMV measurements, based on fast-response instruments, failed to capture the delayed thermal response of the human body during dynamic environmental changes.
By applying a discrete-time FIR filter to high-resolution sensor data, we successfully approximated the PMV values provided by a thermal manikin, which better reflected subjective human comfort ratings. This model captures the integrating behavior of thermal sensation over time and enables real-time correction of PMV readings without the need for complex physical simulation.
The proposed method improves the accuracy of thermal comfort estimation in dynamic indoor environments and can be implemented as a lightweight algorithm in comfort-monitoring and HVAC control systems. Future research will extend the validation to more extreme comfort scenarios and larger subject groups, and may explore personalized filter parameters to account for individual thermal responses.
However, the proposed model also has limitations. The filter parameters were derived from a specific set of environmental conditions and a relatively homogeneous subject group, which may limit generalizability. The method assumes linearity and time-invariance in the thermal response, which might not hold in cases involving metabolic changes, variable clothing insulation, or abrupt environmental transitions. Additionally, the FIR filter is not personalized; it does not yet account for inter-individual variability in thermal sensitivity. Future work should explore adaptive or individualized filter tuning and test the model under a wider range of comfort conditions, including extreme cold and heat. The inclusion of larger numbers of subjects may be necessary, as a larger sample is more likely to produce a better approximation of PMV and AMV values.
In further studies, it is advisable to vary the comfort parameters over a wider range, below 1.5 PMV and above 1.5 PMV, to obtain meaningful results.
Author Contributions
Conceptualization, L.L. and B.C.; methodology, L.L. and B.C.; software, Z.K. and A.T.G.; validation, A.T.G., Z.K. and J.G.; formal analysis, J.G., M.E.M. and Á.B.; investigation, Z.K.; data curation, Z.K., L.B. and G.L.; writing—original draft preparation, L.L.; writing—review and editing, B.C.; visualization, A.T.G., Z.K. and Á.B.; supervision, B.C. All authors have read and agreed to the published version of the manuscript.
Funding
The research did not receive any funds; APC is funded by the University of Pécs, Faculty of Engineering and Information Technology.
Data Availability Statement
The original contributions presented in the study are included in the article, further inquiries can be directed to the corresponding author.
Acknowledgments
We thank A.L. for their support in the data analysis and A.Ó. for their support in the physical measurements.
Conflicts of Interest
The authors declare no conflicts of interest. The funders had no role in the design of the study; in the collection, analyses, or interpretation of data; in the writing of the manuscript; or in the decision to publish the results.
References
- ISO 7730:2005; Ergonomics of the Thermal Environment—Analytical Determination and Interpretation of Thermal Comfort Using Calculation of the PMV and PPD Indices and Local Thermal Comfort Criteria. ISO: Geneva, Switzerland, 2005.
- Borsos, Á.; Zoltán, E.; Pozsgai, É.; Cakó, B.; Medvegy, G.; Girán, J. The Comfort Map—A Possible Tool for Increasing Personal Comfort in Office Workplaces. Buildings 2021, 11, 233. [Google Scholar] [CrossRef]
- Cakó, B.; Zoltán, E.S.; Girán, J.; Medvegy, G.; Miklós, M.E.; Nyers, Á.; Grozdics, A.T.; Kisander, Z.; Bagdán, V.; Borsos, Á. An Efficient Method to Compute Thermal Parameters of the Comfort Map Using a Decreased Number of Measurements. Energies 2021, 14, 5632. [Google Scholar] [CrossRef]
- Semprini, G.; Jahanbin, A.; Pulvirenti, B.; Guidorzi, P. Evaluation of Thermal Comfort Inside an Office Equipped with a Fan Coil HVAC System: A CFD Approach. Future Cities Environ. 2019, 5, 14. [Google Scholar] [CrossRef]
- Miltiades, C.A. Your HVAC System Can Manage Its Own Energy Use: Advantages of Variable Refrigerant Flow (VRF) Zoning Systems. Energy Eng. 2014, 111, 32–40. [Google Scholar] [CrossRef]
- Lin, C.-M.; Liu, H.-Y.; Tseng, K.-Y.; Lin, S.-F. Heating, Ventilation, and Air Conditioning System Optimization Control Strategy Involving Fan Coil Unit Temperature Control. Appl. Sci. 2019, 9, 2391. [Google Scholar] [CrossRef]
- Yau, Y.H.; Rajput, U.A.; Rajpar, A.H.; Lastovets, N. Effects of Air Supply Terminal Devices on the Performance of Variable Refrigerant Flow Integrated Stratum Ventilation System: An Experimental Study. Energies 2022, 15, 1265. [Google Scholar] [CrossRef]
- Charles, K.E. Fanger’s Thermal Comfort and Draught Models; National Research Council of Canada: Ottawa, ON, Canada, 2003.
- Gavin, H. Investigations of the Thermal Properties of Human and Animal Tissues. Ph.D. Thesis, University of Glasgow, Glasgow, UK, 1998. [Google Scholar]
- Huang, J.; Togawa, T. Measurement of the Thermal Inertia of the Skin Using Successive Thermograms Taken at a Stepwise Change in Ambient Radiation Temperature. Physiol. Meas. 1995, 16, 213–225. [Google Scholar] [CrossRef]
- Lipkin, M.; Hardy, J.D. Measurement of Some Thermal Properties of Human Tissues. J. Appl. Physiol. 1954, 7, 212–217. [Google Scholar] [CrossRef]
- Humphreys, M.A.; Fergus Nicol, J. The Validity of ISO-PMV for Predicting Comfort Votes in Every-Day Thermal Environments. Energy Build. 2002, 34, 667–684. [Google Scholar] [CrossRef]
- Grignon-Massé, L. Towards Adaptive PMV/PPD Indices for European Climates; ACEEE: Washington, DC, USA, 2008. [Google Scholar]
- Figueiredo Freitas Oliveira, A.M.; Corvacho, H. Application of Thermal Comfort Assessment Models to Indoor Areas near Glazed Walls—Experimental Evaluation. Rev. Construcción 2021, 20, 106–127. [Google Scholar] [CrossRef]
- Zhao, Q.; Lian, Z.; Lai, D. Thermal Comfort Models and Their Developments: A Review. Energy Built Environ. 2021, 2, 21–33. [Google Scholar] [CrossRef]
- ISO 15831:2004; Clothing—Physiological Effects—Measurement of Thermal Insulation by Means of a Thermal Manikin. ISO: Geneva, Switzerland, 2004.
- ISO 7726:1998; Ergonomics of the Thermal Environment—Instruments for Measuring Physical Quantities. ISO: Geneva, Switzerland, 1998.
- ISO 10551:2019; Ergonomics of the Physical Environment—Subjective Judgement Scales for Assessing Physical Environments. ISO: Geneva, Switzerland, 2019.
- Tanabe, S.; Kimura, K. Effects of Air Temperature, Humidity, and Air Movement on Thermal Comfort under Hot and Humid Conditions. ASHRAE Trans. 1994, 100, 953–969. [Google Scholar]
- Song, W.; Wang, F.; Wei, F. Hybrid Cooling Clothing to Improve Thermal Comfort of Office Workers in a Hot Indoor Environment. Build. Environ. 2016, 100, 92–101. [Google Scholar] [CrossRef]
- Huang, L.; Ouyang, Q.; Zhu, Y.; Jiang, L. A Study about the Demand for Air Movement in Warm Environment. Build. Environ. 2013, 61, 27–33. [Google Scholar] [CrossRef]
- Zhai, Y.; Zhang, H.; Zhang, Y.; Pasut, W.; Arens, E.; Meng, Q. Comfort under Personally Controlled Air Movement in Warm and Humid Environments. Build. Environ. 2013, 65, 109–117. [Google Scholar] [CrossRef]
- Ozalevli, E.; Huang, W.; Hasler, P.E.; Anderson, D.V. A Reconfigurable Mixed-Signal VLSI Implementation of Distributed Arithmetic Used for Finite-Impulse Response Filtering. IEEE Trans. Circuits Syst. I 2008, 55, 510–521. [Google Scholar] [CrossRef]
- Almasalma, H.; Albuquerque, R.J.; Caire, R.; Hadjsaid, N. An Enhanced Adaptive Data Processing Technique for Computing Synchrophasor Measurements under Power System Frequency Variation. In Proceedings of the 2015 IEEE Eindhoven PowerTech, Eindhoven, The Netherlands, 29 June–2 July 2015; pp. 1–6. [Google Scholar]
- The Jamovi Project. Jamovi, Version 2.6.17.0; The Jamovi Project: Sydney, Australia, 2024. Available online: https://www.jamovi.org/ (accessed on 14 March 2025).
- R Core Team. A Language and Environment for Statistical Computing; R Core Team: Vienna, Austria, 2021. [Google Scholar]
- Ji, W.; Cao, B.; Luo, M.; Zhu, Y. Influence of Short-Term Thermal Experience on Thermal Comfort Evaluations: A Climate Chamber Experiment. Build. Environ. 2017, 114, 246–256. [Google Scholar] [CrossRef]
| Disclaimer/Publisher’s Note: The statements, opinions and data contained in all publications are solely those of the individual author(s) and contributor(s) and not of MDPI and/or the editor(s). MDPI and/or the editor(s) disclaim responsibility for any injury to people or property resulting from any ideas, methods, instructions or products referred to in the content. |
© 2025 by the authors. Licensee MDPI, Basel, Switzerland. This article is an open access article distributed under the terms and conditions of the Creative Commons Attribution (CC BY) license (https://creativecommons.org/licenses/by/4.0/).


 ,
, 


