Article

Enhancing Construction Waste Transportation Management Using Internet of Things (IoT): An Evaluation Framework Based on AHP–FCE Method

by
Muhammad Ateeq
1,
Nan Zhang
2,3,
Wenbo Zhao
2,3,4,
Yaoqian Gu
5,
Ziying Wen
6,
Caimiao Zheng
2,3,4 and
Jianli Hao
2,3,4,*
1
School of Internet of Things, Xi’an Jiaotong-Liverpool University, Suzhou 215400, China
2
Jiangsu Province Engineering Research Center of Construction Carbon Neutral Technology, Suzhou University of Science and Technology, Suzhou 215011, China
3
Department of Civil Engineering, Xi’an Jiaotong-Liverpool University, Suzhou 215123, China
4
Faculty of Science and Engineering, University of Liverpool, Liverpool L69 3GH, UK
5
Nanjing Lianzhu Exhibition Engineering Co., Ltd., Room708, Building A3, South Plaza of Greenland, Intercity Space Station, 5 Jinlan Road, Jiangning District, Nanjing 210019, China
6
School of Civil Engineering and Architecture, Zhejiang Sci-Tech University, Hangzhou 310018, China
*
Author to whom correspondence should be addressed.
Buildings 2025, 15(8), 1381; https://doi.org/10.3390/buildings15081381
Submission received: 12 March 2025 / Revised: 9 April 2025 / Accepted: 14 April 2025 / Published: 21 April 2025
(This article belongs to the Section Building Materials, and Repair & Renovation)

Abstract

The transportation of construction waste involves various complexities, including logistics, monitoring, and resource management. Nevertheless, conventional transportation methods struggle to meet the combined requirements of environmental sustainability and efficiency in modern urban development due to problems such as high idle rates and insufficient management. The swift advancement of Internet of Things (IoT) technology offers an innovative solution for the intelligent and effective management of construction waste transportation in response to these issues. This study explores how IoT technology can enhance construction waste transportation management by developing an evaluation framework using the Delphi method, analytic hierarchy process (AHP), and fuzzy comprehensive evaluation (FCE). This research focuses on the application of IoT to optimize the transportation and logistics process through real-time monitoring and data analysis. The capability of IoT technology to analyze real-time data facilitates the modification of routes to minimize empty mileage and transportation time, thus improving transport efficiency. Ultimately, the potential and challenges of IoT in construction waste transportation management have been discussed.

1. Introduction

The transportation management of construction waste entails various challenges, including intricate logistics monitoring, resource allocation, and environmental conservation [1]. The explosive growth of the building sector necessitates finding creative and integrated technical solutions to improve the efficiency of construction waste transportation and minimize its environmental impact. With the explosive growth of the global construction industry, the volume of construction and demolition (C&D) waste is rapidly increasing, placing immense pressure on existing waste transport systems. Efficient management of C&D waste transportation is essential not only for mitigating environmental harm but also for improving urban sustainability and resource recovery. Internet of Things (IoT) technology, as an advanced information technology can realize real-time monitoring, data collection, and analysis, and has been widely used in various fields in recent years [2]. It is crucial to optimize the transportation route to save empty mileage and transit time, thereby enhancing transportation efficiency [3]. This paper aims to identify and evaluate the key challenges and factors affecting construction waste transportation management using IoT technology, develop an evaluation model through AHP and FCE methods, and propose improvements for practical application.
Each type of waste has different physical characteristics and treatment needs, which makes the transport process complex [4,5]. The transport of construction waste involves a series of challenges, such as high logistical complexity, lack of real-time monitoring, and irrational resource allocation. In traditional transport methods, construction waste usually relies on fixed transport routes and schedules, which leads to wasted resources and inefficient transport. The transportation of construction waste is mainly dependent on diesel vehicles, causing about 25% of carbon emissions [6]. The inefficiency and polluting nature of this mode of transport make the optimization of construction waste transport management an urgent issue for all countries.
Despite existing studies on IoT in construction waste transport, research focusing on management-level improvements is scarce. Several studies have explored IoT applications in waste management; however, few have focused specifically on management-level improvements in the context of construction waste transportation. This creates a research gap in understanding how IoT can be holistically integrated to improve transport efficiency, reduce emissions, and promote sustainable resource utilization. This paper can fill that gap by identifying and evaluating the key challenges and influencing factors in construction waste transportation management through IoT technology. Specifically, it develops an evaluation model using analytic hierarchy process (AHP) and fuzzy comprehensive evaluation (FCE) methods to analyze factor significance and propose targeted improvements for practical application. This study aims to examine how IoT technology can optimize construction waste transportation management in China’s transport sector. It will explore data transmission and processing technologies to improve efficiency and reduce costs while assessing the environmental and social implications of IoT adoption, particularly in promoting sustainable resource utilization. The remainder of this paper is structured as follows. Section 2 provides a comprehensive review of the literature concerning the applications, benefits, and challenges of IoT in construction waste transportation management. Section 3 outlines the research methodology, including the Delphi method, AHP, and FCE. Section 4 details the development of the evaluation model. Section 5 presents a critical discussion of the results, and Section 6 concludes this study with key findings and implications. Appendix A and Appendix B and references are included at the end for supplementary information and citation support. The research questions (RQs) to be addressed in this paper are as follows.
RQ1: what are the key factors impacting the efficiency of construction waste transportation management?
RQ2: which factors are the most critical in construction waste transport management according to AHP analysis?
RQ3: how can IoT technology improve the efficiency and sustainability of construction waste transport management?
RQ4: what are the challenges and trade-offs in implementing IoT systems for construction waste transport management, particularly in balancing privacy protection and data sharing?

2. Literature Review

2.1. Applications of IoT in Construction Waste Transportation

Firstly, IoT can enhance real-time monitoring and data acquisition [7]. Traditional construction waste transportation often relies on fixed routes and schedules, which often leads to inefficient transportation and waste of resources. Singh et al. [8] mentioned that an intelligent transportation system based on GPS and GIS can dynamically adjust transportation routes according to real-time road conditions and the demand of waste collection points, thus significantly reducing transportation costs and time. Henaien et al. [9] proposed and validated an IoT-based sustainable intelligent solid waste management system that achieves significant improvements and efficiency gains in several key aspects. By monitoring the status of garbage bins in real time, which reduces unnecessary garbage collection trips and achieves 100% efficiency, significant improvements can be made over traditional curbside collection methods. Rathore et al. [10] proposed that real-time monitoring technology helps optimize resource allocation, reducing waste and improving resource utilization by accurately locating and tracking equipment, materials, and people. The application of real-time monitoring technologies at the construction site has significantly improved construction efficiency, safety, and management accuracy.
Secondly, IoT can promote intelligent scheduling and route optimization. As the global population grows and urbanization accelerates, smart cities significantly improve the efficiency and quality of urban management and residents’ lives by integrating IoT and AI technologies. The number of IoT-connected devices worldwide is expected to exceed 29 billion by 2030, more than tripling from 2020 (from 9.7 billion to 29 billion), underscoring the potential for IoT to be widely used in smart cities [11]. Currently, about 30% of smart city applications significantly integrate IoT and AI technologies to enhance urban sustainability, resilience, and social well-being. Jagatheesaperumal et al. [12] found that intelligent transportation monitoring enhances safety by tracking vehicle status and driver behavior in real-time, issuing early warnings. Unlike fixed traffic signals, vision-based detection dynamically adjusts light durations, reducing accidents and vehicle overloading.
Thirdly, IoT can promote data integration and collaborative management. Eltoukhy et al. [13] proposed a data-driven model based on blockchain and game theory for managing resource allocation and vehicle routing in modular integrated buildings. By collecting and analyzing data generated by IoT devices in real-time, the model automatically adjusts transportation plans and optimizes resource allocation, thereby reducing transportation costs by 30%, time by 40%, and greenhouse gas emissions by 43%. At the same time, IoT technology can also be used to manage the classification and recycling of waste, improving the utilization of resources [14]. Furthermore, IoT technology enhances environmental protection and sustainability in construction waste transportation by monitoring vehicle emissions and enabling timely adjustments to reduce pollutant discharge.

2.2. Advantages of IoT in Construction Waste Transportation Management

Traditional construction waste transport methods often suffer from inefficiency, resource wastage, and a lack of real-time monitoring. The integration of IoT technology enables a shift towards intelligent and sustainable transport management by improving efficiency, reducing costs, and enhancing data transparency. By replacing manual scheduling with real-time data-driven decision making, IoT helps optimize transport plans, minimizing empty mileage and reducing transport time. Additionally, IoT enables real-time monitoring of fuel consumption, driving routes, and vehicle maintenance [15], allowing managers to identify inefficiencies and reduce resource waste. It also enhances safety by lowering the risks of accidents, equipment failures, and unexpected costs. Furthermore, automated data collection and processing provide all stakeholders with transparent and traceable transport data [16], improving overall management control.
Beyond operational benefits, IoT technology plays a crucial role in promoting sustainability in construction waste transportation. Carbon emissions from transport activities are an important source of pollution in the construction industry [8,17]. By optimizing transport routes and improving resource utilization, IoT significantly reduces energy consumption and emissions, fostering a greener and more sustainable industry. This integration of IoT not only enhances efficiency and cost-effectiveness but also aligns construction waste management with broader environmental goals, paving the way for a smarter and more eco-friendly future.

2.3. Challenges of IoT in Construction Waste Transportation Management

Sharma et al. [18] conducted a study in an Indian city, identifying 15 major barriers to smart city IoT implementation, which were analyzed using total explanatory structure modeling, fuzzy matrix of crossed impact multiplications applied to a classification, and decision-making trial and evaluation laboratory. As urbanization accelerates, with an estimated two-thirds of the world’s population expected to live in cities by 2050, waste management challenges will intensify. IoT technology is recognized as a key driver in smart city development, particularly in waste management. However, despite its advantages in construction waste transport management, IoT faces several challenges in practical application. High technology costs and implementation difficulties remain significant barriers, as the initial investment in sensors, hardware, and software can be prohibitively expensive for small and medium-sized construction companies. Additionally, integrating and maintaining IoT systems requires strong technical expertise, making adoption challenging for companies with limited technological capabilities.
Beyond financial and technical constraints, data security and privacy protection pose critical concerns. IoT devices collect sensitive data, including transport routes, vehicle locations, and personnel information, which, if not managed properly, can be vulnerable to breaches. Ensuring data security is essential for successful implementation [19]. Furthermore, the lack of data standardization and system compatibility hinders widespread adoption, as IoT hardware and software from different manufacturers may be incompatible [20,21]. Addressing these issues requires the development of standardized protocols to ensure seamless integration. Lastly, IoT systems demand skilled operators capable of handling data analysis and equipment management. Enterprises must invest in systematic training to equip personnel with the necessary technical expertise, ensuring that IoT technology can be fully leveraged for efficient construction waste transport management.

2.4. Methodological Developments and Research Gaps

In recent years, a range of methodologies have been adopted to address IoT-enabled construction waste management, including simulation modeling, optimization techniques, and hybrid intelligent systems. For instance, Henaien [9] developed and validated a smart waste collection system based on an IoT prototype, achieving 100% collection efficiency through real-time monitoring of bin status adopting the methods of IoT prototype validation. The system demonstrated limited scalability and did not incorporate a comprehensive life cycle assessment, highlighting areas for future improvement. Rao et al. [22] analyzed the recent advancements in sensor technologies and real-time monitoring techniques, concluding that these approaches significantly enhance construction site safety, efficiency, and activity tracking in both indoor and outdoor environments. Eltoukhy [13] proposed a blockchain and game theory-based model for modular building logistics that effectively reduced costs and greenhouse gas emissions, although it was not specifically designed to address the dynamic conditions of C&D waste.
Most studies focus on conceptual frameworks or pilot implementations, lacking the integration of advanced methods such as system dynamics, multi-objective optimization, or digital twin modeling, which are crucial for scalable and predictive decision support in complex construction waste logistics systems. Based on the previous research and the current research status, the research gaps that exist in these areas have been summarized in Table 1.

3. Methodology

3.1. Delphi Method

The Delphi method is a systematic forecasting and decision support method based on expert opinion, widely used for analyzing and forecasting uncertainty problems. It gradually encourages experts to reach a consensus on a specific issue through an anonymous and multi-round feedback mechanism [8,23]. The Delphi method, characterized by anonymity, iterative feedback, and statistical aggregation, is particularly useful for complex issues where clear conclusions cannot be drawn through experimentation or observation. Anonymity reduces expert interactions, avoiding authority effects and herd mentality, while multiple rounds of feedback allow experts to revise their views based on others’ input, gradually leading to consensus. This method is well suited for predicting future trends or analyzing multi-dimensional issues. For this study, the Delphi method offers a systematic expert consultation process to identify key factors impacting the efficiency of construction waste transportation management, ensuring that these factors reflect current technology applications and industry practices, thus providing a solid theoretical foundation for the subsequent quantitative analysis.
The average value signifies the collective acknowledgement by experts on the significance of an indicator, with elevated means suggesting a more favorable perception of its importance by the experts, which is calculated using Equation (1), where x ¯ represents the mean value, representing the overall recognition by experts on the importance of an indicator. x i is the rating given by the i t h expert for the indicator. n is the total number of experts.
x ¯ = i = 1 n x i n
The standard deviation quantifies the extent of variability in the experts’ judgments, where a lower standard deviation signifies that the experts’ assessments of the indicator are more aligned, and the ratings exhibit greater consistency, which is calculated using Equation (2), where S represents the standard deviation, indicating the dispersion of the experts’ ratings.
S = i = 1 n x i x ¯ 2 n 1
Conversely, the coefficient of variation, defined as the ratio of the standard deviation to the mean, is employed to evaluate the relative consistency of the experts’ evaluations, as shown in Equation (3), where c v represents the coefficient of variation, representing the relative consistency of the experts’ ratings. s represents the standard deviation. A lower coefficient of variation indicates greater consensus among experts regarding the significance of the indicator, with a coefficient below 0.25 typically regarded as indicative of strong agreement.
c v = s x
Equation (4) shows the coordination factor with no equal evaluation rating, where C f 1 represents the coordination factor, indicating the consistency of the experts’ ratings. m is the total number of indicators. d j represents the difference between the rating of the j t h indicator and the mean rating.
C f 1 = 12 m 2 n 3 n j = 1 n d j 2
Equation (5) shows the coordination factor with the same evaluation rating, where C f 2 represents the coordination factor adjusted for equal ratings. T i represents the adjustment factor for equal ratings.
C f 2 = 12 m 2 n 3 n m i = 1 m T i j = 1 n d j 2
The difference is calculated using Equation (6), where S j is the sum of ratings for the j t h indicator, and M s j represents the mean rating for the j t h indicator. The equal ratings adjustment factor is calculated using Equation (7), where L represents the number of evaluation groups in which expert i is the same. t i is the number of identical ratings in group L .
d j = S j M s j
T i = i = 1 L t 3 t i
If χ R 2 > χ α 2 , the coordination coefficient is considered to be significant after the test, which means that the expert’s assessment opinion is well coordinated, and the result is desirable. On the contrary, if the value of χ R 2 is very small, the higher the probability is of the non-accidental coordination of the expert group’s opinion. At a 95% confidence level, if p > 0.05, it is considered that the expert’s opinion will be insufficiently confidently coordinated in terms of non-accidental coordination, that the credibility of the assessment conclusions will be poor, and that the results of the evaluation will not be desirable. The significance test of the coordination coefficient is shown in Equation (8).
χ R 2 = 1 m n n + 1 1 n 1 i = 1 m T t j = 1 n d j 2 ~ χ 2 n 1

3.2. Analytical Hierarchy Process (AHP) Method

On the basis of an in-depth analysis of the actual problem, the relevant factors are decomposed into a number of levels in accordance with different attributes, and the factors at the same level are attributed to the factors at the higher level or have an impact on the higher level factors, while at the same time dominating the factors at the lower level or being affected by the role of factors at the lower level [24]. In the analytic hierarchy process (AHP), the research objective is decomposed into multiple criteria and sub-criteria, with relationships between factors represented through a hierarchical structure, forming a multilevel model to analyze their interrelated effects and aggregated contributions at different levels [25]. At each level, factors are compared pairwise to determine their relative importance and weights in relation to the target level [26]. This process ultimately reduces the problem of establishing the relative importance or ranking of the lowest level factors compared with the highest level objective, facilitating a structured evaluation of strengths and weaknesses.
Starting from the second level of the hierarchical model, the judgement matrix is constructed by a two-by-two comparison method for the factors belonging to each factor of the previous level until the last level. The weight of each factor is calculated through a pairwise comparison of the factors by experts. Experts will assess the importance of different influencing factors based on their understanding of construction waste transport and IoT technologies to obtain relative weight values. The range of scale value is shown in Table 2.
For each judgement matrix, its largest characteristic root and corresponding eigenvector are computed and tested for consistency using the consistency index, random consistency index, and consistency ratio. If the test passes, the feature vector is the weight vector after normalization. Conversely, the judgement matrix should be reconstructed. The consistency index ( C I ) in the consistency test formula Equation (9) is as follows:
C I = λ m a x n n 1
where λ m a x is the largest characteristic root of the judgement matrix and n is the order of the matrix. The consistency ratio C R is calculated using Equation (10). The overall hierarchy consistency is calculated using Equation (11), where m is the number of primary indicators and R I is the average random consistency indicator. When C R < 0.1, the consistency of the judgement matrix is considered acceptable. When C R > 0.1, the judgement matrix should be appropriately corrected.
C R = C I R I
C R = i = 1 m w i C I i i = 1 m w i R I i

3.3. Fuzzy Comprehensive Evaluation Method

Fuzzy comprehensive evaluation (FCE) introduces the concept of an affiliation function to quantify human intuition as specific coefficients, addressing the limitations of traditional mathematical methods that seek a “unique solution” by providing multiple levels of solutions based on varying possibilities [27,28]. As a multi-criteria decision-making method rooted in fuzzy mathematics, FCE is particularly suited for evaluating complex, vague, and uncertain decision-making problems. It transforms qualitative evaluation criteria into fuzzy sets and employs fuzzy operations to assess various factors, ultimately deriving a comprehensive decision-making result. In this study, FCE is utilized to evaluate the effectiveness of IoT applications in construction waste transport management and their impact on improving transport efficiency, following a structured process to analyze and interpret the results.
The first step is to divide the evaluation objective (the set of factor domains U) into S subsets according to attribute using Equation (12), where U i refers to the different factors and U i = { u 1 , u 2 , u 3 u s } refers to the individual influencing factors in the evaluation system.
U = U i = 1 s U i
The second step is to construct the evaluation set of the model through fuzzy evaluation language and specific values using Equation (13), where v 1 refers to different evaluation levels.
V = v 1 , v 2 , , v m
The third step is to determine the weight set using Equation (14), which can be based on the combined weights of the factors determined by the hierarchical analysis method. The fourth step is that, for the constructed evaluation set, the affiliation of each factor is scored directly by expert scoring, and the affiliation vector R i = r i 1 , r i 2 r i n is constructed for each factor.
W i = a i 1 , a i 2 a i n
This is used as the basis for constructing the fuzzy evaluation affiliation matrix R according to Equation (15).
R i = R 1 R 2 R n = r 11 r 12 r 1 n r 21 r 22 r 2 n r s 1 r s 2 r s n
The fifth step is to multiply the corresponding set of factor weights with the constructed comprehensive evaluation affiliation matrix to obtain the final fuzzy comprehensive evaluation set B according to Equation (16).
B = W i R i = a i 1 a i 2 a i n × r 11 r 12 r 1 n r 21 r 22 r 2 n r s 1 r s 2 r s n
Then, the indicator scores are calculated by multiplying the fuzzy comprehensive evaluation set B with the value of the corresponding grade using Equation (17). Finally, the maximum affiliation degree in the target layer evaluation model is taken as the final judgement result. According to the principle of maximum affiliation, the final comprehensive evaluation result can be obtained.
S = B × H
To systematically evaluate the key factors affecting the efficiency of construction waste transportation management and the application effects of IoT technologies, this study integrates the Delphi, AHP, and FCE methods. First, the Delphi method (Equations (1)–(8)) is used to achieve expert consensus through iterative feedback, calculating statistical indicators such as mean (Equation (1)), standard deviation (Equation (2)), coefficient of variation (Equation (3)), and coordination coefficients (Equations (4)–(8)) to assess the consistency and significance of expert opinions. Next, the AHP method (Equations (9)–(11)) decomposes the evaluation goal into a hierarchical structure, constructs pairwise comparison matrices, and calculates weights through consistency tests to ensure rational judgments. Finally, the fuzzy comprehensive evaluation method (Equations (12)–(17)) transforms qualitative assessments into quantitative values using membership functions, builds an evaluation matrix, and integrates it with weights to derive a final evaluation score, enabling a comprehensive and structured assessment of IoT effectiveness in transport management.
AHP is a well-established method for multi-criteria decision making that helps decision makers structure complex problems and evaluate alternatives based on multiple criteria. AHP was selected for this study due to its simplicity, transparency, and the ease with which it can handle both qualitative and quantitative data. However, we acknowledge that AHP has several limitations. One of the key drawbacks is the potential for inconsistency in pairwise comparisons, as the process relies heavily on the subjective judgment of experts, which can lead to inconsistencies if not carefully managed. Additionally, AHP assumes that criteria are independent, which may not always reflect real-world situations where interdependencies between criteria exist.
Despite these limitations, AHP remains a popular choice in decision-making research due to its widespread application and established track record in various fields, including sustainability assessments. However, it is important to note that alternative methods could also be employed to address some of the limitations of AHP. Nevertheless, we argue that fuzzy logic is more suitable for this study, given the nature of the data and the inherent uncertainty in sustainability assessments. Fuzzy logic allows for greater flexibility in modeling ambiguous or imprecise information, which is often encountered when evaluating sustainability criteria. Unlike methods like AHP or COBRAC, which rely on more rigid structures, fuzzy logic enables the incorporation of partial membership degrees, offering a more nuanced understanding of the criteria. This makes fuzzy logic particularly effective in dealing with the uncertainty and subjectivity that are common in sustainability decision making, making it the more appropriate choice for the present study.

4. Evaluation Model Development

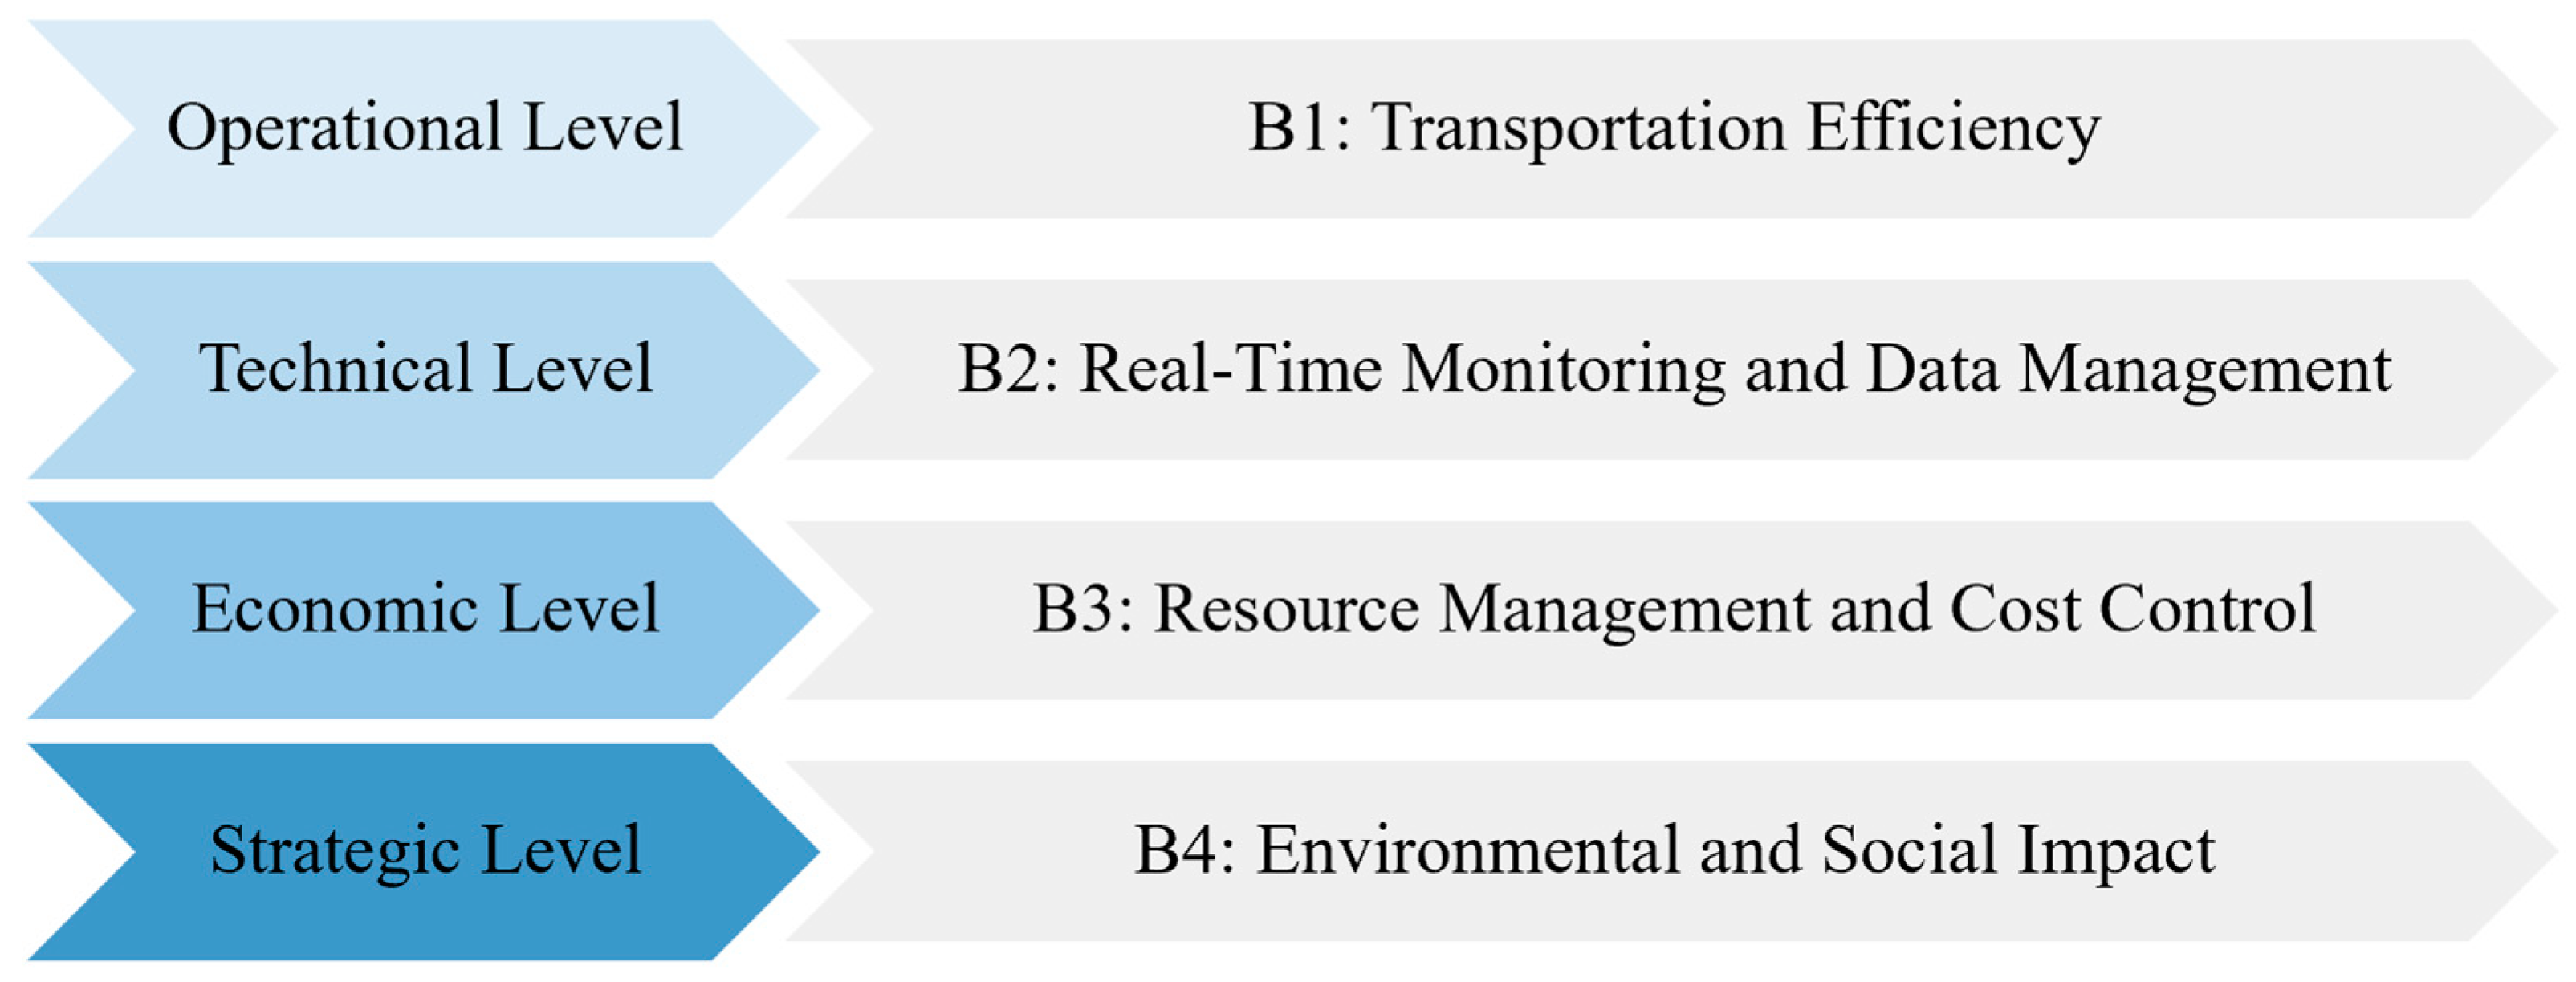
4.1. The Identification of Indicators

The division of the four primary indicators is based on the different dimensions of the objectives to be achieved by IoT in construction waste transport management [29], as shown in Figure 1 and Table 3. The gradual progression from the operational level (efficiency improvement), the technical level (technical support), the economic level (resource optimization), and the strategic level (environmental and social benefits) constitutes a systematic analysis framework.
The selection of criteria for the construction waste transport management model is based on the need to address efficiency, technical support, economic optimization, and sustainability through a systematic framework. The operational level focuses on improving transportation efficiency, while the technical level emphasizes real-time monitoring, data accuracy, and anomaly detection. The economic level aims to optimize resource management and reduce costs, including fuel and equipment maintenance. The strategic level considers environmental and social impacts, such as carbon emissions, resource recycling, community feedback, and regulatory compliance, aligning with sustainable development goals. This comprehensive approach integrates both operational and long-term sustainability objectives in IoT-based transportation management.
Experts rich in knowledge and experience were invited from the relevant fields to ensure that their background matches the research topics shown in Table A1. The survey maintained the anonymity of experts throughout the process to prevent expert opinions from influencing each other and to ensure independence. In the first round, experts scored the importance of indicators and provided opinions on key factors. The results are shown in Table A2 and Table A3.
To assess the community’s perspective on the impact of construction waste transportation activities, data were collected through a combination of surveys and focus group discussions. Surveys were distributed to a representative sample of local residents, gathering their opinions on noise pollution, traffic congestion, and other social factors associated with transportation activities. Focus groups were conducted with community members to gain a deeper understanding of public concerns and suggestions for improving the transportation management system. These methods ensured that the community’s feedback was comprehensive and reflected diverse viewpoints, providing a solid basis for evaluating the social impact of IoT-based transportation management.
Based on the primary indicator results, a mean of 5.0000 and no standard deviation was considered the most important and should be prioritized in the core evaluation model. B3 and B4, with mean values of 4.5000 and 4.4167, also showed high importance, while B1 had a wider rating range from 3 to 5, indicating some disagreement. The chi-square test ( χ 2 = 9.6667, p = 0.0216) revealed significant consistency in experts’ ratings. It was recommended to refine B2’s secondary indicators and clarify B1 to reduce disagreement. Kendall’s Wa coefficient indicated high expert agreement on secondary indicators. C8, C2, and C18 had the highest scores and should be core indicators, while C5 and C7 also showed high ratings and consistency. C12 and C14, with lower ratings and higher expert disagreement, should be removed from the model. C12 overlapped with other B3 indicators, and C14 should be included in C16. C9, with low scores and high divergence, may need redefining, as experts believed C18 covered it. After integrating experts’ opinions, the original 18 evaluation factors were consolidated into 16.
Based on the first round of questionnaires, duplicate and redundant indicators were removed and key indicators not covered were added. Thus, indicators C12 and C14 were deleted, C9: Privacy Protection was changed to C9: Data Visualization based on the experts’ comments, and the second round of the expert questionnaire was continued. The results of the second-round survey are shown in Table A4 and Table A5.
In the second round of the Delphi method, B2 remained fully endorsed by experts with a mean of 5.0 and no disagreement. B1 showed a concentration of ratings between 4 and 5, with an improved mean of 4.6667 and a lower coefficient of variation of 0.1055, indicating greater experts’ agreement. B4 had a more concentrated rating, and B3 had a mean of 4.4167 with a coefficient of variation of 0.1166. Overall, Kendall’s coefficient of concordance improved from 0.2685 to 0.2904, and the chi-square test, p = 0.0151, confirmed significant consistency in experts’ ratings of the primary indicators.
The second-round survey results on secondary indicators showed that all indicators met experts’ consensus. Kendall’s coefficient of concordance was 0.5082, and the chi-square test, p < 0.001, confirmed statistical significant consistency. C8 had the highest rating, followed by C2 and C16, indicating their central role. C7 scored 4.6667 with a coefficient of variation of 0.1055, showing strong expert agreement. C5, C1, C4, C12, and C15 all had mean values above 4.50 and low variation, indicating high recognition. C3, C6, and C14 had slightly lower mean values but still showed experts’ consensus (coefficients of variation < 0.25). C9, C10, and C11 had lower ratings, from 2.5833 to 3.3333, but met the variation criteria, indicating their value in specific contexts. C13 scored 3.8333 with a coefficient of variation of 0.1872, showing high consistency. In conclusion, the core indicators, including C8, C2, C16, and C7, and key indicators including C5, C1, C4, C12, and C15, passed experts’ consistency criteria, while the remaining indicators were complementary, providing a solid foundation for the evaluation model, as shown in Table 4.
To enhance the transparency of the evaluation model, the Delphi method was employed to refine and optimize the selection of indicators based on expert consensus. In the first round, experts identified redundant and overlapping indicators, leading to the removal of C12 (Transportation Costs), which overlapped with other resource management indicators, and C14 (Carbon Emissions), which was integrated into the broader sustainability assessment framework (C16). Additionally, C9 (Privacy Protection) was considered unnecessary as privacy-related concerns were already covered by C18 (Regulatory Compliance), and thus C9 was replaced with C9: Data Visualization, aligning with the evolving needs of IoT-based construction waste transport management. These modifications resulted in a more concise and effective evaluation model, retaining only the most impactful indicators while eliminating redundancy. Statistical analyses, including Kendall’s coefficient of concordance and chi-square tests, confirmed the consistency and validity of these decisions, ensuring expert alignment and refining the model for practical application.

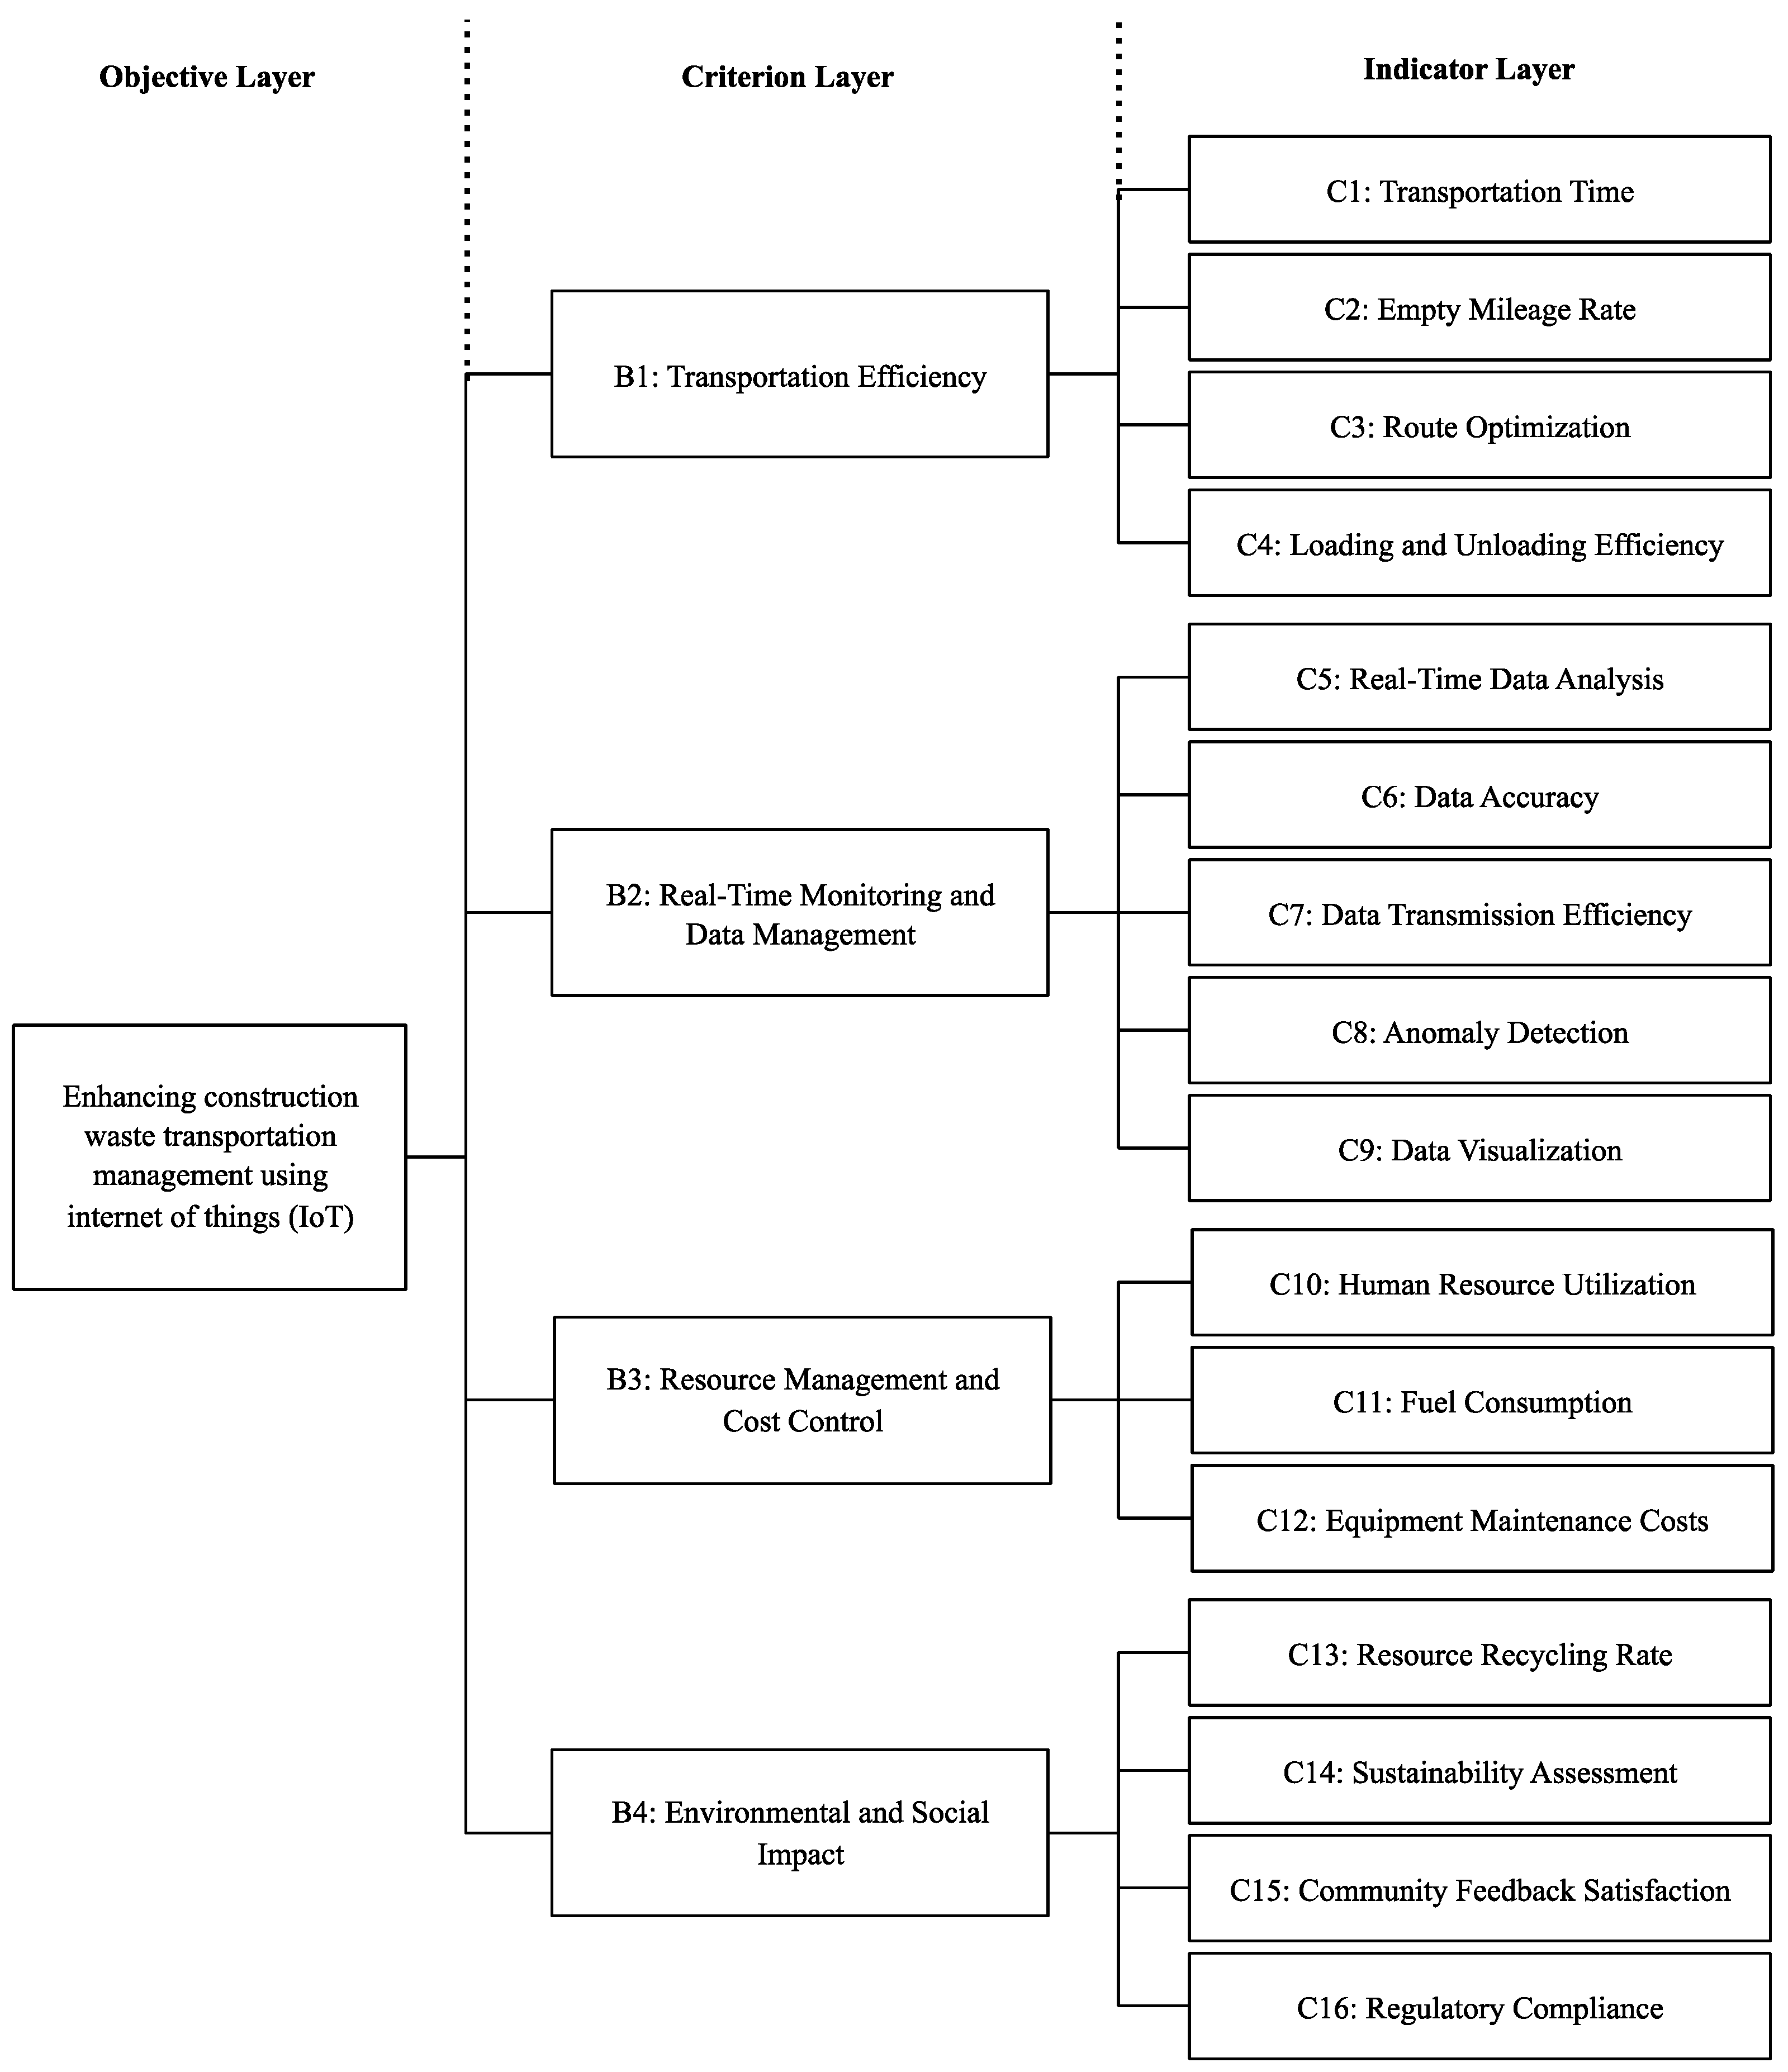
4.2. Establishment of the Hierarchical Model

According to the evaluation model of using IoT to strengthen construction waste transport management, indicators were constructed by combining the structural model of the hierarchical analysis method, and the evaluation of using IoT in construction waste transport management was identified as the objective layer. The hierarchy structure of the model is shown in Figure 2.
The judgement matrix for the criterion layer is shown in Table A6, which is used to describe the two-by-two relative importance between criterion layers (B1, B2, B3, B4). The values in the matrix indicated the proportion of importance of one criterion relative to the other in the weighting calculation. Taking the judgement matrix of the criterion layer as the object of study, the geometric mean was calculated by rows according to the following Equation (18). According to the geometric mean method in accordance with the following formula Equation (19), the normalization process can be used to calculate the weight of each indicator ( w i ). After finding the matrix weight judgement vector, the maximum characteristic root ( λ ) of matrix A was found according to the matrix maximum characteristic root solution formula, as shown in Equation (20).
w i ¯ = j = 1 m a i j m
w i = w i ¯ i = 1 n w i ¯ i = 1 ,   2 ,   3 ,   4 ,   5
λ = i = 1 n A W i n w i
Based on the scoring table of each indicator level as shown in Table A7, the degree of affiliation R i should be the ratio between the number of experts assigning a value V i to an indicator and the total number of experts. After the normalization of each indicator, the affiliation matrix of the evaluation was constructed, as shown in Table 5. After completing the fuzzy comprehensive evaluation of the criterion layer, a fuzzy comprehensive evaluation table of the objective layer was formed according to the principle of maximum affiliation, as shown in Table 6.
The final results in Table 5 and Table 6 were obtained through a multi-step process. First, the judgment matrix for the criterion layer (Table A6) was used to determine the relative importance of the criteria B1, B2, B3, and B4 by applying the geometric mean method. Following the geometric mean calculation, normalization was performed to derive the weights for each criterion. The maximum characteristic root of the matrix was then calculated to evaluate the consistency of the judgment matrix. For each secondary indicator, the degree of affiliation was computed by determining the ratio of experts, assigning a particular value to each indicator, as shown in Table 5. The affiliation matrix for the evaluation was constructed by normalizing these values. Finally, a fuzzy comprehensive evaluation was conducted based on the principle of maximum affiliation, leading to the classification of the primary indicators (B1, B2, B3, B4) as excellent, good, fair, poor, or very poor, as presented in Table 6.

5. Discussion

This study identified key factors influencing the efficiency of construction waste transport management through a comprehensive evaluation system. After two rounds of expert surveys, 16 core evaluation indicators were identified, including transportation time, empty mileage rate, route optimization, real-time data analysis, and data accuracy. These findings provided a robust theoretical foundation for the subsequent AHP analysis. Using the AHP method, a hierarchical model was constructed to quantify the weights of the indicators. The results highlighted that B2: Real-Time Monitoring and Data Management and B4: Environmental and Social Impact were the most critical factors, with weights of 0.3177 and 0.2799, respectively. Among individual indicators, C1: Real-Time Monitoring had the highest weight (0.1514), underscoring its centrality in construction waste transport management.
The FCE method further validated the evaluation model, with expert scoring revealing that most indicators were rated as “good”, indicating the system’s effectiveness. Notably, C5: Real-Time Data Analysis and C3: Route Optimization received high ratings, reflecting their practical significance in improving transport efficiency. However, this study also identified areas for improvement, such as balancing privacy protection and data sharing in IoT systems, a topic less explored in existing research. While some experts emphasized the importance of privacy protection, this study found that data visualization and information transparency are more critical for fostering collaboration in construction waste management. This suggests that companies and governments need to carefully navigate the trade-offs between privacy and data sharing when implementing IoT systems.
In light of growing concerns about data privacy and cybersecurity in IoT applications, this study recognizes the urgent need to align IoT-based construction waste transport systems with global regulatory frameworks. Regulatory initiatives such as the EU’s General Data Protection Regulation and China’s Personal Information Protection Law emphasize the importance of data minimization, informed consent, and secure data processing. To enhance the real-world applicability of IoT systems, the implementation of recommended cybersecurity measures, such as end-to-end encryption, multi-factor authentication, and real-time anomaly detection, should be prioritized. These measures not only protect sensitive operational and location-based data but also build stakeholder trust and foster wider adoption of IoT technologies in construction waste management. Future research could explore how to operationalize these regulations in specific construction contexts and investigate the balance between regulatory compliance and system performance.
While Fredriksson [49] highlighted equipment maintenance costs as a key factor in construction waste management, experts in this study rated its importance lower than expected. This discrepancy may be attributed to the increased automation of IoT technologies, which reduces the frequency of equipment failures and repairs, thereby diminishing the focus on maintenance costs. On the other hand, regulatory compliance was highly recognized as a critical factor, reflecting the need for IoT technologies to align with China’s unique policy environment. This contrasts with the international literature, such as Bibri [59], which emphasizes the role of regulations in technology adoption, highlighting the profound influence of China’s policy framework on technology implementation.
The findings of this study have significant theoretical and practical implications for construction waste transport management, IoT technology application, and smart city development. Theoretically, this study enriches the framework for integrating IoT technology into construction waste management by constructing a systematic evaluation model with objective, criterion, and indicator layers. It also provides a quantitative methodology for analyzing key factors, offering a methodological reference for future research. Practically, this study demonstrates that IoT technology can significantly improve transport efficiency by reducing empty mileage rates and optimizing routes, thereby lowering operating costs and enhancing resource utilization. Additionally, this study highlights the potential of IoT technology to promote green development and sustainable construction by reducing carbon emissions and environmental pollution. These insights provide valuable guidance for policymakers and industry stakeholders in developing regulations and fostering cross-sector collaboration.
This study enhances the integration of IoT in construction waste transport management through a comprehensive evaluation model, offering a novel approach to assess key indicators. It contributes to both theoretical frameworks and practical applications in smart city development. Future research could focus on balancing privacy and data sharing, along with the potential role of emerging technologies such as AI to further improve system efficiency. Practically, the findings provide valuable insights for policymakers and industry stakeholders to develop effective regulations and promote collaboration, ultimately optimizing resource use, reducing environmental impacts, and improving transport efficiency in construction waste management.

6. Conclusions

This study explored the application of IoT technology in construction waste transport management, addressing key challenges and identifying opportunities for optimization across operational, technical, economic, and strategic dimensions. This study provided a comprehensive evaluation of the integration of IoT technology in construction waste transport management by identifying and prioritizing 16 key performance indicators through expert input and applying AHP and FCE methodologies. The findings revealed that real-time monitoring and data management (B2) and environmental and social impact (B4) were the most influential dimensions, with corresponding high weights of 0.3177 and 0.2799, respectively. Among individual indicators, real-time monitoring (C1) was found to be the most critical (0.1514), emphasizing the importance of timely data acquisition in optimizing transport efficiency. The FCE validation confirmed the effectiveness of the proposed model, with indicators such as real-time data analysis (C5) and route optimization (C3) receiving high expert ratings. These results underscore the strategic value of IoT-enabled technologies in addressing operational inefficiencies, supporting data-driven decisions, and promoting low-carbon sustainable practices.
At the operational level, IoT integration, through real-time monitoring and intelligent route planning, significantly reduces inefficiencies such as extended transit durations, elevated empty mileage rates, and delays caused by traffic congestion. By leveraging sensors, GPS, and GIS technologies, IoT enables dynamic route optimization and intelligent scheduling, enhancing overall transport efficiency. At the technical level, IoT facilitates real-time data collection and analysis, enabling swift identification and resolution of issues such as equipment malfunctions or traffic accidents. This ensures a seamless and secure transportation process, supported by AI-driven anomaly detection systems and centralized monitoring platforms.
From an economic perspective, IoT addresses challenges related to resource allocation and cost control by optimizing fuel consumption, enabling predictive maintenance, and improving human resource management. Real-time monitoring of vehicle conditions and operational efficiency allows for data-driven decision making, reducing unnecessary expenses and downtime. Strategically, IoT contributes to sustainable development by minimizing environmental impacts such as carbon emissions, noise pollution, and road congestion. Through real-time exhaust monitoring and optimized transport plans, IoT supports low-carbon development while enhancing community satisfaction and promoting a circular economy through improved waste categorization and resource recovery.
However, there are several limitations to this study. First, the research primarily focuses on the theoretical framework and does not include real-world case studies or pilot projects to validate the proposed model in actual construction waste transportation scenarios. Second, this study’s evaluation framework, while comprehensive, relies heavily on expert input and may not fully capture the variability of real-world operational conditions. Additionally, while the study emphasizes environmental and social impacts, it does not provide detailed baseline or projected data to quantify the specific benefits of IoT integration in construction waste management.
For future research, this study suggests expanding the evaluation framework by exploring additional variables from environmental, social, and governance (ESG) perspectives. Environmentally, research could focus on developing carbon footprint tracking systems and integrating renewable energy solutions, such as electric vehicles and autonomous driving systems, to further reduce emissions. Socially, future studies could enhance public participation and satisfaction by establishing transparent feedback systems and addressing the needs of vulnerable communities through smart technologies. From a governance perspective, research could investigate the role of IoT in standardizing transport processes, fostering cross-sector collaboration, and developing incentive mechanisms to accelerate the adoption of IoT technologies. To integrate environmental, social, and governance elements into construction waste transportation management, a future research and policy roadmap is needed. This roadmap should focus on setting clear ESG objectives, such as reducing emissions, improving community engagement, and ensuring regulatory compliance. Policymakers can incentivize IoT adoption while addressing these goals, and future studies can assess the long-term benefits of such integration. This will provide practical guidance for practitioners seeking to implement ESG principles in construction waste management. By addressing these areas, future research can build on this study’s foundation to drive the intelligent transformation of construction waste transport management and contribute to the broader goals of smart city development. To enhance the practical relevance of the methodology, future research could validate the proposed model through a real-world case study or pilot project in construction waste transportation. This would demonstrate the practical application of the Delphi, AHP, and FCE methodologies and provide evidence of their effectiveness in optimizing efficiency and sustainability in transportation management.

Author Contributions

Conceptualization, N.Z., W.Z., and C.Z.; methodology, N.Z., W.Z., and Y.G.; software, N.Z.; validation, N.Z., M.A., and Z.W.; formal analysis, N.Z., M.A., W.Z., and J.H.; investigation, W.Z., Y.G., Z.W., and C.Z.; data curation, N.Z.; writing—original draft preparation, N.Z.; writing—review and editing, M.A., W.Z., and J.H.; visualization, N.Z.; supervision, M.A., and J.H. All authors have read and agreed to the published version of the manuscript.

Funding

This research is supported by the foundation of Jiangsu Province Engineering Research Center of Construction Carbon Neutral Technology, NO. JZTZH2022-0401.

Data Availability Statement

The data presented in this study are available on request from the corresponding author.

Acknowledgments

This project is based on a master’s dissertation conducted at Xi’an Jiaotong-Liverpool University.

Conflicts of Interest

Author Yaoqian Gu was employed by the company Nanjing Lianzhu Exhibition Engineering Co., Ltd. The remaining authors declare that the research was conducted in the absence of any commercial or financial relationships that could be construed as a potential conflict of interest.

Abbreviations

The following abbreviations are used in this manuscript:
IoTInternet of Things
AHPDirectory of open access journals’ analytic hierarchy process
FCEFuzzy comprehensive evaluation

Appendix A

Table A1. Background information of experts.
ExpertField of SpecializationProfessional QualificationMain Research DirectionYears of Work Experience
1Construction EngineeringAssociate professorCivil engineering11–15 years
2Construction EngineeringAssociate professorRoad and bridge engineering6–10 years
3Construction EngineeringAssociate professorConstruction project management6–10 years
4Project ManagementEngineerIoT applications6–10 years
5Internet of Things TechnologySenior engineerIntelligent transport systems11–15 years
6Internet of Things TechnologyEngineerSensor technology6–10 years
7Transport managementSenior engineerConstruction engineering management11–15 years
8Transport managementEngineerIntelligent transport systems0–5 years
9Data securityEngineerData privacy and security6–10 years
10Artificial intelligenceEngineerComputer science and technology0–5 years

Appendix B

Table A2. Results of the first-round survey on primary indicators.
Primary IndicatorsAverage ValueStandard DeviationCoefficient of Variation
B1: Transportation Efficiency4.50000.67420.1498
B2: Real-Time Monitoring and Data Management5.00000.00000.0000
B3: Resource Management and Cost Control4.41670.51490.1166
B4: Environmental and Social Impact4.50000.52220.1161
Kendall’s Coefficient of CoordinationKendall Wa coefficient = 0.2685
Cardinality = 9.6667
Asymptotic Significance: p = 0.0216
Table A3. Results of the first-round survey on secondary indicators.
Secondary IndicatorsAverage ValueStandard DeviationCoefficient of Variation
C1: Transportation Time4.50000.52220.1161
C2: Empty Mileage Rate4.75000.45230.0952
C3: Route Optimization4.33330.49240.1136
C4: Loading and Unloading Efficiency4.50000.52220.1161
C5: Real-Time Data Analysis4.58330.51490.1123
C6: Data Accuracy4.41670.51490.1166
C7: Data Transmission Efficiency4.66670.49240.1055
C8: Anomaly Detection4.83330.38930.0805
C9: Privacy Protection2.58330.66860.2588
C10: Human Resource Utilization3.00000.73860.2462
C11: Fuel Consumption3.33330.88760.2663
C12: Transportation Costs2.25001.21540.5402
C13: Equipment Maintenance Costs4.50000.52220.1161
C14: Carbon Emissions1.91670.51490.2687
C15: Resource Recycling Rate3.83330.71770.1872
C16: Sustainability Assessment4.33330.49240.1136
C17: Community Feedback Satisfaction4.50000.52220.1161
C18: Regulatory Compliance4.75000.45230.0952
Kendall’s Coefficient of CoordinationKendall Wa Coefficient = 0.6278
Cardinality = 128.0778
Asymptotic Significance: p < 0.001
Table A4. Results of the second-round survey on primary indicators.
Primary IndicatorsAverage ValueStandard DeviationCoefficient of Variation
B1: Transportation Efficiency4.66670.49240.1055
B2: Real-Time Monitoring and Data Management5.00000.00000.0000
B3: Resource Management and Cost Control4.41670.51490.1166
B4: Environmental and Social Impact4.50000.52220.1161
Kendall’s Coefficient of CoordinationKendall Wa Coefficient = 0.2904
Cardinality = 10.4545
Asymptotic Significance: p = 0.0151
Table A5. Results of the second-round survey on secondary indicators.
Secondary IndicatorsAverage ValueStandard DeviationCoefficient of Variation
C1: Transportation Time4.50000.52220.1161
C2: Empty Mileage Rate4.75000.45230.0952
C3: Route Optimization4.33330.49240.1136
C4: Loading and Unloading Efficiency4.50000.52220.1161
C5: Real-Time Data Analysis4.58330.51490.1123
C6: Data Accuracy4.41670.51490.1166
C7: Data Transmission Efficiency4.66670.49240.1055
C8: Anomaly Detection4.83330.38930.0805
C9: Data Visualization2.58330.66860.2588
C10: Human Resource Utilization3.00000.73860.2462
C11: Fuel Consumption3.33330.88760.2663
C12: Equipment Maintenance Costs4.50000.52220.1161
C13: Resource Recycling Rate3.83330.71770.1872
C14: Sustainability Assessment4.33330.49240.1136
C15: Community Feedback Satisfaction4.50000.52220.1161
C16: Regulatory Compliance4.75000.45230.0952
Kendall’s Coefficient of CoordinationKendall Wa Coefficient = 0.5082
Cardinality = 91.4713
Asymptotic Significance: p < 0.0001
Table A6. Judgement matrix of criterion layer E1.
IndicatorB1B2B3B4
B111/221/3
B221 33
B31/21/311/2
B43 1/321
Table A7. Scoring table at indicator layer.
Secondary IndicatorExcellentGoodFairPoorVery Poor
C1: Transportation Time23221
C2: Empty Mileage Rate13420
C3: Route Optimization23320
C4: Loading and Unloading Efficiency13420
C5: Real-Time Data Analysis34111
C6: Data Accuracy24400
C7: Data Transmission Efficiency33220
C8: Anomaly Detection23311
C9: Data Visualization23221
C10: Human Resource Utilization43210
C11: Fuel Consumption13411
C12: Equipment Maintenance Costs05221
C13: Resource Recycling Rate02422
C14: Sustainability Assessment13321
C15: Community Feedback Satisfaction32311
C16: Regulatory Compliance23410

References

  1. Bi, W.; Lu, W.; Zhao, Z.; Webster, C.J. Combinatorial optimization of construction waste collection and transportation: A case study of Hong Kong. Resour. Conserv. Recycl. 2022, 179, 106043. [Google Scholar] [CrossRef]
  2. Qiang, G.; Tang, S.; Hao, J.; Di Sarno, L. BIM, IoT, and Big Data Integration Framework in the Green Building Industry. In Proceedings of the International Conference on Sustainable Buildings and Structures Towards a Carbon Neutral Future, Suzhou, China, 17–20 August 2023; Springer: Berlin/Heidelberg, Germany, 2023; pp. 15–23. [Google Scholar] [CrossRef]
  3. Ahmed, M.M.; Hassanien, E.; Hassanien, A.E. IoT-based intelligent waste management system. Neural Comput. Appl. 2023, 35, 23551–23579. [Google Scholar] [CrossRef]
  4. Islam, R.; Nazifa, T.H.; Yuniarto, A.; Uddin, A.S.; Salmiati, S.; Shahid, S. An empirical study of construction and demolition waste generation and implication of recycling. Waste Manag. 2019, 95, 10–21. [Google Scholar] [CrossRef] [PubMed]
  5. Hao, J.L.; Zhao, W.; Gong, G.; Ma, W.; Li, L.; Zhang, Y. Catalyzing sustainability through prefabrication: Integrating BIM-LCA for assessing embodied carbon in timber formwork waste. Sustain. Chem. Pharm. 2024, 41, 101698. [Google Scholar] [CrossRef]
  6. IEA. Global Energy Review: CO2 Emissions in 2020. 2020. Available online: https://www.iea.org/articles/global-energy-review-co2-emissions-in-2020 (accessed on 1 March 2025).
  7. Islam, M.T.; Iyer-Raniga, U.; Trewick, S. Recycling perspectives of circular business models: A review. Recycling 2022, 7, 79. [Google Scholar] [CrossRef]
  8. Singh, R.; Khan, S.; Dsilva, J.; Centobelli, P. Blockchain integrated IoT for food supply chain: A grey based Delphi-DEMATEL approach. Appl. Sci. 2023, 13, 1079. [Google Scholar] [CrossRef]
  9. Henaien, A.; Elhadj, H.B.; Fourati, L.C. A sustainable smart IoT-based solid waste management system. Future Gener. Comput. Syst. 2024, 157, 587–602. [Google Scholar] [CrossRef]
  10. Rathore, M.M.; Paul, A.; Hong, W.; Seo, H.; Awan, I.; Saeed, S. Exploiting IoT and big data analytics: Defining smart digital city using real-time urban data. Sustain. Cities Soc. 2018, 40, 600–610. [Google Scholar] [CrossRef]
  11. Alahi, M.E.E.; Sukkuea, A.; Tina, F.W.; Nag, A.; Kurdthongmee, W.; Suwannarat, K.; Mukhopadhyay, S.C. Integration of IoT-enabled technologies and artificial intelligence (AI) for smart city scenario: Recent advancements and future trends. Sensors 2023, 23, 5206. [Google Scholar] [CrossRef]
  12. Jagatheesaperumal, S.K.; Bibri, S.E.; Huang, J.; Rajapandian, J.; Parthiban, B. Artificial intelligence of things for smart cities: Advanced solutions for enhancing transportation safety. Comput. Urban Sci. 2024, 4, 10. [Google Scholar] [CrossRef]
  13. Eltoukhy, A.E.; Hussein, M.; Xu, M.; Chan, F.T. Data-driven game-theoretic model based on blockchain for managing resource allocation and vehicle routing in modular integrated construction. Int. J. Prod. Res. 2023, 61, 4472–4502. [Google Scholar] [CrossRef]
  14. Zhao, W.; Hao, J.L.; Gong, G.; Fischer, T.; Liu, Y. Applying digital technologies in construction waste management for facilitating sustainability. J. Environ. Manag. 2025, 373, 123560. [Google Scholar] [CrossRef]
  15. Talla, A.; McIlwaine, S. Industry 4.0 and the circular economy: Using design-stage digital technology to reduce construction waste. Smart Sustain. Built Environ. 2024, 13, 179–198. [Google Scholar] [CrossRef]
  16. Anagnostopoulos, T.; Zaslavsky, A.; Kolomvatsos, K.; Medvedev, A.; Amirian, P.; Morley, J.; Hadjieftymiades, S. Challenges and opportunities of waste management in IoT-enabled smart cities: A survey. IEEE Trans. Sustain. Comput. 2017, 2, 275–289. [Google Scholar] [CrossRef]
  17. Zhao, W.; Hao, J.L.; Gong, G.; Ma, W.; Zuo, J.; Di Sarno, L. Decarbonizing prefabricated building waste: Scenario simulation of policies in China. J. Clean. Prod. 2024, 458, 142529. [Google Scholar] [CrossRef]
  18. Sharma, M.; Joshi, S.; Kannan, D.; Govindan, K.; Singh, R.; Purohit, H. Internet of Things (IoT) adoption barriers of smart cities’ waste management: An Indian context. J. Clean. Prod. 2020, 270, 122047. [Google Scholar] [CrossRef]
  19. Wu, W.; Lyu, Y.; Zheng, C.; Hao, J.L.; Shen, S.; Yu, S. Digital supervision in construction pollution control: Utilizing advanced information models for enhanced supervision and sustainability. Environ. Technol. Innov. 2025, 37, 104038. [Google Scholar] [CrossRef]
  20. Brandín, R.; Abrishami, S. IoT-BIM and blockchain integration for enhanced data traceability in offsite manufacturing. Autom. Constr. 2024, 159, 105266. [Google Scholar] [CrossRef]
  21. Gao, X.; Pishdad-Bozorgi, P.; Shelden, D.R.; Tang, S. Internet of things enabled data acquisition framework for smart building applications. J. Constr. Eng. Manag. 2021, 147, 04020169. [Google Scholar] [CrossRef]
  22. Rao, A.S.; Radanovic, M.; Liu, Y.; Hu, S.; Fang, Y.; Khoshelham, K.; Palaniswami, M.; Ngo, T. Real-time monitoring of construction sites: Sensors, methods, and applications. Autom. Constr. 2022, 136, 104099. [Google Scholar] [CrossRef]
  23. Gholamhosseini, L.; Sadoughi, F.; Rezayi, S.; Nasiri, S. Identifying cloud internet of things requirements in healthcare: A Delphi-based study. J. Supercomput. 2024, 80, 20201–20228. [Google Scholar] [CrossRef]
  24. Pathak, S.K.; Sharma, V.; Chougule, S.S.; Goel, V. Prioritization of barriers to the development of renewable energy technologies in India using integrated modified delphi and AHP method. Sustain. Energy Technol. Assess. 2022, 50, 101818. [Google Scholar] [CrossRef]
  25. Song, P.; Wu, L.; Zhao, W.; Ma, W.; Hao, J. Life cycle sustainability assessment: An index system for building energy retrofit projects. Buildings 2024, 14, 2817. [Google Scholar] [CrossRef]
  26. Oyewale, J.A.; Tartibu, L.K.; Okokpujie, I.P. Decision analysis approaches on the collection methods of polyethylene terephthalate waste. Recycling 2024, 9, 124. [Google Scholar] [CrossRef]
  27. Guo, X.; Xie, W.; Zhang, Y.; Qiao, J.; Lian, H. Fuzzy comprehensive evaluation of imported alcohol safety risk based on AHP and risk matrix. Chin. J. Food Hyg. 2023, 35, 1080–1087. [Google Scholar] [CrossRef]
  28. He, Y.; Zhao, G.; Tang, Y.; Song, J.; Chen, Y. Available target evaluation of underground gas storage based on AHP-FCE methods. Geoenergy Sci. Eng. 2024, 242, 213255. [Google Scholar] [CrossRef]
  29. Rabelo, L.; Ballestas, A.; Valdez, J.; Ibrahim, B. Using delphi and system dynamics to study the cybersecurity of the IoT-based smart grids. ParadigmPlus 2022, 3, 19–36. [Google Scholar] [CrossRef]
  30. Xu, S.; Sun, Y. Research on evaluation of green smart building based on improved AHP-FCE method. Comput. Intell. Neurosci. 2021, 2021, 5485671. [Google Scholar] [CrossRef]
  31. Deja, A.; Ślączka, W.; Kaup, M.; Szołtysek, J.; Dzhuguryan, L.; Dzhuguryan, T. Supply chain management in smart city manufacturing clusters: An alternative approach to urban freight mobility with electric vehicles. Energies 2024, 17, 5284. [Google Scholar] [CrossRef]
  32. Mishra, A.; Kumar Ray, A. IoT cloud-based cyber-physical system for efficient solid waste management in smart cities: A novel cost function based route optimisation technique for waste collection vehicles using dustbin sensors and real-time road traffic informatics. IET Cyber-Phys. Syst. Theory Appl. 2020, 5, 330–341. [Google Scholar] [CrossRef]
  33. Han, H.; Tang, J.; Jing, Z. Wireless sensor network routing optimization based on improved ant colony algorithm in the Internet of Things. Heliyon 2024, 10, e23577. [Google Scholar] [CrossRef] [PubMed]
  34. Narsimhulu, P.; Chithaluru, P.; Al-Turjman, F.; Guda, V.; Inturi, S.; Stephan, T.; Kumar, M. An intelligent fl-based vehicle route optimization protocol for green and sustainable IoT connected IoV. Internet Things 2024, 27, 101240. [Google Scholar] [CrossRef]
  35. Song, Y.; Yu, F.R.; Zhou, L.; Yang, X.; He, Z. Applications of the Internet of Things (IoT) in smart logistics: A comprehensive survey. IEEE Internet Things J. 2020, 8, 4250–4274. [Google Scholar] [CrossRef]
  36. Al-Hadhrami, Y.; Hussain, F.K. Real time dataset generation framework for intrusion detection systems in IoT. Future Gener. Comput. Syst. 2020, 108, 414–423. [Google Scholar] [CrossRef]
  37. Bian, J.; Al Arafat, A.; Xiong, H.; Li, J.; Li, L.; Chen, H.; Wang, J.; Dou, D.; Guo, Z. Machine learning in real-time Internet of Things (IoT) systems: A survey. IEEE Internet Things J. 2022, 9, 8364–8386. [Google Scholar] [CrossRef]
  38. Alam, F.; Mehmood, R.; Katib, I.; Albogami, N.N.; Albeshri, A. Data fusion and IoT for smart ubiquitous environments: A survey. IEEE Access 2017, 5, 9533–9554. [Google Scholar] [CrossRef]
  39. Fathy, Y.; Barnaghi, P. Quality-based and energy-efficient data communication for the internet of things networks. IEEE Internet Things J. 2019, 6, 10318–10331. [Google Scholar] [CrossRef]
  40. Zappile, J.C.; de Andrade, R.P.; Lima, G.S.; Schiffini, G.B.; Maranhão, F.L. Influence of construction materials density on data transmission performance of IOT devices. Autom. Constr. 2024, 166, 105635. [Google Scholar] [CrossRef]
  41. Chatterjee, A.; Ahmed, B.S. IoT anomaly detection methods and applications: A survey. Internet Things 2022, 19, 100568. [Google Scholar] [CrossRef]
  42. Liu, Y.; Pang, Z.; Karlsson, M.; Gong, S. Anomaly detection based on machine learning in IoT-based vertical plant wall for indoor climate control. Build. Environ. 2020, 183, 107212. [Google Scholar] [CrossRef]
  43. Yin, C.; Xi, J.; Sun, R.; Wang, J. Location privacy protection based on differential privacy strategy for big data in industrial internet of things. IEEE Trans. Ind. Inform. 2017, 14, 3628–3636. [Google Scholar] [CrossRef]
  44. Zhu, F.; Yi, X.; Abuadbba, A.; Khalil, I.; Nepal, S.; Huang, X. Cost-effective authenticated data redaction with privacy protection in IoT. IEEE Internet Things J. 2021, 8, 11678–11689. [Google Scholar] [CrossRef]
  45. Strohmeier, S. Smart HRM–a Delphi study on the application and consequences of the Internet of Things in human resource management. Int. J. Hum. Resour. Manag. 2020, 31, 2289–2318. [Google Scholar] [CrossRef]
  46. Zhang, L.; Lu, Q.; Wu, S. Research on the construction process of human resources supply chain of small and micro enterprises based on Internet of Things technology. Internet Things 2023, 22, 100714. [Google Scholar] [CrossRef]
  47. Sanchez, O.T.; Raposo, D.; Rodrigues, A.; Boavida, F.; Marculescu, R.; Chen, K.; Silva, J.S. An IIoT-based approach to the integrated management of machinery in the construction industry. IEEE Access 2023, 11, 6331–6350. [Google Scholar] [CrossRef]
  48. Shahnavaz, F.; Akhavian, R. Automated estimation of construction equipment emission using inertial sensors and machine learning models. Sustainability 2022, 14, 2750. [Google Scholar] [CrossRef]
  49. Fredriksson, A.; Sezer, A.A.; Angelakis, V.; Gundlegård, D. Construction related urban disturbances: Identification and linking with an IoT-model. Autom. Constr. 2022, 134, 104038. [Google Scholar] [CrossRef]
  50. Louis, J.; Dunston, P.S. Integrating IoT into operational workflows for real-time and automated decision-making in repetitive construction operations. Autom. Constr. 2018, 94, 317–327. [Google Scholar] [CrossRef]
  51. Ma, M.; Tam, V.W.; Le, K.N.; Li, W. Challenges in current construction and demolition waste recycling: A China study. Waste Manag. 2020, 118, 610–625. [Google Scholar] [CrossRef]
  52. Woodhead, R.; Stephenson, P.; Morrey, D. Digital construction: From point solutions to IoT ecosystem. Autom. Constr. 2018, 93, 35–46. [Google Scholar] [CrossRef]
  53. Sun, M.; Zhang, J. Research on the application of block chain big data platform in the construction of new smart city for low carbon emission and green environment. Comput. Commun. 2020, 149, 332–342. [Google Scholar] [CrossRef]
  54. Tao, X.; Mao, C.; Xie, F.; Liu, G.; Xu, P. Greenhouse gas emission monitoring system for manufacturing prefabricated components. Autom. Constr. 2018, 93, 361–374. [Google Scholar] [CrossRef]
  55. Arshad, R.; Zahoor, S.; Shah, M.A.; Wahid, A.; Yu, H. Green IoT: An investigation on energy saving practices for 2020 and beyond. IEEE Access 2017, 5, 15667–15681. [Google Scholar] [CrossRef]
  56. Christensen, T.H.; Damgaard, A.; Levis, J.; Zhao, Y.; Björklund, A.; Arena, U.; Barlaz, M.; Starostina, V.; Boldrin, A.; Astrup, T.F. Application of LCA modelling in integrated waste management. Waste Manag. 2020, 118, 313–322. [Google Scholar] [CrossRef]
  57. Dave, B.; Kubler, S.; Främling, K.; Koskela, L. Opportunities for enhanced lean construction management using Internet of Things standards. Autom. Constr. 2016, 61, 86–97. [Google Scholar] [CrossRef]
  58. Rane, N.; Choudhary, S.; Rane, J. Artificial Intelligence (Ai) and Internet of Things (Iot)–Based Sensors for Monitoring and Controlling in Architecture, Engineering, and Construction: Applications, Challenges, and Cpportunities. SSRN; 2023. Available online: https://ssrn.com/abstract=4642197 (accessed on 13 April 2025). [CrossRef]
  59. Bibri, S.E. The IoT for smart sustainable cities of the future: An analytical framework for sensor-based big data applications for environmental sustainability. Sustain. Cities Soc. 2018, 38, 230–253. [Google Scholar] [CrossRef]
  60. Chandrasekaran, H.; Subramani, S.E.; Partheeban, P.; Sridhar, M. IoT-and GIS-based environmental impact assessment of construction and demolition waste dump yards. Sustainability 2023, 15, 13013. [Google Scholar] [CrossRef]
Figure 1. Framework of the evaluation model.
Buildings 15 01381 g001
Figure 2. Hierarchical structure of evaluation model.
Buildings 15 01381 g002
Table 1. Research gaps.
Research AreaResearch Gaps
IoT-Based Smart Waste CollectionLimited scalability and no life cycle assessment. Future work should address dynamic C&D waste conditions and scalability.
Sensor Technologies and Real-Time MonitoringNeed for integration of advanced methods like system dynamics and multi-objective optimization for predictive decision making.
Blockchain and Game Theory in LogisticsNot tailored to dynamic conditions of C&D waste management. Exploration of adaptive models is needed.
Methodological AdvancementsLack of integration of advanced methods such as system dynamics, multi-objective optimization, and digital twin modeling.
Scalability and Predictive SupportNeed for scalable and predictive decision support systems that can handle complex large-scale construction waste logistics.
Table 2. Range of scale value.
Scale ValueImportance DegreeImplication
a i j = 1 Equally importantBoth elements are equally important.
a i j = 3 Slightly more importantThe former element is slightly more important than the latter.
a i j = 5 Significantly importantThe former element is significantly more important than the latter.
a i j = 7 Strongly importantThe former element is more strongly important than the latter element.
a i j = 9 Absolutely importantThe former element is more important than the latter element.
a i j = 2 , 4 , 6 , 8 Median valueIndicates the median value of the above two scales.
a i j = 1 / 2 , . . . , 1 / 9 Corresponds to the aboveThe latter element is the inverse of the above value compared with the former element.
Table 3. Preliminary statistics of the evaluation model.
Primary IndicatorsSecondary IndicatorsExplanationReferences
B1: Transportation EfficiencyC1: Transportation TimeThe time required for transportation vehicles to complete tasks from the starting point to the end point, reflecting the response speed and efficiency of the logistic.[30]
C2: Empty Mileage RateThe proportion of mileage driven by transport vehicles without cargo in the total mileage, which directly affects fuel consumption and cost control.[31,32]
C3: Route OptimizationProvide optimal route planning for transport vehicles by analyzing real-time traffic data and transport network characteristics, aiming to reduce transport time, reduce fuel consumption, and improve transport efficiency.[33,34]
C4: Loading and Unloading EfficiencyThe ability to complete the loading and unloading of goods per unit time, which is a key factor to improve the overall transportation efficiency and the turnover rate of resources.[35]
B2: Real-Time Monitoring and Data ManagementC5: Real-Time Data AnalysisCollect, process, and interpret the data generated during transportation through the IoT technology to provide a scientific basis for decision making in transportation management.[36,37]
C6: Data AccuracyReflect how accurately IoT devices collect and transmit data, the reliability of which is critical to system operation and optimal management.[38]
C7: Data Transmission EfficiencyMeasure the speed and reliability of data transmission from the acquisition end to the receiving end, which directly affects the real-time and response ability of the transportation management system.[39,40]
C8: Anomaly DetectionMonitor unexpected situations during transportation. By accurately capturing these anomalies, the management system can alert relevant parties the first time to achieve rapid response and problem resolution.[41,42]
C9: Privacy ProtectionInvolve the security of transport data during collection, transmission, and storage to ensure that sensitive information is not abused or disclosed.[43,44]
B3: Resource Management and Cost ControlC10: Human Resource UtilizationOptimize the workload of employees through the rational allocation of labor in the transportation process, thereby improving labor efficiency and reducing labor costs.[45,46]
C11: Fuel ConsumptionMeasure the amount of fuel used per unit time or mileage of a transport vehicle, which directly affects operating costs and environmental sustainability.[47,48]
C12: Transportation CostsThe core variables of economic analysis in transportation management include fuel, labor, maintenance, and other operating expenses.[49,50]
C13: Equipment Maintenance CostsMeasure the regular maintenance and fault repair costs of transport vehicles and related equipment that directly affect the long-term availability and operational efficiency of equipment.[51,52]
B4: Environmental and Social ImpactC14: Carbon EmissionsEvaluate the impact of the transportation system on the environment directly related to sustainable development goals.[53,54]
C15: Resource Recycling RateMeasure the proportion of recyclable materials in construction waste, an important reference to promote the development of waste resources and circular economy.[55]
C16: Sustainability AssessmentMeasure whether transport management complies with the principles of sustainable development through the comprehensive consideration of environmental protection, economic benefits, and social impacts.[56]
C17: Community Feedback SatisfactionReflect public acceptance and support for transport management by assessing the impact of transport activities on the local community, such as noise pollution, road congestion, and so on.[57,58]
C18: Regulatory ComplianceMeasure whether transport management meets the requirements of relevant laws, regulations, and policies, and is a key factor in ensuring the legitimacy and standardization of transport activities.[59,60]
Table 4. Final evaluation model.
Primary IndicatorsSecondary Indicators
B1: Transportation EfficiencyC1: Transportation Time
C2: Empty Mileage Rate
C3: Route Optimization
C4: Loading and Unloading Efficiency
B2: Real-Time Monitoring and Data ManagementC5: Real-Time Data Analysis
C6: Data Accuracy
C7: Data Transmission Efficiency
C8: Anomaly Detection
C9: Data Visualization
B3: Resource Management and Cost ControlC10: Human Resource Utilization
C11: Fuel Consumption
C12: Equipment Maintenance Costs
B4: Environmental and Social ImpactC13: Resource Recycling Rate
C14: Sustainability Assessment
C15: Community Feedback Satisfaction
C16: Regulatory Compliance
Table 5. Evaluation affiliation matrix.
Secondary IndicatorExcellentGoodFairPoorVery PoorScore
C1: Transportation Time0.20000.30000.20000.20000.10003.3000
C2: Empty Mileage Rate0.10000.30000.40000.20000.00003.3000
C3: Route Optimization0.20000.30000.30000.20000.00003.5000
C4: Loading and Unloading Efficiency0.10000.30000.40000.20000.00003.3000
C5: Real-Time Data Analysis0.30000.40000.10000.10000.10003.7000
C6: Data Accuracy0.20000.40000.40000.00000.00003.8000
C7: Data Transmission Efficiency0.30000.30000.20000.20000.00003.7000
C8: Anomaly Detection0.20000.30000.30000.10000.10003.4000
C9: Data Visualization0.20000.30000.20000.20000.10003.3000
C10: Human Resource Utilization0.40000.30000.20000.10000.00004.0000
C11: Fuel Consumption0.10000.30000.40000.10000.10003.2000
C12: Equipment Maintenance Costs0.00000.50000.20000.20000.10003.1000
C13: Resource Recycling Rate0.00000.20000.40000.20000.20002.6000
C14: Sustainability Assessment0.10000.30000.30000.20000.10003.1000
C15: Community Feedback Satisfaction0.30000.20000.30000.10000.10003.5000
C16: Regulatory Compliance0.20000.30000.40000.10000.00003.6000
Table 6. Fuzzy comprehensive evaluation table at objective layer.
Criterion LayerExcellentGoodFairPoorVery PoorEvaluation Results
B1: Transportation Efficiency0.16430.30000.32190.20000.0138Fair
B2: Real-Time Monitoring and Data Management0.24900.36950.22590.08820.0675Good
B3: Resource Management and Cost Control0.28110.32090.25140.11040.0361Good
B4: Environmental and Social Impact0.13520.27960.33590.16440.0848Fair
Disclaimer/Publisher’s Note: The statements, opinions and data contained in all publications are solely those of the individual author(s) and contributor(s) and not of MDPI and/or the editor(s). MDPI and/or the editor(s) disclaim responsibility for any injury to people or property resulting from any ideas, methods, instructions or products referred to in the content.

