Abstract
This study investigates the impact of the bearing plate position on the uplift bearing capacity of low-header concrete expanded pile (CEP) foundations using the ANSYS finite element simulation method. Nine models of low-header CEP single piles with varying bearing plate positions are constructed. Incremental loading is applied to obtain relevant data, including load–displacement curves for vertical tensile forces, displacement contours, and shear stress distributions. The study analyzes the characteristics of load–displacement curves under different loading conditions, the axial force distribution along the pile shaft, the failure state of the surrounding soil, and how the uplift bearing capacity varies with changes in the bearing plate position. Based on the findings, a calculation model for the uplift bearing capacity of low-header CEP single-pile foundations is proposed. Given that the uplift bearing capacity decreases to varying degrees depending on the bearing plate position, the slip-line theory from previous studies is applied to refine the corresponding calculation formula for uplift bearing capacity. The results from the ANSYS finite element simulation confirm that the bearing plate position significantly influences the uplift bearing performance of low-header CEP single-pile foundations. The uplift bearing capacity increases with the distance between the bearing plate and the low header, reaching a peak before decreasing beyond a certain threshold. Considering the influence of the bearing plate position on bearing capacity, the affected area of soil beneath the foundation, and the time required for the system to enter its working state, the optimal bearing plate position is found to be at a distance of d1 = 4R0 to 5R0 from the top of the pile.
1. Introduction
CEP piles, as a novel type of concrete expanded pile, are based on conventional concrete drilled piles, with bearing plates formed at specific positions along the pile shaft using specialized equipment. The key advantage of CEP piles lies in their flexibility to adjust both the size and position of the bearing plate according to soil conditions, thereby enhancing bearing capacity and reducing settlement [1,2]. The construction process involves a combined drilling, expanding, and cleaning machine, which simultaneously forms the pile and the bearing plate [3]. This process reduces slurry discharge, lowers material costs, and aligns with national strategies for high-quality development. Current research on CEP piles primarily focuses on single piles, double piles, and pile groups [4,5], with limited attention given to the impact of the cap on the bearing capacity of CEP pile foundations. As a critical component of pile foundations, the cap serves as an essential connection between the superstructure and the pile foundation [6], and its influence should not be overlooked. Factors such as the position of the bearing plate, pile spacing, and cap dimensions play a significant role in the performance of low-cap CEP pile foundations. Therefore, this study uses ANSYS2022 finite element software to investigate the bearing plate position as a key factor, conducting a detailed comparative analysis of the bearing performance of low-cap (cap embedded in soil) CEP single-pile foundations. The results provide reliable theoretical support for future research and practical applications.
While scholars both domestically and internationally have conducted extensive studies on pile–soil–cap interactions, research on the interaction of CEP piles—being variable-section piles—remains sparse. However, findings from studies on constant-section drilled piles provide useful insights and references for CEP pile research. For instance, Xuheng Zhang [7] and others simulated and analyzed the force and deformation characteristics of low-cap pile group foundations under horizontal static and dynamic loads, revealing that the force distribution of the pile–soil–cap system varies at different positions along the pile shaft under horizontal loading. Cheng Fu [8] and colleagues from China Communications Fourth Navigation Engineering Institute addressed the often-overlooked issue of cap–soil interaction in low-cap pile structures. Their results demonstrated that by considering the soil-bearing effect between piles in simplified models, the bending moment of the cap and the axial force in the pile foundation could be reduced by 35–40%. The pile shaft bending moment and shear force were influenced by horizontal forces and the soil’s m-value, while the axial force in the pile foundation decreased as soil stiffness increased, with a progressively diminishing rate. Shilin Luo, Mingquan Liu, Jianqing Jiang, and others [9] proposed an analytical method that takes into account the soil load beneath the cap. This method combines shear displacement and the Boussinesq solution to determine the distribution of side friction and axial force along the pile shaft. The study demonstrates that the soil load beneath the cap reduces the side friction of the pile, with the affected depth extending approximately four times the radius of the load influence. The theoretical results align closely with the measured data, validating the accuracy of the proposed method. Zhou et al. [10], among others, conducted small-scale tests on a single-pile foundation with a transparent soil model to observe the deformation patterns of the surrounding soil. The study demonstrates that the pile cap significantly enhances the bearing capacity of the pile foundation. Furthermore, the elastic load limit shows a strong linear relationship with the pile cap area, pile diameter, and pile length. The experiments validate the effects of the pile cap, pile diameter, and pile length on the bearing performance. Mahmoud N. Hussien, Tetsuo Tobita, and Susumu Iai [11], among others, conducted a two-dimensional finite element analysis to investigate the effect of vertical loads on the lateral response of free-head piles and pile groups with caps. A hyperbolic multiple shear mechanism was employed to simulate the soil behavior, and a hysteretic nonlinear spring model was used to simplify the pile–soil interaction. The results show that vertical loads increase the confining pressure, but the increase is smaller for the outer piles, leading to an imbalance in the soil pressure on the front and rear sides. In the case of free-head piles, the vertical load reduces the side resistance of the front pile (Pile 1) by 10%, while the resistance of the rear piles (Piles 3 and 5) increases by 14% and 35%, respectively. A similar trend is observed in pile groups with caps, but the effects are more pronounced.
2. Construction of the Simulation Analysis Model
2.1. Determination of Model Dimensions
To enhance the consistency of the finite element simulation results with actual engineering practices, the dimensions of the low-cap single-pile foundation model in ANSYS are designed at a 1:1 scale. The position of the bearing plate is considered as the sole control variable, and the distance from the bearing plate to the bottom of the bearing platform is represented by the pile length d1 on the plate (as shown in Figure 1). Nine sets of analytical models are established, with the pile length d1 varying from one to nine times the cantilever radius of the plate, labeled W1 to W9. A low-bearing platform with a direct-hole bored pile foundation is designated as W0. Additionally, nine sets of models are developed in which a 100 kN load is incrementally applied to the pile top. The pile top load–displacement data are extracted and designated M1 to M9. In the simulation, other parameters are kept constant, with the pile length set to 8100 mm, pile diameter to 500 mm, bearing plate overhang diameter to 500 mm, cap length and width to 2500 mm, low-cap thickness to 600 mm, soil model radius to 5000 mm, and height to 11,650 mm. The bearing plate slope angles are defined as α = 45° and β = 27° [12]. Specific dimensions and model diagrams are presented in Table 1 and Figure 1, Figure 2 and Figure 3, respectively.
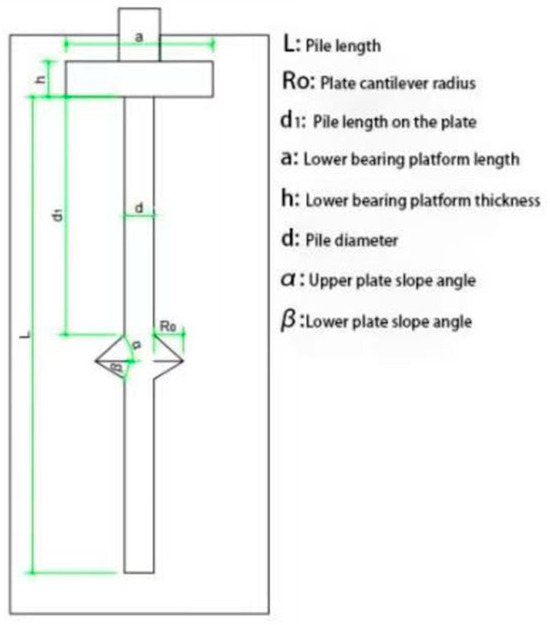
Figure 1.
Schematic of low-cap CEP pile foundation model.

Table 1.
Dimensions of the pile length on the bearing plate (d1).
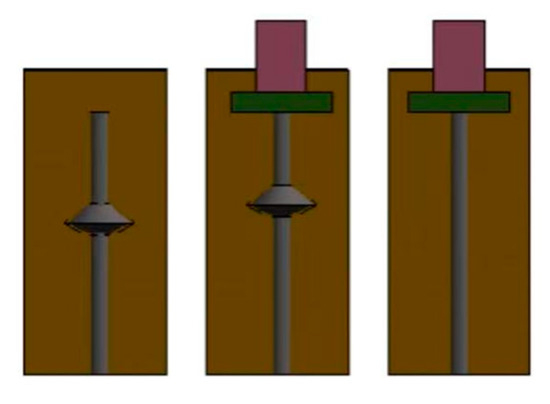
Figure 2.
Schematic of schematic comparison of straight-shaft bored pile.
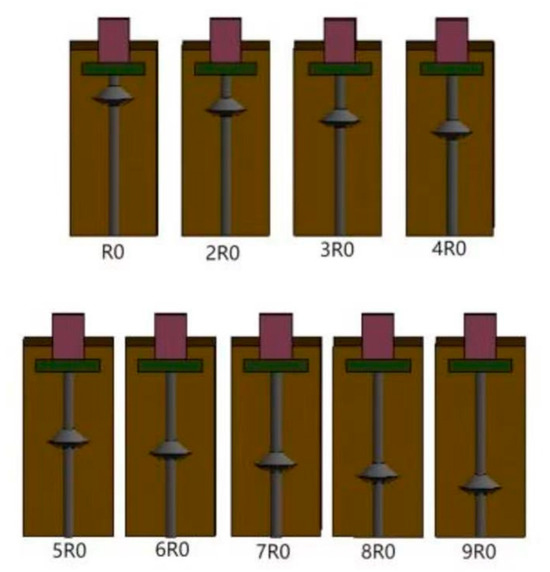
Figure 3.
Schematic of low cap with varying bearing plate positions.
2.2. Material Parameters
To ensure consistency with real-world conditions, the soil parameters in the simulation are matched with those provided in the actual geotechnical report [13,14]. Given that the bearing capacity of CEP piles is sufficient to support high-rise buildings and the pile shaft can adapt to various soil types, common foundation clay is chosen as the test soil to optimize experimental results. This selection also accounts for the deformation of the low-cap CEP pile under horizontal loads and facilitates the observation of experimental phenomena. Both the low cap and the CEP pile shaft are made from C30 concrete. The material parameters for C30 concrete and clay are provided in Table 2.
Table 2.
Material parameter settings.
2.3. Finite Element Model Construction
2.3.1. Pile–Soil Model Construction
In the pile–soil model, the cap and CEP pile shaft are modeled using the SOLID65 element, while the soil is modeled using the SOLID45 element. The SOLID65 element is capable of simulating concrete-specific mechanical phenomena, such as cracking, crushing, and reinforcement, and allows for the predefinition of concrete failure criteria. It uses a standard eight-node 3D solid element (without midside nodes) and incorporates a three-dimensional strength criterion for concrete. The positions, angles, and reinforcement ratios of the rebar in different directions of the 3D space can be set individually, facilitating the modeling process. Each node has three degrees of freedom for translation along the X-, Y-, and Z-axes.
The ANSYS APDL program’s modeling interface is used for this simulation. Based on the data in Table 1, the key points (Keypoints) for the CEP pile shaft are created, and these points are used to form a closed plane. The plane is then rotated 360° around its axis of symmetry to generate the CEP pile shaft model. The cap is created using the Volumes-Block interface, where a cube is first generated, followed by a rectangular column with dimensions of 300 mm in length and width, and 1500 mm in height. A Boolean operation is applied to subtract the 100 mm portion of the pile head that connects the CEP pile and the cap. The cap and the CEP pile shaft are then merged into a single entity using another Boolean operation. The soil modeling process is similar to that of the pile. The low-cap CEP single pile–soil model is shown in Figure 4.
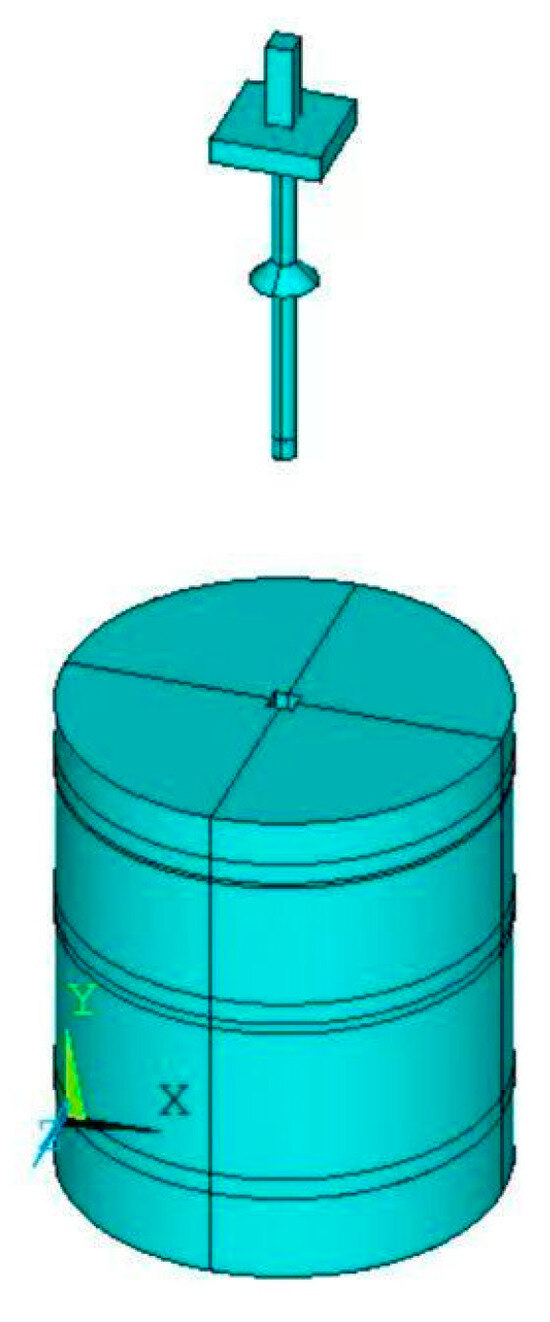
Figure 4.
Pile–soil model.
2.3.2. Mesh Division and Pile–Soil Contact
In ANSYS finite element analysis, various meshing methods are commonly employed, including free meshing, mapped meshing, sweeping meshing, and mixed meshing [15,16,17]. Mapped meshing, a structured approach, is particularly suitable for regular models, as it results in a more orderly mesh and produces computational results that closely reflect the actual problem. Given that the model in this simulation consists of regular quadrilaterals forming relatively regular hexahedrons, mapped meshing was selected for mesh division. The mesh division for the low-cap CEP single-pile foundation model is illustrated in Figure 5.
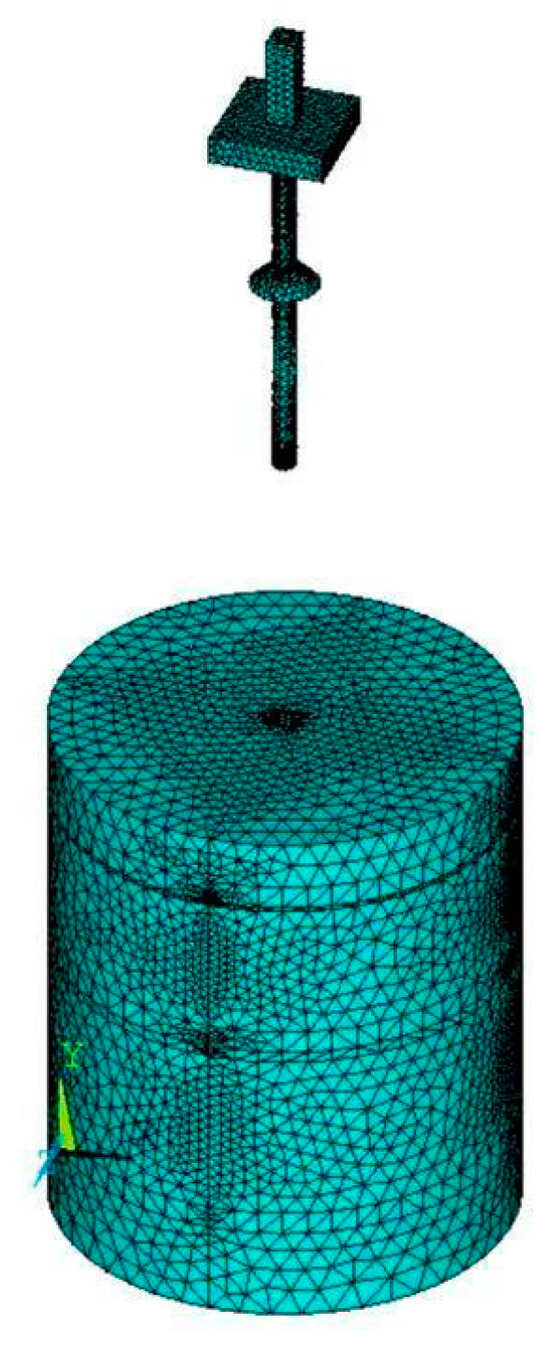
Figure 5.
Grid division.
Considering the material properties of the cap, CEP pile, and surrounding soil, it is evident that the elastic moduli of the cap and CEP pile are significantly higher than that of the soil. Consequently, the model’s contact type is defined as rigid–flexible contact [18]. The target170 element is used to represent the target surface, while the surfaces of the cap and CEP pile in contact with the soil are designated as contact surfaces, where contact173 elements are applied.
2.4. Boundary Constraints and Loading Method
Based on the material parameter data in Table 2, the corresponding material properties are defined in the finite element software. The bearing platform and CEP pile body are modeled using Solid 65 elements to simulate the actual C30 concrete properties, while the soil is modeled using Solid 45 elements to represent the characteristics of silty clay.
In this simulation, the soil model is considerably larger than the low-capacity CEP single-pile foundation, and as such, the influence of boundary conditions on the results is relatively minimal. Boundary constraints are applied to the degrees of freedom at the edge surfaces of the soil model. Since the loading direction in this study is vertical tensile force, all surfaces of the soil model—except the top surface—have their degrees of freedom constrained in the X-, Y-, and Z-directions. The vertical load is applied incrementally: each loading step increases by 100 kN compared to the previous one, and the loading continues until the ANSYS simulation curve fails to converge, at which point loading is halted. The process begins by converting the concentrated force into a surface load, which is then applied. A schematic diagram illustrating the boundary conditions and load application is provided in Figure 6.
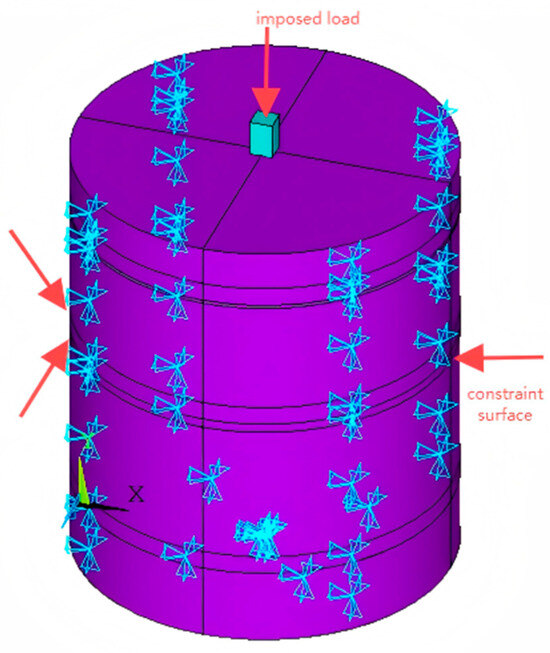
Figure 6.
Schematic diagram of constraint and load application locations.
3. Finite Element Simulation Result Analysis
3.1. Load–Displacement Result Analysis
3.1.1. Analysis of Load–Displacement Curve Trends
After applying the loading operations to each of the constructed finite element models, the resulting data were systematically organized. The pile head load–displacement data for the nine analysis models were accurately extracted, and the load–displacement curves were plotted with careful attention, as shown in Figure 7.
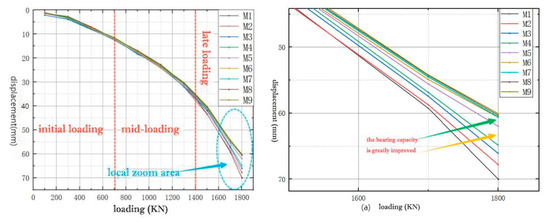
Figure 7.
Pullout load–displacement curves of CEP single pile. (a) Local magnified view at different pile cap positions.
By comparing the pile head load–displacement curves of each model group in Figure 7 and Figure 7a, the following conclusions can be drawn:
- During the initial loading stage, from 0 to 700 kN, the load–displacement curves for each group are linear and nearly coincide. This suggests that, within this range, the displacement increases only slightly as the load is applied, and the structure remains in the elastic phase. The curves are almost identical, indicating that the performance of the low-capacity pile foundation, regardless of pile cap position, is similar during this stage;
- During the mid-loading stage, from 700 to 1400 kN, the pile head displacement for each group continues to increase linearly; however, distinct trends begin to emerge. This behavior can be attributed to the activation of the bearing plate, which signifies that the pile foundations with different pile cap positions begin to exhibit divergent mechanical behaviors during this stage;
- When the load exceeds 1400 kN, the loading enters the later stage. At this point, the bearing plate has fully engaged. Due to factors such as variations in the bearing plate positions among the model groups, the trends of the curves diverge significantly. Specifically, for the M1 to M6 groups, as the position of the bearing plate is moved one pile cap overhang radius closer to the pile tip, the pile’s pullout capacity increases notably. Among these, the pullout capacity improvement is most efficient in the M4 to M5 groups. However, for the M6 group and beyond, although the pullout capacity continues to increase, the rate of improvement becomes significantly limited. This phenomenon clearly demonstrates that the bearing plate position has a substantial effect on the pile’s pullout capacity. Once the bearing plate is fully engaged, this effect becomes more pronounced and is clearly reflected in the load–displacement curve trends.
3.1.2. In-Depth Comparison and Analysis of Load–Displacement Curves
To further investigate the failure process of the model pile during loading and the variation in pile body displacement, this study conducts a comprehensive comparative analysis of the load–displacement curves for the model piles and those for the bored cast-in-place pile foundation. The procedure is as follows: Nine analysis models were constructed with incremental loading of 300 kN applied at the pile head, and the pile head load–displacement data were subsequently extracted. The CEP pile foundations were labeled M1 to M9, while the bored cast-in-place pile foundation was labeled M0. The load–displacement data for these nine models were accurately extracted, and the pullout load–displacement curves for the low-capacity CEP single-pile foundation and the low-capacity bored cast-in-place single-pile foundation with varying pile cap positions were carefully plotted, as shown in Figure 8.
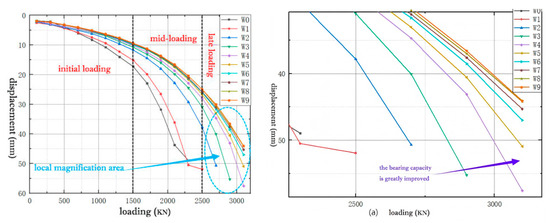
Figure 8.
Comparison of load–displacement curves. (a) Local magnified view.
By comparing the pullout load–displacement curves of the CEP single-pile foundation and the bored cast-in-place single-pile foundation in Figure 8 and Figure 8a, the following conclusions can be drawn:
- During the initial loading stage, from 0 to 1500 kN, the slopes of the curves for all groups are relatively small, indicating that, at this stage, displacement increases only slightly as the load is applied, and the structure remains in the elastic phase. The trends of the W0 and W1 groups are similar, while the trends of the W2 to W9 groups exhibit a similar pattern. This suggests that, in the early loading stage, differences in load–displacement responses start to emerge between the different groups;
- During the mid-loading stage, from 1500 to 2500 kN, as the load increases, the slopes of the curves for all groups gradually become steeper, indicating that the rate of displacement increase begins to accelerate. The load–displacement curves for the W0 and W1 groups exhibit a sharp downward trend, with the pile head displacement increasing significantly until it no longer converges. For the W2 to W9 groups, the trend reveals that, due to the varying positions of the bearing plate, displacement differences become progressively more pronounced. This indicates that, in the mid-loading stage, the pile head displacement of the W0 and W1 groups undergoes more significant changes, while displacement differences among the W2 to W9 groups increase as a result of the differing bearing plate positions;
- After 2500 kN, the loading enters the later stage. The slopes of the curves for all groups become steeper, and the rate of displacement increase accelerates as the structure transitions into the plastic stage. The pile head displacement differences for the W2 to W9 groups increase sharply. For the W2 to W6 groups, as the position of the bearing plate moves one pile cap overhang radius away from the pile head, the pullout capacity increases significantly. However, when the bearing plate is moved a certain distance away from the pile head, the efficiency of pullout capacity improvement diminishes. This indicates that, in the later loading stage, the pile head displacement differences for the W2 to W9 groups increase notably, and the pullout capacity for the W2 to W6 groups is influenced by the position of the bearing plate, with an optimal distance range existing.
3.1.3. Comparison and Analysis of Pullout Displacement Contour Maps of Low-Capacity Bored Cast-in-Place Pile Foundation and Low-Capacity CEP Single-Pile Foundation
Through specialized extraction procedures, the pullout load–displacement contour maps for the W0 and W5 groups under different loading conditions were obtained. For a more detailed and comprehensive analysis, the side half-sectional views of the pile foundation were specifically selected, with the corresponding illustrations provided in Figure 9b–d,b’–d’.
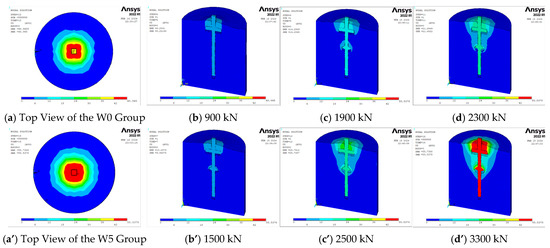
Figure 9.
Pullout displacement contour maps of the W0 and W5 group low-capacity pile foundations under different loads.
From the pullout displacement contour maps of the W0 and W5 group low-capacity pile foundations under different loads in Figure 9, the following can be observed:
- During the initial loading stage, from 0 to 1500 kN, the pile body of the W0 group low-capacity bored cast-in-place pile foundation undergoes significant displacement, and the soil above the pile cap experiences considerable sliding, as shown in Figure 9b. In contrast, for the W5 group low-capacity CEP pile foundation, the pile body exhibits relatively small displacement, the sliding range of the soil above the pile cap is smaller, and the bearing plate has not yet started to function, as shown in Figure 9b’;
- As the load increases from 1500 kN to 2500 kN, entering the mid-loading stage, the pile body displacement of the W0 group pile foundation increases dramatically, and the sliding of the soil above the pile cap expands rapidly, eventually forming a “fan-shaped” sliding zone. The ANSYS simulation fails to converge, and loading is terminated, as shown in Figure 9c. In contrast, for the W5 group pile foundation, the soil above the bearing plate gradually starts to slide and continues to increase, with the bearing plate beginning to function. The soil above the pile cap also begins to bulge, as shown in Figure 9c’;
- When the load reaches 2500 kN, entering the later loading stage, the sliding of the soil above the bearing plate and pile cap for the W5 group pile foundation gradually expands, eventually forming a “fan-shaped” sliding zone, as shown in Figure 9d’.
Due to the inclusion of the bearing plate, the pullout capacity of the low-capacity CEP pile foundation is much higher than that of the low-capacity bored cast-in-place pile foundation.
3.1.4. Displacement Contour Map Analysis Under Vertical Tensile Force
In the course of the research, precise extraction procedures were employed to obtain the Y-direction pullout displacement contour maps for the W0 to W9 groups under a 2300 kN load. For a more detailed and comprehensive comparative analysis, the side half-sectional views of the pile foundation were carefully selected. This approach facilitates a focused study and discussion of these contour maps from a specific perspective, aiming to reveal key insights into the pullout performance of the pile foundations, as shown in Figure 10a–j.
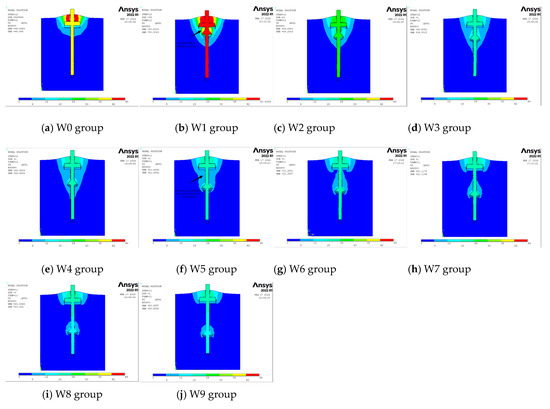
Figure 10.
Y-direction pullout displacement contour maps of pile foundations for the W0 to W9 groups under a 2300 kN load.
By combining the pullout load–displacement curves in Figure 8 and observing Figure 9, the following conclusions can be drawn:
- The pullout capacity of the low-capacity CEP single-pile foundation increases as the distance between the bearing plate and the pile head grows. However, once the bearing plate moves a certain distance away, the rate of increase in pullout capacity slows significantly. This phenomenon occurs because, during the pullout process, the interaction between the soil above the bearing plate and the soil above the pile cap becomes increasingly significant. When the bearing plate reaches a critical distance from the pile head, the effect of this mutual interaction diminishes, and the bearing plate and pile cap begin to resist the pullout load independently. As a result, increasing the distance between the bearing plate and the pile head beyond this point does not substantially enhance the pullout capacity;
- In the W1 group, the bearing plate is positioned too close to the pile head, which leads to sliding failure of the soil above the bearing plate during the pullout process, causing a loss of pullout capacity. Additionally, the presence of the bearing plate reduces the side friction of the pile body compared to the W0 group. Consequently, the pullout capacity of the low-capacity bored cast-in-place pile foundation in the W0 group exceeds that of the low-capacity CEP single-pile foundation in the W1 group.
3.2. Comparison and Analysis of Shear Stress Contour Maps Under Vertical Tensile Force
Shear stress contour maps for the W0 group low-capacity bored cast-in-place pile foundation and the W5 group low-capacity CEP single-pile foundation under various vertical tensile forces were extracted. Additionally, side half-sectional views of the low-capacity pile foundations were selected for comparative analysis. The corresponding illustrations are presented in Figure 11a–d,a’–d’. This approach allows for a more intuitive observation of the distribution and variation of shear stress at different loading stages for both foundation types, providing a solid foundation for further analysis of their mechanical behavior.
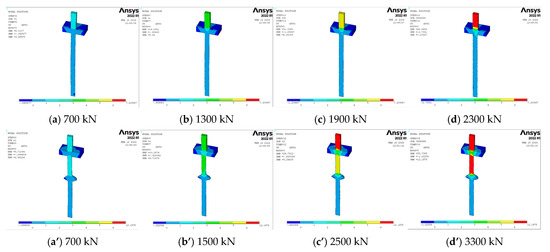
Figure 11.
Pullout shear stress contour maps of the W0 and W5 group low-capacity pile foundations under different loads.
From Figure 11, the following can be observed:
- When subjected to vertical tensile force, the load tension gradually transfers from the upper structure (e.g., column) to the pile cap. In the case of the bored cast-in-place pile foundation, the stress on the pile cap spreads outward and is also transmitted downward through various parts of the pile body. In contrast, for the CEP pile foundation, the stress on the pile cap primarily spreads outward but is mainly transmitted downward to the upper portion of the pile body at the bearing plate. The stress on the lower part of the pile body beneath the bearing plate is minimal, with most of the stress concentrated in the upper central region of the bearing plate;
- Under vertical tensile force, analysis of the stress distribution on the pile cap reveals that the stress is highly concentrated in the central region, while it is relatively low at the edges. This suggests that the pile cap does not fully utilize its capacity during load-bearing. In other words, simply increasing the pile cap size does not lead to a proportional increase in load-bearing capacity. Once the pile cap reaches a certain size, its load-bearing capacity will plateau. Therefore, in practical engineering applications, it is sufficient to ensure the pile cap size meets the requirements specified in the engineering code, effectively preventing the unnecessary waste of concrete due to oversized pile caps, thus achieving both economic efficiency and rational design.
4. Conclusions
The following conclusions can be drawn from this study:
- The inclusion of a low-capacity pile cap also enhances the pullout capacity of the pile foundation. Therefore, it is important to consider the pile cap’s role in bearing the pullout load in order to reduce the number of piles required. However, the size of the pile cap does not lead to a proportional increase in pullout capacity. The load is distributed over a limited area of the pile cap before being transferred to the pile body. Thus, the pile cap size should only meet the requirements specified in the engineering design standards and need not be excessively large, thereby preventing unnecessary waste of concrete;
- Compared to the low-capacity bored cast-in-place pile foundation, the low-capacity CEP single-pile foundation exhibits notable differences in the distribution pattern of pullout displacement, the magnitude of displacement, and its impact on the foundation’s stability. It is clear that the introduction of the bearing plate significantly enhances the pullout capacity of the low-capacity pile foundation;
- The pullout capacity of the CEP single-pile foundation varies significantly with the position of the bearing plate. As the bearing plate is placed further from the pile cap, the pullout capacity increases. However, once the bearing plate reaches a certain distance, the pullout capacity levels off. Additionally, when the bearing plate is positioned too close to the pile head, the soil above the bearing plate experiences overall sliding failure, resulting in a sharp decrease in pullout capacity. Therefore, the bearing plate should not be positioned too close to the pile head;
- The placement of the bearing plate should be determined by considering factors such as the pullout capacity of the low-capacity CEP single-pile foundation, the distance at which the bearing plate influences the soil beneath the pile cap, and the point at which the bearing plate begins to function. Based on these considerations, it is recommended that the bearing plate be positioned at a distance of d1 = 4R0 to 5R0 from the pile head;
- Given that stress concentrations are relatively high at the junction between the bearing plate and the pile body, it is advisable to design this region with a curved shape. This approach effectively mitigates stress concentration, thereby reducing the risk of failure.
Author Contributions
Software, Y.M.; Validation, X.W.; Investigation, Z.W.; Writing—original draft, D.Q.; Visualization, Z.M.; Supervision, Y.Q.; Project administration, L.S. All authors have read and agreed to the published version of the manuscript.
Funding
This research was funded by National Natural Science Foundation of China (NSFC) Project: Study on Group Pile Effect and Bearing Mechanism of Concrete Expanded-Base Pile under Vertical Load, Project No. 52078239.
Data Availability Statement
The original contributions presented in this study are included in the article. Further inquiries can be directed to the corresponding author.
Conflicts of Interest
Authors Yu Mou and Zhongwei Ma were employed by the company China Construction Fifth Engineering Division Corp., Ltd. The remaining authors declare that the research was conducted in the absence of any commercial or financial relationships that could be construed as a potential conflict of interest.
References
- Qian, Y.; Chen, Y.; Xu, L.; Wang, R.; Chao, S. Influence of the α angle of flexible concrete expanded-plate piles on the bearing capacity under horizontal load. Adv. Mater. Sci. Eng. 2022, 2022, 6157320. [Google Scholar] [CrossRef]
- Qian, Y.; Li, M.; Wang, R.; Jin, Y. Theoretical study on the load carrying capacity of concrete drilled and expanded piles with different stiffness under horizontal load. IOP Conf. Ser. Earth Environ. Sci. 2021, 760, 012002. [Google Scholar] [CrossRef]
- Shen, B. Special Lecture on New Pile Foundation Construction Techniques (Thirty-One): Drilling and Expanding Integrated Machine and Its Multi-Section Drilling and Expanding Bored Pile Construction Method. Eng. Mach. Maint. 2014, 32, 106–108+110–114. [Google Scholar]
- Che, M.; Qian, Y.; He, M.; Zhang, S.; Zhang, K. Study on the Influence of Bearing Plate Overhang Radius on the Pullout Failure Mechanism of NT-CEP Pile Groups. North. Archit. 2024, 9, 7–11. [Google Scholar]
- Chang, H.; Qian, Y.; He, M.; Liu, Z. Study on the Influence of Bearing Plate Position on the Compressive Load-Bearing Capacity of NT-CEP Pile Groups. J. Jilin Univ. Archit. 2023, 40, 1–6. [Google Scholar]
- Zhang, C.; Wang, E. Research on Construction Technology of High-Capacity Pile Bored Piles with Slurry Wall Protection. Constr. Mach. 2024, 115–119+122. [Google Scholar] [CrossRef]
- Zhang, X. Analysis of Group Pile Effect and Dynamic Response of Low-Capacity Pile Foundations under Horizontal Loads. Master’s Thesis, Beijing Jiaotong University, Beijing, China, 2018. [Google Scholar]
- Fu, C.; Zhu, J.; Fang, B. Simplified Finite Element Model of Pile-Soil-Pile Cap Interaction. Waterw. Eng. 2018, 193–198. [Google Scholar] [CrossRef]
- Luo, S.; Liu, M.; Jiang, J.; Aierken, A.; Chang, J.; Zhang, X.; Zhang, R. Analytical Method for Capped Pile–Soil Interaction considering the Load Action of Soil under the Pile Cap. Geofluids 2022, 2022, 1007731. [Google Scholar] [CrossRef]
- Zhou, H.; Liu, H.; Li, X.; Ding, X. Plasticity solution for the limit vertical pressure of a single rigid pile with a pile cap in soft soil. Comput. Geotech. 2020, 117, 103260. [Google Scholar] [CrossRef]
- Hussien, M.N.; Tobita, T.; Iai, S. Influence of vertical loads on lateral pile group response considering soil-pile-cap interactions. J. Jpn. Soc. Civ. Eng. Ser. A2 (Appl. Mech. (AM)) 2011, 67, 271–280. [Google Scholar] [CrossRef] [PubMed]
- Qian, Y.; Yang, Y.; Hong, G.; Tian, W.; Song, Y. Theoretical analysis of the influence of a sectional form of a flexible NT-CEP pile disc on the anti-tilting loading performance. KSCE J. Civ. Eng. 2022, 26, 4709–4716. [Google Scholar] [CrossRef]
- Kumar, C.S.; Steve, R.; Michael, T.; Stephen, S. ANSYS Workbench System Coupling: A state-of-the-art computational framework for analyzing multiphysics problems. Eng. Comput. 2018, 34, 385–411. [Google Scholar]
- Liu, B.; Wang, X.; Liu, C.; Kong, J. Effect of Relative Stiffness of Pile and Soil on Pile Group Effect. J. Mar. Sci. Eng. 2023, 11, 192. [Google Scholar] [CrossRef]
- Ke, Y.; Guo, J.; Xu, Y. Direct Optimization Design of Cantilever Structures Based on Ansys Workbench. Ship Sci. Technol. 2024, 46, 54–57. [Google Scholar]
- Jia, Q.; Wang, Y.; Li, G. Stability Analysis of Piles with Lateral Supports Based on Ansys. Comput.-Aided Eng. 2021, 30, 17–23. [Google Scholar] [CrossRef]
- Brown, D.A.; Morrison, C.; Reese, L.C. Lateral load behavior of pile group in sand. J. Geotech. Eng. 1988, 114, 1261–1276. [Google Scholar] [CrossRef]
- Onyelowe Kennedy, C.; Ebid Ahmed, M.; Evangelin, R.S.; Farid, F.-M.; Ali, G.-D.; Kontoni Denise-Penelope, N.; Nabaz, N.-O. Extensive overview of soil constitutive relations and applications for geotechnical engineering problems. Heliyon 2023, 9, e14465. [Google Scholar] [CrossRef] [PubMed]
Disclaimer/Publisher’s Note: The statements, opinions and data contained in all publications are solely those of the individual author(s) and contributor(s) and not of MDPI and/or the editor(s). MDPI and/or the editor(s) disclaim responsibility for any injury to people or property resulting from any ideas, methods, instructions or products referred to in the content. |
© 2025 by the authors. Licensee MDPI, Basel, Switzerland. This article is an open access article distributed under the terms and conditions of the Creative Commons Attribution (CC BY) license (https://creativecommons.org/licenses/by/4.0/).