Article

Structural Performance and Failure Mechanisms in Bend Loading of Steel-Aerated Concrete Fire Wall Composite Panels

1
Institute for Frontier Materials, Deakin University, Waurn Ponds, Pigdons Rd., Geelong, VIC 3216, Australia
2
Shenzhen Institute for Advanced Study, University of Electronic Science and Technology of China, Shenzhen 518000, China
3
School of Engineering, Deakin University, Waurn Ponds, Pigdons Rd., Geelong, VIC 3216, Australia
*
Author to whom correspondence should be addressed.
Buildings 2025, 15(8), 1338; https://doi.org/10.3390/buildings15081338
Submission received: 5 March 2025 / Revised: 13 April 2025 / Accepted: 13 April 2025 / Published: 17 April 2025
(This article belongs to the Special Issue Advances in Structural Techniques for Prefabricated Modular Buildings)

Abstract

Modularised wall panels are increasingly used in building and construction. A new double-skin composite (DSC) wall system technology uses clinch seams to combine two roll-formed open section profiles into a hollow steel shell that is then filled with a light-weight concrete foam and can provide a fire-rated DSC solution for use in commercial and high-rise buildings. One important material parameter for the application is the panel performance in wind loading. This study presents a first fundamental analysis of the structural behaviour of the new DSC wall panel relevant to wind loading. For this, 3-point and 4-point bending tests combined with in situ camera analysis are performed and complimented with the analysis of seam strength and the concrete material parameters. The experimental results provide the first experimental evidence that the aerated concrete core material of the DSC panel only has a minor effect on the wall performance in bending. Most of the bending loads are absorbed by the tensile and compressive deformation of the steel outer shell and the shear deformation near the clinch seam. In this way, failure at maximum load is not initiated by concrete cracking but by steel sheet buckling or a mixed failure mode that combines steel buckling and seam opening.

1. Introduction

Modular building construction is highly efficient and has been gaining increasing attention worldwide [1,2,3] as a solution to reducing both construction costs and environmental impact [4]. Modular wall panels are key components of modular construction. They can be pre-manufactured, cut to size in a factory, and transported to the project site, providing multiple benefits, including reduced labour time and waste compared to conventional non-load-bearing blockwork [5].
Modular wall panels consist of cold-formed steel members and a lightweight concrete core, which is often a foam concrete composite enclosed by a thin-gauge, profiled metal sheet to form a double-skin composite (DSC) system [6]. DSC walls, known for their fire-rated and acoustic properties, are suitable for various applications, including intertenancy and corridor walls, shaft and riser walls, and boundary walls in high-rise and multi-residential buildings.
The metal face sheets are usually aluminum or steel that can bear tensile and compressive stresses during a loading event, while the foam concrete core provides insulation [7]. The density of the foam concrete can be tailored from 400 kg/m3 to 1600 kg/m3 for filling, insulation, partitioning, and structural applications [8,9]. Mydin and Wang [10] tested foam concrete with a density of 1000 kg/m3 in the form of profiled panels with and without steel facing in compression. Their results suggested that the DSC systems can be used as wall panels in low-rise buildings.
The foam concrete generally consists of a mortar matrix and a large volume of air voids (pores) that are created by adding foam-forming agents into the mixture [11,12]. Due to its porous structure, the foam concrete has a low unit weight and can provide thermal and acoustic insulation [13,14]. The mechanical strength of the foam concrete is directly related to its porosity [13,15,16]. The yield and cracking behaviours of foam concrete under uniaxial and flexural loadings have been extensively investigated [17,18]. Under compressive loading, the stress–strain curves often present four stages: linear elastic, nonlinear hardening until maximum stress, nonlinear softening with a significant drop in the stress–strain curve, and a frictional sliding stage [19]. The tensile behaviour of foam concrete is reported as elastic at the beginning, followed by sudden failure [20].
Recent research has focused on improving the strength of foam concrete, with a common approach being the addition of materials, such as fly ash [21], fibres [22,23], and other fine particles [24]. Shafighfard et al. [25] applied machine learning methods to estimate the compressive strength of high-performance alkali-activated concrete and found that the addition of fly ash enhances compressive properties, making it the most influential factor. Additionally, the average pore diameter can be reduced by decreasing the water/cement ratio or by incorporating microsilica [26], both contributing to the increased compressive strength. Eltayeb et al. [7,27] added rubber to ultra-lightweight foam concrete as an infill material in profiled steel composite walls. To achieve this, they filled the foam concrete into a steel shell shaped as a wall panel and cured it. Tests showed that adding polypropylene fibres improved the ductility and load-carrying capacity of the foam concrete. Despite these improvements, foam concrete generally exhibits low compressive strength (ranging from 1 to 25 MPa) and negligible bending resistance [8].
The flexural strength (rupture under tension) of aerated concrete with a density of 650 kg/m3 has been found to be 10–15% of its compressive strength at room temperature [28,29]. During bending loads on DSC systems, wrinkle development in the metal face sheet is a common failure mode [30]. Ridha et al. [31] studied the effects of eccentric, axial, and flexural loads on lightly profiled lightweight concrete panels. The results indicated that failure occurred when the compressed outer metal skins reached the post-buckling stage. To counteract this, outer sheets are often profiled to enhance the buckling resistance of DSC panels [32]. These studies are limited in investigating the DSC system as a whole part; however, how the strength of the individual components (joints and core) affects the overall strength of the system remains unknown.
In a conventional DSC wall panel system, a large number of fasteners are used to assemble the metal cover sheets and concrete into a DSC panel, and the fastening method applied directly influences resistance to lateral loading. The steel skins can be connected using internal fasteners, such as studs and bolts [27,33], or by hooks welded to the inner surface of the steel sheets [34]. Castillo-Lara et al. [20] fabricated sandwich panels by casting foam concrete into a thin corrugated steel shell and applying screws and bolts to connect the top and bottom sheets. However, four-point bending tests revealed that this method led to local cracking around the fasteners [20].
A recently developed fire-rated DSC wall system for non-load-bearing applications in commercial and residential buildings consists of separate panels with male and female connections, allowing for fast and simple assembly by a single person. The wall panels are composed of two roll-formed open steel profiles, which are assembled into a closed shell using a special clinch seam technique. The shell is then filled with aerated concrete, which is initially cured within two days and continues to be cured over several years in its installed environment. This design minimizes steel-to-steel connections to only the panel ends, thereby reducing heat transfer during a fire event [35].
A key feature of this new fire-rated DSC wall panel system is the clinch joint, which is formed using a press-joining technique that binds two steel pieces together without additional elements such as rivets or bolts. In press-joining, the metal interlock is created through a continuous forming process, where local metal deformation occurs using a male and female tool. This technology, originally developed in the automotive and aerospace industries [1], is now widely used for joining roof trusses [36].
The strength of a clinch joint depends on its geometry [37], the elastoplastic behaviour of the materials [38], and the applied loads [36]. Previous research has primarily evaluated clinch joint strength using lap shear tests [39]. Additionally, multi-axis loading tests, conducted using specially designed apparatus [40,41], have been developed to calibrate the strength of press joints under mixed loading conditions. There are two primary failure modes observed in low-quality clinches: (1) neck failure—caused by severe material thinning during the manufacturing process; (2) pull-out failure—similar to a snap button detaching from fabric, occurring due to insufficient interlocking. In contrast, high-quality seams typically fail through tearing on one side after sustaining substantial loads. This failure mode is characterized by significant deformation before ultimate failure, indicating strong joint performance [42].
While prior studies [37,38] have extensively examined the clinch manufacturing process and performance of a single clinched joint, limited research has explored the performance of clinched joint system in fire-rated wall panels.
While numerous studies have focused on DSC wall panels with conventional fasteners, the structural and failure behaviour of fire-rated DSC wall panels with clinch seam connections remains largely unexplored. This study specifically focuses on the panel’s response to flexural loading as it closely represents the primary loading condition in real-world applications, such as wind-induced pressures. To isolate the effects of individual wall components on overall performance, additional bending tests are conducted on panels without outer steel sheets and with partially opened clinch seams. Furthermore, mechanical characterization of the aerated concrete core, clinch seam connection, and outer steel shell is performed through tension, compression, and shear tests. The findings of this study will provide critical insights into the load-bearing mechanisms of clinched DSC wall panels, enhancing their design for improved structural resilience and fire safety. This research contributes to the advancement of modularised fire-rated DSC panels by testing clinch seam connections and understanding their structural behaviour under bending load.

2. Experimental Analysis

2.1. Testing Material Properties of the Panel Constituents and the Seam Strength

A section of the wall panel is shown in Figure 1a with the key dimensions indicated in Figure 1b,c. It consists of a steel outer shell that is filled with aerated concrete foam. The panel is constructed by two roll-formed steel half shells with 0.45 mm thickness that are assembled to a hollow profile with clinch joints on both the top male and bottom female sides (see Figure 1b,c). After assembly, the panel is filled with lightweight foam concrete which is cured at room temperature for a minimum of 28 days.
Figure 1. The wall panel design: (a) panel constituents; (b) cross-section with key dimensions indicated, units are in millimetres; and (c) schematic of the top view illustrating the dimensions of the lock seam.
Buildings 15 01338 g001

2.1.1. Analysis of the Mechanical Properties of the Outer Steel Shell Material

The outer steel shell has a thickness of 0.45 mm. Tensile tests were conducted using an Instron tensile tester equipped with a 50 kN load cell, following ASTM E8 [43]. Dog bone-shaped specimens were CNC-milled from the flat coil material along the rolling direction. The loading rate was set to 6 mm/min, and a video extensometer was used to record strain data.

2.1.2. Analysis of the Aerated Core Structure and Density

Phase-contrast X-ray Computed Tomography (PCX-CT) was used to characterize the microstructure of the foam concrete (Figure 2a). A cuboid specimen (10 mm × 10 mm × 15 mm) was cut from the centre of the as-received concrete using a vertical band saw. After three-point bending on the full wall panel, the steel outer shell was removed, and a similar-sized specimen was extracted from the damaged concrete core beneath the punch indentation zone. The extraction location and cross-section are illustrated in Figure 2b.
The X-ray beam was generated at 110 kV with a source power of 5 W. The specimens were mounted on a 360-degree rotating stage with 0.5-degree steps along the vertical axis. As the X-ray passes through the solid mortar material, its intensity decreases, and this attenuation is captured by the detector. The distance from the X-ray source to the rotation axis (R1 in Figure 2a) was 148 mm, while the distance from the source to the detector (R2 in Figure 2a) was 303 mm, resulting in a calibrated magnification of 7.23 µm/pixel. A total of 721 projection images were acquired, along with background images (taken without samples). These were batch-processed using X-TRACT [44], yielding 1400 cross-sectional slice images. Table 1 lists the parameters used for the image processing.
Figure 2. (a) Micro-CT setup; and (b) location where the cuboid sample was taken.
Buildings 15 01338 g002

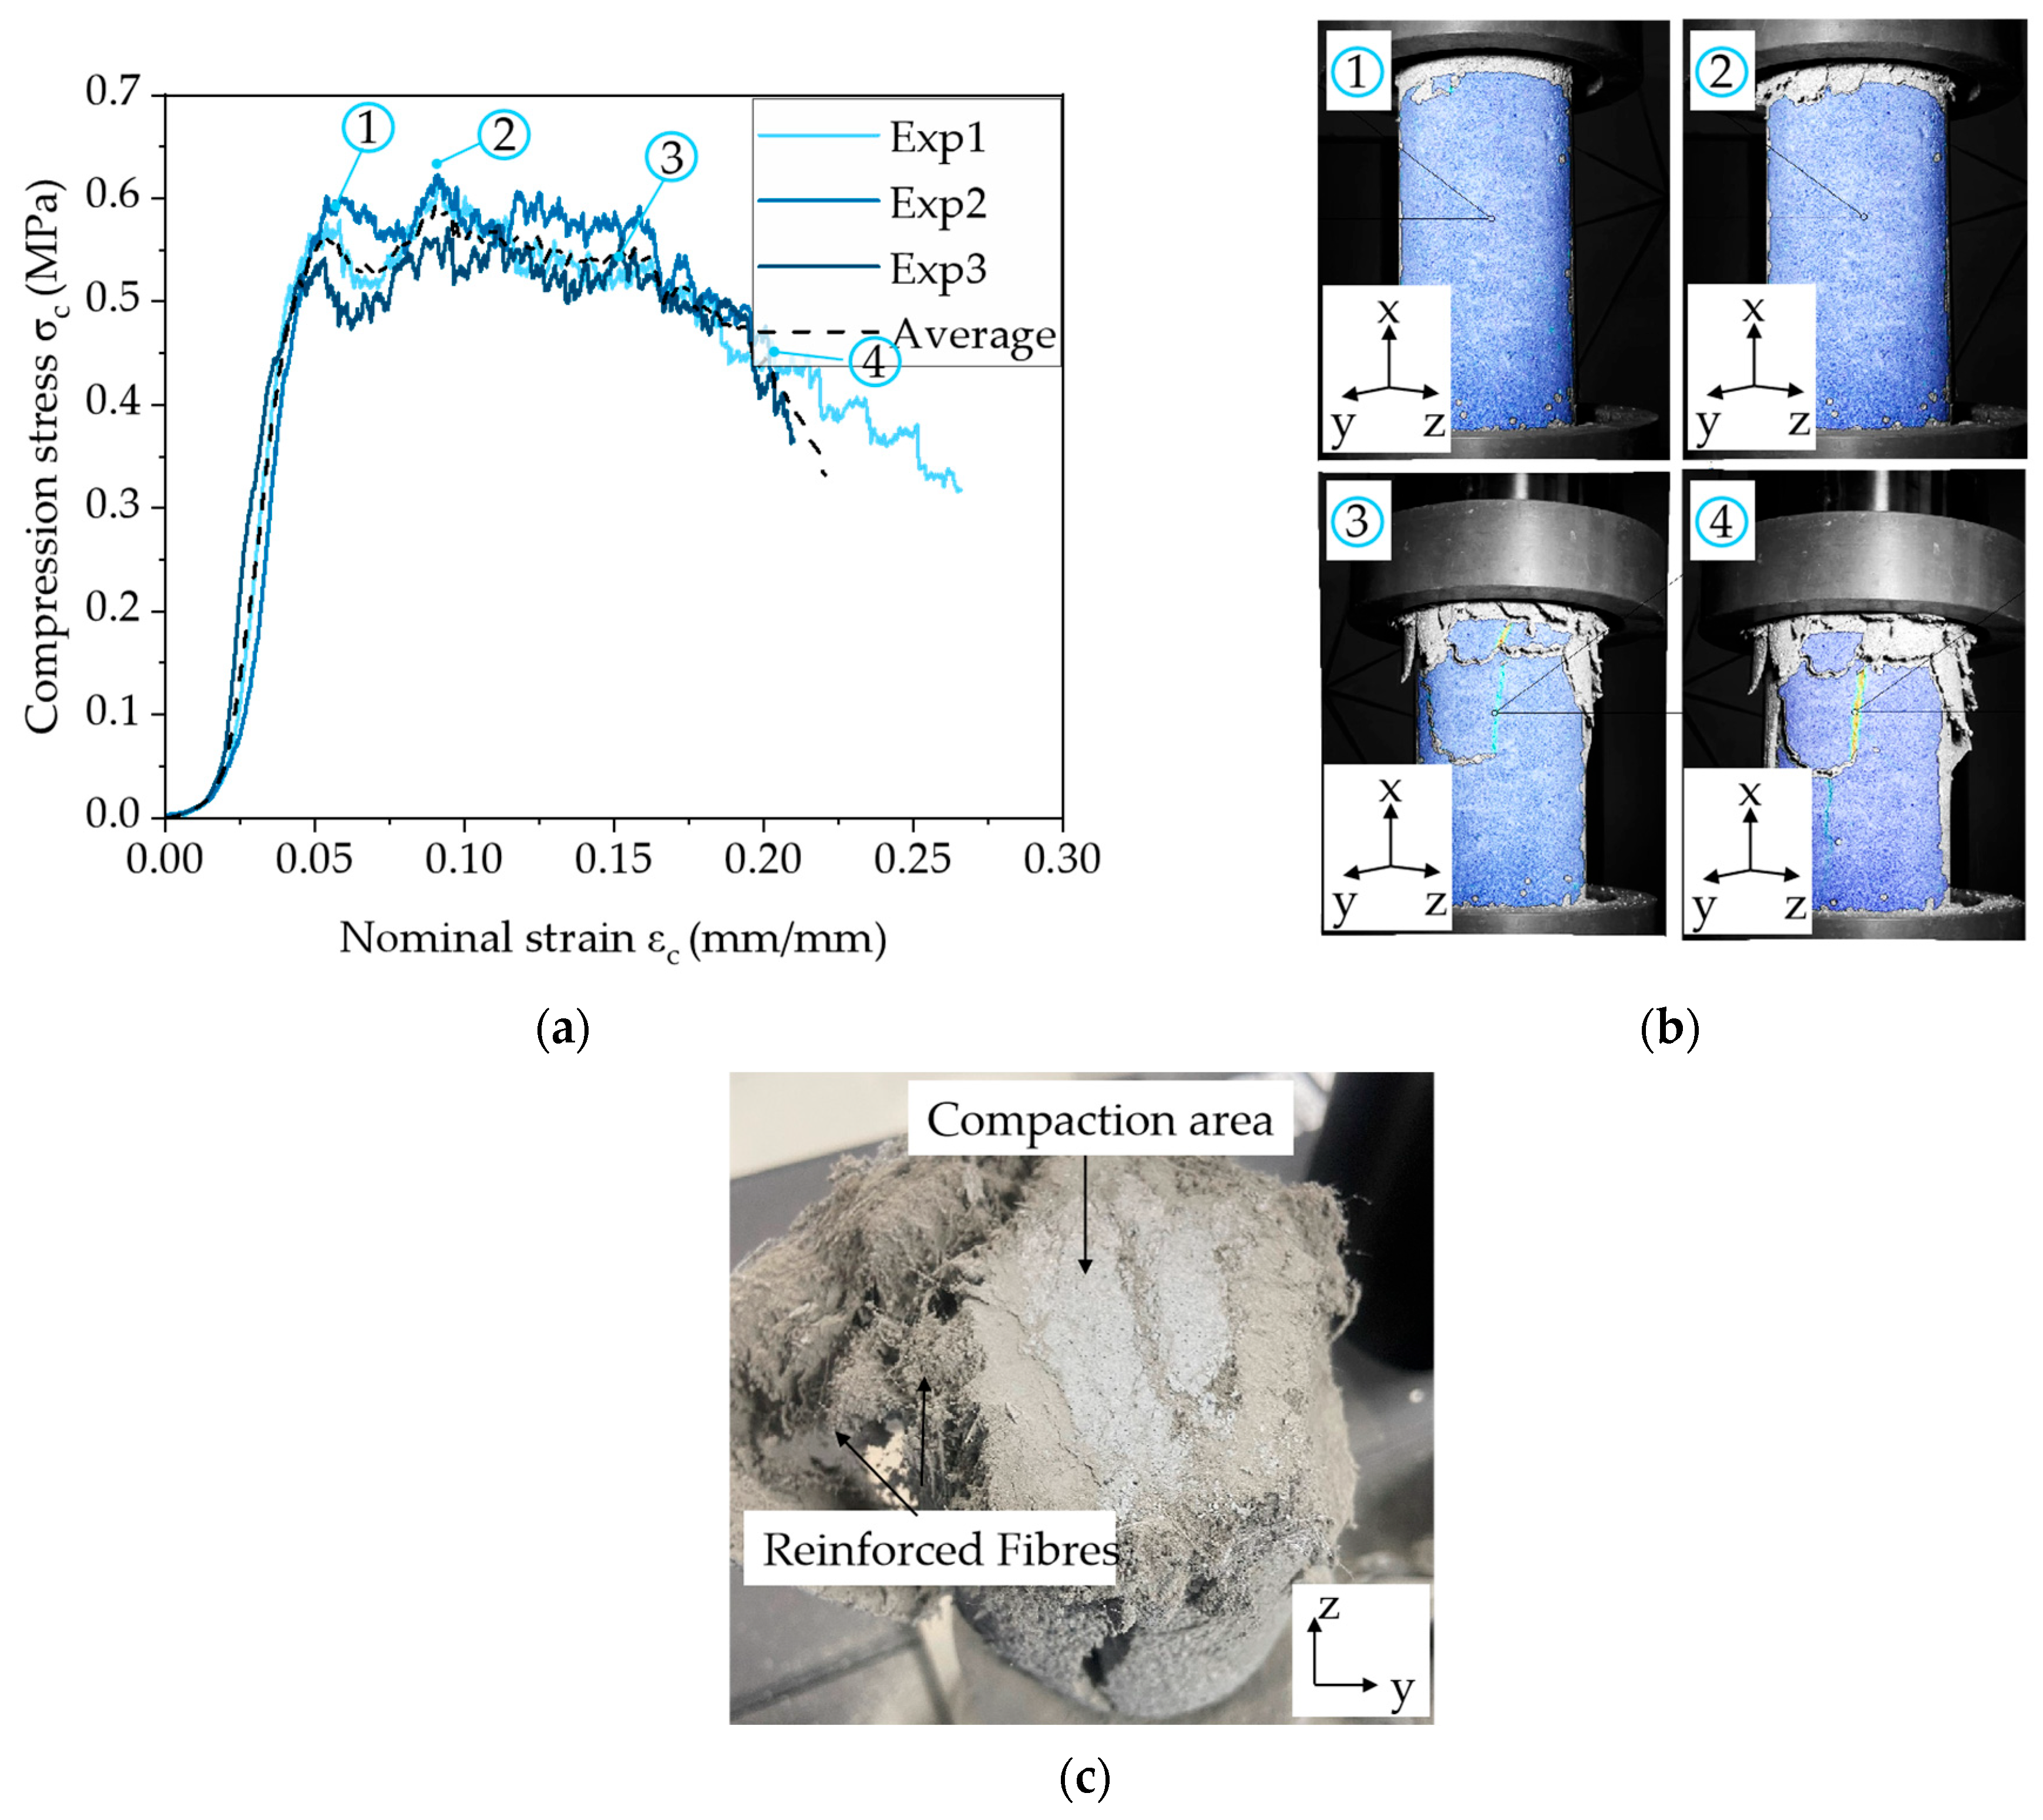
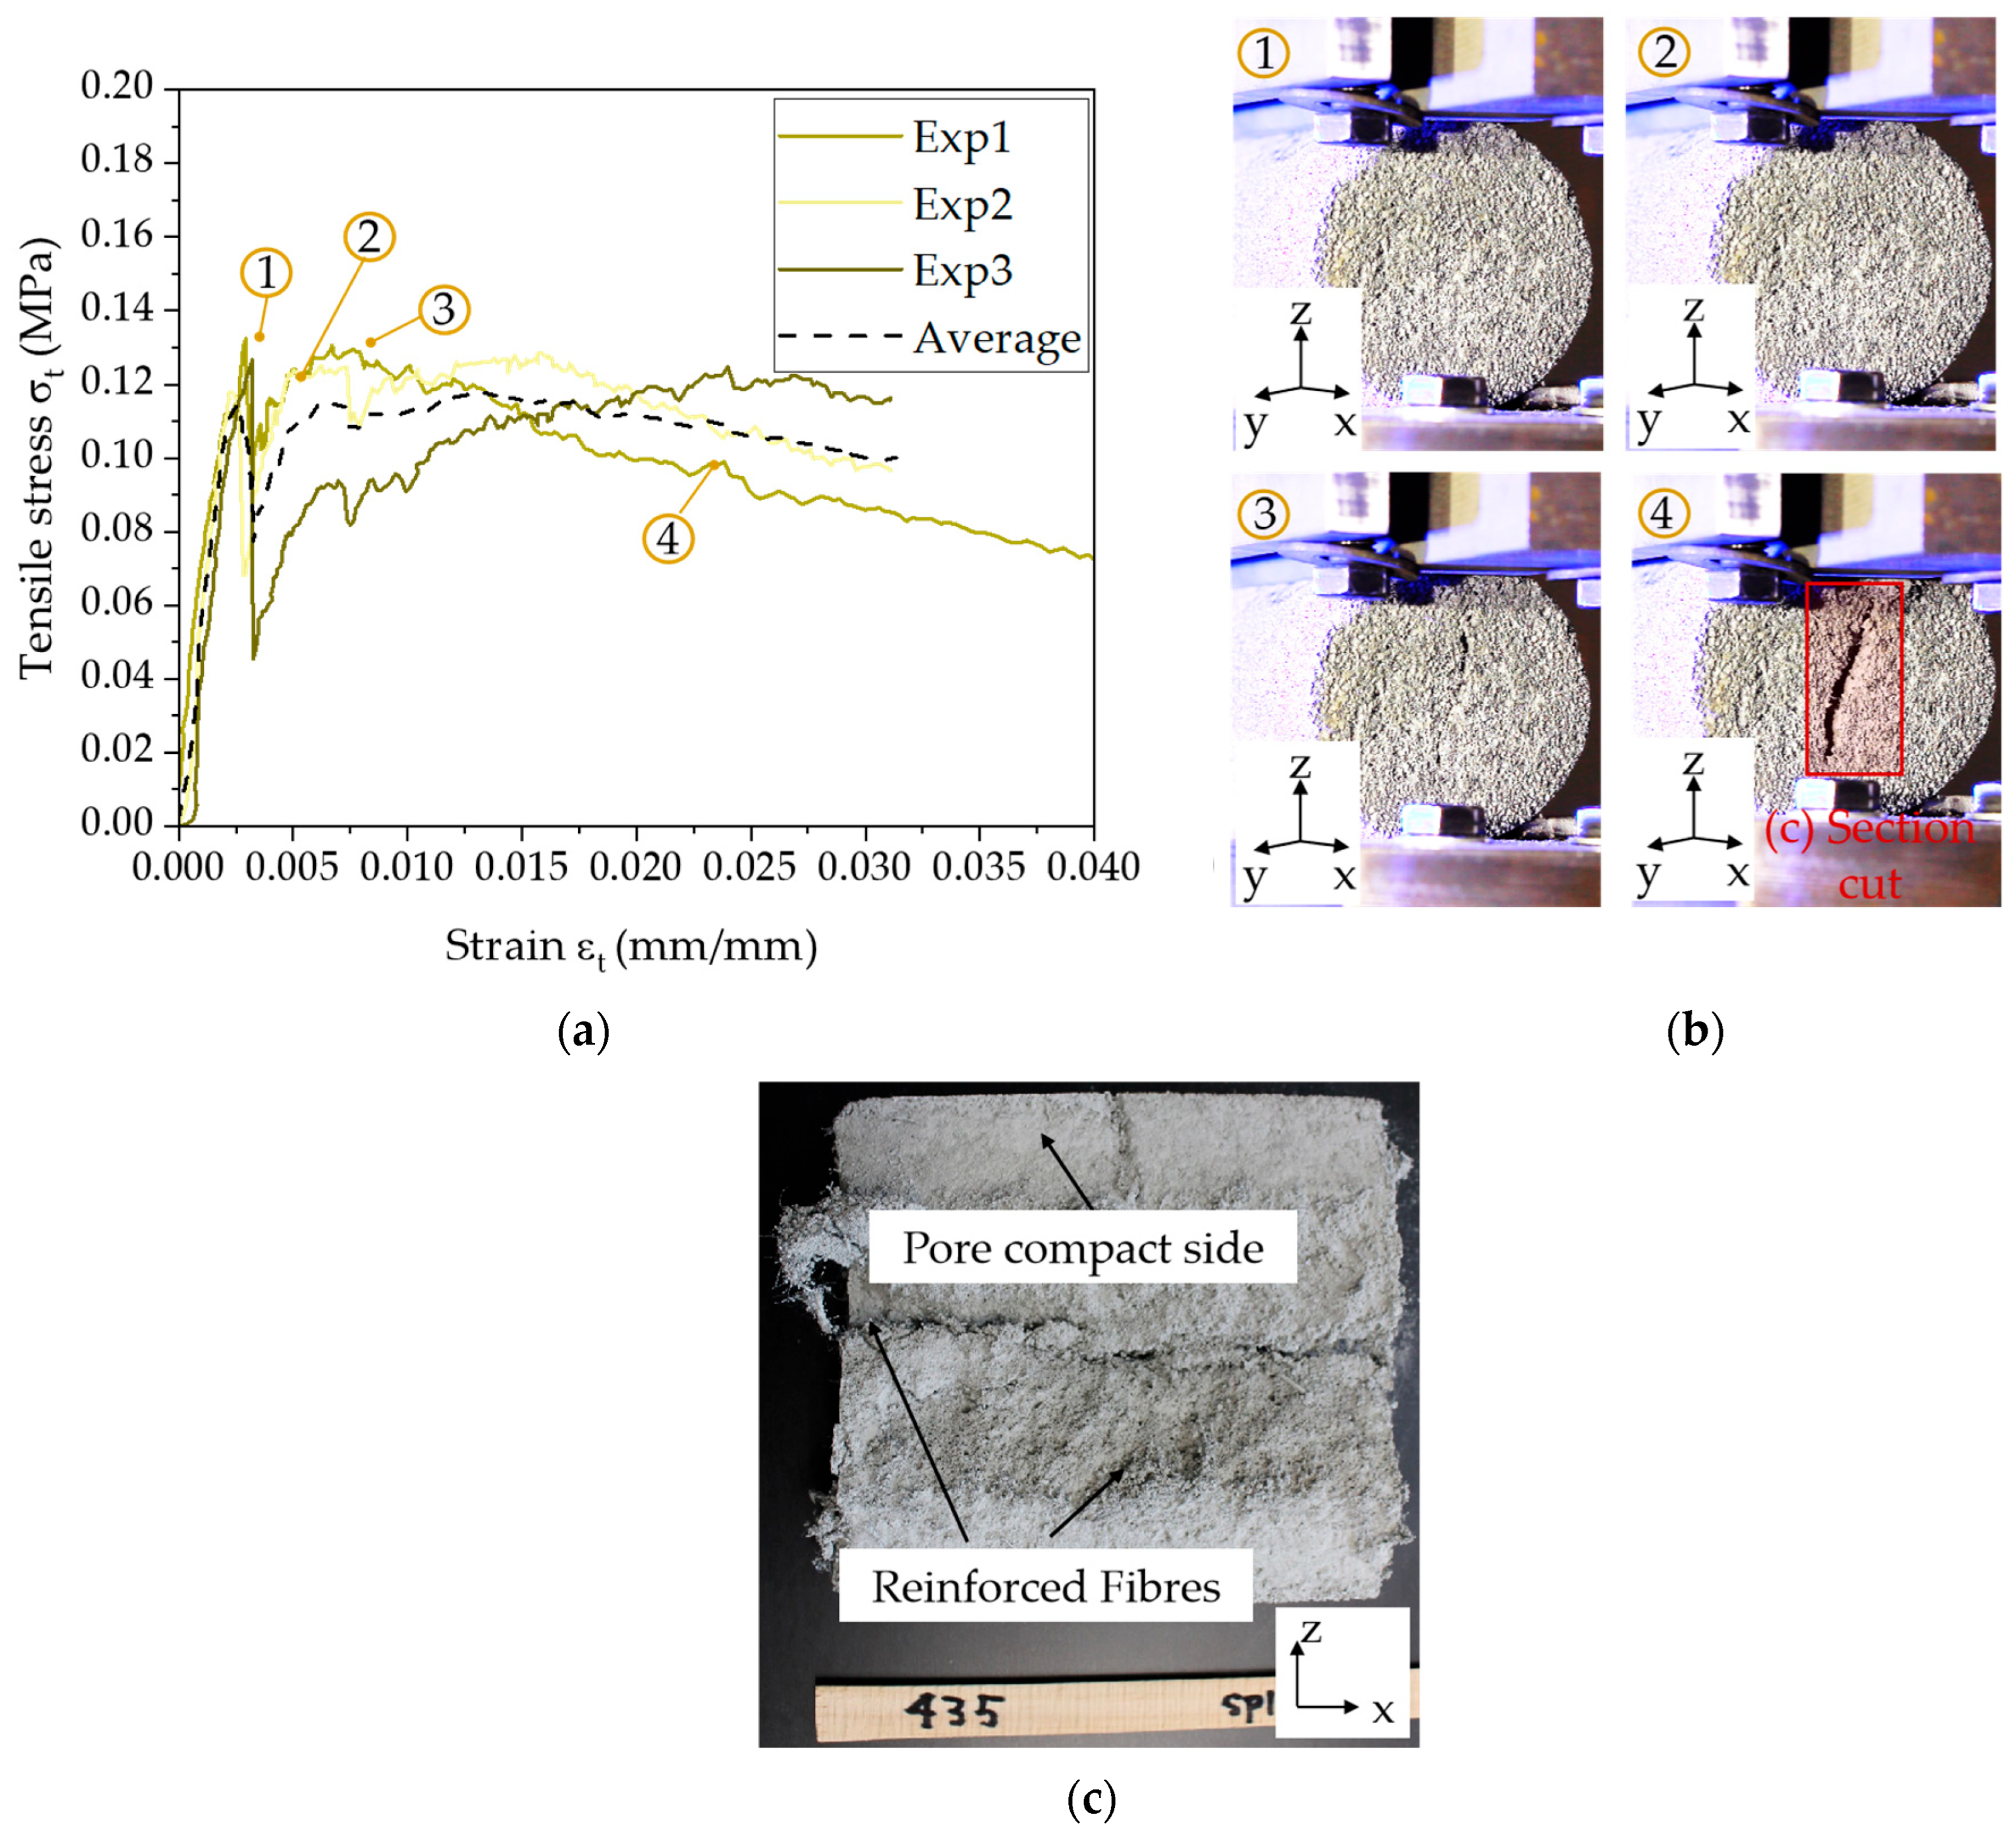
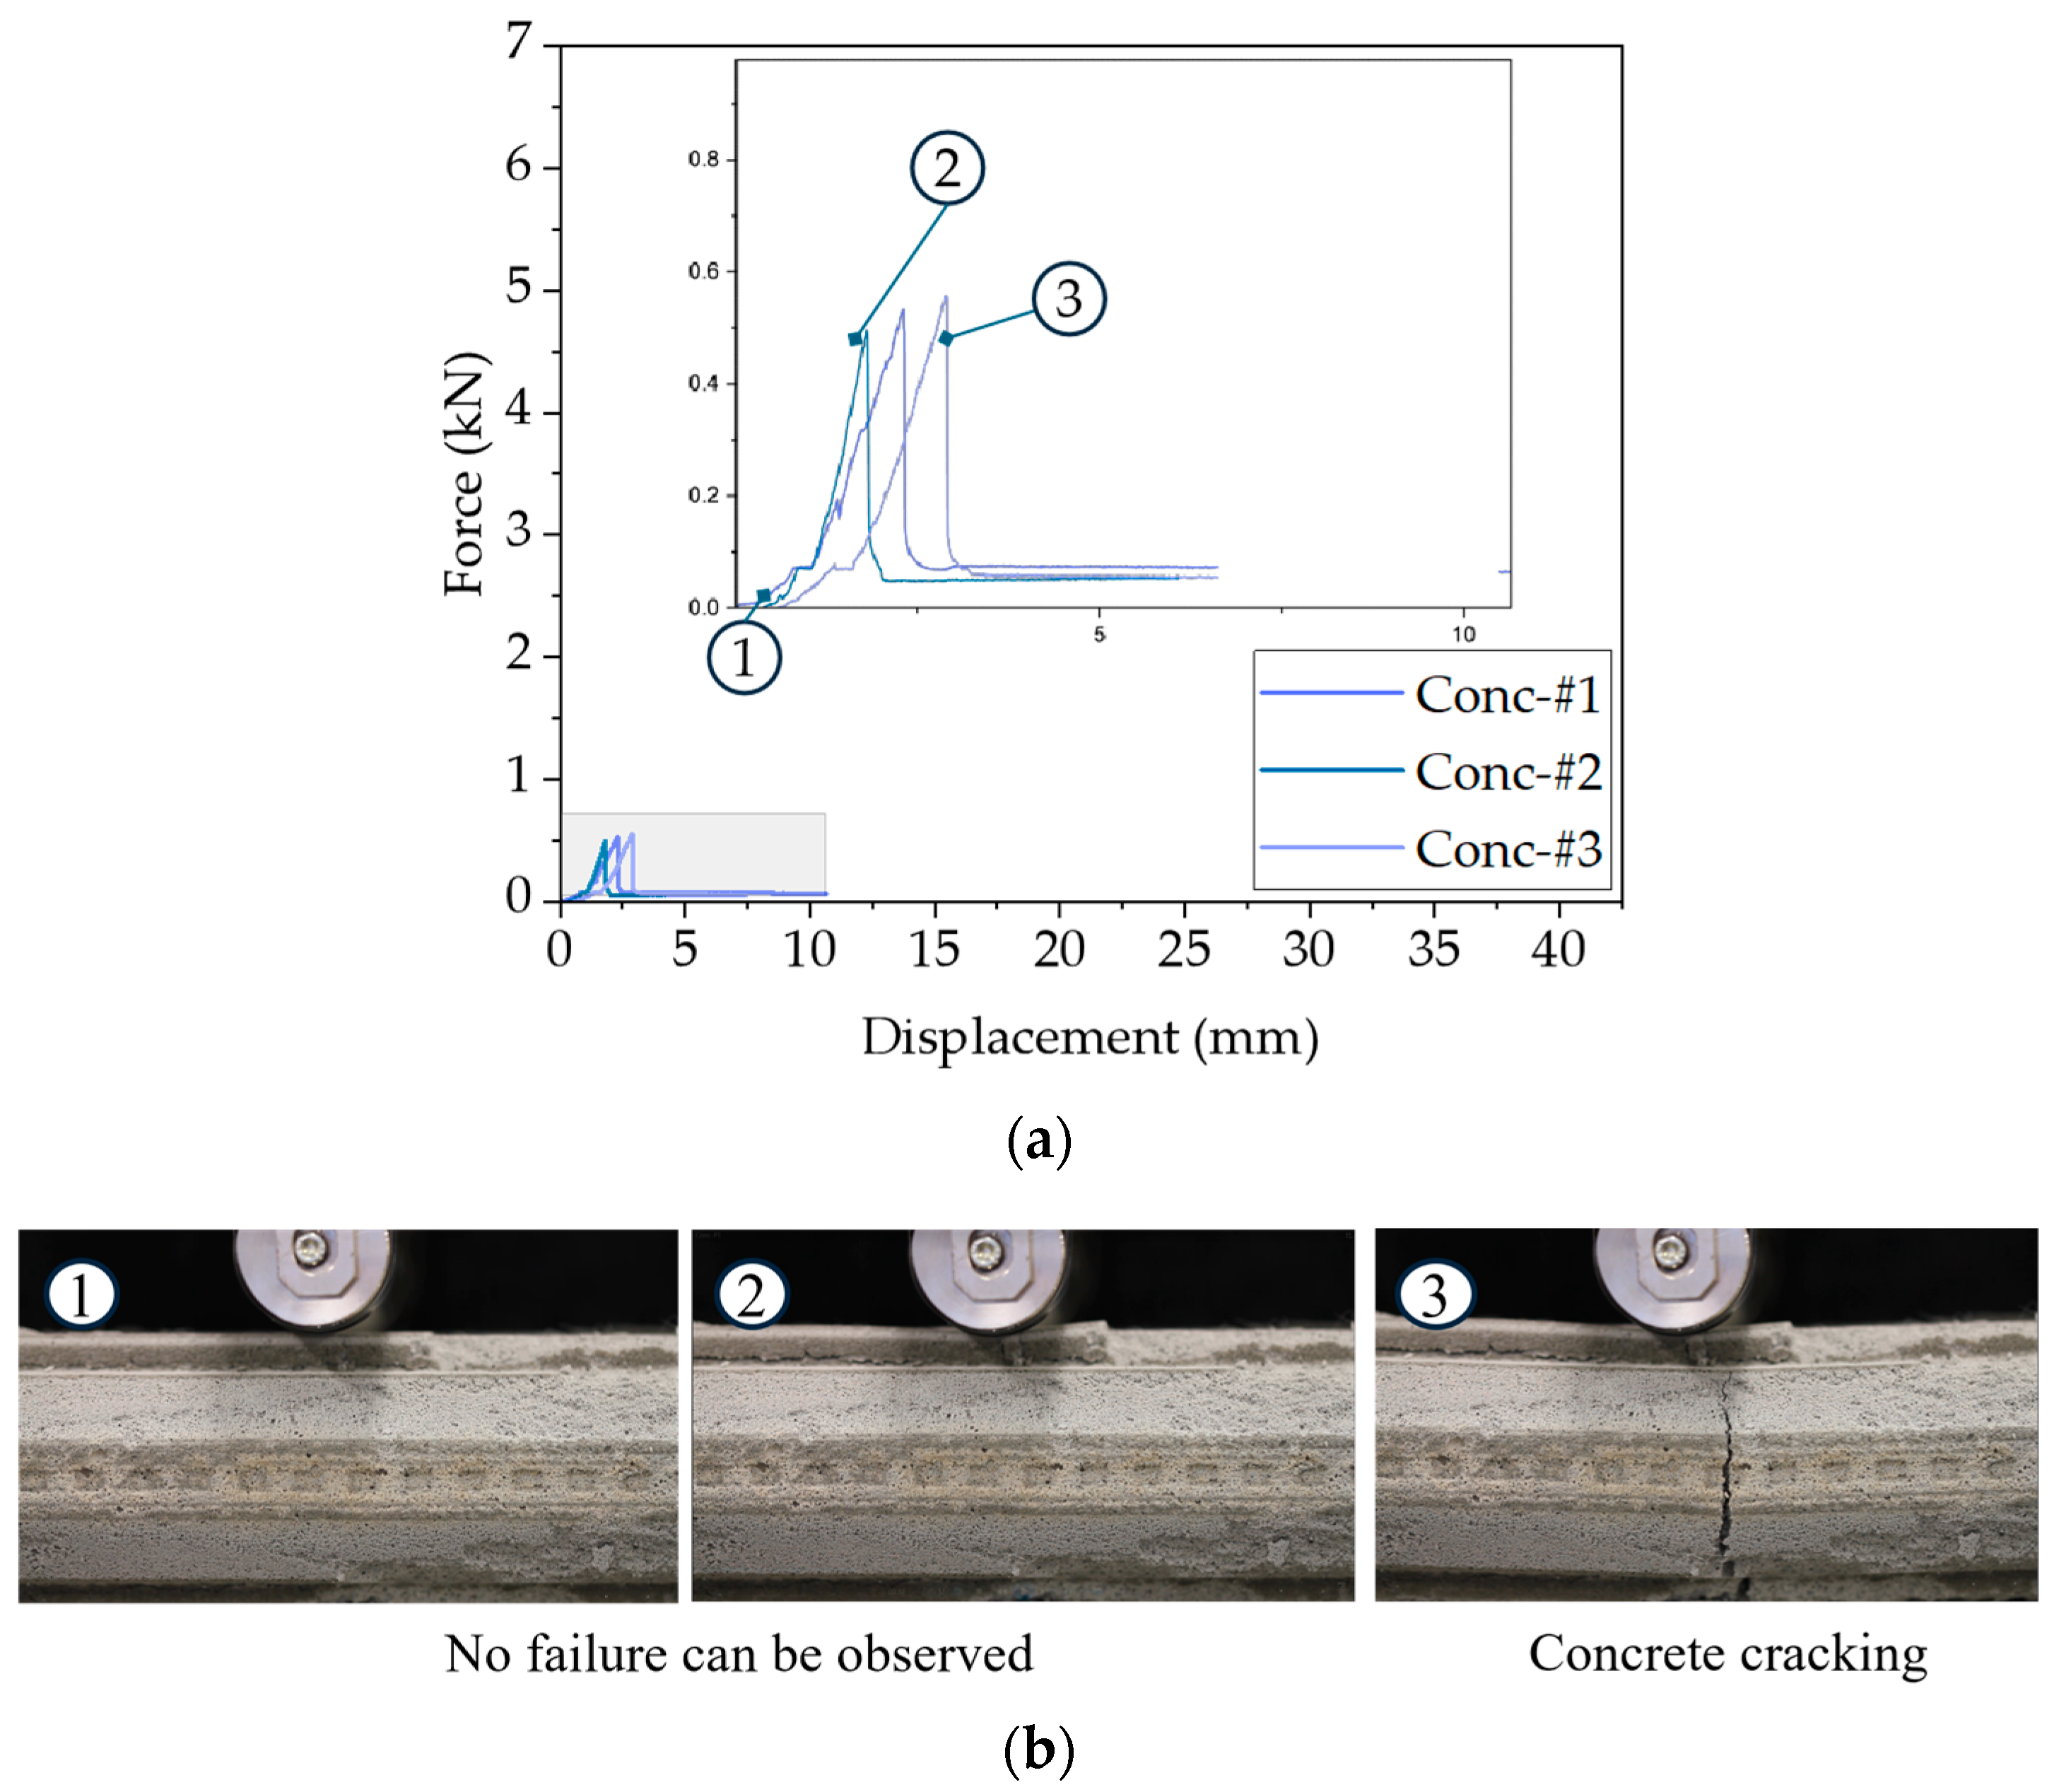
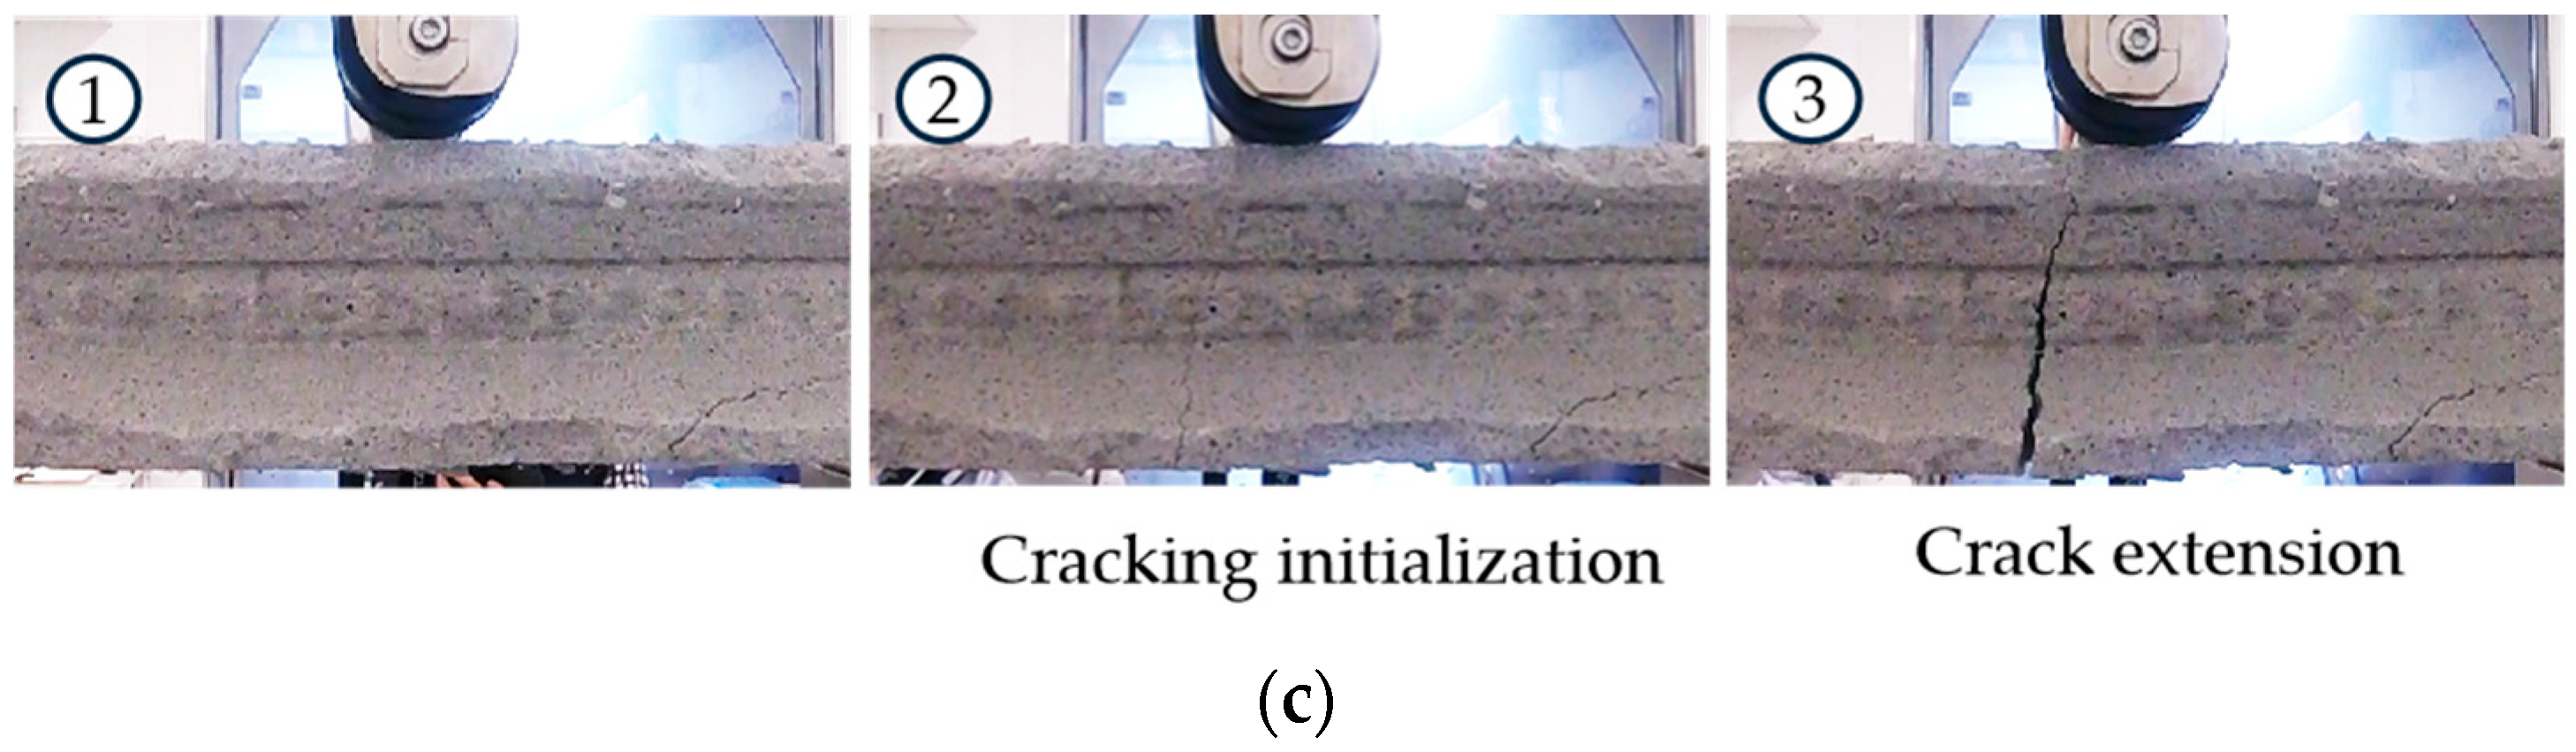
2.1.3. Compression and Splitting Tests on the Aerated Concrete Core

Cylindrical concrete specimens with a diameter of 75 mm and a height of 150 mm were poured into steel cylinders and cured for minimum 28 days. The aerated concrete core had a specified density of 435 kg/m3. This was followed by unconstrained compression and splitting tensile tests, following ASTM C39 and C496 standards, respectively [45,46].
The tests were performed using an Instron tensile tester equipped with a 50 kN load cell. The splitting tensile test (see Figure 3b) used a Digital Image Correlation (DIC) system, GOM Aramis 3D [47], to measure the transverse extension of the specimen during the test. For this, the specimen surface was coated with a black and white speckle pattern and images were captured at a rate of 1 frame per second to enable the DIC measurement. The splitting tensile strength σ t was determined with Equation (1):
σ t = 2 F t / π l d
where F t denotes the maximum applied load, l is the cylinder length, and d represents the diameter of the tested sample. The nominal tensile strain ε t is calculated by applying the change in transverse extension δ t , obtained from the DIC data, using Equation (2):
ε t = δ t / d
A schematic of the compression test, along with the images of the specimen placed between the compression plates, is presented in Figure 3c. The compressive strength σ c of the aerated concrete is a function of the measured compression force F c and is determined as follows:
σ c = 4 F c / π d 2
The nominal compressive strain ε c is obtained by Equation (4):
ε c = δ c / l
where δ c denotes the compression crosshead displacement.
Figure 3. (a) Schematic of the tested sample dimensions; schematic of the experimental setup of (b) the split tensile; and (c) the compression test; units are in millimetres.
Buildings 15 01338 g003

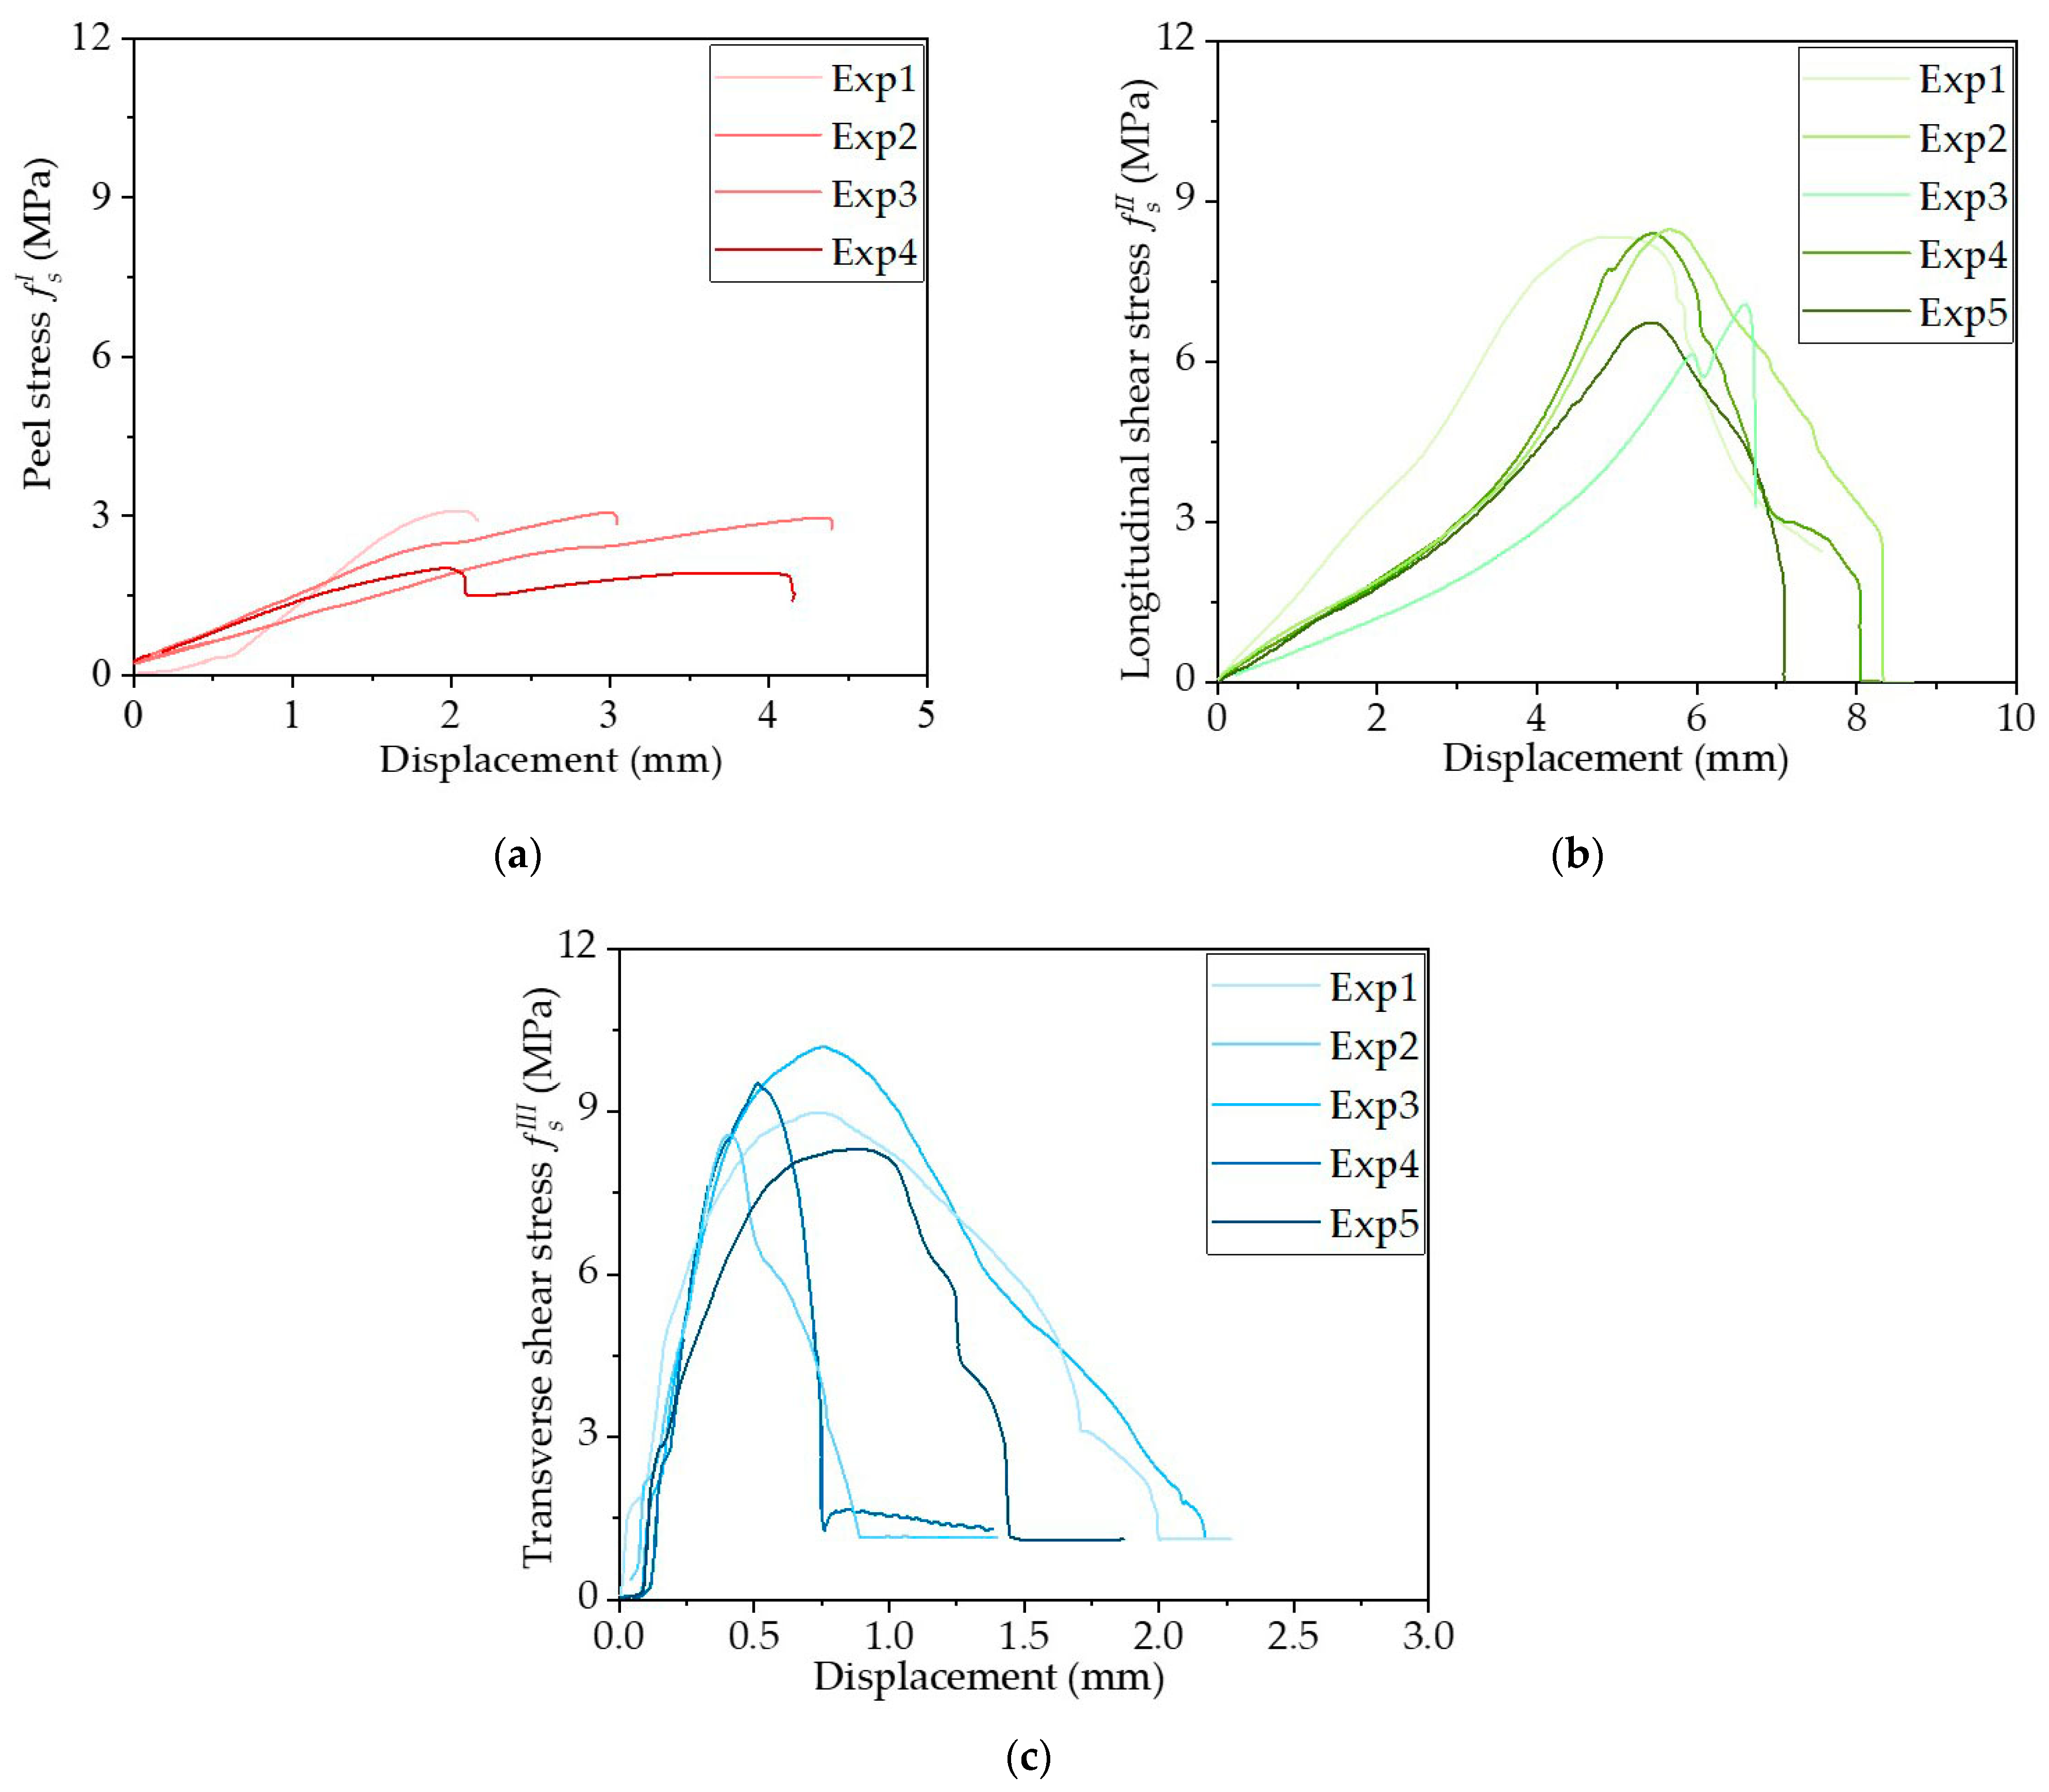
2.1.4. Testing the Strength of the Clinch Joint Connection

To assess the clinch seam strength for different failure modes, three distinct loading conditions were applied, as schematically illustrated in Figure 4. To prepare the samples, large sections of the clinch seam were first cut from the steel shell using an angle grinder. The specific sample dimensions were then precisely cut with a DISCOTOM-100 (Struers, Ballerup Denmark). The Mode I opening was tested using a peel-type test arrangement, where the clinch seam strip was partially opened, allowing the two ends of the seam area to be clamped in the tensile grips. A tensile displacement was then applied, as shown in Figure 4a. For Mode II (longitudinal shear), a tensile load was applied along the seam length direction on samples containing three clinch seams, as shown in Figure 4b. Mode III (transverse shear) involved testing samples that included one full clinch seam and two half seams, with a tensile load applied perpendicular to the seam length direction, as shown in Figure 4c.
In all tests, the force–displacement response was recorded, and the reaction force was normalized by the number of seams tested in the respective sample: one seam for Mode I, three seams for Mode II, and two seams for Mode III. Equation (5) was used to determine the nominal clinch seam strength,
f s I , I I , I I I = P / n A
where the superscripts I , I I , I I I denote three different seam failure strengths, P is the applied load, and n and A represent the number of the seams in the tested sample and the area of one single clinch seam, respectively. See Figure 1c.
It should be noted that the direct measurement of the sample deformation on the surface was not possible. Therefore, the test results presented here include both the elastic deflection of the tensile grips and the effect of the re-straightening of the curved samples.
Figure 4. Clinch seam strength tests: (a) Mode I, Peel test; (b) Mode II, Transverse Shear; and (c) Mode III, Longitudinal Shear.
Buildings 15 01338 g004

2.2. Testing Structural Loading Behaviour

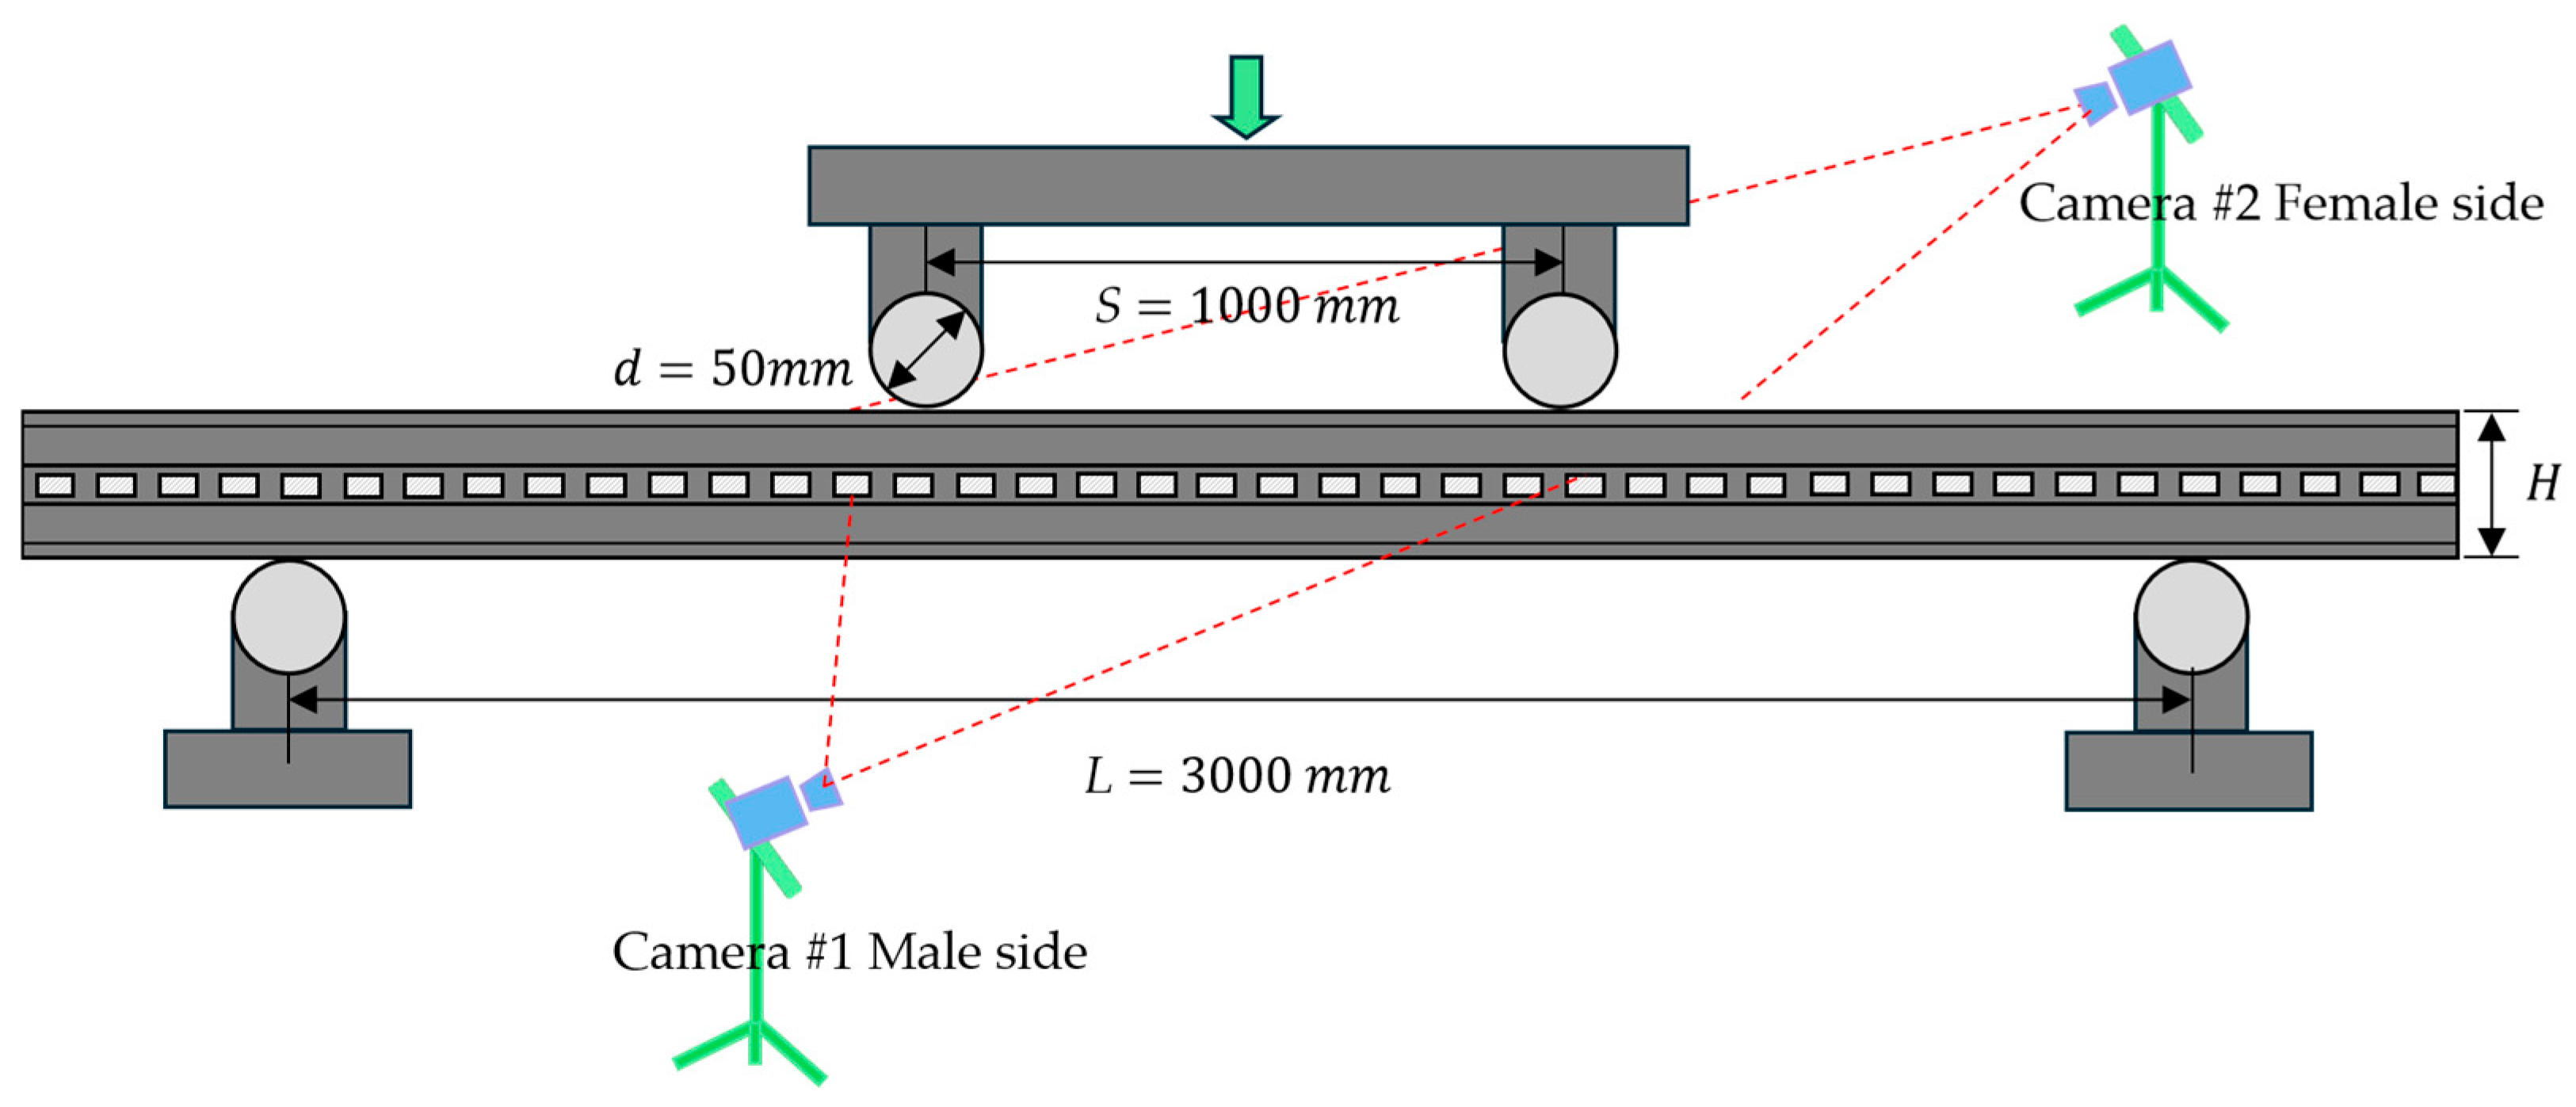
2.2.1. Four-Point Bending Test

A large-scale four-point bending test, as shown in Figure 5, was performed to investigate the load-bearing capacity of the wall panel. The setup consists of two steel rod bottom supports, each with a diameter of 50 mm, spaced 3000 mm apart, and a top punch tool with two steel rods spaced 1000 mm apart. To prevent local penetration of the wall panels by the steel rods, steel plates, 10 mm thick and 30 mm wide, were placed between the panel and the steel rods on both the bottom support and punch sides. A loading speed of 5 mm/min was applied. A 500 kN load cell was used to measure the reaction force during the test, and the crosshead displacement of the machine was documented.
Two high-resolution cameras were positioned to record the deformation and failure mechanisms during the test, one on the male side (Camera #1) and the other on the female side (Camera #2) of the panel. The camera measurements were synchronized with the force–displacement data recorded by the testing facility.
Figure 5. Four-point bend test including 2 cameras to analyze the deformation and failure mechanisms in the male and female seams depending on the crosshead displacement.
Buildings 15 01338 g005

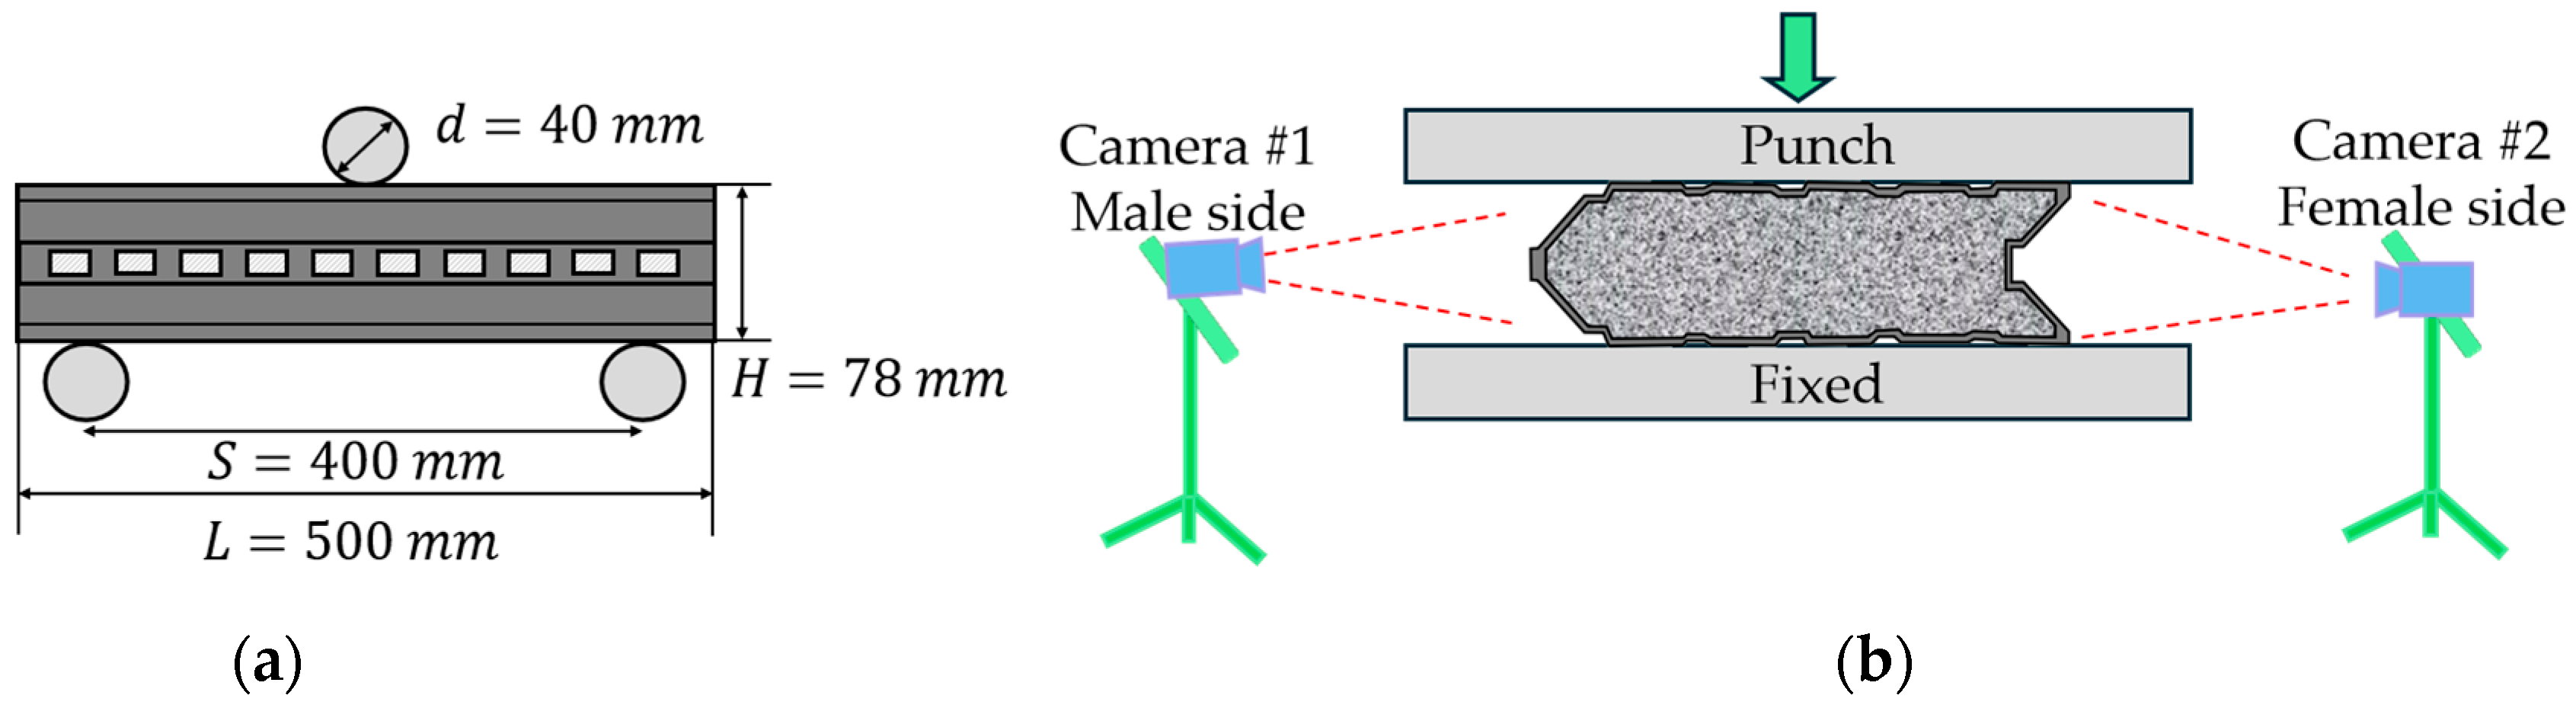
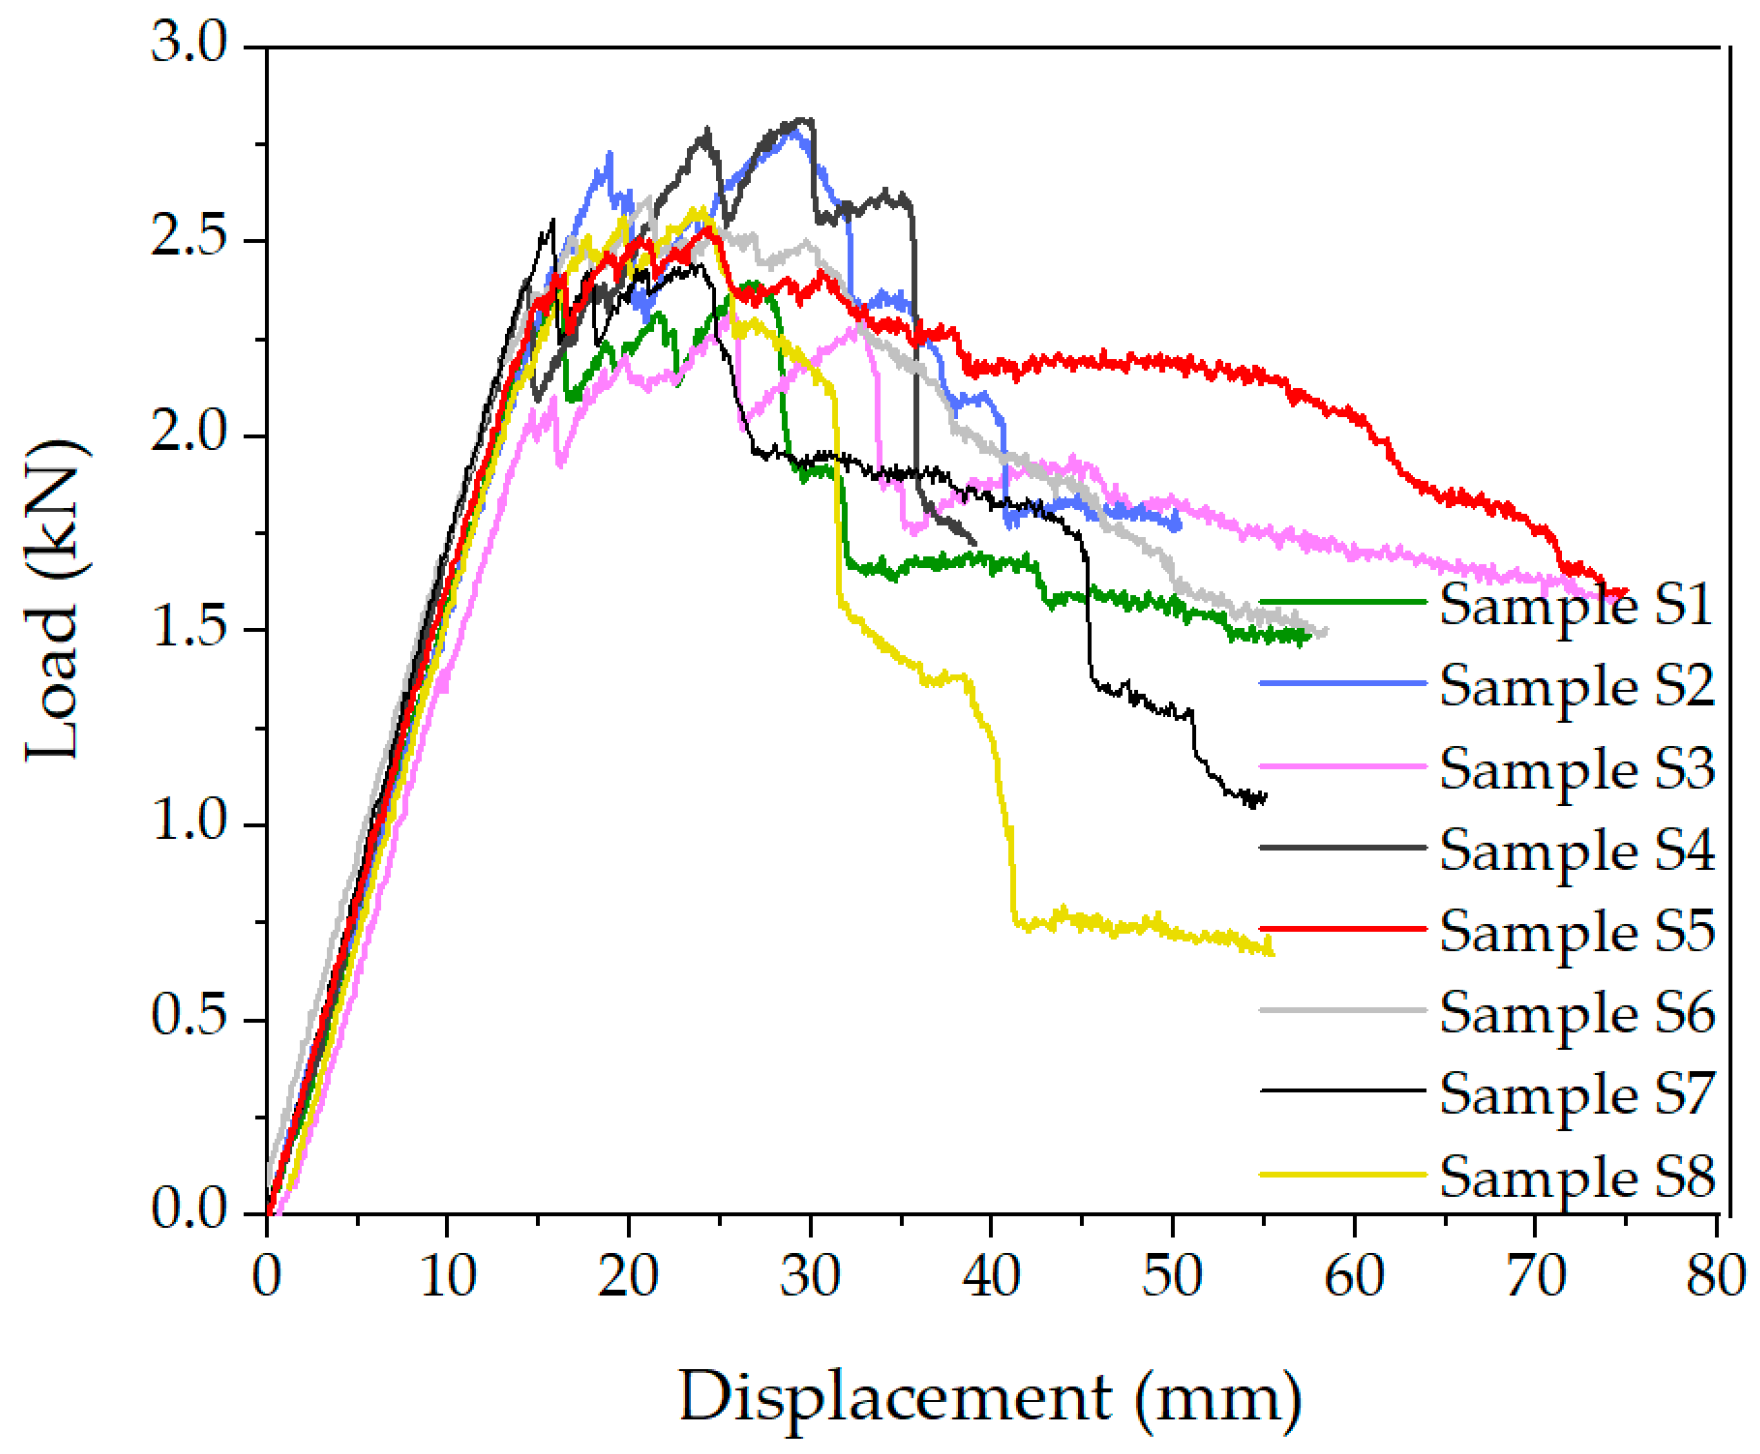
2.2.2. Three-Point Bending Test

A smaller-scale three-point bending test was conducted to investigate the impacts of different panel constituents on the load-bearing capacity and failure mode. The test setup is illustrated in Figure 6a,b, which show the key dimensions. A loading rate of 5 mm/min was applied. Similarly to the large-scale four-point bending test, two cameras were used to monitor the failure of the clinch seams on both the male and female sides, as shown in Figure 6b. Three conditions were tested: (1) aerated foam concrete samples extracted from the wall panels; (2) wall panels with all clinch seams opened using an angle grinder before testing; (3) wall panels with intact and closed clinch seams.
Figure 6. 3-point bend test including 2 cameras to analyze deformation and failure mechanism in the male and female seams: (a) front view of the test setup with detailed dimensions; (b) side view.
Buildings 15 01338 g006

3. Experimental Results

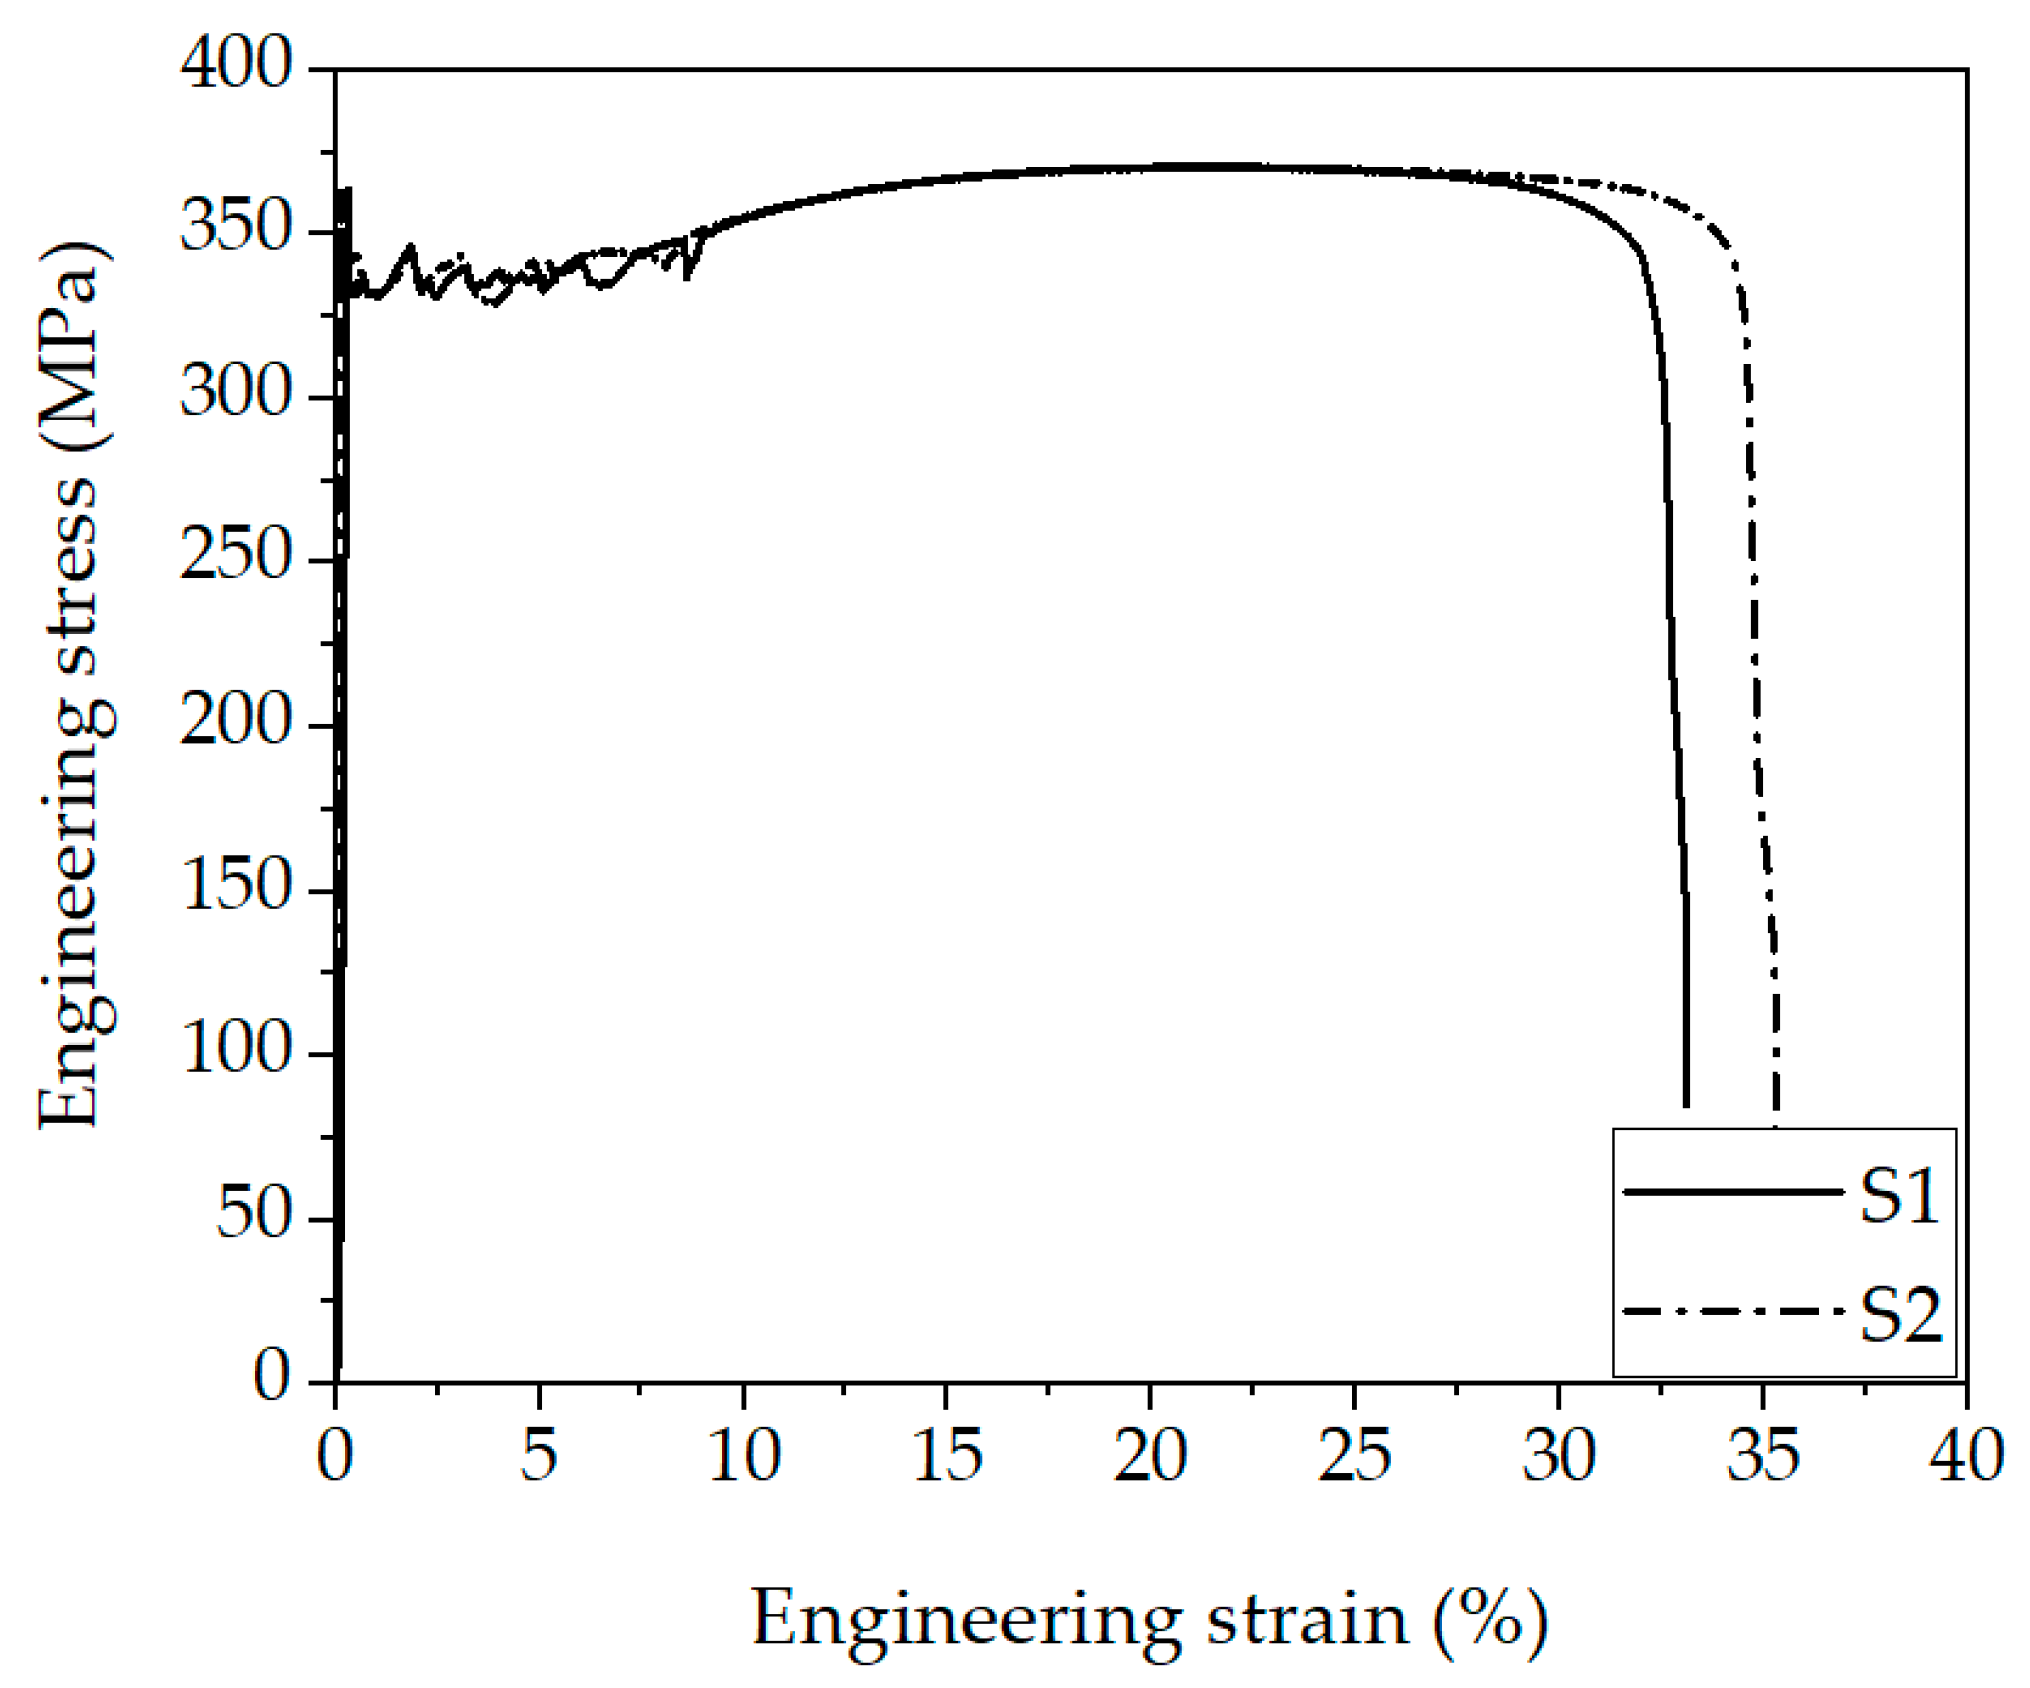
3.1. Mechanical Properties of the Steel

The engineering stress–strain curves of the steel measured in the rolling direction are shown in Figure 7 and the tensile parameters, averaged from the two results, are given in Table 2. The material has an average yield strength of YP0.02% = 295 MPa with an approximate Uniform Elongation of UE = 22.3%.
Figure 7. Engineering stress–strain curves of the G300 steel.
Buildings 15 01338 g007

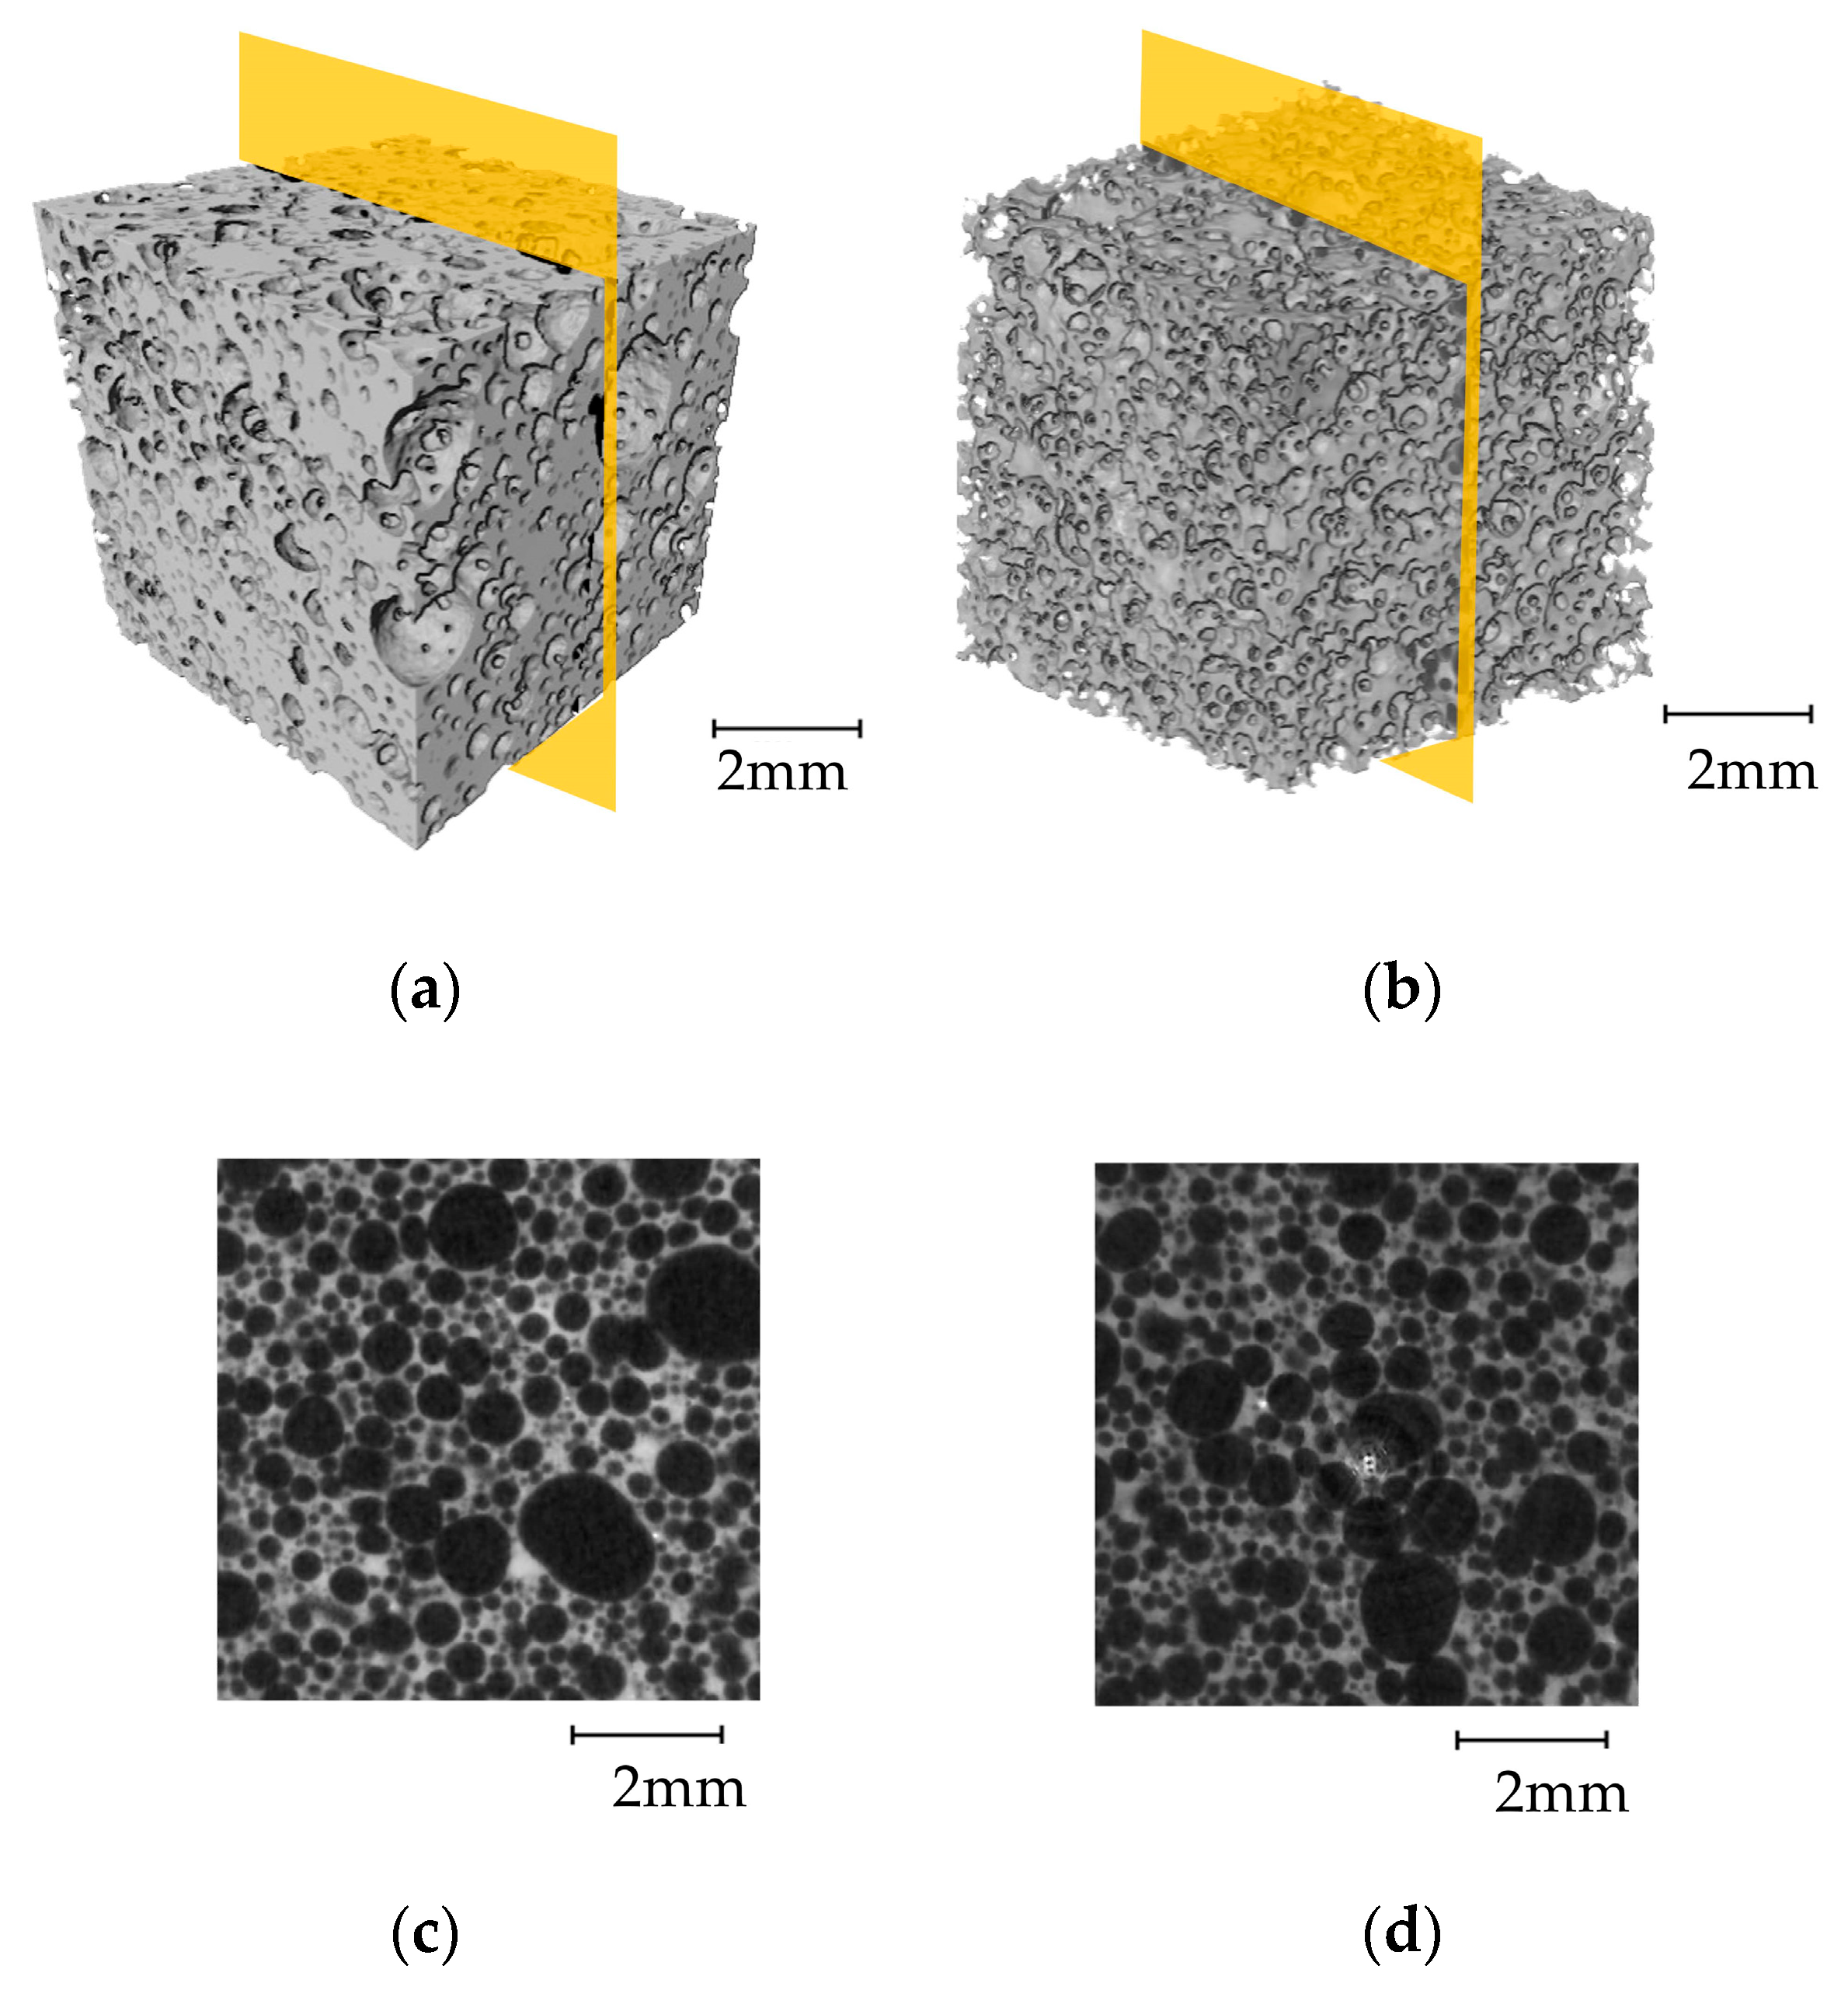
3.2. Structure and Density of the Aerated Concrete Core Before and After Deformation

The 3D-rendered cuboid models and 2D slice images taken from the middle of the cuboid specimen are shown in Figure 8a,d. In the slice images, the mortar appears as high-intensity areas, while the pores are shown in darker colours. The “Volume3D” value was used to compare the measured volume and the percentage of pores relative to the overall cuboid volume, and these values are listed in Table 3. Although the density of the mortar was not directly measured in this study, it was assumed to be between 1350 kg/m3 and 2070 kg/m3 [48]. Based on this assumption, an estimated density range for the foam concrete was determined, as shown in Table 3. The density range derived from the CT scans is higher than the reference value of 450 kg/m3. However, the analysis indicates that CT scanning is a useful tool for investigating pore size, shape, and distribution in aerated concrete cores. During the preparation of the CT specimens, the low-density core became fragile after being severely loaded, which caused mortar fragments to spall off and escape from the specimen’s skeleton. As a result, the initially measured mortar volume decreased from 160.2 mm3 in the as-received concrete to 145.8 mm3 after the 3-point bending test (Table 3).
The CT analysis also reveals the heterogeneous structural characteristics of the lightweight foam concrete, showing a highly non-uniform void distribution and significant variation in void sizes. The pores are irregularly dispersed throughout the concrete matrix, leading to local density fluctuations and potential stress concentration zones. Some areas exhibit densely packed micro voids, while others contain large, interconnected pores, which may affect the mechanical integrity of the aerated concrete core under loading.
Figure 8. Three-dimensional reconstructed models are shown for (a) concrete core without loading and (b) concrete core after the 3-point bend test has been performed. Two-dimensional slice images of the cube sample are given at the bottom, and the two-dimensional images are selected from the middle of the cube: (c) without loading; and (d) after the 3-point bending.
Buildings 15 01338 g008

3.3. Mechanical Properties of the Aerated Core

The compressive stress–strain curves for the aerated foam core are shown in Figure 9a, along with images of the deformed sample at the critical stages of testing in Figure 9b.
Figure 9. Compression test: (a) compression stress strain curves; (b) samples located in the compression test with the critical crack extension stages shown; (c) top view of a tested sample with the compacting area indicated.
Buildings 15 01338 g009
In the initial stages of deformation, the core material is compressed elastically, followed by the initiation of cracks near the top plate (see Figure 9b, stage ②). After this, a steady deformation stage occurs, during which the material continues to crack while the compressive force remains unchanged (see Figure 9b, stage ②–③). This is likely due to concrete compaction, which increases the load-bearing capacity and counteracts the load reduction caused by concrete cracking [49]. Figure 9c shows the top of the concrete cylinder after the test, indicating clear areas of concrete compaction. Towards the end of deformation (see Figure 9b, stage ④), concrete cracking becomes excessive, and the load-bearing capacity of the concrete decreases by approximately 50% compared to the initial maximum compressive stress value measured at crack initiation.
The tensile stress–strain curves for the concrete, determined from the concrete splitting test, are shown in Figure 10. Similarly to the compression test, there is an area where the concrete is compacted during deformation (see Figure 10a,b, stages ①–②). With continuing deformation, the concrete begins cracking and develops a split through the centre of the cylinder (see Figure 10b, stage ③). After this, excessive cracking of the cylinder, combined with concrete compaction, leads to a reduction in strength of approximately 40% compared to the initial maximum tensile stress (see Figure 10b, stage ④).
Figure 10. Splitting tensile test: (a) tensile stress strain curves; (b) sample located in the splitting test with the crack through the cylinder centre shown; (c) cross-section cut of a tested sample with the compacting side indicated.
Buildings 15 01338 g010
Note that the average maximum compressive stress of the aerated concrete core is σ c = 0.6   M P a which is approximately five times higher compared to the average tensile stress σ t = 0.12   M P a . This is comparable to conventional concrete, where the tensile strength is generally much lower than the compressive strength [50].

3.4. Clinch Seam Strength

The stress–displacement curves after testing the three modes of clinch seam strength are shown in Figure 11. The lowest seam strength is observed in the Mode I Peel test with an average peel strength of approximately f s I = 3   M P a , see Figure 11a. Both the Mode II Transverse shear test and the Mode III Longitudinal shear test show higher average strength values of approximately f s I I = 8   M P a and f s I I I = 9   M P a . There is a large variation in the displacement at which the maximum strength occurs, i.e., where seam failure initiates, between the different test conditions and even between test repetitions for the same condition. This variation may be related to the displacement being directly measured based on the crosshead movement, which leads to elastic deflection effects.
Figure 11. Clinch seam strength-displacement curves: (a) Mode I Peel tests; (b) Mode II Transverse shear tests; (c) Mode III Longitudinal shear tests.
Buildings 15 01338 g011

3.5. Structural Loading Behaviour and Failure Modes in Four-Point Bending

The load–displacement curves of the fully seamed and filled panels tested in 4-point bending are shown in Figure 12. It is clear that all panels exhibit very similar maximum strengths, ranging between 2.25 and 2.5 kN, while the residual load-bearing capacity after failure initiation varies significantly. Close examination of all panels suggested three distinct failure modes.
Figure 12. Load–displacement curves for the wall panels tested in 4-point bending.
Buildings 15 01338 g012

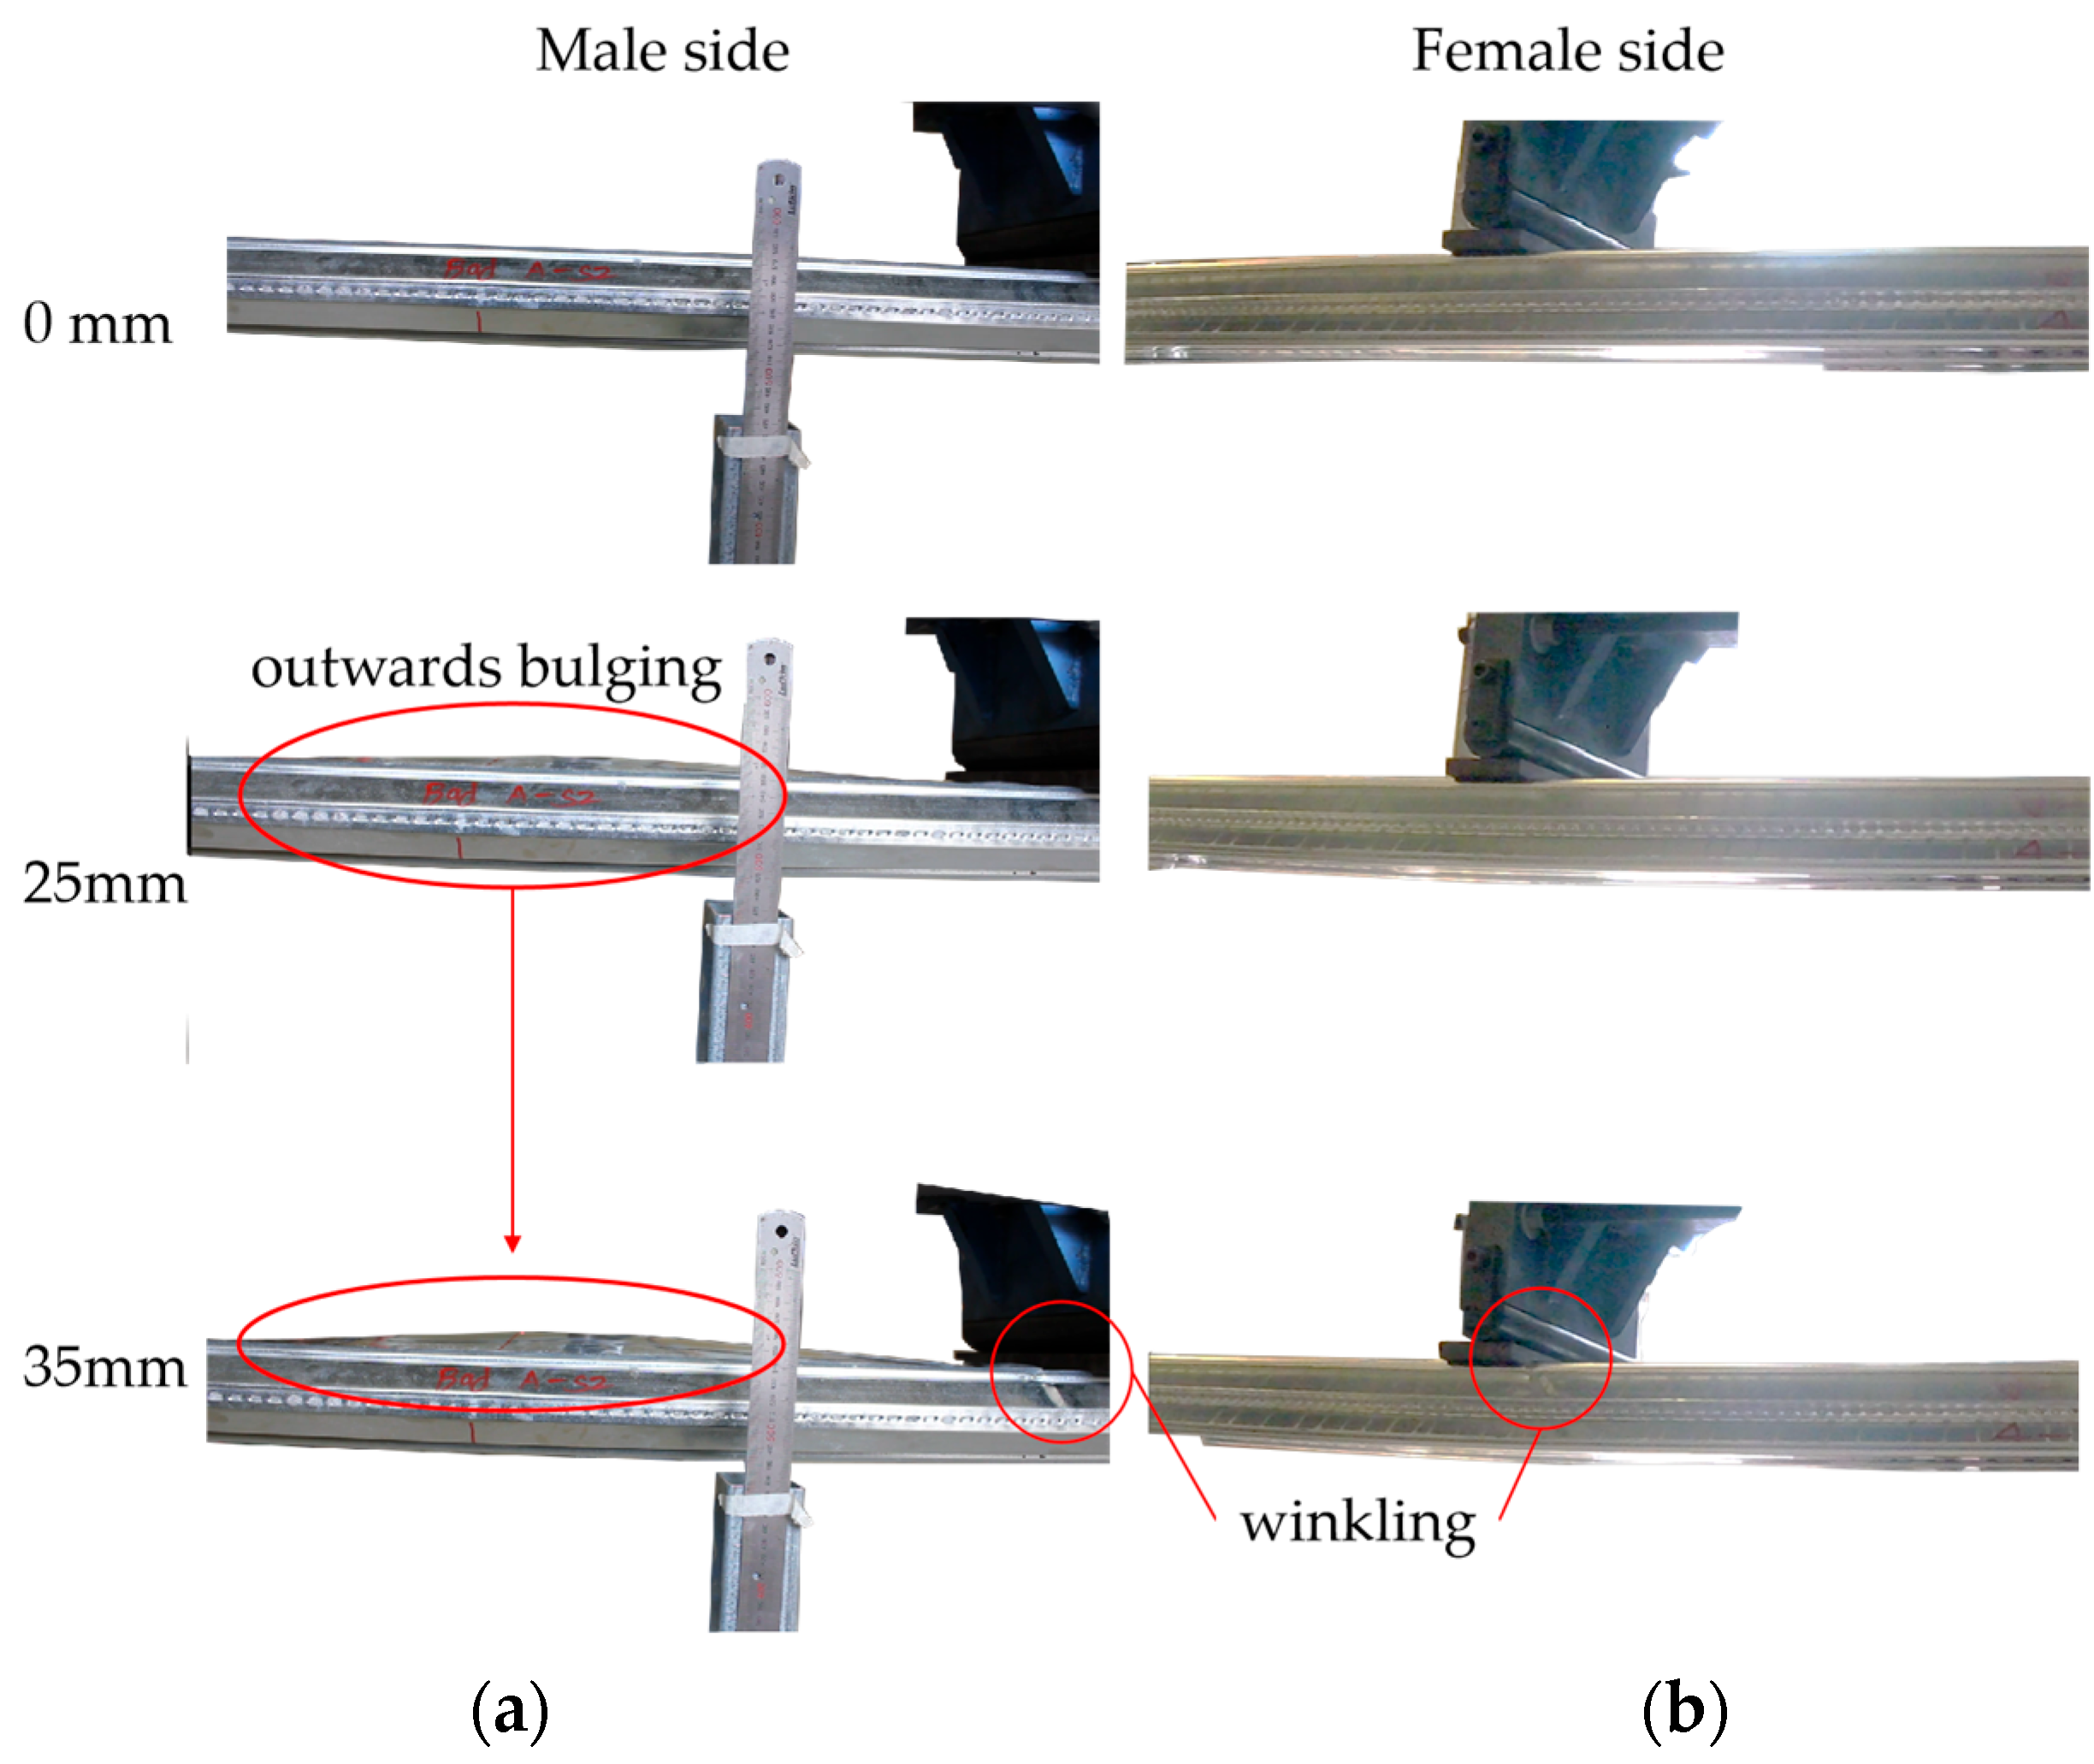
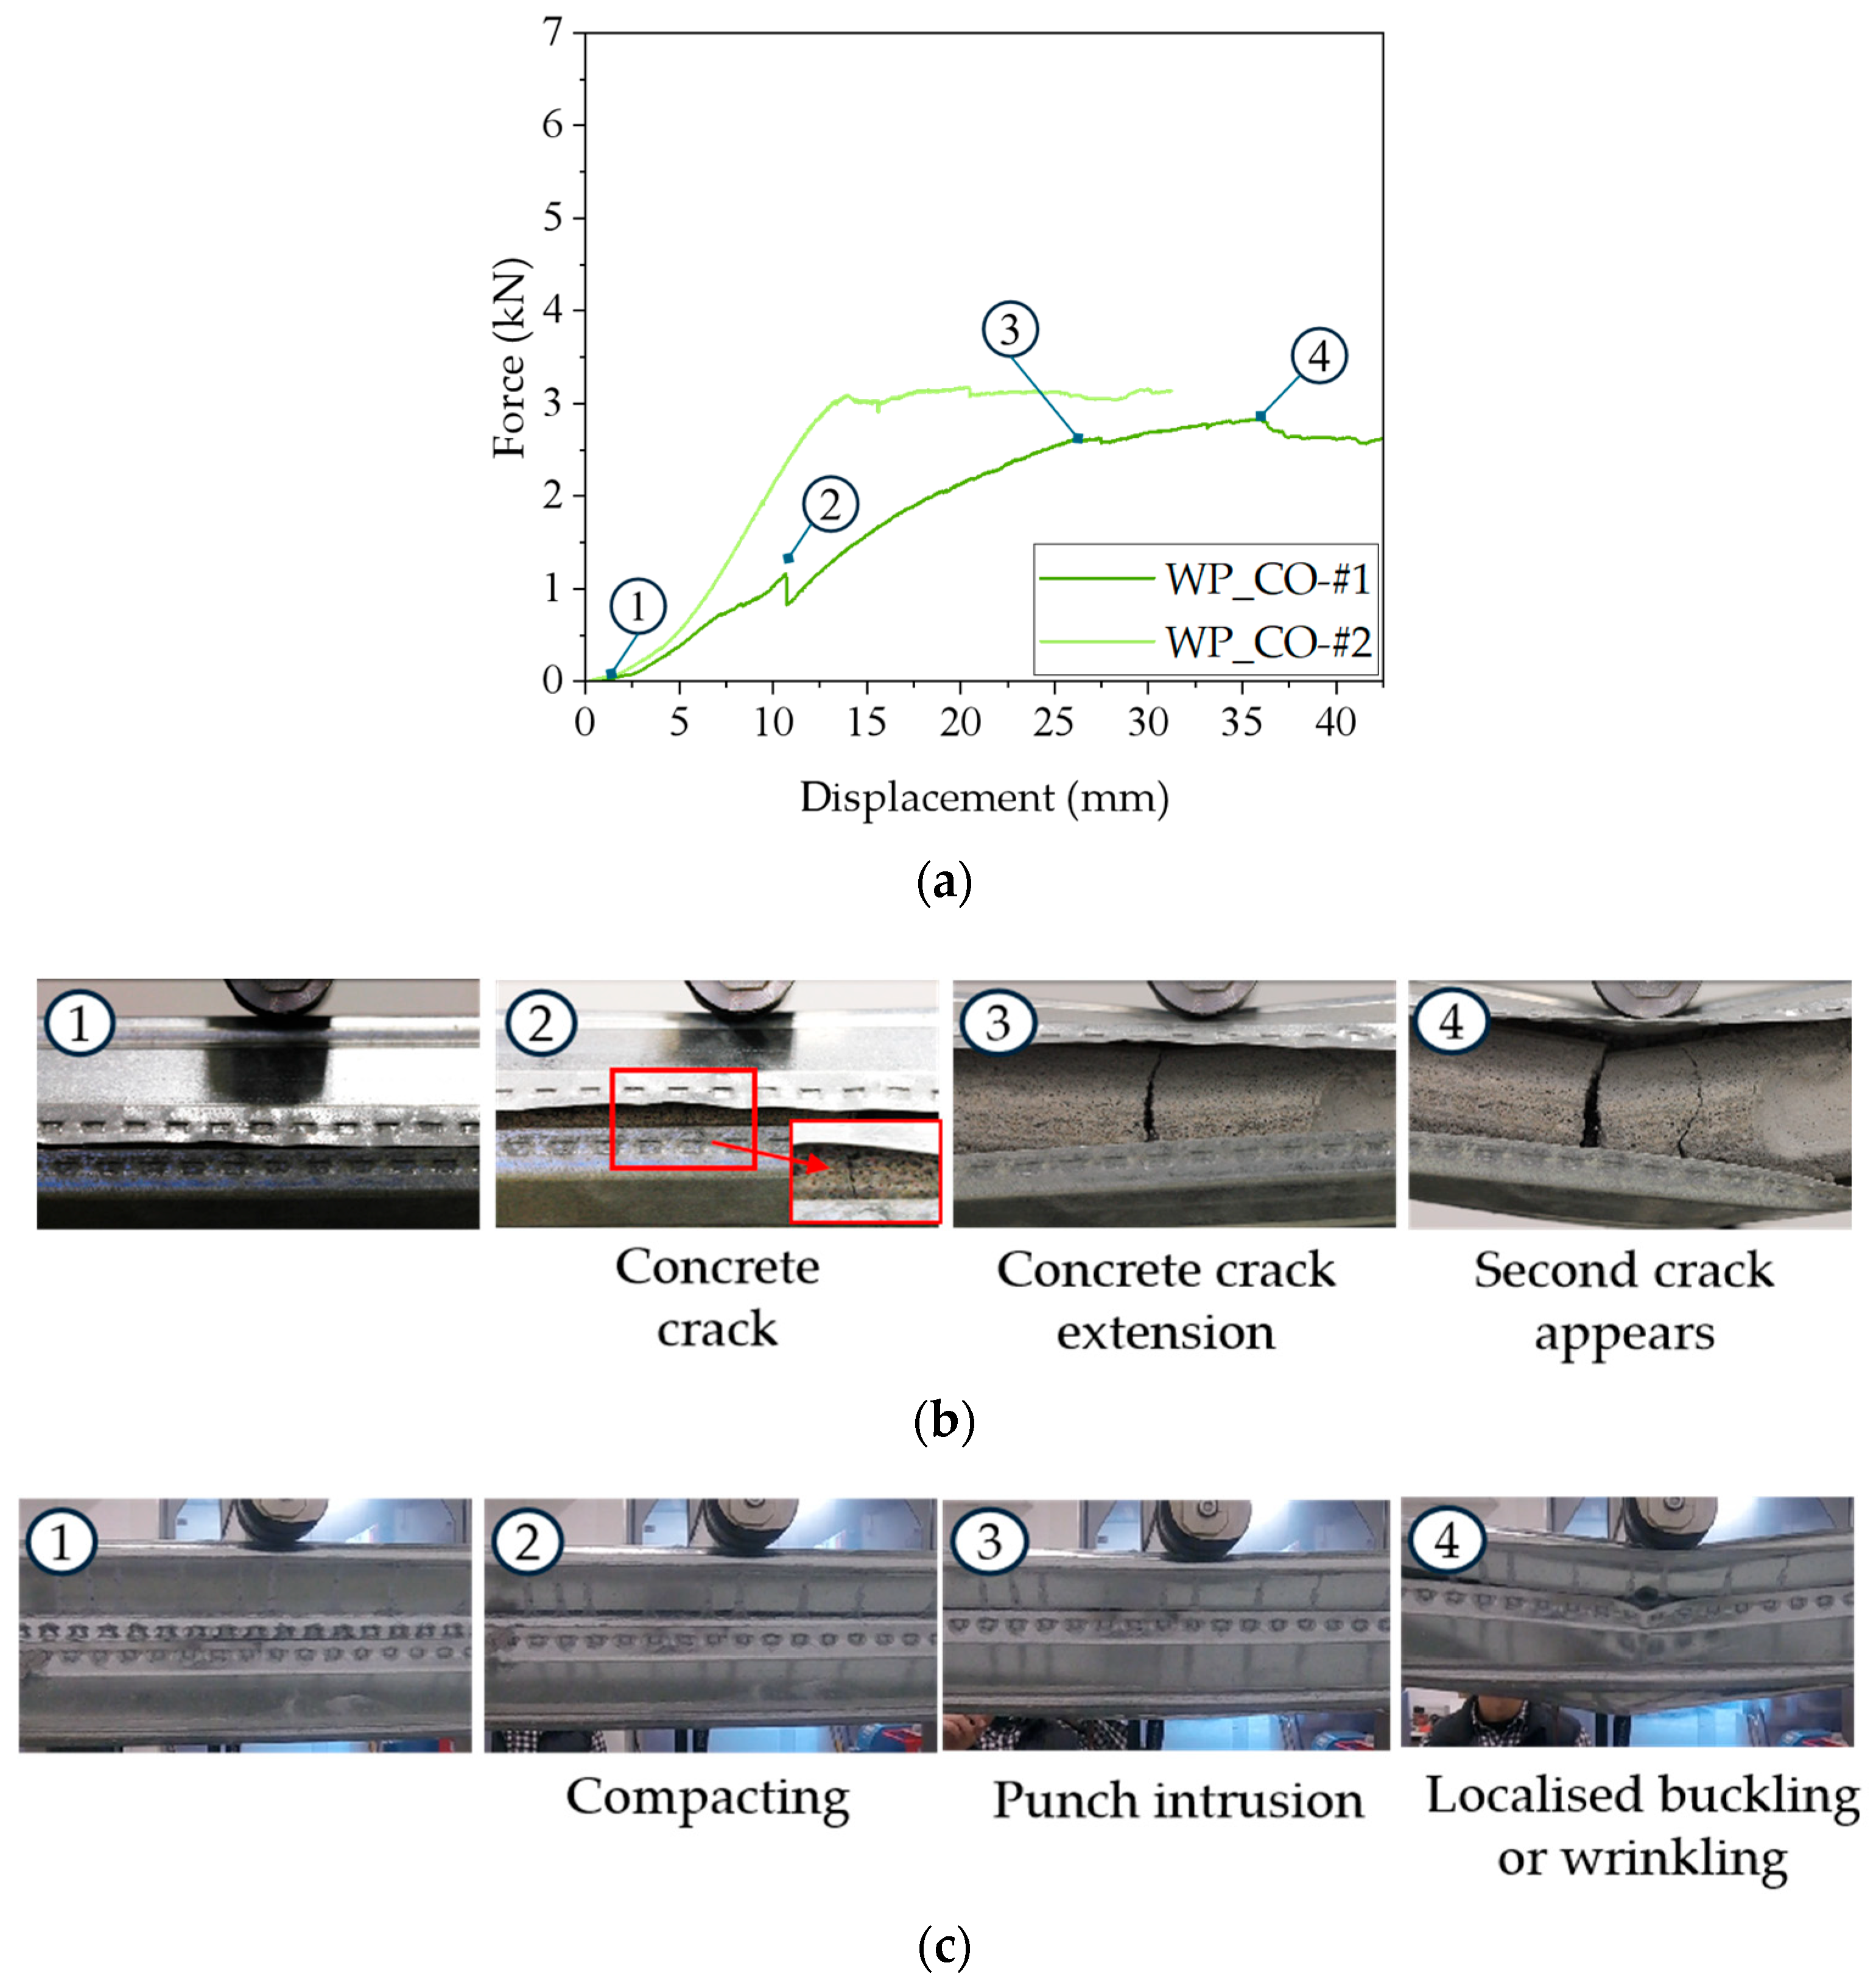
3.5.1. Buckling and Wrinkling of the Steel Outer Shell with the Seam Remaining Intact

This failure mode was only observed for condition S5 (Figure 13), which exhibited a moderate load drop at a punch displacement of approximately 35 mm, followed by a slow decrease in load with further deformation. Figure 13 shows the male and female sides of the panel at punch displacements of 0, 25, and 35 mm. At 25 mm, the top surface starts to bulge outwards, and the level of bulging increases with further deformation. The panel must be compressed on this side to produce the inner bend curvature radius, causing the outer steel sheet to bulge. At 35 mm displacement, the steel outer sheet begins to wrinkle near the punch supports on both the male and female sides, coinciding with the small load drop observed in Figure 12 for S5. As deformation continues, the wrinkling becomes more severe, and the loading capacity of the panel decreases, reaching a residual load of approximately 2 kN at the 60 mm displacement. This represents a load reduction of 20% compared to the maximum load of 2.5 kN.
Figure 13. Condition S5—Start of outwards bulging of the top steel shell at 25 mm punch displacement and wrinkling in the top outer steel shell near the punch contact region at 35 mm punch displacement in both (a) the male and (b) female sides.
Buildings 15 01338 g013

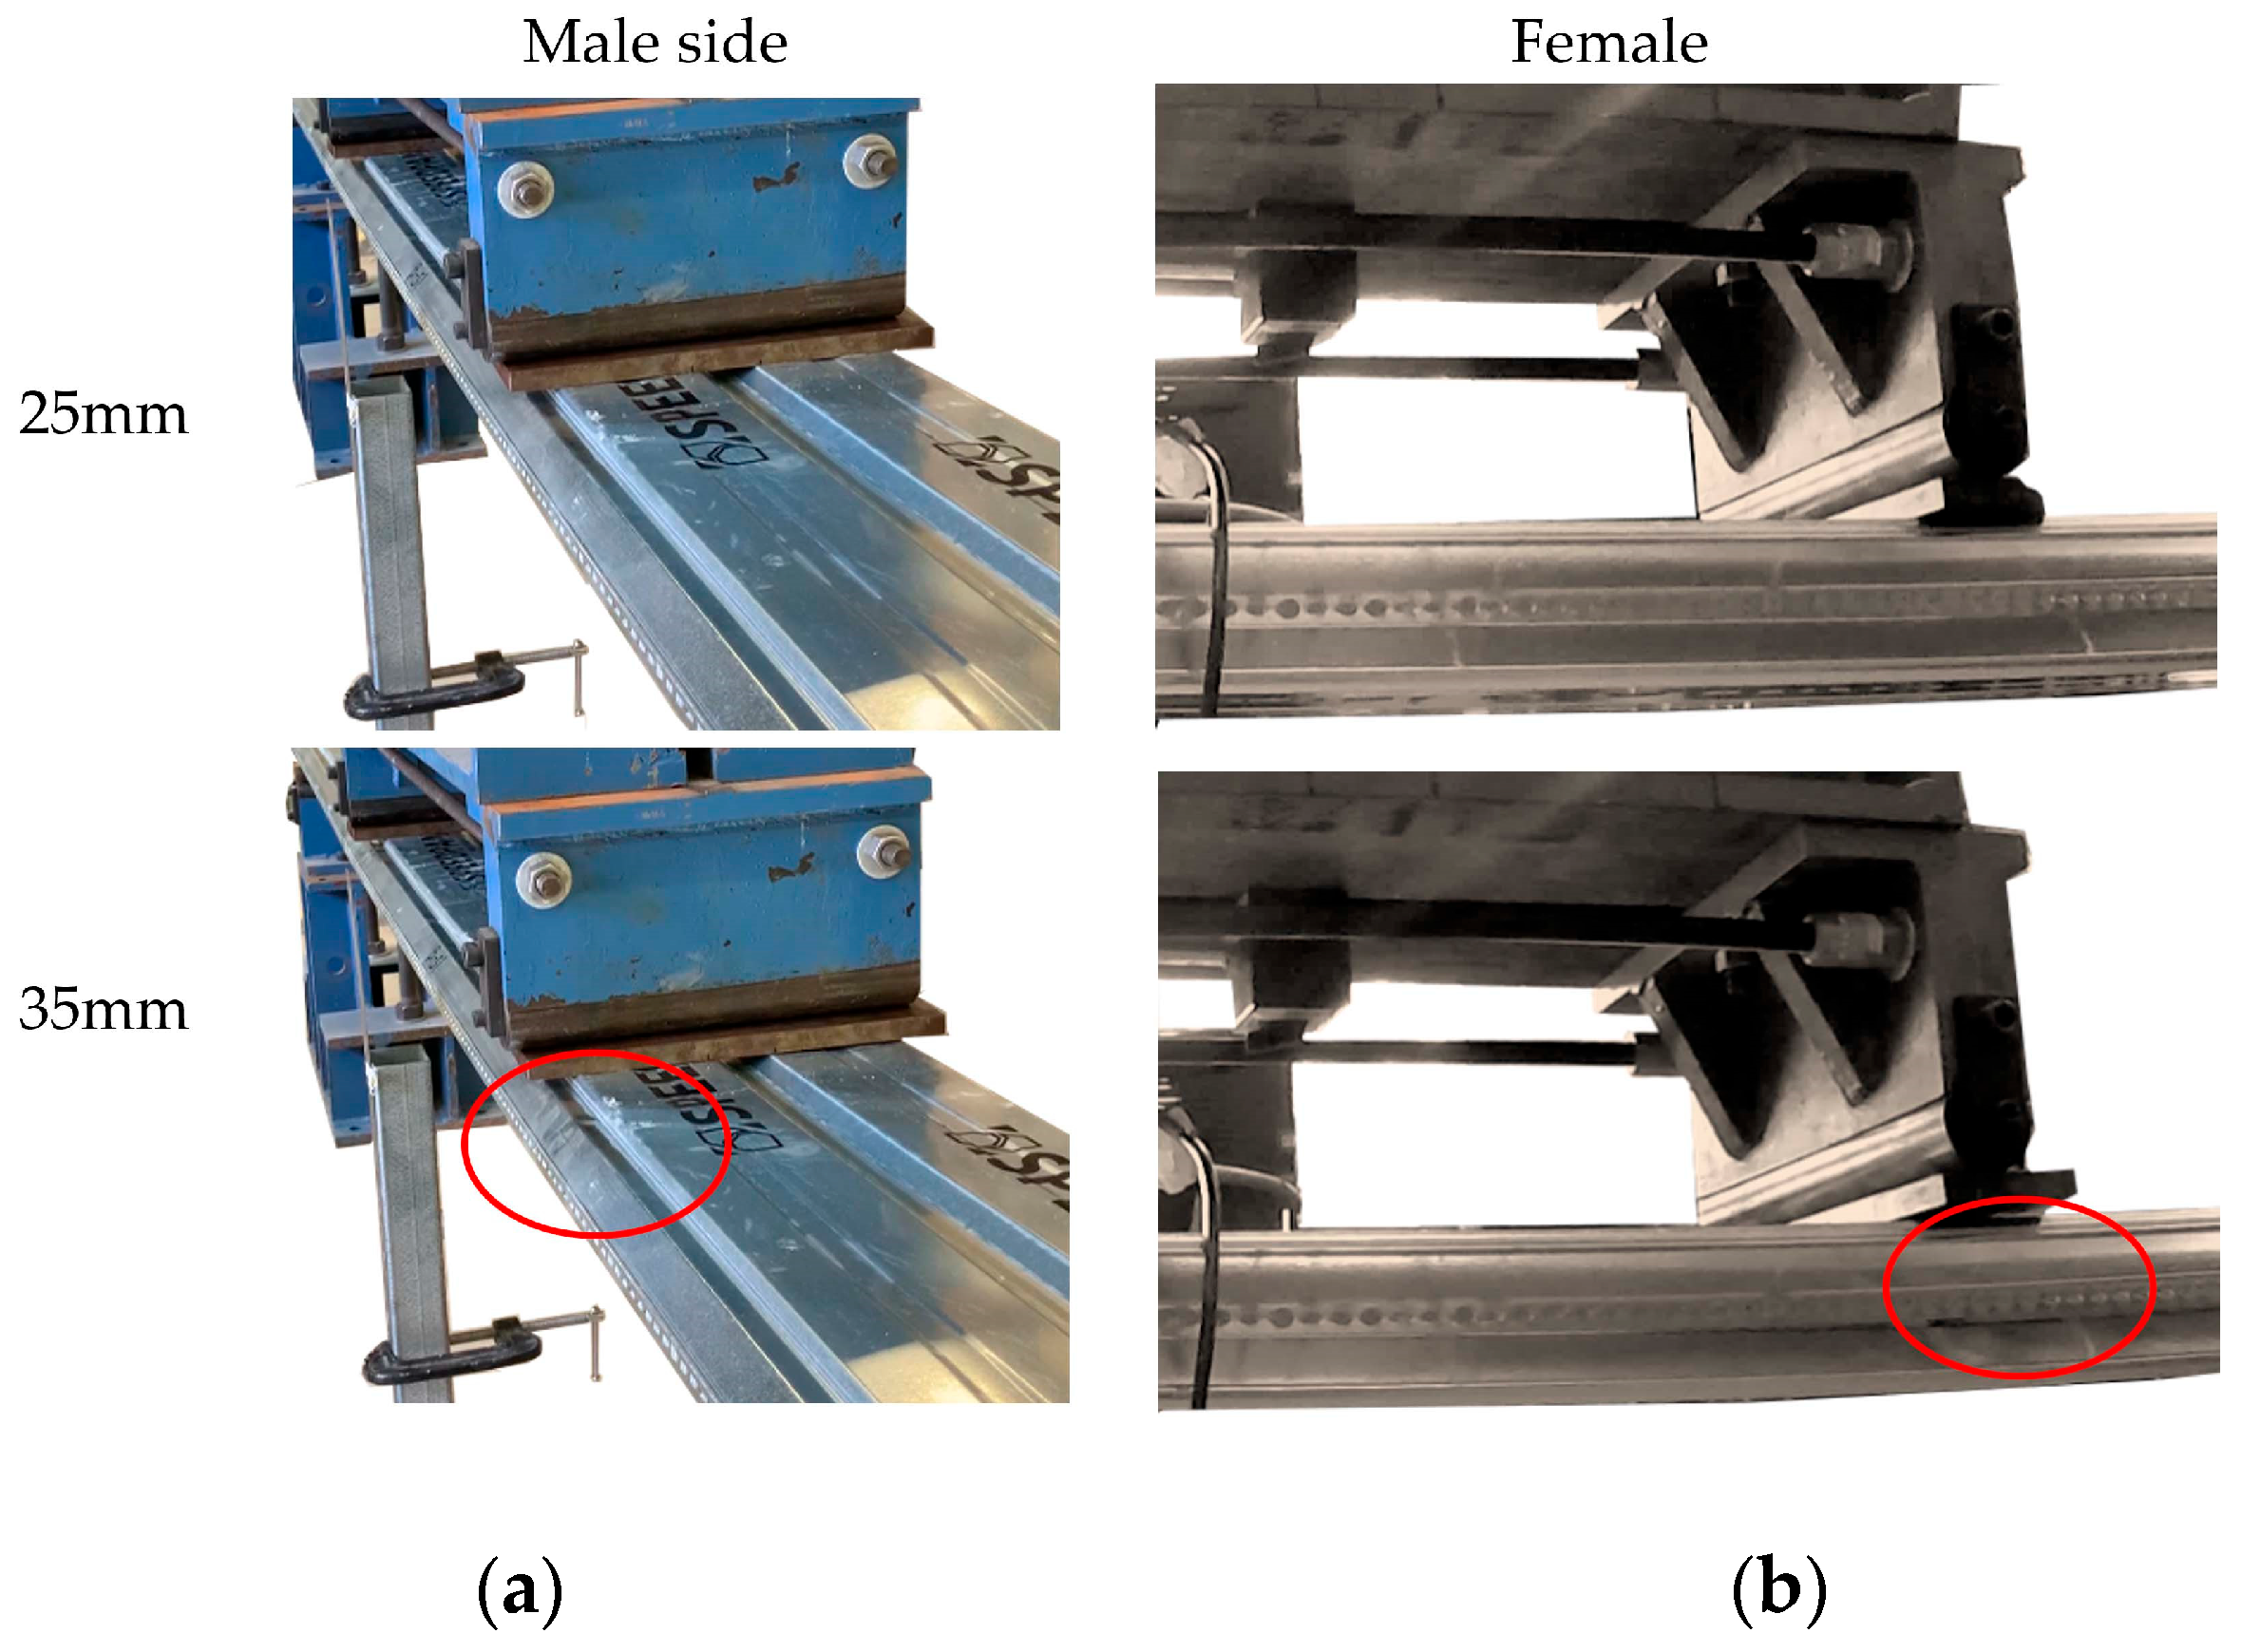
3.5.2. Buckling of the Steel Outer Shell Followed by Seam Failure

This failure mode was observed for S1–S4 and is illustrated in Figure 14 for test panel S3 (see Figure 12), which showed a sudden load drop at a punch displacement of approximately 35 mm. Visual analysis reveals that, at full punch displacement, the clinch seam in the male part remained intact. At around 35 mm displacement, failure occurred in the form of wrinkling of the outer steel shell near the top punch contact region. Additionally, buckling of the steel sheet near the female seam connection led to seam failure at the 35 mm displacement. In both regions, wrinkling became more severe, and the load-bearing capacity of the panel decreased with the increasing punch displacement, reaching a residual load of approximately 1.5 kN at 60 mm displacement. This represents a load reduction of about 33% compared to the maximum load of 2.25 kN.
Figure 14. Failure mode observed for S3: (a) wrinkling in the top outer steel shell near the punch contact region at a punch displacement of 35 mm; (b) buckling of the sheet and failure of the female clinch seam connection at 35 mm punch displacement.
Buildings 15 01338 g014

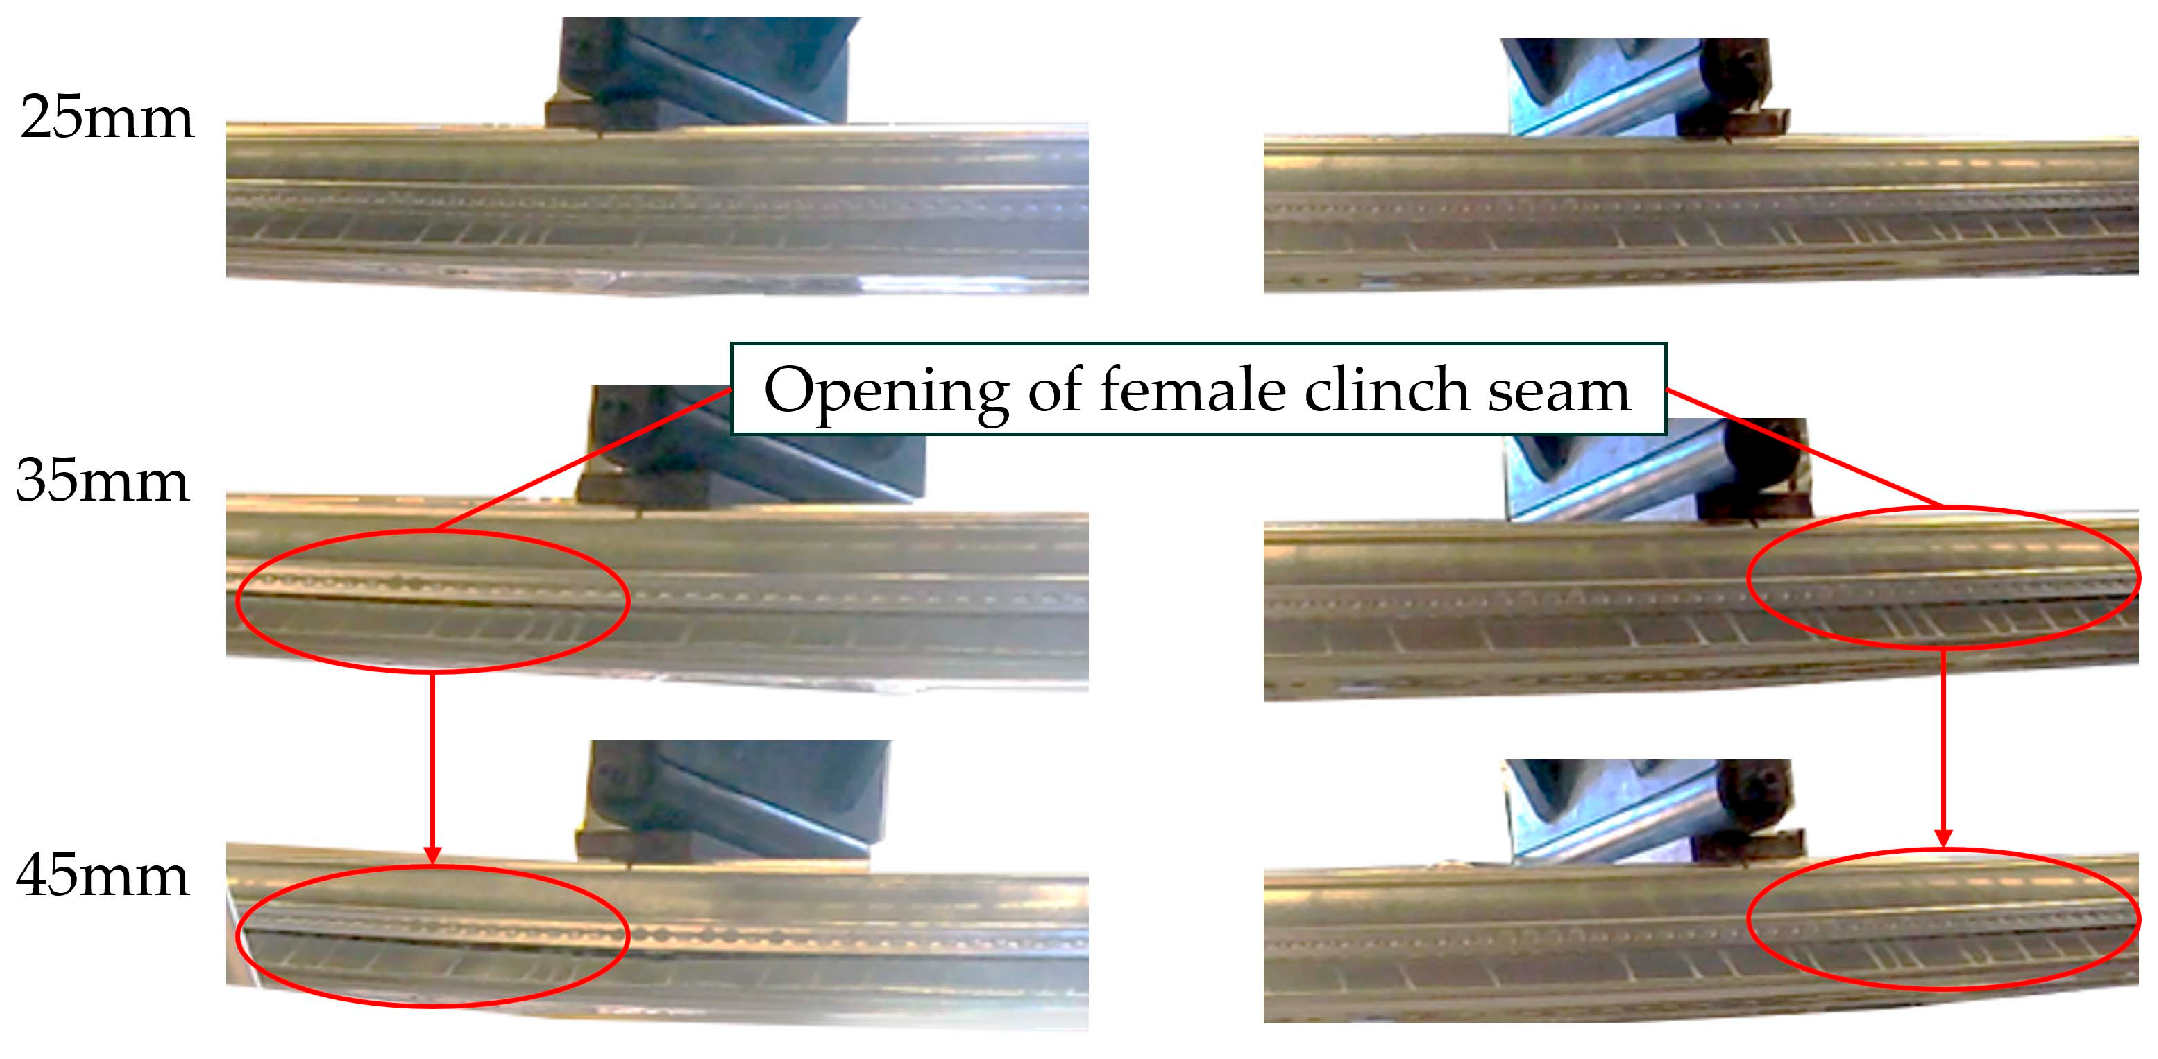
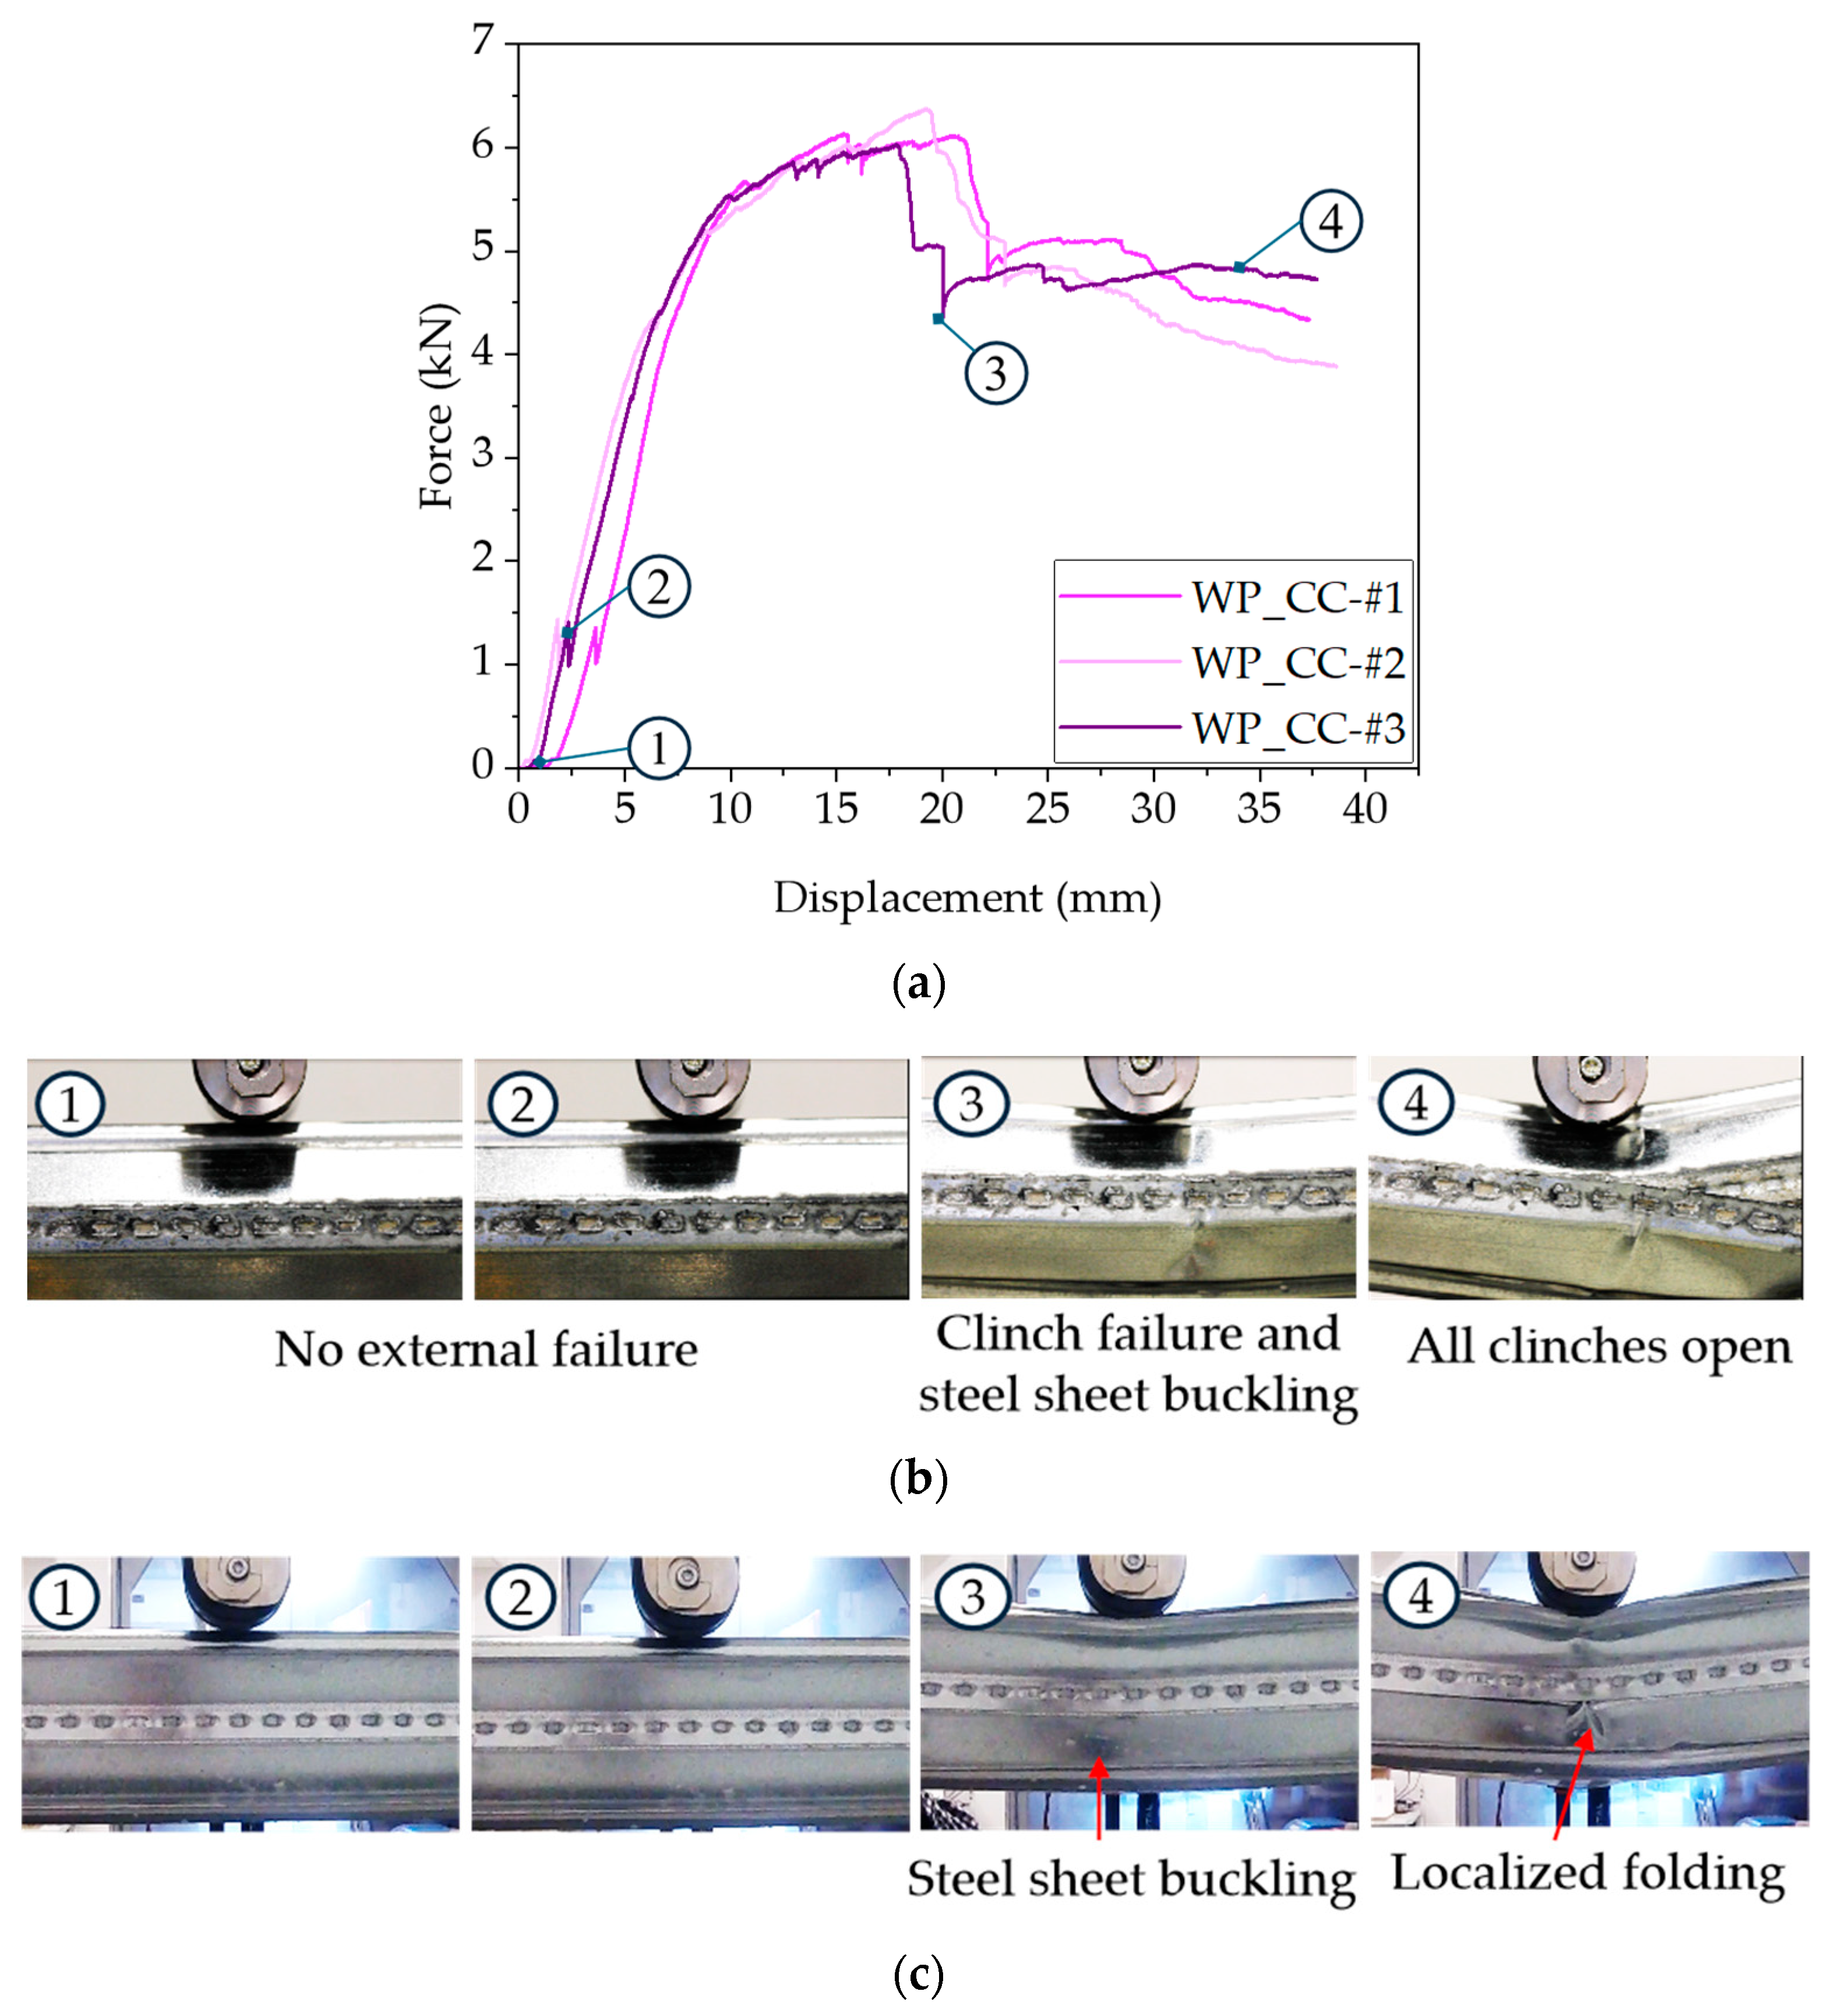
3.5.3. Failure of the Seam on the Male and the Female Side

Sample 8, S8 in Figure 12, sustains a sudden load drop between 30 and 35 mm of punch displacement. This load drop results in a very low residual load-bearing capacity of approximately 0.75 kN, and the load does not change with further panel deformation. This represents a load reduction of approximately 70%. Figure 15 reveals that, at 35 mm of punch displacement, there is widespread failure of the female seam near the two top punch steel rod support regions. Notably, there is no wrinkling or bulging of the metal sheet, suggesting that the load drop between 30 and 35 mm is entirely due to the failure of the female seam.
Figure 15. Failure mode observed for condition S8—failure of the female seam near the punch steel rod supports, starting at 35 mm punch displacement.
Buildings 15 01338 g015

3.6. The Effect of the Individual Panel Constituents on the Load Bearing Capacity

The results of the 4-point bend test suggest similar maximum load bearing capacities for all panels while the panel performance after the initiation of failure is dependent on three distinct failure modes:
  • Buckling of the steel sheet;
  • Buckling of the steel sheet combined with seam failure initiation;
  • Catastrophic failure of the clinch seam connection.
To understand the separate effects of the steel sheets, the concrete core and the seam on the structural behaviour of the wall panel, additional small scale 3-point bend tests were performed for 3 conditions:
  • The concrete core; extracted from the wall panel;
  • The wall panel with both clinch seams opened;
  • The wall panel with the male and female seams intact and closed.
The force–displacement responses for the three different conditions are shown in Figure 16, Figure 17 and Figure 18.
In Figure 16a, it becomes clear that the concrete core material contributes only a very small amount to the structural loading response of the panel, with a maximum average force at failure of approximately 0.5 kN. This is less than 10% of the maximum force at failure (approximately 6 kN) observed when performing 3-point bending on the fully seamed panel (Figure 18a). After the maximum load is reached (Figure 16b,c, stage ②), cracking of the concrete occurs, leading to a sudden force drop to approximately zero (Figure 16b,c, stage ③). This behaviour aligns with previous studies where aerated concrete cores showed low load-bearing capacity under bending loading [8].
Figure 16. Progressive failure for concrete-only condition in 3-point bending: (a) force–displacement curves; (b) front view of Male side-Cam#1; and (c) back view of Female side-Cam#2.
Buildings 15 01338 g016aBuildings 15 01338 g016b
Testing the full wall panel with concrete and steel outer sheets, but with both seams opened prior to testing, results in a maximum force at failure of approximately 3 kN (Figure 17a). This suggests that the concrete core and the steel outer sheets together can provide nearly 50% of the panel’s strength. The force distribution in Figure 17a shows a small drop in force at a displacement of 10 mm (stage ②), while Figure 17b indicates that the concrete begins to crack at this forming stage. After the concrete foam cracks, there is a further increase in reaction force with continued deformation. This suggests that the steel outer sheets can still provide structural support, even with the seams fully opened and the concrete core cracked.
Figure 17. Progressive failure of the wall panel with both seams opened in 3-point bending: (a) force–displacement curves; (b) front view of Male side-Cam#1; (c) back view of Female side-Cam#2.
Buildings 15 01338 g017
The 3-point bending force–displacement curves for the full panel with both seams closed are very similar to the 4-point bending load responses shown in Figure 12. It begins with a nearly linear elastic region, followed by a reduced rate of force increase with additional displacement until a maximum is reached. At this point, there is a load drop from approximately 6 kN to 4.5 kN (Figure 18a, stage ③), representing a load reduction of about 25%. Figure 18b,c suggest that the load drop at stage ③ is due to seam failure on the male side and buckling of the steel sheet on the female side of the wall panel. As deformation continues, the seam opening and buckling of the sheet become more severe on the male and female sides, respectively. Notably, at a displacement of approximately 2–3 mm, a small 0.5 kN force drop occurs (Figure 18a, stage ②). The displacement where the force drop occurs, and its magnitude appear to correspond to the load drop observed when performing 3-point bending on the single concrete panel (see Figure 16a).
Figure 18. Progressive failure when testing the full wall panel with both clinch seams closed in 3-point bending: (a) force–displacement curves; (b) front view of Male side-Cam#1; (c) back view of Female side-Cam#2.
Buildings 15 01338 g018

4. Discussion

4.1. Application of X-Ray Computed Tomography (PCX-CT)

This study showed that the volume of the mortar determined using CT provided a reasonable approximation of the concrete density. However, the density identified through CT exceeded the values stated by the supplier. This discrepancy may be related to the limited number of cuboid samples tested for each condition. Testing more samples taken from different locations of the concrete could help address this issue.
The concrete sample taken after 3-point bending from the contact zone with the top tool showed a lower concrete density compared to the incoming non-deformed material (Table 2). This was unexpected, given that the tension and compression test results in Figure 9c and Figure 10c suggest that the concrete core tends to compact when loaded. This implies that, even in the contact region between the concrete and the upper 3-point bend test tool, some concrete compaction should have occurred. Concrete compaction would have increased the density in the cuboid element after the 3-point bend test. Further analysis of the CT results suggests that the reduction in concrete density after 3-point bending is due to a decrease in the mortar volume (Table 3). Visual observation during specimen preparation confirmed that the aerated concrete core material was fragile after being severely loaded in the 3-point bending test, which led to fragments of mortar being lost. Therefore, the reduction in concrete density, as observed by the CT scan, is likely due to the loss of concrete mortar volume during the CT sample preparation.
Overall, the results suggest that CT analysis can provide a reasonable representation of bubble size and mortar volume. This makes it particularly useful for future computer-based analyses of aerated concrete behaviour, where investigating the detailed bubble size and contribution in the concrete using CT could be beneficial.

4.2. The Fundamental Mechanics of the Speedpanel DSC Bend Loading Behaviour

The aerated concrete core has only a minor effect on the structural performance of the Speedpanel DSC system due to its low tensile and compressive strengths, as shown in Figure 9a and Figure 10a, respectively. It is this low strength that results in concrete failure in the very early stages of bending as indicated by the small 0.5 kN force drop in forming stage ② of the 3-point bending test (see Figure 18a).
The main role of the concrete core is to space out the outer steel sheet material, allowing the outer shells to be loaded in tension and compression according to sandwich theory [51]. This loading condition becomes evident in the 4-point bending tests shown in Figure 13, where the top steel shell bulges outward. This bulging is caused by the compressive stress applied to the top part of the steel shell in the inner curvature radius of the panel, between the two top punch rods.
Based on sandwich theory, the core material should primarily be loaded in shear. However, due to its low material strength, the shear stresses are mostly transferred through the metal clinch seam on both the male and female sides of the panel. This becomes evident in Figure 18c (stage 4), where the steel shell develops buckling on both sides of the clinch seam at an approximate 30-degree angle relative to the wall’s centreline, indicating shear deformation [52].
Therefore, it can be concluded that the structural performance of the DSC system in both 3- and 4-point bending is a combination of tension and compression in the top and bottom parts of the steel outer shells, along with shear deformation near the clinch seam. The soft aerated concrete core mostly functions as a spacer material and does not contribute significantly to the bending load.

4.3. Modes of Failure

The results of this study suggest that the optimal structural behaviour of the wall panel is achieved when the clinch seam can withstand the shear stresses without opening. This is similar to conventional sandwich beams, which often fail by delamination at the cover sheet–core interface or by shear cracking of the core layer [53]. Only one of the eight samples tested in 4-point bending showed failure without seam opening (see Figure 12, S5). This suggests that the clinch seam strength is insufficient to prevent seam failure when the maximum load-bearing capacity of the wall panel is exceeded.
When the seam remains intact, failure is governed by the buckling of the top part of the outer steel shell, which is loaded in compression (Figure 13). Similar failure modes have been observed in previous studies on different DSC systems [54]. The progressive buckling of the outer steel shell leads to a stable failure mode, with a slow reduction in the maximum force during further bending, resulting in a small load drop of about 20% at the final punch stroke (see Figure 12, S5).
However, if the clinch seam opens, the shear stress that can be transferred within the wall centre is reduced. Complete seam opening eliminates the connection between the two outer steel shells, causing them to bend separately. In contrast to the intact seam failure mode, this results in a more abrupt and significant load drop after reaching the maximum bending load, with reductions of 30% to 70%, depending on whether one or both seams fail (compare S3 and S8 in Figure 14 and Figure 15, respectively).

4.4. The Effect of Panel Constituents on the Maximum Bend Load

Figure 13 suggests that all panels showed very similar levels of the maximum bending load in the 4-point bending test even though the failure modes post to reaching the load maximum were significantly different. This becomes clear when comparing conditions S5 and S8 which both experienced very similar levels of maximum bend force. However, while S5 showed a stable failure mode in form of outer steel shell bulging followed by buckling, S8 experienced complete seam failure and a rapid load drop.
The results of the 3-point bend test suggest that even when the seam connection is completely lost, the two outer steel shells combined with the concrete core can provide up to 50% of the maximum load bearing capacity of the panel (see Figure 17a). The outer shells have deep pan profiles that increase the bending rigidity and, in this way, enable the steel shells to withstand substantial loads, even when the seam connection is lost, and the shells are bent individually.
It can be concluded that the clinch seam strength of the investigated DSC is high enough to provide a stable connection between the two outer steel shells until the maximum bending load is reached. After this, panel failure initiates either by shell buckling or seam failure depending on the strength of the clinch seam. This suggests that increasing the clinch seam strength will likely not enhance the ultimate panel strength but that it will only improve the post to failure behaviour. The same applies to the aerate concrete core which contributes less than 10% of the maximum panel strength in bend loading. Therefore, enhancing both the clinch seam strength and the buckling resistance of the steel shell is likely to improve the panel’s bending load-bearing capability by preventing premature failure.
This study suggests that when the clinch seam remains intact, the primary bending stresses are transferred by the two outer steel shells through compression and tensile deformations. The maximum buckling stress of the steel sheet is typically much lower than its fracture limit stress [55,56], meaning that panel failure is primarily governed by bulging and buckling of the inner steel shell, which is loaded in longitudinal compression. To enhance the structural performance of the wall panel, one approach could be to increase the thickness of the inner steel shell, thus improving its buckling resistance. Alternatively, optimizing the cross-sectional shape of the two roll-formed open shells could enhance their individual bending rigidities, improving overall panel strength.

5. Conclusions and Future Work

This study presents, for the first time, an investigation into the structural performance and bending failure modes of a newly developed fire-rated double-skin composite (DSC) system. Unlike conventional DSC systems that require a significant number of fasteners to assemble the metal cover sheets and concrete core, this innovative design utilizes two roll-formed open steel sections that are clinch-seamed into a hollow shell and then filled with an aerated concrete core. By eliminating the need for complex fasteners, material costs and labour are reduced, making the new DSC system a potentially more economical solution compared to conventional wall panel systems. The strength of the clinch seam was evaluated through peel and shear tests, while the core material properties were determined using tension and compression tests on cylindrical specimens. Additionally, the full wall panels were subjected to 3- and 4-point bending tests to assess its overall structural performance. Based on these investigations, the following conclusions can be drawn.
  • X-ray Computed Tomography (PCX-CT) enables the analysis of the size and distribution of air bubbles in aerated concrete. This procedure was validated through concrete density measurements and offers detailed structural information that could be valuable for future material model development and computer-assisted analysis of concrete behaviour.
  • The structural performance of the DSC wall panel during bending deformation is primarily governed by the steel outer shells, which are separated by the concrete core and connected by clinch seams on the male and female sides of the panel. In this configuration, the outer steel shells are subjected to tension and compression, while the clinch seams, located at the panel’s thickness centres, experience shear forces. This behaviour aligns with the theory of bending in sandwich panels.
  • The aerated concrete core has very low compressive and tensile strengths, and as a result, it contributes minimally to the load-bearing capacity of the wall panel. Its primary role is to separate the outer metal sheets, allowing them to be loaded in tension and compression during bending deformation.
  • Panel failure occurs either through buckling of the steel outer shell, clinch seam opening, or a combination of both failure modes. The type of failure does not affect the maximum bending load but only influences the post-failure behaviour after the peak load is reached.
  • The results of this study suggest that, in the current wall panel configuration, the concrete core and the clinch seam provide adequate strength to reach the maximum load-bearing capacity of the panel without premature failure. The majority of the stresses are transferred by the steel outer shell material. This indicates that further improvements in bending performance may only be achieved by either increasing the steel thickness or optimizing the cross-sectional shape of the outer shell to enhance its bending rigidity.
  • This study is limited to experimental findings. Future work should explore analytical and numerical modelling approaches to theoretically validate the experimental results. Finite element analysis (FEA) could be used to simulate the panel deformation and failure mechanisms under bending loads. Additionally, closed-form model approaches based on the sandwich panel theory could provide further verification. While this study focused on bending behaviour due to its relevance to wind-induced loads, other loading conditions, such as axial compression, shear, and impact should be investigated to provide a more comprehensive assessment of the panel’s structural performance.

Author Contributions

Conceptualization, M.W., P.Z. and M.P.; data curation and formal analysis, X.H. and P.Z.; funding acquisition, M.W. and M.P.; investigation, M.W., P.Z., X.H. and M.P.; methodology, M.W., P.Z. and M.P.; project administration and supervision, M.W., P.Z. and M.P., visualization, X.H. and P.Z.; writing—original draft, M.W., P.Z. and X.H., writing—review and editing, M.W., P.Z., M.P. and X.H. All authors have read and agreed to the published version of the manuscript.

Funding

This research was funded by the Cooperative Research Centres Projects (CRC-P) program: CRCPXIV000053.

Data Availability Statement

The data presented in this study are available on request from the corresponding author. The data are not publicly available due to privacy restrictions.

Acknowledgments

The authors would like to thank Speedpanel, Australia, for providing technical support, wall panel and aerated concrete sample material. The authors are also grateful to Sitarama Kada for providing support on the InSitX for micro-CT scanning and thank Keerthana John for assisting in the experimental trials performed to access the concrete and clinch seam strength.

Conflicts of Interest

The authors declare the following financial interests/personal relationships which may be considered as potential competing interests: Matthias Weiss reports that financial support was provided by Cooperative Research Centres Projects (CRC-P) project.

References

  1. Fiorino, L.; Macillo, V.; Landolfo, R. Experimental characterization of quick mechanical connecting systems for cold-formed steel structures. Adv. Struct. Eng. 2017, 20, 1098–1110. [Google Scholar] [CrossRef]
  2. Andrade, P.; Veljkovic, M.; Feldmann, M.; Pak, D.; Pyschny, D.; Lundholm, J. Design and execution of a 3D modular building. In Proceedings of the 7th European Conference on Steel and Composite Structures (Eurosteel 2014), Naples, Italy, 10–12 September 2014. [Google Scholar]
  3. Ferdous, W.; Bai, Y.; Ngo, T.D.; Manalo, A.; Mendis, P. New advancements, challenges and opportunities of multi-storey modular buildings—A state-of-the-art review. Eng. Struct. 2019, 183, 883–893. [Google Scholar] [CrossRef]
  4. Kamali, M.; Hewage, K. Life cycle performance of modular buildings: A critical review. Renew. Sustain. Energy Rev. 2016, 62, 1171–1183. [Google Scholar] [CrossRef]
  5. Thai, H.-T.; Ngo, T.; Uy, B. A review on modular construction for high-rise buildings. Structures 2020, 28, 1265–1290. [Google Scholar] [CrossRef]
  6. Hilo, S.J.; Badaruzzaman, W.H.W.; Osman, S.A.; Al-Zand, A.W.; Samir, M.; Hasan, Q.A. A state-of-the-art review on double-skinned composite wall systems. Thin-Walled Struct. 2015, 97, 74–100. [Google Scholar] [CrossRef]
  7. Eltayeb, E.; Ma, X.; Zhuge, Y.; Xiao, J.; Youssf, O. Composite walls composed of profiled steel skin and foam rubberized concrete subjected to eccentric compressions. J. Build. Eng. 2022, 46, 103715. [Google Scholar] [CrossRef]
  8. Ramamurthy, K.; Nambiar, E.K.K.; Ranjani, G.I.S. A classification of studies on properties of foam concrete. Cem. Concr. Compos. 2009, 31, 388–396. [Google Scholar] [CrossRef]
  9. Clark, J.V.; Lange, D.A. Optimization of cellular concrete microstructure for improved impact resistance. Transp. Res. Rec. 2021, 2675, 237–246. [Google Scholar] [CrossRef]
  10. Mydin, M.A.O.; Wang, Y.C. Structural performance of lightweight steel-foamed concrete–steel composite walling system under compression. Thin-Walled Struct. 2011, 49, 66–76. [Google Scholar] [CrossRef]
  11. Karakurt, C.; Kurama, H.; Topçu, İ.B. Utilization of natural zeolite in aerated concrete production. Cem. Concr. Compos. 2010, 32, 1–8. [Google Scholar] [CrossRef]
  12. Liew, A.C.M. New innovative lightweight foam concrete technology. In Use of Foamed Concrete in Construction: Proceedings of the International Conference, Scotland, UK, 5–7 July 2005; Thomas Telford: London, UK, 2005; pp. 45–50. [Google Scholar]
  13. Amran, Y.H.M.; Farzadnia, N.; Ali, A.A.A. Properties and applications of foamed concrete; a review. Constr. Build. Mater. 2015, 101, 990–1005. [Google Scholar] [CrossRef]
  14. Zhang, Z.; Provis, J.L.; Reid, A.; Wang, H. Geopolymer foam concrete: An emerging material for sustainable construction. Constr. Build. Mater. 2014, 56, 113–127. [Google Scholar] [CrossRef]
  15. Kearsley, E.P.; Wainwright, P.J. The effect of high fly ash content on the compressive strength of foamed concrete. Cem. Concr. Res. 2001, 31, 105–112. [Google Scholar] [CrossRef]
  16. Falliano, D.; Parmigiani, S.; Suarez-Riera, D.; Ferro, G.A.; Restuccia, L. Stability, flexural behavior and compressive strength of ultra-lightweight fiber-reinforced foamed concrete with dry density lower than 100 kg/m3. J. Build. Eng. 2022, 51, 104329. [Google Scholar] [CrossRef]
  17. Su, B.; Zhou, Z.; Li, Z.; Wang, Z.; Shu, X. Experimental investigation on the mechanical behavior of foamed concrete under uniaxial and triaxial loading. Constr. Build. Mater. 2019, 209, 41–51. [Google Scholar] [CrossRef]
  18. Xu, L.; Duan, Y.; Li, Y. Porosity, gradient and impact velocity effects on compressive response of foamed concrete. Constr. Build. Mater. 2022, 315, 125616. [Google Scholar] [CrossRef]
  19. Nguyen, T.T.; Bui, H.H.; Ngo, T.D.; Nguyen, G.D.; Kreher, M.U.; Darve, F. A micromechanical investigation for the effects of pore size and its distribution on geopolymer foam concrete under uniaxial compression. Eng. Fract. Mech. 2019, 209, 228–244. [Google Scholar] [CrossRef]
  20. Castillo-Lara, J.F.; Flores-Johnson, E.A.; Valadez-Gonzalez, A.; Herrera-Franco, P.J.; Carrillo, J.G.; Gonzalez-Chi, P.I.; Agaliotis, E.; Li, Q.M. Mechanical behaviour of composite sandwich panels with foamed concrete core reinforced with natural fibre in four-point bending. Thin-Walled Struct. 2021, 169, 108457. [Google Scholar] [CrossRef]
  21. Jones, M.R.; McCarthy, A. Utilising unprocessed low-lime coal fly ash in foamed concrete. Fuel 2005, 84, 1398–1409. [Google Scholar] [CrossRef]
  22. Castillo-Lara, J.F.; Flores-Johnson, E.A.; Valadez-Gonzalez, A.; Herrera-Franco, P.J.; Carrillo, J.G.; Gonzalez-Chi, P.I.; Li, Q.M. Mechanical properties of natural fiber reinforced foamed concrete. Materials 2020, 13, 3060. [Google Scholar] [CrossRef]
  23. Raj, B.; Sathyan, D.; Madhavan, M.K.; Raj, A. Mechanical and durability properties of hybrid fiber reinforced foam concrete. Constr. Build. Mater. 2020, 245, 118373. [Google Scholar] [CrossRef]
  24. Song, Y.; Lange, D. Influence of fine inclusions on the morphology and mechanical performance of lightweight foam concrete. Cem. Concr. Compos. 2021, 124, 104264. [Google Scholar] [CrossRef]
  25. Shafighfard, T.; Kazemi, F.; Asgarkhani, N.; Yoo, D.-Y. Machine-learning methods for estimating compressive strength of high-performance alkali-activated concrete. Eng. Appl. Artif. Intell. 2024, 136, 109053. [Google Scholar] [CrossRef]
  26. Just, A.; Middendorf, B. Microstructure of high-strength foam concrete. Mater. Charact. 2009, 60, 741–748. [Google Scholar] [CrossRef]
  27. Eltayeb, E.; Ma, X.; Zhuge, Y.; Youssf, O.; Mills, J.E.; Xiao, J.; Singh, A. Structural performance of composite panels made of profiled steel skins and foam rubberised concrete under axial compressive loads. Eng. Struct. 2020, 211, 110448. [Google Scholar] [CrossRef]
  28. Kozłowski, M.; Kadela, M. Mechanical characterization of lightweight foamed concrete. Adv. Mater. Sci. Eng. 2018, 2018, 6801258. [Google Scholar] [CrossRef]
  29. Mydin, M.A.O.; Wang, Y.C. Mechanical properties of foamed concrete exposed to high temperatures. Constr. Build. Mater. 2012, 26, 638–654. [Google Scholar] [CrossRef]
  30. Mahendran, M.; McAndrew, D. Flexural wrinkling strength of lightly profiled sandwich panels with transverse joints in the foam core. Adv. Struct. Eng. 2003, 6, 325–337. [Google Scholar] [CrossRef]
  31. Ridha, M.M.S.; Li, D.; Clifton, G.C.; Ma, X. Structural behavior of composite panels made of lightly profiled steel skins and lightweight concrete under concentric and eccentric loads. J. Struct. Eng. 2019, 145, 04019093. [Google Scholar] [CrossRef]
  32. Pokharel, N.; Mahendran, M. An investigation of lightly profiled sandwich panels subject to local buckling and flexural wrinkling effects. J. Constr. Steel Res. 2005, 61, 984–1006. [Google Scholar] [CrossRef]
  33. Prabha, P.; Marimuthu, V.; Saravanan, M.; Palani, G.S.; Lakshmanan, N.; Senthil, R. Effect of confinement on steel-concrete composite light-weight load-bearing wall panels under compression. J. Constr. Steel Res. 2013, 81, 11–19. [Google Scholar] [CrossRef]
  34. Liew, J.Y.R.; Yan, J.-B.; Huang, Z.-Y. Steel-concrete-steel sandwich composite structures-recent innovations. J. Constr. Steel Res. 2017, 130, 202–221. [Google Scholar] [CrossRef]
  35. Negahban, E.; Bagheri, A.; Al-Dujaili, A.; Sanjayan, J. Insulation failure of lightweight composite sandwich panels exposed to flame. Fire Mater. 2020, 44, 943–952. [Google Scholar] [CrossRef]
  36. Pedreschi, R.; Sinha, B. Predicting the shear strength of mechanical clinching in cold-formed steel structures. J. Mater. Civ. Eng. 2006, 18, 435–442. [Google Scholar] [CrossRef]
  37. Oudjene, M.; Ben-Ayed, L.; Delamézière, A.; Batoz, J.L. Shape optimization of clinching tools using the response surface methodology with Moving Least-Square approximation. J. Mater. Process. Technol. 2009, 209, 289–296. [Google Scholar] [CrossRef]
  38. Coppieters, S.; Cooreman, S.; Lava, P.; Sol, H.; Houtte, P.V.; Debruyne, D. Reproducing the experimental pull-out and shear strength of clinched sheet metal connections using FEA. Int. J. Mater. Form. 2011, 4, 429–440. [Google Scholar] [CrossRef]
  39. Mucha, J.; Boda, Ł.; Witkowski, W. Geometrical parameters and strength of clinching joint formed with the use of an additional rivet. Arch. Civ. Mech. Eng. 2023, 23, 114. [Google Scholar] [CrossRef]
  40. Breda, A.; Coppieters, S.; Debruyne, D. Equivalent modelling strategy for a clinched joint using a simple calibration method. Thin-Walled Struct. 2017, 113, 1–12. [Google Scholar] [CrossRef]
  41. Mucha, J.; Witkowski, W. The clinching joints strength analysis in the aspects of changes in the forming technology and load conditions. Thin-Walled Struct. 2014, 82, 55–66. [Google Scholar] [CrossRef]
  42. Varis, J. Ensuring the integrity in clinching process. J. Mater. Process. Technol. 2006, 174, 277–285. [Google Scholar] [CrossRef]
  43. ASTM E8/E8M-22; Standard Test Methods for Tension Testing of Metallic Materials. ASTM: West Conshohocken, PA, USA, 2022; p. 31. [CrossRef]
  44. Mayo, S.C.; Gureyev, T.E.; Nesterets, Y.I.; Thompson, D.A.; Siu, K.K.W.; Wallwork, K. A dedicated micro-CT beamline for the Australian Synchrotron and the Remote-CT project. J. Phys. Conf. Ser. 2013, 463, 012002. [Google Scholar] [CrossRef]
  45. ASTM C39/C39M-21; Standard Test Method for Compressive Strength of Cylindrical Concrete Specimens. ASTM International: West Conshohocken, PA, USA, 2021. [CrossRef]
  46. ASTM C496/C496M-17; Standard Test Method for Splitting Tensile Strength of Cylindrical Concrete Specimens. ASTM International: West Conshohocken, PA, USA, 2017. [CrossRef]
  47. ZEISS. ZEISS Quality Tech Guide: Introduction to Digital Image Correlation and Strain Computation. Available online: https://techguide.zeiss.com/en/zeiss-inspect-2025 (accessed on 30 March 2025).
  48. Nanayakkara, O.; Xia, J. Mechanical and physical properties of mortar of partially replaced fine aggregates with sawdust. Acad. J. Civil Eng. 2019, 37, 308–313. [Google Scholar] [CrossRef]
  49. Youssef, A.; Lecompte, T.; Picandet, V.; Challamel, N. Compressive and shearing behavior of lime and hemp concrete. Acad. J. Civil Eng. 2015, 33, 405–411. [Google Scholar]
  50. Xiao, Q.; Ju, G.; Ye, F.; Wang, Y.; Jin, L.; Fu, W. An innovative approach for assessing the tensile strength of concrete: Experimental and numerical investigations. Constr. Build. Mater. 2024, 417, 135249. [Google Scholar] [CrossRef]
  51. Plantema, F.J. Sandwich Construction: The Bending and Buckling of Sandwich Beams, Plates, and Shells, 1st ed.; John Wiley and Sons: Hoboken, NJ, USA, 1966. [Google Scholar]
  52. Zenkert, D. An Introduction to Sandwich Structures, Student ed.; Technical University of Denmark: Copenhagen, Denmark, 1995. [Google Scholar]
  53. Hou, Y.; Tai, Y.H.; Lira, C.; Scarpa, F.; Yates, J.R.; Gu, B. The bending and failure of sandwich structures with auxetic gradient cellular cores. Compos.-A Appl. Sci. Manuf. 2013, 49, 119–131. [Google Scholar] [CrossRef]
  54. Ali, S.B.; Kamaris, G.S.; Gkantou, M. Flexural behaviour of concrete-filled double skin aluminium alloy tubes. Eng. Struct. 2022, 272, 114972. [Google Scholar] [CrossRef]
  55. Hoff, N.J.; Mautner, S.E. Bending and buckling of sandwich beams. J. Aeronaut. Sci. 1948, 15, 707–720. [Google Scholar] [CrossRef]
  56. Gdoutos, E.E.; Daniel, I.M.; Wang, K.A. Compression facing wrinkling of composite sandwich structures. Mech. Mater. 2003, 35, 511–522. [Google Scholar] [CrossRef]
Table 1. Image processing parameters.
Spatial Standard Deviation (-)Intensity Standard Deviation (-)Search Window (px)Local Neighbourhood (px)
50.2103
Table 2. Tensile parameters of the G300 steel.
Ultimate Tensile Strength
(UTS) MPa
Yield Strength
MPa
Uniform Elongation
(UE) %
Total Elongation
(TE) %
Specimen 1370.7363.122.633.1
Specimen 2370.6363.822.035.3
Average370.7363.522.334.2
Table 3. Measured volume sizes and percentages before and after 3-point bending.
ConditionMortar Volume 3D (mm3)Pore Volume 3D
(mm3)
Pore Percentage
(%)
Estimate Density Range (kg/m3)
Non-loaded160.2217.757.6572.3–877.5
After the bend test145.8232.161.4518.4–794.9
Disclaimer/Publisher’s Note: The statements, opinions and data contained in all publications are solely those of the individual author(s) and contributor(s) and not of MDPI and/or the editor(s). MDPI and/or the editor(s) disclaim responsibility for any injury to people or property resulting from any ideas, methods, instructions or products referred to in the content.

