Article

Hybrid Model for BIM Application Maturity in Prefabricated Buildings: A Case Study in Xi’an, China

School of Architecture and Civil Engineering, Xi’an University of Science and Technology, Xi’an 710054, China
*
Author to whom correspondence should be addressed.
Buildings 2025, 15(8), 1322; https://doi.org/10.3390/buildings15081322
Submission received: 8 March 2025 / Revised: 4 April 2025 / Accepted: 12 April 2025 / Published: 16 April 2025
(This article belongs to the Section Construction Management, and Computers & Digitization)

Abstract

Building Information Modeling (BIM) has recently gained popularity in the public building industry, and BIM is widely implemented in the construction industry in many developed countries around the world. In this paper, in order to evaluate the application level of BIM technology in assembly buildings in China, five maturity levels of BIM application in assembly buildings are established based on the commonly used maturity model, including the initial level, the starting level, the management level, the integration level, and the continuous optimization level. In order to construct a maturity evaluation index system for BIM application in prefabricated buildings, the literature review method was chosen to identify the indexes initially, the indexes were optimized by combining the questionnaire survey method, and using the balanced scorecard model, the maturity evaluation index system for BlM application in prefabricated buildings consisting of one target level, five guidance levels, thirteen graded element levels and thirty-one secondary index levels were identified. Based on this framework, the study establishes a maturity assessment model for BIM application in prefabricated buildings through three methodological integrations. First, the hierarchical analysis method Analytic Hierarchy Process (AHP) was employed to assign weights to indexes within the evaluation system. Subsequently, the Entropy Weight Method (EWM) was utilized to systematically construct the index system. This quantitative foundation was then combined with fuzzy comprehensive evaluation principles to develop the integrated assessment model. The practical application of this model was demonstrated through a case study of a prefabricated building project in China. The assessment results revealed that the project’s BIM application maturity level falls within the transitional phase “between the management level and integrated level”, indicating progressive but not yet fully optimized implementation. The result verifies the validity of the assessment model and proposes corresponding optimization suggestions based on the assessment results.

1. Introduction

1.1. Research Background

The current traditional construction methods still occupy a large proportion of the research [1]. This method mainly relies on on-site cast-in-place, which not only produces a large amount of dust, noise, and other pollution during the construction process—which has a serious impact on the surrounding environment—but also has a low degree of mechanization and a large input of manpower, which leads to low efficiency in the construction process. At the same time, the phenomenon of waste of resources in the process of transporting, storing, and using the materials is more prevalent. The macroeconomic environment is complex and changeable, especially the real estate market, which has not yet fully stabilized. Local government investment is impacted by the constraints of the source of funds, and the construction industry urgently needs to explore new means of construction in order to adapt to the new market demand and future development trend [2].
“Integration” and “informationization” are the distinctive features of prefabricated buildings. With the rapid development of digital technology, the integration of prefabricated buildings and BIM technology is becoming increasingly close. The two technologies promote each other and develop together. In the context of prefabricated buildings, BIM transcends its conventional role in on-site construction by acting as a centralized orchestrator for modular design, precision manufacturing, and systemic integration across the project lifecycle. Unlike traditional construction, where BIM primarily resolves spatial clashes and streamlines on-site workflows, prefabricated BIM workflows demand tighter synchronization between design intent and factory production. For instance, BIM in prefabrication embeds manufacturing specifications (e.g., material tolerances, assembly sequences) directly into component models, enabling automated fabrication and real-time tracking via RFID (Radio Frequency Identification) or IoT-enabled systems. This contrasts with on-site BIM applications, which focus more on adapting designs to unpredictable field conditions.
Beyond the creation of a shared 3D model, BIM’s multidimensional capabilities are pivotal in prefabricated projects. The 4D dimension integrates construction schedules with modular production timelines, ensuring just-in-time delivery of components to minimize site storage. Cost analysis (5D) becomes more granular, as BIM links material databases to prefab-specific cost drivers like factory labor rates and transportation logistics. Sustainability analysis (6D) is enhanced through energy simulations of modular units and lifecycle assessments of reusable components, aligning with circular economy principles. Safety planning benefits from clash detection in virtual assembly sequences, reducing onsite risks, while Lean methodologies are embedded through waste reduction in factory workflows. Post-construction, BIM evolves into a digital twin for facility management, storing maintenance data within prefab component tags for predictive upkeep. These dimensions collectively position BIM not merely as a design tool but as a lifecycle governance framework uniquely suited to the industrialized precision of prefabricated construction.
The innovative construction mode of “BIM + assembly” is highly suitable for the current development trend of the construction industry, which not only improves the degree of visualization of the construction process, allowing all parties involved in the project to understand the whole picture of the project more intuitively, but also improves the level of integration of the design, and realizes the collaborative operation of various professional designs. Although the application of BIM technology in the field of prefabricated buildings in China started relatively late, through the construction of a scientific and reasonable evaluation system, problems in the application process can be found and solved in a timely manner, which will strongly promote the sustainable development of prefabricated buildings. Therefore, the development of a comprehensive set of BIM application maturity evaluation tools is of great practical significance to promote the progress of the assembly building industry [3,4,5,6].

1.2. Literature Review

BIM maturity refers to the extent to which BIM is explicitly “defined, managed, integrated, and optimized” [7]. Yujie Lu et al. (2024) [8] systematically investigated the pivotal role of BIM in the Integrated Digital Delivery (IDD) paradigm. Their research not only validated its technical feasibility, evidenced by a 67% reduction in project timelines and a decrease in construction waste to 25 t/104 m2, but also proposed a standardized implementation framework. This framework provides theoretical underpinnings for advancing BIM from a standalone tool to an industry-wide collaborative platform, enabling seamless integration across the entire construction value chain.
Atul P. and Kasun N. (2013) [9] explained that BIM is being vigorously promoted in Western countries, and that more and more installation designers, architects, producers of prefabricated elements, architects, engineers, investors, developers, construction companies, contract managers are applying it to all stages of preparation, construction, management, etc., in Poland and around the world, so as to achieve the purpose of public investment.
Sonmez et al. (2022) [10] designed and developed a novel BIM-integrated smart contract system for improving traditional progress payment procedures in construction projects. The system was applied to a real construction project, and the results of a questionnaire survey indicated that the new system has significant potential for accelerating existing payment processes and reducing disputes.
Samer E. S. and Osama O. (2021) [11] focused on designing a BIM energy-consumption template to calculate and achieve a net-zero-energy house, which is primarily about using BIM for building energy consumption calculation. Their research provides a reliable solution for energy efficiency in buildings.
Farrukh A. and Waleed A. K. (2021) [12] showed that BIM has been widely used in all aspects of the supply chain and has been significantly improved with the support of BIM. In order to better understand the role of BIM, simulation experiments were also carried out to explore the potential in the current field of prefabricated buildings.
Lee M., Park G., Jang H., et al. (2021) [13] proposed BIM-based prefabricated steel frame structures to meet the needs of small and medium-sized enterprises. Researchers have conducted in-depth research on its basic functions in order to achieve the best results, and through the analysis of actual cases, it has demonstrated its qualitative effect.
Faraj et al. (2000) [14] developed WISPER, a web-based collaborative construction computer environment based on Industry Foundation Classes (IFC). This system was designed to enhance collaboration among construction project stakeholders by enabling efficient data sharing and management, thereby improving project efficiency and communication.
The global prefabricated buildings market was valued at USD 146.47 billion in 2024 and is projected to reach USD 208.10 billion by 2030, growing at a CAGR of 6.03% during the forecast period [15]. The market is experiencing robust growth, fueled by rapid urbanization, cost efficiency, and the increasing demand for scalable housing and infrastructure solutions, particularly in emerging economies such as India and China. The Asia–Pacific region commands a significant market share, driven by rising construction activities, labor shortages, and government initiatives supporting affordable housing. Europe and North America are also witnessing growth, with the adoption of modular construction gaining traction in both commercial and residential sectors. Innovations like 3D printing, Building Information Modeling (BIM), and robotics are transforming the prefabrication process, enhancing precision, minimizing waste, and promoting sustainability [16,17].
By combining BIM with manufacturing, the structural integrity and innovation of buildings can be greatly improved, allowing for more accurate collection and analysis of data in building models. In recent years, in order to promote the popularization of BIM and prefabricated buildings, the Chinese government has vigorously promoted the development of BIM and released the latest BIM application standards in 2018 [18], guiding the effective use of BIM in civil building design. Starting from the entire life cycle of buildings, stricter requirements have been put forward for the depth, resources, and delivery of its application, thus promoting the standardization, normalization, and sustainable development of the construction industry. Currently, Chinese scholars are actively exploring prefabricated buildings, BIM, and their applications to achieve better results.

1.3. Research Gaps

1.3.1. Deficiency in Dynamic BIM Capability Evaluation Framework for Prefabricated Scenarios

Current BIM assessment systems lack dynamic adaptation mechanisms tailored to modular construction workflows. Static evaluation criteria fail to address phase-specific BIM requirements across prefabricated component design (demanding millimeter-level modeling precision for manufacturing), logistics tracking (requiring RFID data integration), and on-site assembly (needing real-time clash detection). The absence of temporal evaluation metrics becomes critical with technological advancements like robotic construction equipment, which require BIM models to dynamically adjust tolerance thresholds and material traceability parameters [19].

1.3.2. Overreliance on Subjective Weighting in Conventional Method

Traditional approaches like fuzzy AHP exhibit significant subjectivity biases [20], where expert backgrounds disproportionately influence indicator weighting [21]. For instance, logistics specialists may overweight transportation management indicators by 20–25% compared to structural engineers, while objective data such as component production cycle times remain underutilized [22]. Empirical studies reveal that purely subjective weighting reduces diagnostic accuracy for installation errors, highlighting the necessity for hybrid weighting methods that integrate entropy weight analysis of construction IoT data with expert knowledge calibration.

2. BIM Capability Rating Construction

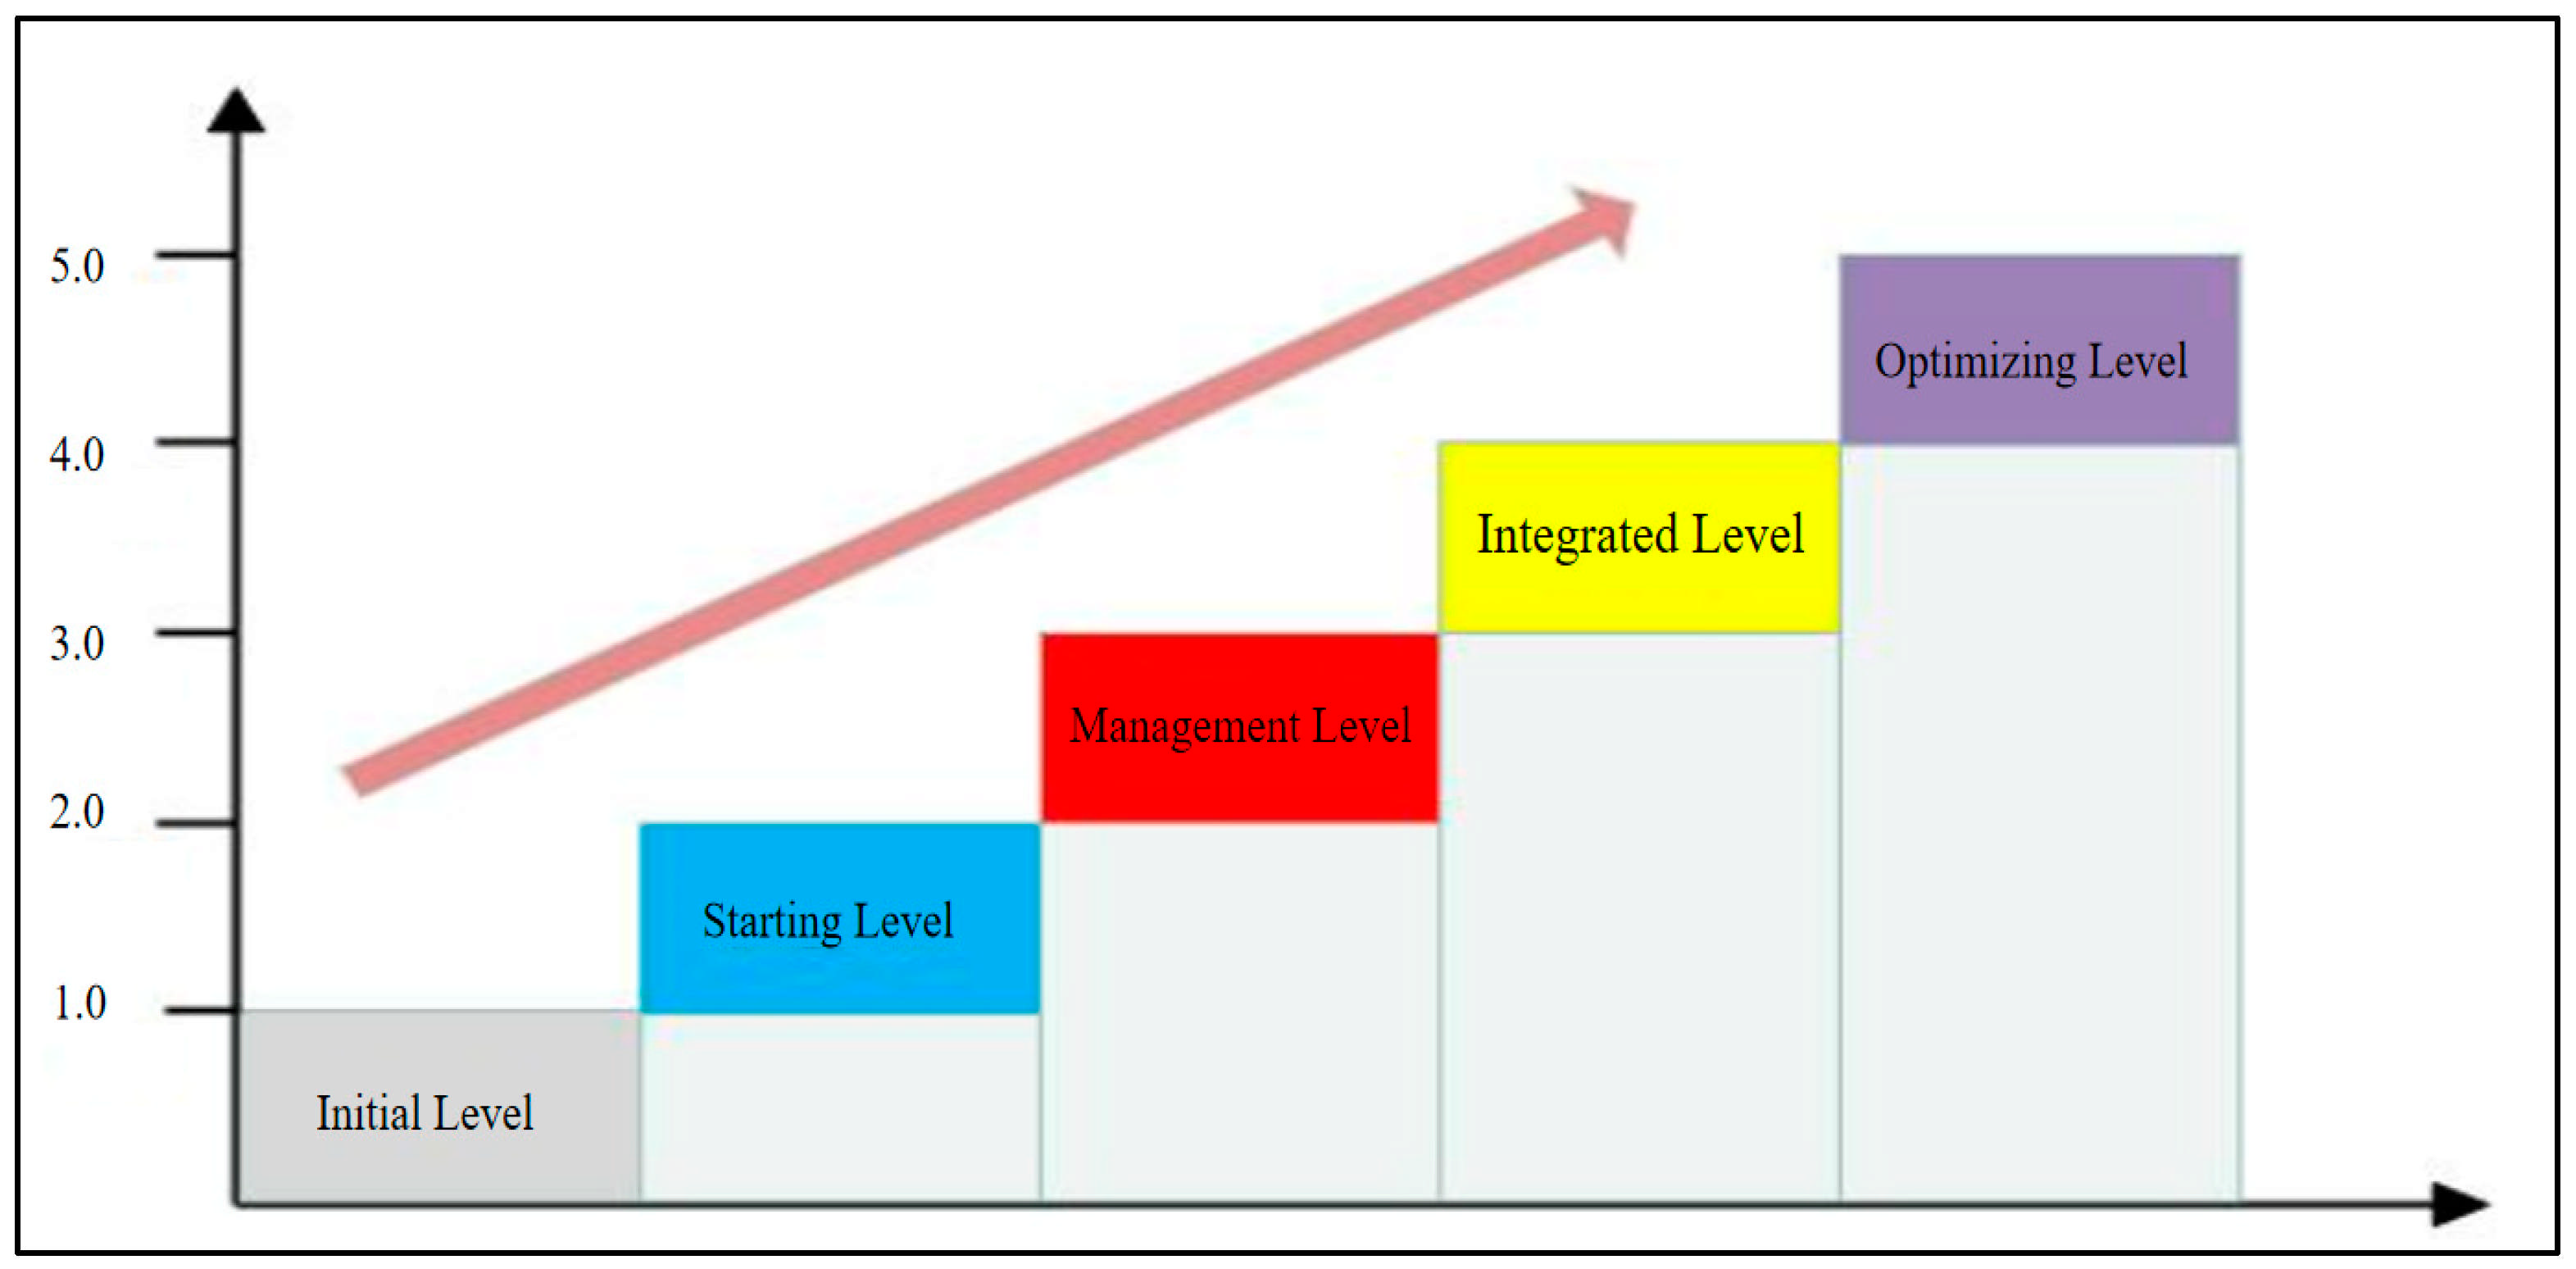
2.1. Level Classification

This paper refers to the CMM (Capability Maturity Model) and OPM3 (Organizational Project Management Maturity Model) at the same time on the basis of summarizing the literature, combined with the advice of experts in the industry [22,23]. Then, we came up with the following definition of the BIM application capability maturity model for assembly buildings: to help the organization to achieve the established goals; for the growth of the project, capability maturity will bring about a reduction in the gap between the actual results of the project and the expected results, relative to the established goals and results. The range of deviation of the actual results is reduced and the expected target results are improved.
By classifying the application capabilities of prefabricated building BIM, the advantages and disadvantages of prefabricated building application capabilities are described, which is also the basis for constructing a maturity model of prefabricated building application capabilities to better guide practical operations. After studying the Capability Maturity Model [24], the BIM application capability maturity model for prefabricated buildings is divided into five levels, from low to high: Initial Level, Starting level, Management level, Integrated level, and Optimization level [25,26]. As shown in Figure 1.
According to the analysis, the assembly building BIM application capability maturity model consists of the following three dimensions.
The first dimension is the five levels of maturity, which are initial, starting, management, integration, and continuous optimization. The second dimension is the four stages of the whole life cycle of assembly building: planning and scheme, design, production, transportation and lifting construction, and completion. The third dimension is the elements of the assembly building BIM application system, which utilizes the balanced scorecard principle to describe the key indicators under each maturity level from four dimensions: project stakeholders, finance, learning and growth, and internal business processes.

2.2. BIM Application Capability Maturity Level Characteristics

Currently, the mainstream maturity evaluation models in the international and national research fields categorize maturity levels into three to ten levels to better measure their level of development [27,28]. Thus, using CMM [29,30] as a reference, the maturity level of BIM application in prefabricated buildings is divided into five different levels. The overall maturity levels are described in Table 1.

3. Construction of Evaluation System for Maturity of BIM Application Capability in Prefabricated Buildings

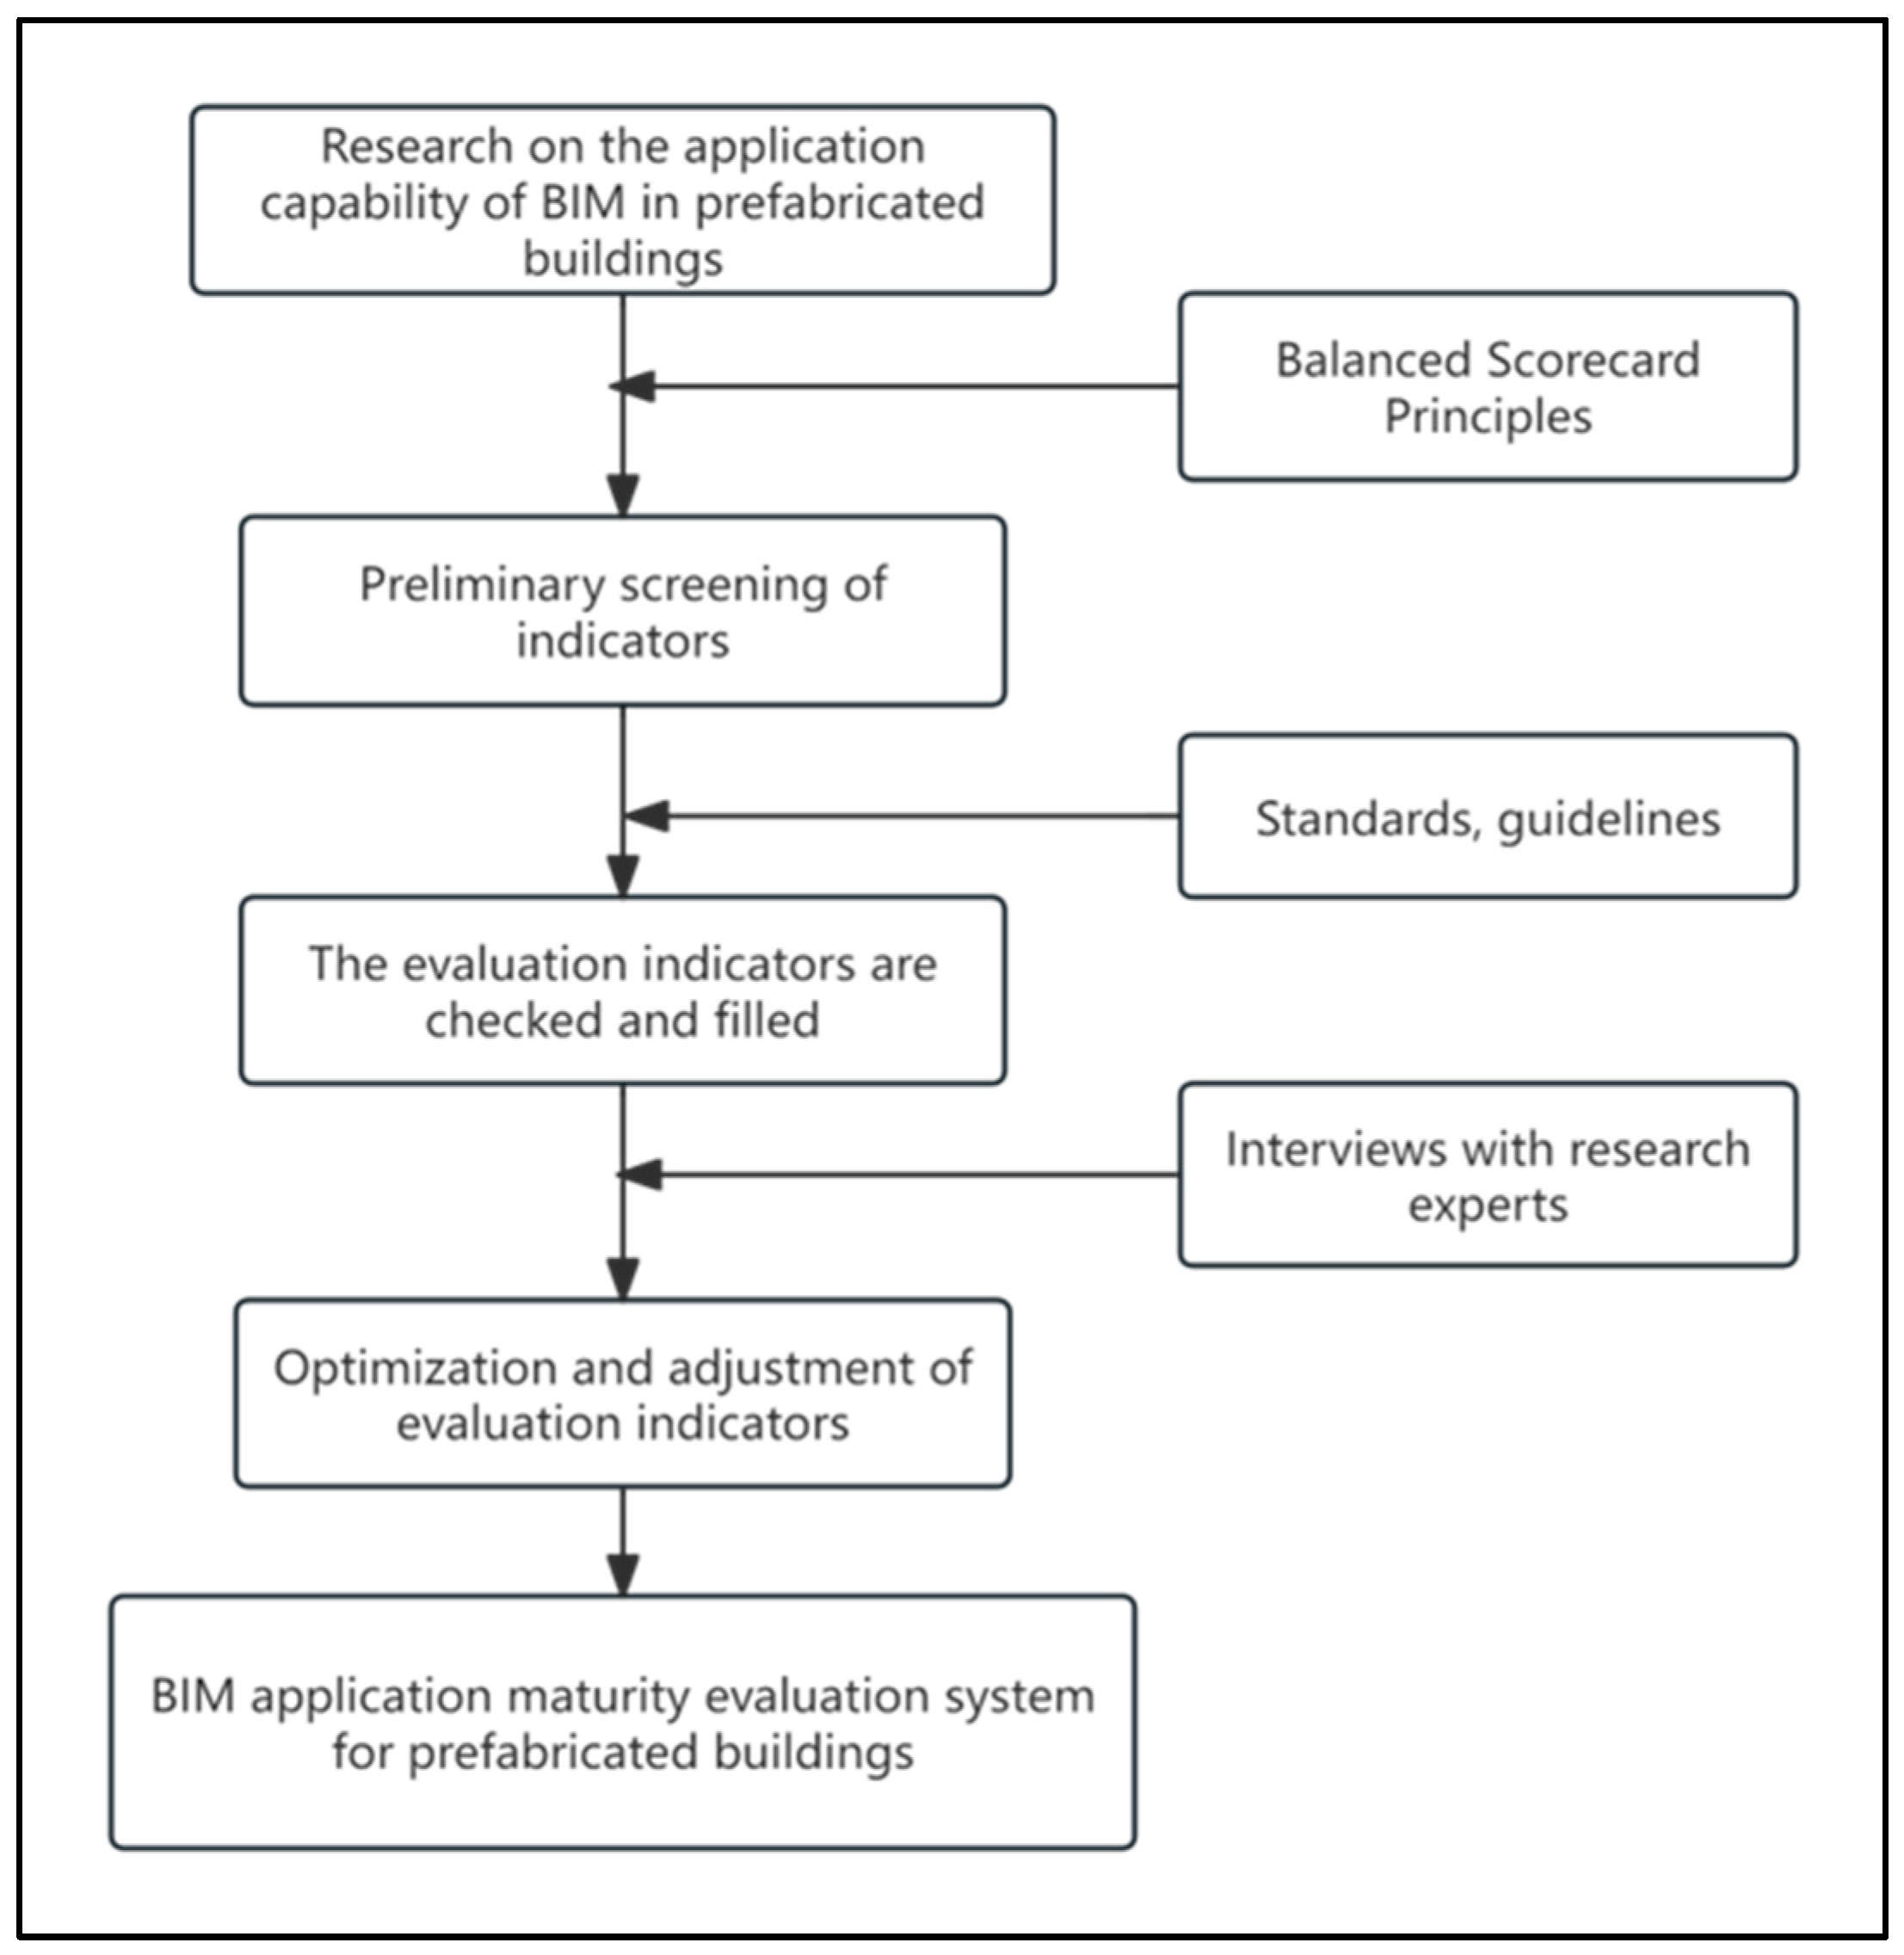
3.1. Basis for Construction

By combing and analyzing the relevant theoretical knowledge, we use the principle of the balanced scorecard for the initial identification of evaluation indicators [31], conduct a further screening of indicators in multiple dimensions, and then use the relevant literature and standards for the indicators to check the gaps and make up for the omissions, and then use the research and expert interviews through the questionnaire survey for the evaluation of indicators to optimize and improve the evaluation of the indicators. Ultimately, we obtain the scientific and effective evaluation of the maturity of the application of the BIM indicator system after heavy screening, the process of which is shown in Figure 2.
This paper analyzes the actual situation of BIM application, summarizes the research results in recent years, and communicates with experts with many years of experience in the field of BIM. Combined with the principle of Balanced Scorecard, the following evaluation indexes are finally screened out from four dimensions, namely, the internal business process dimension, the financial dimension, the learning and growth dimension, and the dimensions of the stakeholders of the engineering projects. The Target Layer is the maturity of BIM application capability in prefabricated construction, as shown in Table 2.

3.2. Reliability Analysis of Indicators

Through the preparation of feasibility questionnaires to examine the reliability of the evaluation index framework for the maturity of BIM application capability of prefabricated buildings, data are collected to determine whether the evaluation index system hierarchical element layer and index layer are sufficiently reliable to detect the level of BIM development and application capability, and the composition of the researched personnel is shown in Table 3.
Among them, there are one senior engineer, two engineers, one department director, and two deputy directors.
From the perspective of a scientific and operational comparison of questionnaire calculation, this paper adopts Cronbach’s coefficient.
The scoring of the experts was processed through the SPSS26.0 analysis tool. The test results obtained are shown in Table 4.
Usually, Cronbach’s coefficient is between 0 and 1. When it is 0.7–0.8, the questionnaire design has a fairly high reliability; if it is 0.8~0.9, it means that the reliability of the questionnaire is very good; when it is close to 1, it means that the reliability is higher. Different scholars have different views on the lower limit of Cronbach’s coefficient. When the coefficient is greater than or equal to 0.7, it is considered that the reliability is reliable and acceptable; if the coefficient is less than 0.6, it is considered that the reliability is insufficient.
The Alpha value of each dimension of the criterion layer is greater than 0.7, which indicates that the above established element structure is reasonable and passes the reliability requirement.
Other test results are shown in Table 5.
The coefficient is 0.7108 > 0.7 and the reliability of the graded elements layer is acceptable.
Similarly, the other indicator layers are tested, and the results are shown in Table 6.
Cronbach’s coefficient is 0.7065 > 0.7, and the reliability of the indicator layer is acceptable.
The analysis shows that the reliability of the indicator elements passes the requirements.
When conducting the validity analysis, first, experts in the field were invited to assess each indicator based on their professional knowledge and personal experience to ensure that the indicators were consistent with the research topic of this thesis. Based on the assessment results, the experts measured each indicator in detail to ensure accuracy and reliability. Then the validity evaluation was calculated according to the validity ratio Formula (1). After rigorous testing, it was determined whether the evaluation indicators could reflect all the requirements of the maturity assessment. If the evaluation result is lower than 0.6, it means that the validity of the system does not meet the requirements, at which time the questionnaire should be redesigned until a satisfactory validity is achieved 31.
V C R i = n e H / 2 H / 2
where H is the total number of experts, and ne is the number of participating experts who choose the ith indicator and rating purpose.
After the questionnaire survey and the collection of experts’ opinions, using the Formula (1) to calculate, organize and summarize the results, the validity ratios of the indicators are more than 0.6, which proves that the above indicator system is reliable.

3.3. Determination of Indicator Weights

This article uses the Analytic Hierarchy Process [32] and Entropy Weight Method [33] to obtain subjective weights and entropy weights. Finally, the weights are combined through root combination weighting to obtain a comprehensive and objective weight.
After repeated modification and improvement, in order to determine the weight of the application indicators, the questionnaire is set up as shown in Supplementary Materials. Using expert scoring, we invite BIM technicians, college teachers, and relevant experts in construction-related professions in the Shaanxi Province to score the judgment matrix according to the 1–9 scaling method. Respondent demographics have been clarified: 20 BIM experts (60% PhD holders, 10–15 years’ experience), 49 technical staff (70% with bachelor’s degrees, 5–10 years’ experience), and 17 academics (100% PhD researchers), ensuring a high credibility of input. The recovery rate of the questionnaire is shown in Table 7 and take the average value of the scores of the experts as the basis for judgment.
Table 8, Table 9, Table 10, Table 11, Table 12, Table 13, Table 14, Table 15 and Table 16 show the results of the AHP calculation.
According to the above analysis, the AHP weights of the detailed evaluation indexes of the maturity of BIM application capability of prefabricated buildings are shown in Table 17 below.
The entropy weight method aims to quantitatively analyze various parameters in a system by analyzing the uncertainty of variables, mainly based on the entropy principle and other related factors, in order to measure the importance of each parameter and better reflect the overall situation [33].
Q j = 1 H j n j = 1 n H j
In the formula, Q j is the weight of the jth evaluation indicator and H j represents the entropy value of the evaluation index.
The entropy value H j is negatively correlated with the entropy weight Q j . As H j increases, Q j decreases, indicating that the evaluation index has a weak influence on the system and therefore provides less useful information. On the contrary, as H j decreases, Q j increases, indicating that this evaluation metric has a greater impact on the system and therefore provides more useful information.
After calculation, the square root combination weighting method proves to be simple and effective. It can help determine the combined weights of each evaluation index. This method not only solves the problems of other combinatorial methods, but also obtains more accurate results.
The combined weight of the ith index in the evaluation system Q i is the following:
Q i = Q i Q i i = 1 n Q i Q i
In the formula, Q i is the subjective weight of the evaluation index, and Q i is the objective weight of the evaluation index.
Calculating the entropy weights using the Formula (2), combined with the formula of Equation (3) combination weights, the combination weights of each indicator layer are derived as shown in Table 18.

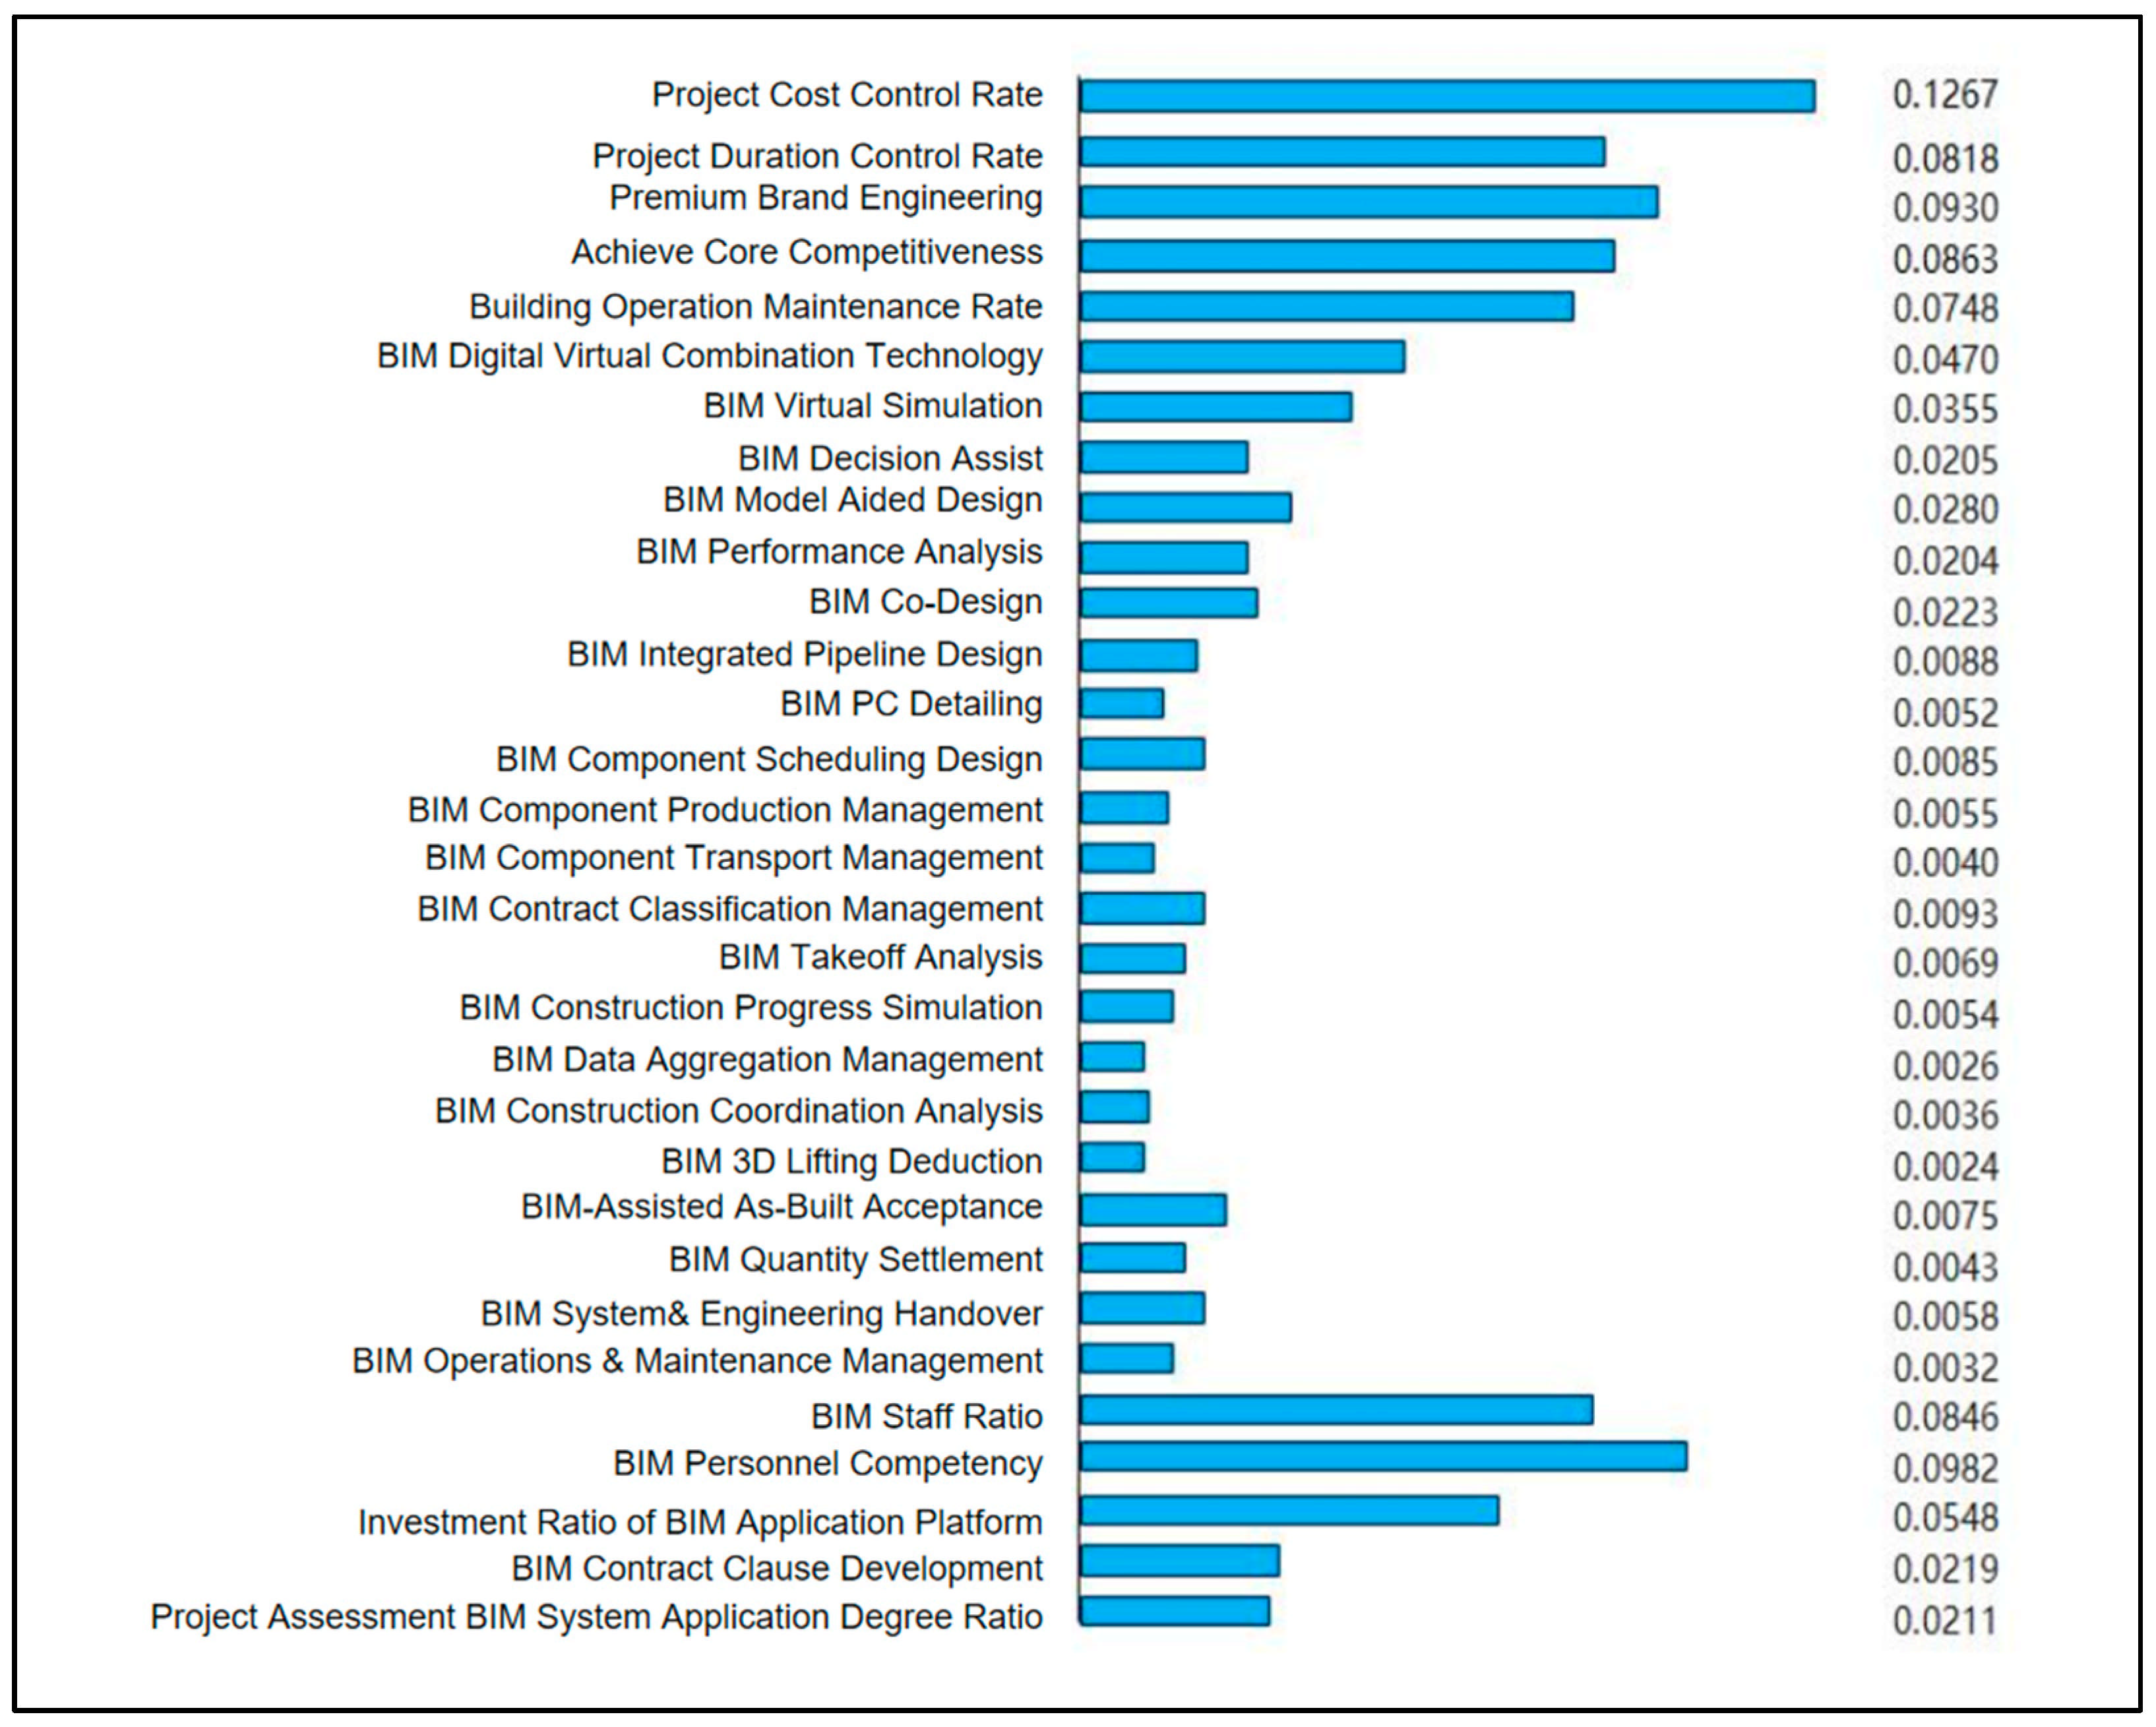
3.4. Analysis of Weighting Results

In the evaluation index system of the BIM application capability maturity of assembly building established by combining the principle of balanced scorecard with hierarchical analysis and entropy weighting method, according to the overall analysis of the results, the proportion of each index at the guideline level is not obvious, and the learning and growth dimensions and internal business process dimensions account for the highest proportion, which indicates that the organization and implementation of BIM and the actual application effect in assembly building projects are essential to improve the maturity level of the project. Among the 31 indicators, project cost has the highest weight, followed by project duration and the ability of BIM practitioners, and the main purpose of applying BIM in assembly projects is to reduce project cost and shorten the construction period; among the stakeholder dimensions, the proportion of high-quality brand projects is larger, and the successful application of BIM not only improves the rate of cost control and duration control of the project, but also brings more benefits to the owner. Therefore, in the field of assembly construction, attention should be paid to the establishment of the application environment of BIM so that its value can be utilized at different stages and the cost and duration of the project can be controlled through these measures to create a high-quality project brand, as shown in Figure 3.

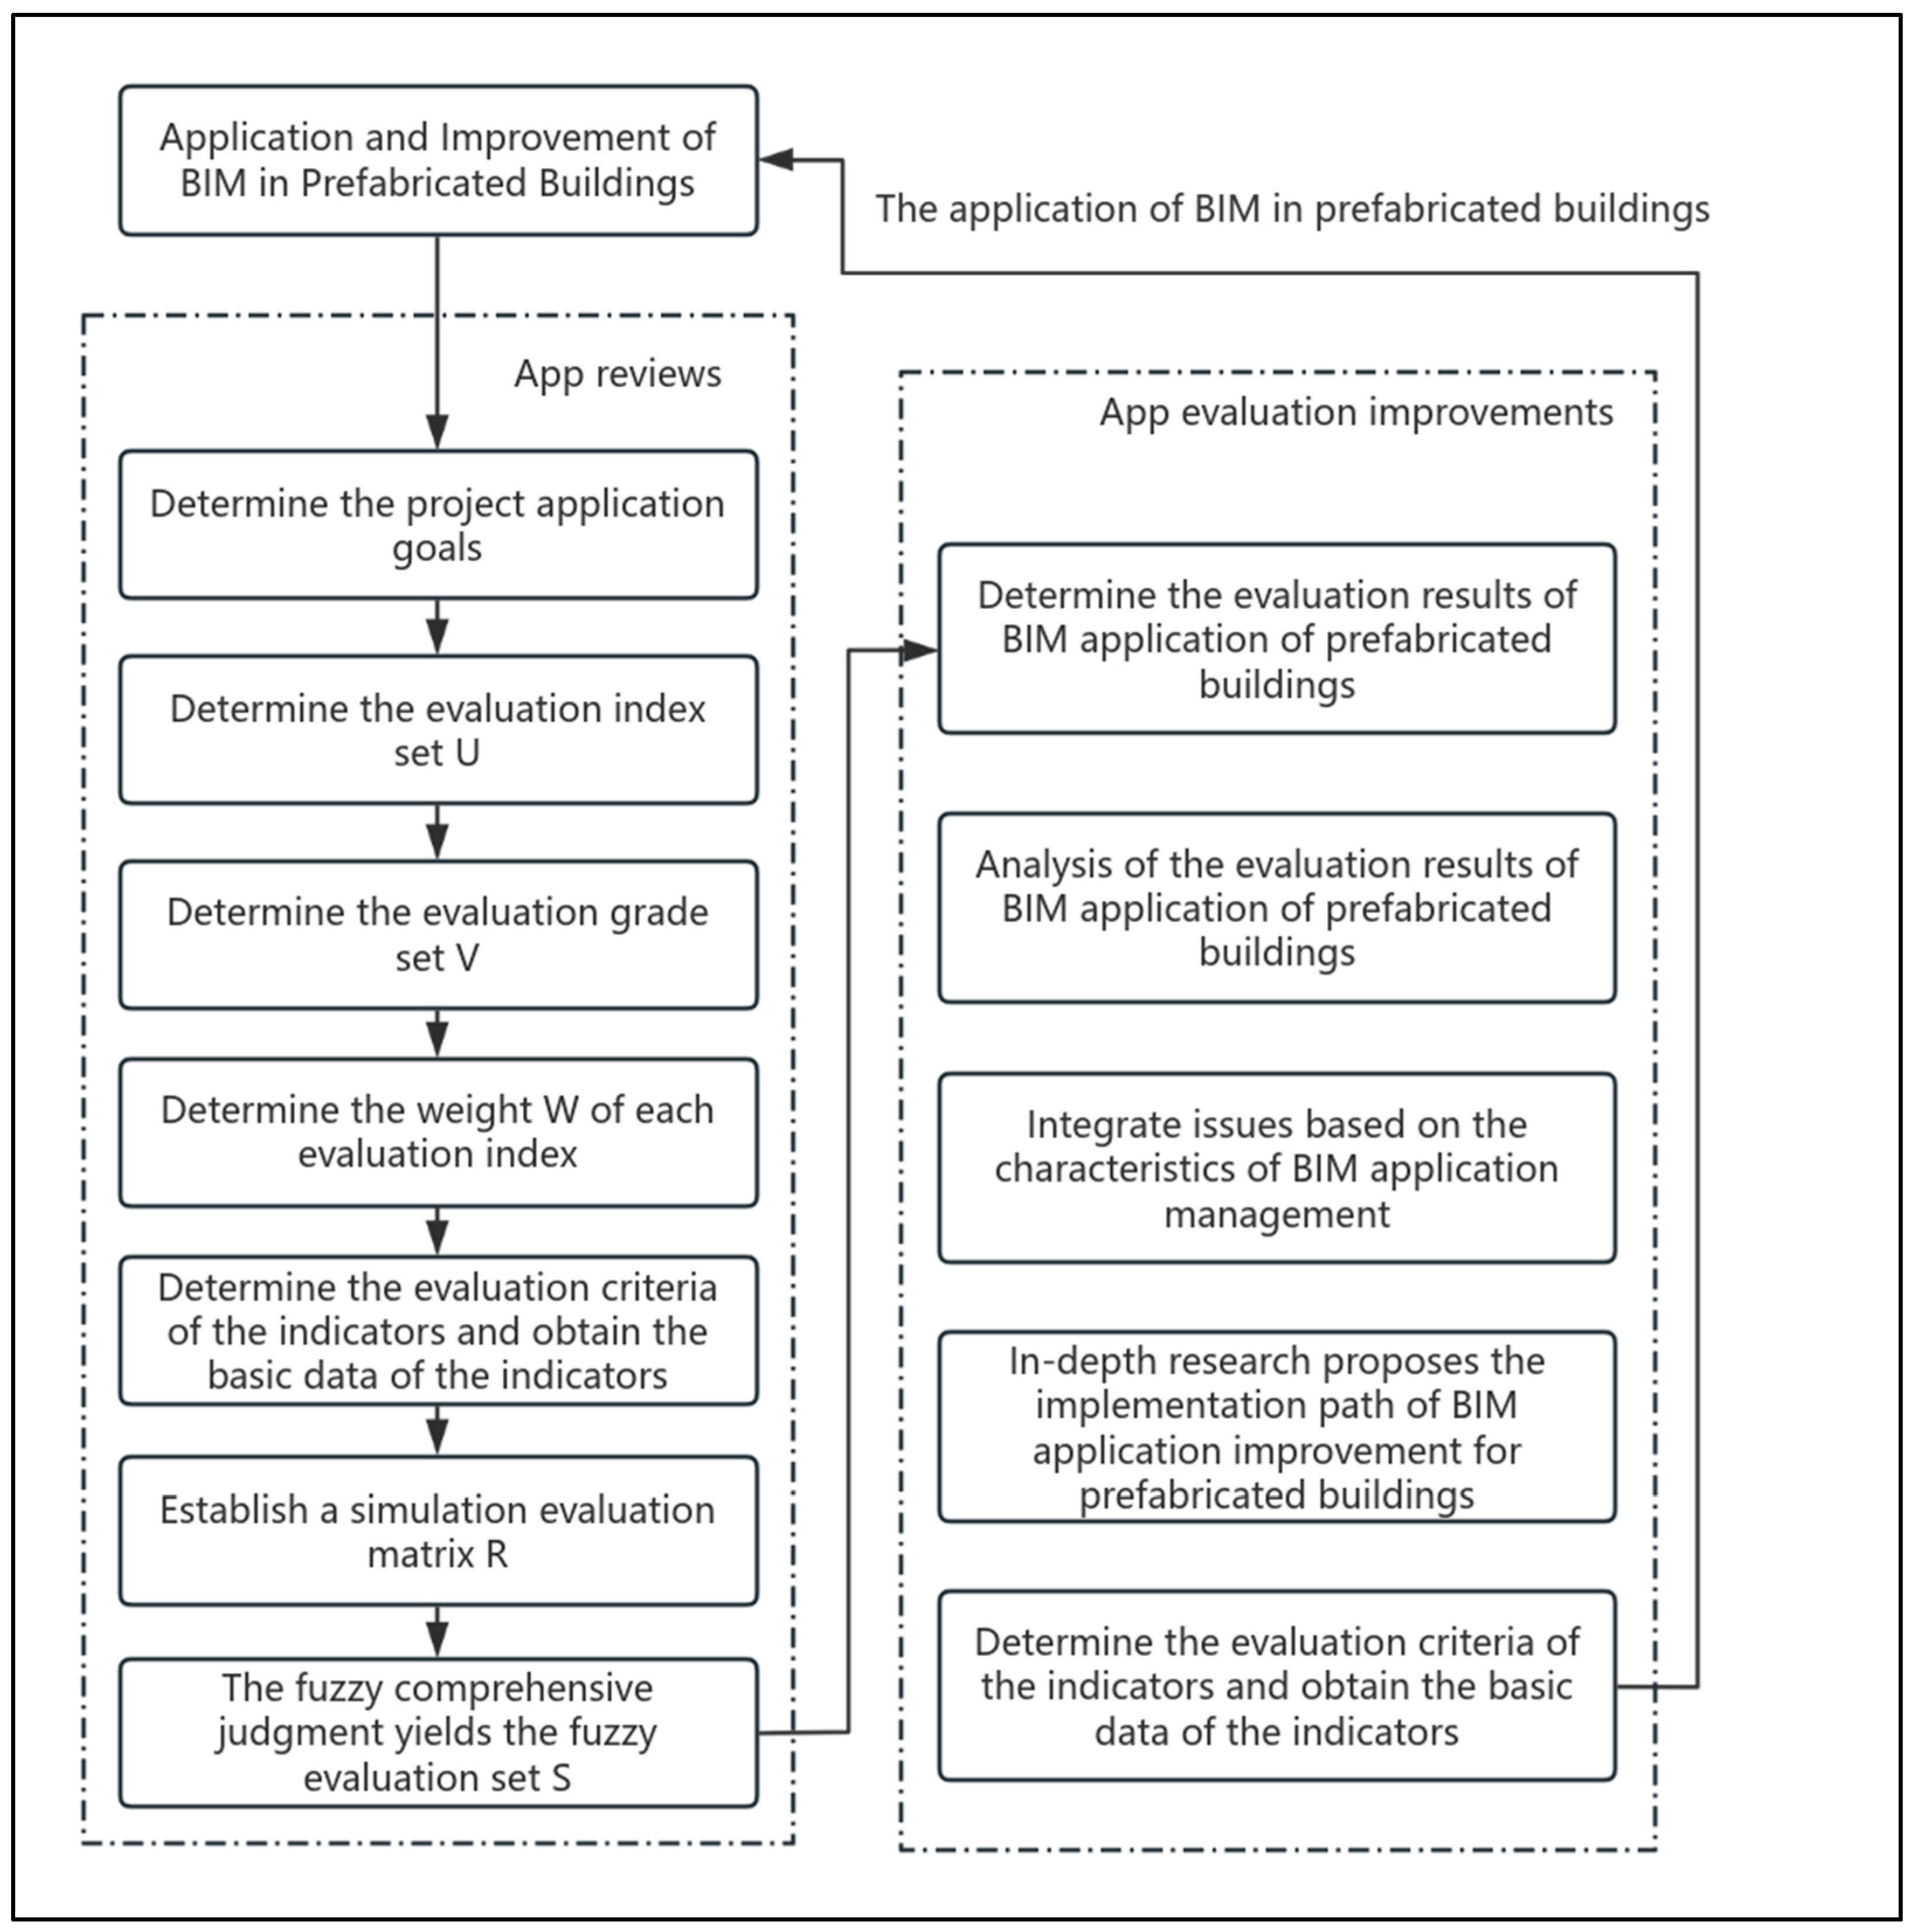
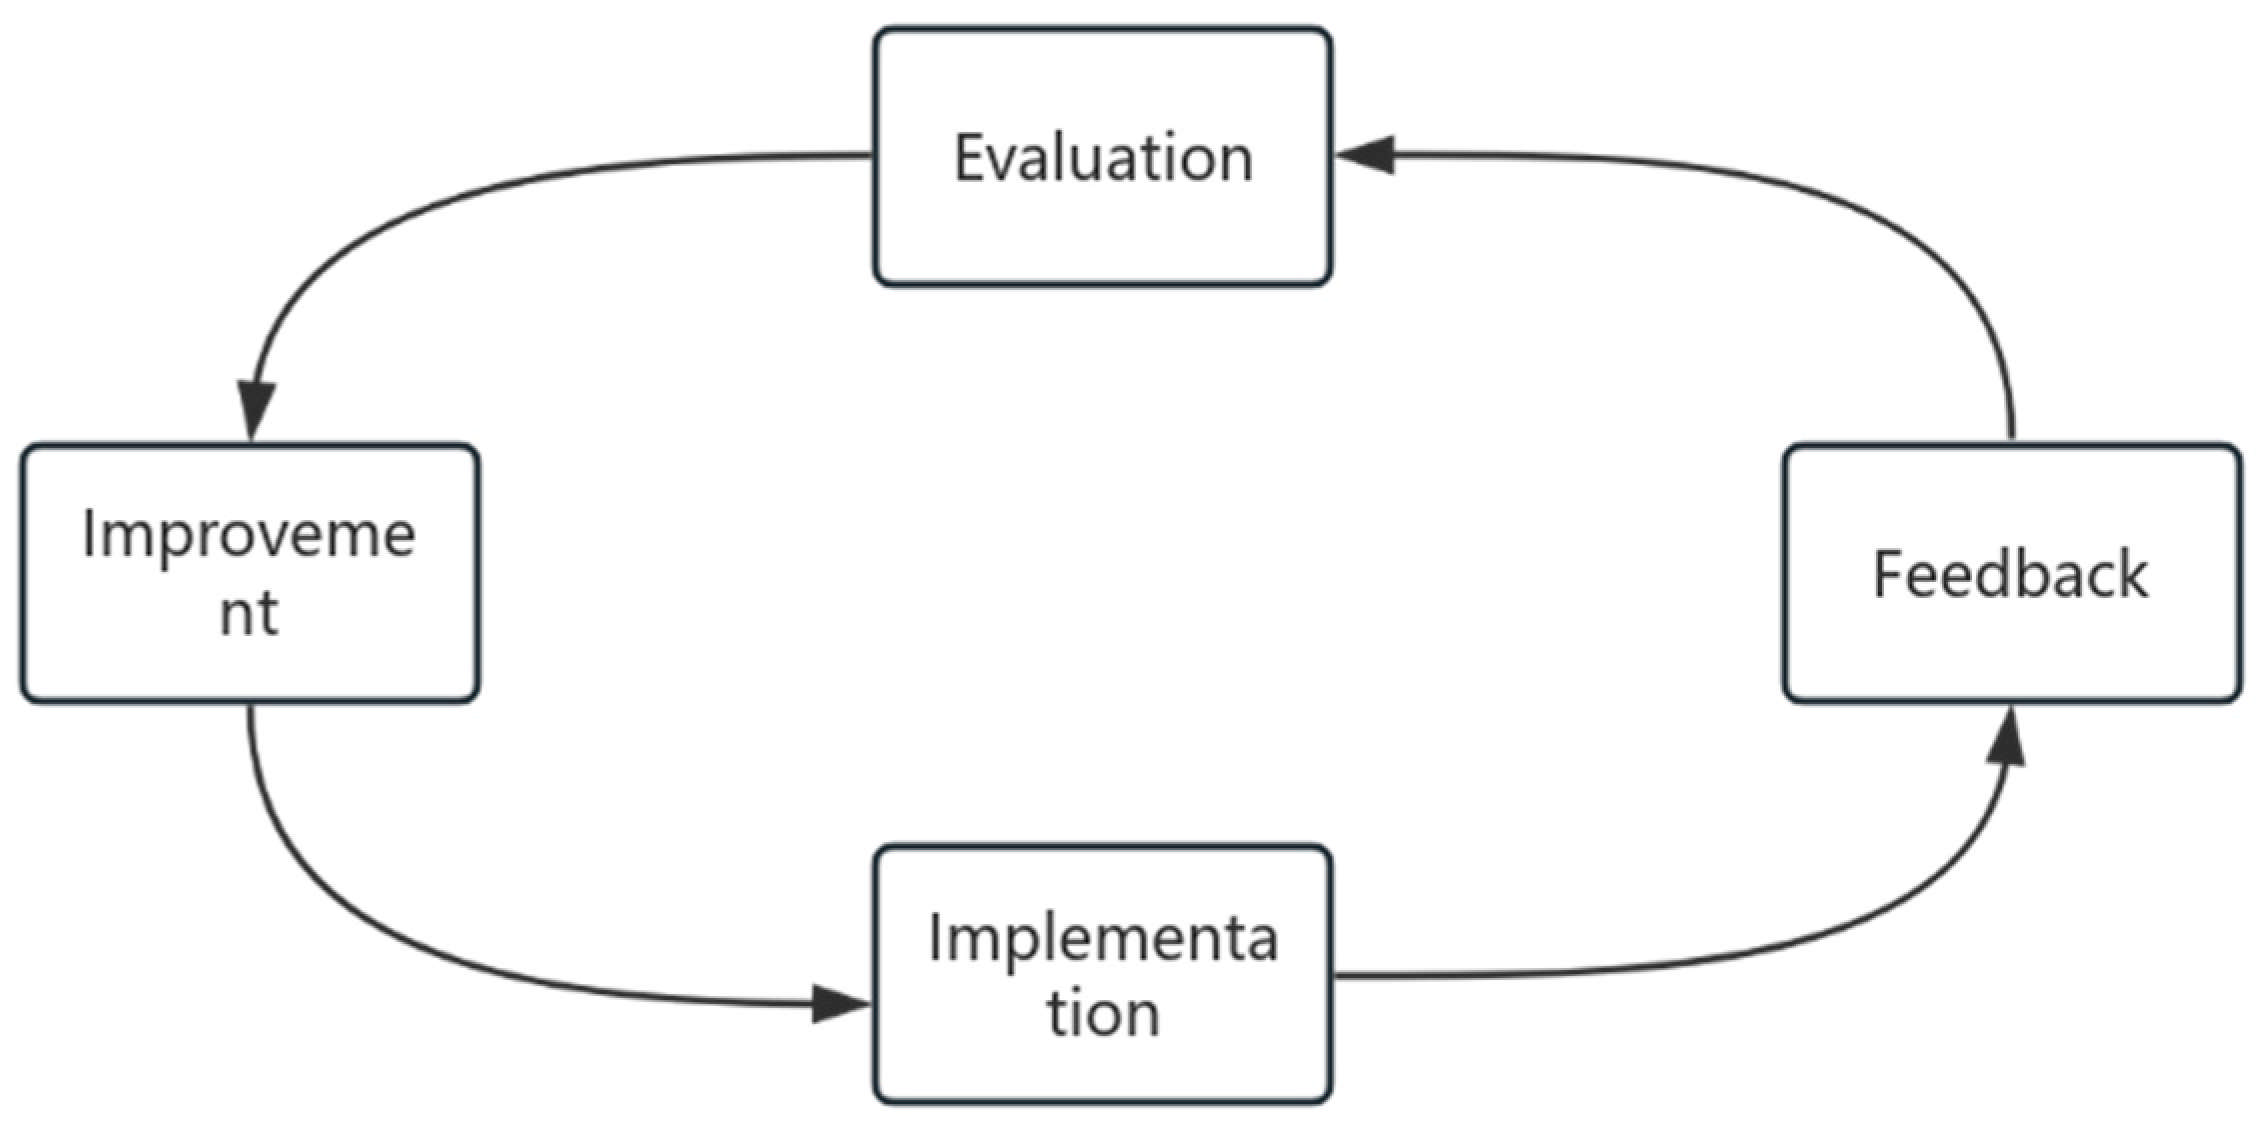
3.5. BIM Application Maturity Evaluation and Improvement Process

The evaluation and improvement of BIM application maturity of prefabricated buildings complement each other, and the evaluation and improvement should be reciprocated to realize that the project maturity should be continuously improved. The assembly building BIM application maturity evaluation and improvement system researched in this paper is based on the above evaluation index system, the multilevel fuzzy comprehensive evaluation (FCE) as the evaluation method, combining it with the characteristics of the application management through the application maturity evaluation, so as to formulate effective improvement measures, and then continue to improve the level of the assembly building BIM application, as shown in Figure 4.
When evaluating the maturity of assembly building BIM, due to the complexity of the system, it is necessary to consider multifaceted and multidimensional factors, and it is difficult to assign weights to each index. In view of the data uncertainty, the multilevel fuzzy comprehensive evaluation is selected for evaluating the maturity level of assembly building BIM, which provides a complete, comprehensive, and objective evaluation standard, thus providing reliable theoretical support for the evaluation. Through the comprehensive consideration of multiple factors, more objective and complete evaluation results can be obtained, and the specific evaluation process is as follows.
(i) Determine the set of evaluation indicators.
U = u 1 , u 2 , , u n
(ii) Determine the set of evaluation levels.
V = v 1 , v 2 , , v n
(iii) Weight of each evaluation index is assigned.
W = w 1 , w 2 , , w n
(iv) Establish the fuzzy evaluation matrix R.
For single-factor (i = 1, 2, …, m) judgment, obtain the fuzzy set of V (r1, r2, …, rn,), then obtain the fuzzy judgment matrix R of U to V as follows:
R = r 11 r 12 r 1 n r 21 r 22 r 2 n r m 1 r m 2 r m n
(v) The fuzzy judgment vector S is obtained by the fuzzy transformation of the weight coefficient matrix W and the evaluation matrix R as follows:
S = W · R = U = u 1 , u 2 , , u n r 11 r 12 r 1 n r 21 r 22 r 2 n r m 1 r m 2 r m n
(vi) Calculate the maturity level of the integrated indicators to obtain the final integrated evaluation results.
F = S · V T

4. Case Study

4.1. Project Profile

The project is a large-scale commercial and residential complex located in Xi’an. The project covers an area of 102 acres, a total of 12 monomers, including 10 assembly high-rise residential buildings, underground garages, and kindergartens and other ancillary facilities; the project has a total construction area of 314,541.82 square meters, a commercial area of 1249.8 square meters, the main unit of construction by the China Construction Bureau, Fenghui Development Construction Unit, the plot ratio of 2.80, and the community-supporting services, houses and structures on the ground are 517.51 square meters. The high-rise residence adopts SPCS (Steel Prefabricated Construction System) assembly structure technology, and the rest of the parts, such as the bottom reinforcement area, roof, stairwell, and core cylinder, are to be constructed by the cast-in-place method. The project adopts prefabricated components such as cavity prefabricated walls, laminated panels, prefabricated stairs, etc. The aerial view of the project is shown in Figure 5.
As the structural design of the project is very complex, involving a wide range of specialties, and a large number of participants, it is difficult to establish effective cooperation among different participants, resulting in management confusion and inefficiency. In order to solve these problems, BIM was used in both the design and implementation of the project, aiming to help better control costs, ensure quality, speed up progress, enhance the project’s improved engineering quality and cooperation efficiency, and reduce costs.
This project was equipped with a kindergarten building, and to ensure quality and construction safety, a BIM information management platform was used to implement fine on-site quality control and safety management to ensure the successful completion of the project. With the completion of delivery, the requirements for operation and management in the later stages became increasingly demanding, so efforts were made to realize intelligent operation and also to work on promoting green operation to reduce energy consumption.

4.2. BIM Applications in Projects

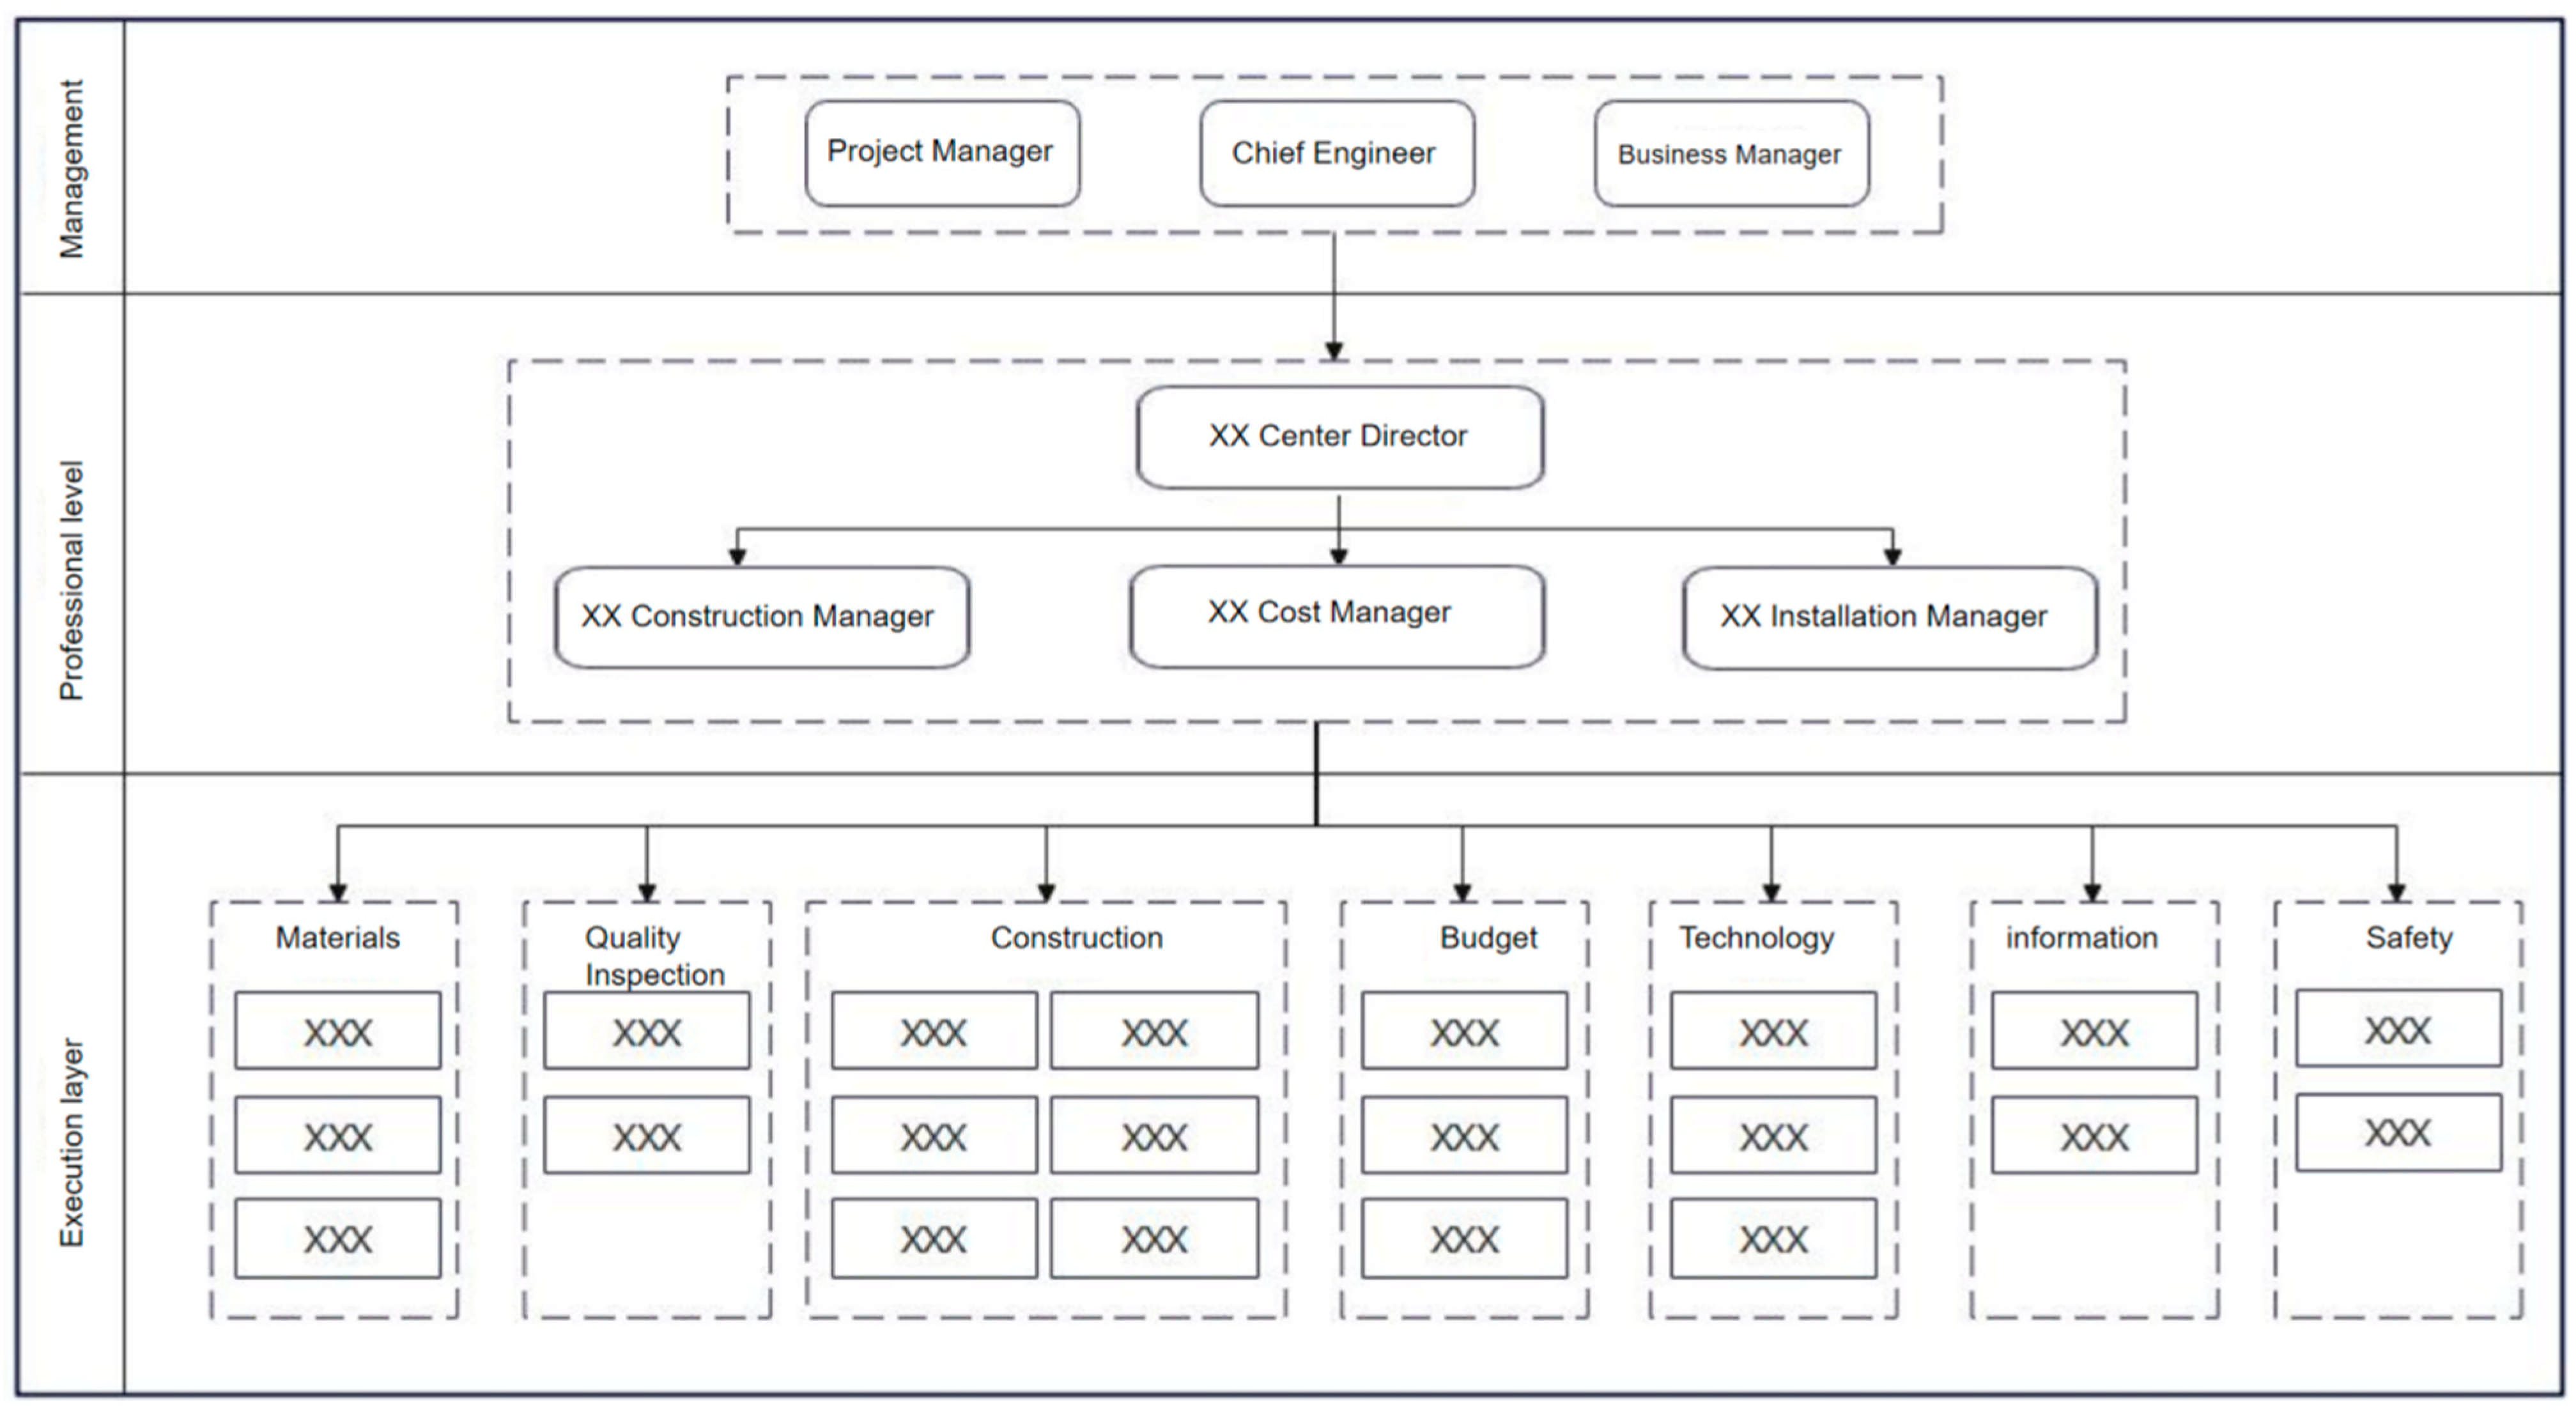
4.2.1. BIM Application Organization System

A three-tiered application structure consisting of executive, professional, and management tiers was established to meet the BIM needs of the client. To improve project management, the professional tier formed teams consisting of cost, installation, and civil teams, and incorporated material, budget, safety, construction, quality control, data, and technical teams into the executive tier, connecting them to the professional tier to ensure that each team’s responsibilities and authority were clearly defined. The organizational structure is shown in Figure 6. The software and hardware configuration of this project is shown in Table 19.

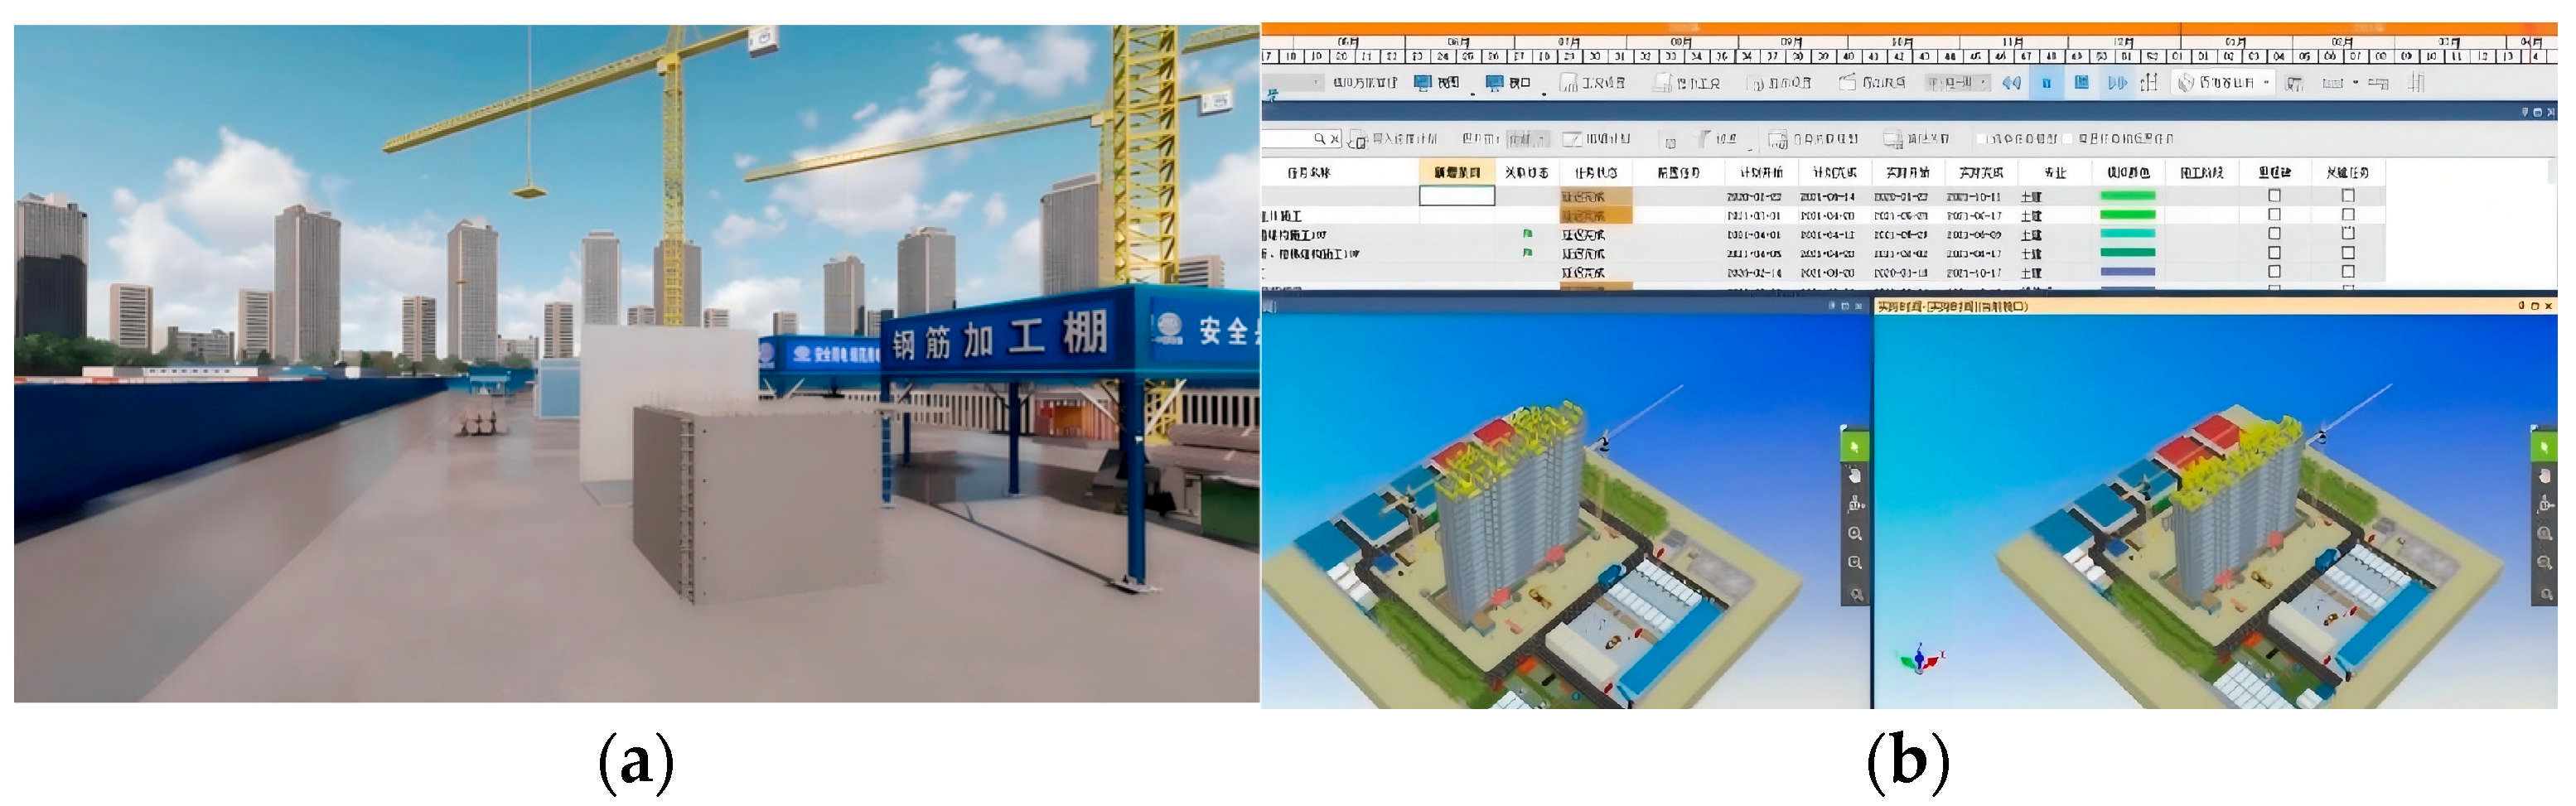
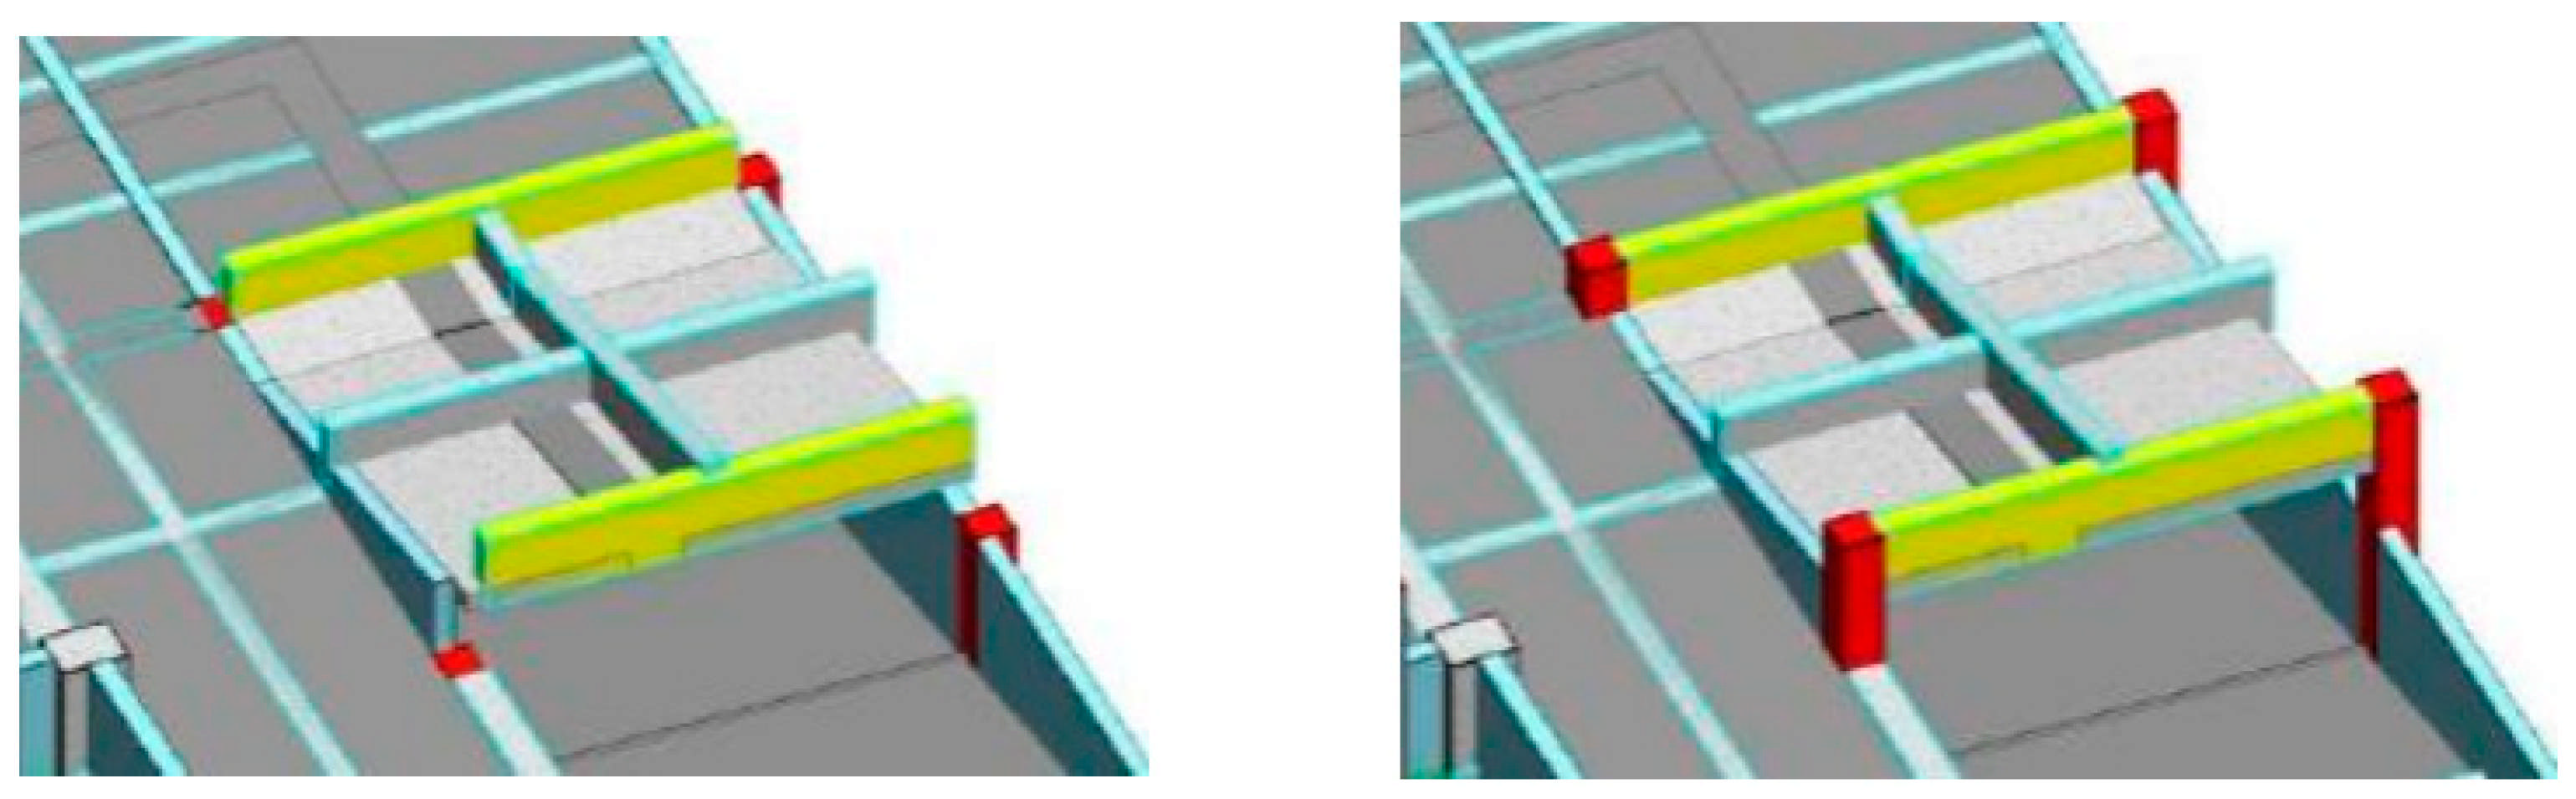
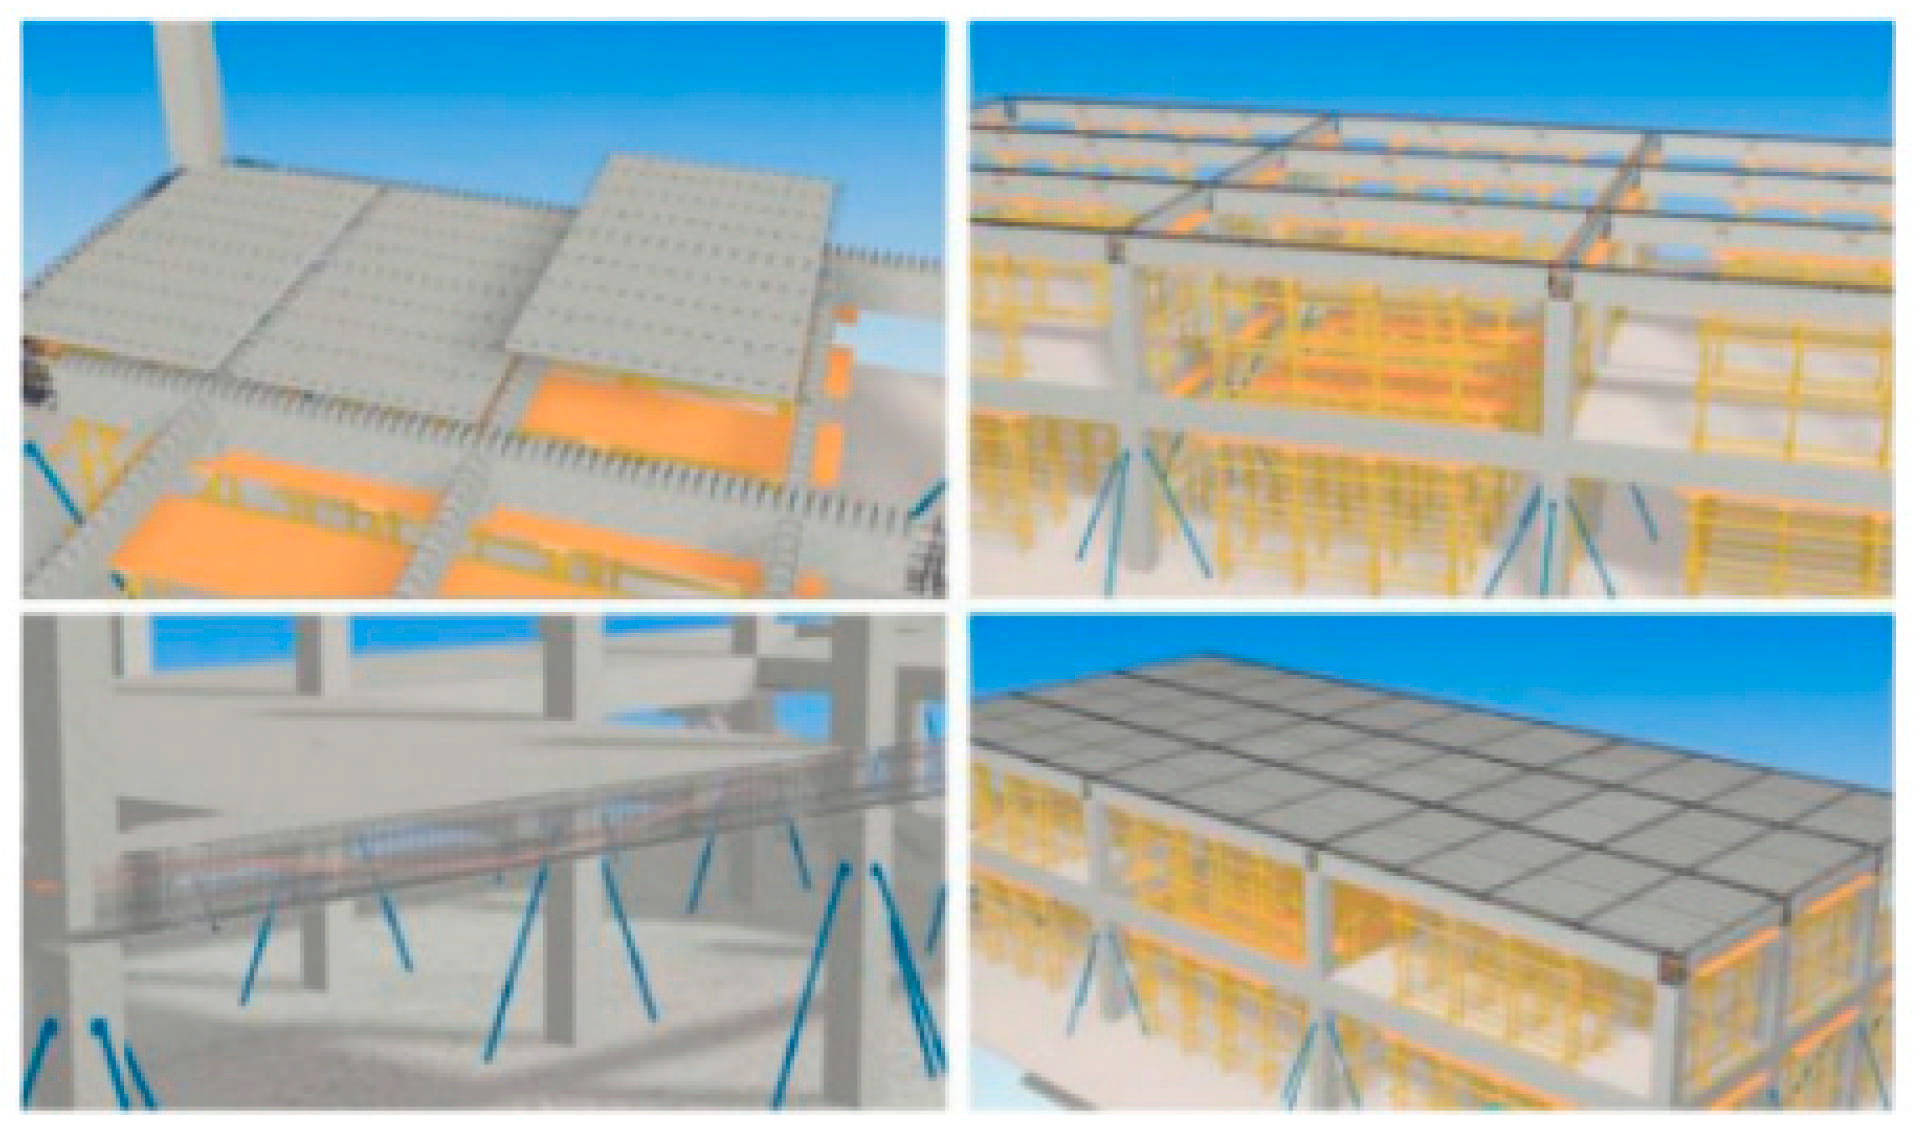
4.2.2. Application of BIM in Assembly Construction Management Process

In the project management, the core elements of progress, safety, quality, and cost aspects of the development for the management of timely detection of problems in a timely manner to correct and provide the basis for decision-making, based on the traditional management, we increase the timeliness and intuition of the wisdom of data processing.
(i) Progress management: first of all, the project manager should lead the team, establish the goal of progress control, and let the project director exhaustively formulate the project construction plan, as well as the realization of each key step of the program. At the same time, the project manager should conduct an in-depth analysis of technology, quality, cost, and other aspects of the problem, and give effective guidance so that the professional team can be in accordance with the requirements of the plan through the simulation of construction, optimization of the human resources and materials configuration plan, to process arrangements, etc. This is shown in Figure 7a.
Through the use of BIM models for a comprehensive simulation of the construction progress, as well as a comparison with the planned progress, we conduct an in-depth analysis of the root causes of progress lag, and take targeted control measures to ensure that the progress is completed in accordance with the contract. This is shown in Figure 7b.
(ii) Collision checking and deepening of drawings: BIM distinguishes itself from the major changes in traditional construction, bringing unprecedented changes to the construction of assembly buildings. The advantage is being able to effectively solve the challenges of engineering details, and to provide strong support for the construction of assembly buildings according to the characteristics of the complexity of the building structure, and a variety of specialized pipelines and other technical requirements, which will lead to a great improvement in the quality of construction (as shown in Figure 8). In addition, BIM addresses drawing design flaws, enabling designers to review models to ensure accuracy and to effectively reduce unnecessary changes and rework. Through analysis and evaluation, design flaws were identified, and piping system models were used to improve piping layouts for different disciplines to reduce conflicts and improve layout efficiency (as shown in Figure 9).
(iii) Quantity statistics: before starting the modeling, the current national measurement standards are imported into the BIM software Glodon BIM 5D 3.5, and the model can automatically generate the information related to the quantity according to the standards. Using BIM 5D of Quanta to quickly and accurately count the quantities of components can not only improve the efficiency of project costing personnel, but also better ensure the quality of the project.
(iv) Quality management: we use BIM5D to track problems to understand the quality problems and forms, determine the priority of each link through systematic quality analysis, and take effective measures to solve the quality problems; at the same time, we strengthen the actual measurement to ensure that the construction accuracy is not affected, and focus on the details to carry out the technical delivery and the deepening of the drawings.
(v) Cost management: through BIM, this can help the project manager to better understand the status of the project and can automatically generate lists and plans for each stage based on information such as expectations, models, and lists.
(vi) Visualization and safety protection: using the BIM 3D visualization function (as shown in Figure 10) for program exchange greatly improves the efficiency of design, supervision, and construction participants; the protection of construction site adjacent holes (as shown in Figure 11) is related to the safety of personnel, but it is always omitted. The project management personnel carry out on-site risk source investigation in advance through the BIM model, and at the same time use the constructed 3D model to provide visual operation for the safety technical briefing.
We upload project information to the cloud using the BIM5D platform. We ensure that project data, such as drawings, technical safety documents, meeting minutes, etc., can be stored for a long period of time for easy access at any time. This also structures and organizes them so as to improve the project’s data management capability, ensure data integrity, and improve the project’s efficiency and level.

4.3. Multilevel Fuzzy Comprehensive Evaluation Based on BIM Application Capability Evaluation System

(i) Determine the affiliation matrix of each index.
In the comprehensive evaluation of BIM application in prefabricated buildings, this paper corresponds the evaluation set to different levels of the maturity model; VT = (V5 V4 V3 V2 V1) indicates the continuous optimization level to the initial level and assigns the value of VT = (5 4 3 2 1). To ensure the validity, three staff members involved in the BIM work of the project are invited, and to ensure the objectivity of the scoring, two experts with rich experience in BIM work are invited to score and evaluate, and the questionnaire is filled in through in-depth exchanges with the relevant staff members and the collection of on-site information to evaluate the performance of the application of various indicators of the BIM of the project and normalize the results. As shown in Table 20.
(ii) Evaluation calculation.
(1) Determine the one-factor fuzzy matrix from U to V Ri = Xi(Xi1, Xi2, Xi3, Xi4, Xi5) (according to Equations (4)–(6)).
R 1 = 0 0 0.2 0.8 0 0 0 0.6 0.4 0
R 2 = 0 0 0.2 0.8 0 0 0 0.8 0.2 0 0 0.2 0.6 0.2 0
R 31 = 0 0.2 0.8 0 0 0 0.4 0.6 0 0 0 0.2 0.4 0.4 0
R 32 = 0 0 1 0 0 0 0 0.8 0.2 0 0 0 0.6 0.4 0 0 0.2 0.8 0 0 0 0 0.4 0.6 0
R 33 = 0 0 0.2 0.8 0 0 0.2 0.6 0.2 0 0 0.2 0.8 0 0 0 0.8 0.2 0 0 0 0.6 0.2 0.2 0 0 0 1 0 0 0.2 0.4 0.4 0 0 0 0.6 0.4 0 0 0 0.2 0.4 0.4 0
R 34 = 0.2 0.2 0.6 0 0 0 0.8 0.2 0 0 0 0.4 0.6 0 0 0 0.4 0.6 0 0
R 4 = 0 0 0.2 0.4 0.4 0 0 1 0 0 0 0 0.4 0.4 0.2 0 0.4 0.4 0.2 0 0 0 0.6 0.4 0
Based on the above fuzzy matrix combined with Equation (8), the combined judgment vector of each factor is calculated as follows: Si
       S 1 = W 1 · R 1 = 0.6115 0.3885 T · 0 0 0.2 0.8 0 0 0 0.6 0.4 0 = 0 0 0.3554 0.6446 0        S 2 = W 2 · R 2 = 0.3910 0.3629 0.2461 T · 0 0 0.6 0.4 0 0 0 0.8 0.2 0 0 0.2 0.6 0.2 0 = 0 0.0492 0.6726 0.2782 0        S 31 = W 31 · R 31 = 0.4563 0.3446 0.1990 T · 0 0.2 0.8 0 0 0 0.4 0.6 0 0 0 0.2 0.4 0.4 0 = 0 0.2689 0.6514 0.0796 0
Available in order as follows:
S 32 = 0 0.0207 0.7599 0.1830 0
S 33 = 0.0107 0.3558 0.4205 0.2123 0
S 34 = 0.0721 0.4130 0.5210 0 0
The judgment vectors S3i are merged and collapsed to obtain S3:
S 3 = 0.0078 0.2148 0.6426 0.1346 0
S 4 = 0 0.0312 0.5645 0.2442 0.1596
(2) Determine the multifactor judgment matrix R and judgment vector set S.
According to Equation (8), the multifactor judgment vector set of assembly building BIM application maturity can be obtained as follows:
S = W · R   = 0.2072 0.2378 0.2708 0.2842 T · 0 0 0.3554 0.6446 0 0 0.0492 0.6726 0.2782 0 0.0078 0.2148 0.6426 0.1346 0 0 0.0312 0.5645 0.2442 0.1596 = 0.0021 0.0787 0.5680 0.3055 0.0453
(iii) Evaluation results of BIM application maturity for assembly buildings.
According to Equation (9), single-factor and multifactor judgment results are calculated, respectively.
(1) Single-factor judgment results:
F 1 = S 1 · V T = 0 0 0.3554 0.6446 0 · 1 2 3 4 5 = 3.6446
The same reasoning can be used to find the evaluation scores for the different segments of the guideline layer as follows:
F 2 = S 2 · V T = 0 0.0492 0.6726 0.2782 0 · 1 2 3 4 5 = 3.229
F 3 = S 3 · V T = 0.0078 0.2148 0.6426 0.1346 0 · 1 2 3 4 5 = 2.9036
F 4 = S 4 · V T = 0 0.0312 0.5645 0.2442 0.1596 · 1 2 3 4 5 = 3.5307
(2) Multifactorial judgmental outcomes:
F = S · V T = 0.0021 0.0787 0.5680 0.3055 0.0453 · 1 2 3 4 5 = 3.312
According to the calculation results, the project’s BIM application maturity evaluation is 3.312.

4.4. Results and Analysis

From the above results of the BIM application maturity evaluation of the project, it can be seen that the overall maturity level of the project reaches 3.312, which is in the middle level of Starting Level and Management Level, indicating that the BIM application of the project has basically achieved the expected results and can effectively control the operation of the whole project.
The evaluation score of the Financial Dimension is 3.6446, indicating that the maturity level of the Financial Dimension of the project is at the Management Level, and the project can be effectively controlled in terms of cost and schedule.
The evaluation score of Dimensions of Stakeholders in Engineering Projects is 3.229, indicating that Dimensions of Stakeholders in Engineering Projects are satisfied with the results of BIM implementation in the project.
The Internal Business Process Dimension BIM application maturity score is 2.9036, and its maturity level is at the starting level close to the Management Level, which indicates that BIM only plays a partial role in enhancing the implementation of the project, but does not play a full role in value, and needs to be further strengthened and improved in the assembly construction.
The Learning and Growth Dimension is at the Management Level in this project, and the BIM working mode and environment, BIM application platform, BIM personnel, and capabilities have not reached the optimal level, which makes it difficult to carry out BIM application. The BIM capability of the project personnel is not high, the number of personnel is small, and the project lacks a complete and unified BIM collaboration platform to meet the application requirements.
Through the analysis of the evaluation results, it is basically in line with the actual case of the project, which verifies the validity and reliability of this paper’s evaluation model of the BIM application capacity of prefabricated buildings.
The evaluation results indicate that while the project demonstrates foundational BIM maturity, strategic improvements are needed to advance toward higher integration and optimization levels. Key focus areas include enhancing internal process integration, strengthening human capital development, optimizing collaborative platforms, and deepening stakeholder engagement.
(1) Internal Process Integration.
The transitional status of the Internal Business Process Dimension (2.9036) highlights insufficient BIM utilization in critical workflows such as design coordination, component scheduling, and clash detection. To address this, the project should institutionalize BIM-driven workflows across all lifecycle phases. For instance, integrating 4D/5D BIM for real-time progress tracking and cost management, coupled with automated clash detection algorithms, would minimize post-construction rework. Additionally, establishing a standardized BIM execution plan (BEP) aligned with prefabrication workflows—such as modular design validation and RFID-enabled component tracking—can bridge gaps between design intent and on-site assembly.
(2) Human Capital and Training.
Despite reaching the Management Level in Learning and Growth (3.5307), gaps persist in BIM competency and staffing. A targeted upskilling program should be implemented, focusing on advanced BIM tools (e.g., Dynamo for parametric design) and prefabrication-specific applications (e.g., MEP coordination in modular units). Partnering with academic institutions for certification programs and incentivizing cross-disciplinary collaboration (e.g., joint workshops between designers and fabricators) will foster a culture of continuous learning.
(3) Collaborative Platform Optimization.
The lack of a unified BIM collaboration platform hinders data interoperability. Adopting cloud-based Common Data Environments (CDEs) like Autodesk BIM 360 or Trimble Connect, integrated with IoT sensors for real-time component status updates, would streamline stakeholder communication. Embedding blockchain technology for secure data sharing and version control could further enhance transparency in multi-party workflows.
(4) Stakeholder Engagement and Value Demonstration
While stakeholder satisfaction is moderate (3.229), clearer ROI communication is essential. Regular BIM-driven visual reports—such as energy performance simulations for users or prefabrication cost-benefit analyses for owners—should be institutionalized. Implementing a BIM-based digital twin for post-occupancy facility management would reinforce long-term value to end-users and operators.
(5) Standardization and Governance.
Develop prefabrication-specific BIM standards, including Level of Development (LOD) requirements for manufacturing tolerances and assembly sequences. Establishing a centralized BIM governance committee to oversee compliance, data quality, and innovation adoption (e.g., AI-driven error detection) will ensure sustained maturity growth.
By prioritizing these strategies, the project is expected to move toward a more integrated, lifecycle-oriented BIM implementation, gradually aligning with global best practices for industrialized construction.

5. Improvement Path and Promotion Suggestion of BIM Application Capability for Prefabricated Buildings

5.1. Improvement Process of BIM Application Capability Maturity for Prefabricated Buildings

Evaluation is the means and improvement is the end. The formulation of the BIM application improvement process to enhance the BIM maturity to play its value.
The cycle of “Evaluation → Improvement → Implementation → Feedback” is repeated continuously to realize the continuous improvement of BIM application maturity in a real sense. Through scientific methodology and problem-oriented thinking, various problems of BIM application are systematically divided and integrated, and the characteristics of the problems are studied in depth so that effective solutions are put forward to improve the efficiency of BIM in assembly buildings. It mainly includes the construction of a BIM application environment, strengthening the localization of an enterprise BIM platform, the depth of “BIM+” technology application, and actively organizing training and communication, as shown in Figure 12.

5.2. Implementation Path for BIM Application Capability Maturity Improvement for Prefabricated Buildings

5.2.1. BIM Application Environment Construction

BIM is more and more widely used in the field of assembly construction, combining multiple professional technologies to form a complex and diversified system, which enables the participants to communicate and coordinate effectively among multiple fields so as to achieve the optimal effect of assembly construction. In the process of assembly implementation, BIM application is in the transition stage of technology alternation, and the application in project management is also changing, which is a comprehensive method combining project management, technical software, and multidisciplinary professional knowledge. Therefore, before starting to use BIM, it is necessary to establish a good application environment in order to better realize the application of BIM in the project [34]. The process of establishing a BIM application environment includes determining project management objectives, developing implementation plans, establishing standards, and developing systems, which are interrelated and interact with each other to realize BIM application.
(1) Assembly project management BIM application goals.
Adopt BIM assembly project management to effectively guide project implementation, and to act as an important indicator to measure the effectiveness of the application of BIM maturity in order to improve the project BIM maturity and efficiency. This includes the following: (1) adopting integrated management, organically integrating the data of financing, design, preparation and other preliminary steps into the later settlement, operation and maintenance, and constructing a perfect system to effectively improve the overall efficiency of the project; (2) establishing an information-sharing platform to better promote the effective dissemination of information, so that the owner, the group company, the engineers, the project company, the subcontractors, the design unit, the suppliers, the project users, and the government departments can have a more smooth and efficient relationship with each other; (3) adopt real-time monitoring technology to provide timely and accurate management decision support and effectively control project cost, completion time, and quality; (4) introduce cutting-edge IT technologies such as cloud computing, big data, mobile communication, intelligence, and Internet of Things to establish a comprehensive industry supervision and service platform, improve project efficiency and quality, and maximize IT innovation.
(2) BIM application implementation plan for assembly projects.
The BIM application implementation plan is designed to provide guidance for assembly projects to ensure that all project participants can effectively achieve their application goals. The plan includes project organization structure, BIM application platform, implementation plan, planning of each phase, implementation process, and responsibilities of participants, etc. It aims to help project participants better achieve their application goals and provide effective support for project management.
(3) BIM application standards for assembly projects.
BIM application standards for assembly projects are the guidelines for the BIM implementation process and play an important role in assembly projects, which provide complete standards covering the establishment of 3D modeling platforms, completion of application deliverables, and collaborative entity platform applications. These standards are designed to ensure that BIM is effectively operated throughout the project and can provide uniform, standardized results that lead to model diversity and platform standardization.
(4) BIM application system for assembly projects.
A BIM application system is designed to standardize the rights and obligations of all project participants so that BIM can be better utilized to replace traditional workflows and better meet client needs. In addition, the system should clearly indicate how BIM can be used to improve the efficiency and quality of the assembly project, and how it can be applied to the entire project life cycle.
The whole process of using BIM has a clear division of responsibilities; in order to ensure the effective use of BIM, it must be applied to every position and staff’s responsibility, including information collection, organization, analysis, sharing, feedback, etc.; in addition, in order to ensure the correct use of BIM in assembly project management, it is also necessary to set up a perfect BIM application system, so as to effectively supervise and manage the various application paths and processes, and to realize the BIM application information. management, and realize the final presentation of BIM application information collection, processing, transmission, storage, and query.

5.2.2. Promote the Localization of BIM Platform for Construction Enterprises

The enterprise BIM application platform is the foundation for the implementation of BIM application. If construction enterprises want to use BIM more conveniently, then the localization of the BIM platform is particularly important. By combining the local construction environment and the actual situation of the enterprise, it creates a construction information management platform that meets the characteristics of China. To promote the localization of the BIM platform, companies should invest heavily in resources, redesign hardware and software, adjust workflow, cultivate the spirit of cooperation, collect practical experience in projects, integrate data, establish effective communication and feedback mechanisms, and strictly implement security certification procedures. To truly localize the BIM platform, it is necessary to make full use of information technology resources, apply BIM to projects, meet the company’s business development needs and implement various business construction processes. Each software manufacturer’s BIM platform has different advantages; providing software and similar consulting services. When choosing the relevant BIM platform, the company should pay attention to comparison to avoid being bound by the software provider.

5.2.3. Strengthen the Depth of “BIM+” Application

BIM is utilized in prefabricated buildings to realize multichannel collaborative management and effectively improve the level of assembled building construction. In the construction industry, BIM has long since ceased to be a single application and has developed into an integrated application. In order to keep pace with the times, realize “BIM+” application depth exploration and BIM depth development, we must implement a variety of effective control measures, committed to improving the quality management level of prefabricated buildings, and promote its innovative mode of operation, so as to promote its sustainable development.

5.2.4. Strengthen the Organization and Exchange of Information Interoperability

BIM plays an important role in promoting and exchanging the opinions and information of each participant at different stages of assembly project construction. The first factor in improving project construction quality and reducing project construction time and cost is people.
At present, the lack of compound talents with many years of practical experience and professional skills in BIM makes the development of BIM in China seriously constrained and affects its development process. In addition, the relevant companies and departments should actively play the subjective initiative, learn the relevant experience of countries and regions with mature BIM development, improve the ability of employees to use BIM by integrating the experience of domestic and foreign BIM experts, and help the relevant departments to better master BIM. In addition, it can also be used to promote the upgrading of the manufacturing industry by clarifying the method of using BIM, improving the performance of computer software, employee training, and other cost incentives, as well as to promote the development of BIM in China and other cost incentives, and to fully mobilize motivation to promote the popularization and use of BIM in the future.

6. Conclusions

In today’s construction industry towards industrialization and intelligent transformation, assembly building has gradually become the development trend in the construction field with its many advantages such as high efficiency and environmental protection. The application of BIM technology in prefabricated buildings has brought significant benefits in terms of improving project management efficiency and optimizing design and construction processes. However, how to accurately assess the maturity of BIM application capabilities in assembly buildings and identify potential capability gaps has become an important issue for the industry.
In this context, an integrated model based on AHP—Entropy Weighting and Multilevel Fuzzy Comprehensive Evaluation has emerged. The proposed BIM application maturity model distinguishes itself through three key innovations. First, it introduces a hybrid weighting methodology that combines Analytic Hierarchy Process (AHP) for expert-driven subjective weights with entropy weighting for objective data calibration, addressing the overreliance on subjective judgment in traditional models like CMM or fuzzy AHP. Second, the model integrates full lifecycle stages (planning, design, production, construction, and operations) with the Balanced Scorecard dimensions (stakeholders, finance, processes, learning/growth), enabling a multidimensional evaluation that captures both technical and managerial maturity. Third, it embeds a dynamic assessment framework tailored to prefabricated construction workflows, such as real-time tolerance adjustments for robotic assembly and RFID-enabled logistics tracking, which are absent in static models. Unlike existing studies that focus on generic BIM capabilities, this model emphasizes prefabrication-specific metrics (e.g., BIM-based component scheduling, 3D lifting simulations) and validates its practicality through a large-scale case study (314,541 m2 project), bridging the gap between theoretical frameworks and industry implementation.
With this integrated model, gaps in BIM application capabilities in prefabricated buildings can be identified in depth and quantitatively. By carefully analyzing the factors affecting the BIM application capability, from the perspective of personnel quality, technology application level, management process, and other dimensions, it clearly defines the gap between the existing BIM application capability and the ideal maturity level with quantitative indexes and scientific calculations, which provides a powerful basis for enterprises and relevant departments to formulate targeted enhancement strategies.
However, there are some limitations in the application cases of the model. The cases in the current study are all limited to the Chinese scenario, where the construction industry environment, policies and regulations, technical standards, and other factors are unique and different from other countries and regions. This means that the adaptability of the model in different countries and regions has not been fully verified, and its universality is questioned. Therefore, for the model to be widely used globally, it must be validated and improved in different cultural, economic, and policy contexts.
In future research, to enhance the adaptability and practicality of the maturity evaluation model, a dynamic indicator framework will be established, maintaining core metrics (e.g., cost control, stakeholder collaboration) as stable benchmarks while dynamically adjusting weights for secondary metrics (e.g., plan-actual alignment, IoT integration) based on project phases (e.g., design vs. assembly) and technological advancements (e.g., AI-driven prefabrication). Empirical validation will be conducted through expanded case studies across diverse project types (e.g., high-rise urban complexes vs. low-rise rural modular housing) to test newly proposed indicators, with machine learning algorithms applied to refine adaptive weighting mechanisms. Concurrently, industry collaboration will be prioritized by partnering with prefabrication manufacturers and BIM software developers to identify emerging metrics linked to automated workflows (e.g., robotic assembly compatibility) and digital twin integration, ensuring the model evolves in tandem with cutting-edge industrial practices.

Supplementary Materials

The following supporting information can be downloaded at: https://www.mdpi.com/article/10.3390/buildings15081322/s1. Questionnaire on the Weight of Evaluation Index System for Prefabricated Building BIM Application.

Author Contributions

Conceptualization, Z.C. and P.C.; methodology, Z.C.; software, D.H.; validation, Z.C., P.C. and D.H.; formal analysis, J.W.; investigation, Z.C.; resources, Z.C.; data curation, Z.C.; writing—original draft preparation, Z.C.; writing—review and editing, D.H.; visualization, J.W.; supervision, D.H.; project administration, P.C.; funding acquisition, Z.C. All authors have read and agreed to the published version of the manuscript.

Funding

This research received no external funding.

Data Availability Statement

The data presented in this study are available upon request from the corresponding author. The data are not publicly available due to privacy.

Conflicts of Interest

The authors declare no conflicts of interest.

References

  1. Moon, S.; Zekavat, P.R.; Bernold, L.E.; Leviakangas, P. Dynamic control of resource logistics quality to eliminate process waste in rebar placement work. KSCE J. Civ. Eng. 2018, 22, 3697–3706. [Google Scholar] [CrossRef]
  2. Hwang, B.-G.; Ngo, J.; Her, P.W.Y. Integrated Digital Delivery: Implementation status and project performance in the Singapore construction industry. J. Clean. Prod. 2020, 262, 121396. [Google Scholar] [CrossRef]
  3. Ding, Z.; Niu, J.; Liu, S.; Wu, H.; Zuo, J. An approach integrating geographic information system and building information modelling to assess the building health of commercial buildings. J. Clean. Prod. 2020, 257, 120532. [Google Scholar] [CrossRef]
  4. Wang, L.; Li, J.; Cen, W.; Feng, W. Governing sustainable smart cities supported by city information modelling: A bibliometric analysis and systematic review. J. Asian Archit. Build. Eng. 2024, 1–19. [Google Scholar] [CrossRef]
  5. Ji, Y.; Qi, K.; Qi, Y.; Li, H.X.; Lei, Z.; Liu, Y. BIM-based life-cycle environmental assessment of prefabricated buildings. Eng. Constr. Archit. Manag. 2020, 27, 1703–1725. [Google Scholar] [CrossRef]
  6. Paneru, S.; Jahromi, F.F.; Hatami, M.; Roudebush, W.; Jeelani, I. Integration of emergy analysis with building information modeling. Sustainability 2021, 13, 7990. [Google Scholar] [CrossRef]
  7. Succar, B. Building Information Modeling maturity matrix. In Handbook of Research on Building Information Modeling and Construction Informatics: Concepts and Technologies; IGI Global: Hershey, PA, USA, 2010; pp. 65–103. [Google Scholar] [CrossRef]
  8. Lu, Y.; Lu, J.; Wang, S.; Mao, Y.; Zhang, Q. Establishment of an integrated digital delivery (IDD) system under the perspective of new construction industrialization. J. Tsinghua Univ. Sci. Technol. 2024, 64, 214–223. [Google Scholar] [CrossRef]
  9. Atul, P.; Kasun, N. Building Information Modeling (BIM) Partnering Framework for Public Construction Projects. Autom. Constr. 2013, 31, 204–214. [Google Scholar]
  10. Sonmez, R.; Ahmadisheykhsarmast, S.; Güngör, A.A. BIM integrated smart contract for construction project progress payment administration. Autom. Constr. 2022, 139, 104294. [Google Scholar] [CrossRef]
  11. Samer, E.S.; Osama, O. Designing a BIM Energy-onsumption Template to Calculate and Achieve a Net-zero-energy House. Sol. Energy 2021, 216, 315–320. [Google Scholar]
  12. Farrukh, A.; Waleed, A.K. Smart Progress Monitoring Framework for Building Construction Elements Using Videography–MATLAB–BIM Integration. Int. J. Civ. Eng. 2021, 19, 717–732. [Google Scholar]
  13. Lee, M.; Park, G.; Jang, H.; Kim, C. Development of Building CFD Model Design Process Based on BIM. Appl. Sci. 2021, 11, 1252. [Google Scholar] [CrossRef]
  14. Faraj, I.; Alshawi, M.; Aouad, G.; Child, T.; Underwood, J. An Industry Foundation Classes Web-Based Collaborative Construction Computer Environment: WISPER. Autom. Constr. 2000, 10, 79–99. [Google Scholar] [CrossRef]
  15. Arizton. Prefabricated Buildings Market Size & Growth, Market Share Analysis. 2025. Available online: https://www.arizton.com/market-reports/prefabricated-building-market (accessed on 11 April 2025).
  16. Brink, B.; Rutland, C. Take BIM Processes to the Next Level with Digital Twins; Building SMART International: Hertfordshire, UK, 2024; Available online: https://www.buildingsmart.org/take-bim-processes-to-the-next-level-with-digital-twins/ (accessed on 11 April 2025).
  17. Hu, X.; Assaad, R.H. A BIM-enabled digital twin framework for real-time indoor environment monitoring and visualization by integrating autonomous robotics, LiDAR-based 3D mobile map**, IoT sensing, and indoor positioning technologies. J. Build. Eng. 2024, 86, 108901. [Google Scholar] [CrossRef]
  18. GB/T 51301-2018; Ministry of Housing and Urban-Rural Development of China. Standard for Design Delivery of Building Information Modeling. China Architecture & Building Press: Beijing, China, 2018.
  19. Salati, M.; Costa, A.A.; Silvestre, J.D. A Comprehensive Review of Dynamic Life Cycle Assessment for Buildings: Exploring Key Processes and Methodologies. Sustainability 2025, 17, 159. [Google Scholar] [CrossRef]
  20. Rui, S.; Makanae, K.; Fujiu, M.; Morisaki, Y. SWOT-AHP Analysis of BIM Technology Utilization in the Japanese Construction Industry. Buildings 2024, 14, 3549. [Google Scholar] [CrossRef]
  21. Zaia, Y.Y.; Adam, S.M.; Abdulrahman, F.H. Investigating BIM level in Iraqi construction industry. Ain Shams Eng. J. 2023, 14, 101881. [Google Scholar] [CrossRef]
  22. Abanda, F.H.; Tah, J.H.M.; Cheung, F.K.T. BIM in off-site manufacturing for buildings. J. Build. Eng. 2017, 14, 89–102. [Google Scholar] [CrossRef]
  23. Wijaksono, F.A.; Pratami, D.; Bay, A.F. Measurement of Risk Project Maturity Using Organizational Project Management Maturity Model (Opm3): Study Case of Construction Project in Bandung. In Proceedings of the IOP Conference Series: Materials Science and Engineering, Chandigarh, India, 28–30 August 2020; IOP Publishing: Bristol, UK, 2020; Volume 852, p. 012098. [Google Scholar]
  24. Alaghbandrad, A.; April, A.; Forgues, D.; Leonard, M. BIM Maturity Assessment and Certification in Construction Project Team Selection. 2015, Volume 32, pp. 76–87. Available online: https://open.library.ubc.ca/media/stream/pdf/52660/1.0076339/4 (accessed on 11 April 2025).
  25. Succar, B. The Five Components of BIM Performance Measurement. In Proceedings of the CIB World Congress, Salford, UK, 10–13 May 2010. [Google Scholar]
  26. Du, J.; Liu, R.; Issa, R.R. BIM Cloud Score: Benchmarking BIM Performance. J. Constr. Eng. Manag. 2014, 140, 04014054.1–04014054.13. [Google Scholar] [CrossRef]
  27. Tammy, L.; Cuen, M.C. Building Information Modeling and the Interactive Capability Maturity Model. In Proceedings of the Associated Schools of Construction International Proceedings of 44 Annual Conference 2008, Auburn, AL, USA, 2–5 April 2008. [Google Scholar]
  28. Fahrenkrog, S.; Abrams, F.; Haeck, W.; Whelbourn, D. Project Management Institute’s Organizational Project Management Maturity Model (OPM3). In Proceedings of the PMI Global Congress Europe, Baltimore, MD, USA, 18–25 September 2003; pp. 179–186. [Google Scholar]
  29. Gökalp, E.; Martinez, V. Digital transformation maturity assessment: Development of the digital transformation capability maturity model. Int. J. Prod. Res. 2022, 60, 6282–6302. [Google Scholar] [CrossRef]
  30. BIM CMM. United States National Building Information Modeling Standard, Version 1; National Institute of Buiding Sciences: Washington, DC, USA, 2007. [Google Scholar]
  31. Baghestani, A.R.; Ahmadi, F.; Tanha, A.; Meshkat, M. Bayesian critical values for Lawshe’s content validity ratio. Meas. Eval. Couns. Dev. 2019, 52, 69–73. [Google Scholar] [CrossRef]
  32. Lipovetsky, S.; Kulakowski, K. Understanding the Analytic Hierarchy Process; Chapman and Hall/CRC, Taylor & Francis Group: Boca Raton, FL, USA, 2021; 262p, ISBN 978-1-1380-3232-3. [Google Scholar]
  33. Li, Z.; Luo, Z.; Wang, Y.; Fan, G.; Zhang, J. Suitability evaluation system for the shallow geothermal energy implementation in region by Entropy Weight Method and TOPSIS method. Renew. Energy 2022, 184, 564–576. [Google Scholar] [CrossRef]
  34. National Institute of Building Sciences. National Building Information Modeling Standard Version 4.0; National Institute of Building Sciences: Washington, DC, USA, 2023. [Google Scholar]
Figure 1. Maturity levels of BIM application capability in prefabricated buildings.
Buildings 15 01322 g001
Figure 2. Constructing the evaluation index system process of prefabricated building BIM application capability.
Buildings 15 01322 g002
Figure 3. Weight distribution of the evaluation index portfolio.
Buildings 15 01322 g003
Figure 4. Evaluation of BIM application maturity and improvement process for prefabricated buildings.
Buildings 15 01322 g004
Figure 5. Aerial view of the project.
Buildings 15 01322 g005
Figure 6. BIM application organizational structure.
Buildings 15 01322 g006
Figure 7. Construction progress management. (a) Construction progress simulation; (b) comparison of the actual project schedule with the planned project schedule.
Buildings 15 01322 g007
Figure 8. Pipeline synthesis.
Buildings 15 01322 g008
Figure 9. Comparison before and after problem checking.
Buildings 15 01322 g009
Figure 10. 3D visualization.
Buildings 15 01322 g010
Figure 11. Edge security pr.
Buildings 15 01322 g011
Figure 12. Improve the evaluation process.
Buildings 15 01322 g012
Table 1. BIM maturity level classification and description.
Maturity Level ClassificationDescription
(1) Initial LevelAt this level, BIM is only understood as a 3D model by project and business leaders, and there is a lack of recognition of its intrinsic value, neglect of model detailing, inability to effectively process and update information, and a lack of coordination and management of the construction site during project implementation.
(2) Starting LevelManagers and some members of the team have fully recognized the importance of BIM and hired professional BIM consultants to provide regular guidance, and they are actively learning the operation of the platform and software in order to better master the new technology and be able to better apply it to all aspects of construction. However, as it is still in the primary stage, the model information is not yet perfect, so the operation level of the personnel also needs to be improved continuously, and the problems and information appeared in the construction process still need to be controlled after the fact, so as to summarize the experience in a better way and thus improve the construction management.
(3) Management LevelThe project team is constantly improving the model and information and updating it regularly in order to improve the success rate of the project. The BIM management platform is also used to enable effective simulation and analysis of different areas of specialization, helping to better grasp the progress of the project. It also enables the timely processing of various documents generated during the construction process. In order to encourage team members to continue to learn and improve their BIM skills, a series of effective incentive policies have been developed.
(4) Integrated LevelThe project had a good BIM environment, with each specialist doing his or her part by regularly processing and updating data, as well as conducting simulations and evaluations before starting in order to prevent possible risks as early as possible. With a growing understanding of BIM, the participants were also able to clearly define the rights and obligations of the various players in the project.
(5) Optimizing LevelThe project’s team consists of experienced people who are familiar with using BIM to manage the project. They are able to develop efficient management processes based on the characteristics of the project. In addition, the project is able to integrate the model with other IT to achieve precise positioning of the space. Some members of the team also have the ability to develop the model to provide personalized services to the client.
Table 2. Maturity evaluation index system for BIM application capability.
Criterion LayerHierarchical Element LayerIndicator Layer
Financial Dimension B1Project CostProject Cost Control Rate C11
Construction PeriodProject Duration Control Rate C12
Dimensions of Stakeholders in Engineering Projects B2OwnerPremium Brand Engineering C21
Participating PartyAchieve Core Competitiveness C22
UserBuilding Operation Maintenance Rate C23
Internal Business Process Dimension B3Planning and Proposal Stage B31BIM Digital Virtual Combination Technology C311
BIM Virtual Simulation C312
BIM Decision Assist C313
Design Phase B32BIM Model Aided Design C321
BIM Performance Analysis C322
BIM Co-Design C323
BIM Integrated Pipeline Design C324
BIM PC Detailing C325
Component Production, Transportation, and Hoisting Construction Phase B33BIM Component Scheduling Design C331
BIM Component Production Management C332
BIM Component Transport Management C333
BIM Contract Classification Management C334
BIM Takeoff Analysis C335
BIM Construction Progress Simulation C336
BIM Data Aggregation Management C337
BIM Construction Coordination Analysis C338
BIM 3D Lifting Deduction C339
Completion Acceptance Stage B34BIM-Assisted As-Built Acceptance C341
BIM Quantity Settlement C342
BIM System and Engineering Handover C343
BIM Operations and Maintenance Management C344
Learning and Growth Dimension B4BIM Personnel and CapabilitiesBIM Staff Ratio C41
BIM Personnel Competency C42
BIM Application PlatformInvestment Ratio of BIM Application Platform C43
BIM Workflow and EnvironmentBIM Contract Clause Development C44
Project Assessment BIM System Application Degree Ratio C45
Table 3. Evaluation of indicators’ reliability researchers composition.
ConstituteConstruction UnitOwner’s SideDesign Unit
Number411
Table 4. Results of the criterion-level reliability test.
IndexAverage ValueVarianceScore Total VarianceScore Total Variance
Financial Dimension4.00000.63250.40004.5667
Dimensions of Stakeholders in Engineering Projects4.16670.75280.5667
Internal Business Process Dimension 3.83330.75280.5667
Learn and Grow Dimension4.16670.75280.5667
Cronbach’s Alpha: 0.7202
Table 5. The results of the reliability test of the hierarchical element layer.
IndexAverage ValueStandard DeviationVarianceScore Total Variance
Project Cost4.50000.54770.300016.1667
Construction Period4.83330.40820.1667
Owner’s Side4.00000.89440.8000
Participants3.33330.51640.2667
User3.83330.98320.9667
Planning and Programming Phase4.00000.63250.4000
Design Phase3.66670.51640.2667
Component Production, Transportation, and Hoisting Construction Phase4.0000.63250.4000
Completion Acceptance Stage4.00001.09541.2000
BIM Personnel and Capabilities3.50000.54770.3000
BIM Application Platform4.66670.51640.2667
BIM Workflow and Environment4.50000.54770.3000
Cronbach’s Alpha: 0.7108
Table 6. Reliability test results of the indicator layer.
IndexAverage ValueStandard DeviationVarianceScore Total Variance
Project Cost Control Rate 4.83330.40820.166752.2667
Project Duration Control Rate 4.66670.51640.2667
Premium Brand Engineering3.66670.81650.6667
Achieve Core Competitiveness 3.66670.81650.6667
Building Operation Maintenance Rate4.00000.00000.0000
BIM Digital Virtual Combination Technology 4.50000.54770.3000
BIM Virtual Simulation 3.33330.51640.2667
BIM Decision Assist4.00000.63250.4000
BIM Model Aided Design 3.50000.83670.7000
BIM Performance Analysis4.00000.89440.8000
BIM Co-Design 4.50000.83670.7000
BIM Integrated Pipeline Design 4.00000.63250.4000
BIM PC Detailing4.33330.81650.6667
BIM Component Scheduling Design4.00000.63250.4000
BIM Component Production Management 4.00000.89440.8000
BIM Component Transport Management 4.33330.51640.2667
BIM Contract Classification Management 4.33330.81650.6667
BIM Takeoff Analysis4.16670.98320.9667
BIM Construction Progress Simulation4.16670.40820.1667
BIM Data Aggregation Management 3.66670.81650.6667
BIM Construction Coordination Analysis4.50000.54770.3000
BIM 3D Lifting Deduction4.16670.98320.9667
BIM-Assisted As-Built Acceptance 4.16670.75280.5667
BIM Quantity Settlement4.00000.63250.4000
BIM System and Engineering Handover4.33330.81650.6667
BIM Operations and Maintenance Management 4.16670.75280.5667
BIM Staff Ratio 3.83330.75280.5667
BIM Personnel Competency 3.83330.75280.5667
Investment Ratio of BIM Application Platform4.00000.89440.8000
BIM Contract Clause Development 4.00000.63250.4000
Project Assessment BIM System Application Degree Ratio 4.00000.64250.3500
Cronbach’s Alpha: 0.7065
Table 7. Survey questionnaire statistics.
CategoryProfessional and Technical PersonnelBIM ExpertResearch Faculty/AcademicsTotal/Copy
Questionnaires are distributed552520100
Recall the questionnaire49211787
Valid questionnaires49201786
Table 8. The criterion layer index evaluates the weight of A and the consistency test.
AB1B2B3B4
B1121/41/2
B21/211/71/7
B34711/2
B42721
Table 9. Judgment matrix.
Maturity of BIM Application Capabilities for Prefabricated Buildings AFinancial Dimension B1Engineering Project Stakeholder Dimensions B2Internal Business Process Dimensions B3Learning and Growth Dimension B4Wi
Financial dimension B11.00002.00007.00002.00000.4420
Engineering project stakeholder dimensions B20.50001.00007.00004.00000.3659
Internal business process dimensions B30.14290.14291.00000.50000.0575
Learning and Growth Dimension B40.50000.25002.00001.00000.1346
Calculated by Yaahp, λmax = 4.1760; CI = (4.1760 − 4)/(4 − 1) = 0.0586; CR = CI/RI = 0.0586/0.9 = 0.0652 < 0.1; the consistency of this judgment matrix passed. CI stands for Consistency Index, RI stands for Random Consistency Index, and CR stands for Consistency Ratio.
Table 10. Indicator weight and consistency test of all stakeholders of the project.
B2C21C22C23
C21135
C221/314
C231/51/41
Calculated by Yaahp, λmax = 3.0858; CI = (3.0858 − 3)/(3 − 1) = 0.0429; CR = CI/RI = 0.0429/0.58 = 0.0739 < 0.1; the consistency of this judgment matrix passes.
Table 11. Internal business process indicator weighting and consistency checking.
B3B31B32B33B34
B311357
B321/3145
B331/61/414
B341/71/51/41
Calculated by Yaahp, λmax = 4.2518; CI = (4.2518 − 4)/(4 − 1) = 0.839; CR = CI/RI = 0.0839/0.9 = 0.0932 < 0.1; the consistency of this judgment matrix passes.
Table 12. B31 index weight and consistency test.
B31C311C312C313
C311124
C3121/213
C3131/41/31
Calculated by Yaahp, λmax = 3.0183; CI = (3.0183 − 3)/(3 − 1) = 0.0092; CR = CI/RI = 0.0092/0.58 = 0.0159 < 0.1; the consistency of this judgment matrix passes.
Table 13. B32 index weight and consistency test.
B32C321C322C323C324C325
C32113579
C3221/31375
C3231/51155
C3241/71/71/513
C3251/91/51/51/31
Calculated by Yaahp, λmax = 5.3501; CI = (5.3501 − 5)/(5 − 1) = 0.0875; CR = CI/RI = 0.0875/1.12 = 0.0782 < 0.1; the consistency of this judgment matrix passes.
Table 14. B33 index weight and consistency test.
B33C331C332C333C334C335C336C337C338C339
C331122646457
C3321/2111/222135
C3331/211123322
C3341/62111/21444
C3351/41/21/2212253
C3361/61/21/311/21124
C3371/411/31/41/2111/21
C3381/51/31/21/41/51/2212
C3391/71/51/21/41/31/411/21
Calculated by Yaahp, λmax = 9.8927; CI = (9.8927 − 9)/(9 − 1) = 0.1116; CR = CI/RI = 0.1116/1.45 = 0.0770 < 0.1; the consistency of this judgment matrix passes.
Table 15. B34 index weight and consistency test.
B34C341C342C343C344
C3411325
C3421/311/31/2
C3431/2315
C3441/521/51
Calculated by Yaahp, λmax = 4.2472; CI = (4.2472 − 4)/(4 − 1) = 0.0824; CR = CI/RI = 0.0824/0.9 = 0.0915 < 0.1; this judgment matrix consistency passed.
Table 16. Learn and Grow index weight and consistency test.
B4C41C42C43C44C45
C4113577
C421/31597
C431/51/5155
C441/71/91/511
C451/71/71/511
Calculated by Yaahp, λmax = 5.4232; CI = (5.4232 − 5)/(5 − 1) = 0.1058; CR = CI/RI = 0.1058/1.12 = 0.0945 < 0.1; this judgment matrix consistency passed.
Table 17. AHP weights of BIM application maturity indicators for prefabricated buildings.
Indicator LayerAHP Subjective WeightingIndicator LayerAHP Subjective Weighting
Project Cost Control Rate C110.0856BIM Contract Classification Management C3340.0021
Project Duration Control Rate C120.0979BIM Takeoff Analysis C3350.0020
Premium Brand Engineering C210.0887BIM Construction Progress Simulation C3360.0012
Achieve core competitiveness C220.0764BIM Data Collection Management C3370.0009
Building operation maintenance rate C230.1152BIM Construction Coordination Analysis C3380.0008
BIM Digital Virtual Combination Technology C3110.0484BIM 3D Lifting Deduction C3390.0006
BIM Virtual Simulation C3120.0277BIM-Assisted As-Built Acceptance C3410.0036
BIM Decision Assist C3130.0106BIM Quantity Settlement C3420.0012
BIM Model Aided Design C3210.0216BIM system and works handed over to C3430.0022
BIM Performance Analysis C3220.0089BIM Operations and Maintenance Management C3440.0006
BIM Co-Design C3230.0075BIM staff ratio C410.1837
BIM Integrated Pipeline Design C3240.0024BIM Personnel Competency C420.1217
BIM PC Detailing C3250.0015BIM application platform investment is more than C430.0476
BIM Component Scheduling Design C3310.0053BIM Contract Clause Development C440.0146
BIM Component Production Management C3320.0021Project assessment BIM system application degree ratio C450.0153
BIM Component Transport Management C3330.0022
Table 18. The weight of each index of BIM application maturity of prefabricated buildings.
Criterion LayerCriterion Layer WeightsIndicator LayerMetric Layer Weights
Subjective WeightingEntropy WeightPortfolio WeightsSubjective WeightingEntropy WeightPortfolio Weights
B10.19230.19930.2072C110.08560.104460.1267
C120.09790.05270.0818
B20.26920.18750.2378C210.08870.07510.0930
C220.07640.07510.0863
C230.11520.03740.0748
B30.15380.42570.2708C3110.04840.03510.0470
C3120.02770.03510.0355
C3130.01060.03510.0205
C3210.02160.02790.0280
C3220.00890.03600.0204
C3230.00750.05110.0223
C3240.00240.02500.0088
C3250.00150.01400.0052
C3310.00530.01050.0085
C3320.00210.01110.0055
C3330.00220.00570.0040
C3340.00210.03190.0093
C3350.00200.01850.0069
C3360.00120.01880.0054
C3370.00090.00570.0026
C3380.00080.01230.0036
C3390.00060.00760.0024
C3410.00360.01190.0075
C3420.00120.01190.0043
C3430.00220.01190.0058
C3440.00060.01320.0032
B40.38460.18750.2842C410.18370.03000.0846
C420.12170.06110.0982
C430.04760.04870.0548
C440.01460.02530.0219
C450.01530.02250.0211
Table 19. Basic hardware and software configuration.
Job ResponsibilitiesScopeBasic Configuration
Results, documents, and process materials are archived; engineering materials are backed up.ServerCPU: Xeon E3-1230 v5; memory: 8 G; hard disk: 6 T
Modeling deepening output, special plan simulation renderingDesktop computerCPU: Intel i7 7700; memory: DDR4-2400 32 G; graphics card: GTX1060
Model browsing view, program reportMobile computerCPU: Intel Core i7; graphics card: 1024 MB DDR; memory: DDR3 > 8 G; hard drive: >1 TB
Plan presentation, interactive experienceTouchscreenSize: 70 inches; system: Android; RAM: 32 G
Table 20. Normalized indicator scoring results.
Guideline LayerIndicator LayerMaturity Membership Evaluation
Namely LevelInitial LevelStarting LevelManagement LevelOptimization Level
B1C11000.200.800
C12000.600.400
B2C21000.600.400
C22000.800.200
C2300.200.600.200
B3C31100.200.8000
C31200.400.6000
C31300.200.400.400
C32100100
C322000.800.200
C323000.600.400
C32400.200.8000
C325000.400.600
C331000.200.800
C33200.200.600.200
C33300.200.8000
C33400.800.2000
C33500.600.200.200
C33600100
C3370.200.400.4000
C33800.600.4000
C33900.200.400.400
C3410.200.200.6000
C34200.800.2000
C34300.400.6000
C34400.400.6000
B4C41000.2000
C4200100
C43000.400.400.40
C4400.400.400.200
C45000.600.400
Disclaimer/Publisher’s Note: The statements, opinions and data contained in all publications are solely those of the individual author(s) and contributor(s) and not of MDPI and/or the editor(s). MDPI and/or the editor(s) disclaim responsibility for any injury to people or property resulting from any ideas, methods, instructions or products referred to in the content.

