
Analysis of the Vertical Bearing Capacity of Pile Foundations in Backfill Soil Areas Based on Non-Stationary Random Field


Abstract
1. Introduction
2. Non-Stationary Random Field of Undrained Shear Strength in Backfill Soil Area
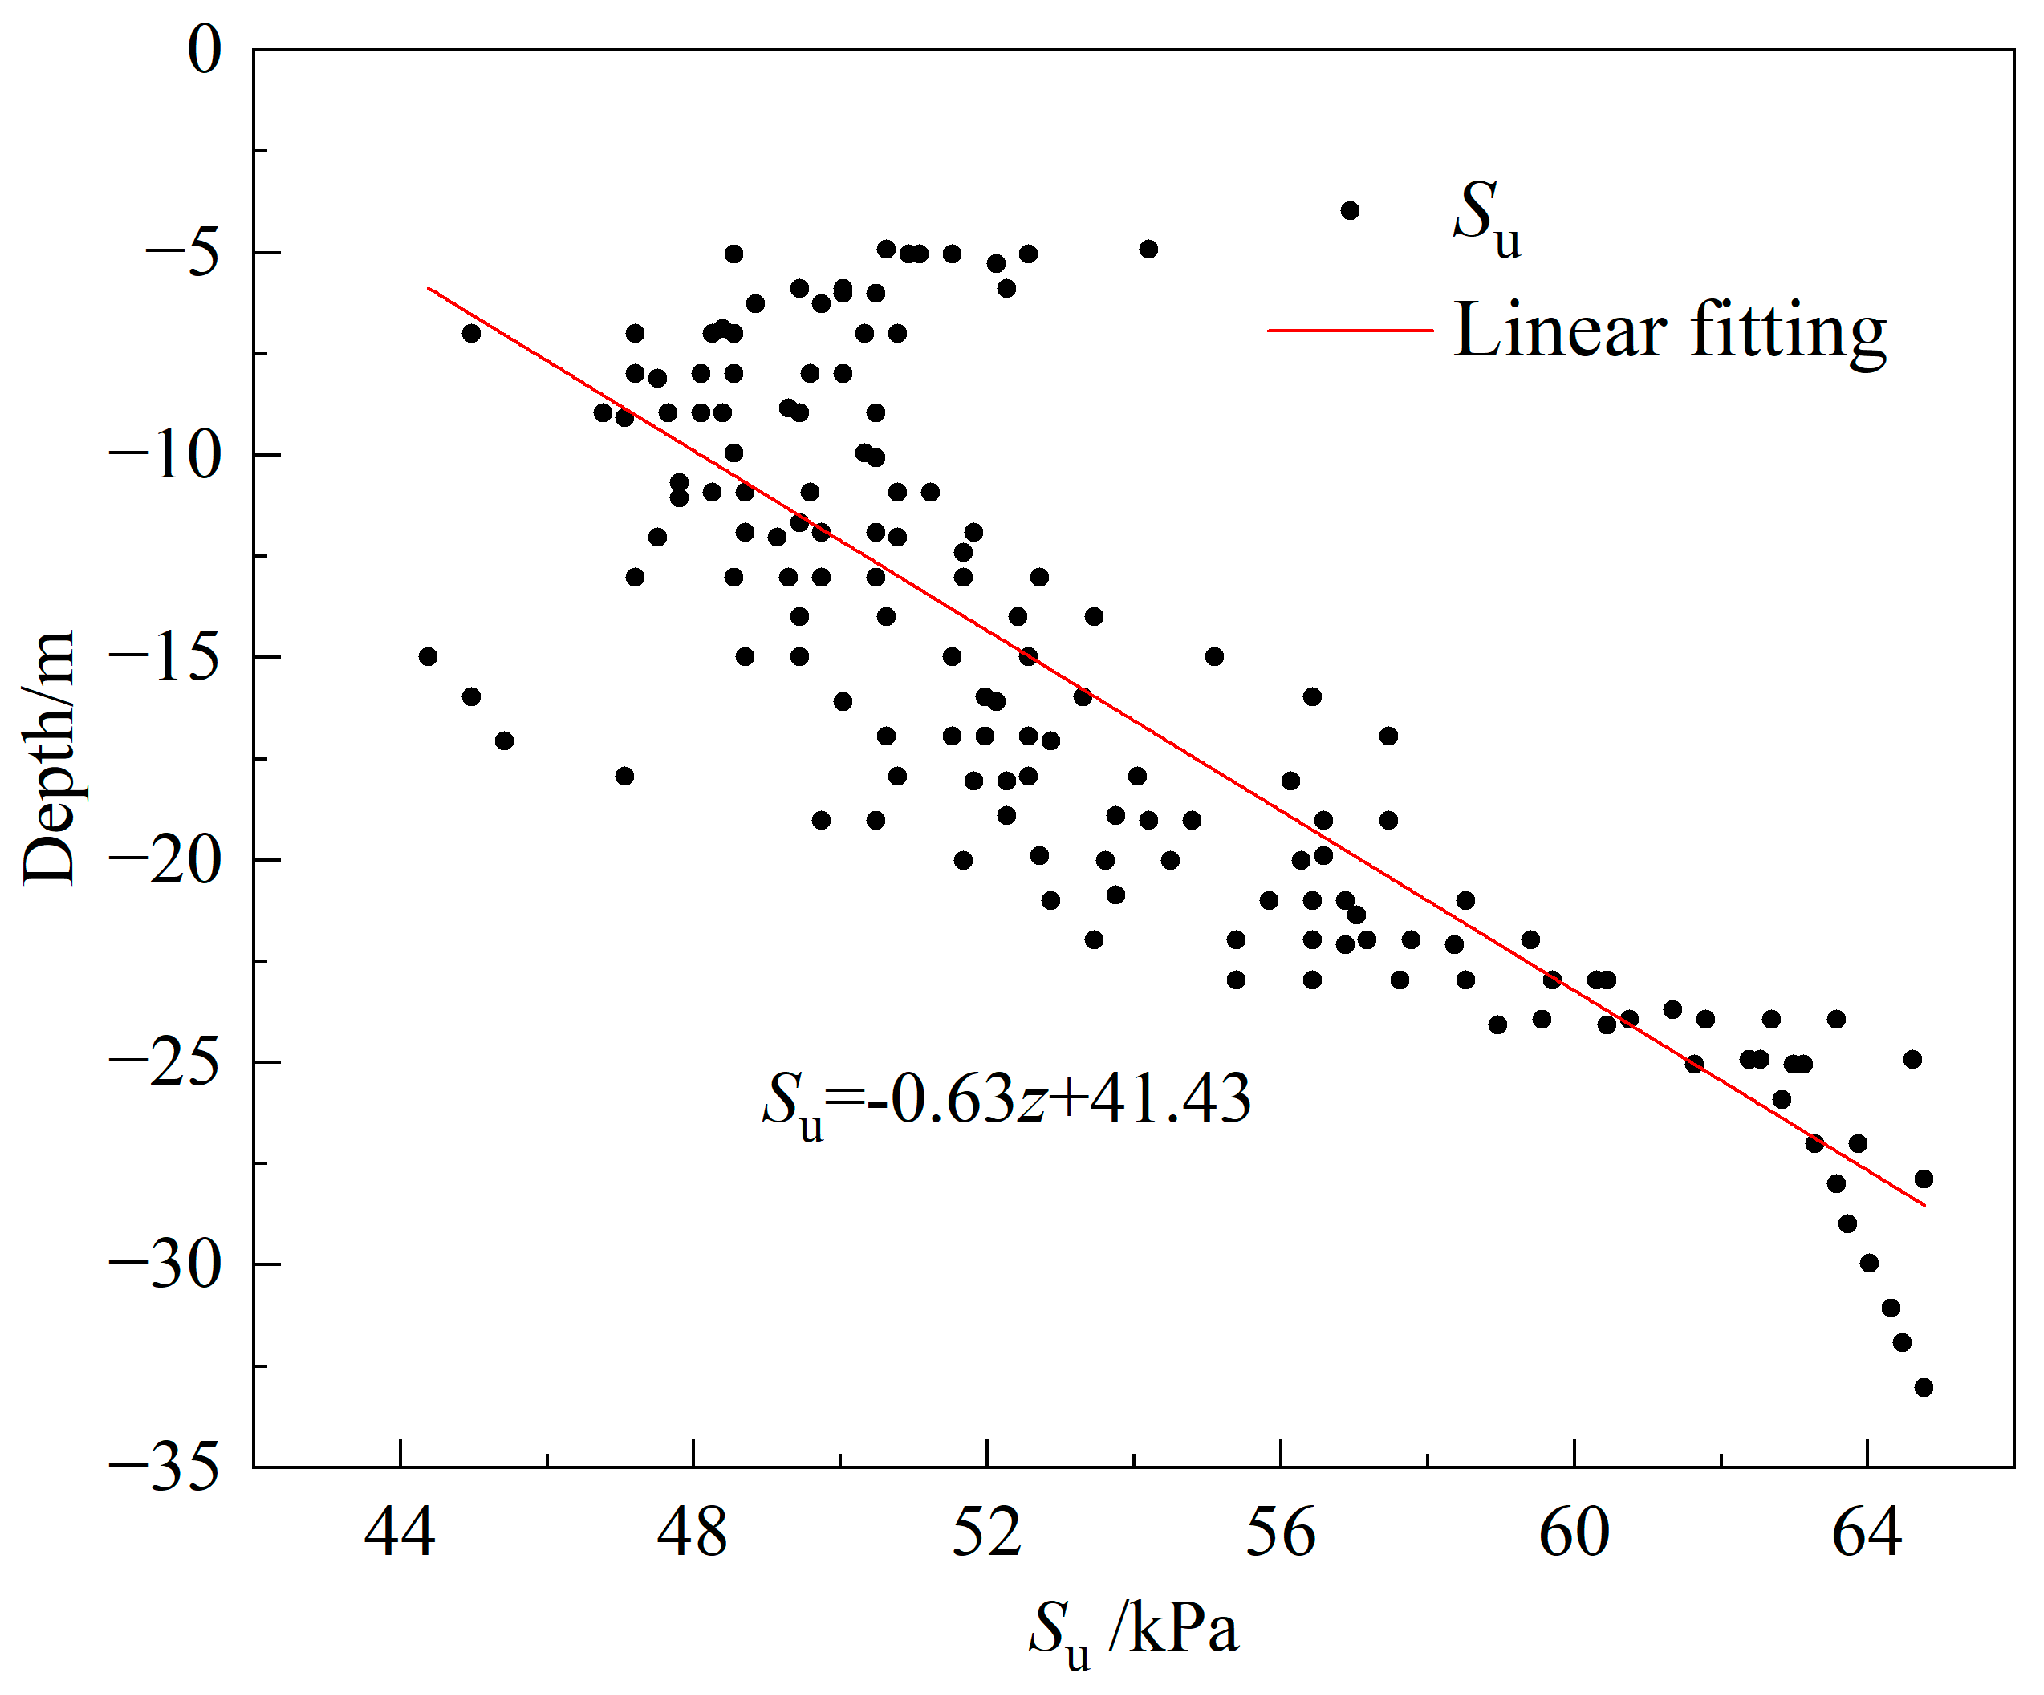
2.1. Spatial Characterization of the Undrained Shear Strength
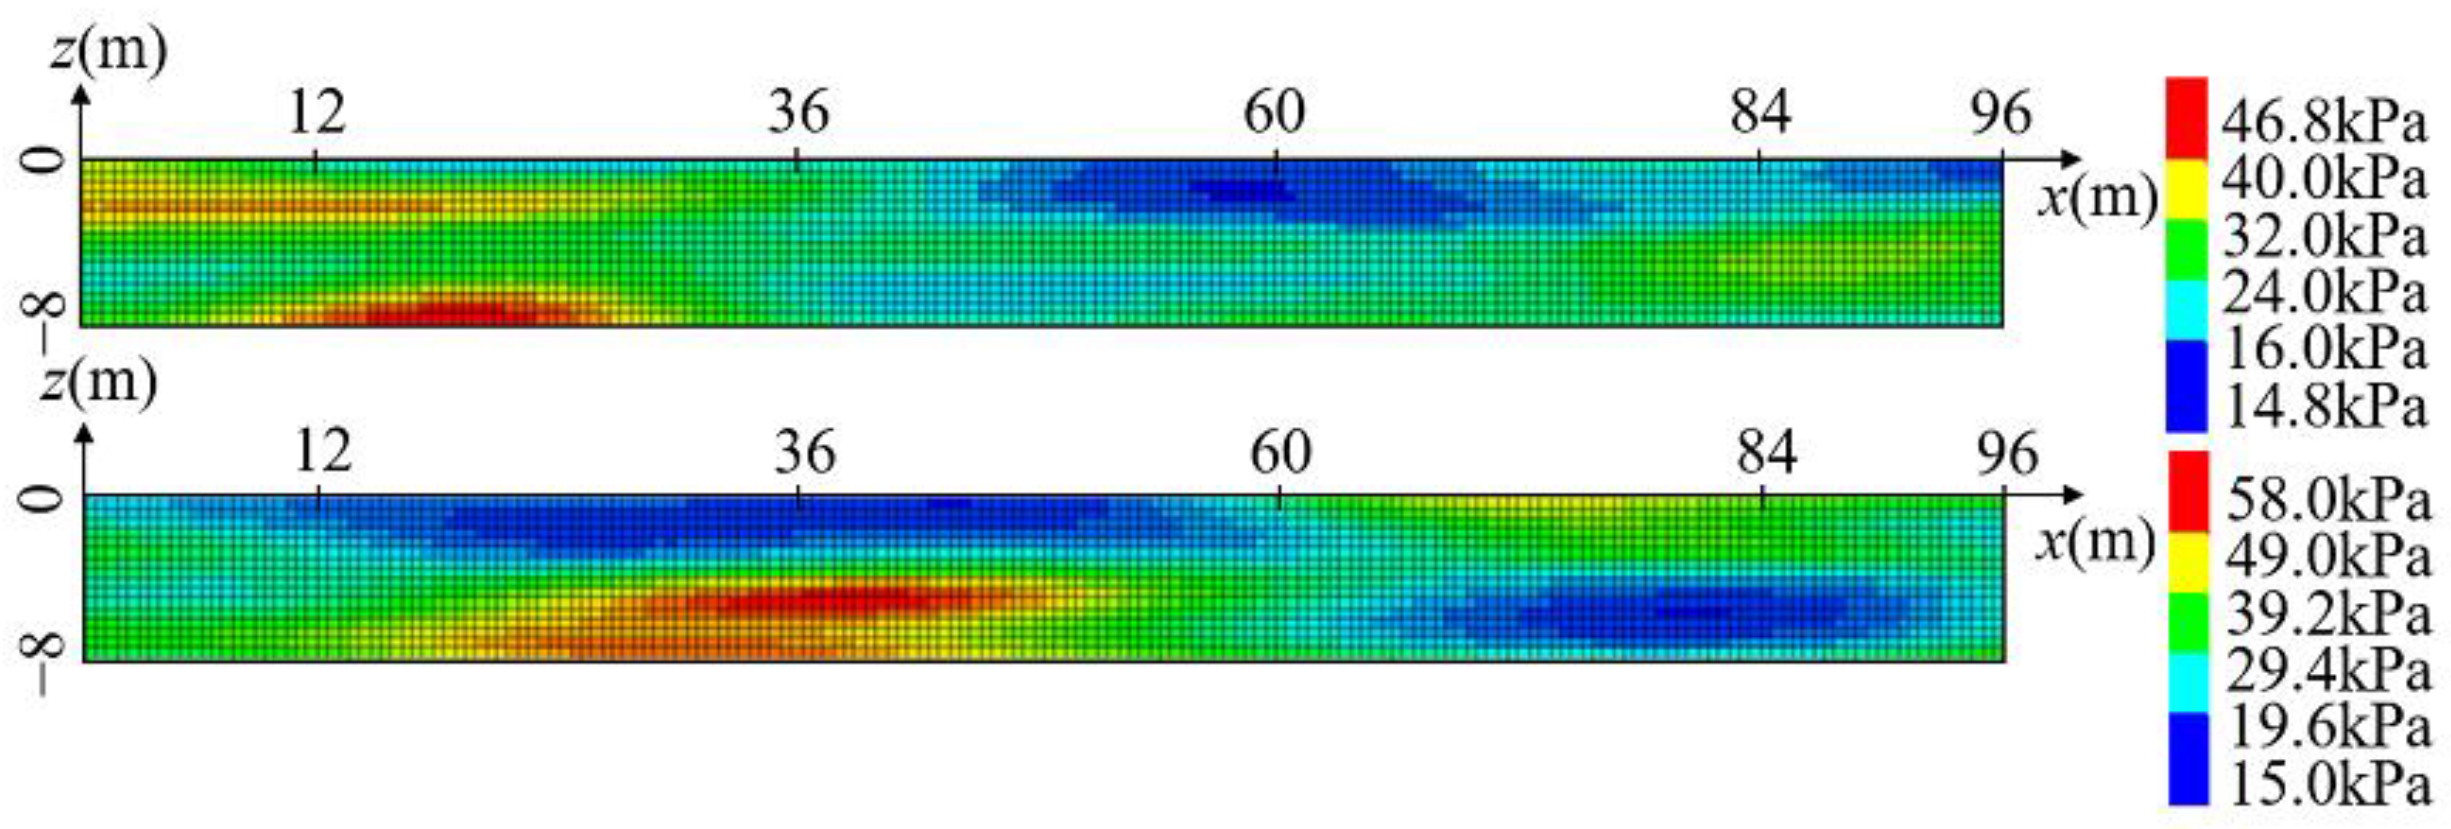
2.2. Non-Stationary Random Field of Undrained Shear Strength
3. Probabilistic Analyses for Vertical Bearing Capacity of Pile Foundations
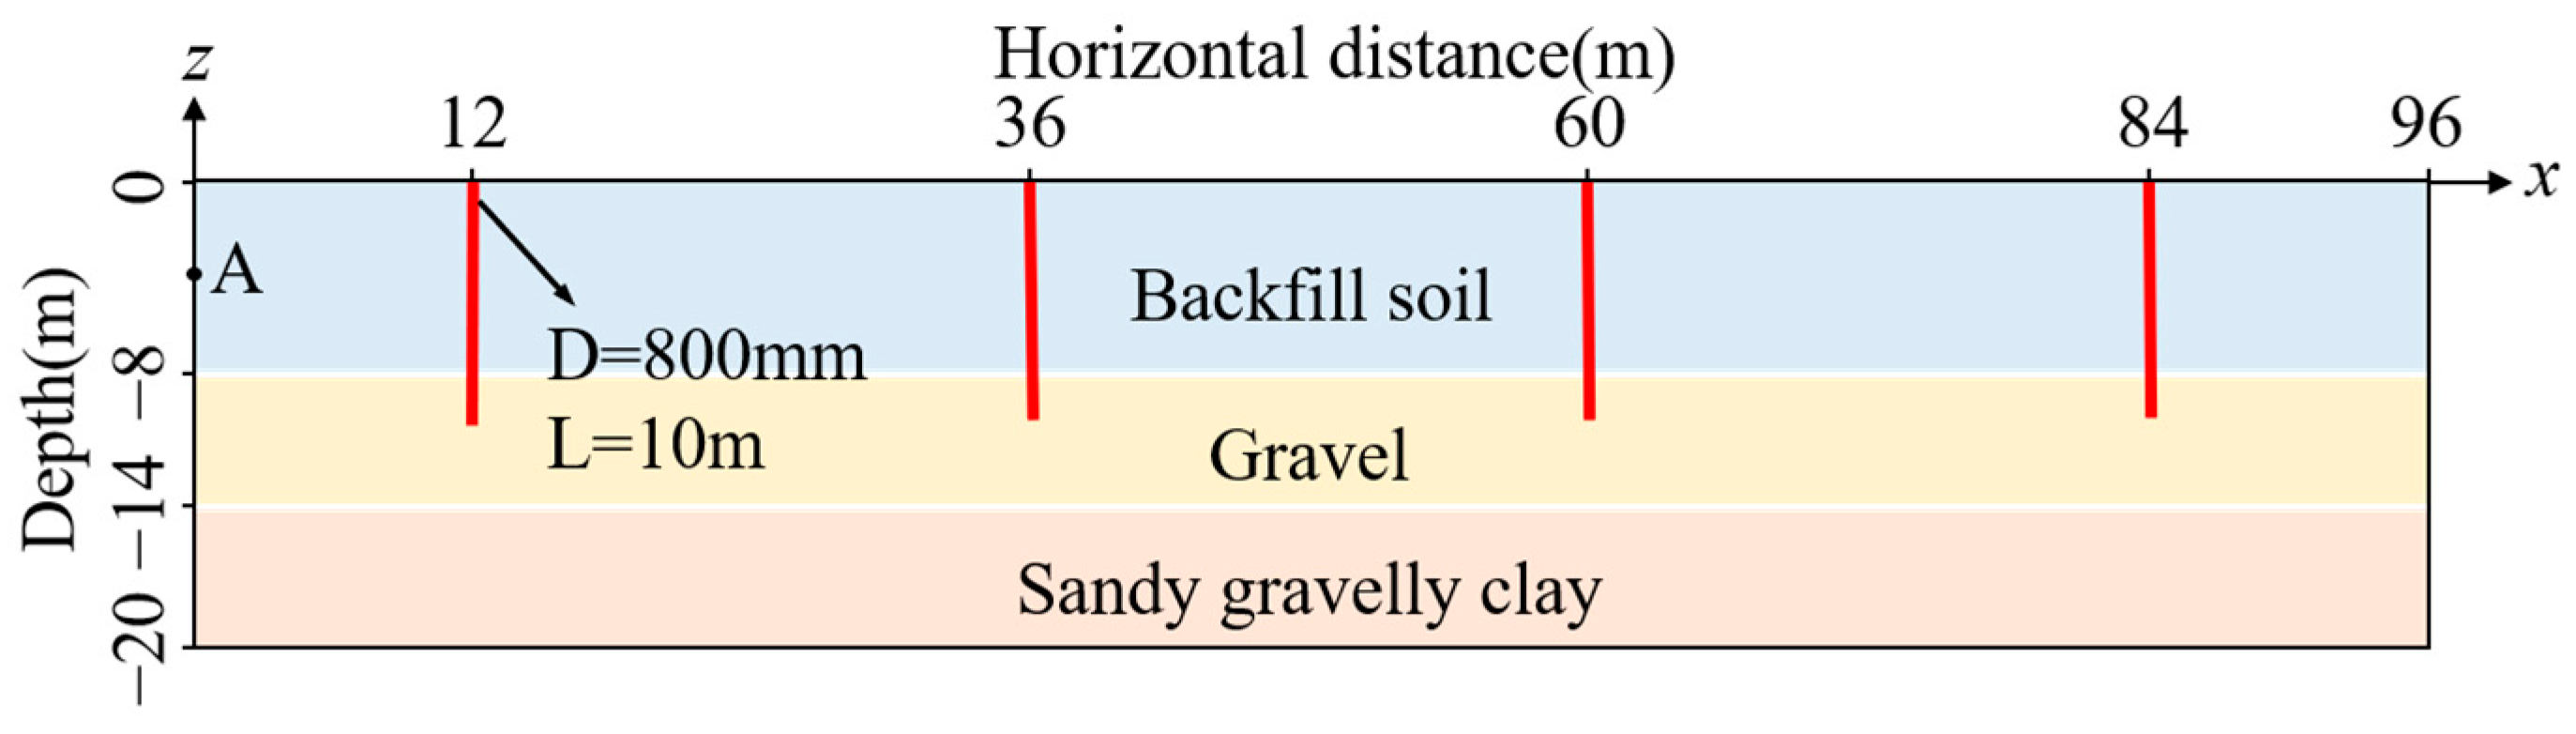
3.1. Numerical Model
3.2. Monte Carlo Simulation Process
- Discretization of the random field
- 2.
- Sample generation
- 3.
- Finite element Solving
3.3. Probabilistic Simulation Cases
4. Results and Discussions
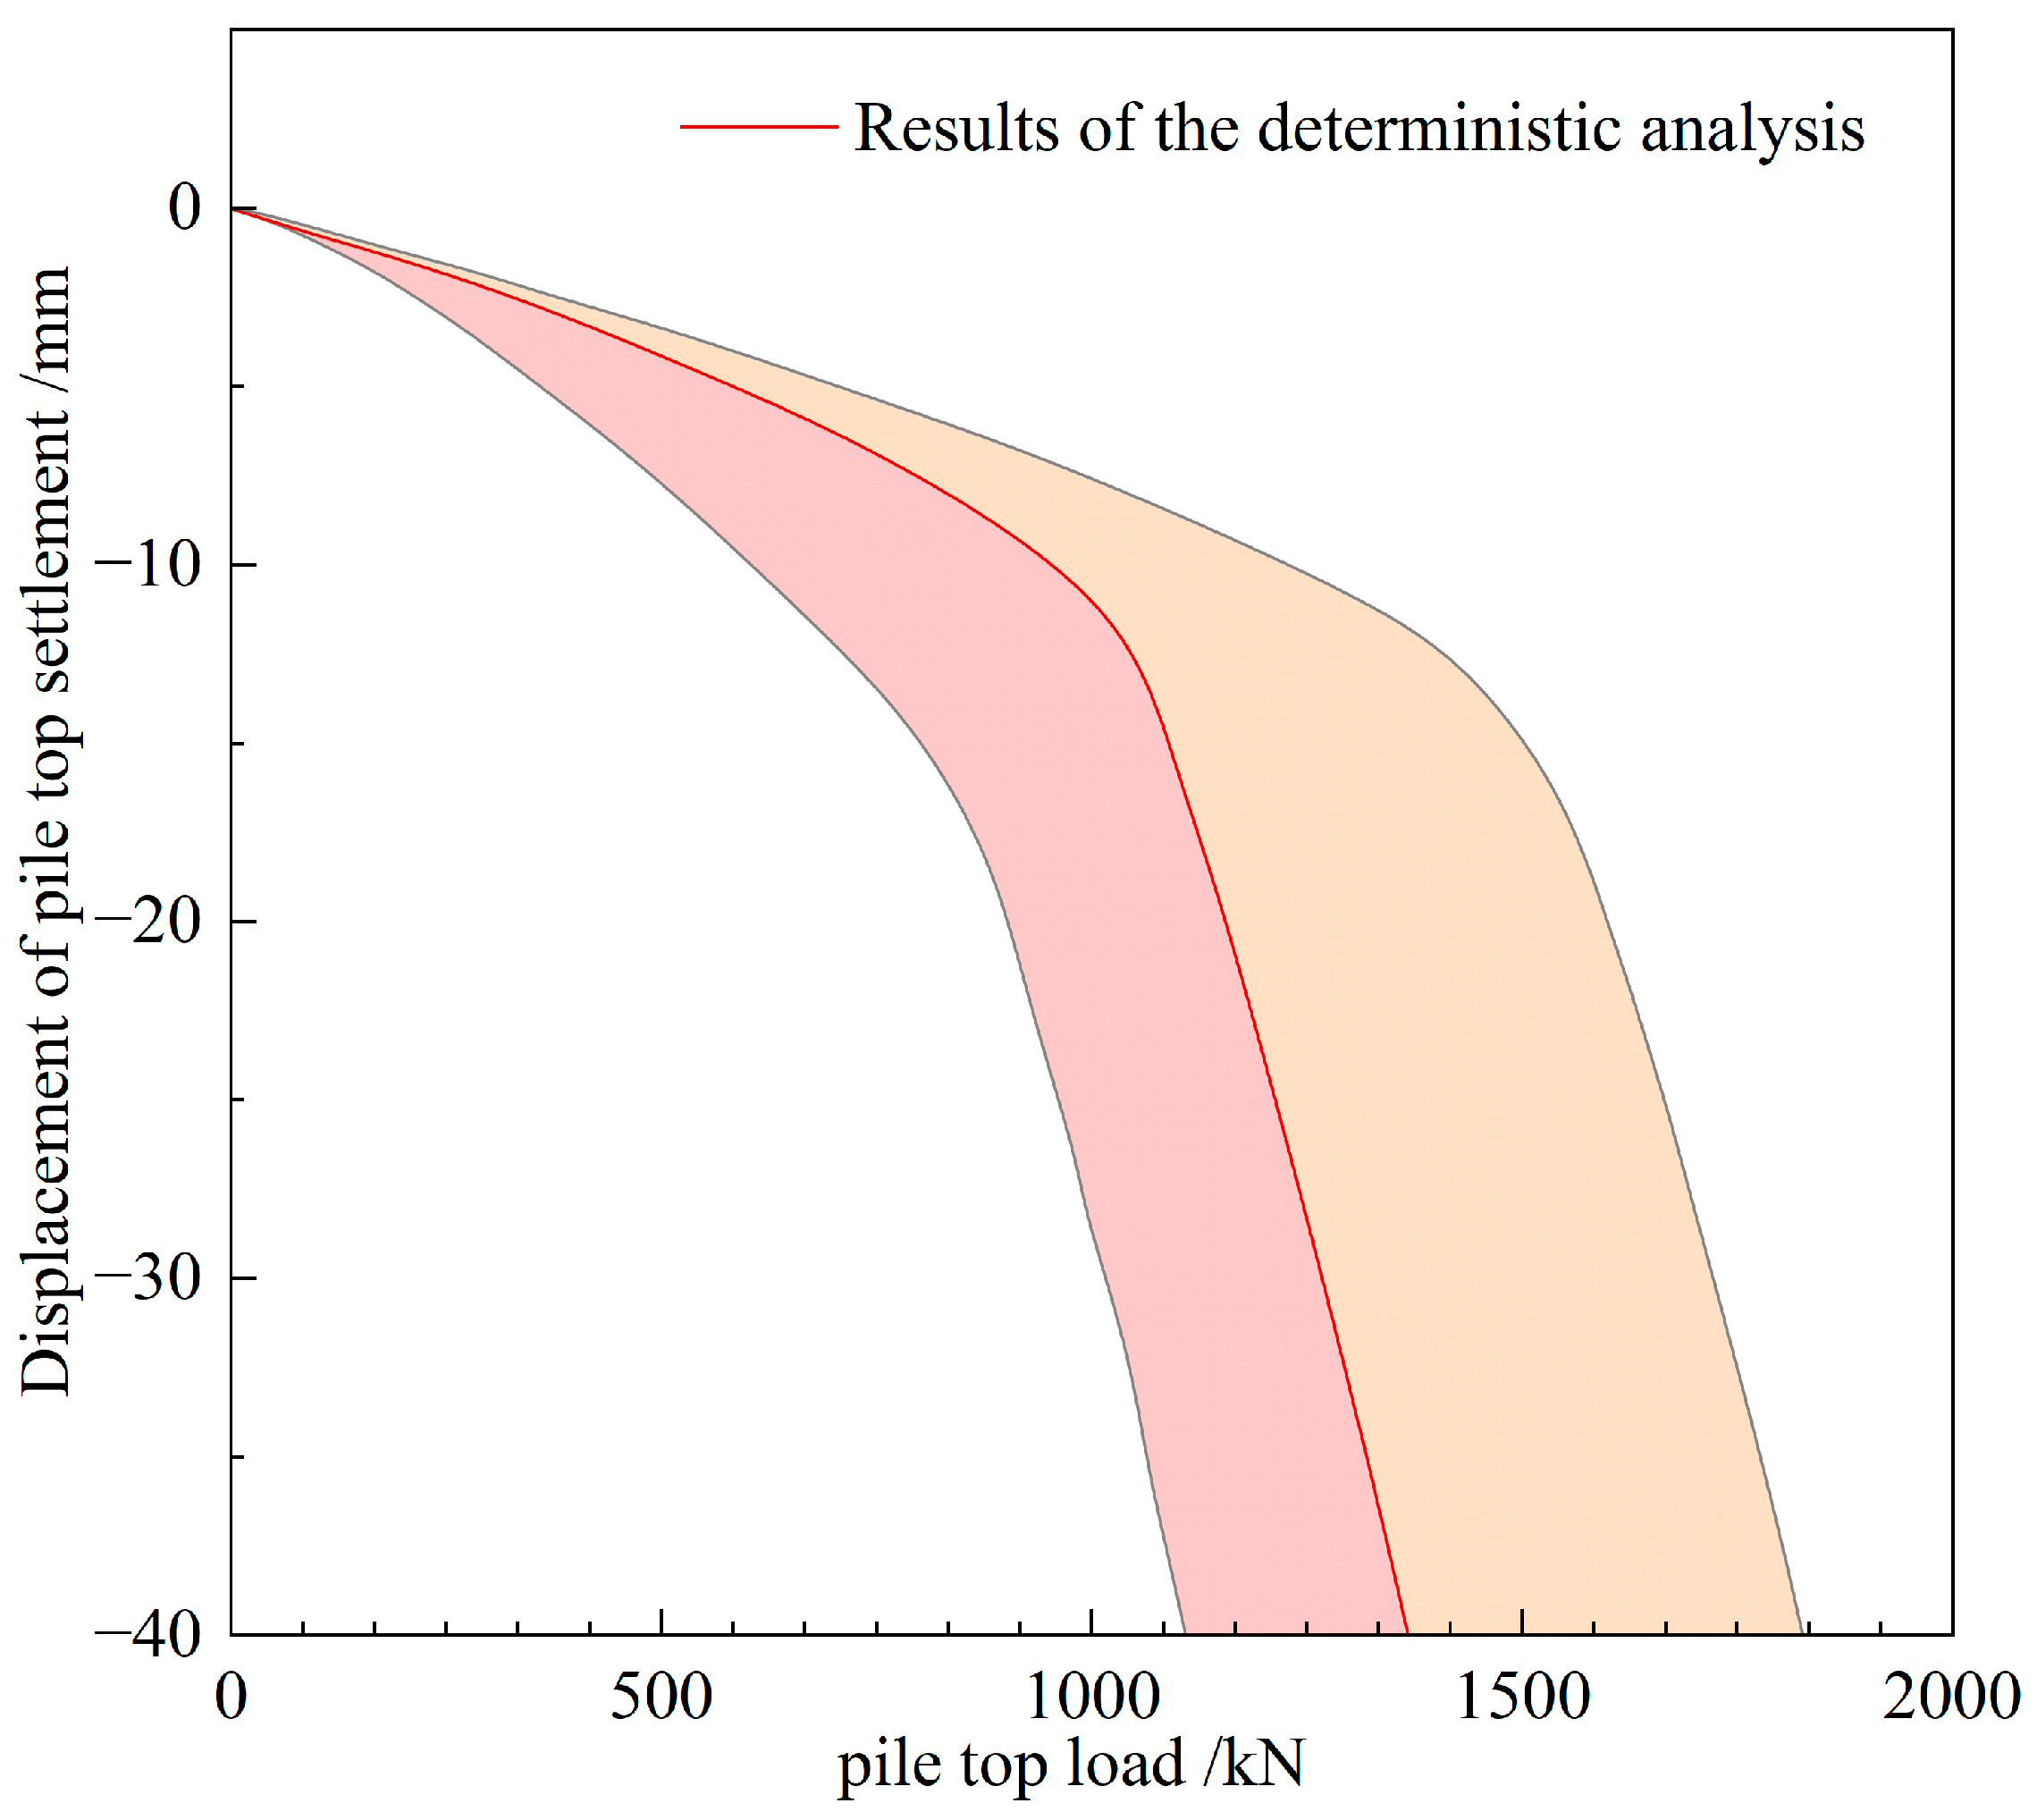
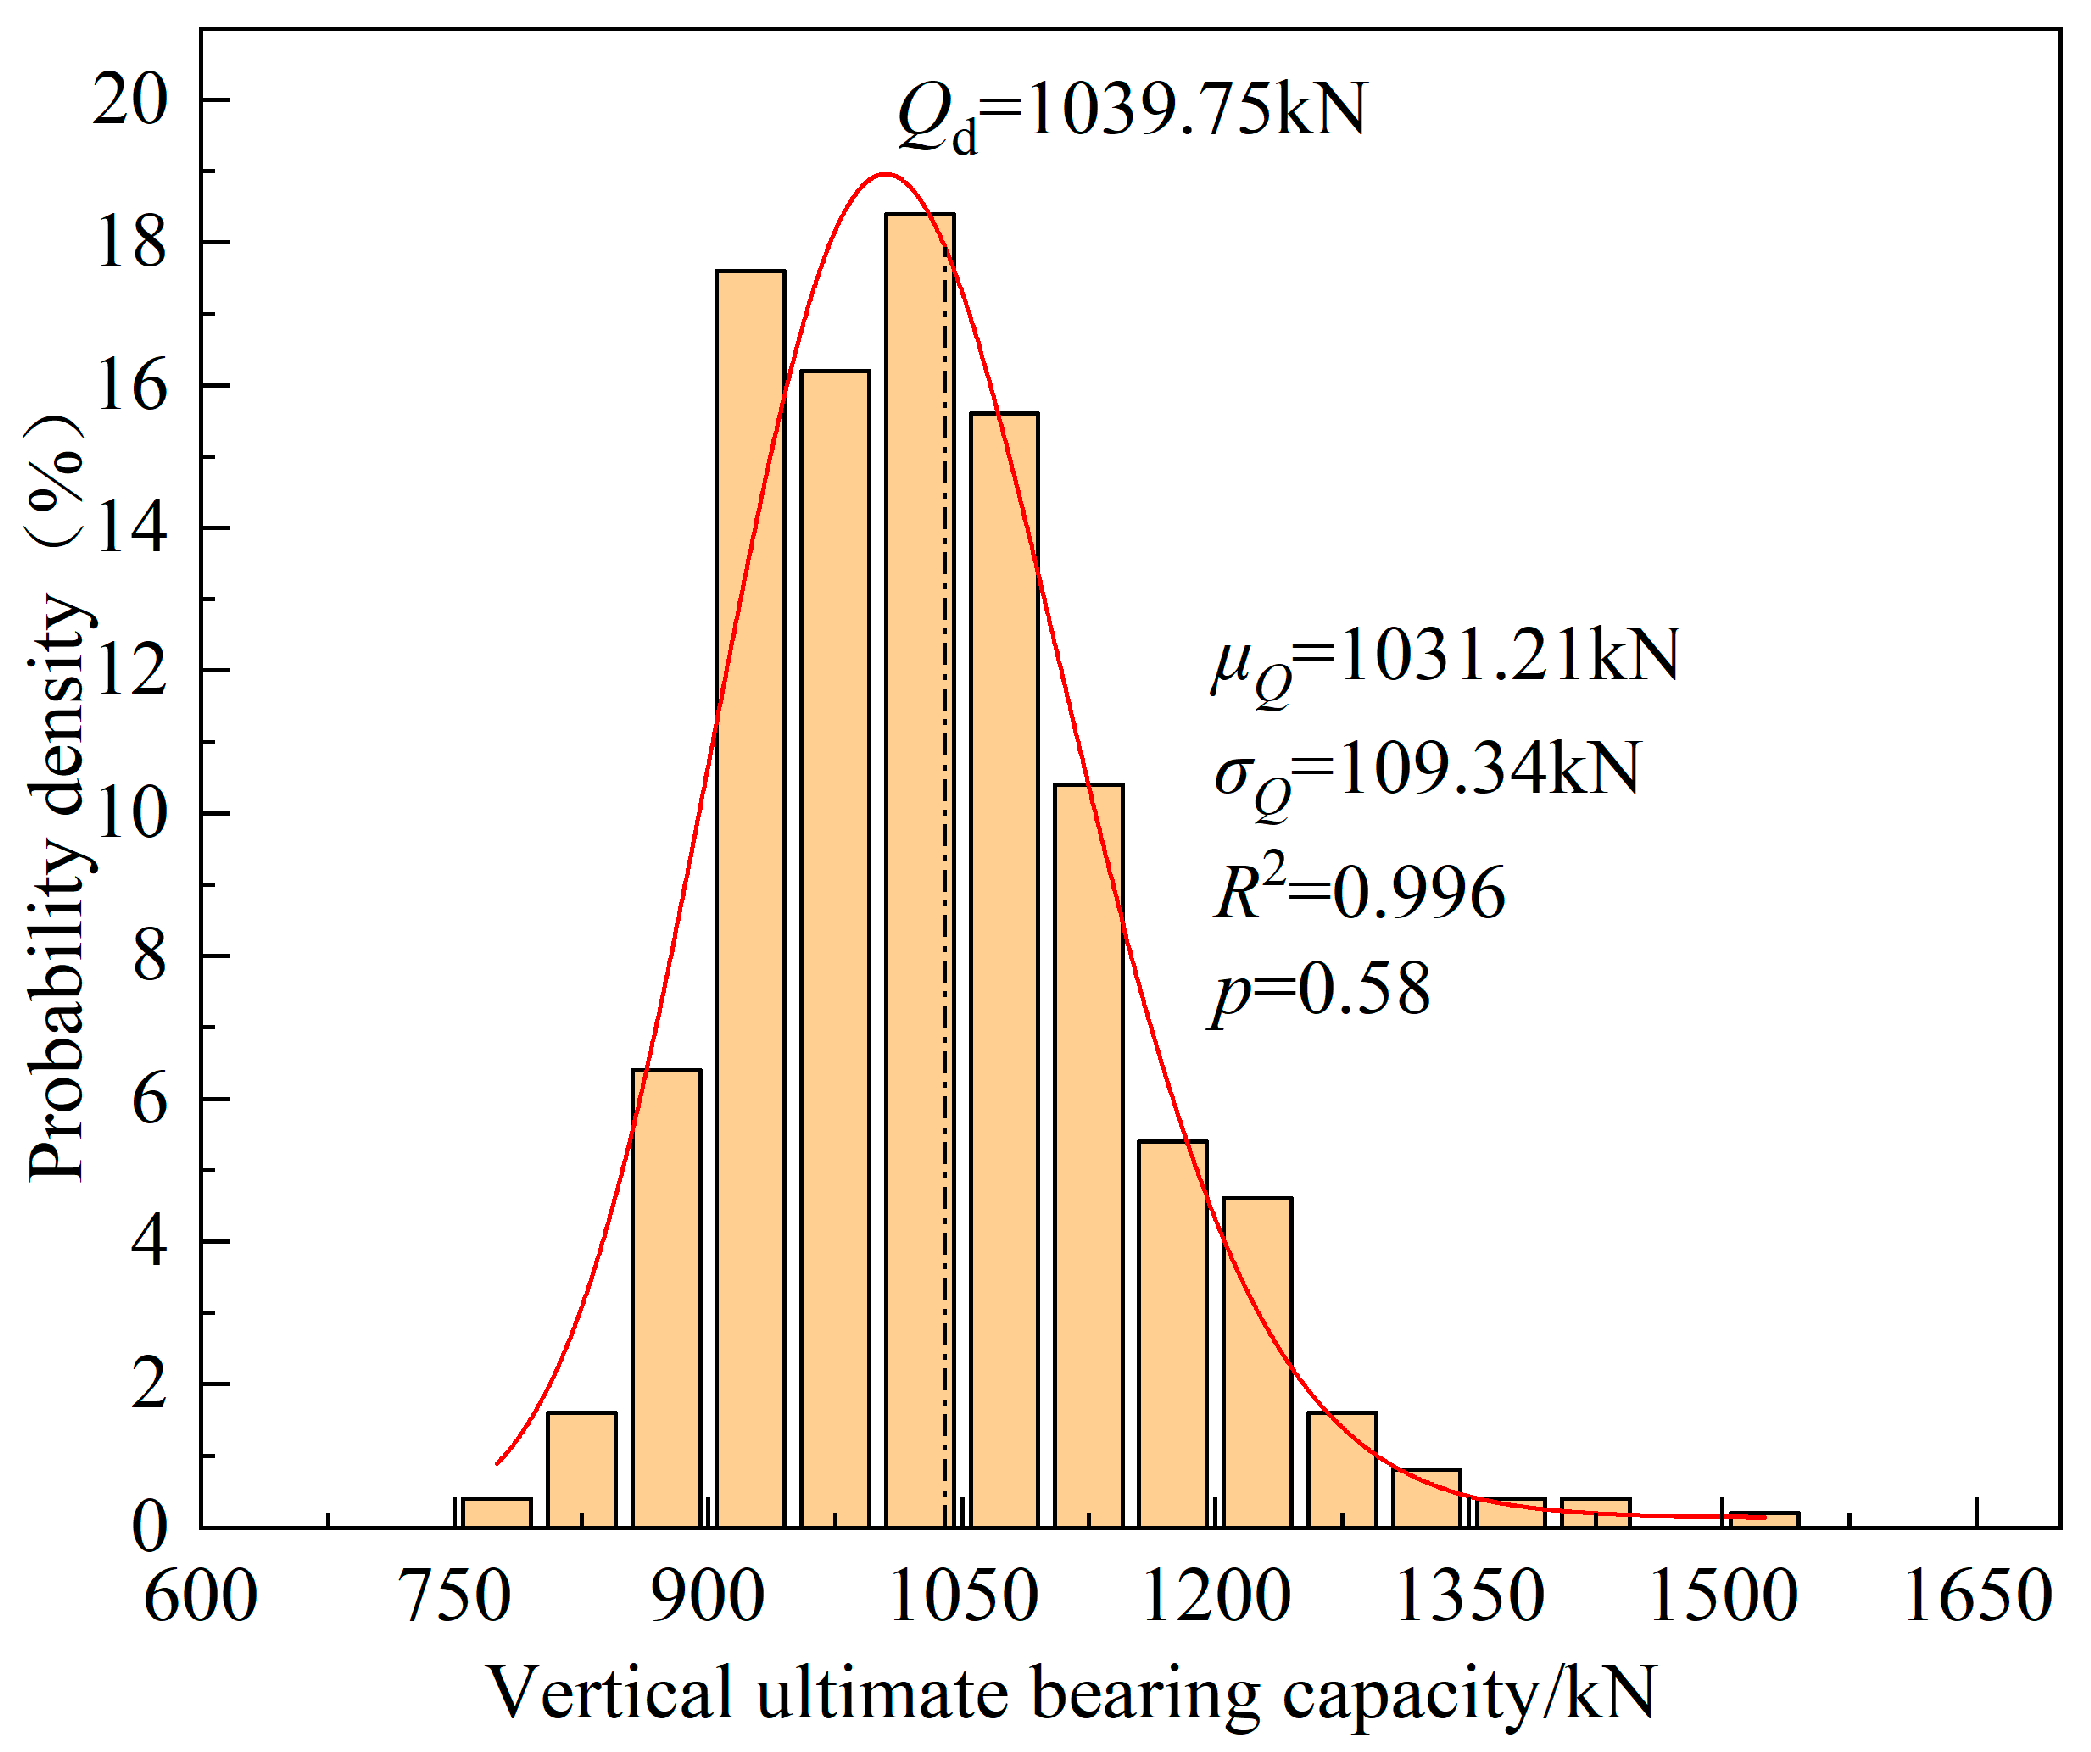
4.1. Results of Baseline Case
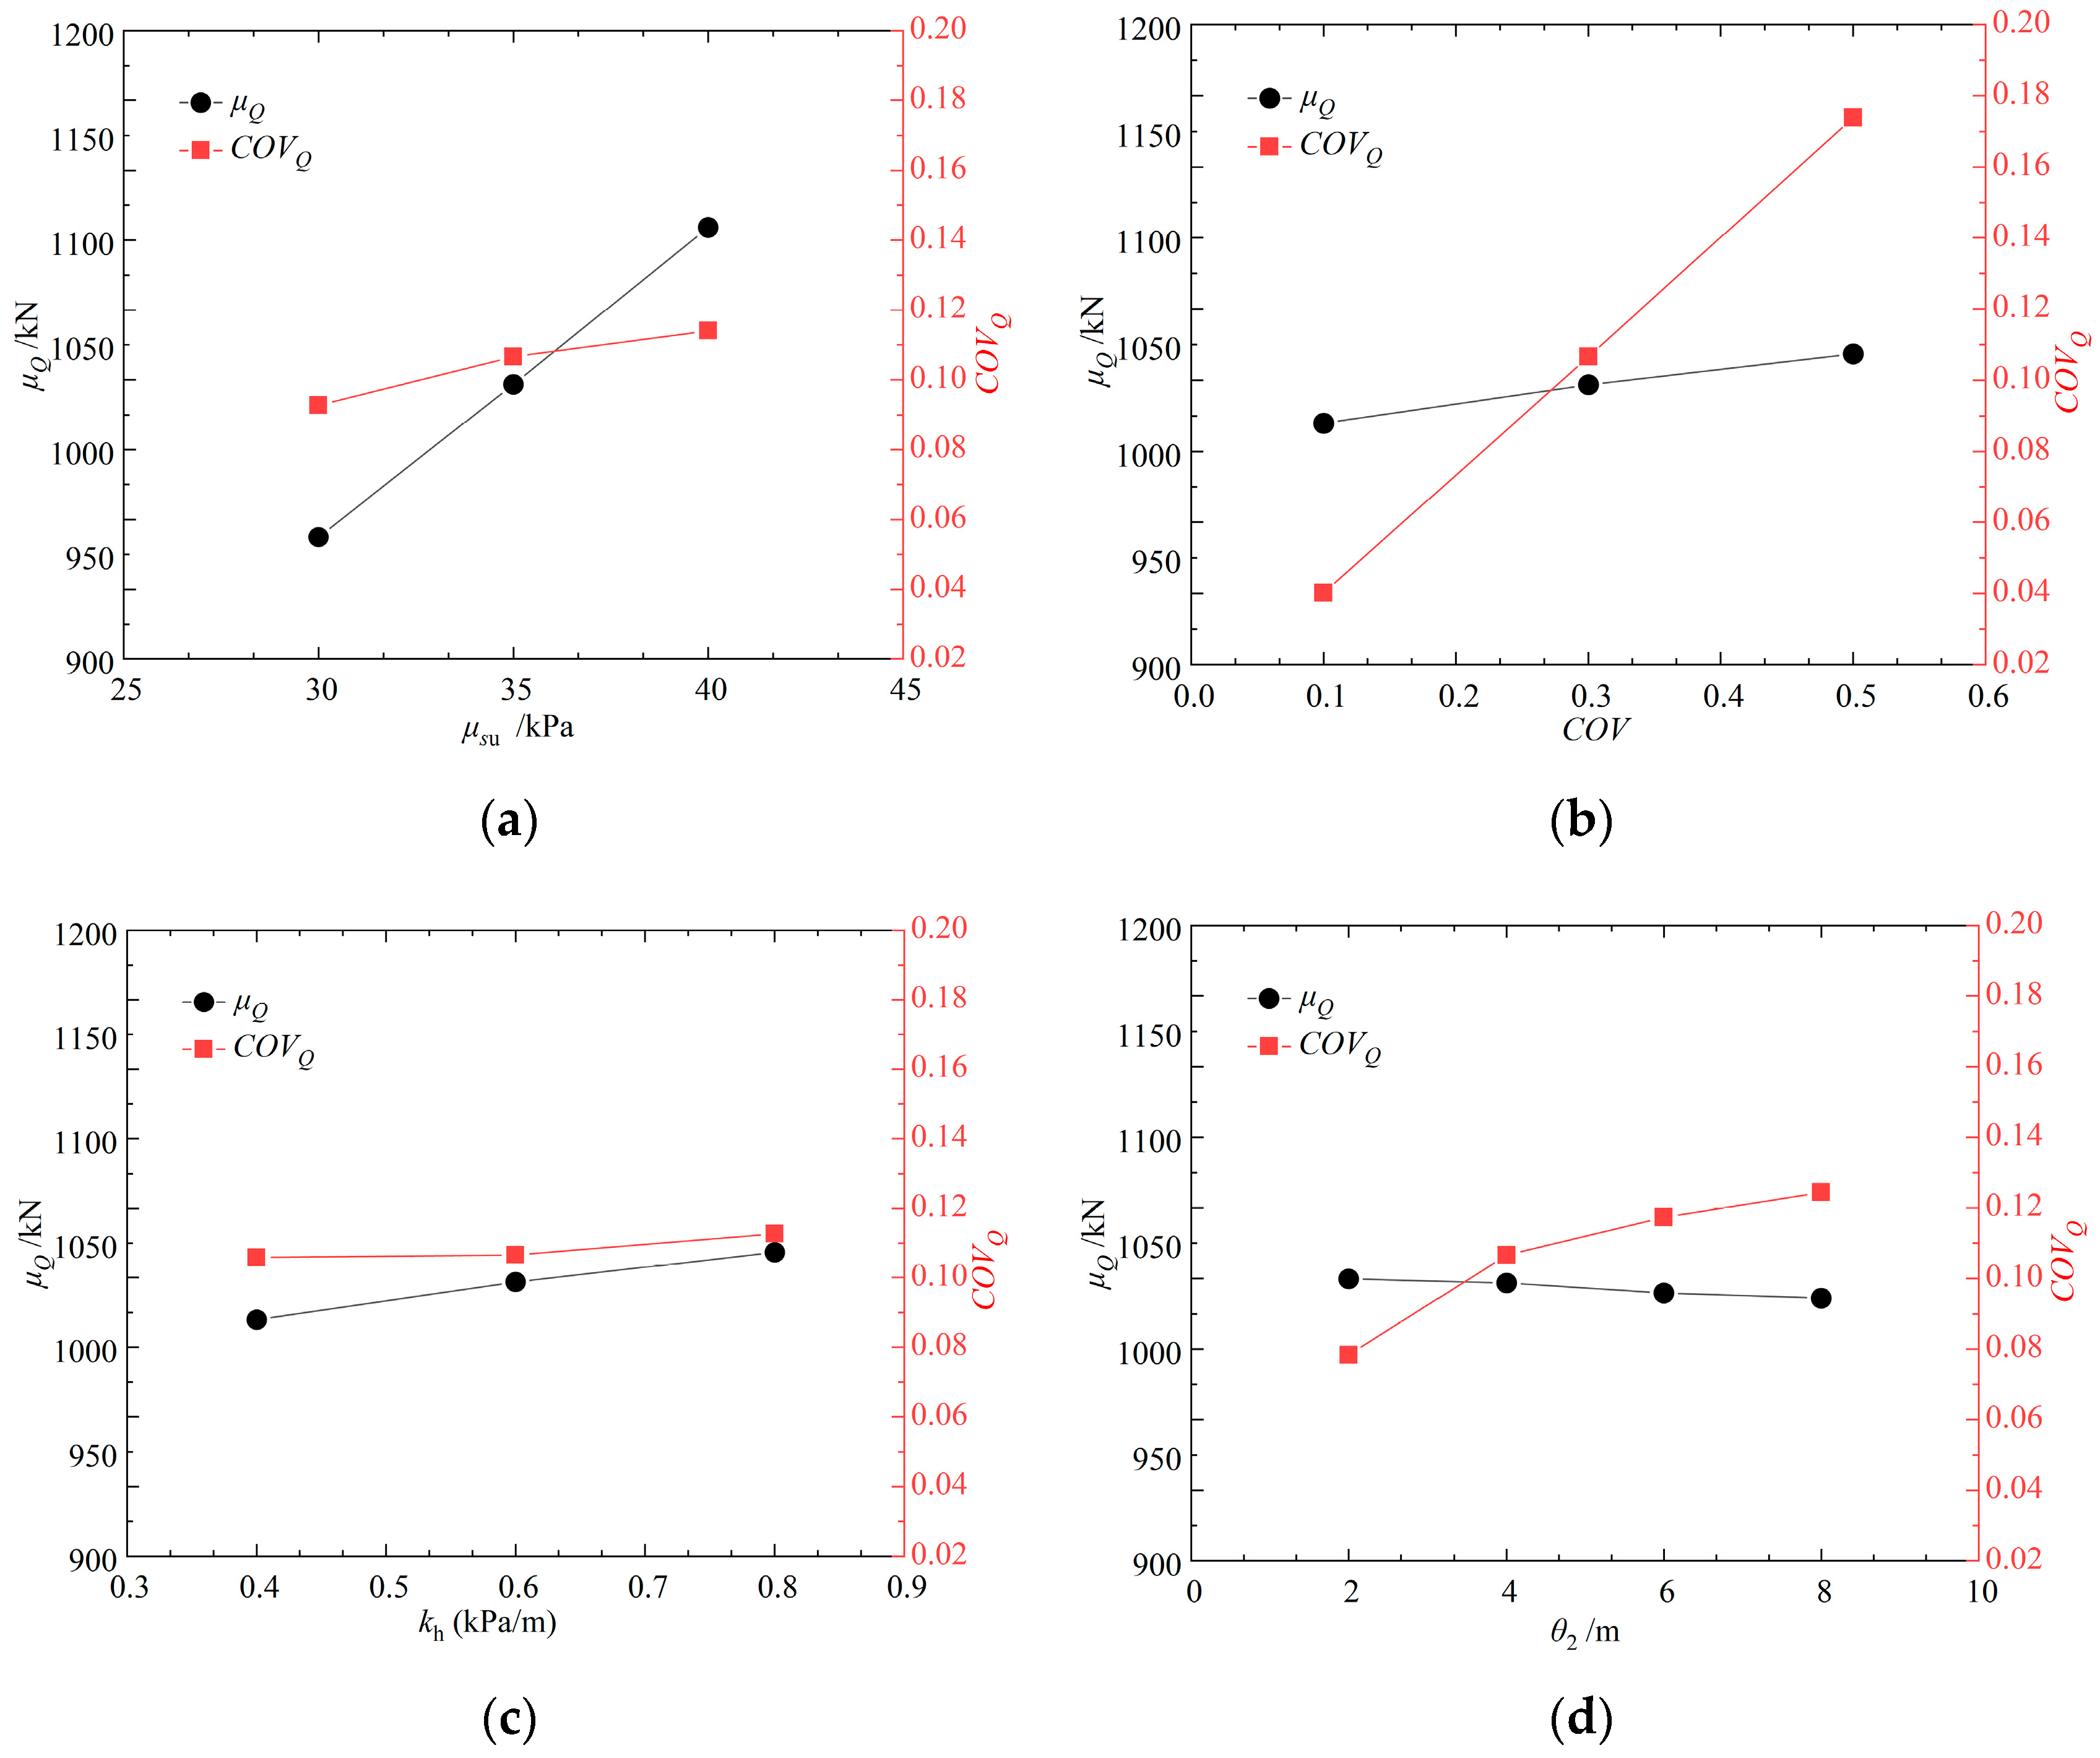
4.2. Effect of the Soil Properties
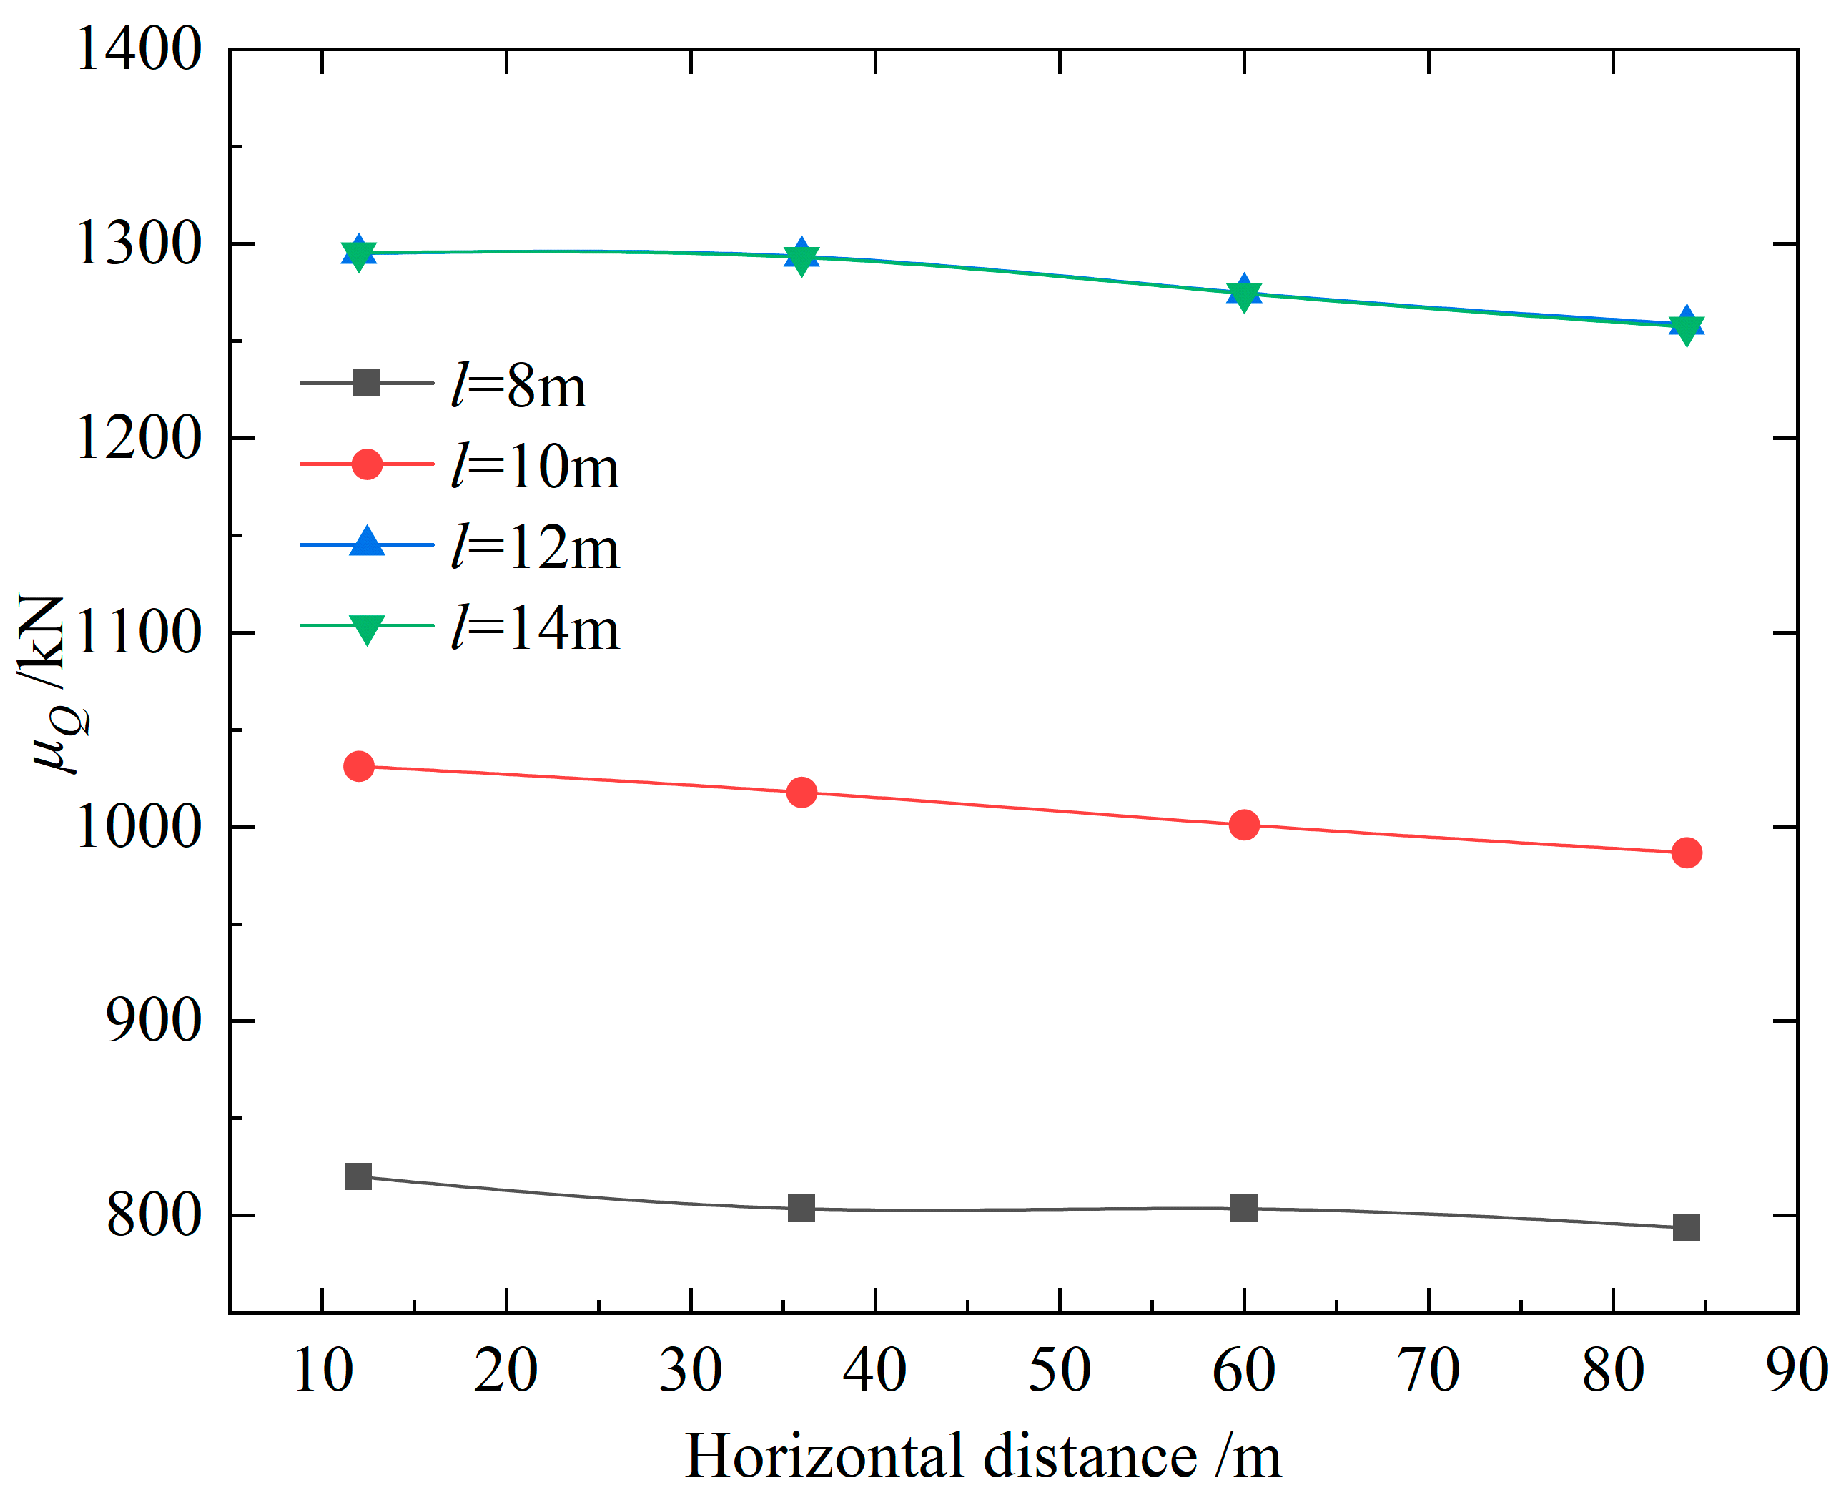
4.3. Effect of the Pile Length
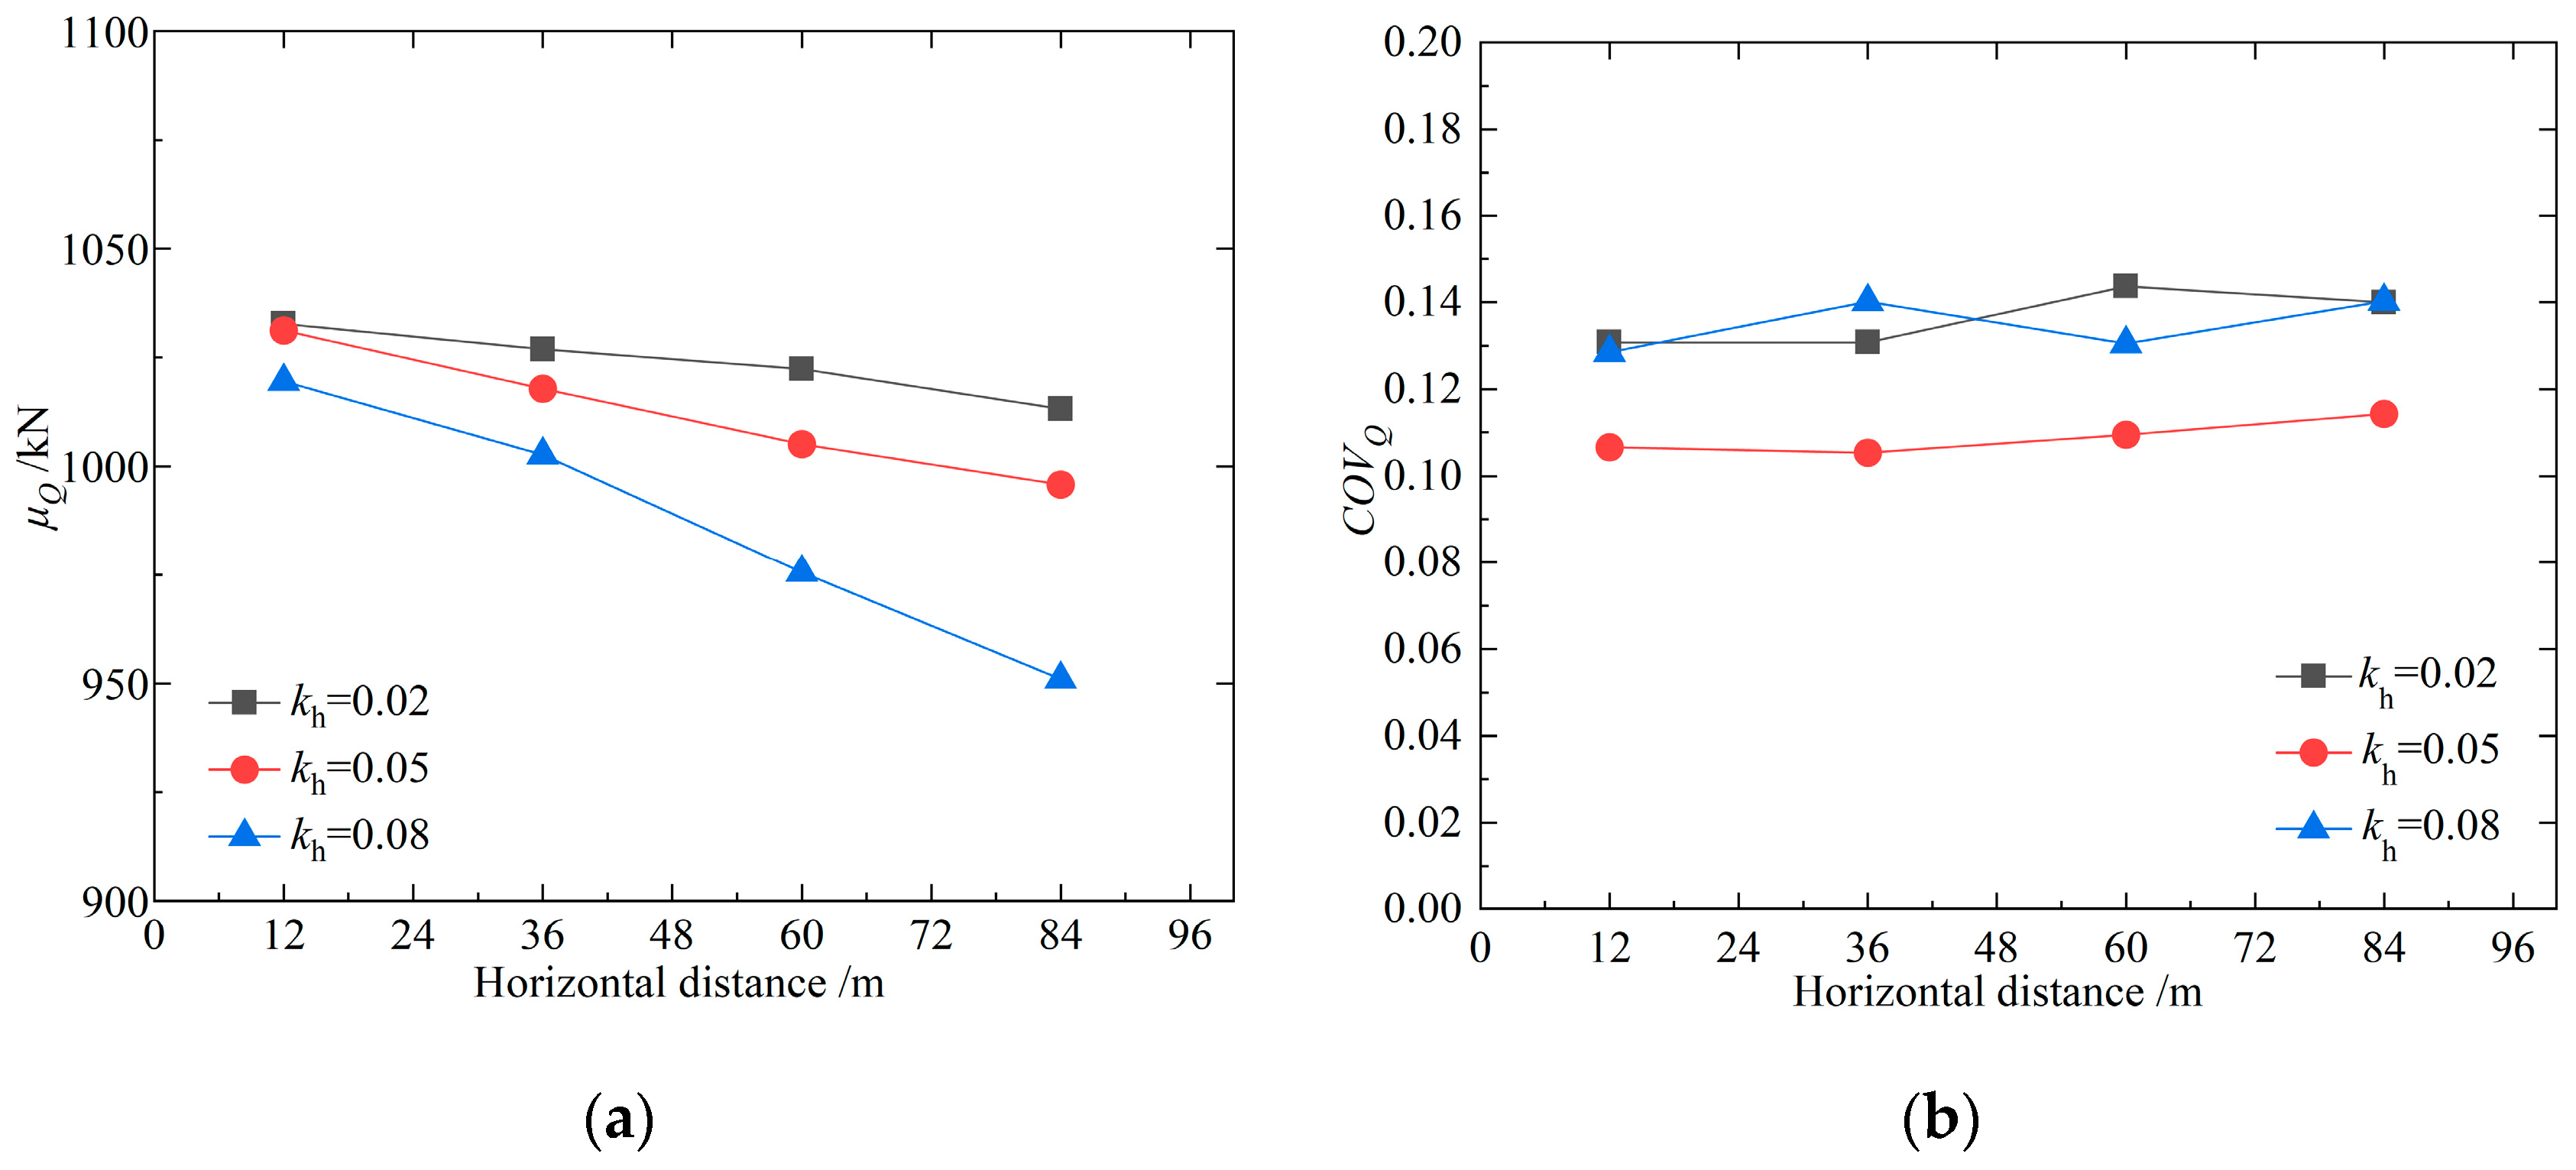
4.4. Effect of the Pile Location
4.5. Discussion
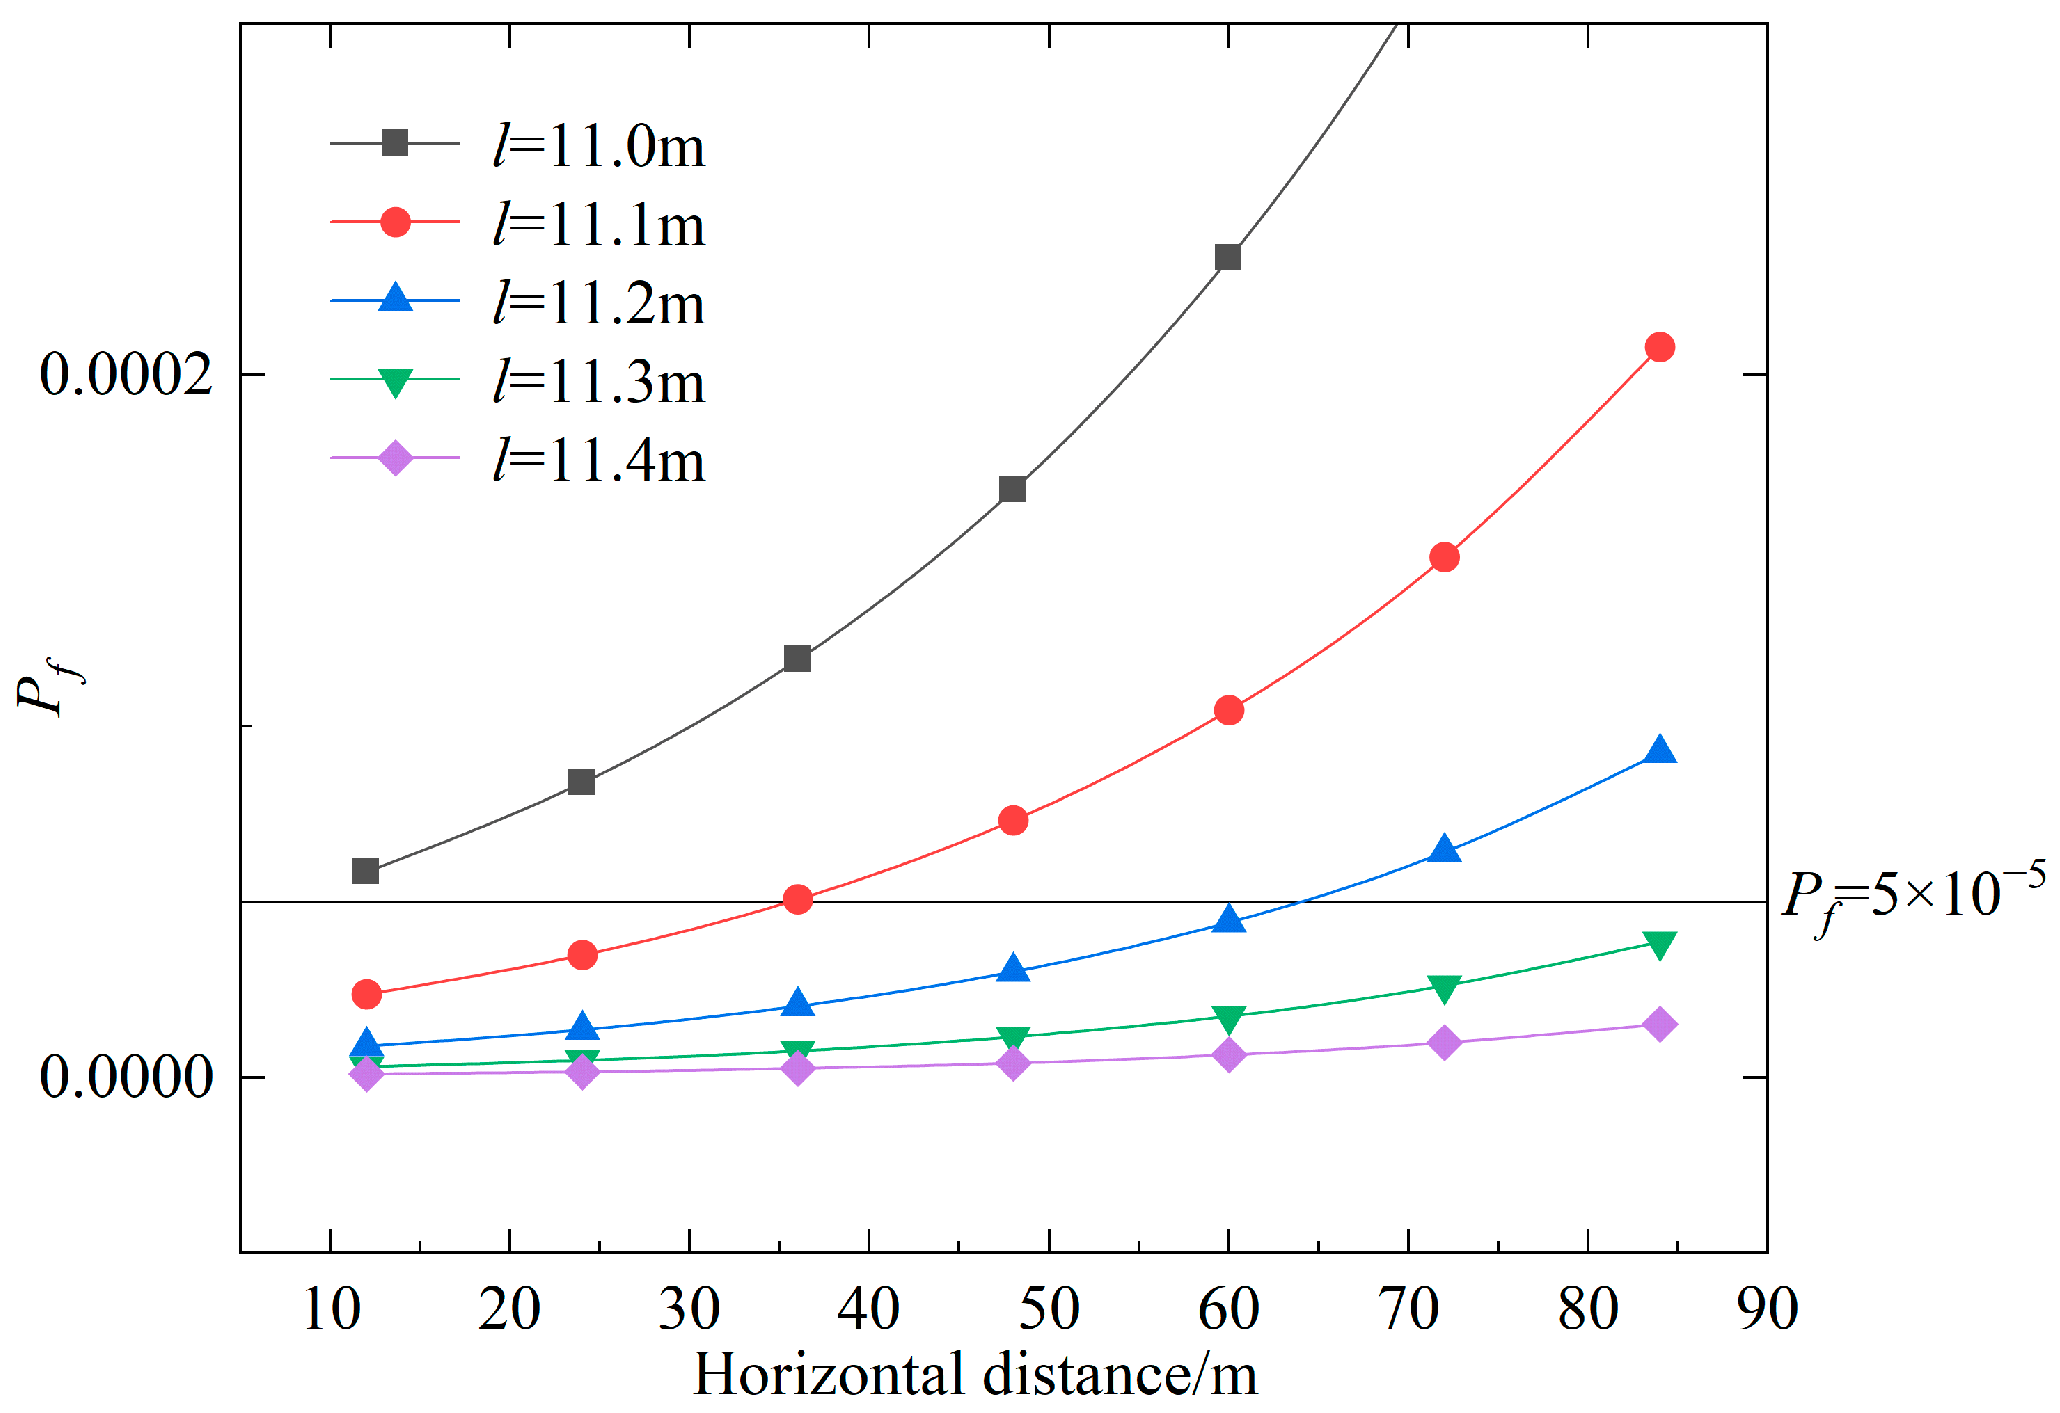
4.6. Case Study
5. Conclusions
- (1)
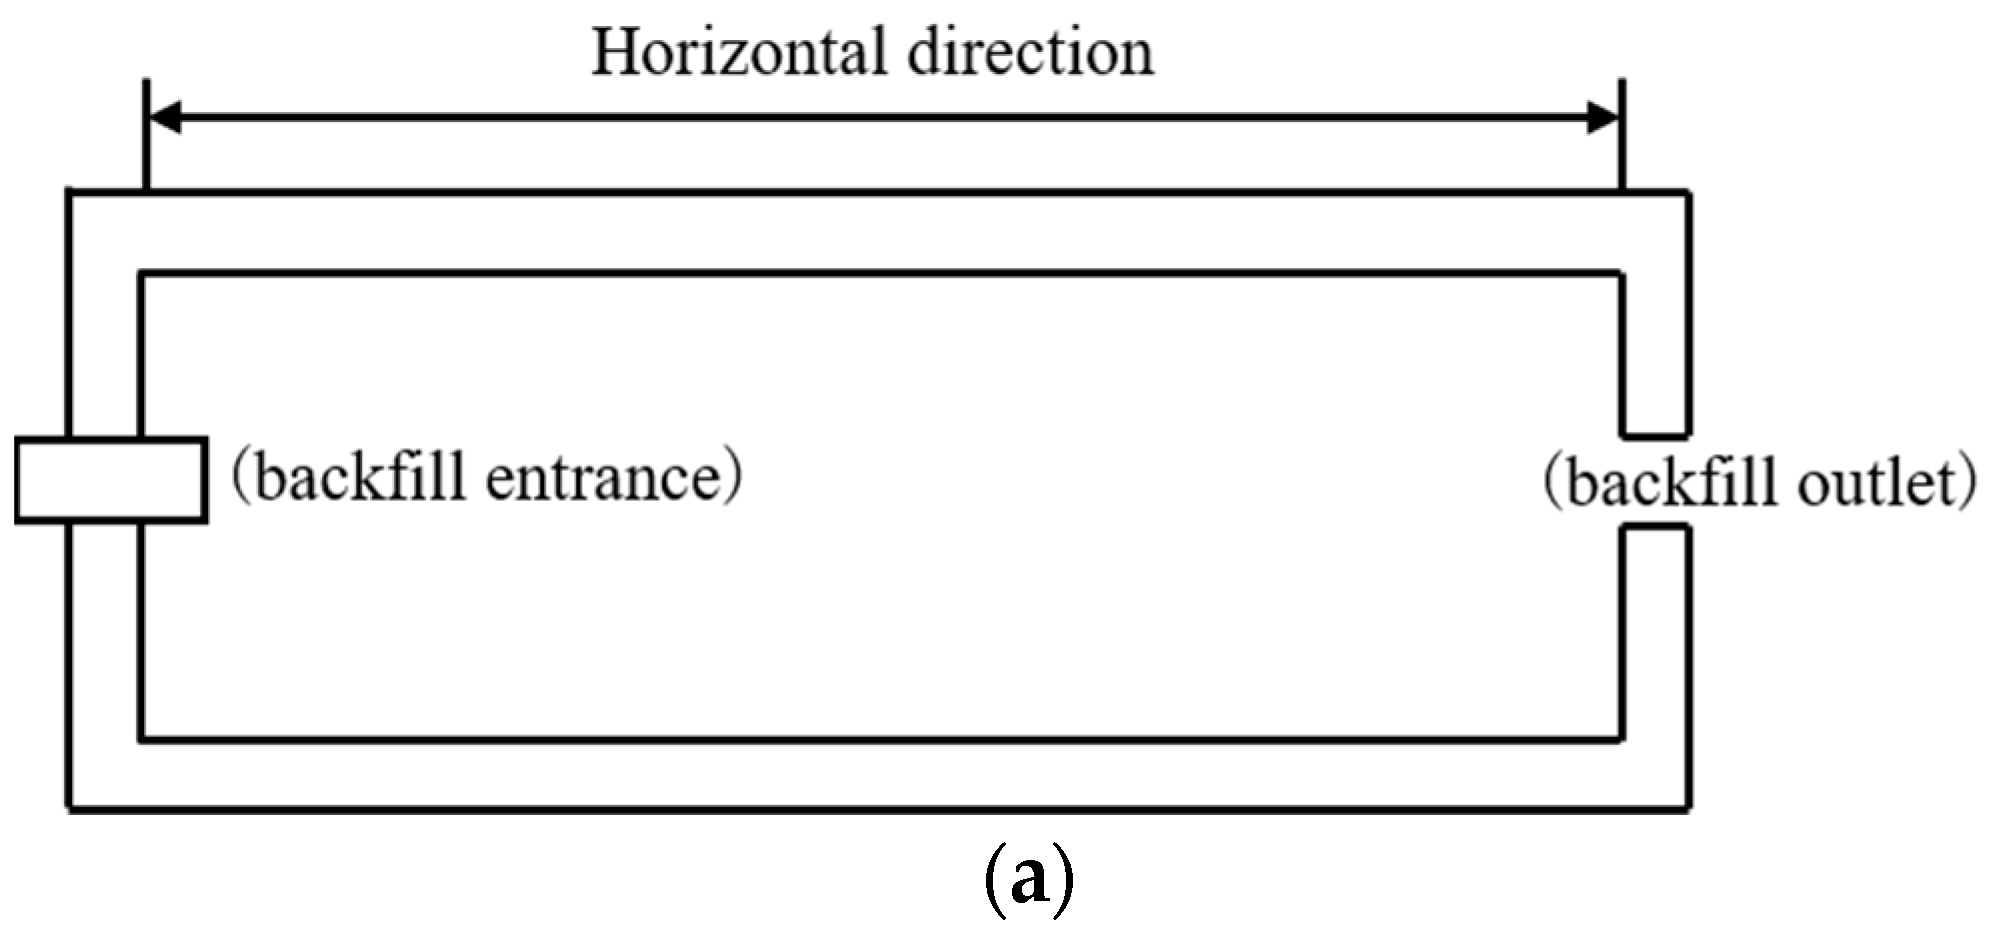
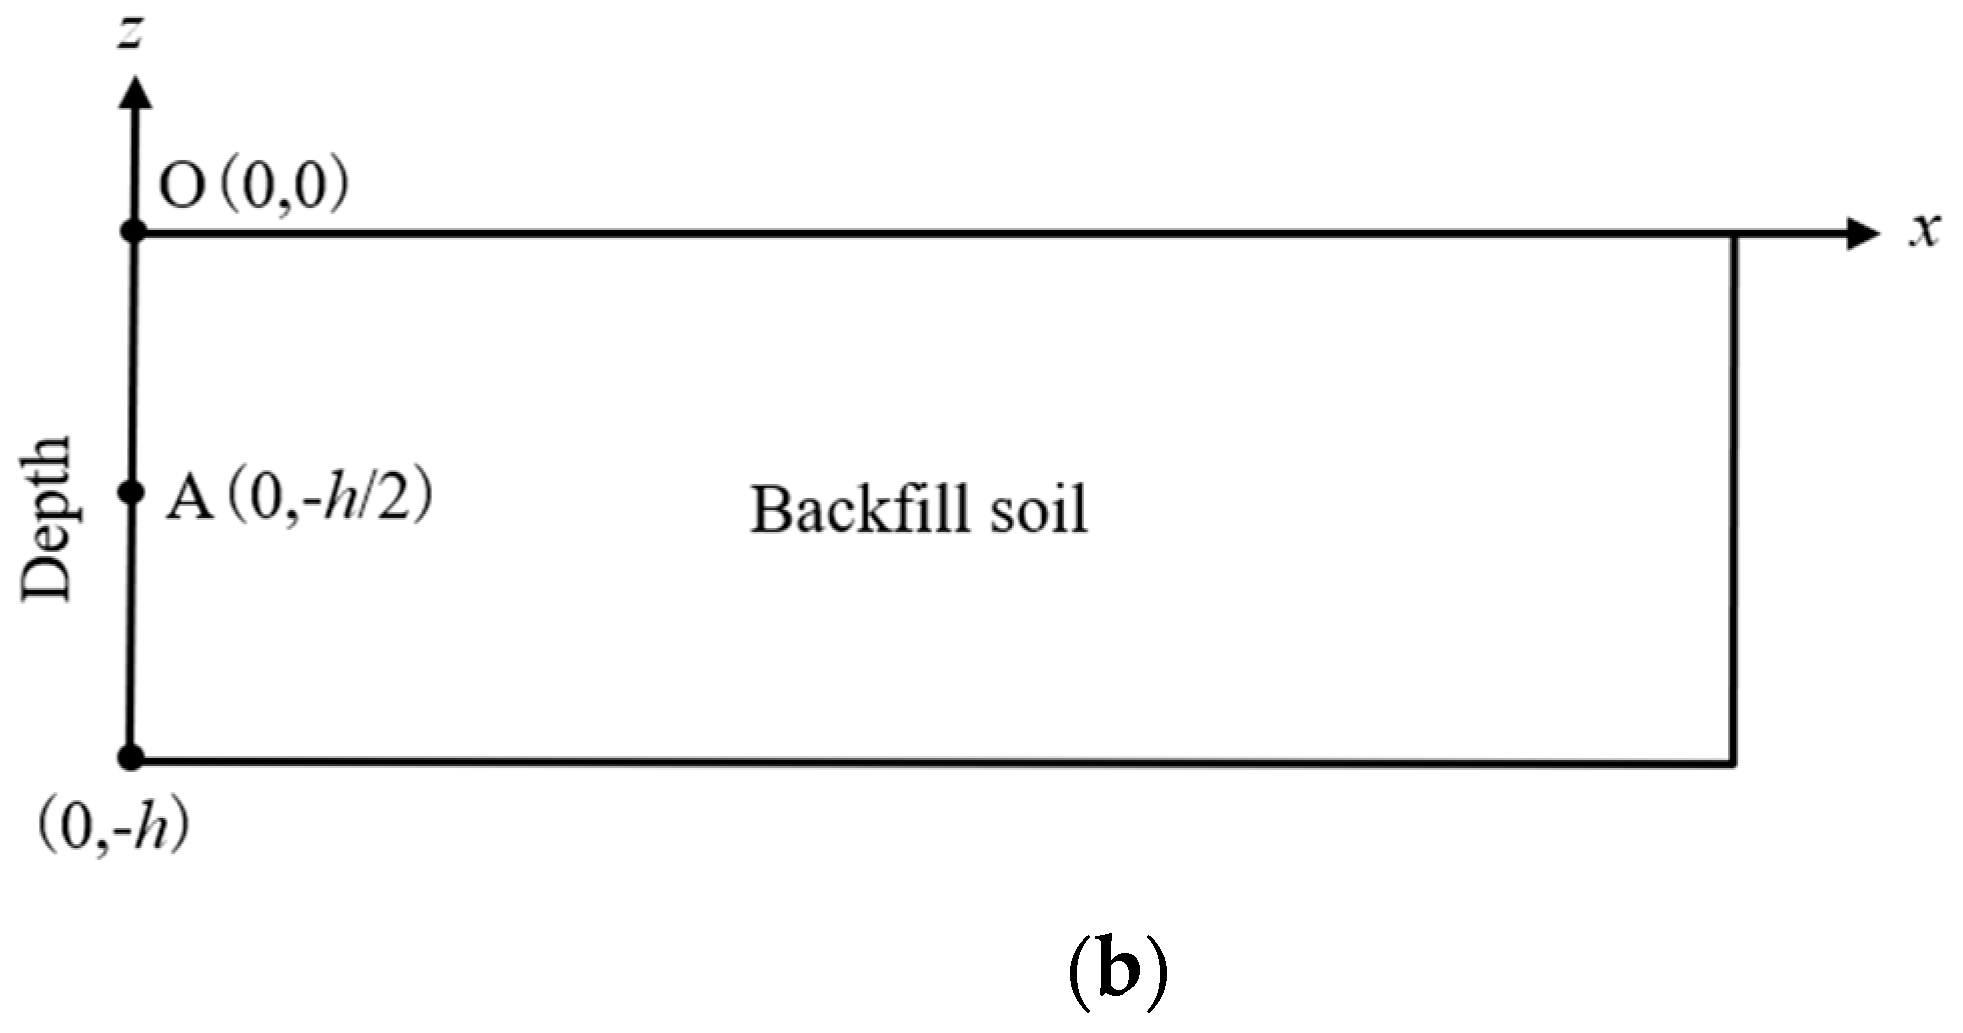
- Based on the spatial distribution characteristics of the undrained shear strength in the backfill soil, a non-stationary random field model is proposed that incorporates the attenuation of undrained shear strength decrease with the horizontal direction and increase with the vertical direction. This model effectively characterizes the spatial distribution of strength in artificial soil foundations.
- (2)
- The distance between the pile and the backfill entrance, as well as the horizontal non-stationary trend coefficient, has a substantial effect on the vertical ultimate bearing capacity. The mean value of the vertical ultimate bearing capacity of pile foundations increases with the length of the pile, but there is an upper limit to this growth. When kh (the horizontal non-stationary trend coefficient) is quantified, a linear relationship is observed between the mean vertical ultimate bearing capacity and x (the distance from the pile to the backfill entrance). It is worth mentioning that kh has an increasingly pronounced effect on the vertical ultimate bearing capacity of pile foundations as x increases.
- (3)
- Through practical engineering analyses, the model can effectively guide the optimization of pile foundation design. Compared to traditional design methods, the approach adopted in this study reduces project costs while ensuring reliability. However, it is important to note that the current model’s applicability to other pile types and ultra-high water-content backfill foundations still requires further validation. Future research will focus on the following areas: improving pile body optimization by refining the design of related parameters such as pile diameter and type; expanding the applicability of the model to fill sites; and developing a three-dimensional non-stationary stochastic field model suitable for backfill soil foundations.
Author Contributions
Funding
Data Availability Statement
Conflicts of Interest
References
- Bi, X.; Liu, F.; Pan, X. Coastal projects in China: From eeclamation to restoration. Environ. Sci. Technol. 2012, 46, 4691–4692. [Google Scholar] [CrossRef] [PubMed]
- Solanki, P.; Jain, B.; Hu, X.; Sancheti, G. A review of beneficial use and management of dredged material. Waste 2023, 1, 815–840. [Google Scholar] [CrossRef]
- De Padova, D.; Ben Meftah, M.; De Serio, F.; Mossa, M. Management of dredging activities in a highly vulnerable site: Simulation modelling and monitoring activity. J. Mar. Sci. Eng. 2020, 8, 1020. [Google Scholar] [CrossRef]
- Wen, L.; Yao, D. The effect of flocculants and water content on the separation of water from dredged sediment. Water 2023, 15, 2462. [Google Scholar] [CrossRef]
- Zhang, D.-M.; Jiang, Q.-H.; Zhang, J.-Z.; Huang, H.-W. Bearing capacity of shallow foundations considering geological uncertainty and soil spatial variability. Acta Geotech. 2024, 19, 3961–3977. [Google Scholar] [CrossRef]
- Wu, C.L.; Li, J.H.; Liu, J.C. Experimental study of a shallow foundation on spatially variable soils. Georisk-Assess. Manag. Risk Eng. Syst. Geohazards 2022, 16, 225–234. [Google Scholar] [CrossRef]
- Griffiths, D.V.; Huang, J.; Fenton, G.A. Probabilistic slope stability analysis using RFEM with non-stationary random fields. In International Symposium on Geotechnical Safety and Risk; ASME: New York, NY, USA, 2015; pp. 704–709. [Google Scholar]
- Kasama, K.; Zen, K. Reliability assessment of cement-mixed foundations bearing capacity considering spatial variability. In Proceedings of the International Foundation Congress and Equipment Expo, Orlando, FL, USA, 15–19 March 2009; ASME: New York, NY, USA, 2009; pp. 356–363. [Google Scholar]
- Wu, T.; Sun, Z.; Tan, W.; Kasu, C.M.; Gong, J. Response of vertically-loaded pile in spatially-variable cement-treated soil. PLoS ONE 2022, 17, e0266975. [Google Scholar] [CrossRef]
- Tan, X.; Zhang, P.; Dong, X.; Lin, X.; Lu, Z. Reliability analysis of single pile in spatially variable soil based on variance reduction method. ASCE-ASME J. Risk Uncertain. Eng. Syst. Part A-Civ. Eng. 2024, 10, 04024016. [Google Scholar] [CrossRef]
- Dong, X.; Tan, X.; Lin, X.; Guo, W.; Zha, F.; Xu, L. Reliability analysis and design of vertically loaded piles in spatially variable soils. Int. J. Geomech. 2023, 23, 04023175. [Google Scholar] [CrossRef]
- Li, D.Q.; Jiang, S.H.; Cao, Z.J.; Zhou, W.; Zhou, C.B.; Zhang, L.M. A multiple response-surface method for slope reliability analysis considering spatial variability of soil properties. Eng. Geol. 2015, 187, 60–72. [Google Scholar] [CrossRef]
- Wang, Z.Z.; Goh, S.H. Novel approach to efficient slope reliability analysis in spatially variable soils. Eng. Geol. 2021, 281, 105989. [Google Scholar] [CrossRef]
- Melink, T.; Korelc, J. Stability of Karhunen-Loeve expansion for the simulation of Gaussian stochastic fields using Galerkin scheme. Probabilistic Eng. Mech. 2014, 37, 7–15. [Google Scholar] [CrossRef]
- Wang, S.C.; Zhang, C.L.; Huang, Y.H.; Liu, Q.S.; Zhu, W. Study of diversification of water contents in dredged sediment storage yard. Rock Soil Mech. 2010, 31, 2823–2828. [Google Scholar]
- Wu, X.C.; Sun, Y.C.; Ding, J.W.; Ji, F. Survey and experiment on three dredging mud storage sites in the East Route of the South to North Water Diversion Project. Adv. Sci. Technol. Water Resour. 2012, 32, 47–50. [Google Scholar]
- Wang, L.; Zhu, W.; Xie, J.; Li, L.; Zhang, C. Study of the shear strength of sediments in main sedimentation stages. Mar. Georesources Geotechnol. 2015, 33, 556–566. [Google Scholar] [CrossRef]
- Cai, Z.; Qiao, S.; Tan, J.; Liu, Y. Study on characteristics and spatial heterogeneity of deep silt soft soil in Nansha Port Are. Chin. J. Underfound. Space Eng. 2023, 19, 897–910. [Google Scholar]
- Guo, X.Q.; Zhu, B.; Liu, J.C. Experimental study of undrained shear strength and cyclic degradation behaviors of marine clay in Pearl River Estuary. Rock Soil Mech. 2016, 37, 1005–1012. [Google Scholar]
- Jiang, S.H.; Huang, J.S. Modeling of non-stationary random field of undrained shear strength of soil for slope reliability analysis. Soils Found. 2018, 58, 185–198. [Google Scholar] [CrossRef]
- Wu, Y.; Gao, Y.; Li, D.; Xu, C.; Mahfouz, A.H. Study of the approximate approaches to the POD based spectral representation method. Sci. China-Technol. Sci. 2013, 56, 970–979. [Google Scholar] [CrossRef]
- JGJ 106-2014; Technical Code for Testing of Building Foundation Piles. Ministry of Housing and Urban-Rural Development: Beijing, China, 2014.
- Abate, G.; Fiamingo, A.; Massimino, M.R. Sustainable building: The role of the soil parameters on earthquake safety. In Proceedings of the International Scientific Conference Environmental Challenges in Civil Engineering, Opole, Poland, 26–28 September 2022; Springer International Publishing: Cham, Switzerland, 2022; pp. 32–47. [Google Scholar] [CrossRef]
- Forcellini, D. A 3-DOF system for preliminary assessments of the interaction between base isolation (BI) technique and soil structure interaction (SSI) effects for low-rise buildings. In Structures; Elsevier: Amsterdam, The Netherlands, 2024; Volume 59, p. 105803. [Google Scholar] [CrossRef]
- Liu, Y.; Lee, F.H.; Quek, S.T.; Chen, E.J.; Yi, J.T. Effect of spatial variation of strength and modulus on the lateral compression response of cement-admixed clay slab. Geotechnique 2015, 65, 851–865. [Google Scholar] [CrossRef]
- Li, J.; Tian, Y.; Cassidy, M.J. Failure Mechanism and Bearing Capacity of Footings Buried at Various Depths in Spatially Random Soil. J. Geotech. Geoenviron. Eng. 2014, 141, 333–345. [Google Scholar] [CrossRef]

| Soil Types | Common Interest | Literature Sources |
|---|---|---|
| Soft soil in Nansha Port Area | Su = 0.780z | Cai et al. [18] |
| Soft soil in the Pearl River Estuary (PRE) | Su = 0.405z | Guo et al. [19] |
| Soil | High h (m) | Density γ (g/m3) | Cohesion c (kPa) | Friction φ (°) | Elastic Modulus E (MPa) | Poisson’s Ratio υ |
|---|---|---|---|---|---|---|
| The backfill soil | 8 | 1.80 | 35 | 0 | 9.8 | 0.35 |
| Gravel | 6 | 1.90 | 0 | 30 | 45 | 0.25 |
| Sandy gravelly clay | 6 | 1.85 | 22 | 26 | 50 | 0.25 |
| Working Condition Group | μSu (kPa) | COV | kv (kPa/m) | θ2 (m) | θ1 (m) | kh (kPa/m) | Pile No. |
|---|---|---|---|---|---|---|---|
| A | 30, 35, 40 | 0.3 | 0.6 | 4 | 40 | 0.05 | I |
| B | 35 | 0.1, 0.3, 0.5 | 0.6 | 4 | 40 | 0.05 | I |
| C | 35 | 0.3 | 0.4, 0.6, 0.8 | 4 | 40 | 0.05 | I |
| D | 35 | 0.3 | 0.6 | 2, 4, 6, 8 | 40 | 0.05 | I |
| E | 35 | 0.3 | 0.6 | 4 | 40 | 0.02, 0.05, 0.08 | I |
| F | 35 | 0.3 | 0.6 | 4 | 40 | 0.02, 0.05, 0.08 | II |
| G | 35 | 0.3 | 0.6 | 4 | 40 | 0.02, 0.05, 0.08 | III |
| H | 35 | 0.3 | 0.6 | 4 | 40 | 0.02, 0.05, 0.08 | IV |
| kh (kPa/m) | μQ/kPa | R2 | Range |
|---|---|---|---|
| 0.02 | μQ = −6.3046x + 1039.5 | 0.9779 | 0 ≤ x ≤96 |
| 0.05 | μQ = −15x + 1046.7 | 0.9983 | 0 ≤ x ≤96 |
| 0.08 | μQ = −23.259x + 1045.3 | 0.9916 | 0 ≤ x ≤96 |
| Region | Pile Length | Design Basis |
|---|---|---|
| Near zone (0–30 m) | 11.1 m | Meets bearing capacity requirements and achieves optimal economy |
| Middle zone (30–60 m) | 11.2 m | Compensates for the gradient effect on soil strength, ensuring the predefined reliability |
| Far zone (60–96 m) | 11.3 m | Overcomes the attenuation effect of soil parameters in distant areas, ensuring stability of bearing capacity |
Disclaimer/Publisher’s Note: The statements, opinions and data contained in all publications are solely those of the individual author(s) and contributor(s) and not of MDPI and/or the editor(s). MDPI and/or the editor(s) disclaim responsibility for any injury to people or property resulting from any ideas, methods, instructions or products referred to in the content. |
© 2025 by the authors. Licensee MDPI, Basel, Switzerland. This article is an open access article distributed under the terms and conditions of the Creative Commons Attribution (CC BY) license (https://creativecommons.org/licenses/by/4.0/).
Share and Cite
Liu, H.; Zhu, D.; Bian, X.; Wang, Z.; Gu, J. Analysis of the Vertical Bearing Capacity of Pile Foundations in Backfill Soil Areas Based on Non-Stationary Random Field. Buildings 2025, 15, 1314. https://doi.org/10.3390/buildings15081314
Liu H, Zhu D, Bian X, Wang Z, Gu J. Analysis of the Vertical Bearing Capacity of Pile Foundations in Backfill Soil Areas Based on Non-Stationary Random Field. Buildings. 2025; 15(8):1314. https://doi.org/10.3390/buildings15081314
Chicago/Turabian StyleLiu, Hui, Danli Zhu, Xiaoya Bian, Zhaona Wang, and Jianfeng Gu. 2025. "Analysis of the Vertical Bearing Capacity of Pile Foundations in Backfill Soil Areas Based on Non-Stationary Random Field" Buildings 15, no. 8: 1314. https://doi.org/10.3390/buildings15081314
APA StyleLiu, H., Zhu, D., Bian, X., Wang, Z., & Gu, J. (2025). Analysis of the Vertical Bearing Capacity of Pile Foundations in Backfill Soil Areas Based on Non-Stationary Random Field. Buildings, 15(8), 1314. https://doi.org/10.3390/buildings15081314