Study Protocol

Application Research on Cable Force Optimization of Cable-Stayed Bridge Based on Improved Grey Wolf Algorithm

1
School of Civil Engineering, Lanzhou Jiaotong University, Lanzhou 730070, China
2
China Railway Third Engineering Group Sixth Engineering Co., Ltd., Jinzhong 030600, China
3
Faculty of Information Technology, Monash University, Clayton Campus, Wellington Rd, Clayton, VIC 3800, Australia
*
Author to whom correspondence should be addressed.
Buildings 2025, 15(8), 1309; https://doi.org/10.3390/buildings15081309
Submission received: 17 February 2025 / Revised: 11 April 2025 / Accepted: 13 April 2025 / Published: 16 April 2025
(This article belongs to the Section Building Structures)

Abstract

For complex structures, the solution process of existing cable force optimization methods for low-tower cable-stayed bridges is characterized by a significant number of matrix operations, which require substantial computing power and time. As a result, achieving a more accurate solution becomes exceedingly difficult. To tackle this challenge, we propose a new cable force optimization method that enhances the stress distribution of the cable-stayed cables in the completed state of the bridge. This approach minimizes the need for frequent adjustments to cable forces and alterations to the linear elevation of the beam bridge during construction. In this study, the low-tower cable-stayed bridge of the Lanjiang Bridge serves as the engineering background. By integrating finite element analysis with a multi-objective optimization method, we propose an optimization approach for the real-time correction of cable forces during the construction of long-span low-tower cable-stayed bridges. Within this optimization framework, the cable forces during construction are treated as variable parameters, while the linear elevation of the completed bridge is imposed as a constraint. The improved grey wolf algorithm is integrated with the finite element algorithm, and the key parameters of the support vector machine are optimized using this method, resulting in the optimal parameter combination predicted based on the training samples. The results indicate that after optimizing the support vector machine model using the improved grey wolf algorithm, the cable force distribution of the cable-stayed cables becomes more uniform, with a variance of 19.96. Additionally, the maximum displacement change of the main beam under the influence of the dead load is reduced by 33.48%. This method demonstrates high optimization efficiency and produces favorable outcomes, highlighting its value in calculating cable forces and guiding construction processes during the erection of cable-stayed cables for similar bridges.

1. Introduction

In recent years, low-pylon cable-stayed bridges have gained popularity due to their lightweight structures, material efficiency, and adaptability for medium-span applications. These features allow for effective extension of bridge spans while ensuring excellent structural performance. However, as composite system bridges, low-pylon cable-stayed bridges demonstrate greater stiffness in their main girders compared with traditional cable-stayed bridges. Additionally, the cable-free zones near the side spans and tower roots are elongated, resulting in an uneven distribution of cable forces. Consequently, determining appropriate cable forces during both construction and operation presents a significant challenge.
Extensive research has been conducted by numerous scholars to address this issue, resulting in the proposal of various optimization methods. For instance, cable force optimization was achieved by Fan Lichu [1] and colleagues through bending moment control. Xiao Rucheng’s team [2,3] introduced the influence matrix method to simultaneously solve cable force problems in both completed bridge and construction states. Yan Donghuang [4,5] and his team developed a step-by-step algorithm that combines multiple techniques to determine the optimal completion state of concrete cable-stayed bridges. Liang Peng [6] and his colleagues approximated minimum bending energy through stiffness adjustments. Additionally, the minimum cable consumption was set as the objective, and nonlinear planning with deformation constraints was conducted by Baldomir A [7]. A multi-parameter optimization model was developed by Martins A [8] through a comprehensive consideration of stress and deformation constraints. Furthermore, factors such as the most unfavorable load combination effects, the minimum total cost of cables and prestressed tendons, and post-tensioning technology have been taken into account for optimization by various scholars [9,10,11,12,13].
To address the limitations of conventional methods—such as intensive matrix operations and high computational demands for complex structures—researchers have explored mathematical optimization approaches. Yan Li et al. [14] established a constrained quadratic programming model, which was solved using MATLAB. Guo Zhongqun [15] implemented a cable force optimization method based on the feasible region approach, also utilizing MATLAB. Liu Yiming [16] proposed a dead-load cable force optimization technique that integrates MATLAB R2013a with ANSYS 14.5. J. Zhang [17] introduced a kriging surrogate model to reduce finite element computation time. Yin Xun-qiang [18] employed a new strongly sub-feasible sequential quadratic programming (SQP) method for automated cable force optimization. Wang et al. [19] developed programs that utilize dynamic weighted coefficients to solve multi-objective mathematical models.
With advancements in computer technology, intelligent optimization algorithms—including neural networks, particle swarm optimization (PSO), and genetic algorithms (GAs)—have been increasingly applied to the optimization of cable forces in low-pylon cable-stayed bridges. Wu Xiao et al. [20] addressed cable force challenges by minimizing bending strain energy through an improved GA. Jiang Zengguo [21] optimized cable forces using an enhanced PSO algorithm. Wang Junhai [22] modified the imperial competition algorithm and integrated penalty functions with finite element analysis. Ma Guang [23] incorporated simulated annealing into GA to develop an unconstrained optimization model. Kambin [24] combined tabu search with standard PSO to create an improved algorithm. Li Bo [25] enhanced GA with an elite reservation mechanism for cable force optimization. Wang Tao [26] integrated GA and finite element algorithms to construct three-dimensional models for optimization. Xiong Hui-Zhong et al. [27] proposed an improved PSO algorithm for diagonal tension optimization in bridge structures. Wang Lifeng et al. [28] embedded the influence matrix into a multi-objective PSO algorithm with mutation operations, incorporated fuzzy set theory, and selected Pareto solutions for the optimization of cable-stayed bridges. Yue F. et al. [29] combined the influence matrix method with genetic algorithms (GAs). Ha et al. [30] developed a coupling approach that integrates nonlinear inelastic analysis with micro-GAs, utilizing unit load matrices to establish mapping relationships between cable forces and internal forces. Zarbaf et al. [31] integrated GA and PSO, introduced cable force error functions, considered sag effects, and enhanced result reliability through statistical analysis. Zhang Dong [32] proposed a multi-tower cable-stayed bridge optimization method based on a back propagation (BP) neural network combined with GSL-PS-PGSA. Guo Junjun [33] applied differential evolution for cable force optimization. Kaijie Huang [34] combined joint analytical methods with GAs for multi-tower cable optimization. Zhong Zhenxiao [35] investigated the determination of the stress-free cable length, examined the impact of temperature on the construction process, and analyzed the effect of the stiffness of the hanging basket on the construction of the cable-stayed bridge.
The grey wolf algorithm (GWO) [36] decomposes complex problems into subsets assigned to agents, mimicking the hierarchical behavior of grey wolves. After generating solutions, these are ranked to derive optimal results. Compared with other algorithms, GWO demonstrates faster optimization due to its strategy of prioritizing solution generation followed by comparative ranking. In this study, we propose an optimization method for real-time cable force monitoring and adjustment in the main girder of the Lanjiang Bridge, which combines actual tension measurements with an improved GWO. A support vector machine (SVM) model is established with the objectives of minimizing cable force increments and changes in beam displacement, optimized using the enhanced GWO.

2. Improved Grey Wolf Algorithm Cable Force Optimization Theory

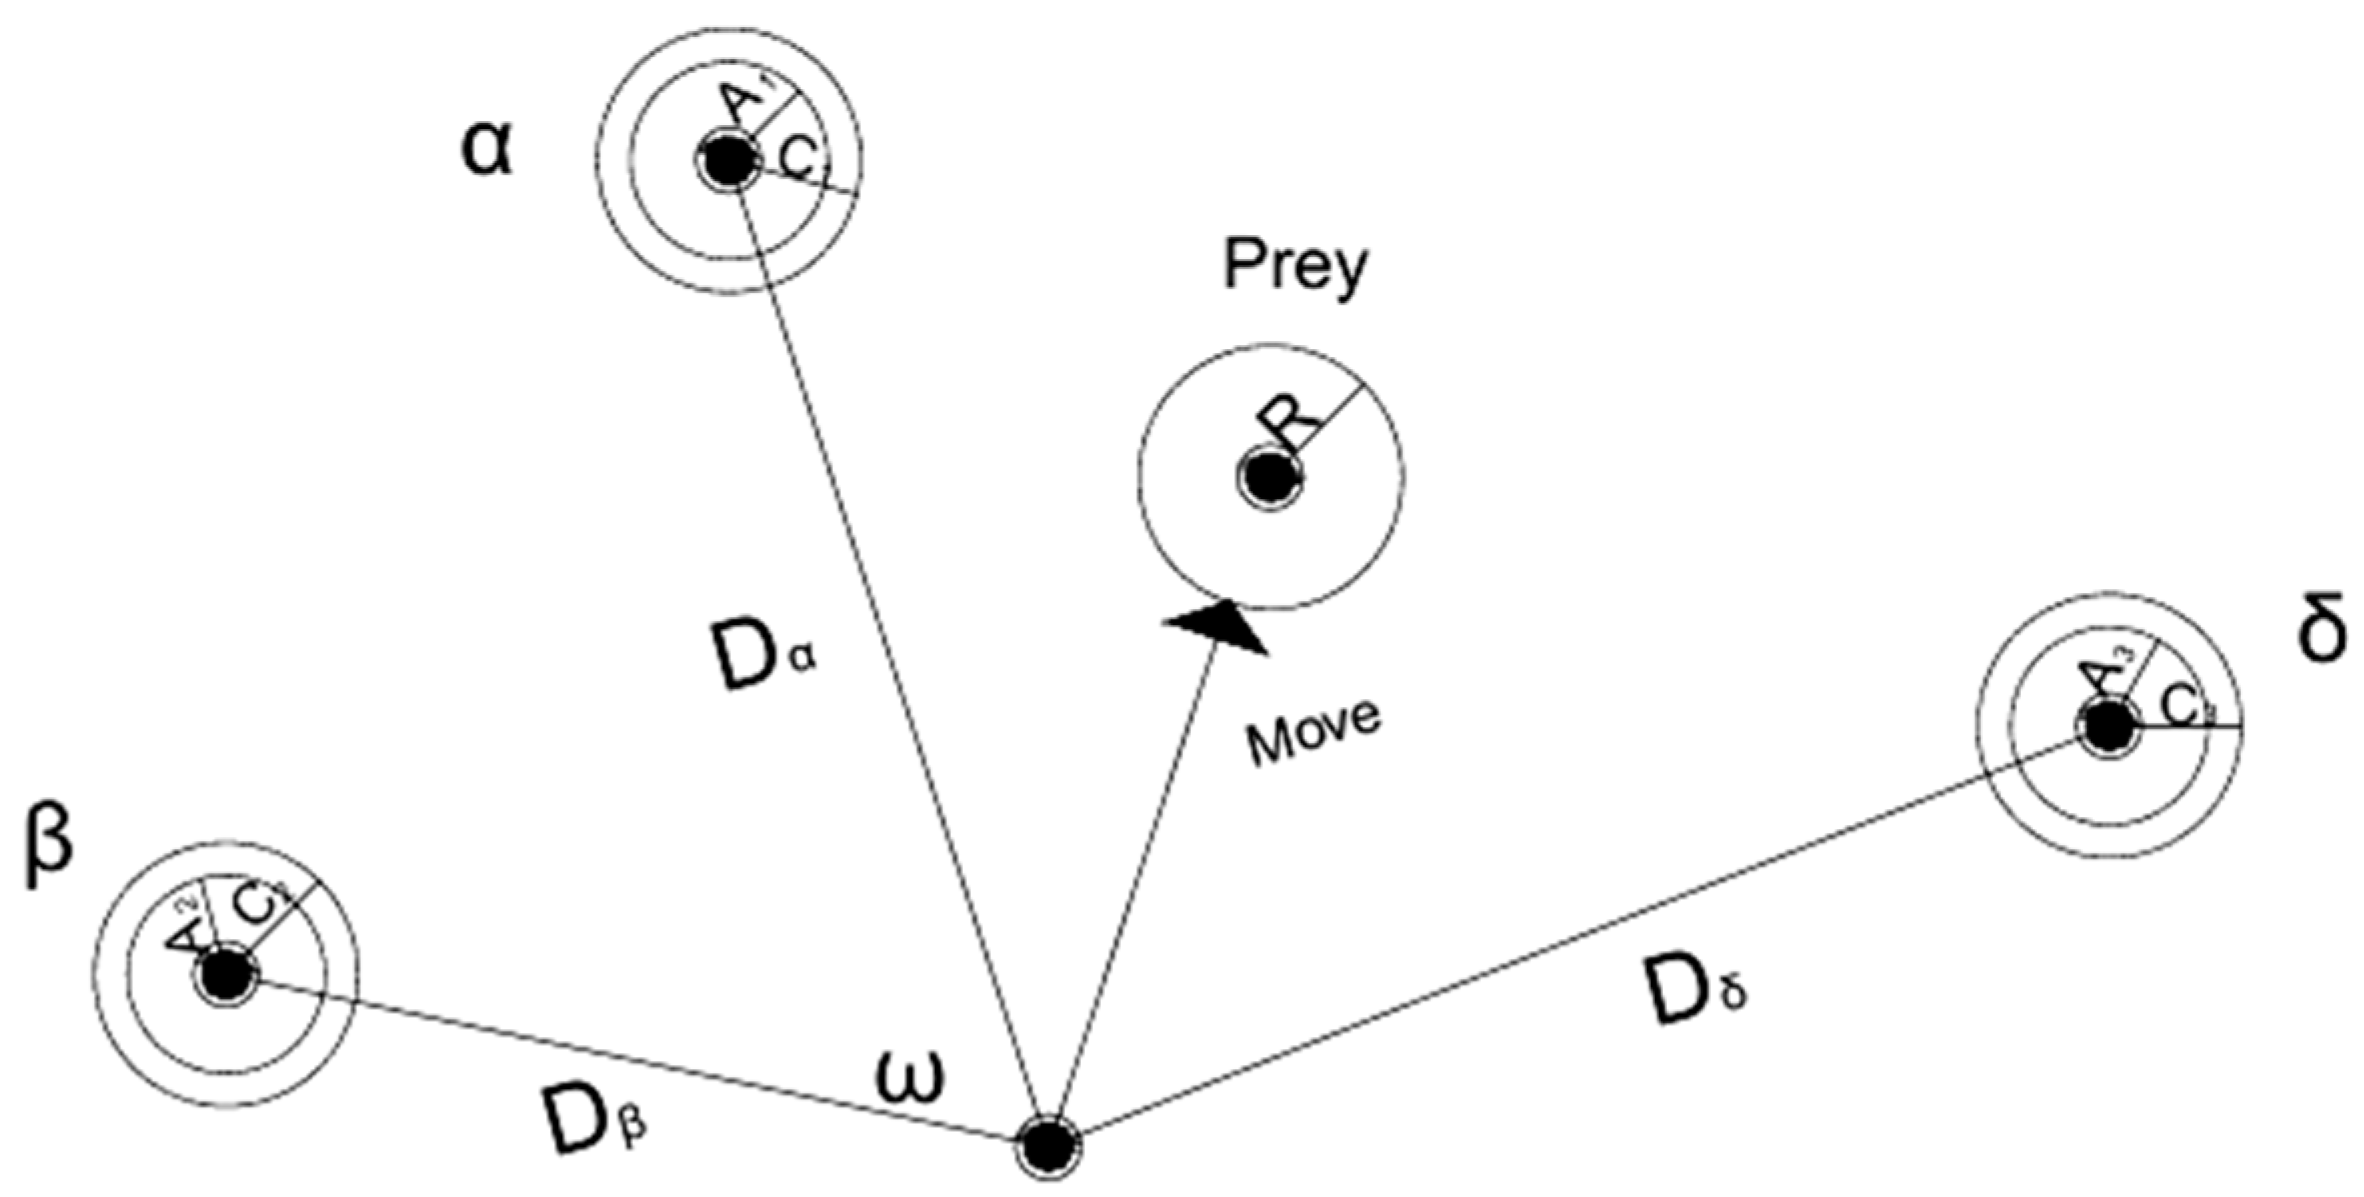
2.1. Standard Grey Wolf Algorithm

In the standard GWO algorithm, there are three wolves (α, β, δ) among the wolves to guide other wolves (ω) to find prey. The process of wolves looking for prey is the process of finding the optimal solution, which includes surrounding, hunting, and tracking prey, and its hunting process is shown in Figure 1.
According to the wolf’s leadership level, in the design of the GWO algorithm, α wolf is the optimal solution, β and δ wolves are the suboptimal solutions, and ω wolf is the candidate solution. In the implementation of the algorithm, the following equation is used to describe the behavior of the grey wolf population surrounding prey:
D = C · X p t X t
X t + 1 = X p t A · D
where D is the distance between the prey and the grey wolf; t is the current iteration number, A and C are coefficients, Xp(t) is the position vector of prey, and X(t) is the target position vector of the grey wolf. The values of coefficients A and C are:
A = 2 a r 1 a
C = 2 r 2
a = 2 1 t t m a x
where a is the distance control coefficient, which linearly decreases from 2 to 0 in the iterative process as shown in Equation (5), and r1 and r2 are random numbers in [0, 1].
The guiding behavior of grey wolves in hunting can be expressed by the following model:
D α = C 1 X α X D β = C 1 X β X D δ = C 1 X δ X
X 1 = X α A 1 · D α X 2 = X β A 2 · D β X 3 = X δ A 3 · D δ
X t + 1 = ( X 1 + X 2 + X 3 ) 3
In the GWO algorithm, when the coefficient is A > 1 , the grey wolf diverges to find prey. At that time, they converge to attack their prey. The value of coefficient C indicates the difficulty for the grey wolf to approach the prey. The greater the value of C, the more difficult it is for the grey wolf to approach the prey. The smaller the value of C, the easier it is for the grey wolf to approach the prey. When the grey wolf attacks the prey, the hunting is over.

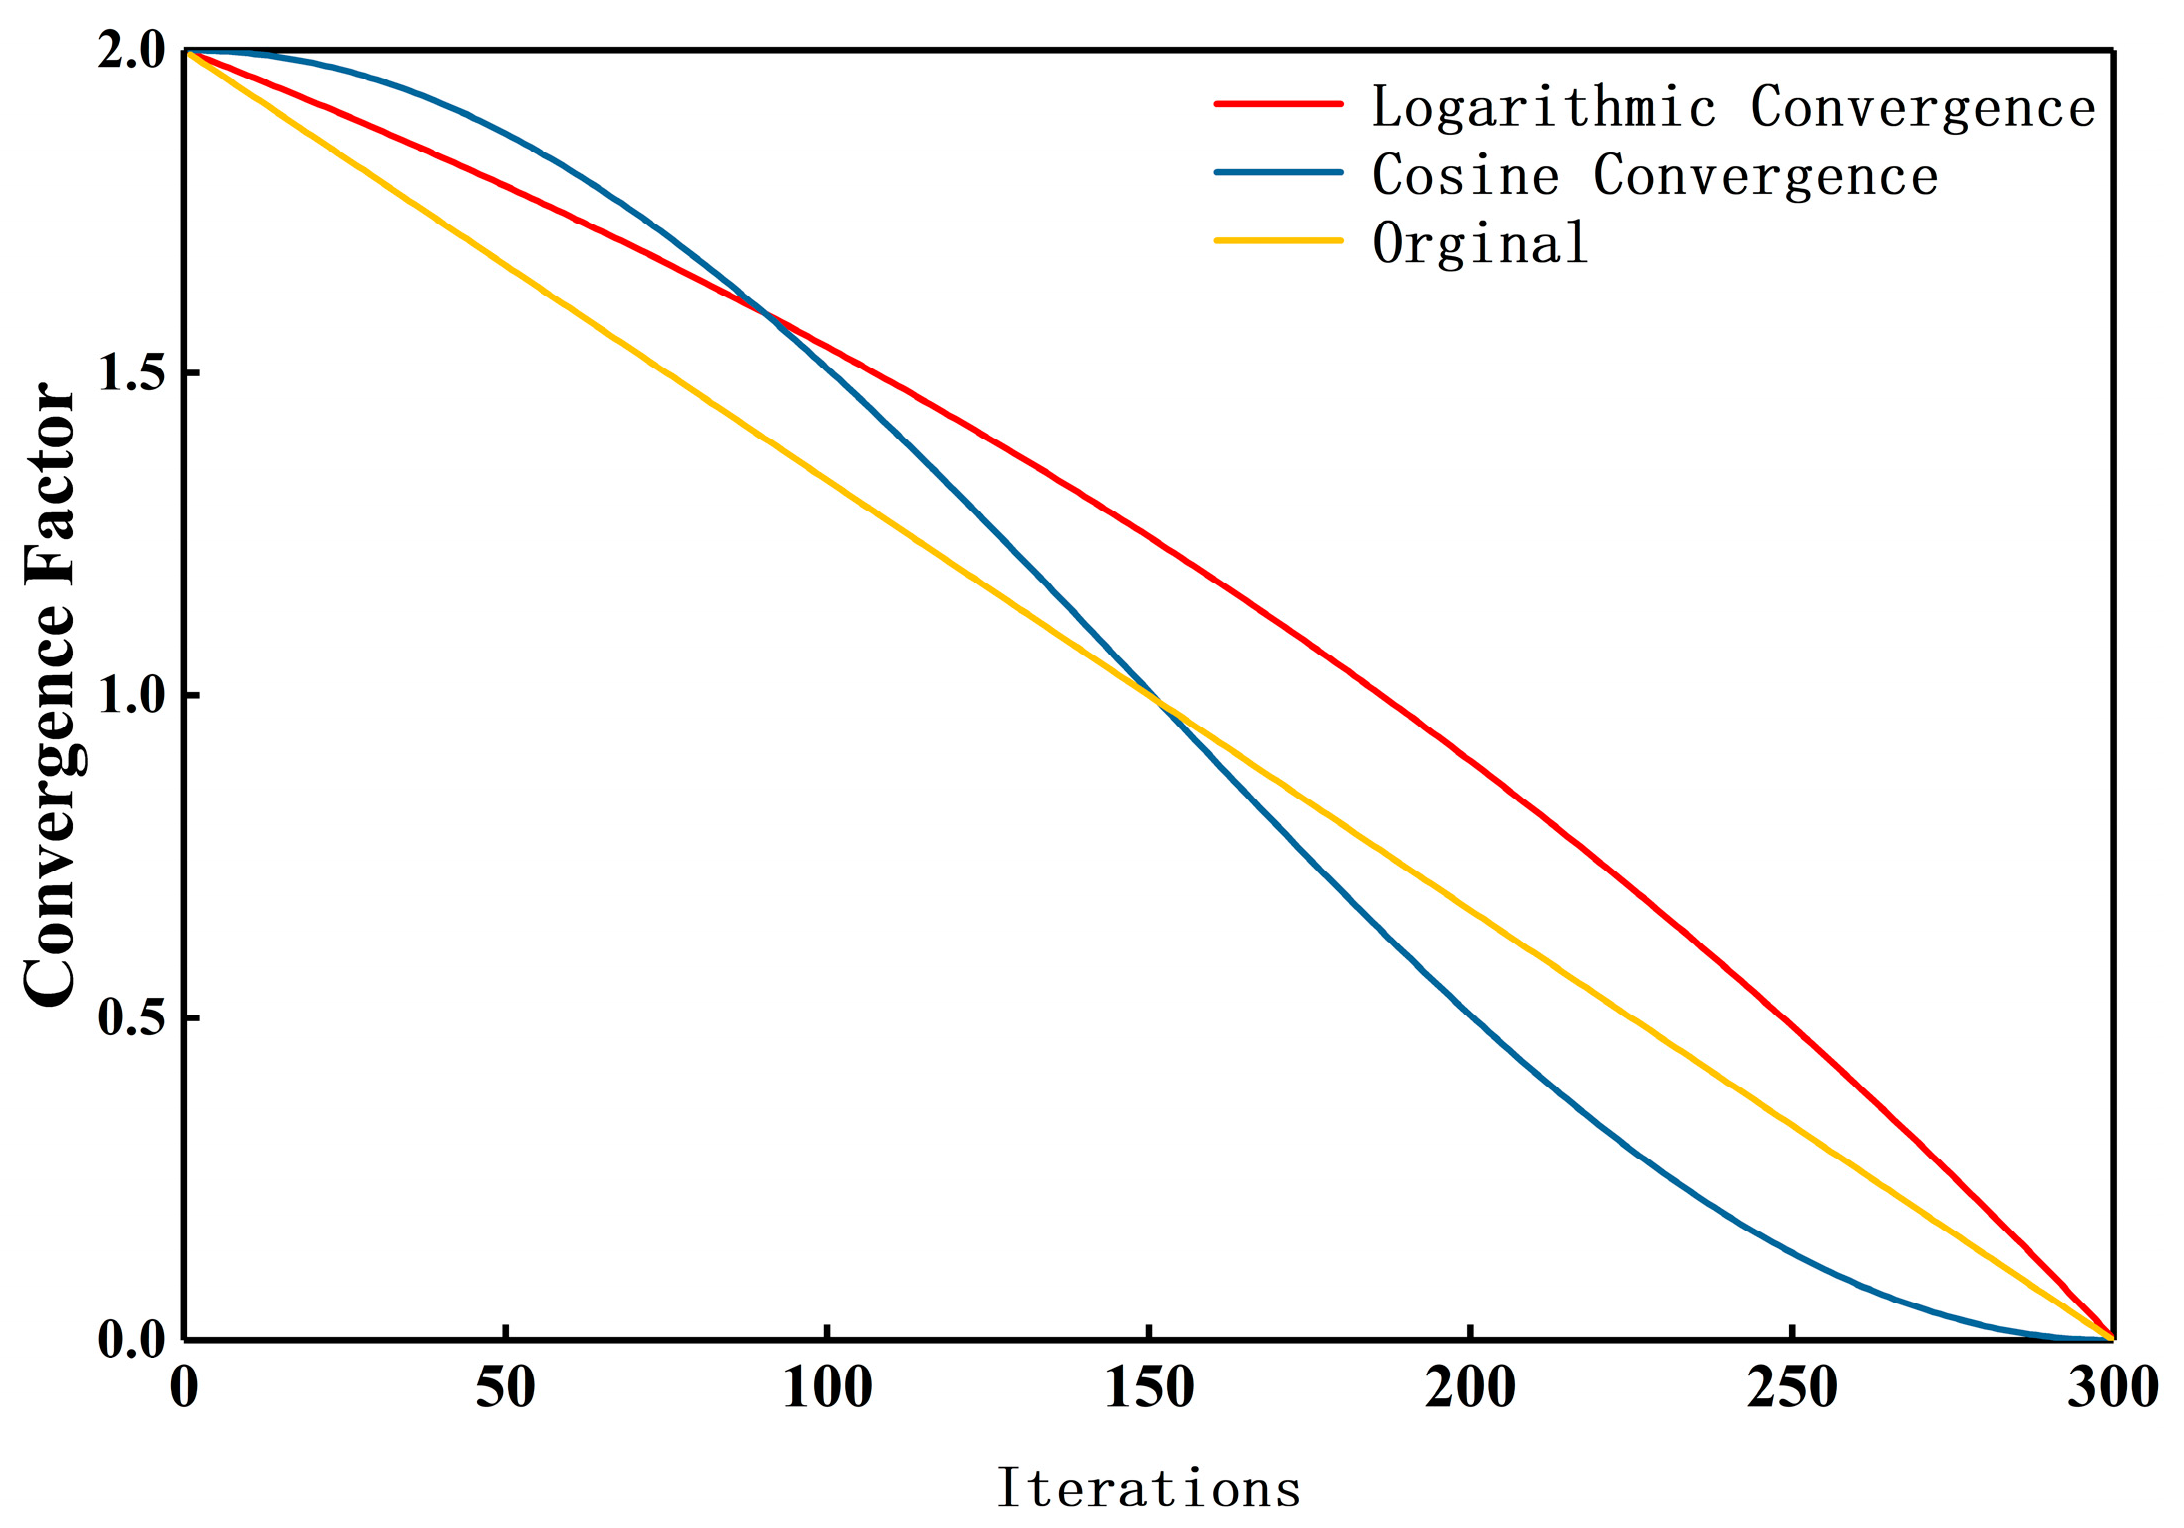
2.2. Improvement of Grey Wolf Algorithm

The usual improvement strategies of swarm intelligence optimization algorithm mainly focus on two aspects: one is to improve the initialization strategy of population to ensure that the population is evenly distributed in the search space as much as possible in the initialization stage to prevent the algorithm from missing the global optimal solution. Another improvement strategy is mainly aimed at the improvement of individual search methods and evolutionary strategies. In this paper, two improvement strategies are used to improve the grey wolf algorithm at the same time [37,38,39,40,41,42,43].
(1) Chaotic mapping
Chaotic sequencing [37,38,40] has good ergodicity and randomness, and chaotic mapping can generate random numbers with [0, 1] uniform distribution, so that the initial population can make the best use of the information in the solution space, effectively improving the global search ability and optimization speed in the first and middle stages of the algorithm, and avoiding falling into the local optimal solution in the first and middle stages of the algorithm. According to the research of the literature, this paper adopts tent chaotic mapping to improve the random initialization method of the standard grey wolf algorithm, and the mapping formula is shown in Equation (9).
x t + 1 = 2 x t       ,     0 x t 0.5 2 1 x t ,     0.5 x t 1  
As shown in Figure 2, after a certain number of iterations of chaotic mapping calculation, the population distribution is more uniform, and the population distribution is the best when the number of iterations is about 300.
(2) Convergence factor
The balance between exploration and development in GWO is determined by control parameter A. As shown in Formula (5), A linearly decreases from 2 to 0 in the optimization process, and this linear convergence factor does not conform to the actual convergence process of the algorithm. With the increasing number of iterations, the control coefficient shows a linear decreasing trend in the middle and late stages of the algorithm, which seriously affects the population diversity and global search ability of wolves in the late stage of the algorithm. In order to prevent the population from jumping out of the local extremum region in the middle and late stages of the algorithm, the convergence factor needs to be improved.
① Logarithmic convergence value as shown in Formula (10) [39]:
a = 2 · 1 1 e 1 e t t m a x 1
where t is the number of iterations and t m a x is the maximum number of iterations.
② The value of cosine convergence factor is shown in Formula (11) [41,42,43]:
a = a min + a max a min 1 2 1 + cos t 1 π t max 1 n , t 0.5 t max a min + a max a min 1 2 1 cos t 1 π t max 1 n , 0.5 t max t t max
where a m i n and a m a x represent the minimum and maximum values of the convergence factor, respectively, with a m a x set to 2 and a m i n set to 0 in this paper; n is the decay exponent, where 0 < n 1 ; and t m a x denotes the maximum number of iterations.
The change in convergence factor is shown in Figure 3. The original convergence factor a decreases linearly, while the logarithmic and cosine convergence factors exhibit nonlinear changes. The cosine convergence factor has the slowest decay in the early stage improvement of a, which keeps A at a high value for a long time. The fastest reduction speed in the later stage is beneficial for local development and improves optimization accuracy. The nonlinear convergence factor is more in line with the actual convergence process, balancing global and local searches and enhancing the algorithm’s global optimization ability.
In this paper, the strategy of introducing the cosine convergence factor and chaotic mapping is selected to improve the grey wolf algorithm. The nonlinear convergence factor can dynamically balance the search ability of the algorithm, and chaotic mapping makes the initial population use the information in the solution space as much as possible. The improved grey wolf algorithm is superior to the unmodified standard algorithm in convergence speed and convergence accuracy.

2.3. Improved Grey Wolf Algorithm Cable Force Optimization Method for Cable-Stayed Bridges

In this paper, the displacement of the main girder during the construction process is treated as a variable parameter, while the displacement and unevenness of the deck after the bridge’s completion are established as constraint conditions. The objective function incorporates the main girder displacement and the increments in cable forces during construction. By optimizing this function, the cable forces and displacements at each post-closure stage are calculated. A relevant algorithm program is developed using MATLAB 2022a software, and the improved grey wolf optimization (IGWO) algorithm is employed to optimize the cable forces of the completed bridge. The optimization process is structured as follows:
(1)
The mathematical model for optimizing cable forces in a low-pylon cable-stayed bridge has been established. Structural modeling and stress analysis during construction are conducted using Midas Civil 2023, in accordance with the structural design parameters, to extract relevant data for the mathematical model.
(2)
The coding method has been selected, and an optimization model for the key parameters of the support vector machine (SVM) linear prediction has been established. The parameters (c, g) of the vector machine to be optimized are converted into the coordinates of grey wolf individuals within the search space. Sixty-two groups of cable force combination data are randomly generated within the reasonable upper and lower limits of the designed cable tensions. These datasets are then substituted into the finite element program of the low-pylon cable-stayed bridge to calculate the computed elevation of the main girder at each elevation control point.
(3)
The IGWO parameters for the SVM parameter optimization model have been initialized. The size of the grey wolf population is set at n = 100 , and the maximum number of iterations is set at t m a x = 300 . The parameters (c, g) to be optimized are encoded into the coordinates of the wolf group, and the grey wolf population is evenly distributed within the search space according to Equation (9).
(4)
The convergence factor is updated according to Equation (11). The fitness values of the grey wolf population are calculated, and the optimal fitness is assigned to the alpha wolf.
(5)
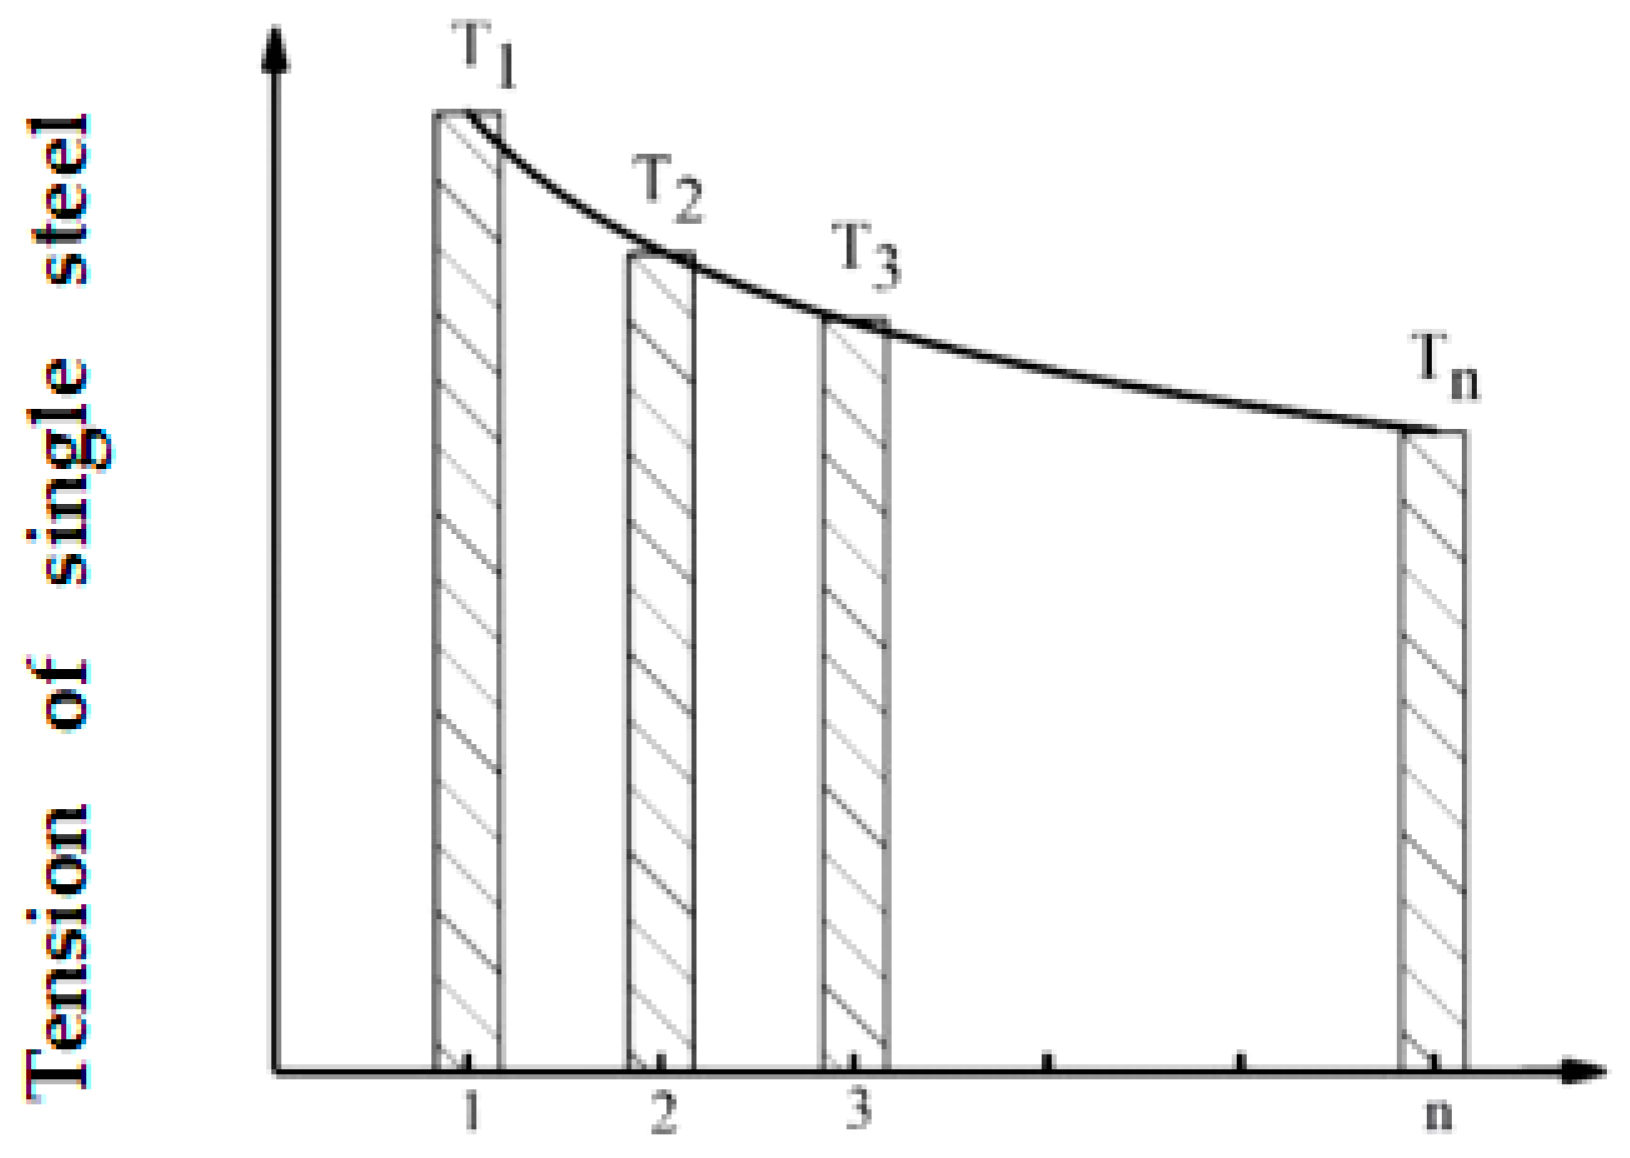
The algorithm’s completion is assessed by determining whether it has reached the maximum number of iterations. If it has not, the process returns to Step 4; if it has, the optimal parameter combination for the support vector machine (SVM) is output. The prediction accuracy of the updated SVM parameters is evaluated using cable force linear training samples. Prediction accuracy is defined as the mean squared error of the deviations between the predicted and actual linear shapes, as shown in Equation (12):
f f i t = 1 n i = 1 n x i x i ^ 2
where ffit denotes the individual fitness value of the grey wolf; xi signifies the predicted linear elevation of the i-th sample; x i ^ represents the calculated linear elevation of the i-th sample.
(6)
The accuracy of the SVM with updated parameters is evaluated. If the requirements are not met, the process returns to Step (3) for re-optimization. If the requirements are satisfied, the optimization of the SVM linear prediction model is considered complete.
(7)
The parameters of the IGWO combination optimization model are initialized, with the parameters to be optimized defined as the cable force combination T in the mathematical model represented by Equation (13). The population size of grey wolves is designated as n = 100 , and the maximum number of iterations is defined as t m a x = 300 . The cable force combination T is incorporated into the coordinates of the wolf group. The constraints on the cable force affecting the grey wolf population are established, and the chaos of the grey wolf population is mapped into the search space in accordance with Equation (9).
F i n d T = T 1 , T 2 , , T j T m i n X = 1 n i = 1 n x i u i 2 s . t . i = 1 16 T i T ¯ 2 16 1000 0 T i 6000   kN
where T represents the cable force input vector to be optimized; xi represents the actual elevation value of the i-th sample; ui represents the theoretical elevation design value of the i-th sample.
(8)
The cosine convergence factor is updated according to Equation (11), while the positions of the wolves in the search space are updated based on Equations (7) and (8).
(9)
The coordinates of the wolves are decoded, a linear prediction is made using the input vector of the support vector machine (SVM), and the fitness value of the grey wolf population is updated according to the calculation method of the objective function outlined in Equation (13).
(10)
It is assessed whether the termination condition of the algorithm—specifically, the maximum number of iterations—has been reached. If the maximum number of iterations has not been reached, the process returns to Step (7). If the maximum number of iterations is attained, the coordinates of the alpha wolf are output, decoded into the cable force combination T, and the results are imported into finite element software for the analysis of the bridge’s completion state. If the target bridge completion state meets the specified requirements, the target cable force for the bridge completion is obtained. If the requirements are not met, relevant parameters are modified, and the process is recalculated.
The specific flowchart is illustrated in Figure 4.

3. Applied Research

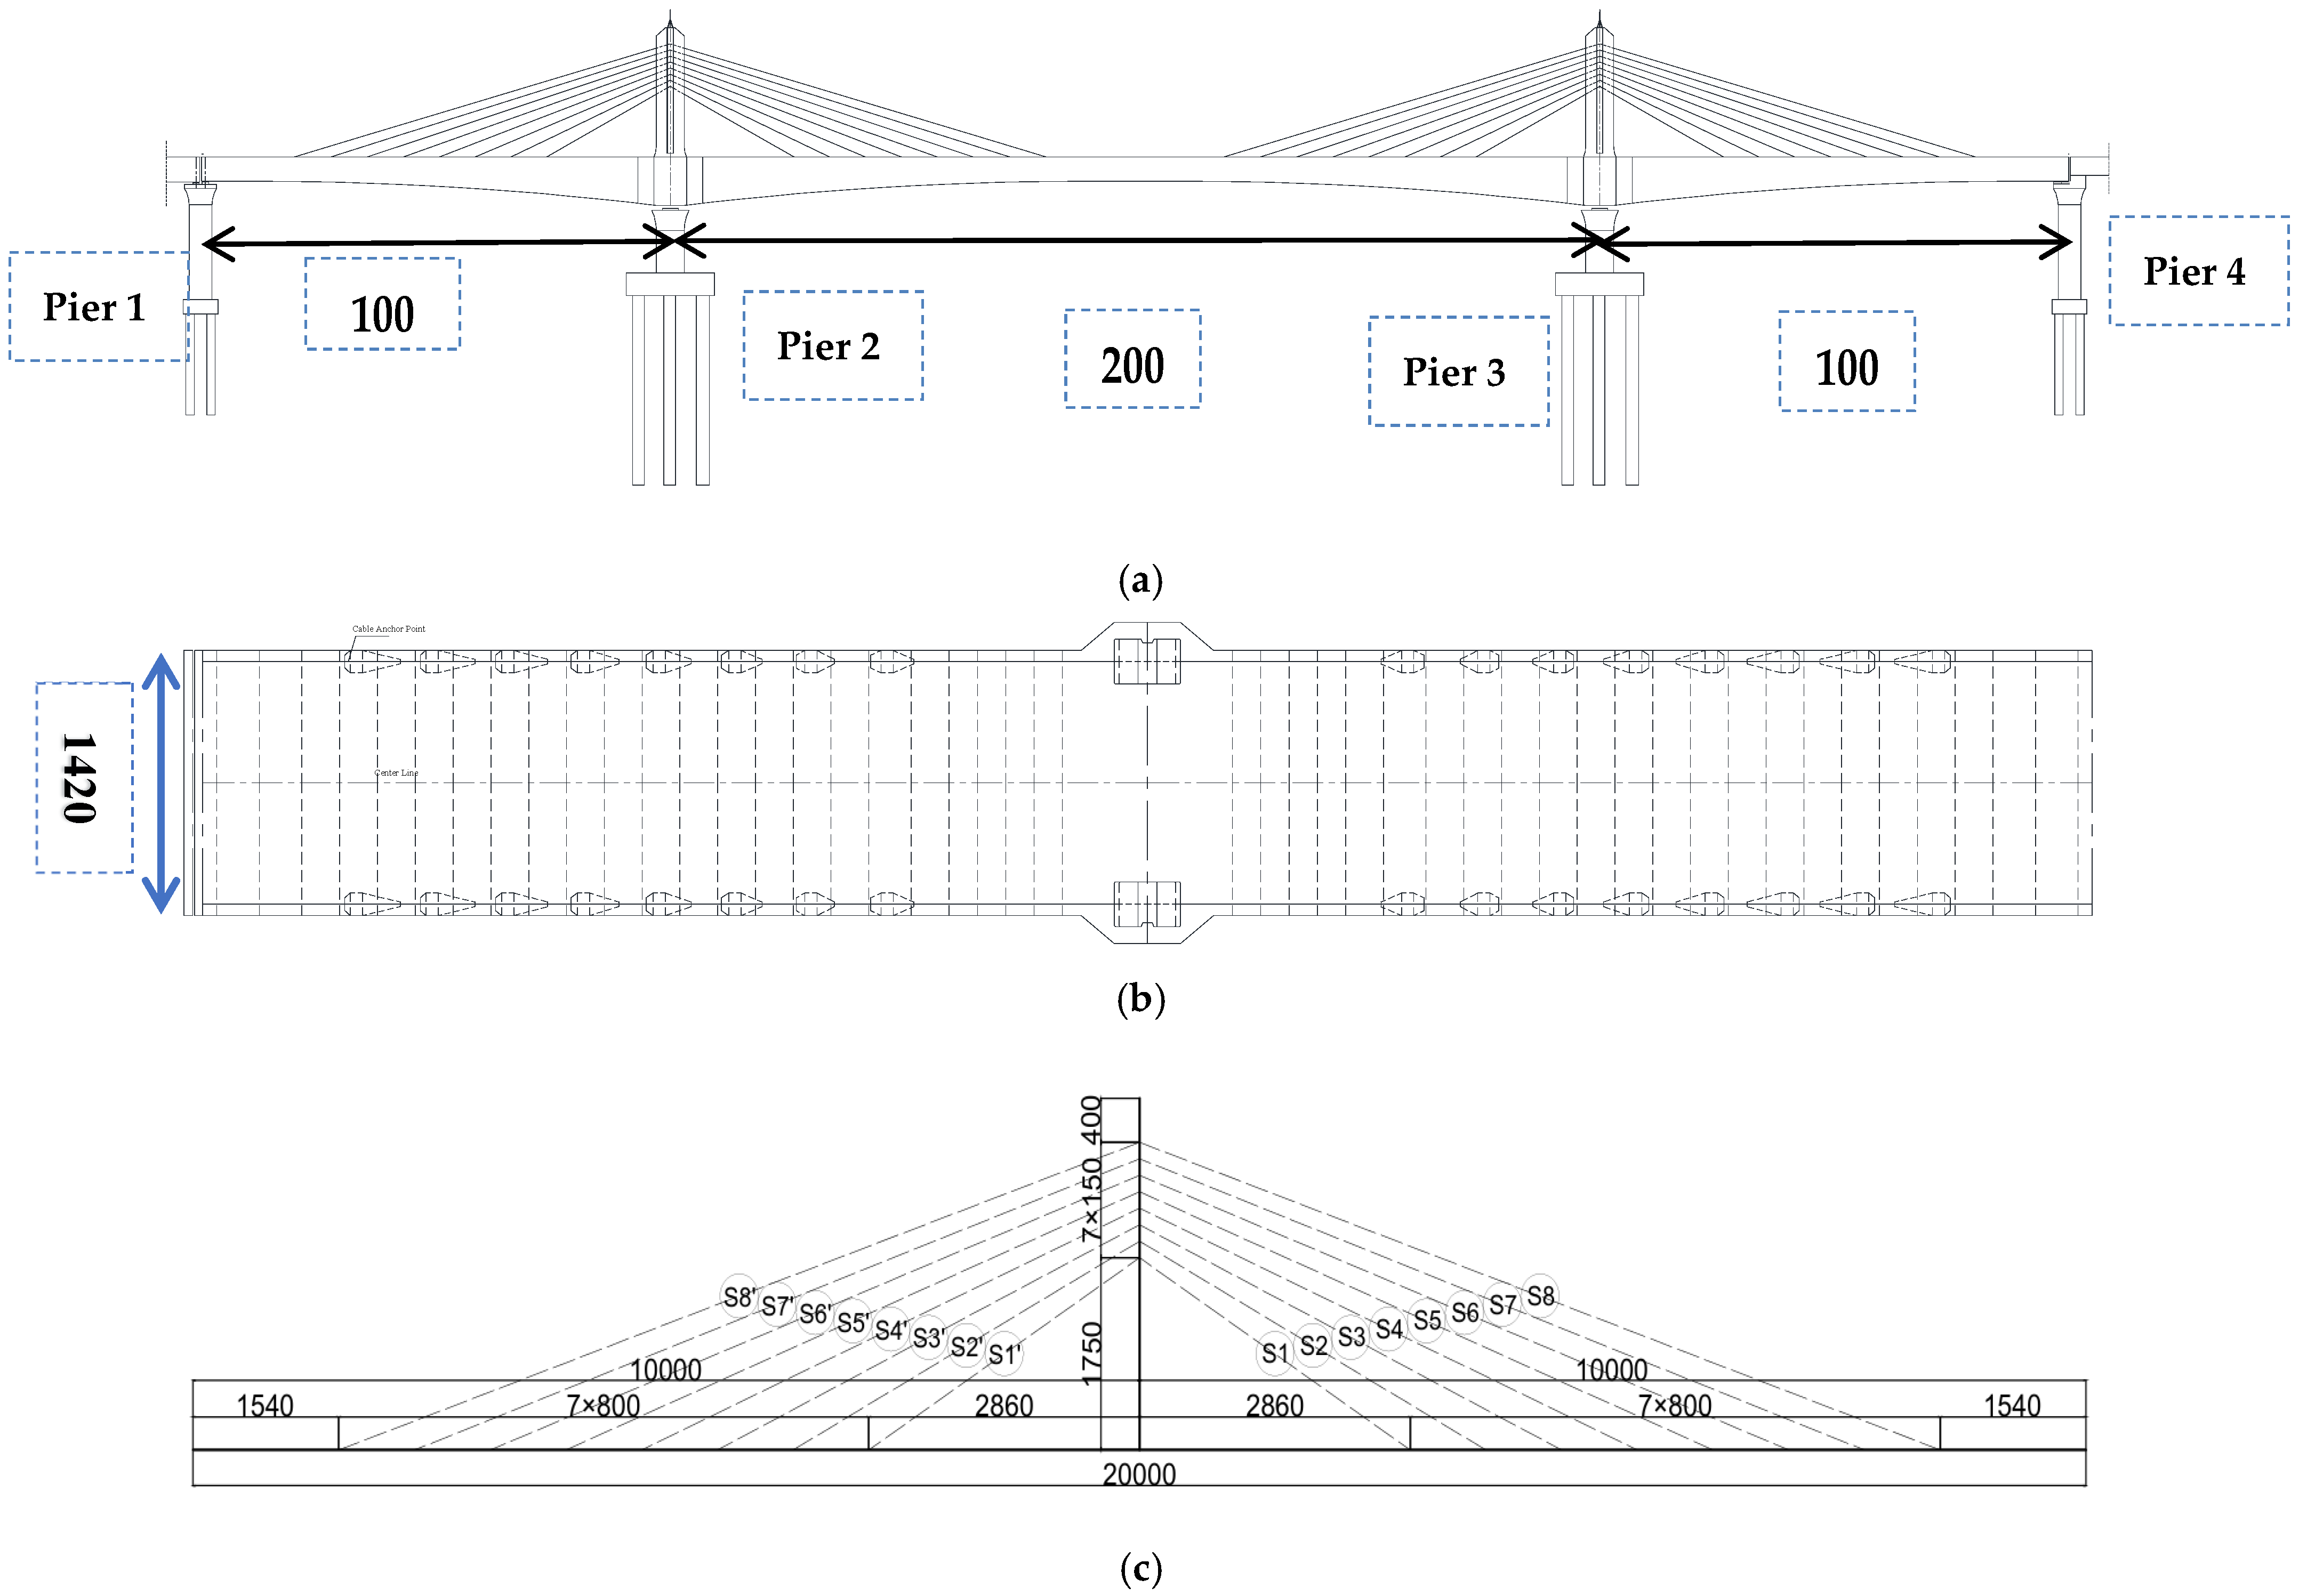
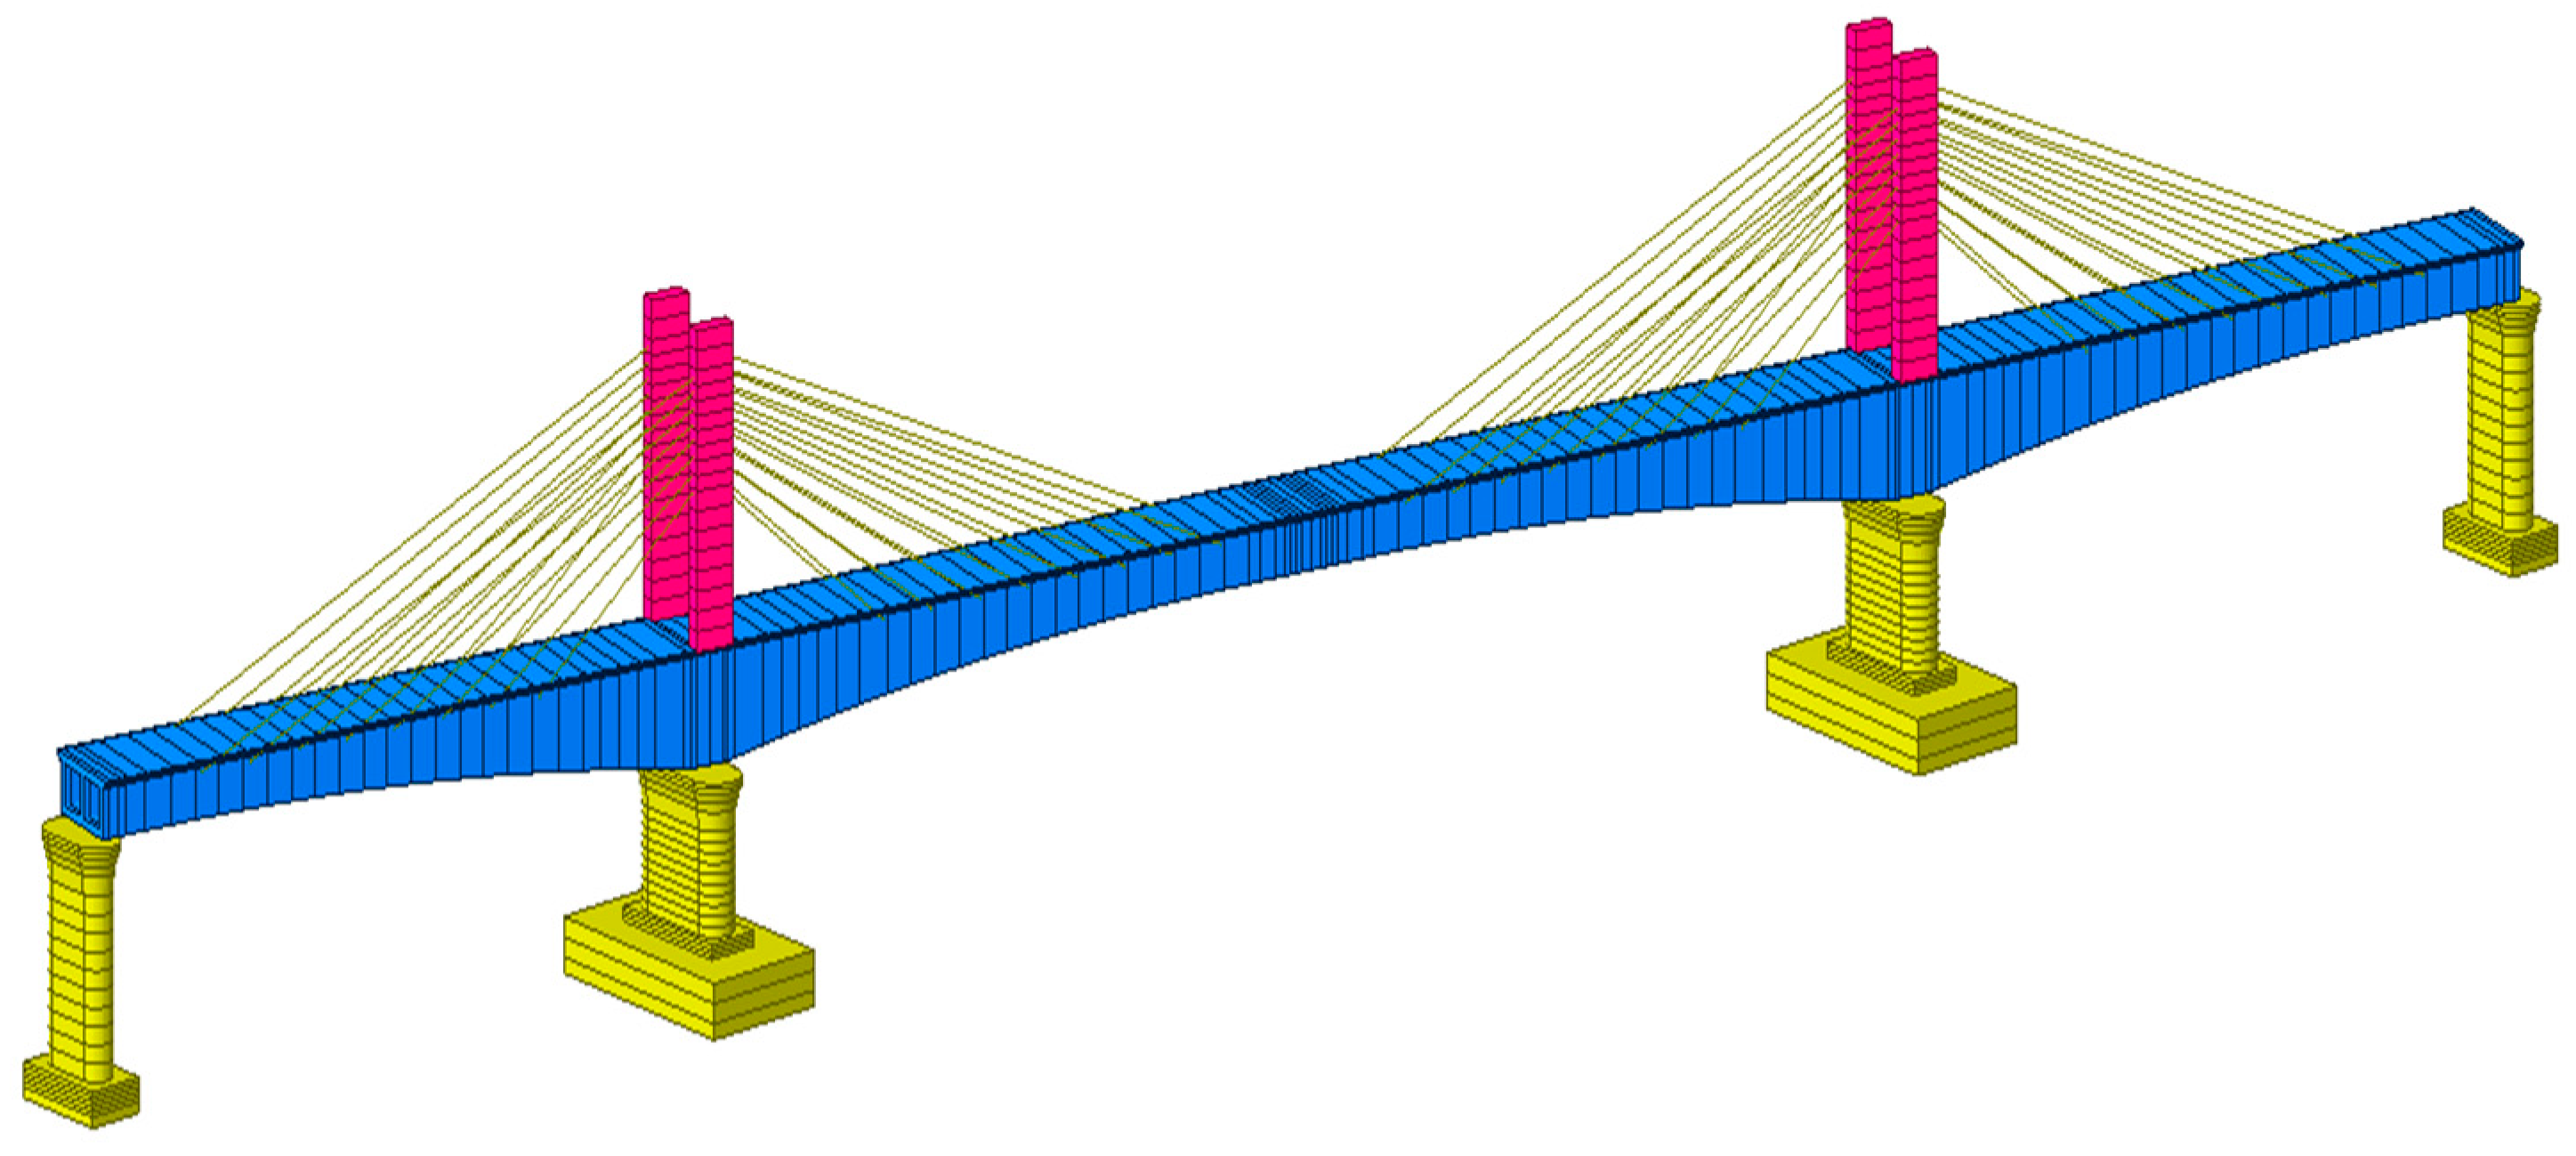
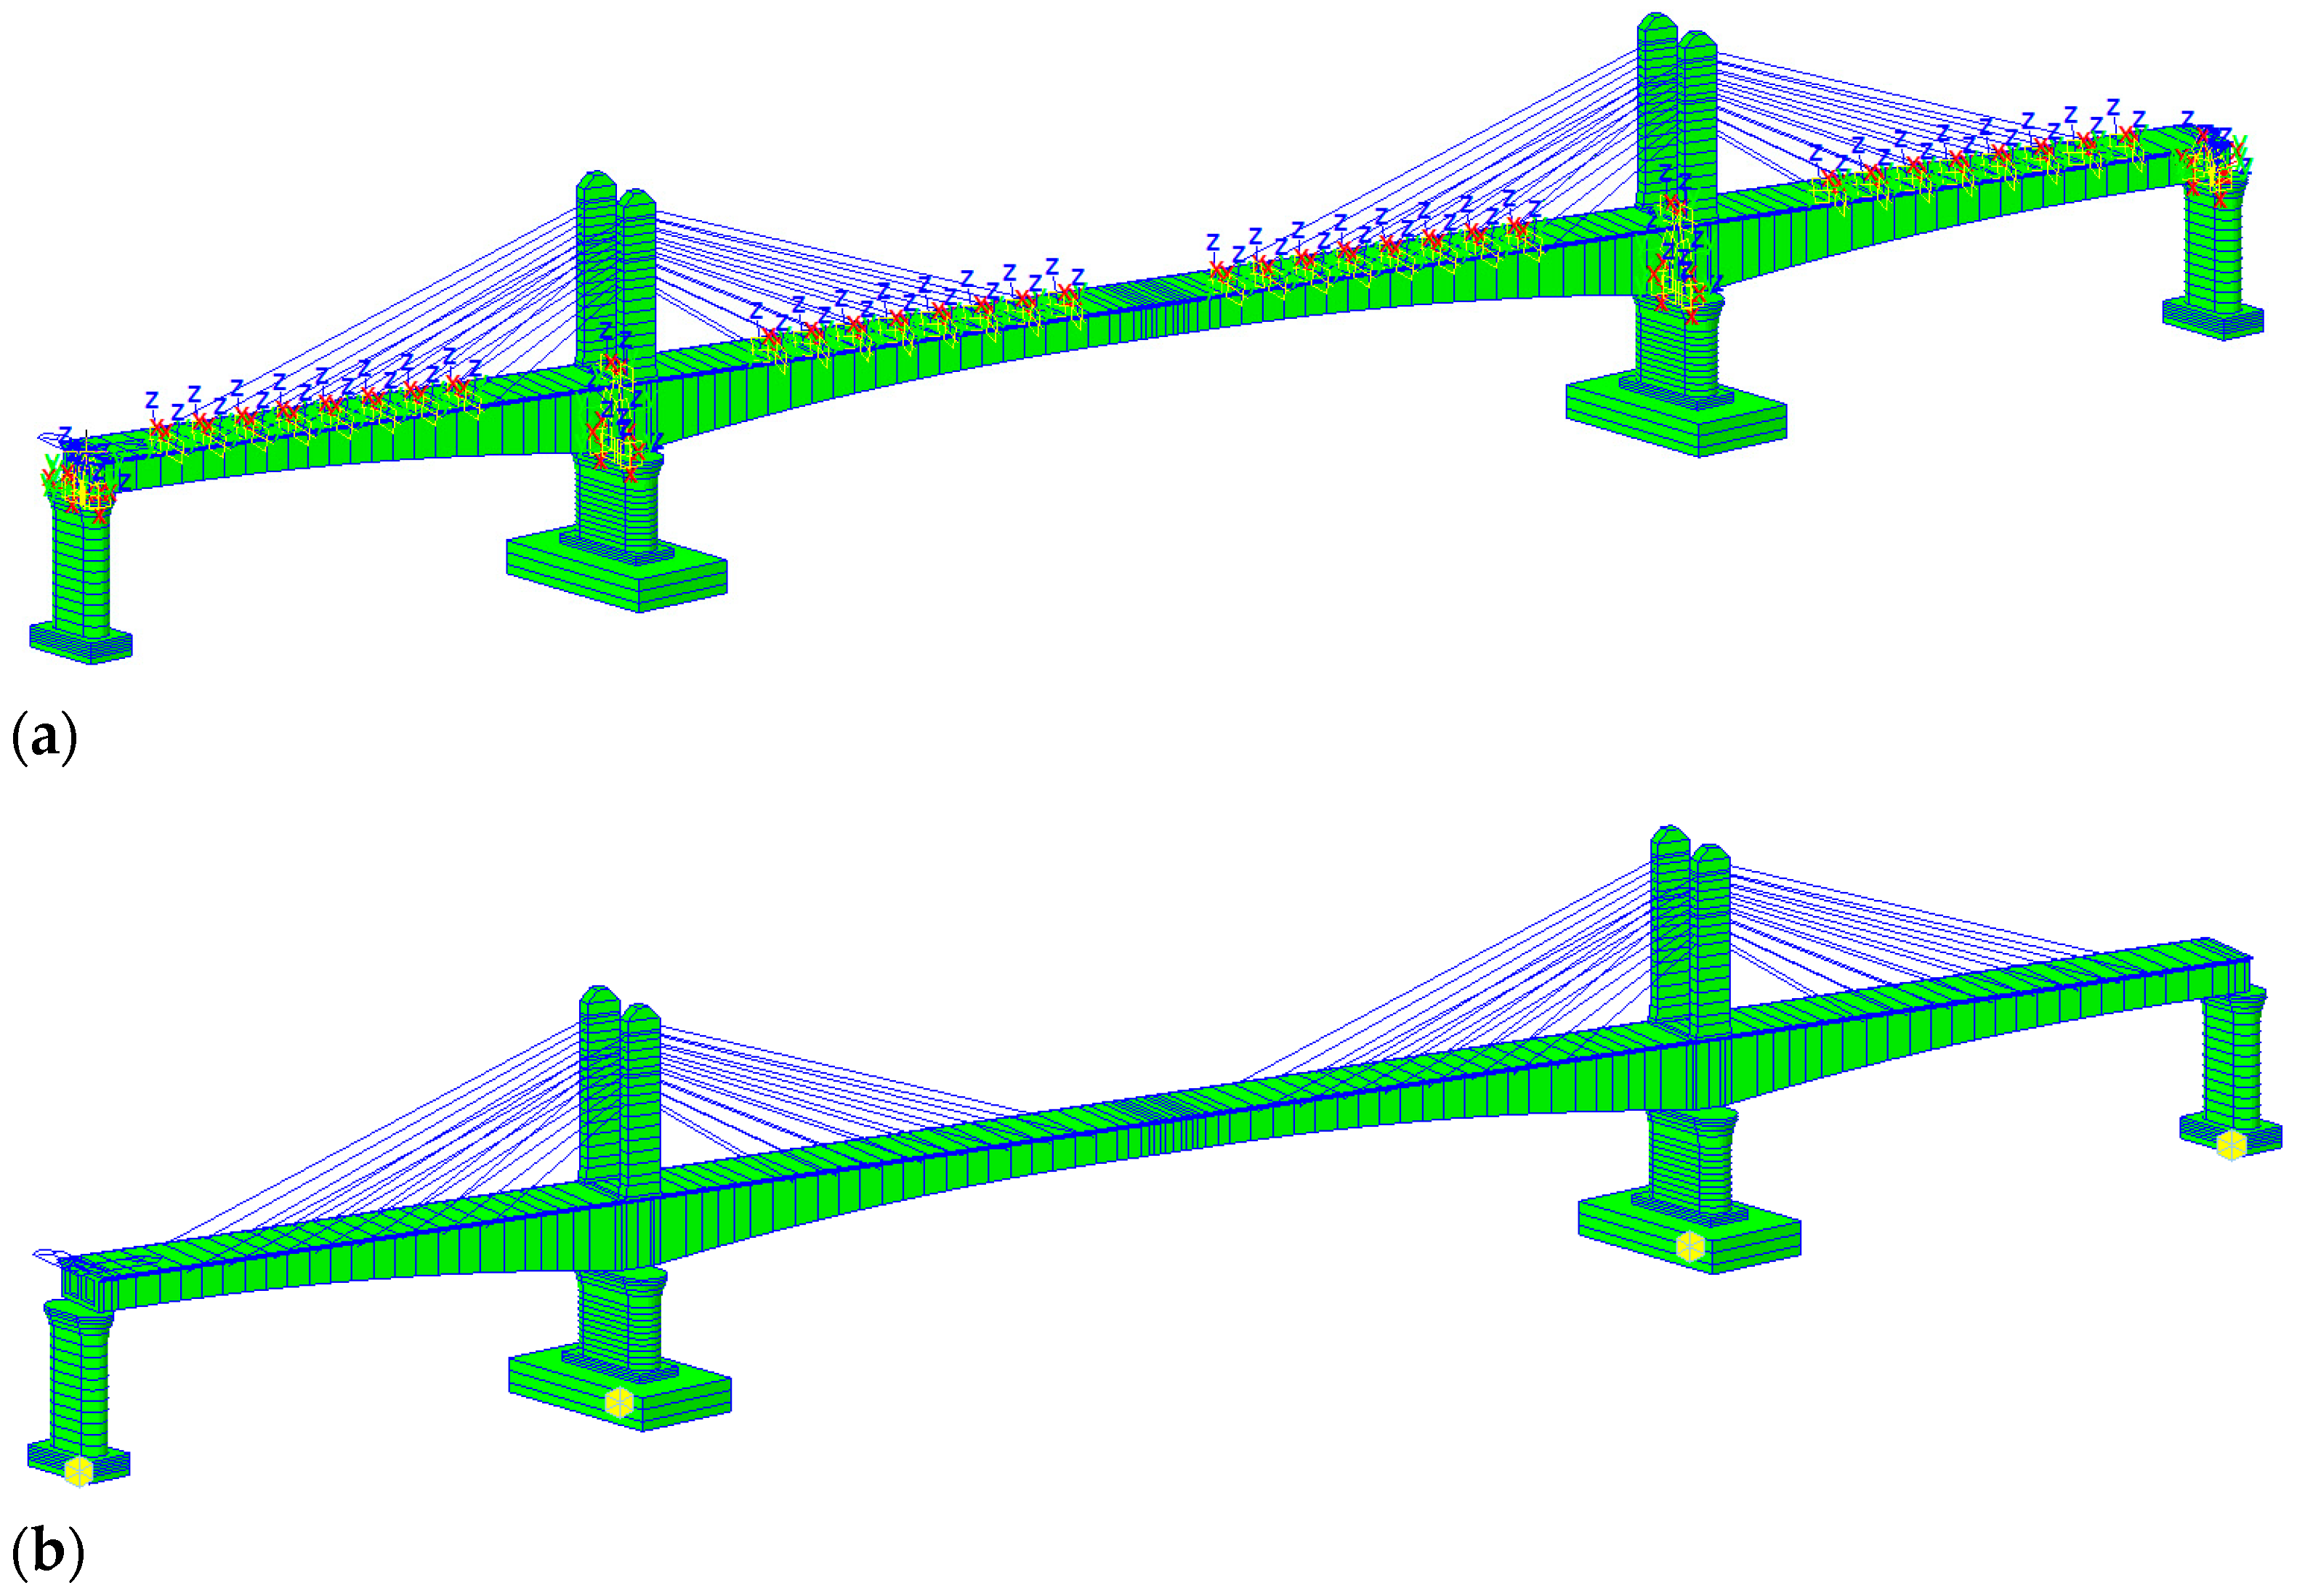
3.1. Project Overview

The main bridge of the Lanjiang Bridge, currently under construction, is selected as the focus of this study, which investigates the application of the proposed cable force optimization method within this project. The main bridge is designed as a short-pylon cable-stayed bridge featuring twin towers and double cable planes, spanning (100 + 200 + 100) m. It is characterized by a structural configuration that consolidates the tower and beam while separating the pier and beam. The main girder is constructed as a prestressed concrete single-box double-cell structure with a variable height and cross-section, while the main tower has a height of 32 m and a solid rectangular cross-section. A total of 64 stay cables are utilized throughout the bridge, composed of 61 AT-61 epoxy-coated prestressed steel strands. The material properties of the bridge are summarized in Table 1, and the structural layout is illustrated in Figure 5.

3.2. Simulation of Main Bridge of Lanjiang Bridge

In this study, Midas Civil is employed to develop a finite element model that accurately simulates the construction process of a low-pylon cable-stayed bridge. The simulation encompasses all key construction stages, including the construction of the bridge tower, pouring of prestressed concrete, installation of cables, construction of the bridge deck, and application of dead loads in Phase II. The effects of concrete shrinkage and creep are thoroughly integrated into the model. Additionally, the influence of various design parameters, such as elastic modulus, section dimensions, and bearing constraints, is considered throughout the construction process. The main girder and tower are modeled using beam elements, while the stay cables are represented by truss elements. The complete bridge model consists of 527 nodes and 390 elements, which include 326 beam elements and 64 truss elements. The comprehensive finite element model of the bridge is illustrated in Figure 6. The material properties of the bridge are summarized in Table 1. Elastic connections are utilized between bridge components, and the nodal constraints are depicted in Figure 7.

3.3. Field Monitoring Results

During the primary tensioning operation of the cable in this project, a professional hydraulic jack device (model YDCS160-150) (Liuzhou Ovim Structure Testing Technology Co., Ltd., Liuzhou, China) is employed, and the YDC160 series continuous tensioning bearing system is utilized to ensure compatibility. To ensure measurement accuracy, CSJMZX-3102AT (Shenzhen Stepp Technology Co., Ltd., Shenzhen, China) series monitoring instruments are selected for the detection system, and a high-precision hydraulic pressure gauge with an accuracy level of 0.4 is specifically configured. The field deployment and configuration of the complete hydraulic jack cable force detection system are documented in Figure 8.
The tensioning process for inclined cables is calculated using the equivalent tensioning method [44], which is based on actual measurement data. This method compensates for tension loss during subsequent tensioning by over-tensioning the steel strands in the initial stage, with the tensioning forces adjusted according to the prescribed tensioning sequence. The operational principle of this methodology is schematically illustrated in Figure 9. A direct correlation exists between the tensioning force of individual steel strands and their sequential tensioning order. The earlier a steel strand is tensioned, the greater the tensioning force applied. Subsequently, tensioning operations continue, during which the tensioning force of previously tensioned steel strands is gradually reduced, and their over-tensioning magnitude is progressively offset. After completing the tensioning of the final steel strand within a diagonal cable, the tensions of all pre-tensioned steel strands are reduced to levels essentially equivalent to that of the final strand. Consequently, it can be concluded that the tension of all steel strands that have been tensioned in the early stage will be reduced to be basically the same as the last steel strand, that is T 1 = T 2 = = T 61 . From this, it can be concluded that the total tensile force of the cable is equal to the tensile force of the last strand multiplied by the number of strands. This relationship is expressed in this article as follows: cable force = (average of the final 31 tension values) × (number of strands), as demonstrated by the left inclined cable S1 of tower 1 T 1 = 66.43 × 61 = 4052.23 . Additional measurement parameters are systematically listed in Table 2.
The vibration frequency method [45] is used to test the cable force of the cable-stayed bridge in the verification stage of the cable force system (mid-span and after the dragon). Based on the structural dynamics theory, the vibration frequency method captures the micro-vibration response characteristics of cables excited by the natural environment, extracts its natural vibration frequency characteristics, and finally carries out an indirect cable force inversion calculation according to the cable force–frequency mapping relationship. Its mechanical theoretical basis is based on the classical string vibration theory. When the simplified calculation model ignores the influence of cable sag, the dynamic equation of cable vibration behavior can be expressed as shown in Equation (14)
E I 4 y x t 4 x T 2 y x t 2 x + ρ 2 y x t 2 x = 0
where EI is the characteristic value of the bending stiffness of the cable structure; T is the axial force value of the cable; ρ is the mass per unit length of the cable material; y x t is the displacement response function of each spatial point of the cable medium evolving with time.
When the boundary conditions are defined as rigidly constrained at both ends of the cable, and the effects of cable sag and material bending or axial deformation are neglected in the computational model, the simplified cable force relationship is expressed as Equation (15).
T = 4 ρ l 2 f n 2 n 2
where n is the vibration mode order; Fn is the measured value of the nth order natural frequency; l is the effective calculation length parameter of the stay cable.
Field data acquisition is conducted using the JMM-268 (Liuzhou Ovim Structure Testing Technology Co., Ltd., Liuzhou, China) professional cable tension dynamic testing instrument, with the measurement procedure schematically illustrated in Figure 10. Due to the influence of external environmental factors on test results, each dataset is organized into groups of 15 measurements, from which the 2 highest and 2 lowest values are systematically eliminated. The average value is then calculated from the remaining 11 data points. A comprehensive summary of the systematically measured results is presented in Table 3.

3.4. Improved Grey Wolf Algorithm Cable Force Optimization Analysis

3.4.1. Other Cable Force Optimization Methods

① Multi-objective optimization method [46]. The weight and displacement of the main girder in the construction process are taken as parameter variables, and the displacement and unevenness of the deck after the completion of the bridge are taken as constraint conditions. The constraint process is as follows:
The objective equation is provided by:
m i n f ( x ) = a · A 01 X + A m 01 m + d i s 01 d e s t + b · i = 1 ~ n j = i + 1 ~ n δ i j X j 2
The constraint condition is then defined by:
u = A 0 X + A m 0 m + d i s 0 d e s t u d e l t a ε = 1 n i = 1 n u i + 1 u i 2 < d e l t a
The parameter variables are as follows:
d i s 0 = s 1 0 , s 2 0 , s n 0 T ,   d i s 01 = s 1 01 , s 2 01 , s n 01 T X = x 1 , x 2 , x 3 T m = m 1 , m 2 , m 3 T A 0 = δ 11 δ 21 δ n 1     δ 12 δ 22 δ n 2         δ 1 n δ 2 n δ n n , A 01 = δ 11 ~ δ 21 ~ δ n 1 ~     0 0 δ n 2 ~         0 0 δ n n ~ A m 0 = 11 m 21 m n 1 m     12 m 22 m n 2 m         1 n m 2 n m n n m , A 01 = 11 m ~ 21 m ~ n 1 m ~     0 0 n 2 m ~         0 0 n n m ~
where variable representations are displayed in the table below.
VariableMeaning
uThe displacement value of the control point for the beam, obtained after optimization.
disThe displacement vector of the control points under the influence of the initial tension value X0 for the suspenders.
XThe optimized cable force increment vector.
mThe real-time corrected weight vector of the grid beam represents the difference between the actual weight and the design weight for each segment of the grid beam.
destThe target displacement vector of the control points on the bridge deck during the bridge completion stage.
AThe influence matrix for the unit force of a stay cable on the displacement of the main girder control points.
AmThe influence matrix for the weight correction value on the displacement in the completed section of the bridge.
deltaThe difference vector between the optimization value and the target value.
δ i , δ i ~ The influence value of the tension unit force of the i-th stay cable on the displacement of the main girder control points.
a ,   b The   weighting   coefficients ,   satisfying   the   relationship   a 2 + b 2 = 1
② Improved genetic algorithm [25]. For practical engineering applications, various parameters in the optimization process must be determined according to the design requirements. The research presented in this section is conducted using the genetic algorithm library and numerical analysis library within the MATLAB environment. The optimal parameter combination identified includes an initial population size of 50, a mutation probability of 0.5, and a crossover probability of 0.7. With these parameters, the algorithm achieves convergence after approximately 700 iterations.
The objective equation is provided by:
U = M L 0 + C L T T B M L 0 + C L T + M R 0 + C R T T B M R 0 + C R T
The constraint condition is then defined by:
s . t . i = 1 16 T i T ¯ 2 16 10000 0 T i 6600 kN ( I = 1 , 2 , 16 )
The parameter variables are as follows:
T = T 1 , T 2 , , T 16 T b i = L i 4 E i I i i = 1 , 2 , , m ( The   member   length   is   denoted   by   L i . )
where
C L , C R is the influence matrix of cable force adjustment on the left and right ends of the bar;
M L 0 , M R 0 is the moment vector at the left and right ends of the bar after the stay cable is primary tension;
B is a diagonal matrix, the element on the diagonal is bi.

3.4.2. Advantages of Cable Force Optimization Method Based on Improved Grey Wolf Algorithm

By substituting the measured data obtained during construction, the optimal cable force at the completion stage can be determined through optimization techniques. A comparative analysis is conducted between the multi-objective optimization method and the enhanced genetic algorithm. The optimized cable force is assessed from four different perspectives: calculation results, computational efficiency, bending moment of the main girder under dead load, and the stress distribution of the main girder, as summarized in the following analytical findings:
(1)
Dead load cable force of completed bridge
In the case of design cable force, a comparison between the cable force under dead load and the secondary optimization results of cable force calculated by finite element software is presented in Table 4 and Figure 11. The cable force optimized by the improved grey wolf algorithm ranges from 5370 kN to 5620 kN, and the distribution of cable force is shown to be more uniform. This leads to the conclusion that the calculation results derived from the improved grey wolf algorithm are considered more reasonable.
(2)
Main girder deflection change
The comparison of deflection changes in the main girder during the completion of the bridge is presented in Figure 12. Analysis of the girder deflection comparison diagrams, both before and after optimization, reveals that the multi-objective optimization method, the improved genetic algorithm, and the enhanced grey wolf algorithm exhibit similar linear variations under dead load. Notably, a 33.48% reduction in the maximum mid-span deflection of the main beam (from 50.89 mm to 33.85 mm) is achieved through cable force optimization using the improved grey wolf algorithm, while relatively minor deformation effects are observed in the side span.
(3)
The change of bending moment under dead load when the bridge is completed
The comparison of the bending moment in the main girder under the dead load of the completed bridge is illustrated in Figure 13. When compared with the bending moment values calculated using finite element software, the two-stage cable force optimization conducted by the improved grey wolf algorithm results in a 16.74% reduction in the maximum negative bending moment and a 13.92% decrease in the maximum positive bending moment. The optimized results demonstrate a more rational distribution of bending moment characteristics.
(4)
Stress analysis of the main beam under dead load.
Under the as-built dead load condition, relatively minor differences in beam element stress levels are observed among the three optimization strategies. The maximum compressive stress values calculated using the finite element method, modified genetic algorithm, and modified grey wolf algorithm remain within the allowable safe stress range, with recorded magnitudes of 13.4 MPa, 13.4 MPa, 13.5 MPa, and 13.9 MPa, respectively.
(5)
Calculation efficiency evaluation
The enhanced grey wolf algorithm is integrated with chaotic mapping for population initialization and a cosine convergence factor, demonstrating convergence within a minimum of 300 iterations. Solving the objective equation necessitates extensive matrix iterative operations through the multi-objective optimization method, leading to significant demands on computational resources and time consumption. Although iterative procedures are incorporated in the finite element software-based computational approach, relatively long processing durations are observed. The improved genetic algorithm requires no fewer than 700 iterations to achieve convergence. Consequently, the IGWO-SVM model exhibits superior computational efficiency compared with alternative methodologies, indicating its potential for real-time construction progress monitoring. The iterative process associated with cable force optimization is illustrated in Figure 14.

3.5. Verification of Cable Force Optimization Method

The measured initial tension forces in the cables are incorporated into the finite element model for computational analysis. This model allows for the derivation of the main girder’s deformation under actual tension conditions, followed by the calculation of the theoretical elevation of the main girder. The processed results are then input into the IGWO-SVM integrated optimization model, where optimal cable forces during mid-span closure are determined through optimization procedures. Table 5 presents a comparative analysis between experimental findings and selected field measurement data.
A maximum discrepancy of 5% between the optimized and measured values is maintained, demonstrating compliance with the prescribed design specifications. Furthermore, the technical feasibility of the IGWO-SVM methodology has been experimentally validated through this comparative verification process.

4. Conclusions

As a critical component of bridge structural systems, cable force optimization methodology is recognized as an essential guiding mechanism for construction operations. Using the main span of the Lanjiang Bridge as the engineering prototype, an efficient, accurate, and real-time cable force adjustment methodology is investigated through rigorous computational analysis. The principal findings are systematically presented in the following conclusions:
(1)
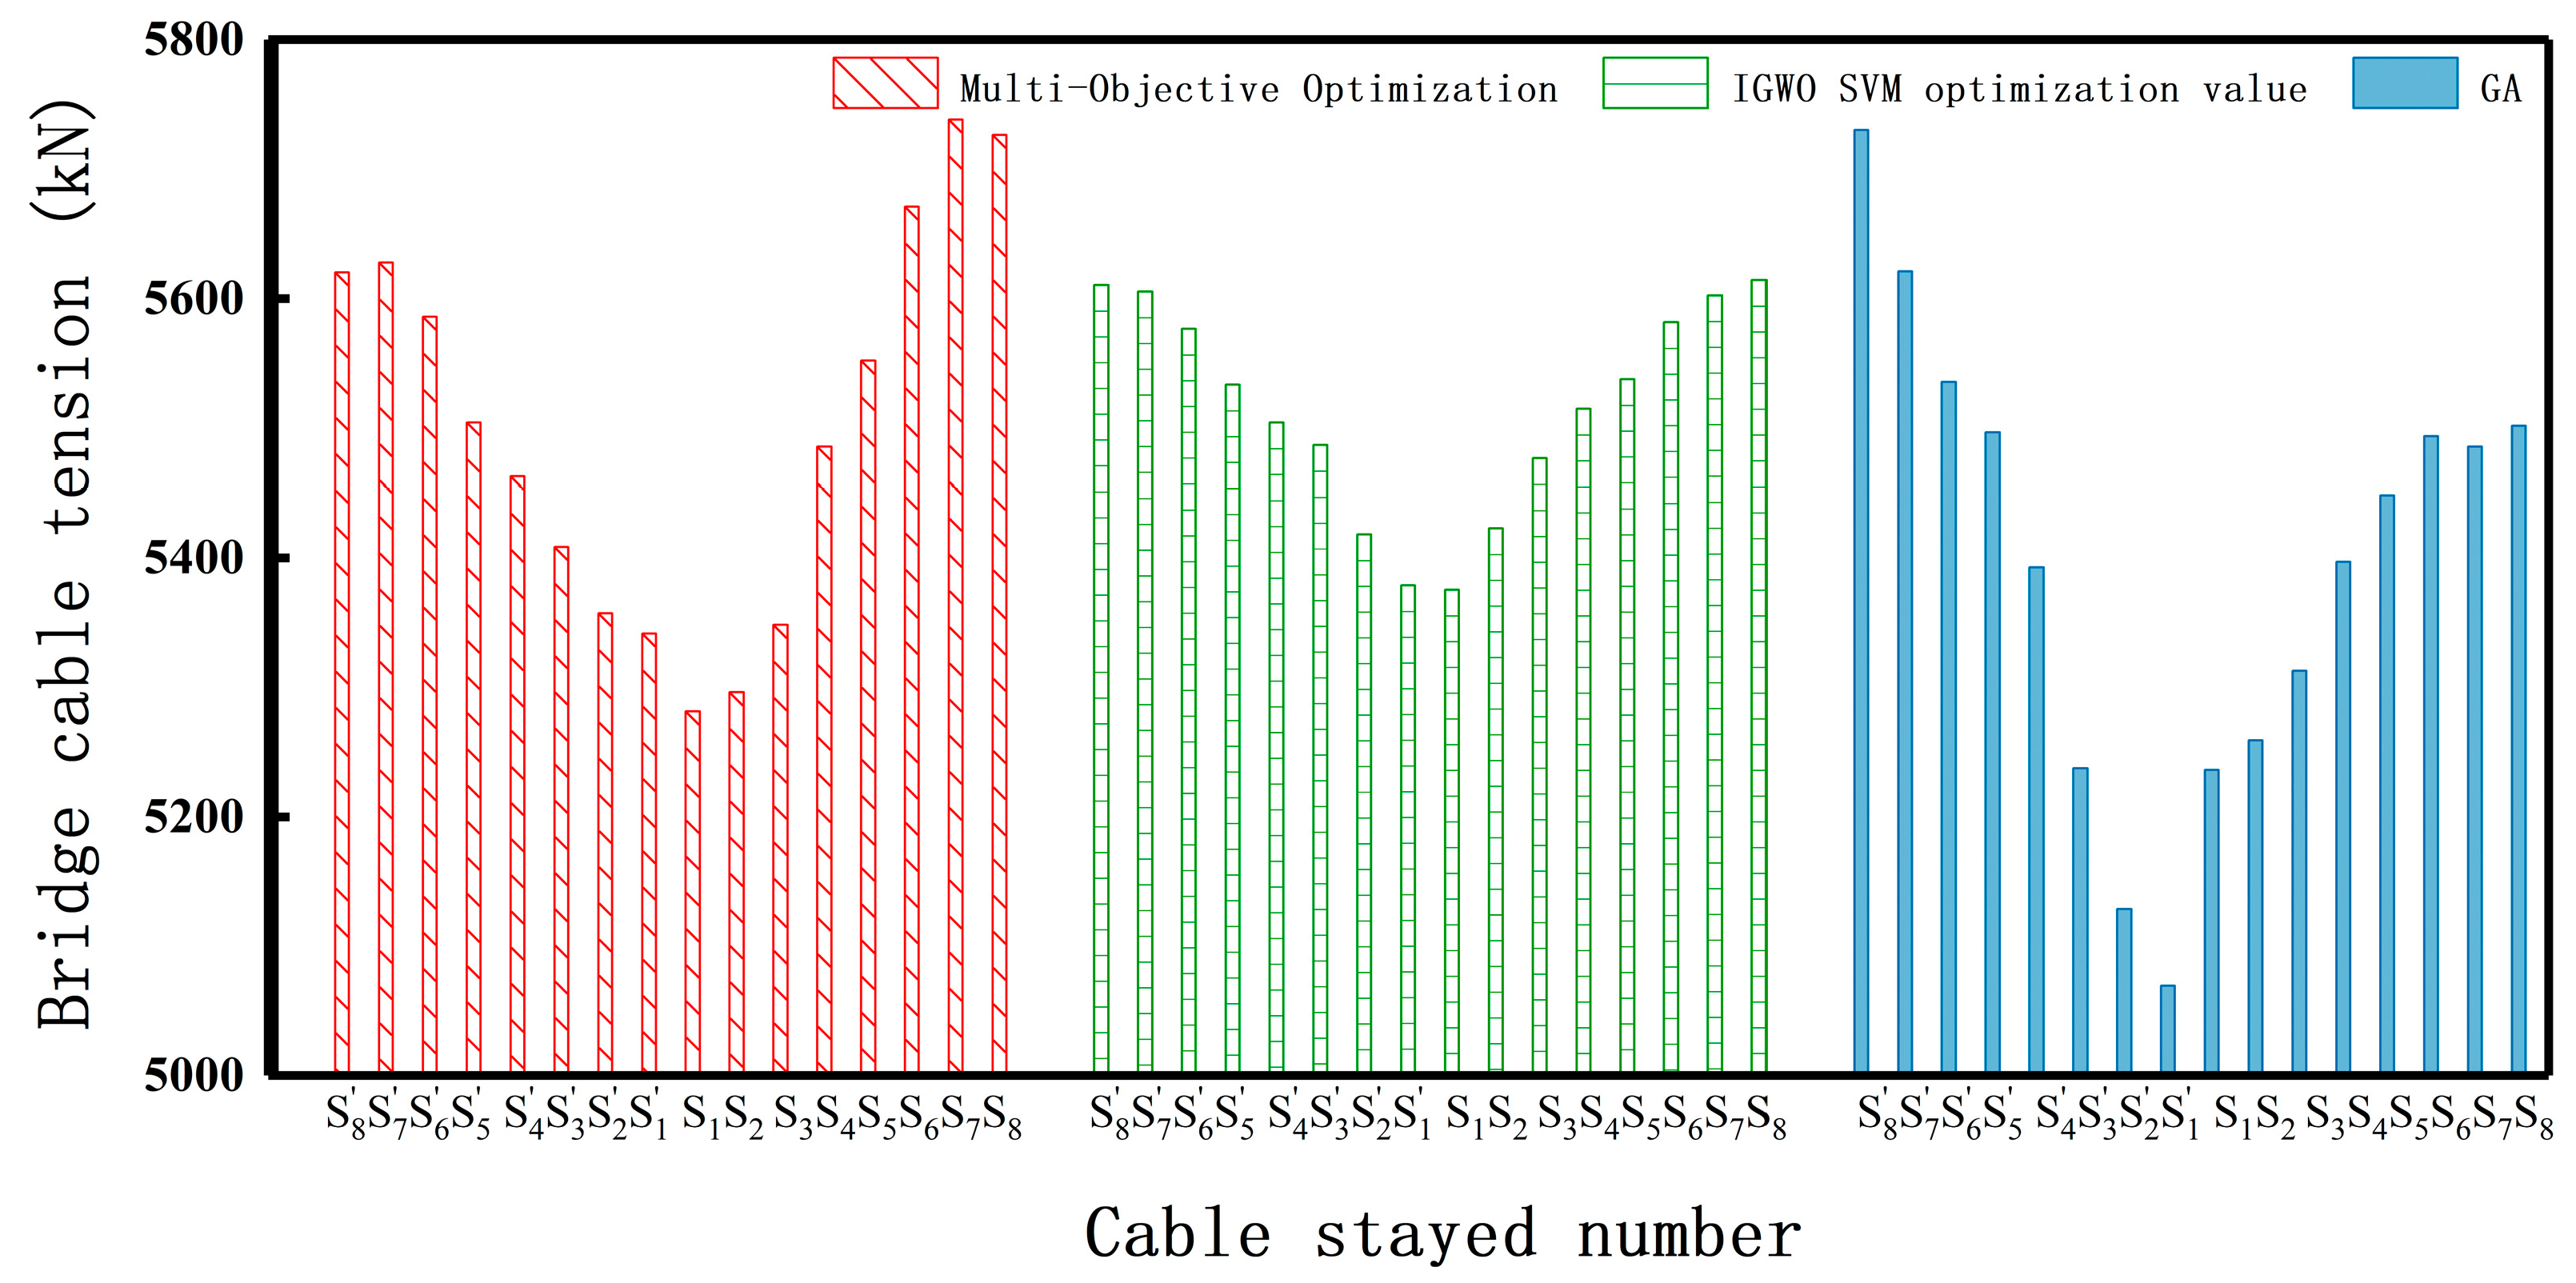
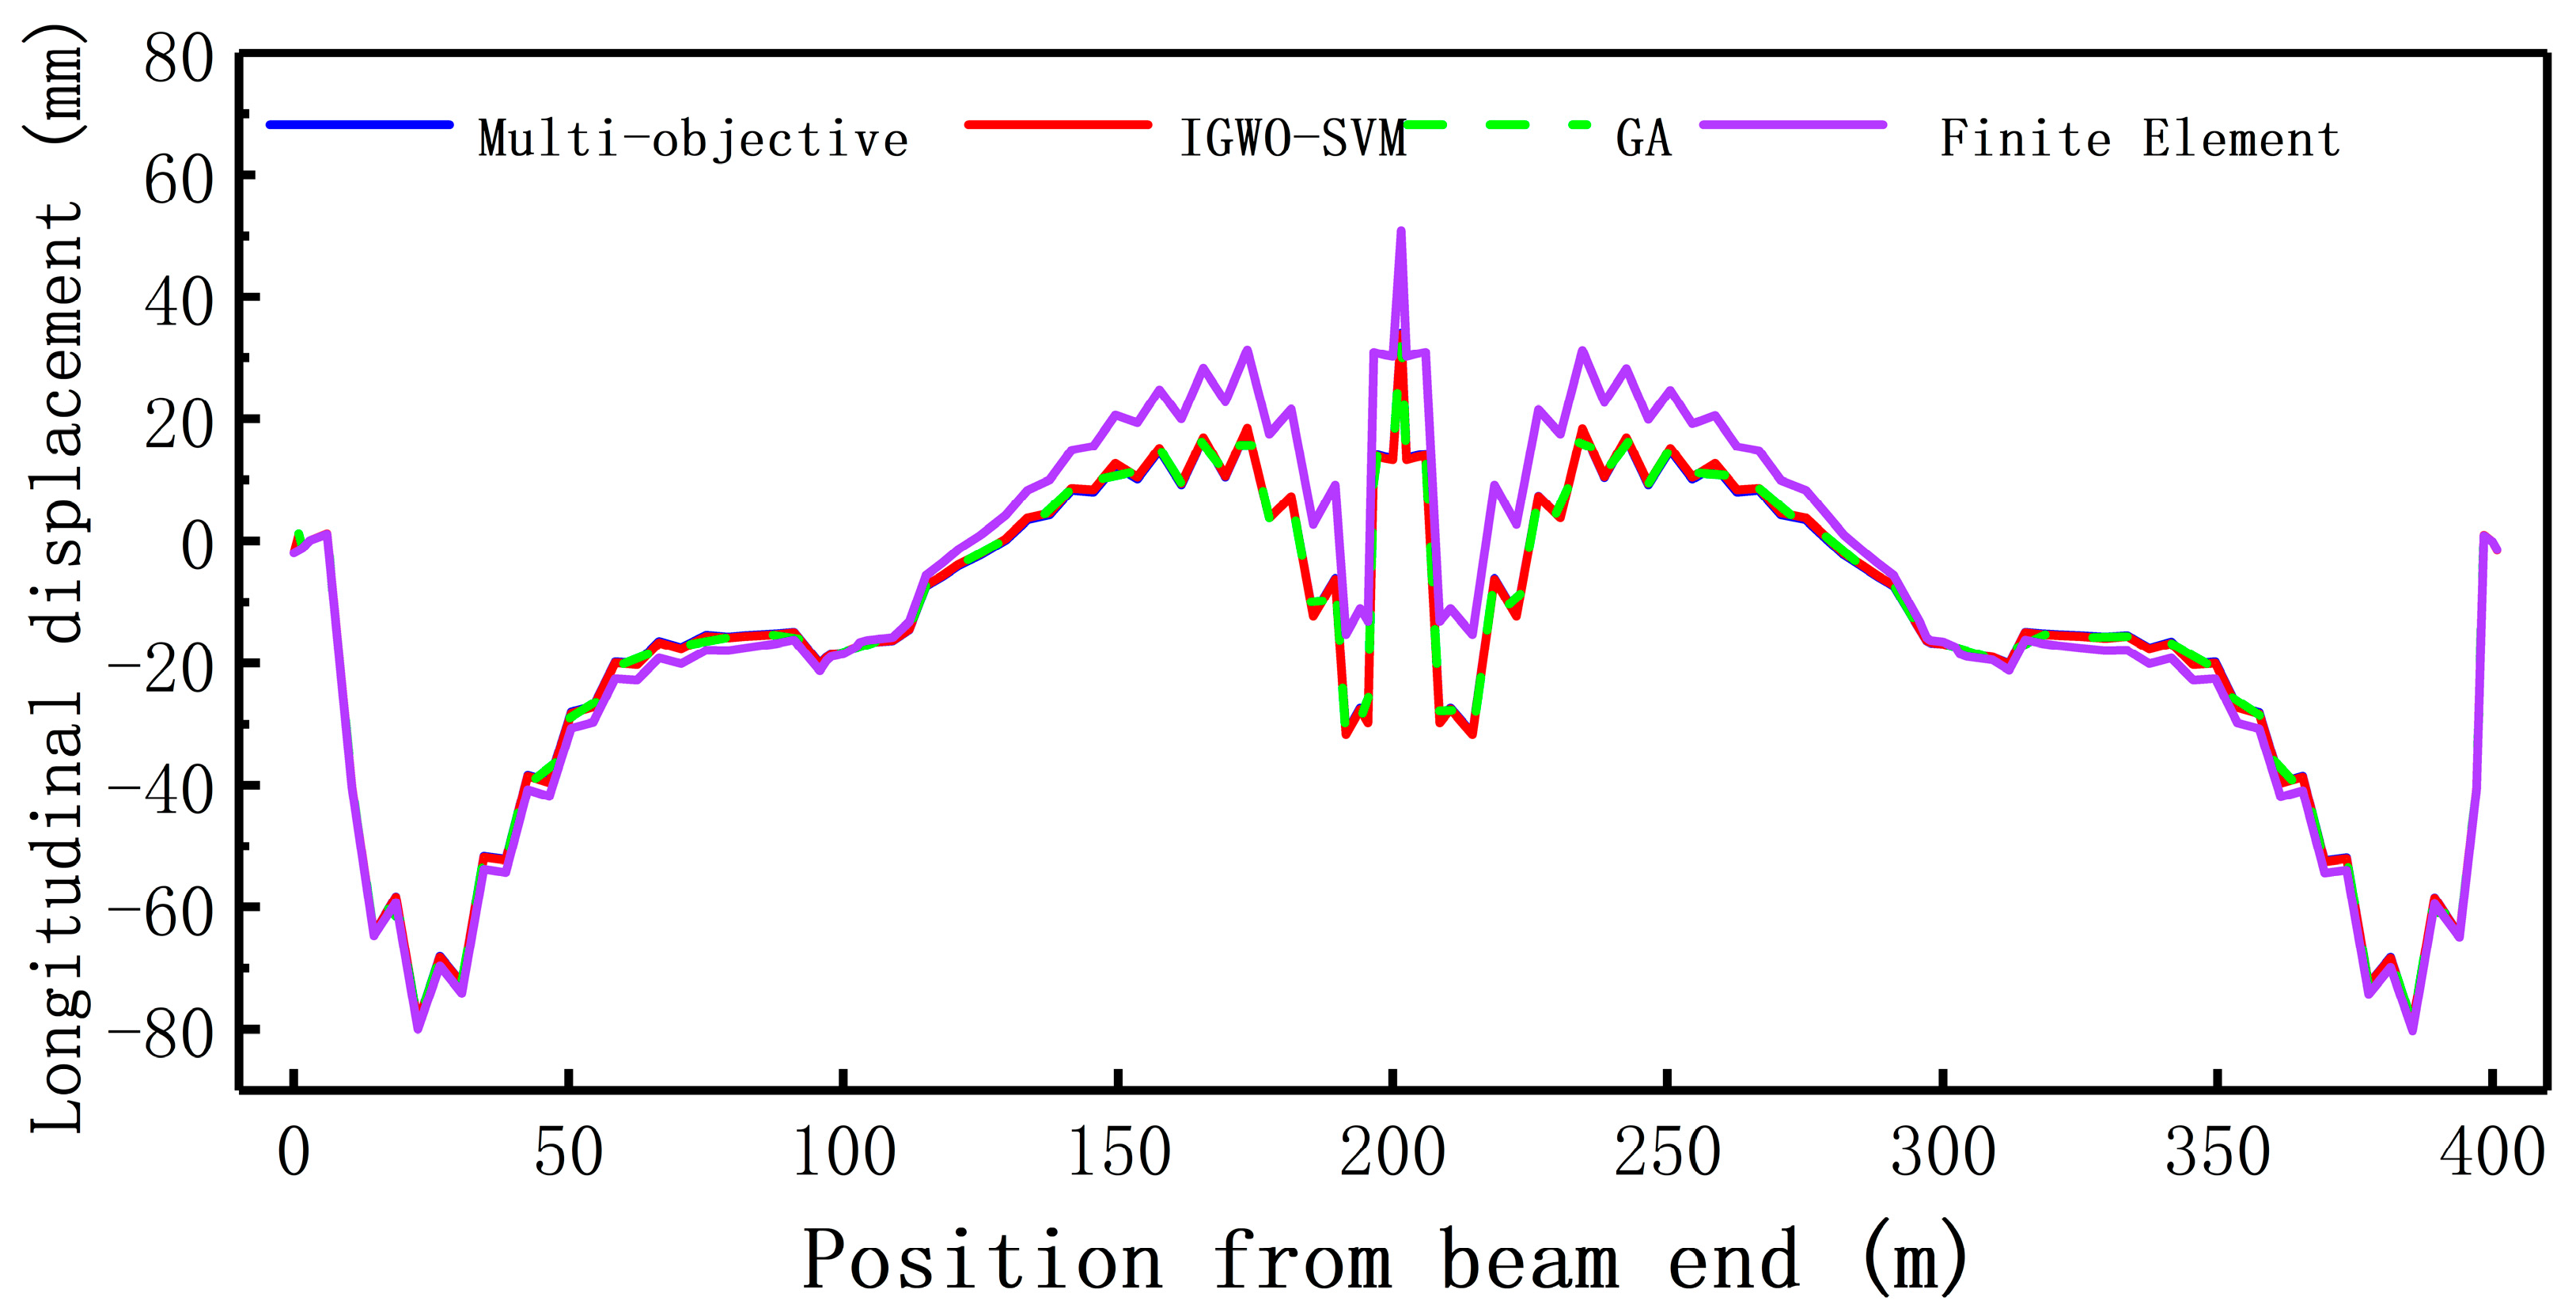
After optimizing the IGWO-SVM prediction model, the linear mapping relationship between cable force and girder elevation in long-span low-pylon cable-stayed bridges can be accurately simulated, minimizing prediction error and demonstrating strong generalization capabilities. Utilizing the combined optimization model, the maximum deflection of the main girder in the middle span is reduced from 50.89 mm to 33.85 mm, representing a decrease of 33.48%. Additionally, the maximum negative bending moment is reduced by 16.74%, while the maximum positive bending moment decreases by 13.92%. The calculated cable force results are more uniform, with a variance of 19.96, which is lower than that obtained through multi-objective optimization and the improved genetic algorithm.
(2)
This method comprehensively accounts for the dynamic changes in cable force during the construction phase, enabling accurate predictions of cable force distribution and main girder displacement from bridge closure to completion. This provides a solid foundation for effective construction control. Additionally, the optimization method ensures the stability of main girder displacement throughout the construction process, aligning the structural integrity of the completed bridge with predetermined control objectives. Based on measured data, this method also allows for the timely adjustment and optimization of key parameters, ensuring that the final state of the completed bridge adheres to design specifications.
(3)
A guiding framework is established for low-pylon cable-stayed bridges with varying spans, demonstrating high practicality and a broad range of applications. During the actual construction process, real-time modifications of design parameters and optimization of calculation methods allow for timely corrections of process deviations, ensuring that the completed bridge meets the specified design requirements.

Author Contributions

Conceptualization, J.G. and L.Z.; methodology, J.G. and L.Z.; software, L.Z.; validation, Y.Z., J.G. and H.G.; formal analysis, L.Z.; investigation, H.G.; resources, L.Z.; data curation, J.G.; writing—original draft preparation, L.Z.; writing—review and editing, L.Z.; visualization, Y.Z.; supervision, Y.Z.; project administration, H.G.; funding acquisition, J.G. All authors have read and agreed to the published version of the manuscript.

Funding

This research received no external funding.

Data Availability Statement

The original contributions presented in the study are included in the article, further inquiries can be directed to the corresponding author/s.

Conflicts of Interest

Author Yuzhong Zhang is affiliated with the company China Railway Third Engineering Group Sixth Engineering Co., Ltd. The remaining authors declare that the research was conducted in the absence of any commercial or financial relationships that could be construed as a potential conflict of interest.

References

  1. Fan, L.; Du, G.; Jiang, L. Cable force optimization and nonlinear ideal regression analysis of cable-stayed bridges. J. Chongqing Jiaotong Univ. 1992, 11, 1–12. [Google Scholar]
  2. Xiao, R.; Gong, H. Influence matrix of cable force optimization of cable-stayed bridges. J. Tongji Univ. 1998, 26, 235–240. [Google Scholar]
  3. Xiao, R.; Xiang, H. Cable force optimization of cable-stayed bridge and its engineering application. J. Comput. Mech. 1998, 15, 120–128. [Google Scholar]
  4. Yan, D. Determination of Reasonable Design State and Construction Control of Cable-stayed Bridges. Ph.D. Dissertation, Hunan University, Changsha, China, 2001. [Google Scholar]
  5. Yan, D.; Li, X.; Liu, G.; Yi, W. Step-by-step algorithm for determining reasonable completed state of concrete cable-stayed bridge. China J. Highw. Transp. 2003, 16, 43–46. [Google Scholar]
  6. Liang, P.; Xiao, R.; Zhang, X. Practical method for cable force optimization of cable-stayed bridges. J. Tongji Univ. (Nat. Sci. Ed.) 2003, 31, 1270–1274. [Google Scholar]
  7. Baldomir, A.; Hernandez, S.; Nieto, F.; Jurado, J. Cable optimization of a long span cable stayed bridge in La Corua (Spain). Adv. Eng. Softw. 2010, 41, 931–938. [Google Scholar] [CrossRef]
  8. Martins, A.M.B.; Simes, L.M.C.; Negro, J.H.J.O. Optimization of cable forces on concrete cable-stayed bridges including geometrical nonlinearities. Comput. Struct. 2015, 155, 18–27. [Google Scholar] [CrossRef]
  9. Miao, C.; Wang, Y.; Li, S. Cable force optimization of low-pylon concrete cable-stayed bridge. J. Southeast Univ. (Nat. Sci. Ed.) 2012, 42, 526–530. [Google Scholar]
  10. Chen, C. Research on cable force optimization of low-pylon cable-stayed bridge based on the principle of minimum cost. Eng. Mech. 2012, 29, 141–146. [Google Scholar]
  11. Hassan, M.M.; El Damatty, A.A.; Nassef, A.O. Database for the optimum design of semi-fan composite cable-stayed bridges based on genetic algorithms. Struct. Infrastruct. Eng. 2015, 11, 1054–1068. [Google Scholar] [CrossRef]
  12. Song, C.; Xiao, R.; Sun, B.; Wang, Z.; Zhang, C. Optimization of cable pre-tension forces in long-span cable-stayed bridges considering the counterweight. Eng. Struct. 2018, 283, 115856. [Google Scholar] [CrossRef]
  13. Cao, H.; Li, H.; Zhou, Y.; Li, Z.; Feng, L. Biobjective Optimization of Cable Force for Concrete Cable-Stayed Bridges Considering the Requirements of the Serviceability and Ultimate Limit State. J. Bridge Eng. 2024, 29, 04024026. [Google Scholar] [CrossRef]
  14. Yan, L.; Chen, Y.; Sheng, H.; Sun, H. Practical method for cable force optimization of cable-stayed bridges based on MALTAB optimization toolbox. For. Eng. 2006, 22, 35–37. [Google Scholar] [CrossRef]
  15. Guo, Z.; Xie, Z.; Zhao, K.; Xie, L.; Lin, X. Cable force optimization of cable-stayed bridge based on feasible region method. J. Jiangxi Univ. Sci. Technol. 2012, 33, 10–13. [Google Scholar]
  16. Liu, Y.; Liu, D.; Liu, S. Cable force optimization of cable-stayed bridge under dead load based on MATLAB combined with ANSYS. J. Chongqing Jiaotong Univ. (Nat. Sci. Ed.) 2013, 32, 1111–1114+1194. [Google Scholar]
  17. Zhang, J.; Au, F.T.K. Calibration of initial cable forces in cable-stayed bridge based on Kriging approach. Finite Elem. Anal. Des. 2014, 92, 80–92. [Google Scholar] [CrossRef]
  18. Yin, X.; Wang, G.; Xue, Z. Research on cable force optimization of cable-stayed bridge based on new strongly sub-feasible SQR method. World Bridges 2016, 44, 33–37. [Google Scholar]
  19. Wang, Z.; Zhang, N.; Du, X.; Wang, S.; Sun, Q. Multiobjective Optimization of Cable Forces and Counterweights for Universal Cable-Stayed Bridges. J. Adv. Transp. 2021, 2021, 6615746. [Google Scholar] [CrossRef]
  20. Wu, X.; Xiao, R. Cable force optimization of long-span hybrid beam cable-stayed bridge based on genetic algorithm. J. Jiangsu Univ. (Nat. Sci. Ed.) 2014, 35, 722–726. [Google Scholar]
  21. Jiang, Z.; Zhu, B. Cable Force Optimization of Asymmetric Cable-stayed Bridge Based on Improved Particle Swarm Optimization. Highw. Eng. 2018, 43, 117–121. [Google Scholar]
  22. Wang, J.; Liu, L.; Ren, X. Cable force optimization of long-span cable-stayed bridge based on improved imperial competition algorithm. J. Jiangsu Univ. (Nat. Sci. Ed.) 2019, 40, 94–101. [Google Scholar]
  23. Ma, G. Research on Cable Force Optimization of Four-wire Steel Truss Cable-stayed Bridge Based on Hybrid Genetic Algorithm. Railw. Stand. Des. 2020, 64, 85–89. [Google Scholar]
  24. Kan, B. Cable Force Optimization of Cable-stayed Bridge Based on Improved Particle Swarm Optimization. Chin. Foreign Highw. 2021, 41, 133–137. [Google Scholar] [CrossRef]
  25. Li, B. Cable Force Optimization and Construction Simulation Analysis of Low-Pylon Cable-Stayed Bridge. Master’s Thesis, Sichuan Agricultural University, Ya’an, China, 2022. [Google Scholar] [CrossRef]
  26. Wang, T.; Hu, Y.; Zhang, X.; Wang, L. Research on cable force optimization of cable-stayed bridge based on genetic algorithm. J. Chongqing Jiaotong Univ. (Nat. Sci. Ed.) 2023, 42, 9–17+23. [Google Scholar]
  27. Xiong, H.-Z.; Yang, X.; He, Y.-N.; Huang, Y. Optimization of cable-stayed force for asymmetric single tower cable-stayed bridge formation based on improved particle swarm algorithm. Int. J. Struct. Integr. 2024, 15, 873–890. [Google Scholar] [CrossRef]
  28. Wang, L.; Xiao, Z.; Li, M.; Fu, N. Cable Force Optimization of Cable-Stayed Bridge Based on Multiobjective Particle Swarm Optimization Algorithm with Mutation Operation and the Influence Matrix. Appl. Sci. 2023, 13, 2611. [Google Scholar] [CrossRef]
  29. Yue, F.; Cheng, L.; Briseghella, B.; Fenu, L.; Zordan, T. Cable optimization of a cable-stayed bridge based on genetic algorithms and the influence matrix method. Eng. Optim. 2020, 54, 20–39. [Google Scholar]
  30. Ha, M.H.; Vu, Q.A.; Truong, V.H. Optimum Design of Stay Cables of Steel Cable-stayed Bridges Using Nonlinear Inelastic Analysis and Genetic Algorithm. Structures 2018, 16, 288–302. [Google Scholar] [CrossRef]
  31. Zarbaf, S.E.H.A.; Norouzi, M.; Allemang, R.J.; Hunt, V.J.; Helmicki, A. Stay Cable Tension Estimation of Cable-Stayed Bridges Using Genetic Algorithm and Particle Swarm Optimization. J. Bridge Eng. 2017, 22, 05017008. [Google Scholar] [CrossRef]
  32. Zhang, D.; Jun, X.; Zhou, B.; Yuan, S. Research on cable force optimization of multi-tower cable-stayed bridge based on BP neural network-GSL&PS-PGSA. Highw. Eng. 2022, 47, 34–39. [Google Scholar]
  33. Guo, J.; Guan, Z. Optimization of the cable forces of completed cable-stayed bridges with differential evolution method. Structures 2023, 47, 1416–1427. [Google Scholar] [CrossRef]
  34. Huang, K.; Chai, S.; Wang, X. Crossing cable design optimization of multi-tower cable-stayed bridge based on joint analytical method and genetic algorithm. Structures 2024, 69, 107335. [Google Scholar] [CrossRef]
  35. Zhong, Z. Research on Cable Force Optimization and Construction Control of Asymmetric Single-Tower Wide Concrete Box Girder Cable-Stayed Bridge. Master’s Thesis, Sichuan Agricultural University, Ya’an, China, 2024. [Google Scholar] [CrossRef]
  36. Mirjalili, S.; Mirjalil, S.M.; Lewis, A. Grey Wolf Optimizer. Adv. Eng. Softw. 2014, 69, 46–61. [Google Scholar] [CrossRef]
  37. Kohli, M.; Arora, S. Chaotic grey wolf optimization algorithm for constrained optimization problems. J. Comput. Des. Eng. 2018, 5, 458–472. [Google Scholar] [CrossRef]
  38. Teng, Z.; Lv, J.; Guo, L.; Xu, Y. An improved algorithm for hybrid grey wolf optimization based on Tent map. J. Harbin Inst. Technol. 2018, 50, 40–49. [Google Scholar] [CrossRef]
  39. Guo, Z.; Liu, R.; Gong, C.; Zhao, L. Research on improvement based on grey wolf algorithm. Comput. Appl. Res. 2017, 34, 3603–3610. [Google Scholar]
  40. Cui, J.; Lin, H.; Lyu, X.; Zhang, W. Chaotic Opposition learning and differential evolution grey wolf algorithm based on individual disturbance. Comput. Eng. Des. 2022, 43, 587–595. (In Chinese) [Google Scholar]
  41. Wang, Q.; Wang, M.; Wang, X. Grey Wolf Optimization Algorithm with Improved Convergence Factor and Proportional Weight. Comput. Eng. Appl. 2019, 55, 60–65+98. [Google Scholar] [CrossRef]
  42. Duan, J.; Wang, H.; Hao, T.; Liang, Q. Cable Force Optimization Model of Arch Bridge Based on Improved Grey Wolf Algorithm and Support Vector Machine. Comput. Eng. Des. 2023, 44, 457–465. [Google Scholar] [CrossRef]
  43. Hashemi, M.; Javaheri, D.; Sabbagh, P.; Arandian, B.; Abnoosian, K. A multi-objective method for virtual machines allocation in cloud data centres using an improved grey wolf optimization algorithm. IET Commun. 2021, 15, 2342–2353. [Google Scholar] [CrossRef]
  44. Niu, Y. Analysis on the application of equivalent tension method in the construction of steel strand stay cables. Anhui Archit. 2022, 29, 148–149+170. [Google Scholar] [CrossRef]
  45. Wang, J.; Yang, J.; Zeng, Z.; Pei, Z. Error analysis of cable tension measurement by frequency method and optimization of cable tension calculation formula. Ind. Saf. Environ. Prot. 2021, 47, 27–31. [Google Scholar]
  46. Yu, M.; Yao, X.; Deng, N.; Hao, T.; Wang, L.; Wang, H. Optimal Cable Force Adjustment for Long-Span Concrete-Filled Steel Tube Arch Bridges: Real-Time Correction and Reliable Results. Buildings 2023, 13, 2214. [Google Scholar] [CrossRef]
Figure 1. Hunting process of grey wolf group.
Buildings 15 01309 g001
Figure 2. Population distribution after chaotic mapping with different iterations.
Buildings 15 01309 g002
Figure 3. Variation diagram of convergence factor.
Buildings 15 01309 g003
Figure 4. Flow chart of cable force optimization.
Buildings 15 01309 g004
Figure 5. General layout of low-pylon cable-stayed bridge of Lanjiang Bridge (unit: m). (a) Elevation layout of low-pylon cable-stayed bridge. (b) Deck layout of low-tower cable-stayed bridge. (c) Layout of stay cables.
Buildings 15 01309 g005
Figure 6. Cable-stayed bridge with short towers: finite element model. Illustration: Different colors represent various members of the bridge.
Buildings 15 01309 g006
Figure 7. Model constraints. (a) Bar connection. (b) Bridge pier and foundation connection.
Buildings 15 01309 g007
Figure 8. Cable force measurement site by hydraulic jack method.
Buildings 15 01309 g008
Figure 9. Schematic diagram of equivalent tension method.
Buildings 15 01309 g009
Figure 10. Cable force measurement site by frequency method.
Buildings 15 01309 g010
Figure 11. Comparison of cable tension results.
Buildings 15 01309 g011
Figure 12. Comparison of deflection of main girder.
Buildings 15 01309 g012
Figure 13. Comparison of bending moment under dead load of completed bridge.
Buildings 15 01309 g013
Figure 14. Calculation iteration process of improved grey wolf algorithm.
Buildings 15 01309 g014
Table 1. Properties of materials used for low-pylon cable-stayed bridge.
Component PartMaterialElastic Modulus (Mpa)Linear Expansion Coefficient (1/°C)Poisson’s Ratio Bulk   Density   ( k N / m 3 )
Mean BeamC55 3.55 × 10 4 1.0 × 10 5 0.226.5
Main TowerC50 3.45 × 10 4 1.0 × 10 5 0.226
Stay CablePrestressed Steel Strand 1.95 × 10 5 1.2 × 10 5 0.378.5
Table 2. Measured values of primary tension.
Cable NumberMeasured Value of Tower 1 (kN)Measured Value of Tower 2 (kN)
The Left SideRightThe Left SideRight
S8’4049.814052.564042.334052.56
S7’4063.584063.584066.544063.19
S6’4064.174064.174063.584063.58
S5’4063.584063.024065.354065.55
S4’4053.074063.364065.654065.65
S3’4062.604062.604071.454071.45
S2’4057.684042.734076.184077.95
S1’4056.304049.554051.784048.83
S14052.234055.124038.594055.12
S24060.834045.484053.754076.18
S34062.604062.604062.604071.45
S44059.094056.694065.654065.65
S54071.854067.724063.584067.72
S64064.174064.174063.584063.58
S74063.584063.584064.574062.40
S84053.554043.124052.564052.56
Table 3. Measured values of mid-span after closure.
Cable NumberMeasured Value of Tower 1 (kN)Measured Value of Tower 2 (kN)
The Left SideRightThe Left SideRight
S8’3860.933929.054344.874316.4
S7’3722.673899.574275.734190.33
S6’3824.333694.24190.334133.4
S5’3903.633887.374228.974292
S4’3694.23791.84241.174165.93
S3’3663.73806.034163.94115.1
S2’3736.93816.24094.44011.03
S1’3662.973740.233941.17 3888.3
S13765.933609.373733.4 3625.63
S23798.833741.93778.5 3784.6
S33941.533856.13 3988.3 3880.53
S44063.93974.43 4055.77 3980.53
S54133.033996.8 4037.47 3960.2
S63994.773895.13 4076.1 3960.2
S74072.774143.93 4155.4 4122.87
S83903.634021.57 4240.8 4244.87
Table 4. Comparison table of cable force results.
Stay Cable NumberMulti-Objective Optimization of Cable ForceIGWO-SVM Optimization ValueImproved Genetic Algorithm
S8’5620.35610.35730
S7’5627.65605.235620.8
S6’5585.75576.45535.3
S5’5504.35533.435496.3
S4’5462.75504.125392.7
S3’5408.55486.595237.5
S2’5357.45418.235128.6
S1’5341.65378.855069.3
S15281.45375.55236.2
S25296.35422.815259
S35348.25476.545312.9
S45485.35514.775397
S55552.15537.455448.4
S65670.85581.425493.7
S75738.25602.285485.5
S85726.55614.335501.4
Average value5500.435514.915402.79
Variance36.5819.9640.57
Kolmogorov–Smirnov test0.3510.3940.591
Table 5. Comparison table of cable force results of mid-span closure.
Cable NumberIGWO-SVM Optimization Value (kN)No. 1 Left TowerNo. 1 Right Tower
Measured Value (kN)Error (%)Measured Value (kN)Error (%)
S8’4112.33860.936.5 3929.054.7
S7’3981.73722.677.0 3899.572.1
S6’3952.73824.333.4 3694.2 7.0
S5’3943.43903.631.0 3887.37 1.4
S4’3807.13694.23.1 3791.8 0.4
S3’37683663.72.8 3806.03 −1.0
S2’3656.53736.9−2.2 3816.2 −4.2
S1’3545.33662.97−3.2 3740.23 −5.2
S13580.13765.93−4.9 3609.37 −0.8
S23608.93798.83−5.0 3741.9 −3.6
S33739.43941.53−5.1 3856.13 −3.0
S438204063.9−6.0 3974.43 −3.9
S53882.14133.03−6.1 3996.8 −2.9
S63974.13994.77−0.5 3895.13 2.0
S74036.74072.77−0.9 4143.93 −2.6
S83911.33903.630.2 4021.57 −2.7
Disclaimer/Publisher’s Note: The statements, opinions and data contained in all publications are solely those of the individual author(s) and contributor(s) and not of MDPI and/or the editor(s). MDPI and/or the editor(s) disclaim responsibility for any injury to people or property resulting from any ideas, methods, instructions or products referred to in the content.

