1. Introduction
The three major objectives of project management are schedule, safety, and cost, of which the schedule objective is the most obvious. The results of a project’s management determine whether it can be performed on schedule. The key to the success of project implementation is whether scientific and effective management technologies and methods can be applied [
1,
2,
3,
4]. If there are problems, this can easily lead to construction delay, cost overrun, and construction safety accidents and ultimately affect the timely delivery of the project and reduce the interests of all parties. There are many internal or external uncertainty factors in the actual implementation process of a project. These uncontrollable factors will affect the project scheduling during project implementation, lead to deviation of the project duration, and then disrupt the original schedule of the project [
2,
4]. Therefore, if the management scheme of the project schedule lacks dynamic optimization and adjustment, there will be drawbacks [
5]. This paper combines the critical path and earned value method (EVM) to realize the scheduling optimization and prediction of the construction schedule and introduces random duration to consider the random fluctuation of the project duration.
In previous research, there have been many studies on the dynamic management of schedules and the random fluctuations caused by uncertainty. In the process of schedule management, Israeli scholar Goldratt [
6] published the book Critical Chain, in which the critical path method was first proposed to be applied to project management. After time verification and continuous improvement, this method is still one of the more scientific schedule management schemes.
In the field of project schedule prediction management, EVM management has been proven by many scientists to effectively improve prediction accuracy [
7,
8]. EVM is a project management technique used to measure the schedule and cost performance of projects in a single, integrated approach. Some researchers have introduced fuzzy theory [
9,
10,
11,
12], reflected the project schedule control under uncertain conditions by combining it with EVM, and expanded the EVM by using an intelligent optimization algorithm [
7,
10,
13,
14]. However, with the increasing complexity of engineering projects, the engineering variability brought about by the continuous increase in engineering volume is also increasing, and more and more researchers have begun to study the impact of randomness in engineering projects, which has become the current trend in earned value method research. Naeni et al. (2011) [
7] proposed a new F-EVM model, which estimates the completion time and cost under uncertain conditions by establishing and analyzing earned value indicators. Eshghi et al. (2019) [
10] proposed an EVM model considering the uncertainty of interval fuzzy set processing. In recent years, a small number of scholars have also considered the development of fuzzy profit duration management (Wood, 2017 [
15]; Ghanbari et al., 2017 [
16]; Hamzeh and Mousavi, 2019 [
17]; Hamzeh et al., 2020 [
18]). However, the fuzzy earned value method demonstrates certain limitations, particularly in terms of interpretability and dynamic updating capabilities. To address robust scheduling for resource-constrained projects with stochastic activity durations, Lambrechts O et al. [
19] measured schedule robustness based on deviations between planned and actual activity start times. Zhang Jingwen et al. [
20] quantified schedule robustness from the perspective of free slack utility functions and solved the model using the non-dominated sorting genetic algorithm (NSGA-II). Yu Miao conducted robustness optimization for prefabricated buildings by developing stochastic activity duration-based schedules, though the existing research exhibits limited responsiveness mechanisms when confronted with unexpected disruptions [
21].
In summary, this paper, against such a background, starts from the randomness of the project duration and integrates the critical path with the EVM to establish a dynamic, full-process schedule optimization model. The main objective of this paper is to develop a relatively comprehensive dynamic control model for schedule optimization, enhance the model’s capability in dealing with project duration fluctuations and dynamic control, improve the scientific validity of project decision-making, and strengthen the resilience of project schedule management against risk fluctuations. Regarding the strengths and weaknesses of the models, the critical path, while capable of scientifically and reasonably arranging construction processes in the early stages of project planning to reduce resource conflicts, lacks organizational resilience when facing uncertainties during construction and struggles to focus on key aspects when multiple branches run in parallel. On the other hand, the earned value method is mostly based on deterministic research conditions, with limited studies on uncertainty conditions [
22]. It has not effectively combined resource schedule and project schedule control in a dynamic manner. In existing research, most studies focus on historical data while neglecting the impact of future resource planning on project schedules [
23]. Through the research presented in this paper, the solution approach for dynamic optimization of project schedules is improved, a new model for full-process schedule control in project construction is established, and a practical solution for engineering practice is provided through case studies.
The structure of the rest of this paper is as follows. In
Section 2, we propose a three-stage implementation method for the proposed schedule optimization model and propose and improve the control scheme for dynamic schedule optimization. In
Section 3, we analyze and demonstrate the case and deepen the implementation steps of the proposed scheme in combination with engineering practice. In
Section 4, we discuss the applicability and effectiveness of the model and discuss the research content in the text. In
Section 5, we analyze and summarize the conclusions and phenomena of this study.
2. Materials and Methods
The traditional earned value method primarily focuses on static management and passive control, with limited in-depth research on proactive control and dynamic management in project execution. This approach exhibits two significant shortcomings. Firstly, it fails to adequately adapt to the practical realities of dynamic project management, resulting in limited applicability to on-site operational management. Secondly, the lack of proactive control mechanisms forces reactive management responses to project delays while demonstrating insufficient predictive capabilities and early warning systems, thereby diminishing overall project control effectiveness. This paper builds upon critical path technology, leveraging its inherent advantages in comprehensive scheduling. By integrating stochastic activity durations that reflect project timeline variability and incorporating performance-target-adjusted earned value methodology, we propose an enhanced framework for dynamic project schedule management. This approach systematically addresses temporal uncertainties while optimizing progress monitoring capabilities.
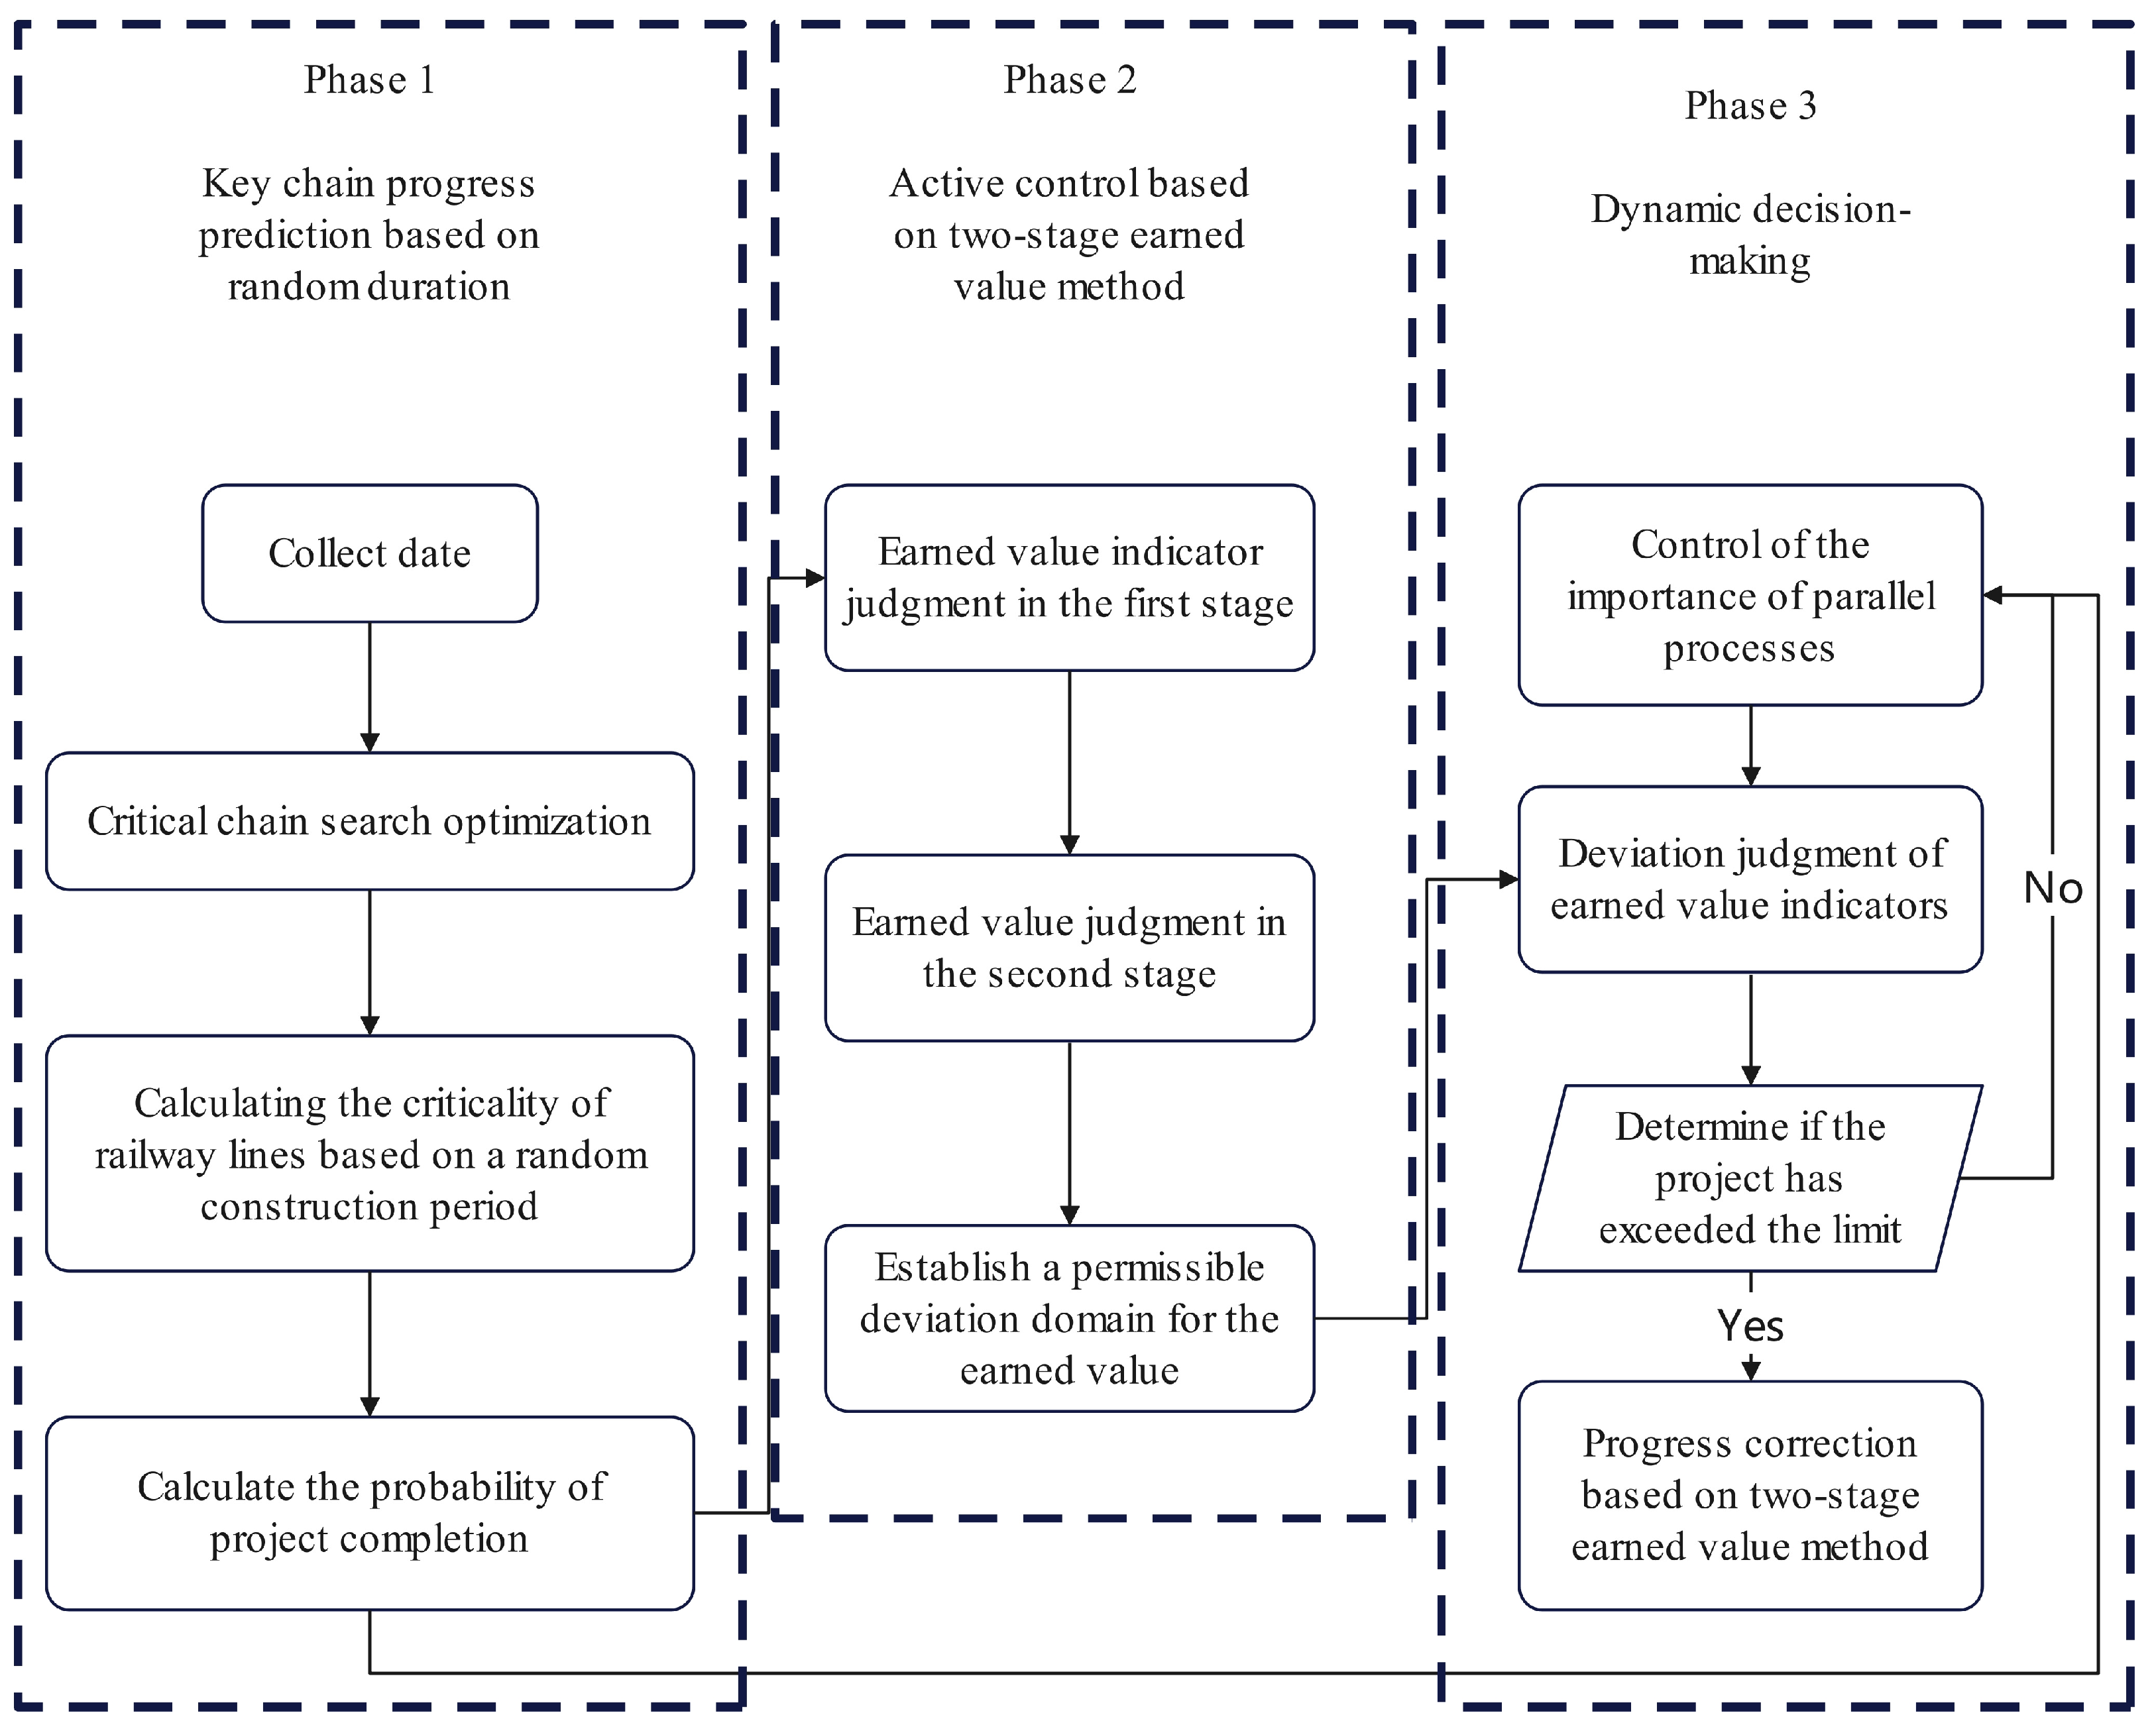
As illustrated in
Figure 1, the three-phase management framework based on this model comprises the following stages:
Phase 1: Focusing on critical path analysis with stochastic duration forecasting, this stage calculates completion probabilities for each activity and implements schedule optimization during project execution. By quantifying temporal uncertainties, it generates probabilistic scheduling solutions aligned with real-world project dynamics.
Phase 2: Leveraging a dual-path earned value method (EVM) control system, this stage establishes tolerance deviation zones for performance metrics. It integrates both corrective actions for current deviations and predictive adjustments for emerging trends, thereby enhancing proactive schedule adaptation while maintaining reactive control mechanisms. This dual optimization significantly improves dynamic management responsiveness.
Phase 3: Synthesizing outputs from the preceding phases, this final stage deploys the completion probability model and earned value tolerance thresholds for closed-loop progress control. The integrated system enables real-time monitoring and preemptive adjustments, achieving enhanced proactive control capacity throughout the project lifecycle.
This staged approach systematically transitions from probabilistic planning through adaptive control to comprehensive execution management, addressing both stochastic variability and operational uncertainties inherent in complex engineering projects.
2.1. Phase 1: Critical Path Schedule Prediction Based on Random Duration
2.1.1. Application of Random Duration
Most published work on stochastic scheduling can be divided into two categories, machine scheduling models and project scheduling models. Machine scheduling models often rely on normal distribution and exponential distribution, and the results of exponential distribution usually have good fitting [
24,
25]. The normal distribution assumes that the sum of the large and uncertain components of the processing time is consistent and applies to the central limit theorem [
26]. It has been the research direction of the randomness of construction periods for a long time. Since the pioneering work of Malcolm et al. (1959) [
25], the project scheduling model mainly relies on beta distribution because it is flexible and easy to estimate and study [
27]. However, some scholars claim that beta distribution cannot be estimated by the PERT method. Sun Fuxing pointed out its applicability through theoretical proof [
28]. However, certain conditions need to be met, and the application of practical engineering is relatively complex. M. Poshdarsup et al. found that in some production situations, it may limit its modeling ability, especially when the coefficient of variation related to process variability is higher than 100% and the limitation is obvious. At the same time, M. Poshdarsup et al. pointed out that LP3, Frechet, Dagum, and Burr were the most suitable distributions and made theoretical arguments, but they lacked more practical verification [
29], while Strum et al. 2000) [
25,
29] showed that after proposing the best fitting to date for the lognormal distribution in the simulation analysis, Dan Trietsch also proved that the lognormal distribution has some practical and rational validity in the simulation duration time [
30].
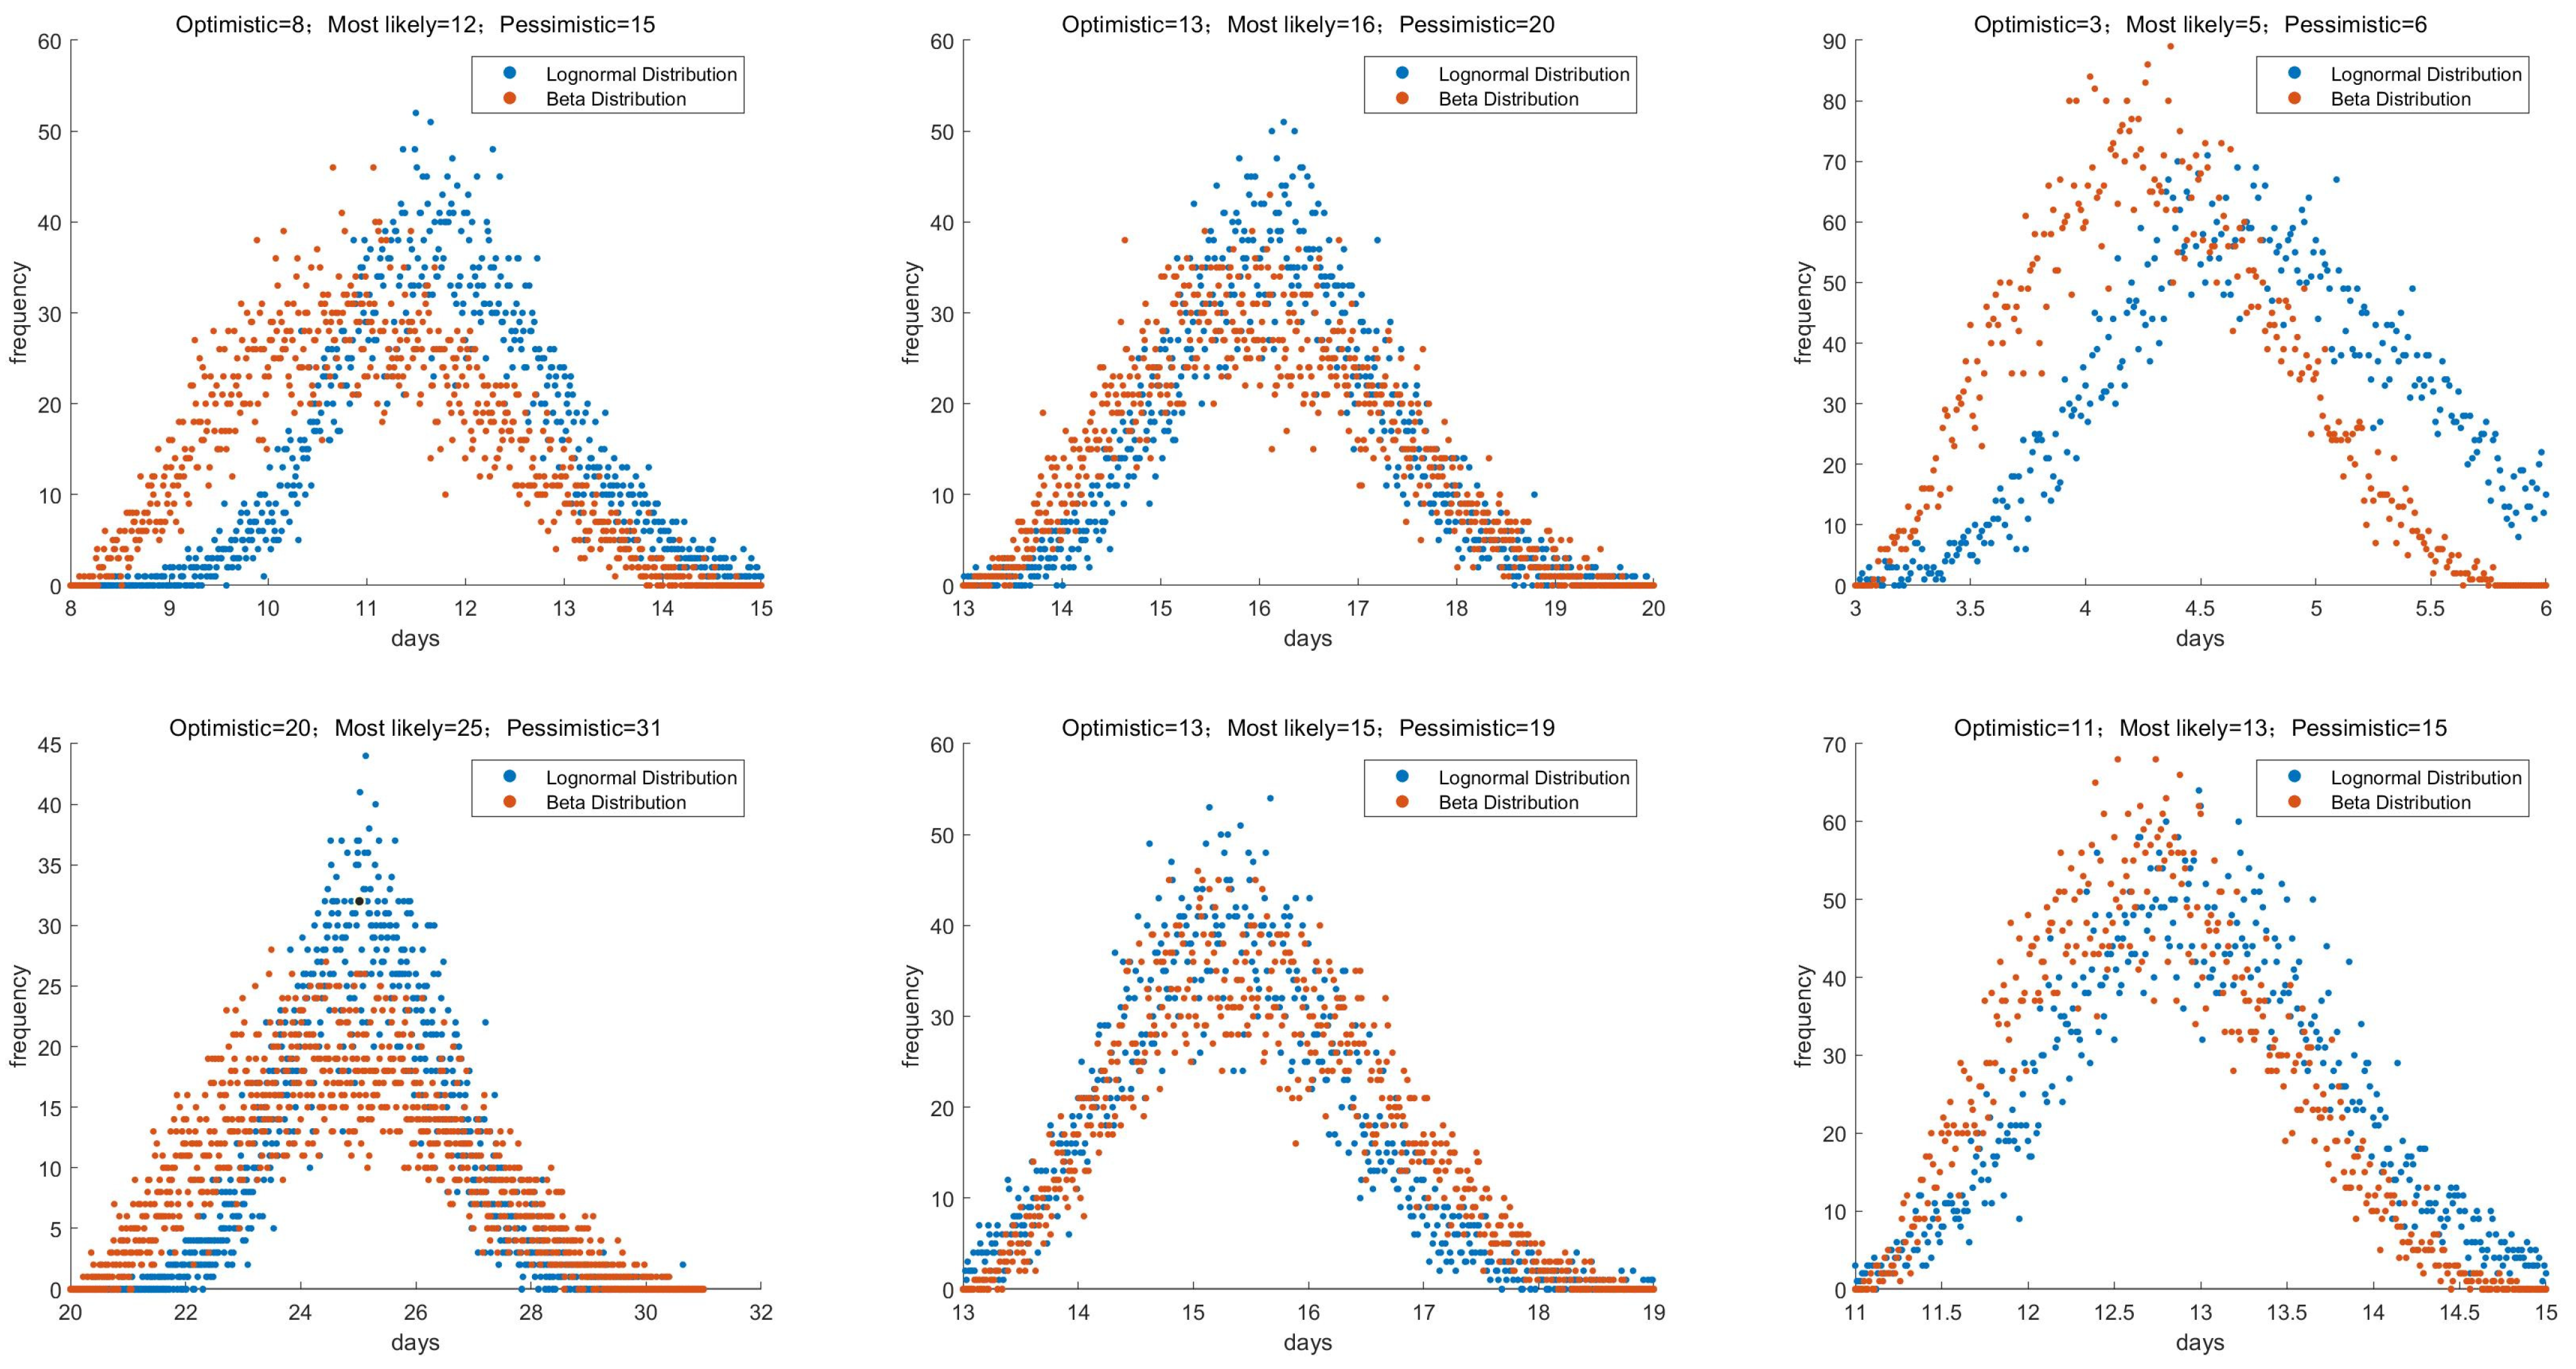
In this paper, to demonstrate that the lognormal distribution is more suitable for integration with the PERT method than the beta distribution in estimating the probability of task completion, we utilize the actual project duration completion data presented in
Table 1, which is derived from the preliminary project research mentioned later in the text. By employing Monte Carlo simulation, we model the distribution characteristics of both distribution functions.
The number of Monte Carlo simulation runs is set to N = 10,000. The simulation analysis was conducted using Matlab R2018b software, and the generated random number distributions are shown in
Figure 2.
From the simulation in
Figure 2, it can be observed that the lognormal distribution is closer to the actual project duration than the beta distribution, but the deviation is relatively small. Therefore, by introducing the concept of deviation degree, we statistically analyze the simulated durations generated by the two random distribution functions in each Monte Carlo simulation. We calculate the difference between the simulated durations and the actual completion time, sum these differences, and then compute the average value. This process yields the deviation degree of the two random functions. The formula is shown in Equation (1), and the calculated results are presented in
Table 2.
In the formula, N is the number of Monte Carlo simulation runs, is the simulated duration for the i-th Monte Carlo simulation, and Q is the actual construction duration of the process.
As can be seen from
Table 2, the lognormal distribution has a smaller deviation degree than the beta distribution and thus has an advantage in estimating the random duration of project processes in combination with the PERT method. Therefore, this paper selects the lognormal distribution as the distribution function for random duration to conduct further research.
2.1.2. Critical Path and Completion Probability Estimation
The proactive schedule optimization primarily targets pre-planning adjustments during project scheduling development. Its core objectives are to minimize potential schedule deviations during execution, elevate project management standards, and enhance project robustness. The proposed methodology involves the following steps.
Data-driven parameterization: Collecting operational parameters through comprehensive data gathering, then generating stochastic activity durations using lognormal distribution modeling that reflects each task’s probabilistic characteristics. This establishes the foundation for Monte Carlo simulation iterations.
Critical path probabilistic analysis: Conducting systematic Monte Carlo simulations, where each iteration identifies and records critical paths under varying duration scenarios. Through statistical analysis of critical path occurrences across simulations, this phase calculates the following:
Criticality frequency for individual activities;
Path criticality indices;
Project completion probability using probability-adjusted duration parameters derived from iterative refinements.
This dual-phase approach transforms traditional deterministic scheduling into a probabilistic framework, enabling quantitative risk assessment during the planning stage while preserving critical path methodology’s resource optimization benefits. The integration of stochastic modeling with critical path analytics provides measurable predictive insights for proactive schedule optimization.
Search and Optimization of Critical Path
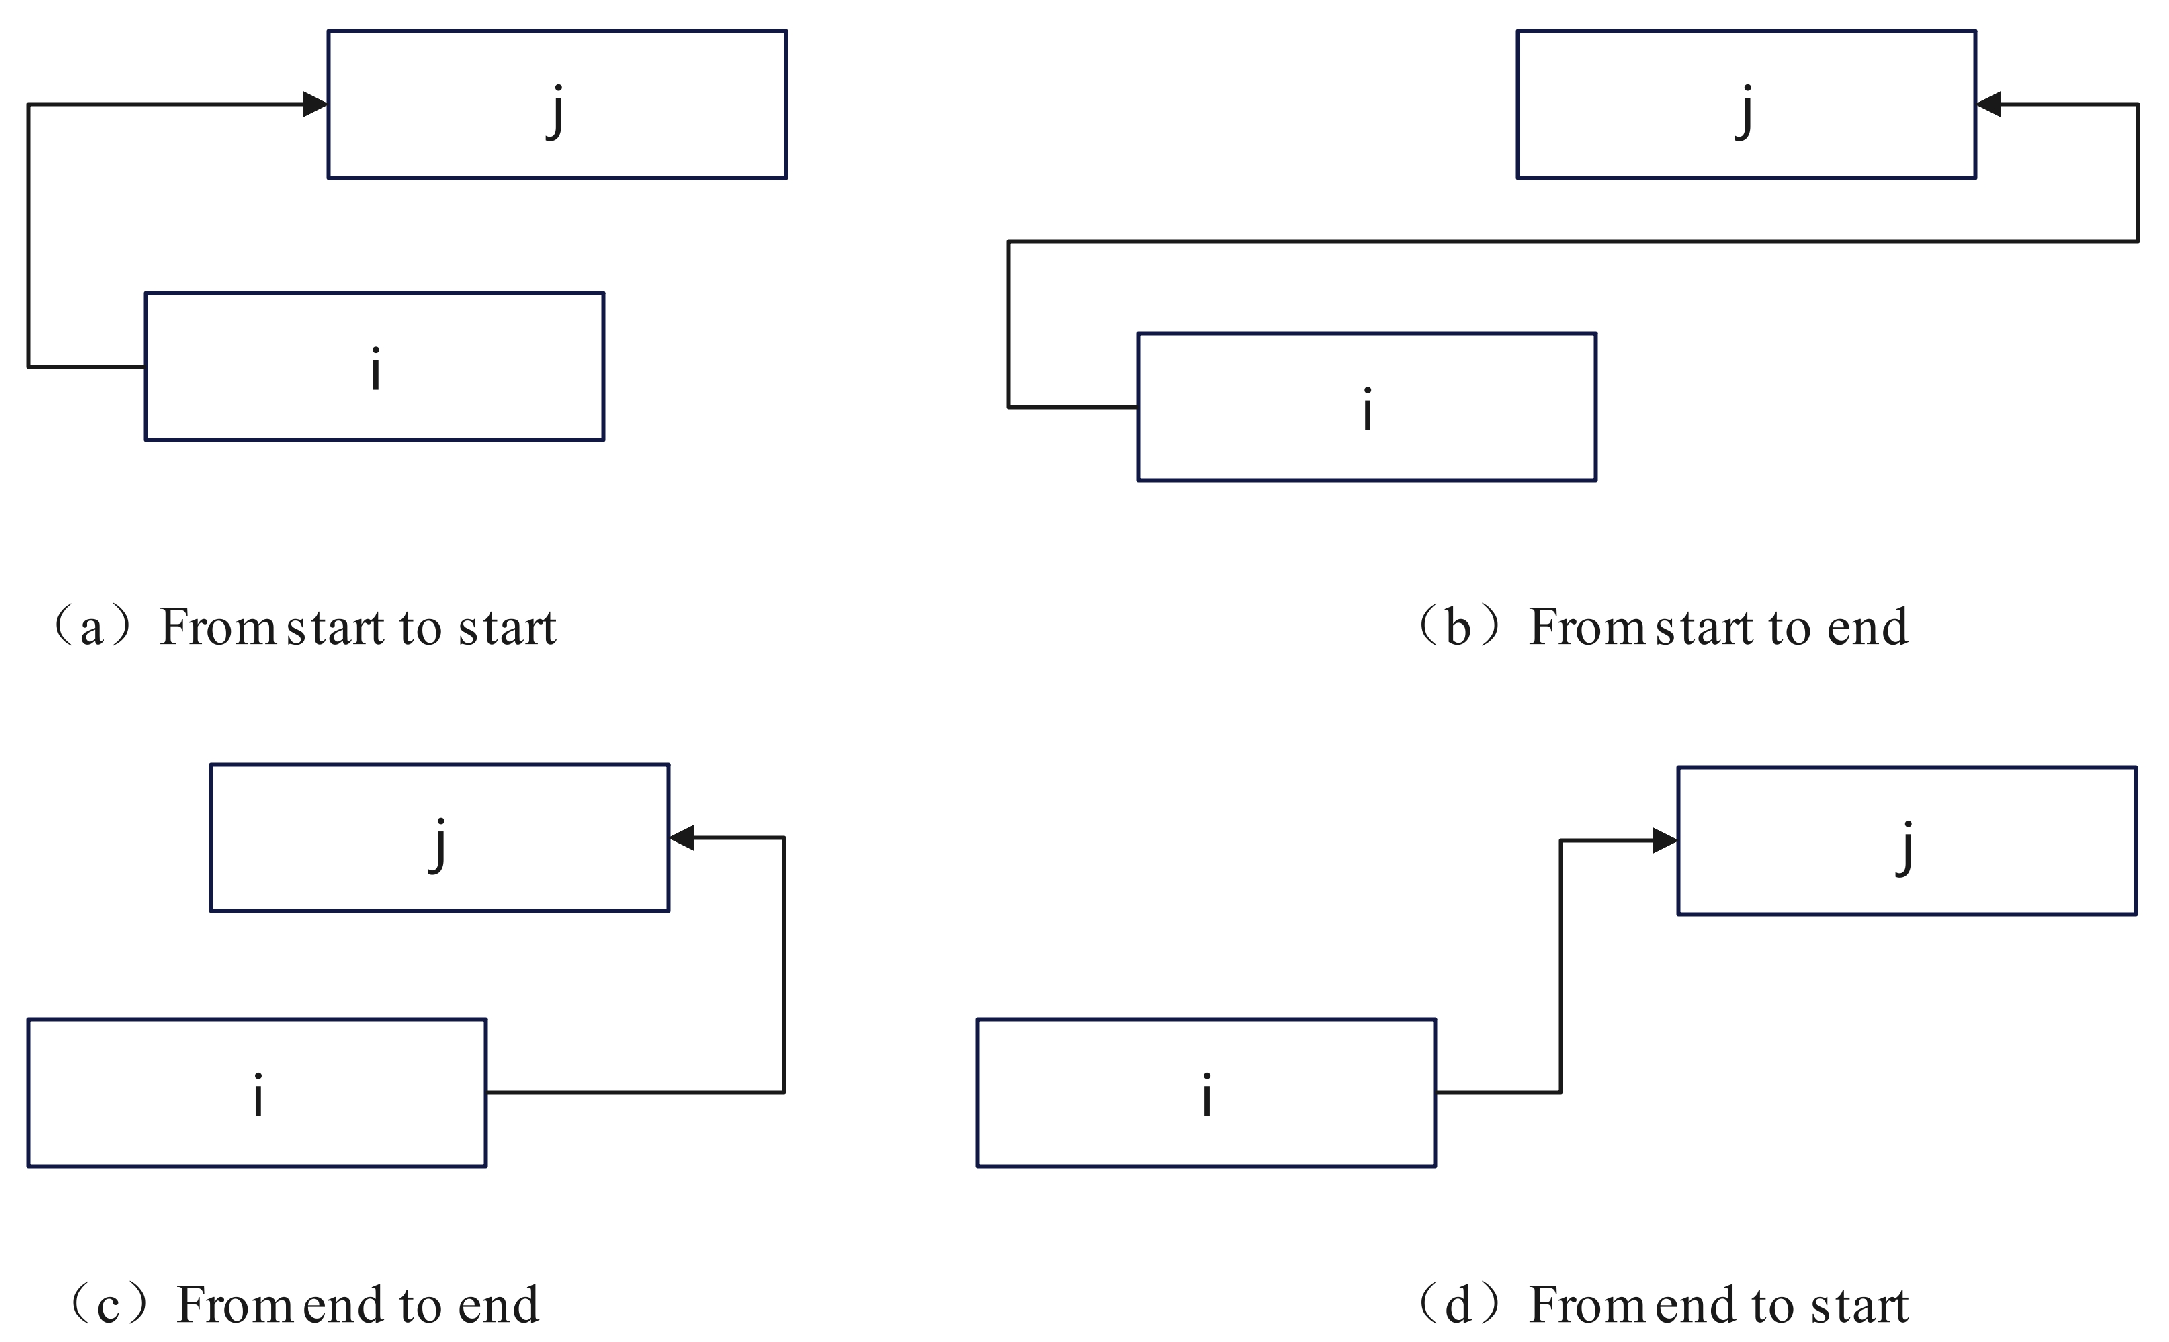
The critical path methodology operates through systematic optimization to identify a project’s critical path, which determines the minimum project duration, while strategically incorporating buffer zones at both initiation and termination points to mitigate uncertainties and enhance schedule adherence. This approach employs multi-relational constraints—including start-to-start (SS), start-to-finish (SF), finish-to-start (FS), and finish-to-finish (FF) dependencies—to analyze fundamental logical sequences and identify the critical path as the activity chain yielding the longest project duration, with the computational framework detailed in
Figure 3. To address inherent project risks, temporal buffers are systematically integrated. A project buffer is inserted at the critical path terminus to absorb cumulative schedule deviations, while feeding buffers are positioned at non-critical path convergence points to prevent delay propagation. This dual-buffer mechanism transforms deterministic scheduling into a risk-resilient framework, balancing schedule integrity with adaptability to uncertainties through probabilistic planning and real-time adjustments.
The mathematical logic relationship in the above figure is shown in Equations (2)–(5):
Maximum project duration is Equation (6):
where:
This study implements the root variance method [
31] for buffer sizing. Specifically, 50% of the estimated activity duration is allocated as the baseline execution time, with the remaining 50% aggregated as contingency buffers. These buffers are strategically distributed at critical/non-critical path interfaces and the project terminus.
The root variance method addresses the limitations of traditional cut-and-paste approaches [
31] by avoiding excessive or insufficient buffer sizing through probabilistic duration segmentation. Under the assumption of statistically independent activity durations within the schedule framework—a condition aligned with the root variance method’s application scenarios—the buffer size derivation follows Equation (7), derived through the central limit theorem. This mathematical foundation ensures buffer quantities proportionally reflect schedule uncertainty while maintaining logical consistency with the critical path’s stochastic characteristics.
where:
Calculation of Route Criticality
If there are
lines in the network plan, the overall sample
of the project duration is divided into n parts, and in the overall Monte Carlo simulation, the lines are independent of each other, so the line criticality
is introduced. The generation rules of the duration in the Monte Carlo simulation are implemented according to the lognormal distribution proposed above, where
is the number of times that the
-th process becomes a critical path operation in the simulation, and
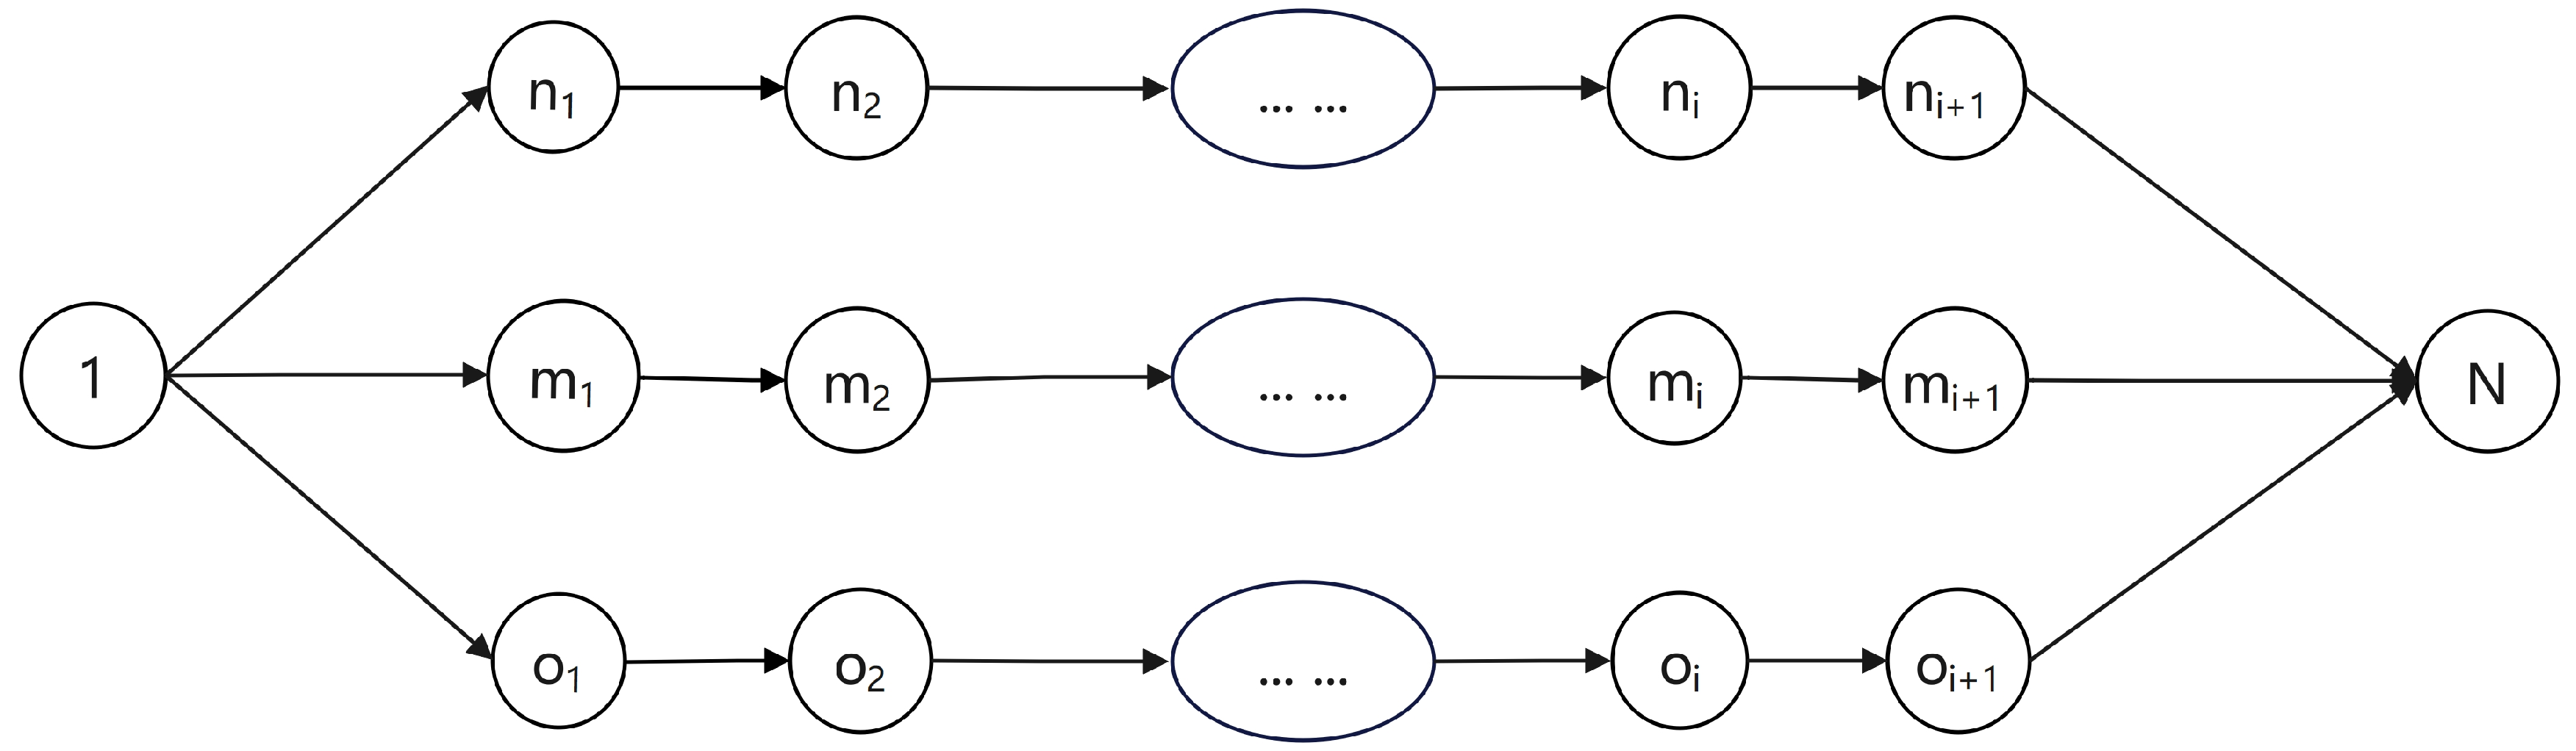
is the total number of valid simulations. Through the introduction of line criticality, the probability of completion of a single process can be calculated, and the frequency of the process becoming the main critical process can be considered, so that the overall completion probability calculation of the project is more complete. As an example in the
Figure 4 below, if there are three planned lines, the number of Monte Carlo simulations is M times, and the number of times the three lines become critical path processes is
,
, respectively. Then, the corresponding line criticality is
,
through the introduction of line criticality, and the frequency of the process becoming the main key process can be considered while calculating the completion probability of a single process, so that the overall completion probability calculation of the project is more complete.
Calculation of Process Completion Probability
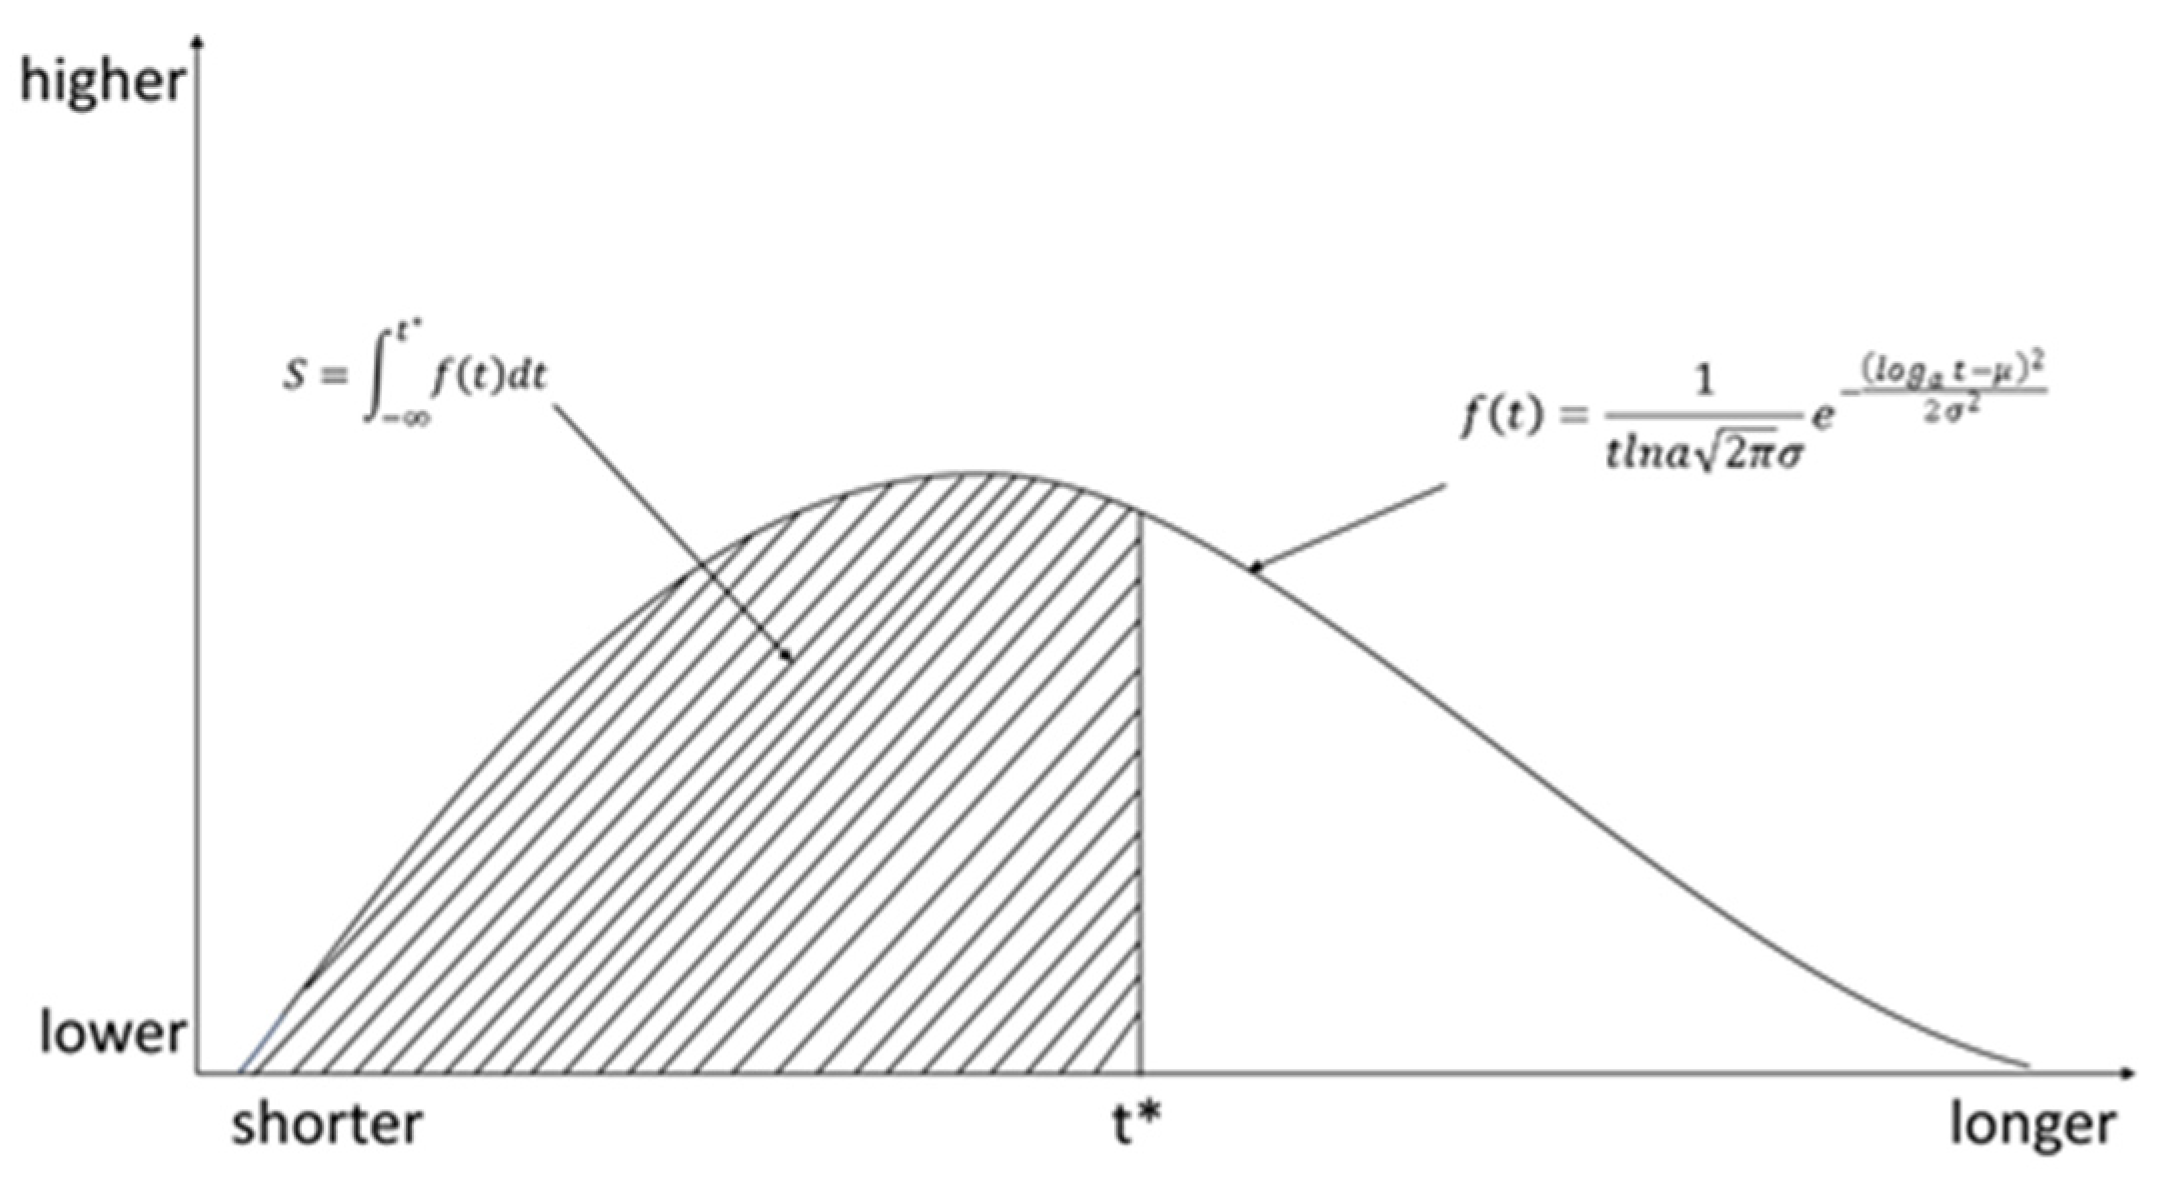
Building upon the established probability density functions for stochastic activity durations, this research employs lognormal distribution modeling to characterize task duration variability. Through integration with the PERT technique [
25], we derive probability density functions (PDFs) for individual activities. The methodology subsequently calculates completion probabilities under specified adjusted durations (
) via integral computation across these PDFs, as illustrated in
Figure 5. This dual approach of parametric distribution fitting and probabilistic calculus enables quantitative assessment of schedule execution likelihoods under predefined duration constraints.
This model treats activities on the critical path as the primary control elements. When calculating the overall project completion probability, it only computes the completion probability of activities on the critical path while incorporating the path criticality index (PCI). The calculation of the overall project completion probability is shown in Equation (8).
where
is the completion probability of the processes included in the critical path. By multiplying the completion probability (
) of the key process with the criticality (
) and averaging the average of the critical path, the overall completion probability of the project construction is obtained.
When calculating the completion probability of non-critical paths, it is only necessary to consider the completion probability of each individual process and then take the average of the sum. The calculation formula is shown in Equation (9).
In the formula, represents the completion probability of the processes included in the non-critical path of the project, and is the number of processes in the -th non-critical path. By summing the processes on the -th non-critical path and then calculating the average value, the completion probability of the -th non-critical path in the project construction is obtained.
2.2. Phase 2: Active Control of the EVM
2.2.1. Control Method of the EVM
Unlike conventional schedule management techniques, the earned value method (EVM) provides a comprehensive framework that simultaneously integrates schedule optimization, cost control, and work performance measurement through its distinctive “earned value” concept [
31]. This multidimensional approach enables project managers to (1) accurately assess current work efficiency by comparing actual progress against planned schedules during monitoring periods, generating reliable performance indicators; and (2) conduct predictive analysis for future work durations and costs based on these metrics, supporting more accurate budget forecasting and schedule evaluation for both individual and multiple projects. Particularly valuable for phased project reviews, EVM’s unique value-based measurement system significantly enhances monitoring effectiveness and early warning capabilities, ensuring better control over project execution while maintaining alignment between planned objectives and field implementation.
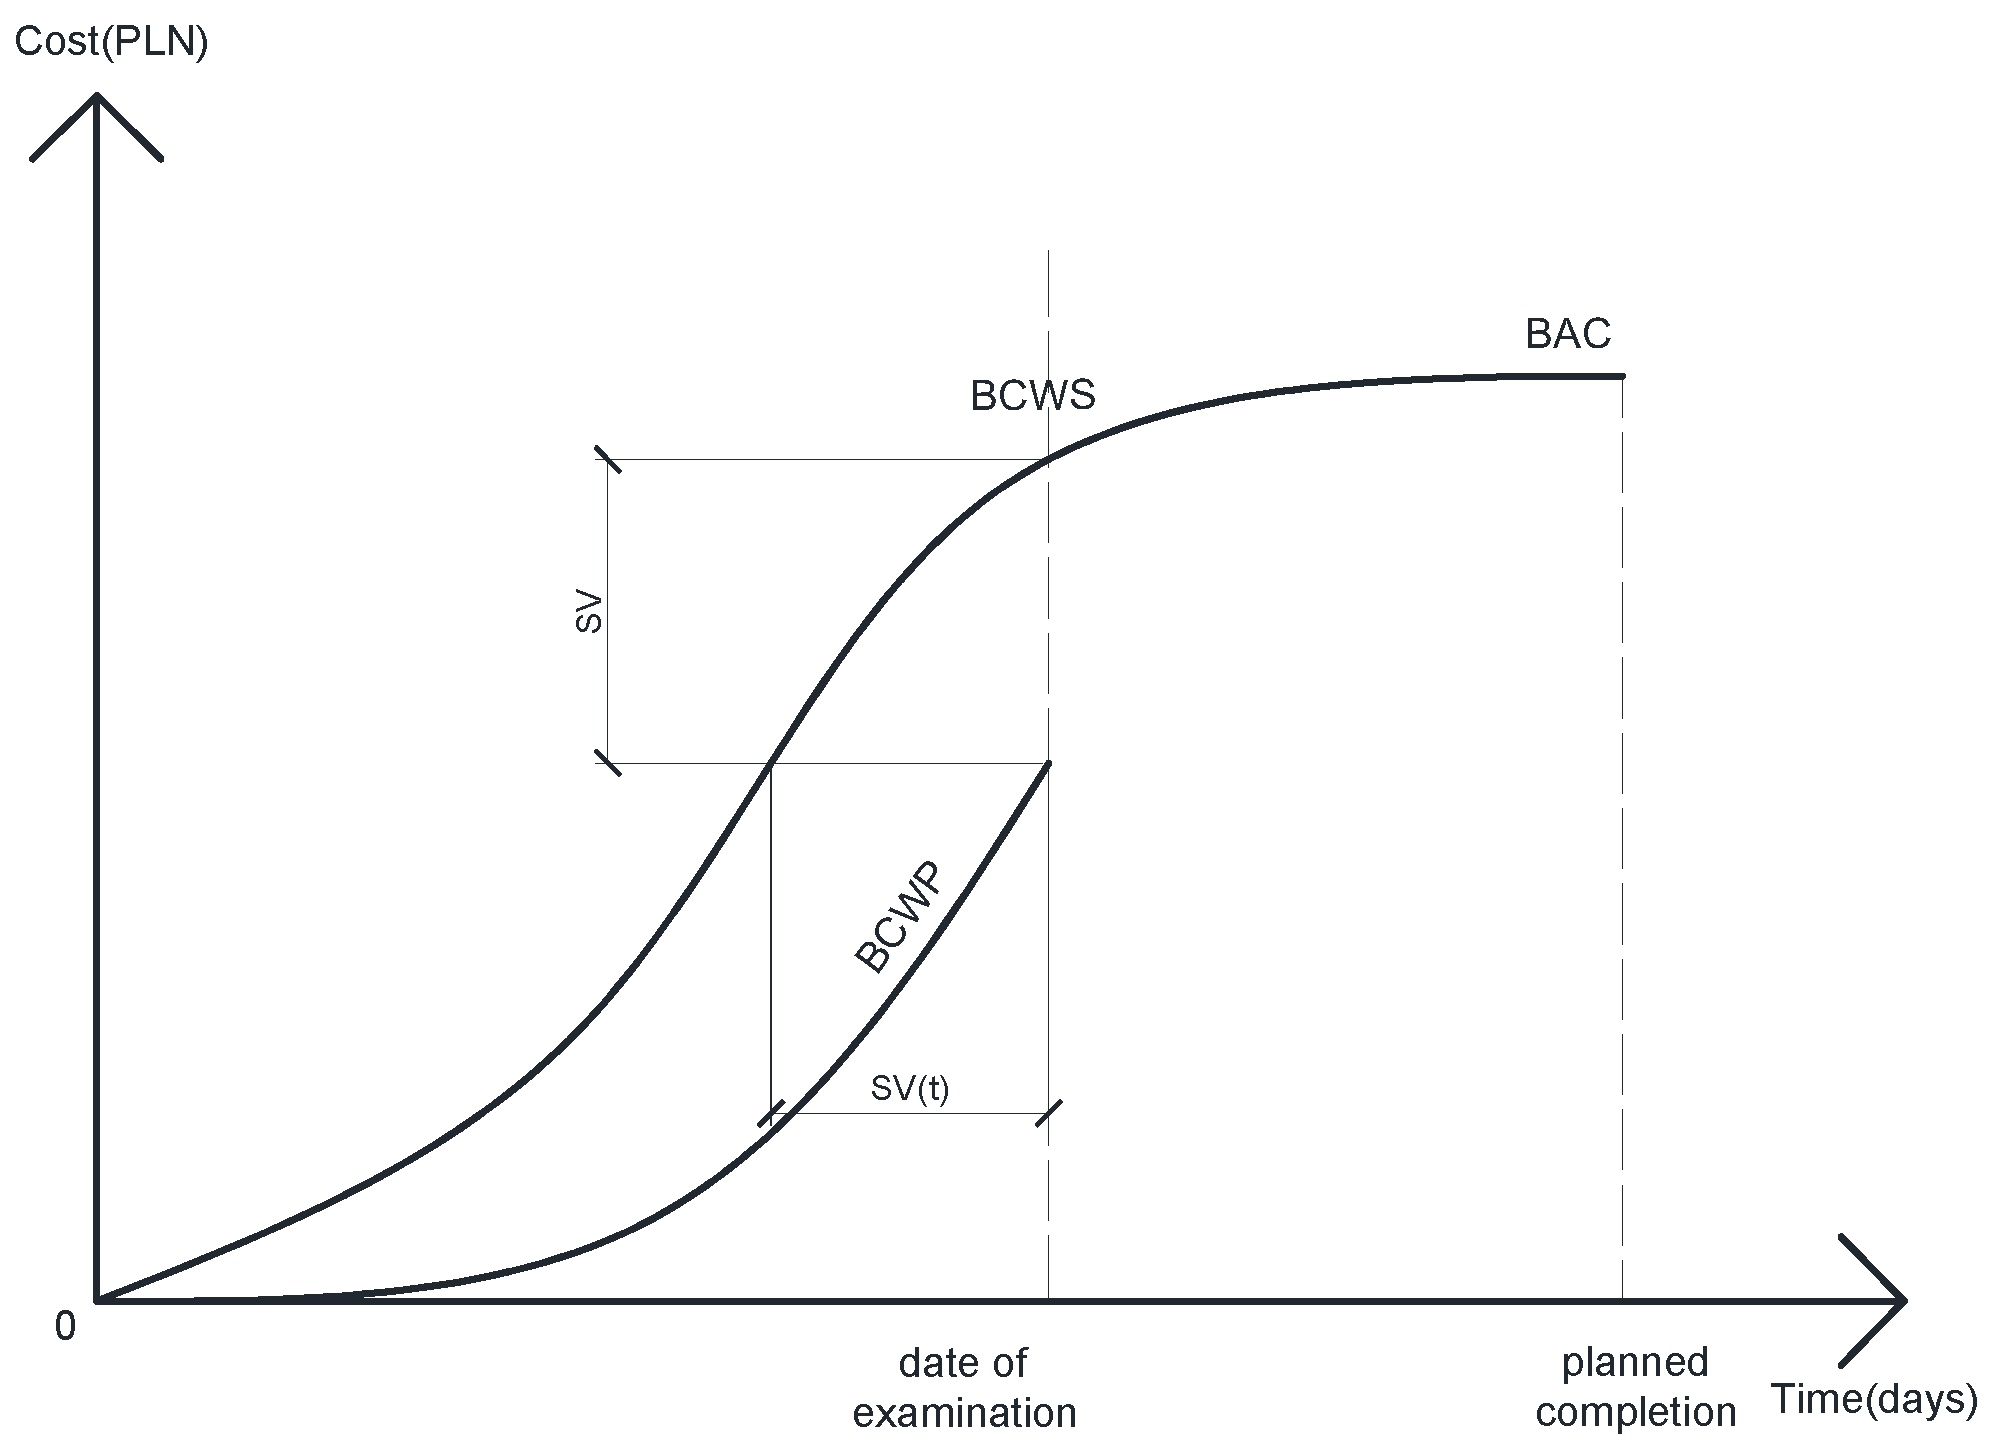
The earned value method (EVM) operates on the fundamental metric of budgeted cost of work performed (BCWP), which quantifies the planned cost of actual work completed by the inspection date [
31]. As illustrated in
Figure 6,the EVM framework incorporates three primary curves: (1) the budgeted cost of work scheduled (BCWS), established during initial project planning with its horizontal axis endpoint (BAC) representing the planned total duration and vertical axis endpoint indicating the total budget; and (2) the actual cost of work performed (ACWP), reflecting real expenditures for completed work up to the inspection date. The dashed projection beyond the inspection date demonstrates potential outcomes under current performance conditions, where the estimate at completion (EAC) indicates both the adjusted total duration (horizontal coordinate) and projected total cost (vertical coordinate) if current performance trends persist. Crucially, this framework permits dynamic optimization through post-inspection performance index adjustments that modify the ACWP trajectory—the core focus of this study’s EVM-based dynamic optimization approach. This methodology provides a robust mechanism for integrating real-time performance data with predictive schedule and cost modeling.
The mathematical model of the EVM is as follows in Equations (10)–(13):
Schedule variance (
):
Cost performance index (
):
Schedule performance index (
):
The earned value method (EVM) employs several key metrics for project performance analysis. BCWP (budgeted cost of work performed) represents the planned cost of actual work completed by the inspection date; ACWP (actual cost of work performed) denotes the actual expenditure for completed work; and BCWS (budgeted cost of work scheduled) indicates the planned cost of scheduled work up to the inspection date. Performance variances are quantified through CV (cost variance, reflecting budget deviations) and SV (schedule variance, measuring timeline discrepancies using planned cost benchmarks). The EV (earned value) metric captures the budgeted cost of completed work, while the CPI (cost performance index, the ratio of earned value to actual cost) determines budget compliance, and the SPI (schedule performance index, comparing earned value to planned value) assesses schedule adherence. The EAC (estimate at completion) projection, with its horizontal coordinate representing the anticipated total duration and vertical coordinate showing estimated total investment at current performance levels, provides a comprehensive forecast of project outcomes under existing conditions. These integrated metrics form a robust framework for real-time project monitoring and predictive performance analysis.
Figure 6 illustrates schedule variance under the assumption of a linear cost–schedule relationship, which, while operationally valid, presents visualization limitations. To address this,
Figure 7 demonstrates schedule deviation at fixed cost levels, where SV(t) quantitatively represents the temporal variance between actual and planned progress under identical expenditure conditions. This alternative representation provides more intuitive analysis of schedule performance while maintaining methodological rigor in variance measurement. The comparative visualization approach enhances interpretability of schedule deviations without compromising the analytical framework’s technical validity.
2.2.2. EVM Control Based on Performance Indicators
The earned value method (EVM), while widely recognized as an effective tool for project scheduling and cost control, has traditionally been primarily employed for completion risk assessment rather than performance management. This study advances EVM application by integrating it with critical path technology to develop a proactive performance management framework. Specifically, we propose a performance-based EVM approach that (1) forecasts performance indices through predictive modeling, (2) establishes project-specific performance targets based on historical organizational performance data, and (3) implements front-loaded control mechanisms. This integration enhances management precision by shifting from reactive monitoring to preemptive performance optimization, thereby increasing the scientific rigor of project control processes while maintaining the EVM’s core analytical strengths. The proposed methodology represents a significant evolution in performance-oriented project management applications of earned value analysis.
The modified two-stage earned value method (EVM) primarily takes into account both the randomness of schedule fluctuations and the macro and micro perspectives of EVM control. Firstly, in terms of the random fluctuations in schedule duration, this paper, through the discussion in Stage 1, develops a stochastic schedule fluctuation model based on the lognormal distribution. Here, the concepts of the maximum buffer consumption rate () and the project cost fluctuation alert rate () are introduced. In terms of data relationships, reflects the maximum proportion of buffer duration consumption acceptable to project managers, while reflects the proportion of target cost fluctuations acceptable to managers. In application, once is determined, it is multiplied by the corresponding buffer to obtain the overall buffer consumption ratio. Similarly, once is determined, it is multiplied by the target cost to obtain the project cost alert fluctuation rate. Here, and reflect the control strength of project managers over schedule and cost. In setting the values of these indicators, they are usually determined based on the completion results demonstrated by the project management team in similar previously completed projects, combined with the management expectations for the target project.
This study implements a dual-control mechanism evaluating project management tolerance thresholds through two key dimensions: (1) maximum allowable activity duration extension ratios, and (2) cost overrun rates. These metrics quantitatively reflect managerial capacity for stochastic event mitigation, where duration tolerance corresponds to integral values under probability density functions for activity completion times, operationally representing permissible buffer consumption limits. For cost control, the maximum allowable fluctuation rate derives from project-specific cost benefit analyses, establishing financially viable performance index boundaries. Through critical path identification, the methodology proportionally allocates feeding buffers and project buffers across activity chains based on duration characteristics, creating a risk-balanced control framework that synchronizes temporal and financial contingency management while maintaining operational feasibility. The integrated approach provides measurable indicators of both schedule resilience and cost-control effectiveness within probabilistic project environments.
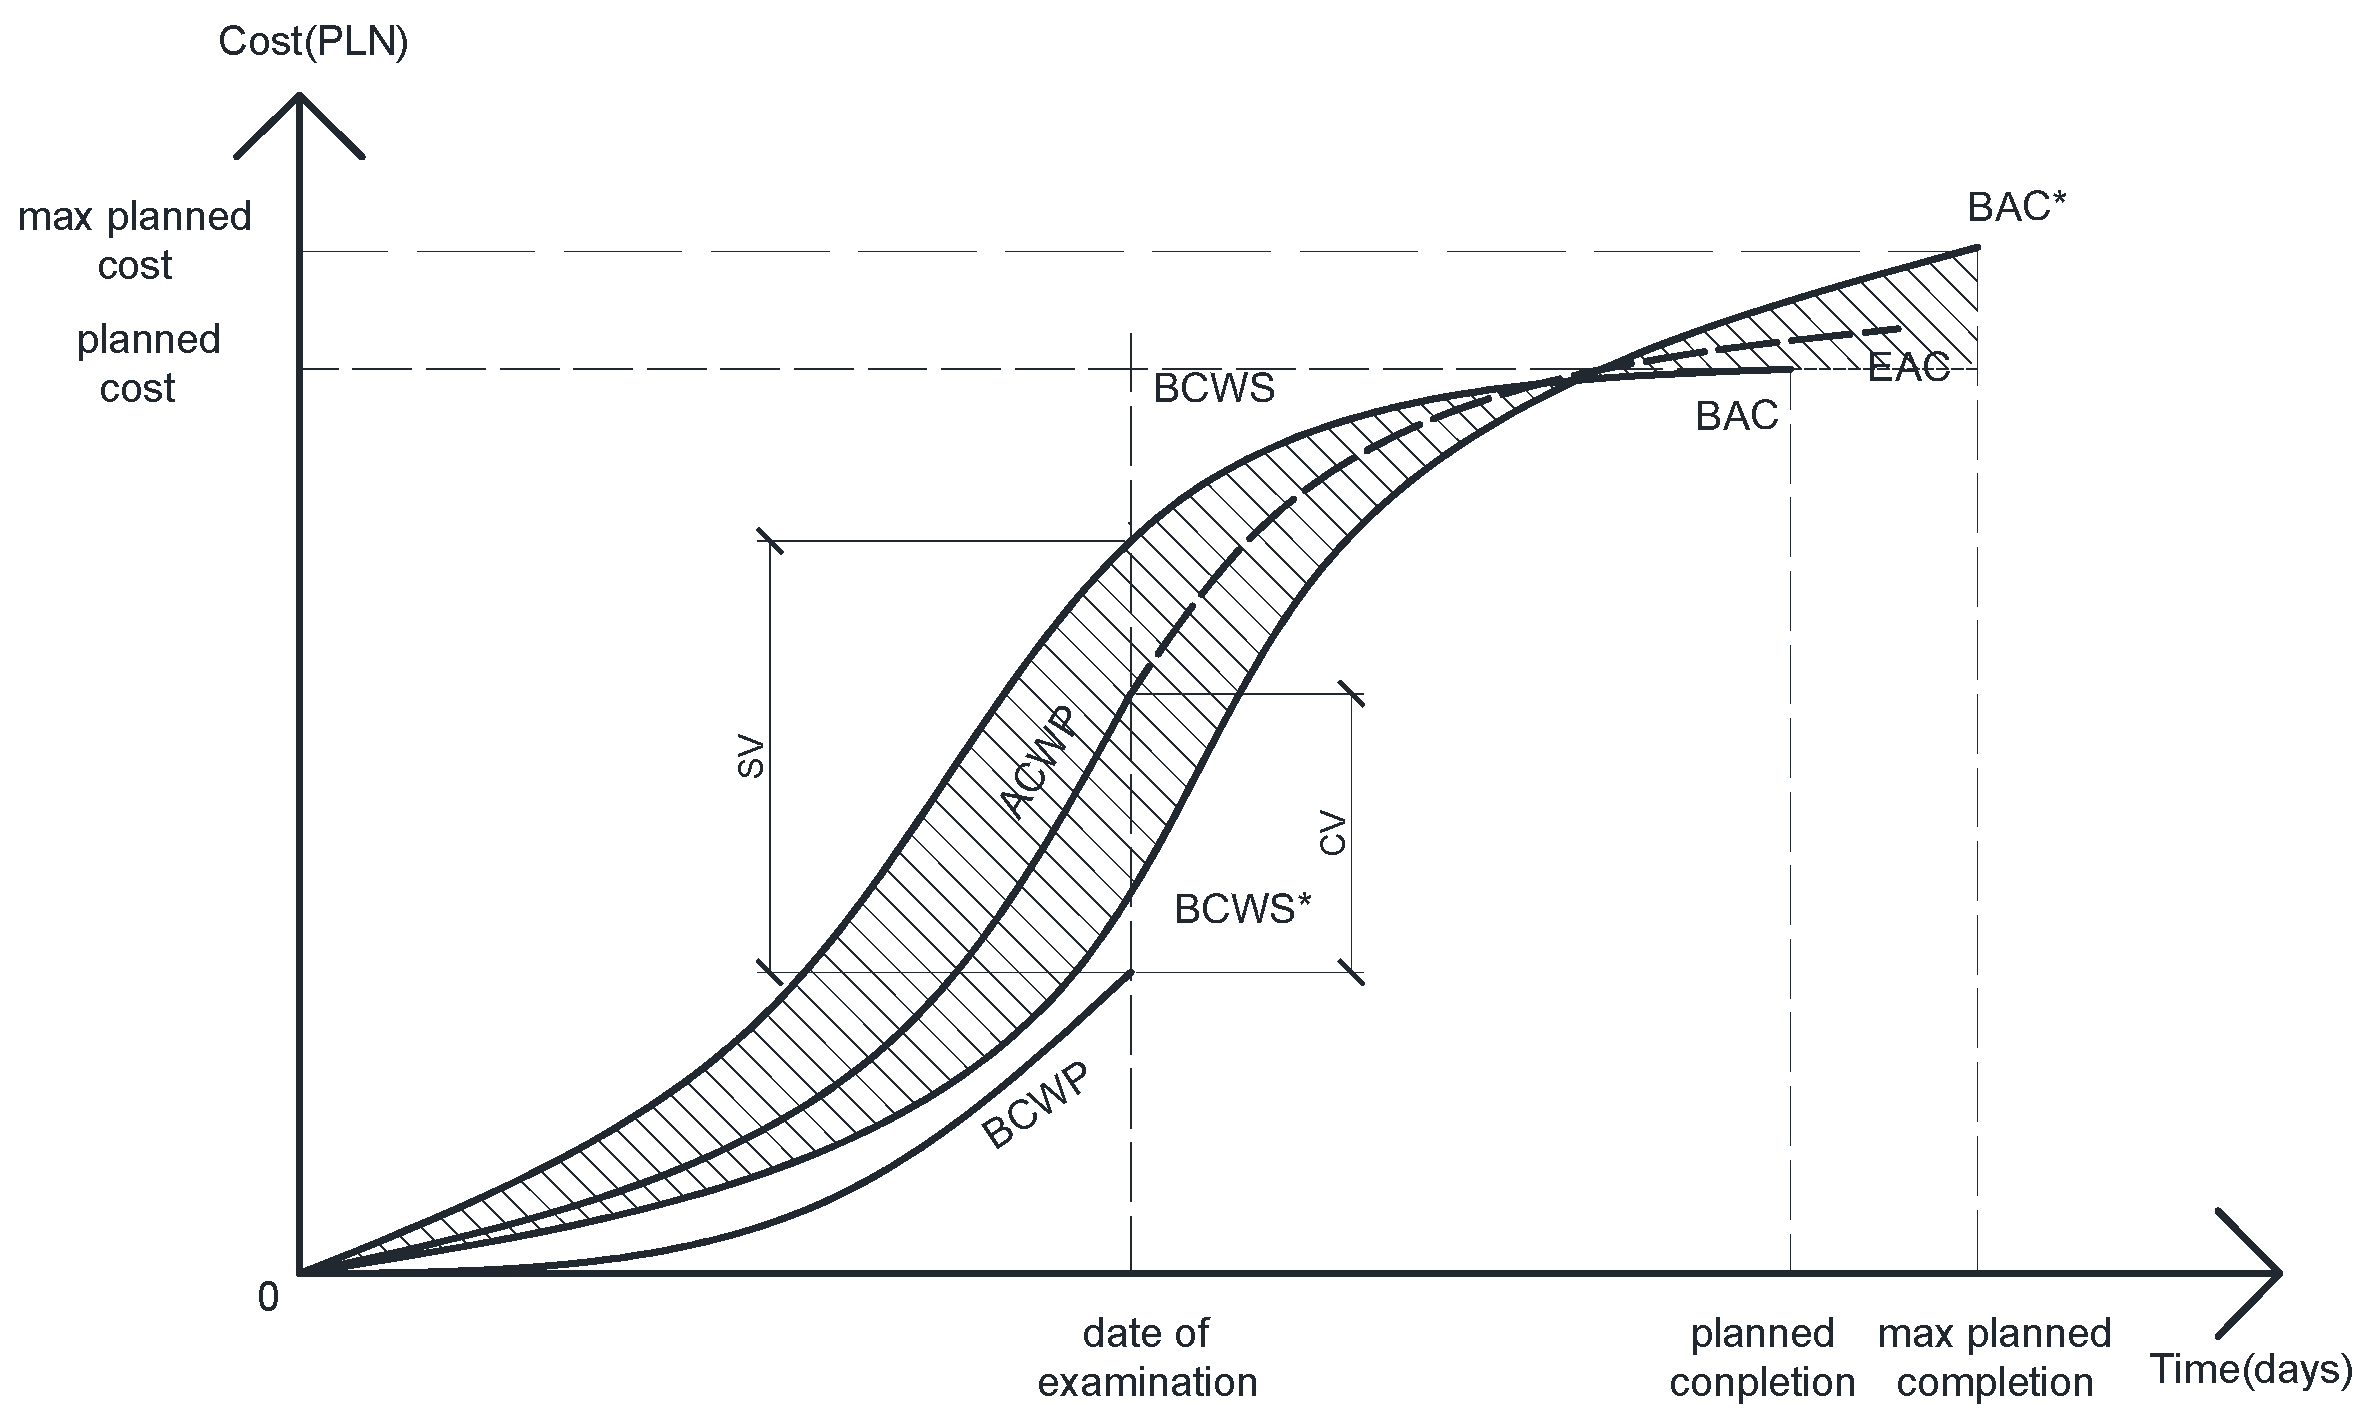
Building upon this foundation, the critical path optimization yields the project schedule, which is then probabilistically refined through integration with the earned value method (EVM) model, as illustrated in
Figure 8. The figure retains all original notations while introducing the BCWS* curve—a derived EVM trajectory representing the maximum permissible buffer consumption rate (
) and cost fluctuation threshold (
) established by project management. This curve’s shaded area delineates the acceptable performance index fluctuation range, bounded mathematically by Equations (14) and (15), with its lower threshold marking the deviation alert line for schedule and cost-control interventions. The non-shaded region below signifies unacceptable variance, triggering mandatory corrective actions to maintain schedule compliance and cost risk mitigation. The BCWS* curve’s derivation incorporates both the calculated maximum allowable duration extensions and cost ceilings, operationalizing the probabilistic control boundaries through integrated schedule–cost performance monitoring.
2.2.3. Correction and Prediction Based on Deviation Points
Identification and Correction of Deviation Points
The described methodology constitutes the first phase of performance-index-based earned value method (EVM) refinement, focusing on macro-level assessment of project schedule–cost variances. Building upon this foundation, the second phase implements EVM correction at a micro-level by targeting specific deviated activities for optimization. This granular approach involves magnifying performance deviations to evaluate individual activity variances, as illustrated in
Figure 9. The second-phase EVM analysis transitions from project-wide evaluation to discrete activity-level correction, enabling precise identification and rectification of operational discrepancies while maintaining alignment with the established macro-performance framework. This two-tiered refinement process systematically progresses from comprehensive variance detection to targeted activity optimization, ensuring both strategic control and tactical adjustment capabilities.
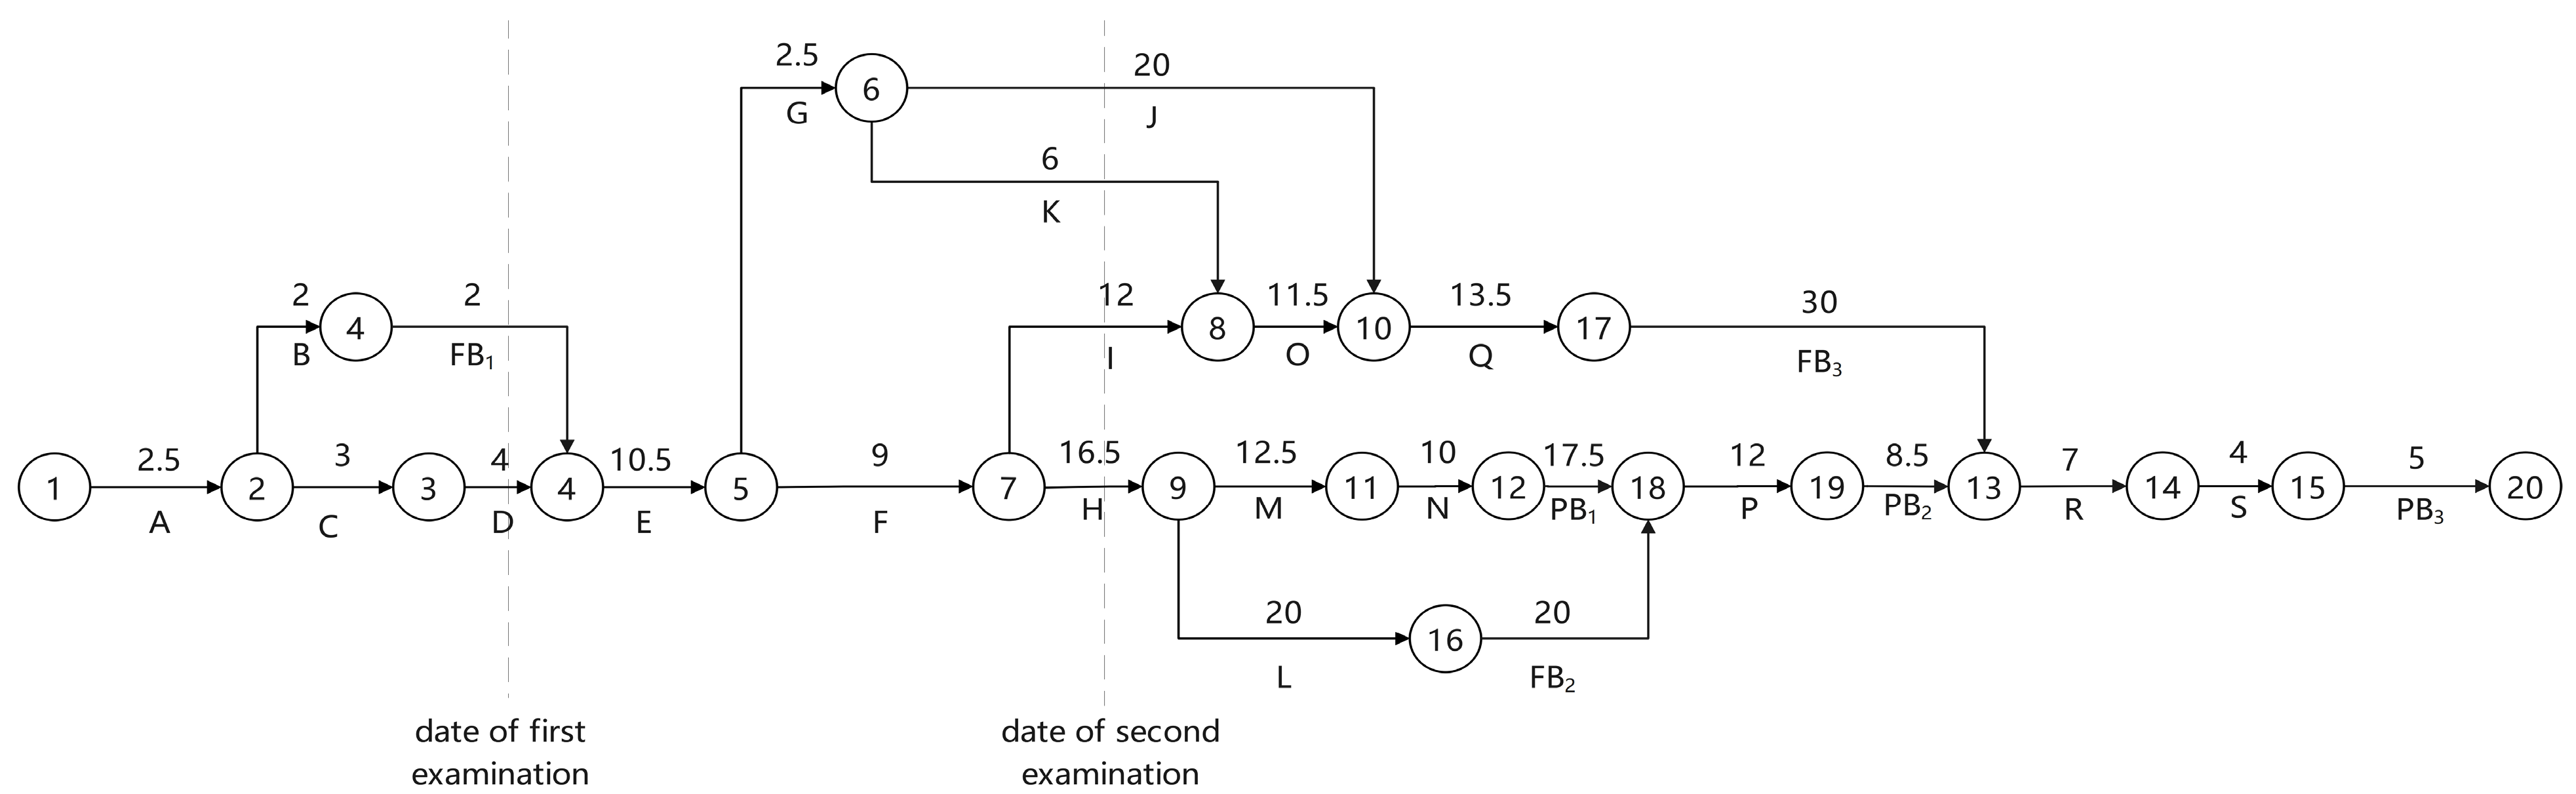
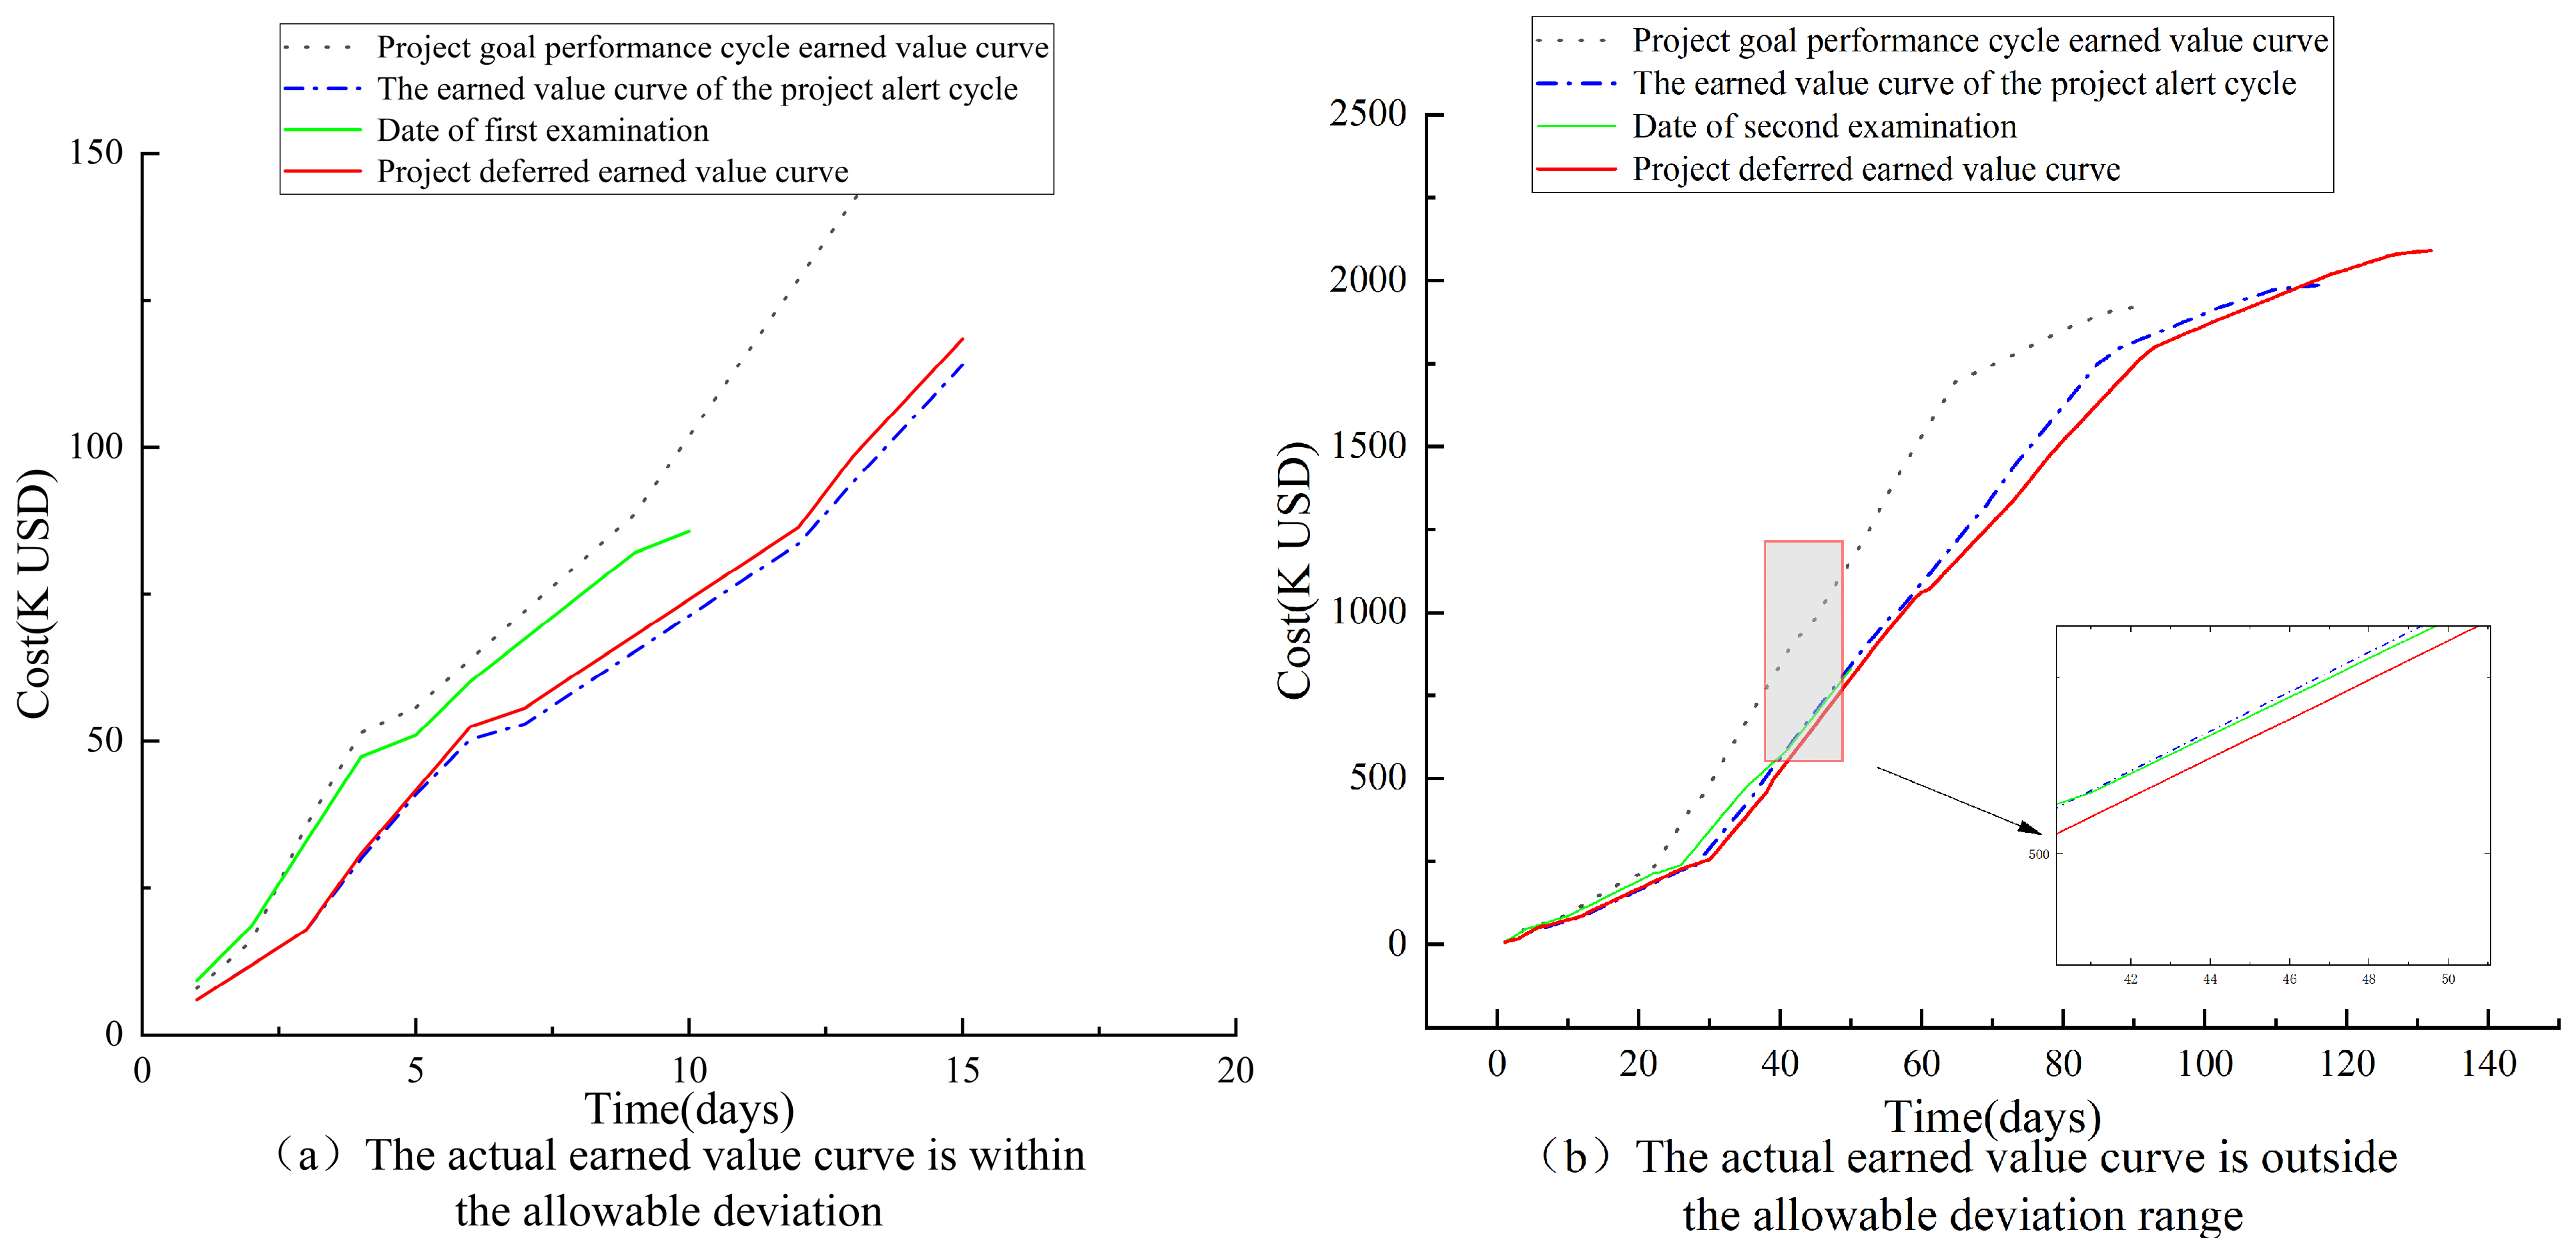
Figure 9 demonstrates the monitoring process across two inspection points. During the first inspection, while the ACWP curve deviates from the BCWS curve, it remains within the acceptable tolerance zone (shaded area), thus requiring no immediate adjustment. However, by the second inspection, the ACWP curve exceeds permissible variance thresholds, necessitating corrective optimization. For clarity, the diagram magnifies a representative activity sequence at Inspection Point 2, modeled with basic finish–start relationships. The schematic includes (1) a timeline baseline showing planned durations, (2) a lower section indicating scheduled progress with hatched tolerance zones, where solid black represents the minimum required completion, and (3) an upper section displaying actual progress, with solid black denoting work completed by Inspection 2. This visualization confirms the activity’s delay risk, prompting necessary schedule replanning and dynamic completion probability reassessment to determine recoverability. The methodology exemplifies proactive variance management through tiered monitoring, from macro-level trend tracking to micro-level activity correction.
Modified Prediction Based on Deviation Points
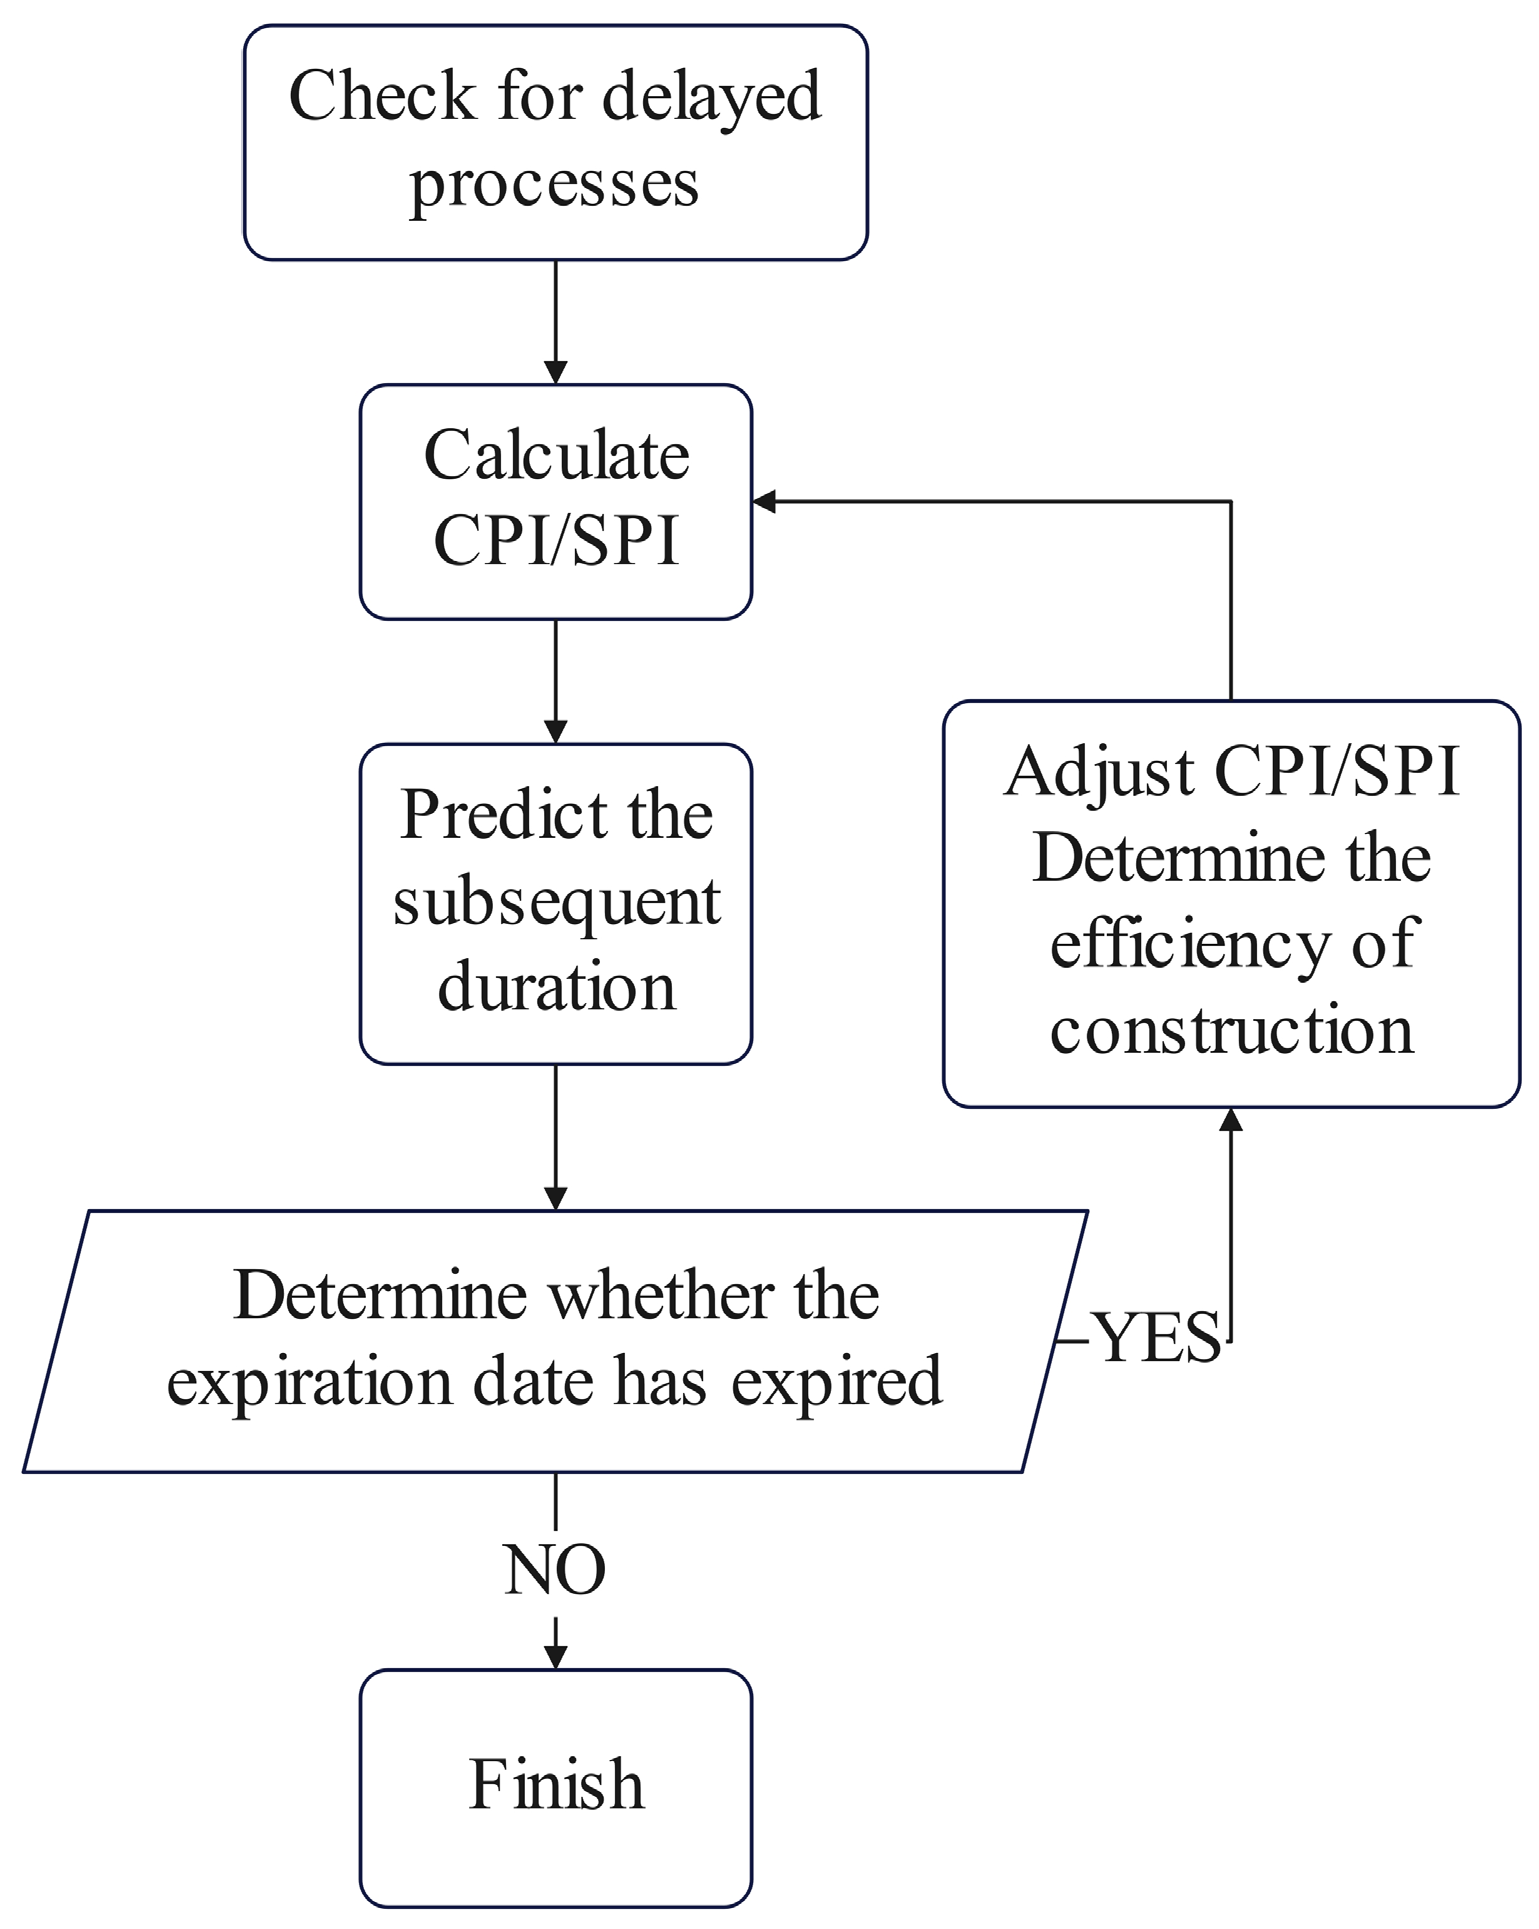
The study employs earned value method (EVM) performance indices (CPI and SPI) to forecast subsequent activity completion and assess overall project duration and cost under current performance conditions. As illustrated in
Figure 9, if schedule delays occur, the derived CPI and SPI values are used to project whether localized deviations will propagate to impact the total project duration and budget. Should projections indicate potential delays or cost overruns, corrective measures are implemented to optimize EVM performance metrics and realign execution with project objectives. The predictive correction process, detailed in
Figure 10, systematically evaluates whether adjusted performance levels meet overall project requirements, ensuring proactive schedule and cost control through performance-based forecasting.
2.3. Phase 3: Dynamic Decision-Making
2.3.1. Proactive Scheduling Decision
This study develops a probabilistic scheduling framework by integrating critical path analysis with stochastic duration modeling to calculate activity completion probabilities. The methodology enables data-driven decision-making by (1) evaluating concurrent activity execution priorities through critical path identification and (2) optimizing managerial resource allocation based on quantified completion probabilities. The dual approach of critical path analysis and probabilistic forecasting enhances management efficiency by concentrating oversight on high-risk activities while reducing unnecessary monitoring costs, ultimately improving project control effectiveness through statistically informed prioritization.
As demonstrated in
Figure 11, the proposed methodology accurately calculates completion probabilities for three concurrent workstreams, enabling (1) data-driven prioritization of parallel activities and (2) optimized resource allocation during multi-threaded project execution. This probabilistic approach enhances both technical decision-making and managerial efficiency by quantitatively identifying critical parallel paths requiring focused oversight while maintaining computational tractability through discrete event simulation. The framework’s capability to evaluate multiple concurrent workstreams represents a significant advancement over traditional linear scheduling methods, particularly for complex projects with interdependent parallel activities.
This study proposes a hybrid methodology integrating critical path analysis with stochastic duration modeling to establish a scientifically grounded project control hierarchy. The framework operates on two decision tiers: (1) a primary control focus on critical path activities dictated by network topology, and (2) secondary prioritization of non-critical tasks based on comparative completion probability analysis, with preferential attention given to lower-probability activities to mitigate delay risks. This dual-criteria approach generates optimized oversight sequences that systematically address both structural criticality and probabilistic uncertainty, resulting in macro-level management efficiency through risk-proportionate resource allocation.
2.3.2. Reactive Scheme Scheduling Decision
As demonstrated in
Figure 8, the modified earned value method (EVM) was employed during project initiation to establish permissible deviation thresholds, forming a quantitative control framework. Throughout project execution, EVM performance indices (detailed in
Table 3) serve as key monitoring metrics, enabling (1) real-time assessment of schedule adherence through systematic variance analysis and (2) data-driven management interventions when deviations exceed predefined tolerance limits. This integrated approach combines proactive baseline establishment with responsive performance tracking, creating a closed-loop control system that maintains alignment between planned objectives and actual progress while providing actionable insights for timely corrective measures.
4. Result and Discussion
The methodology outlined in
Section 2 was applied to the case study presented in
Section 3. Practical implementation confirmed the feasibility of the model, yielding a final project cost of USD 1,970,000 and an actual construction duration of 108 days. Compared to the initial critical path solution, this represents a schedule reduction of 28.5 days and a cost saving of USD 119,000. A comparison with the data in
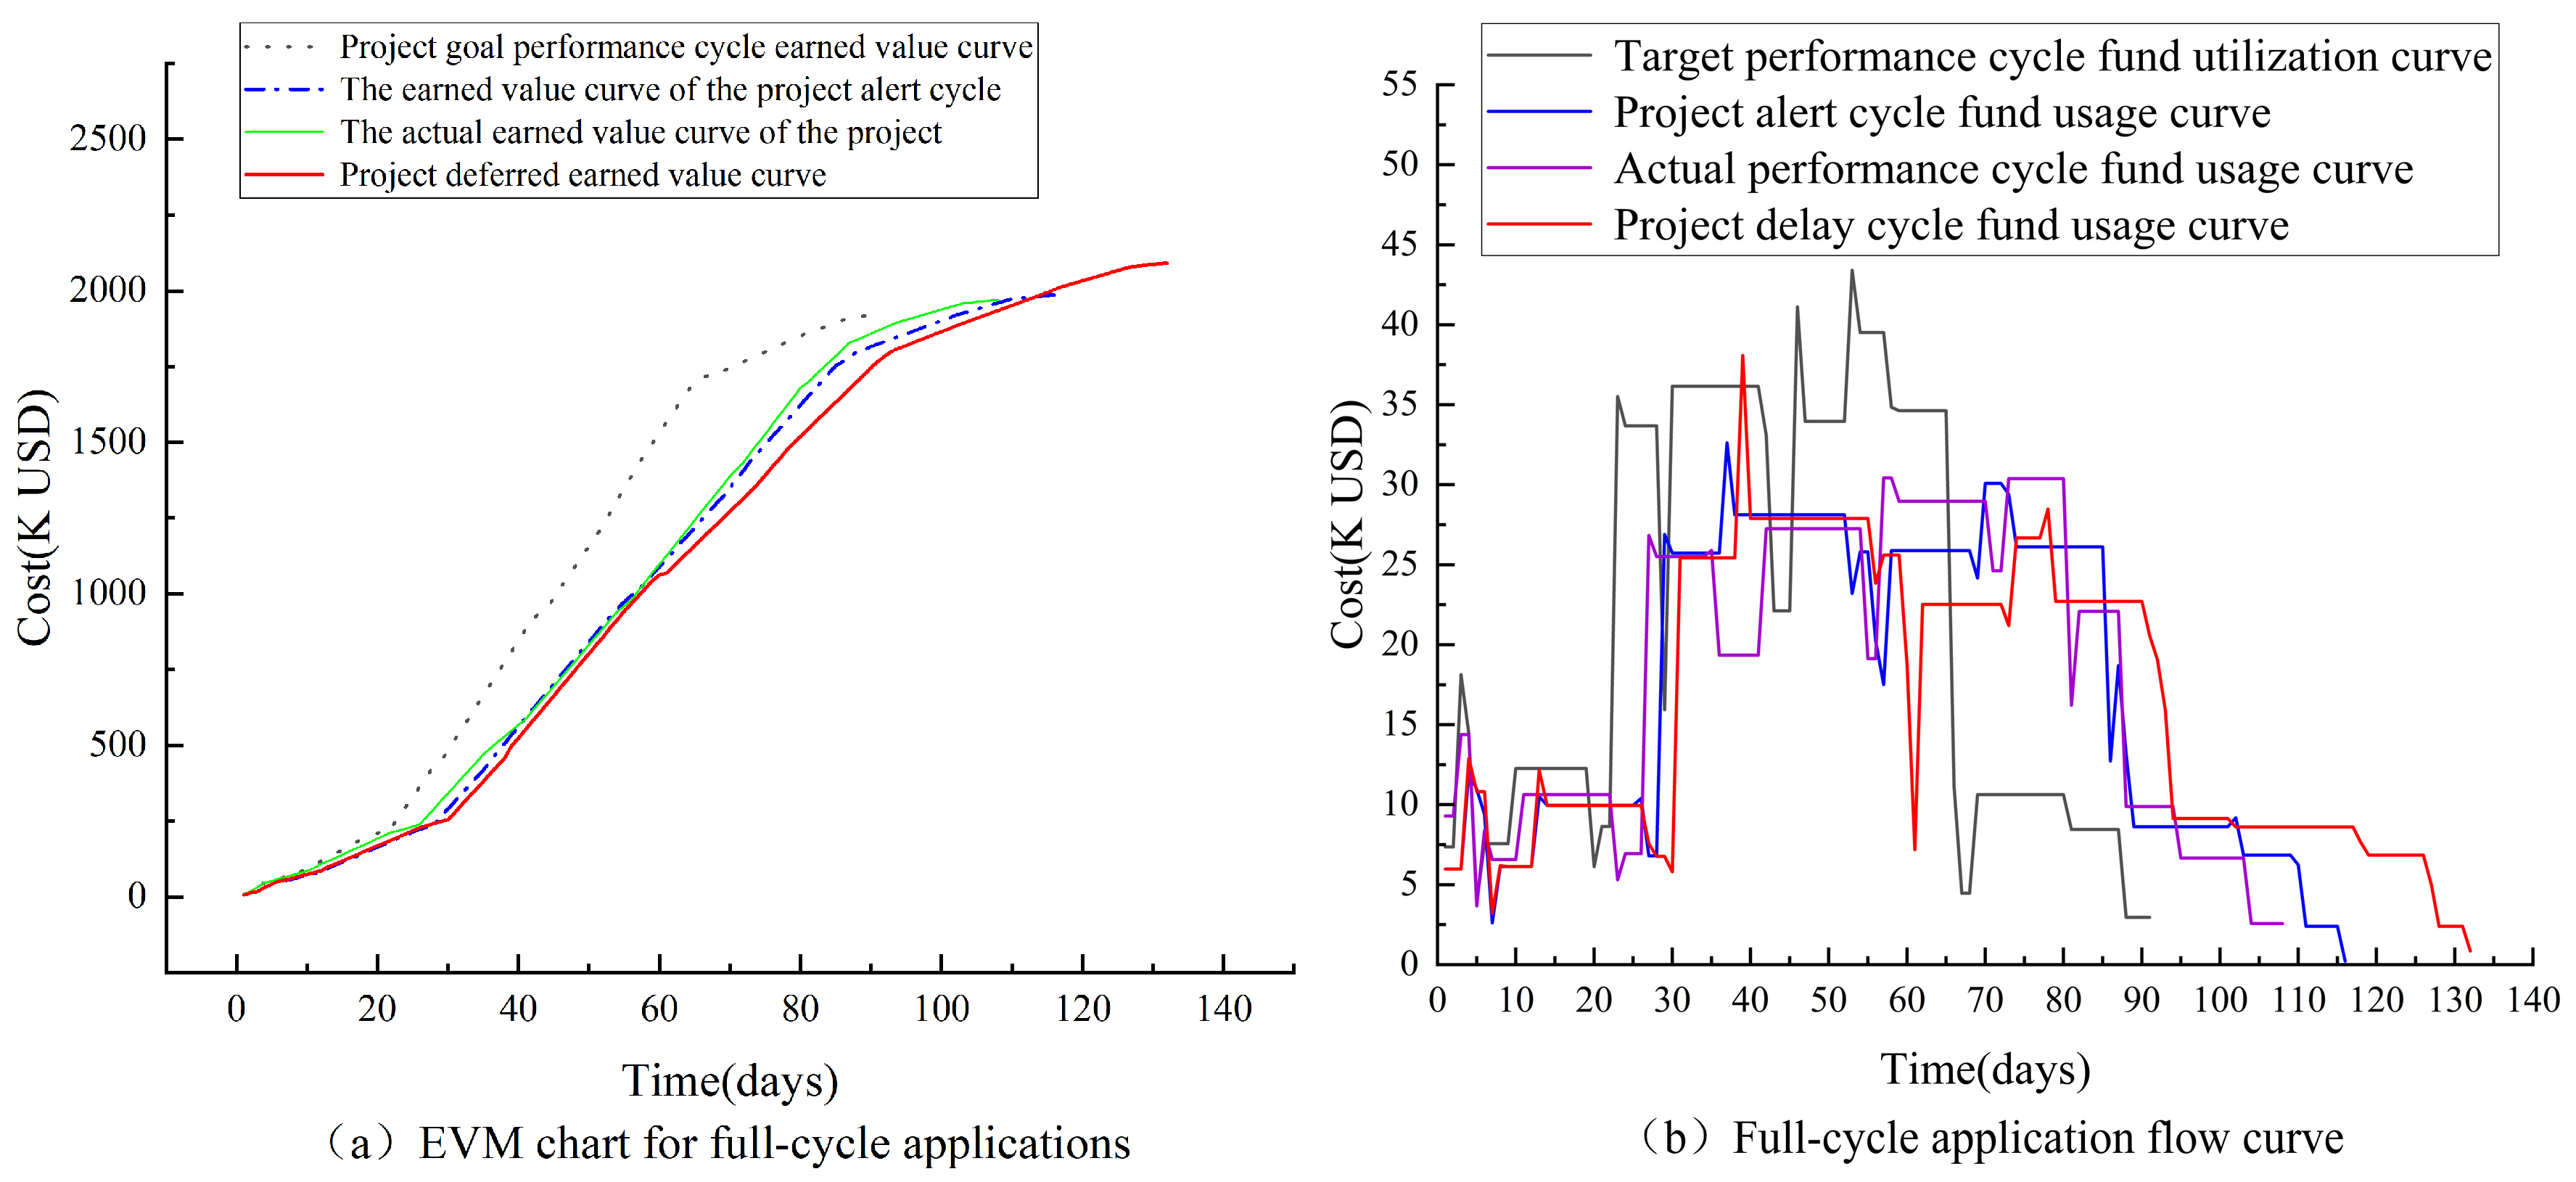
Table 1 reveals that the application of this model resulted in the project being completed 28.5 days ahead of schedule, with a profit margin exceeding the historical average for the project department. This significantly enhanced the project department’s engineering management capabilities. The effectiveness of the model was further validated through comparison with historical projects from the same department, demonstrating its practical value. The application results across the entire project lifecycle are illustrated in
Figure 17.
This study develops an integrated schedule control model by incorporating stochastic duration analysis with the earned value method (EVM) within a critical path framework. The proposed three-phase implementation framework (
Figure 1) addresses existing limitations in the dynamic optimization of traditional EVM and critical path applications for schedule management. Case study validation demonstrates the model’s enhanced predictive capability in identifying potential schedule deviations and maintaining project timelines within acceptable tolerance thresholds while significantly improving management resilience through its probabilistic risk-containment mechanism. The methodology represents a substantial advancement in proactive schedule control by synergizing probabilistic duration modeling with performance-based monitoring systems.
This study addresses a fundamental research question by developing a comprehensive, dynamically adjustable schedule optimization model based on critical path technology. The model enhances proactive scheduling through two key innovations: (1) integration of stochastic duration analysis with the earned value method (EVM), and (2) implementation of activity completion probability estimation to optimize management prioritization, effectively mitigating cascading delays from complex critical activities. The refined EVM framework incorporates two novel control parameters, the maximum buffer consumption rate (
) and cost fluctuation threshold (
), which scientifically constrain permissible schedule and cost variances. Case validation confirms the technical soundness of these indices, particularly their calibration using historical project data from the same construction team, resulting in more practical performance benchmarks for field management. Recognizing that schedule deviations stem not only from uncontrollable factors (weather, resource conflicts, and environmental changes) or management errors but also from inherent forecasting inaccuracies, the model intelligently avoids over-intervention through its buffer-based tolerance zone (
Figure 8). This approach balances control precision with management efficiency by triggering corrective actions only when buffer consumption exceeds predetermined thresholds (A) or cost variances breach established limits (B), thereby preventing unnecessary oversight costs while maintaining schedule integrity. The resulting framework provides project managers with a scientifically grounded yet operationally practical solution for dynamic schedule control.
Furthermore, this study develops a comprehensive decision matrix (
Table 3) based on dynamic decision-making principles to address schedule deviations through real-time earned value parameter analysis. For cases where performance indices exceed permissible thresholds, the enhanced EVM methodology precisely identifies deviant activities for targeted optimization (
Figure 10), significantly improving corrective capability. The integrated approach ensures sufficient buffer capacity remains available for management intervention when progress exceeds tolerance boundaries, enabling systematic troubleshooting of delays through both spatial buffer allocation and deviation localization. This dual mechanism—combining proactive buffer protection with diagnostic performance analysis—substantially strengthens the dynamic optimization model’s resilience against various disruption scenarios while maintaining operational flexibility.
The final application results demonstrate the model’s effectiveness in maintaining project performance within established control boundaries (
Figure 17). While temporary earned value deviations occurred during execution, the system’s corrective mechanisms successfully regulated overall progress within permissible thresholds, achieving all key performance indicators. The research makes dual contributions. Theoretically, it advances dynamic schedule control methodology through its integrated optimization framework; practically, it provides construction managers with an operational system featuring predefined tolerance zones, graduated warning thresholds, and adequate adjustment capacity, significantly enhancing schedule reliability while maintaining implementation flexibility. Case validation confirms the model’s ability to balance theoretical sophistication with practical usability in real-world project environments.
This study aims to develop a scientifically robust dynamic optimization model by integrating stochastic duration analysis with the earned value method (EVM) within a critical path framework. The proposed approach addresses a fundamental gap in schedule optimization by systematically accounting for project uncertainty through probabilistic duration modeling while maintaining performance visibility via EVM metrics. The integration of these methodologies creates a novel control system that significantly enhances dynamic schedule management effectiveness through three key mechanisms: (1) probabilistic risk quantification, (2) performance-based progress tracking, and (3) adaptive buffer allocation. This research demonstrates that successful schedule optimization requires dual consideration of both inherent project uncertainties (through stochastic modeling) and performance measurement (via EVM indicators) to achieve responsive yet stable project control.
5. Conclusions
This paper develops a comprehensive dynamic schedule optimization model that enables real-time adjustments to project timelines. The model incorporates stochastic duration analysis to account for uncertainty-driven schedule fluctuations, combined with critical path methodology to establish a planning-phase completion probability prediction system. This dual approach provides scientific guidance for schedule management by (1) evaluating activity completion probabilities and (2) integrating the earned value method (EVM) to compensate for the critical path’s predictive limitations and the EVM’s resource planning deficiencies. Through computer simulations of future project scenarios, the model achieves proactive control by simultaneously considering duration uncertainty and EVM-based performance forecasting, resulting in more scientifically grounded and practical decision-making compared to conventional methods.
This study presents an advanced dynamic project management model that synergistically combines enhanced the earned value method (EVM) with critical path theory while incorporating stochastic duration analysis. The integrated framework establishes activity-specific completion probability functions derived from planned durations, providing precise reference metrics for early stage schedule optimization. The model features a dual-phase EVM enhancement through the maximum buffer consumption rate () and () cost fluctuation threshold (Parameter B), which collectively define permissible performance boundaries to guide management interventions. The research makes dual contributions: quantitatively transforming duration uncertainties into schedulable parameters through probabilistic modeling, and establishing a comprehensive dynamic control system for full project cycle optimization. Empirical validation demonstrates the model’s effectiveness, showing superior schedule control compared to conventional methods while maintaining practical applicability across diverse project types.
This research acknowledges several limitations that warrant discussion. First, the active control mechanism in the Phase II EVM employs a uniform distribution model for process-level progress cost allocation, assuming linear cost accumulation over time for individual activities. However, empirical evidence suggests actual cost accrual typically follows a left-skewed distribution pattern (e.g., lognormal), as proposed elsewhere in this study. Second, while the single case validation demonstrates model viability through comparison with baseline projects—providing reasonable generalizability given the case’s representative characteristics—broader verification across multiple project types would strengthen findings. Future research should pursue three directions: (1) refined cost modeling through appropriate distribution functions, (2) multi-project validation to enhance generalizability, and (3) extension to resource-constrained scenarios. Although the current resource-unconstrained model offers practical value for most construction projects, developing resource-aware variants would address additional real-world constraints.


