Article

Prediction of Shear Strength of Steel Fiber-Reinforced Concrete Beams with Stirrups Using Hybrid Machine Learning and Deep Learning Models

1
Department of Civil Engineering, Adichunchanagiri Institute of Technology, Chikkamagaluru 577102, India
2
Department of Mathematics, Adichunchanagiri Institute of Technology, Chikkamagaluru 577102, India
3
Department of Civil Engineering, Jyothy Institute of Technology, Visvesvaraya Technological University, Belagavi 590018, India
*
Author to whom correspondence should be addressed.
Buildings 2025, 15(8), 1265; https://doi.org/10.3390/buildings15081265
Submission received: 6 March 2025 / Revised: 4 April 2025 / Accepted: 10 April 2025 / Published: 11 April 2025
(This article belongs to the Section Building Structures)

Abstract

The shear behavior of beams cast with steel fiber reinforced concrete and provided with stirrups is a complex phenomenon that depends on various factors. In the present research effort, a hybrid support vector regression model combined with a particle swarm optimization algorithm is provided, to explore the relationship between the material and dimensional characteristics of a concrete beam and its shear strength. A database with diverse material properties associated with the shear strength of a steel fiber reinforced concrete beam was established from numerous reliable published research articles and was utilized for the development and evaluation of the model. The obtained results from the hybrid support vector regression model were then validated through the results of the artificial neural network and convolutional neural network models combined with the particle swarm optimization algorithm. In conclusion, the adopted hybrid support vector regression approach was proven to be a successful engineering technique that can be used in structural and construction engineering problems.

1. Introduction

Concrete is regarded as a brittle substance, having a low shear capacity and tensile strength, though these can be improved by adding fibers to the matrix. The use of fibers to reinforce brittle building materials is an old concept. Nowadays, concrete is reinforced with four major types of fibers: glass, natural, synthetic and steel. Steel fibers are the most widely accepted fibers utilized in concrete reinforcement. Due to its accepted mechanical advantages, we can use steel fiber reinforced concrete (SFRC) as the structural component. The enhancement of post-cracking behavior in structural elements is one of the notable properties of SFRC. Hence, it has been extensively used in several areas of construction. The SFRC beam is a building element that has been broadly studied due to its structural performance, particularly in terms of shear failures.
Understanding the shear strength of reinforced concrete beams is crucial for ensuring the integrity of the structure. The difference in shear strength of reinforced concrete beams containing steel fibers and those containing no steel fibers lies in the substantial post-cracking tensile strength of SFRC. The key parameters influencing the ultimate shear strength of reinforced concrete beams are the compressive strength of concrete, effective depth, shear span-to-effective depth ratio and the longitudinal reinforcement ratio. In the case of SFRC beams, the post-cracking tensile strength of SFRC is another major factor. Experimental data presented by many researchers confirm that there is considerable reserve strength in SFRC beams failing in shear after the appearance of initial diagonal cracking.
The prediction of the shear strength of an SFRC beam can be classified into experimental, numerical, analytical and soft computing approaches. Through experiment, we can precisely monitor the structural behavior of SFRC beams, but it is very expensive and time-consuming. It also needs rigorous knowledge about the constituent materials, their mechanical and physical properties and the loading conditions. Even though the analytical methods are cost-effective, they are largely based on empirical formulas that can give appropriate results only within a certain range. Hence, very few studies have been conducted to establish such empirical formulas to estimate the shear strength of SFRC beams. Since SFRC is a composite material, whereas reinforced concrete beams are defined by their non-stabilized nature, a numerical simulation to predict resistance behavior has not been adequately addressed.
In the last few decades, soft computing algorithms have been effectively adapted in the area of structural engineering, particularly in the discipline of reinforced concrete. A literature review on the prediction of the structural performance of SFRC beams with stirrups using soft computing approaches has demonstrated a limited amount of research. Using experimental data from the literature, Adhikary and Mutsuyoshi [1] developed two neural network models with five input parameters, namely concrete strength, shear span-to-effective depth ratio, longitudinal reinforcement ratio, effective depth and fiber factor. They observed that the artificial neural network (ANN) model with five input parameters predicts the shear strength of beams without stirrups quite accurately. Ahn et al. [2] investigated the shear strength characteristics of SFRC beams by considering various shapes and mixture ratios using available experimental data that has inherent limitations. Based on 209 experimental results, Hossain et al. [3] recently presented an approach to predict the shear strength of SFRC beams by adapting the ANN model. They also analyzed the impact of different factors on the shear strength of SFRC beams without stirrups. By studying the consequences of the clear span-to-overall depth ratio, Naik and Kute [4] developed an ANN model to predict the shear strength of high-strength SFRC deep beams.
Based on linear genetic programming, a model has been created by Gandomi et al. [5] with an extensive dataset containing a total of 213 samples with nine input parameters, namely shear span-to-depth ratio, cylinder compressive strength of concrete, fiber factor, flexural steel reinforcement ratio, reinforcement factor, arch action factor, steel fiber pullout stress, splitting tensile strength and split-cylinder strength of fiber concrete. The authors created a number of models by taking into account various combinations of the input attributes. Based on a multi-objective strategy, they selected the best model for their study. By using genetic programming, Shahnewaz et al. [6] recently investigated the influence of nine parameters—namely, beam width, height, effective depth, shear span-to-effective depth ratio, compressive strength of concrete, yield strength of steel, longitudinal reinforcement ratio, aspect ratio of fibers and fiber volume—on the shear strength of steel fiber-reinforced concrete beams. Splitting a set of 222 experimental outcomes into six groups, Slater et al. [7] conducted research predicting the shear strength of steel fiber-reinforced concrete beams using linear and nonlinear regression analysis by considering five input parameters, viz., concrete compressive strength, tensile reinforcement ratio, span-to-depth ratio, fiber aspect ratio and the amount of fiber in concrete. Based on gene expression programming, an empirical equation was proposed by Kara [8] in his work, which used a total of 101 data points by considering five distinct input parameters, viz., compressive strength of concrete, effective depth, shear span-to-depth ratio, longitudinal reinforcement ratio and fiber factor. A multiple linear regression model has been created by Islam and Alam, utilizing a dataset of 222 experimental outcomes to determine the shear strength of SFRC beams [9]. Two novel equations for normal and high-strength steel fiber-reinforced concrete beams were provided to predict the shear strength in ref. [10] using multi-expression programming. Two equations were based on a set of 104 data points and a third equation was proposed by utilizing a set of all the 208 data points. Recently, a genetic algorithm-based method was employed in ref. [11] to simplify the proposed analytical models, generated through 222 data points from experiments on SFRC beams without stirrups. All previous research has primarily concentrated on the shear strength of SFRC beams without stirrups. Thus, in our study, we consider a database of SFRC beams with stirrups to develop robust machine learning and deep learning models to predict shear strength.
Soft computing-based methods, adapted to address the prediction problem, always consist of two major steps: (i) transforming all the information in the system into numerical data to feed the model and (ii) determining the optimum topology for the model. In the present research, we propose a novel intelligent data model that integrates support vector regression (SVR) with particle swarm optimization (PSO) to predict the shear strength of SFRC beams with stirrups. In this study, nine input parameters are adapted as the feature attribute to produce an efficient and accurate computational SVR model. The model uses nine input parameters—effective depth (d), breadth (b), shear span-to-effective depth ratio (a/d), aspect ratio of steel fiber (A), volume fraction of steel fiber (Vf), compressive strength of concrete (fc), shear rebar ratio (Rv), tensile rebar ratio (Rt) and compressive rebar ratio (Rc)—to predict the scaled shear strength (Vsc). The results from the proposed hybrid SVR-PSO model are then validated using results from artificial neural network and convolutional neural network models, combined with the particle swarm optimization method, to build a comparative framework. The aim of the analysis is to develop robust and reliable soft computing techniques which can be utilized to predict shear strength with high precision to support important engineering decisions made in structural design.
The shear span-to-effective depth ratio is a crucial parameter in the analysis and design of reinforced concrete beams, particularly when assessing their shear strength. The shear span is the distance between a concentrated load and the support of the beam, whereas the effective depth is the distance from the compression face of the beam to the centroid of the tensile reinforcement. Lower a/d ratios generally result in higher shear strengths because the load is transferred more directly to the supports. The shear rebar ratio refers to the amount of shear reinforcement, typically in the form of stirrups, within a reinforced concrete beam. This ratio is crucial for determining the beam’s capacity to resist shear forces. A sufficient shear rebar ratio is essential to prevent shear failures, which can be sudden and catastrophic. The tensile rebar ratio quantifies the amount of tensile reinforcement in relation to the concrete cross-sectional area. This ratio is crucial for determining the flexural capacity of a reinforced concrete member. In essence, the tensile rebar ratio is a fundamental parameter in reinforced concrete design, ensuring that concrete members can effectively resist tensile forces and maintain structural integrity. The compressive rebar ratio specifically refers to the amount of reinforcement placed within the compression zone of the beam’s cross-section. In summary, the compressive rebar ratio is a key design parameter in beams, used to improve flexural capacity, enhance ductility and control deflection. The aspect ratio of a fiber is the ratio of its length to its diameter. The aspect ratio of steel fiber is an important parameter that has a significant influence on the mechanical properties of SFRC. Fibers with a higher aspect ratio are more effective in controlling crack width and propagation, which is crucial for shear strength.

2. Support Vector Regression (SVR)

The support vector machine (SVM) is one of the most appreciated versions of all the data-driven soft computing models deployed in the areas of science, engineering and technology. It has a great ability to resolve both regression and classification problems and it always attains a global optimum rather than local maxima or minima [12]. In this study, we consider support vector regression by using a dataset of the form { x i , y i } which can be formulated as
f ( x ) = ω ψ ( x ) + a
The optimization of the regression function can be achieved by utilizing the following:
Minimum :                                                                         0.5   | | ω | |   2 + C i = 1 n ε i + ε i *
and is subjected to the following conditions:
y i ω ψ x i a   ε + ε i                                 y i ω ψ x i + a   ε + ε i * ,       i = 1 ,   2 , n     ε i + ε i *   0                                                      
where ψ is the nonlinear transfer function, ω and a are the undetermined parameters, C is the regularization parameter, ε is the loss function and ε i and ε i * are slack variables. In this study, the radial basis function (RBF) has been employed as a kernel equation to convert the nonlinear problem into a linear equation, as defined below:
K X i , X j = exp 0.5 X i , X j σ 2
where σ in RBF represents the tuned parameter. The optimum solution of the support vector regression model is determined by considering the best combination of the kernel function, loss function and the regularization parameter. Therefore, an important task in the implementation of the SVR model is to optimize the internal parameters σ , ε and C , which help with the consistency of conclusions and can be determined from the learning experience. Hence, the nature-inspired optimization algorithm PSO has been implemented in this study to select and tune the parameters to obtain an effective feature-extraction and prediction model.

3. Particle Swarm Optimization (PSO)

The PSO algorithm was first proposed by Kennedy J. and Eberhart R. [13] to obtain the most optimal solution for complex nonlinear functions. While optimizing the function, the PSO algorithm simulates birds’ flocking patterns. Inspired by nature, the PSO algorithm evaluates the input data features by performing a population search. The population follows the leader, who directs the best position for the entire swarm and modulates its optimal position by following the group objective. The optimum local PSO is obtained if the best particle corresponds to the neighboring position through the learning experience. The update must be accomplished for the particle velocity to achieve the migration of all the particles to the desired location through the following equation:
v i j = w v i j + a 1 r 1 P b e s t , i j x i j + a 2 r 2 ( G b e s t , i j x i j )
x i j = x i j + j
where x i j is the position of the ith particle in the jth dimension; a1 and a2 are the acceleration coefficients; r1 and r2 are the random coefficients limited between 0 and 1; w is the inertia weight [14].
Recent studies have revealed that the main drawback of implementation of the SVR model is the optimization of internal parameters, including ε, C and σ. These parameters, which can be calculated during the learning process, show the same characteristics among successions. Hence, in the present research, to tune these internal parameters of the SVR model, the PSO algorithm has been used, leading to a completely optimized model for effective feature extraction and prediction.

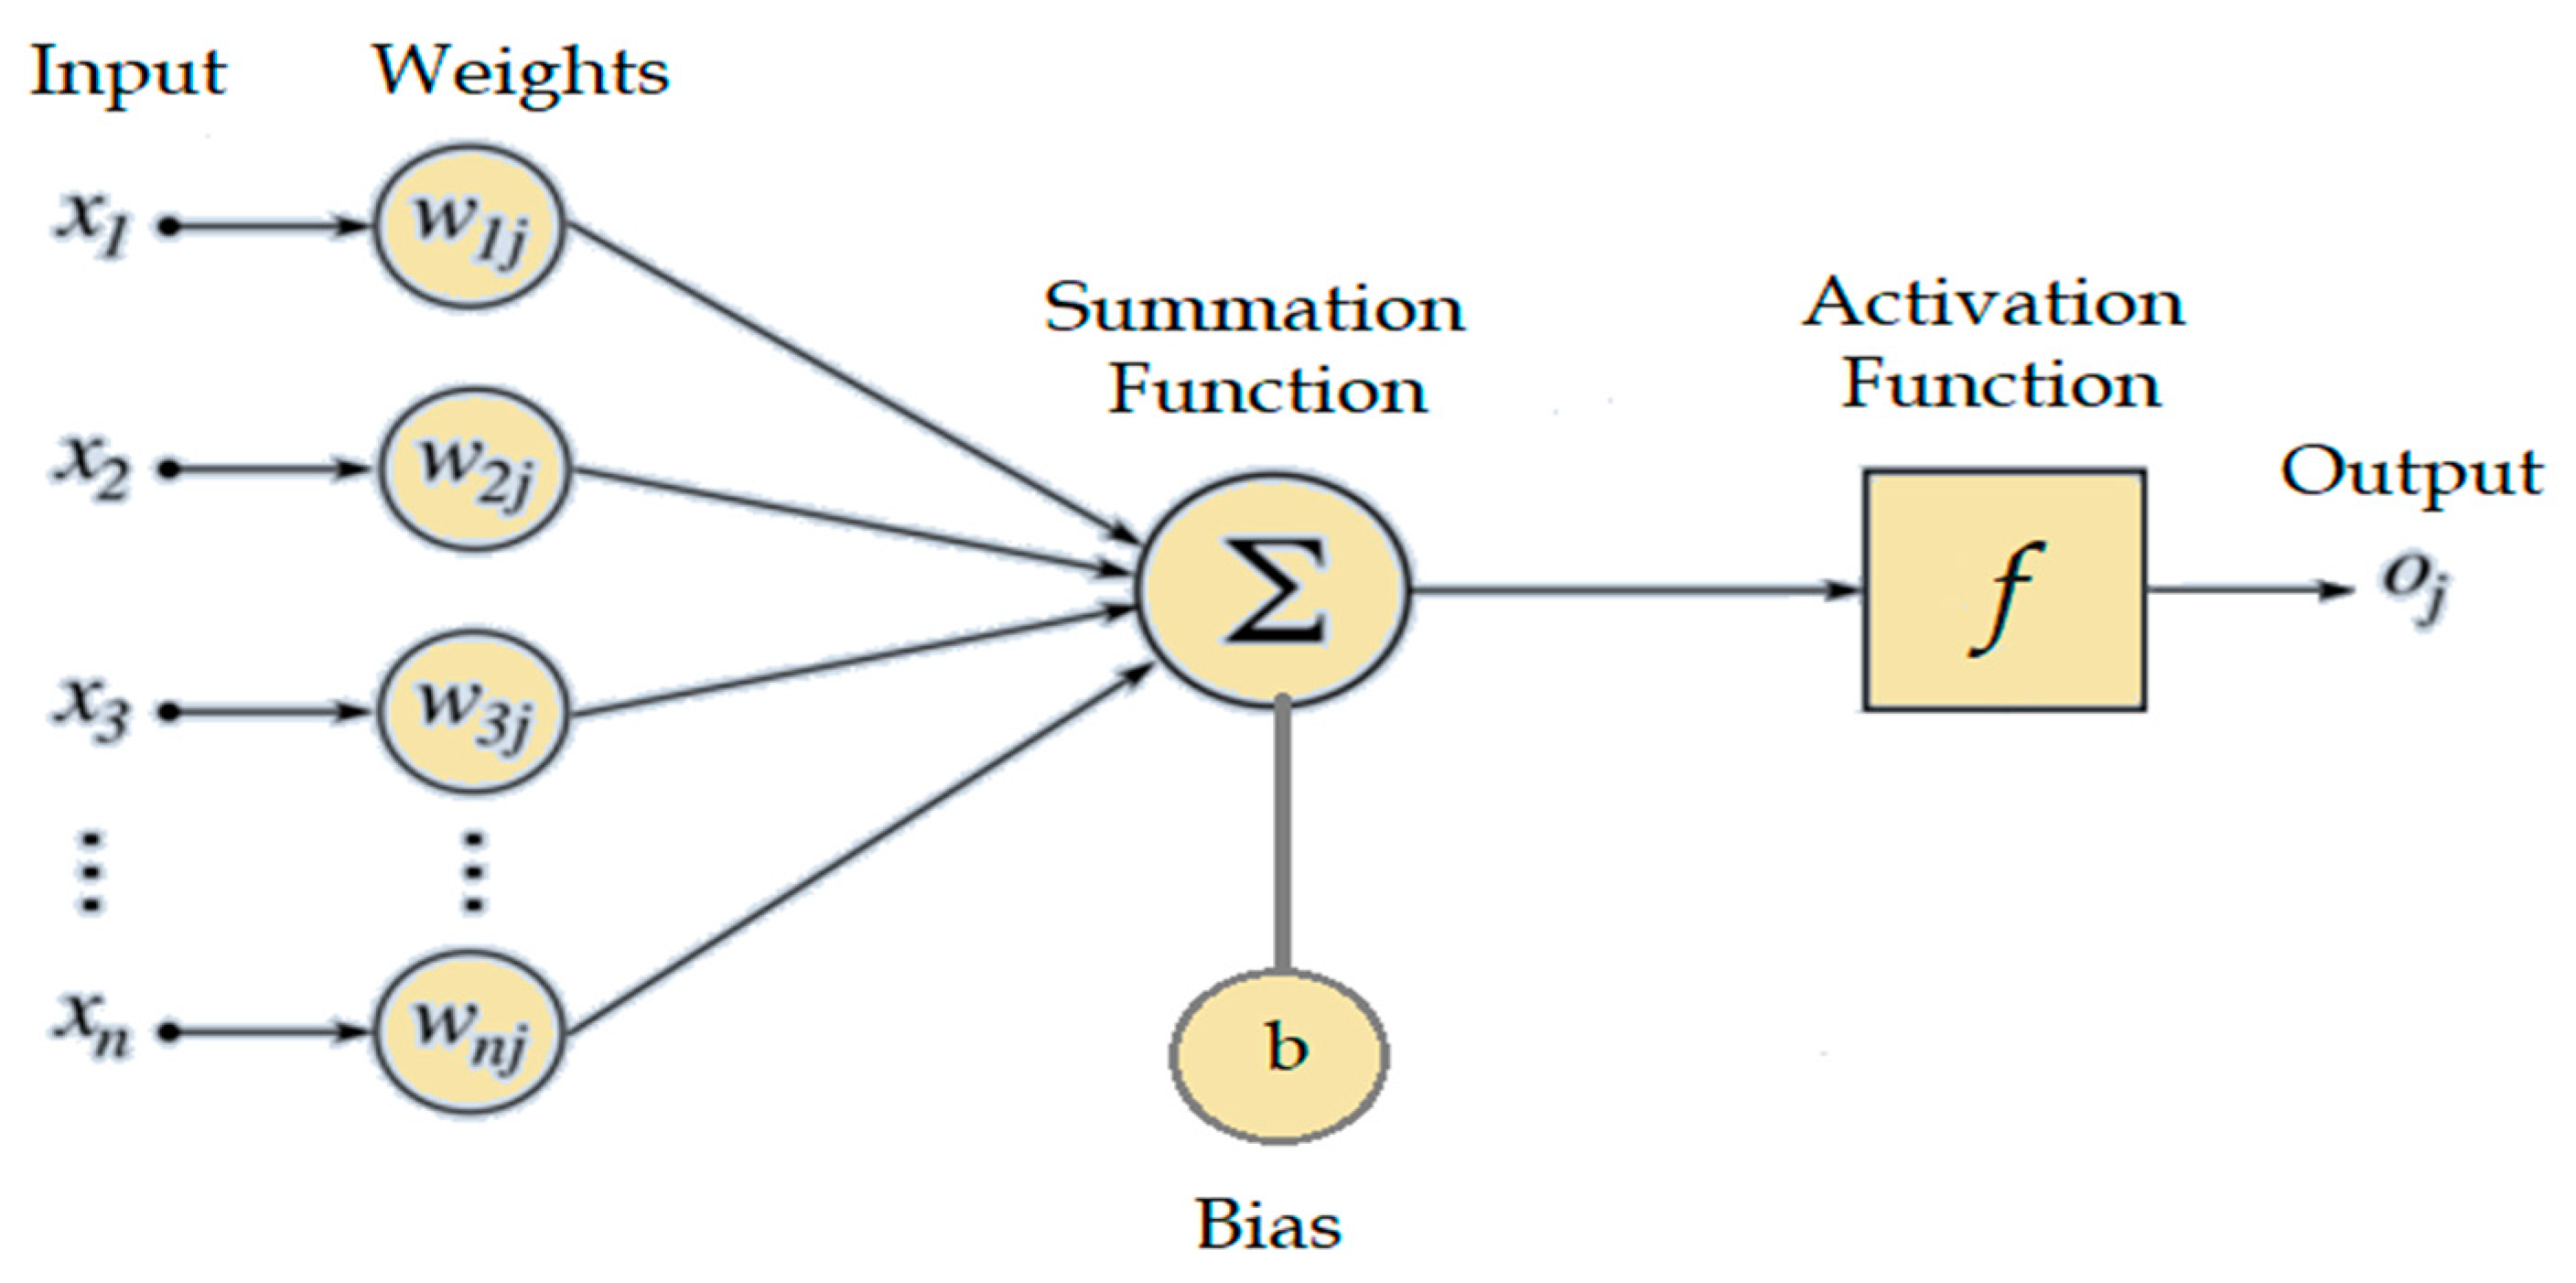
4. Artificial Neural Network

An artificial neural network is a computational algorithm that can perform parallel computation substantially for complex data processing and knowledge representation. Research on ANNs in the last few decades has shown significant progress, encompassing applications in all fields of engineering. ANN models use precise organization, which aligns with the biological neural structure. Similar to the human brain, an ANN model is made up of neurons layered in a complex nonlinear form, with weighted links connecting the neurons in adjacent layers. After receiving the inputs in the form of numeric values by the input layer of the ANN, every input is multiplied by suitable weights. These weights often indicate the strength of the connections between the neurons in the ANN. In order to include necessary nonlinearities into the overall network topology, neurons use activation functions on weighted inputs. In order to recognize a pattern in the input data, the hidden layers perform a mathematical computation. The detailed computations in the hidden layers enable the ANN to generate the intended result in the output layer. In ANNs, the heuristic approach is an efficient way to choose the number of hidden layers and the number of neurons in each layer. The structure of neurons is shown in Figure 1 and the architecture of an ANN is shown in Figure 2.

5. Convolutional Neural Network

As a subset of deep learning models, convolutional neural networks are suitable for processing grid-like data, such as images. CNNs are widely used for data-intensive visual tasks like object detection, pattern recognition and image classification. Two major advantages of CNNs over standard neural networks are translation invariance, which allows them to recognize features regardless of their position, and hierarchical feature learning, which enables them to progressively learn more intricate patterns as layer depth increases. A CNN is constructed primarily through the convolution operation to identify patterns in data. The convolution operation is carried out by applying filters to the input data. A filter, which is a compact matrix of weights, is applied to the input data using a dot product operation to generate a feature map at each position. The resulting feature map is then subjected to an activation function to introduce nonlinearity in the model so that the model becomes capable of learning complex patterns. Pooling layers, which typically come after convolutional layers, reduce the size of feature maps while retaining the most important information. These layers typically use a pooling window that slides over the feature map to perform either an average pooling or a max pooling operation. The convolution operation, activation function and pooling operation are iterated numerous times to create a fully connected layer, which serves as the concluding component of the CNN, performing the task of regression or classification. The architecture of a CNN is shown in Figure 3.

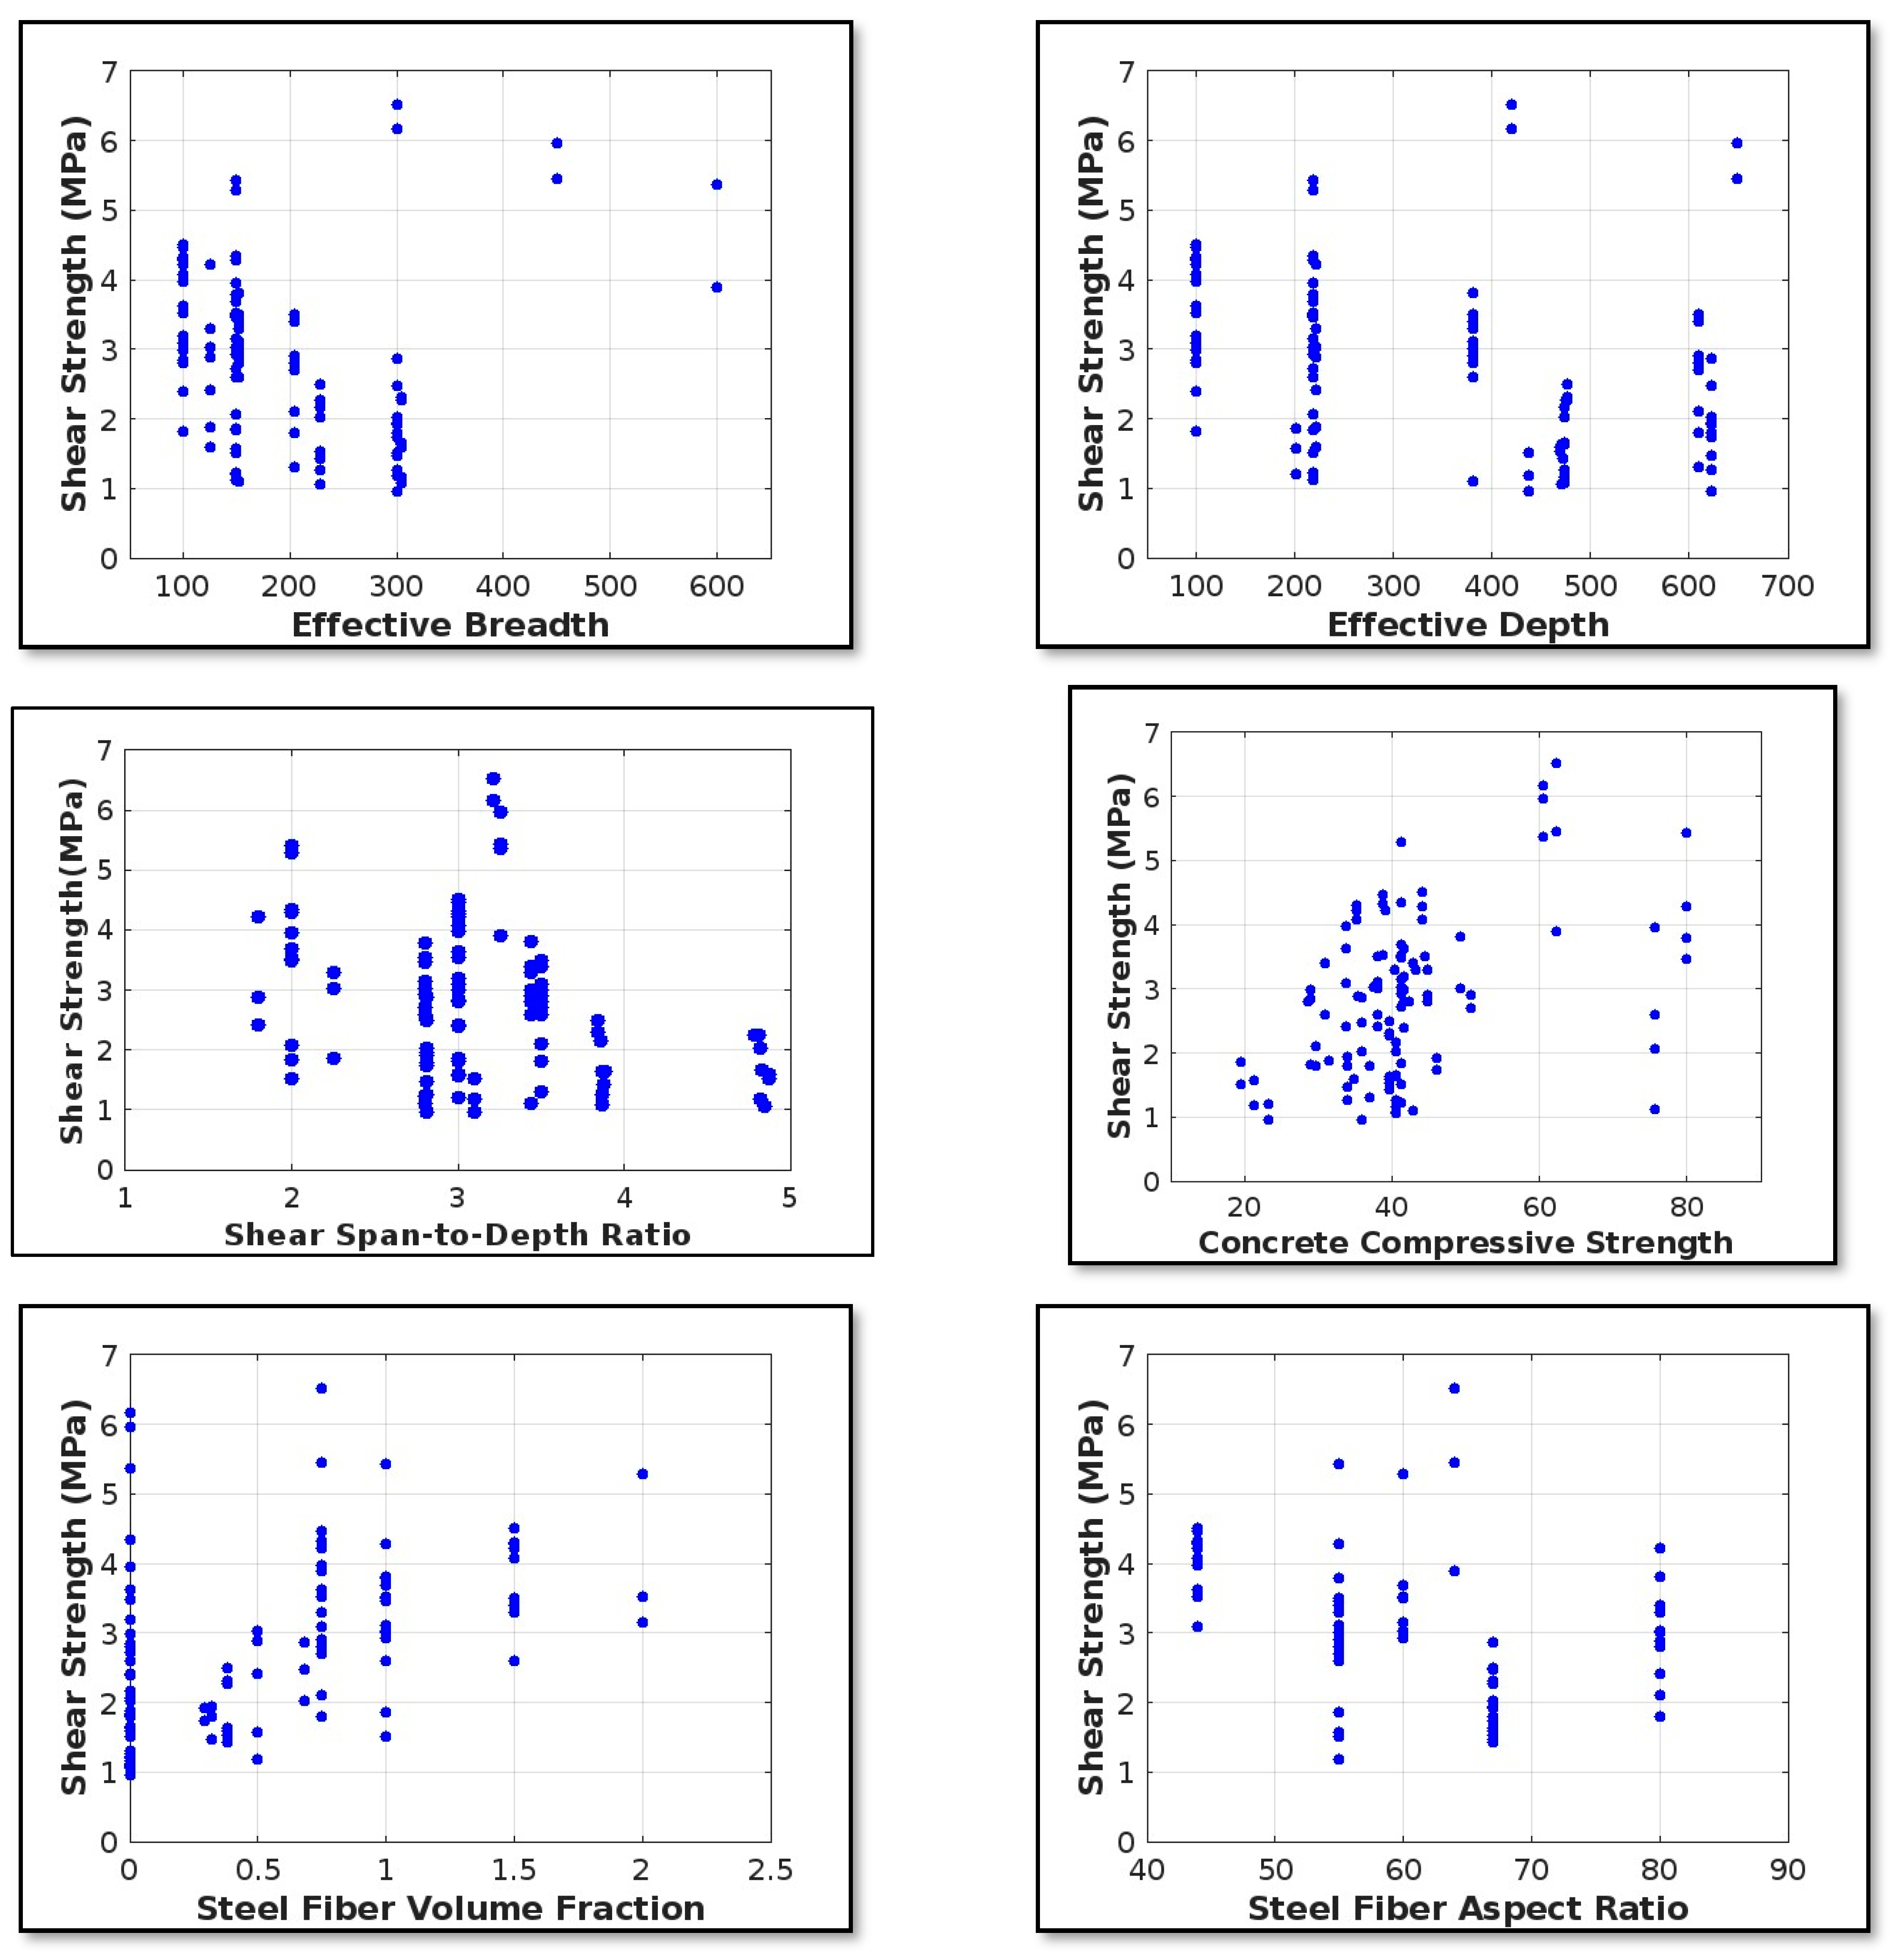
6. Experimental Dataset

A dataset of 116 experimental test results of SFRC beams with stirrups from nine previous investigations was created, which included material characteristics and the dimensions of the tested beams. The complete experimental data collected from the literature has been represented in Table 1 and its statistical characteristics like the mean (µ), standard deviation (s), Skewness (Sk) and Kurtosis (Ku) are summarized in Table 2. Standard deviation is crucial for understanding the distribution of data, skewness measures the extent of asymmetry in the data distribution, whereas Kurtosis helps us to understand the tailenders in the distribution of data. The experimental studies mainly varied with the concrete compressive strength, dimension of the beams tested, aspect ratio of steel fiber, amount of fiber present in the concrete, shear span-to-effective depth ratio, tensile rebar ratio and shear rebar ratio, as well as the compressive rebar ratio.

7. Performance Measure

The performance of the data-based objective and intelligent models are evaluated using various statistical techniques such as mean absolute percentage error (MAPE), mean absolute errors (MAEs), root mean square error (RMSE), coefficient of determination ( R 2 ) and scatter index (SI). These performance metrics will provide a deeper and more detailed evaluation of the prediction models. The mathematical expressions are presented below:
M A P E = 100 n i = 1 n s a s p s a
M A E = i = 1 n s a s p n
R M S E = i = 1 n s a s p 2 n
R 2 = 1 i = 1 n s a s p 2 i = 1 n s a s p ¯ 2 × 100
S I = 1 s a ¯ i = 1 n s a s p 2 n
where s a is the actual shear strength obtained from experimental results and s p is the predicted value from the developed data intelligence models, while s a ¯ and s p ¯ are the mean of the actual and predicted shear strength observations. The model accuracy can be evaluated using MAPE, with an excellent model having an MAPE less than 10%, a good model having it in the range of 10 ≤ MAPE < 20 and a fair model having it in the range of 20 ≤ MAPE < 30.

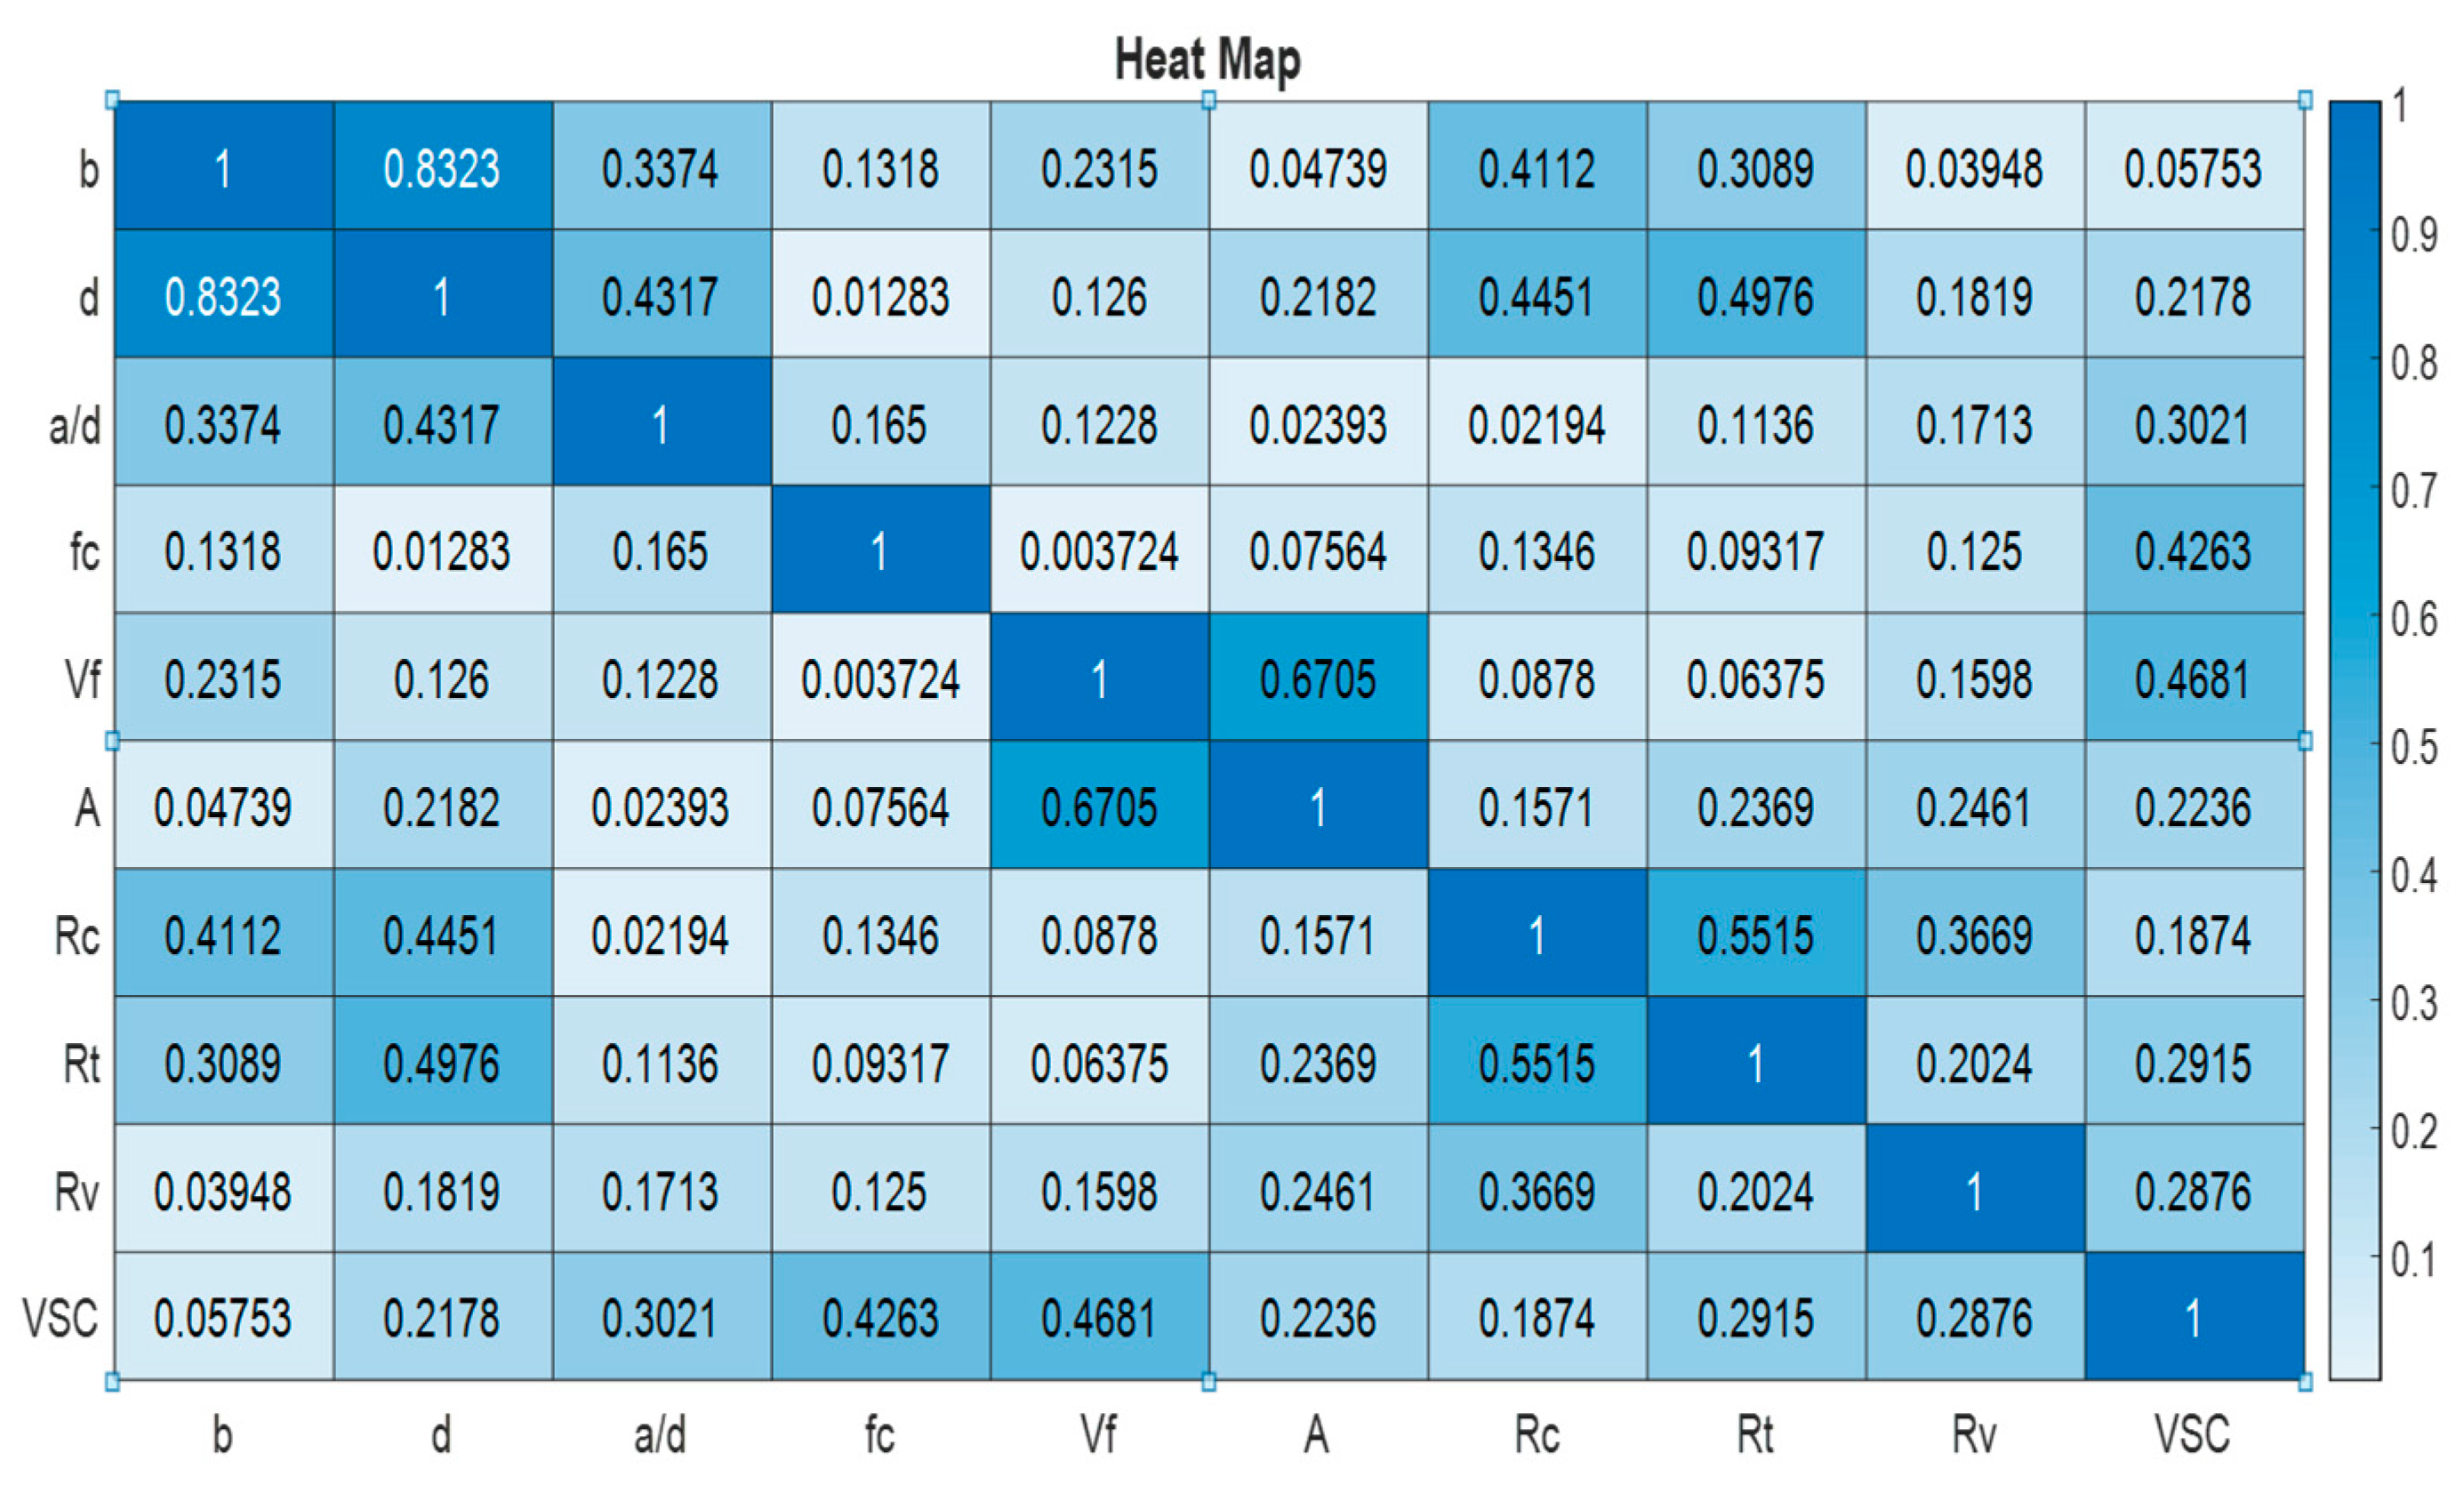
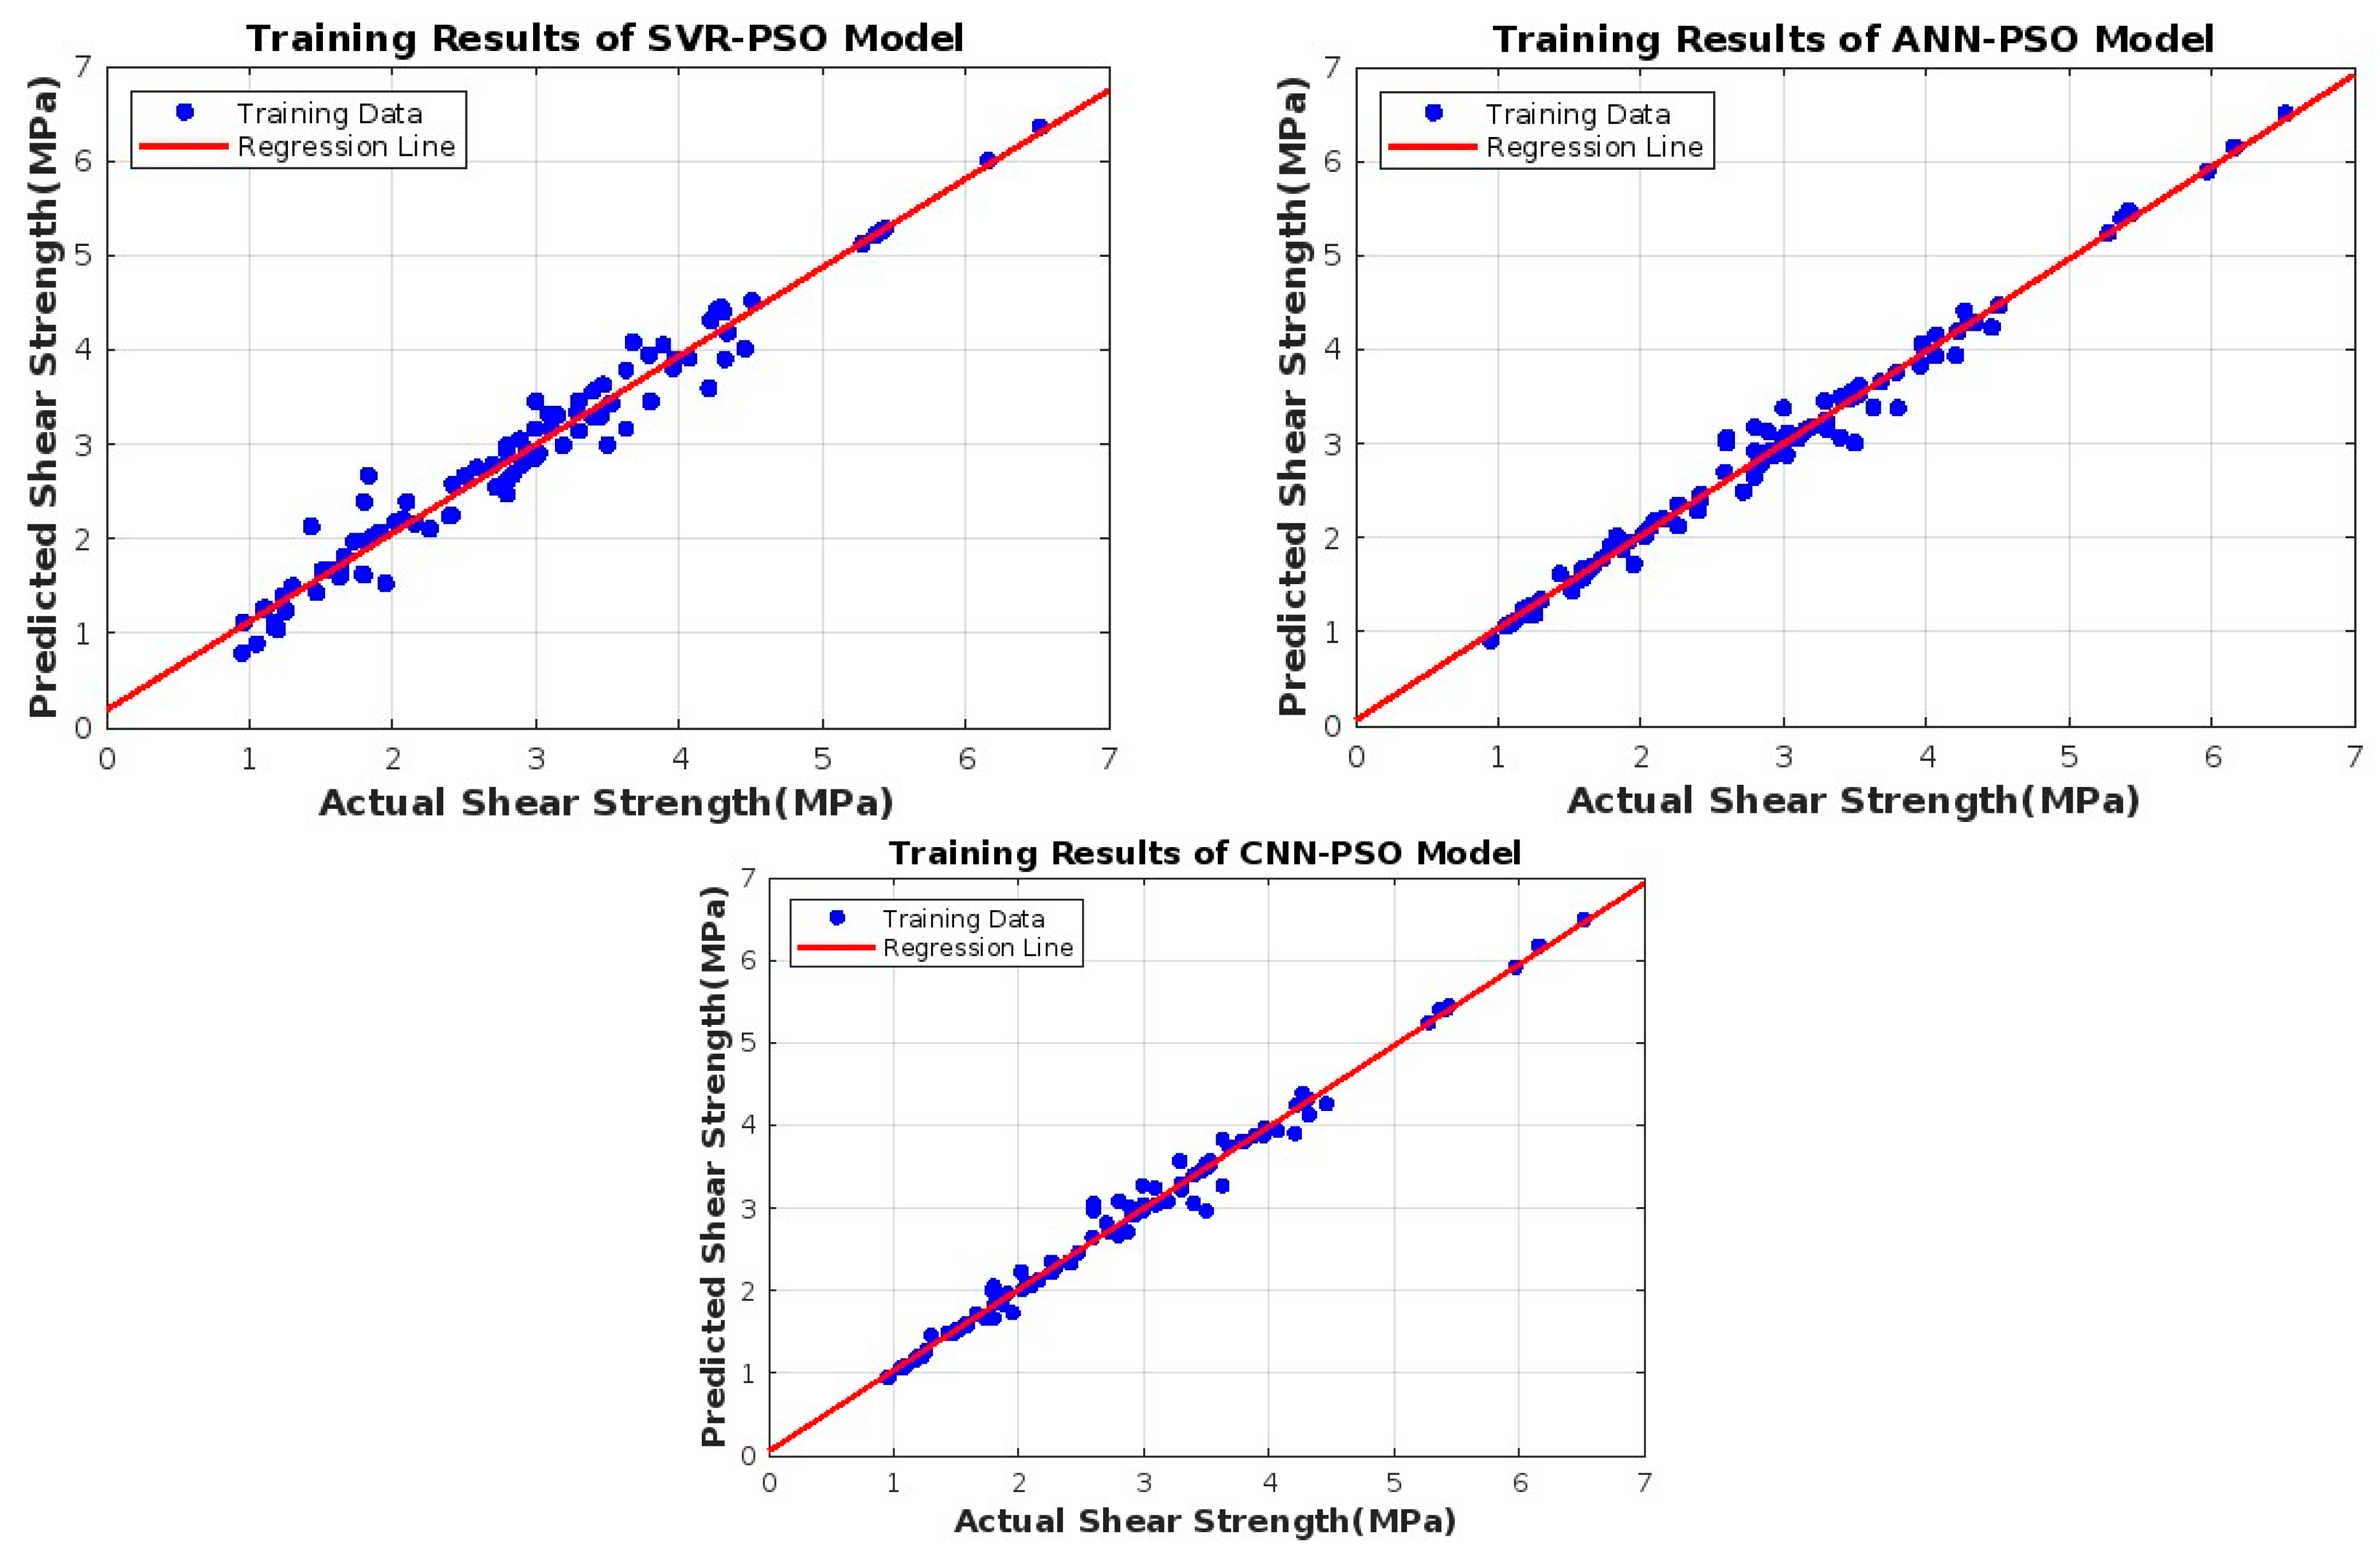
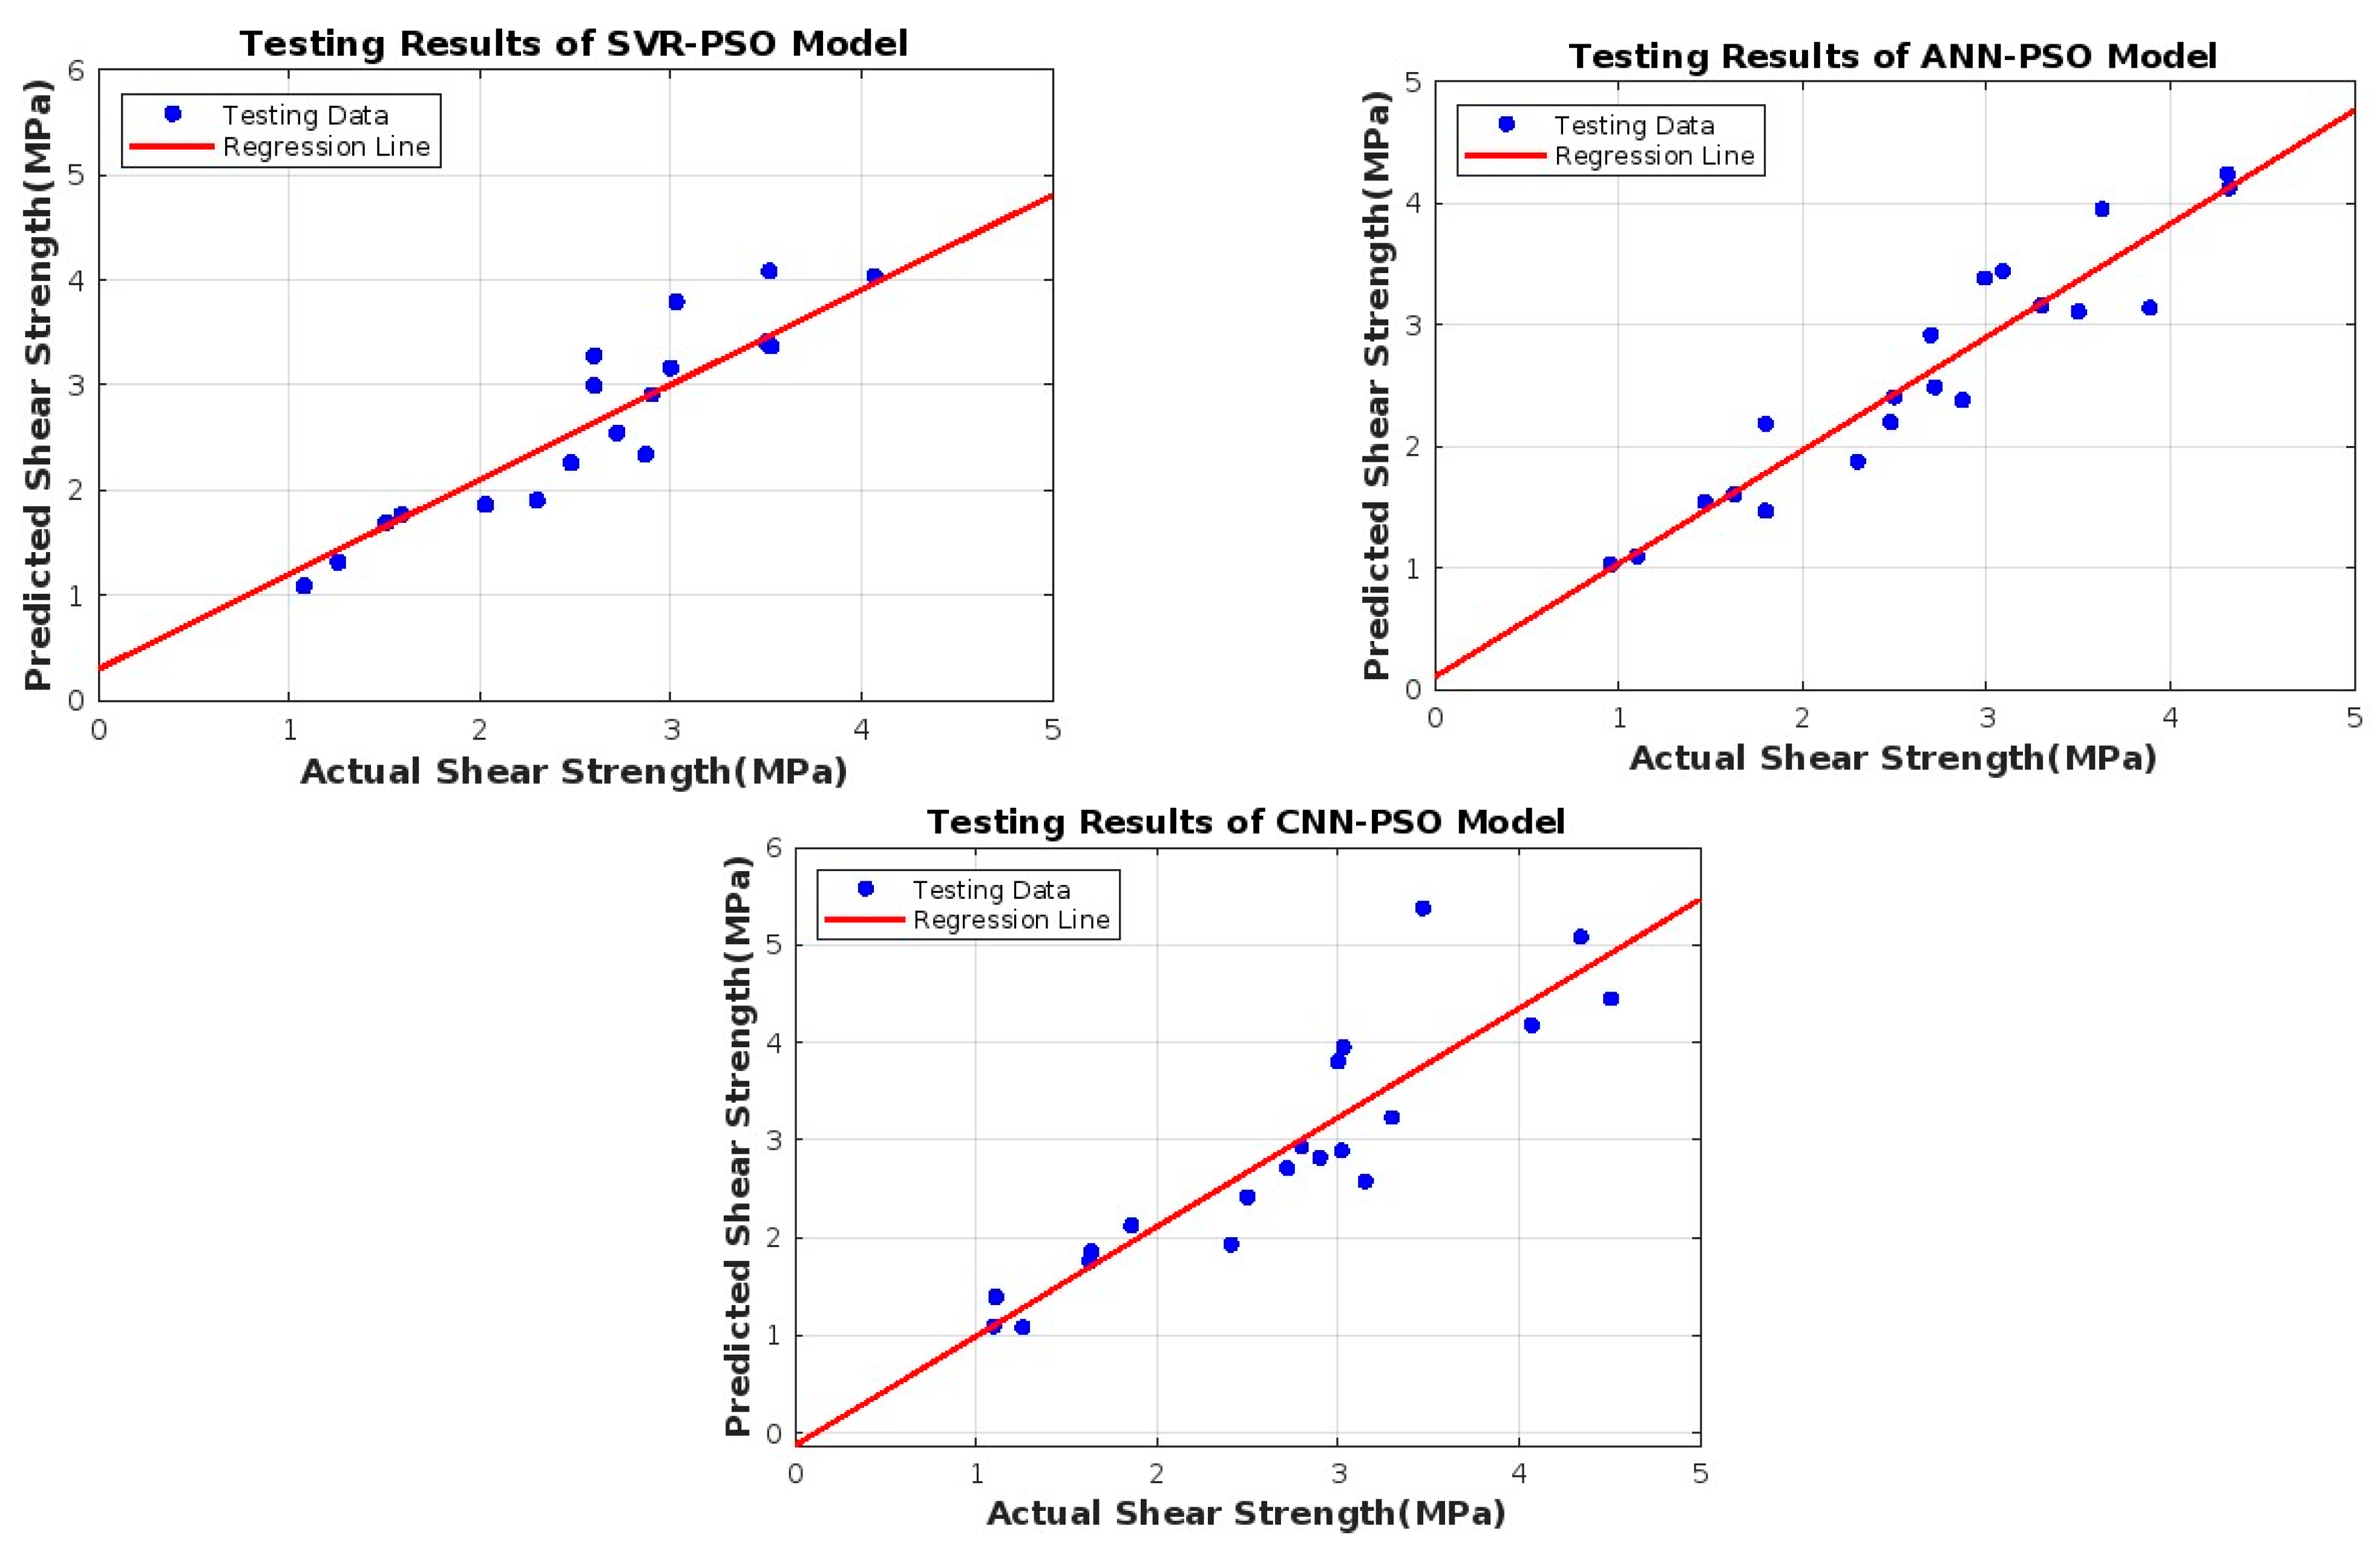
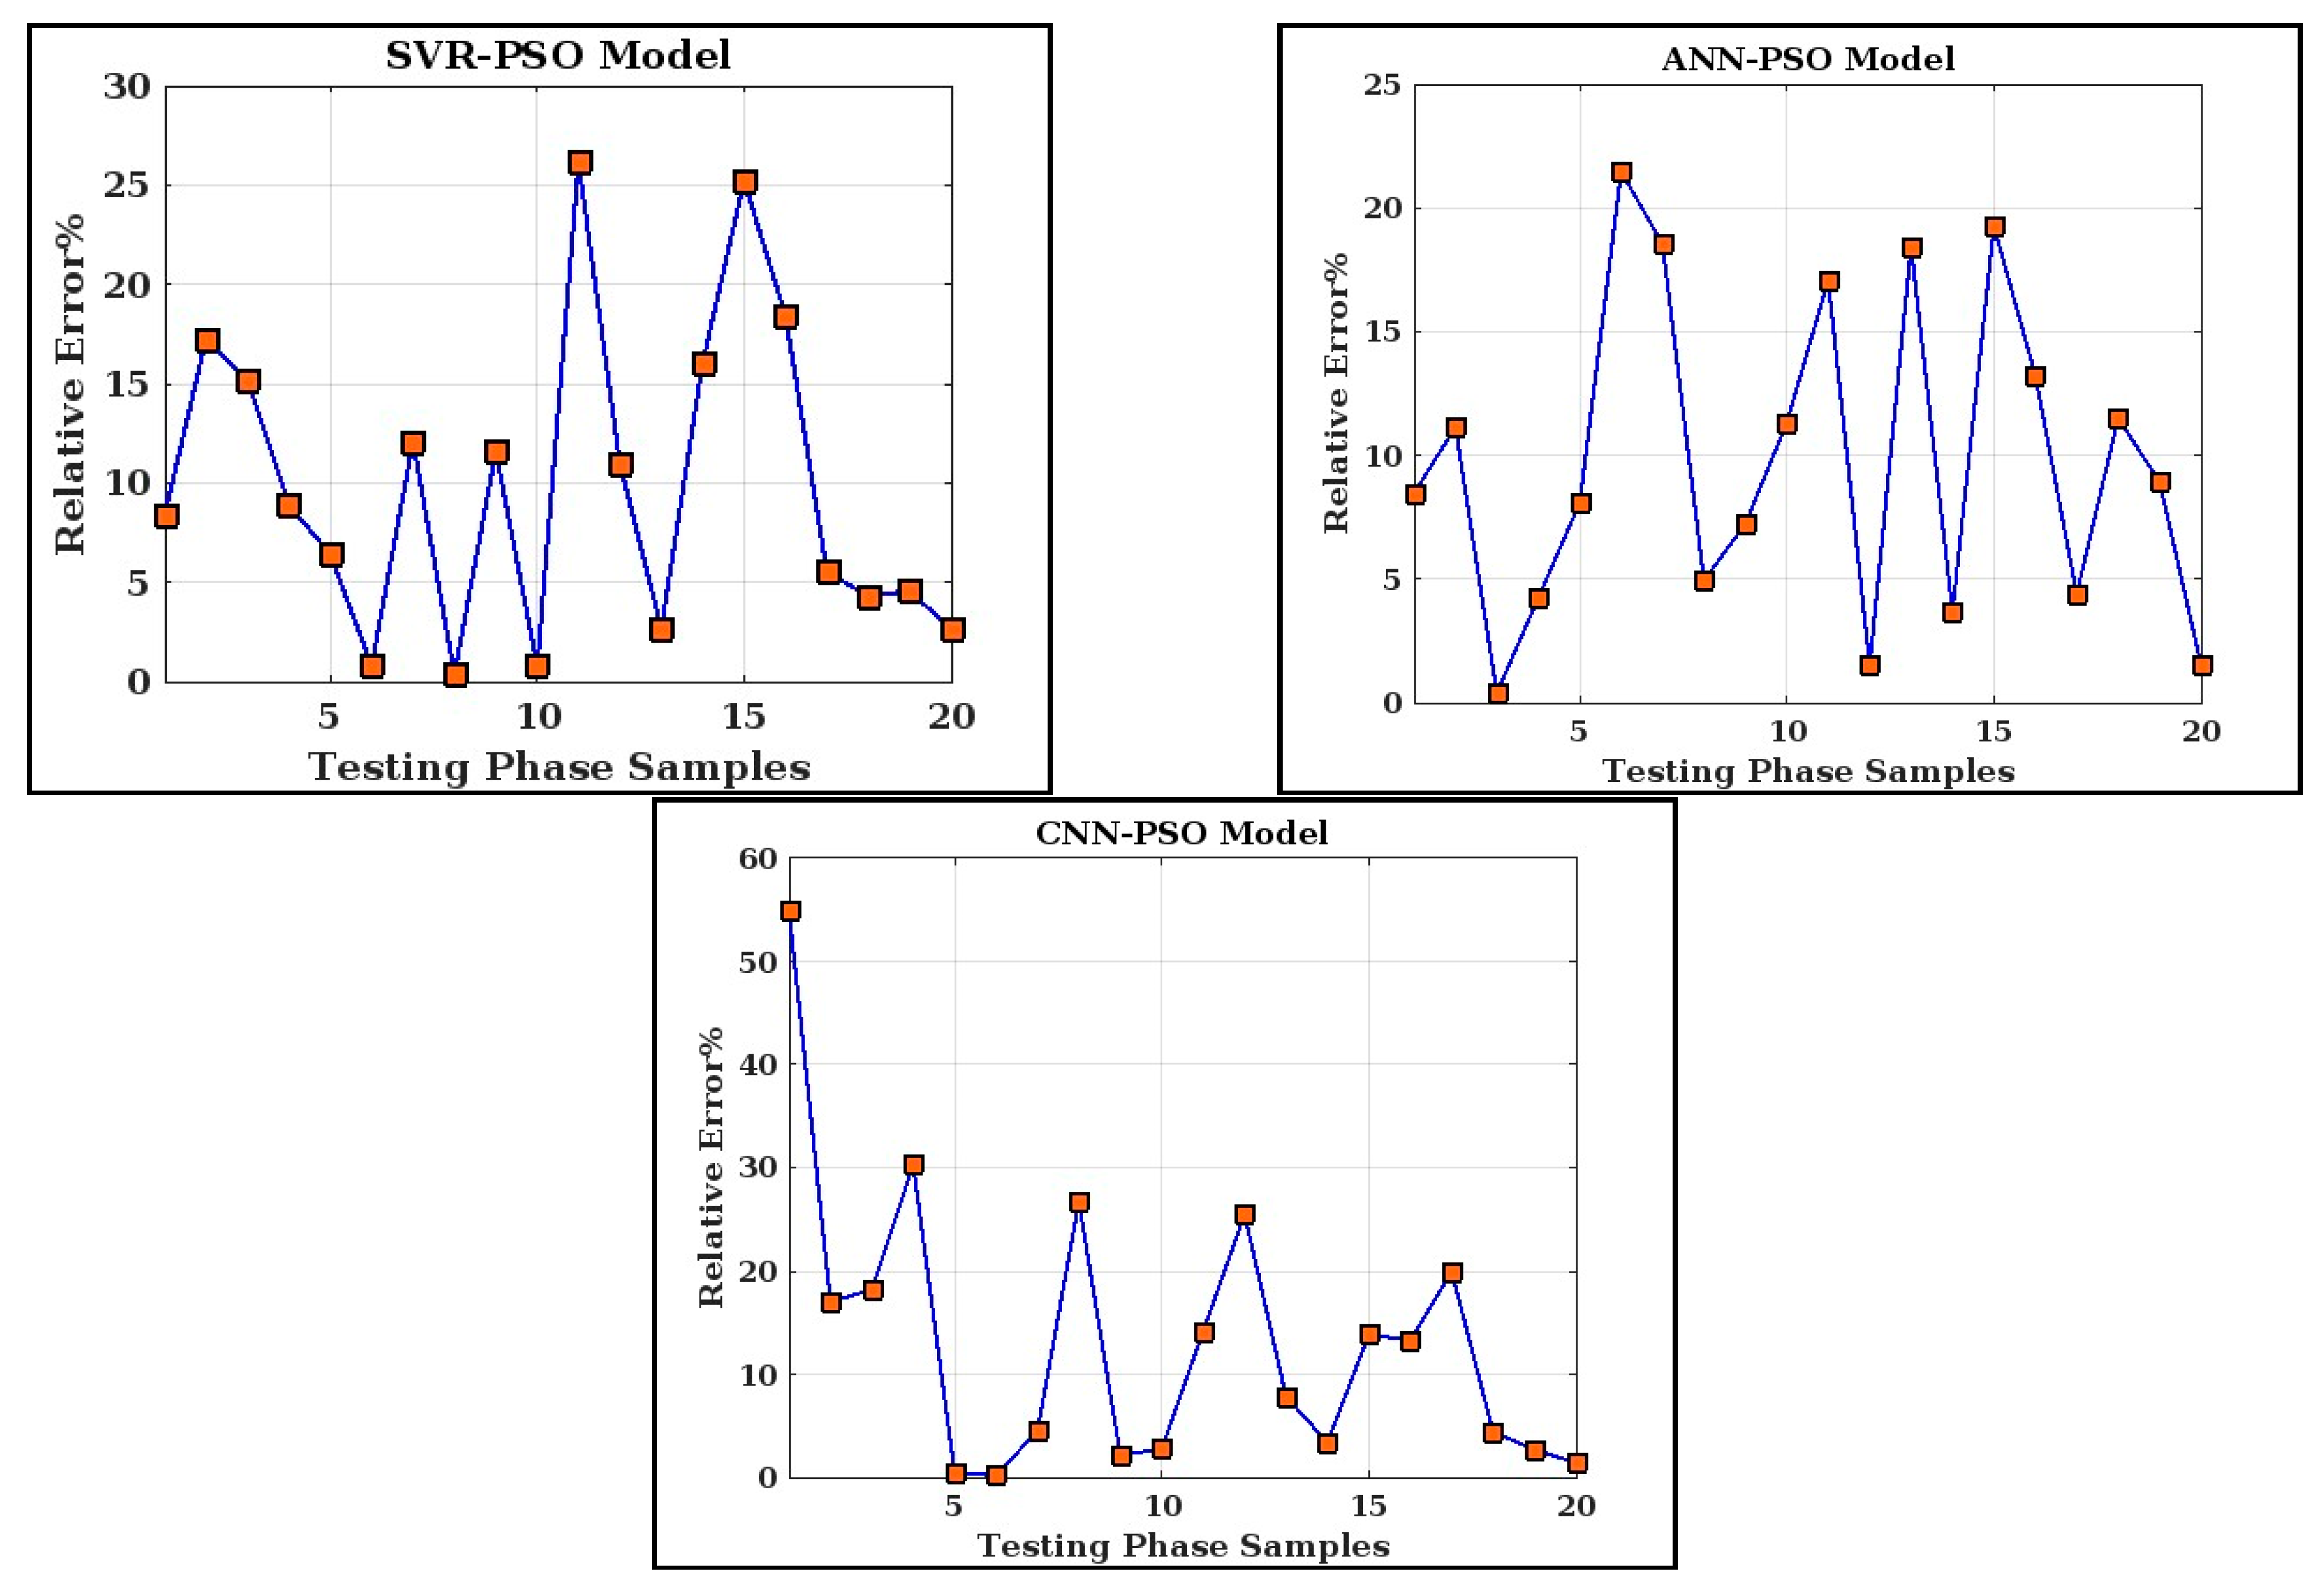
8. Analysis and Discussions

In this research work, to predict the shear strength of SFRC beams, hybrid predictive models based on SVR, ANNs and CNNs combined with a PSO algorithm were developed. In order to create the best possible predictive models, 96 samples were employed for training and 20 samples were employed for testing. The primary objective of the research is to evaluate the efficacy and precision of the final hybrid SVR-PSO model and to validate its predictability with the CNN-PSO and ANN-PSO models for shear strength using nine input parameters. The model accuracy is evaluated using several efficiency indices, including dimensionless indices such as SI and R 2 , and residual error-based indices such as RMSE, MAE and MAPE.
The particle swarm optimization investigated how the combination of nine input variables—including the breadth (b), effective depth (d), shear span-to-effective depth ratio (a/d), concrete compressive strength (fc), steel fiber volume fraction (Vf), steel fiber aspect ratio (A), compressive rebar ratio (Rc), tensile rebar ratio (Rt) and shear rebar ratio (Rv)—give the best shear strength prediction.
Figure 4 demonstrates the correlation between nine input variables and the target shear strength. For concrete compressive strength (fc), steel fiber volume fraction (Vf), steel fiber aspect ratio (A), compressive rebar ratio (Rc), tensile rebar ratio (Rt) and shear rebar ratio (Rv), the correlation coefficient is positive, which indicates that variables change together in the same direction, while it is negative for breadth (b), effective depth (d) and shear span-to-effective depth ratio (a/d), which demonstrates that the variables change in opposite directions. Figure 5 represents the correlation between input variables and the target through a heat map, which is a data visualization technique that uses color coding to represent the magnitude of values within a dataset. In the heat map, a dark color typically indicates a strong correlation between variables, whereas a light color indicates weak correlations. Figure 6 represents the feature importance analysis using an F-test, which examines the importance of each feature individually and then ranks these features using the p-values of the F-test statistics. The analysis indicates that all features exhibit almost equal importance in the prediction of shear strength using soft computing models.
Table 3 and Table 4 represent the relative errors of training and testing results of shear strength prediction through the hybrid SVR-PSO, ANN-PSO and CNN-PSO models. The values stated in the tables estimate the precision of the models. The high R 2 value and lower residual error indicates the better performance of the hybrid intelligent models. Based on different efficiency indices of testing data, it can be seen that the SVR-PSO and ANN-PSO models achieve better predictions compared to the CNN-PSO model. However, it is worth noting that in testing, both SVR-PSO and ANN-PSO performed well, with R 2 values of about 0.88 and 0.89 and MAPE values of 9.91% and 9.71%, respectively, which confirms the acceptability of the developed hybrid data-intelligence models.
For a more comprehensive examination, two significant graphical comparisons, namely the scatter-plots and relative error distribution, are presented. Figure 7 and Figure 8 show the actual-versus-predicted shear strength values in the training and testing of the hybrid SVR-PSO, ANN-PSO and CNN-PSO models, respectively. In the best fit lines y = m x + c , the ‘ m ’ values are close to one and the ‘ c ’ values are close to zero. Hence, the best-fit lines and R 2 values clearly indicate that the SVR-PSO and ANN-PSO models predict the shear strength more precisely than the CNN-PSO model.
Figure 9 presents the relative error distribution of the developed hybrid SVR-PSO, CNN-PSO and ANN-PSO models. Variations in the relative error indicate a fluctuating distribution in the developed models. Figure 9 also specifies that the developed CNN-PSO model has a wider variation when compared to the hybrid SVR-PSO and ANN-PSO models. A comparison of models illustrates that the maximum relative error is approximately 25% in the case of the hybrid ANN-PSO and SVR-PSO models, while it drifted approximately 55% in the hybrid CNN-PSO model. Hence, the obtained results indicate that the relative error distribution can be regarded as a method used to evaluate the models, based on the graphical representation.

9. Conclusions

In this study, a novel hybrid intelligent data model called the SVR-PSO was adapted to determine the underlying relationship between the dimensional and material properties of concrete beams and their ultimate shear strength. A reliable dataset of diverse material properties connected with shear strength was constituted from the comprehensive literature review and utilized for the development and evaluation of the model. The developed model was then validated with ANN and CNN models combined with particle swarm optimization. The following findings are evident:
Overall, the proposed SVR-PSO model demonstrates superior performance over the analogous ANN-PSO and CNN-PSO models.
he accomplished results considered in the testing period demonstrate that the hybrid SVR-PSO model is a reliable and robust intelligent data model to predict the ultimate shear strength of steel fiber-reinforced concrete beams, showing the predictive model as a very useful decision-support tool for structural engineers.
Despite the present research supporting the superiority of the SVR-PSO model, the approach can be further explored with other nature-inspired evolutionary algorithms, where the influence of parameters on the shear strength helps preclude the manual trial-and-error processes.
The results of this research enable concrete engineers to apply their prior knowledge of explainable features to the formulation of SFRC beams. Also, it advances our understanding of the effects of job-site constituents on the development of the best concrete and improves our ability to meet practical construction needs for beam design. The proposed hybrid intelligence models, however, can only be applied when there are nine explainable features and their values fall within the ranges indicated in Table 1 for each parameter. Further study should be conducted to include both unexplainable and explainable features for developing an effective predictive model because the beam is a very complex system made up of various types and numbers of phases, each of which is crucial in determining the shear strength. Hence, by taking meteorological data from construction sites into account, the number and variety of datasets used for training and testing the model need to be greatly increased in future studies.

Author Contributions

Conceptualization, B.R.K., A.S.S. and K.S.S.; methodology, B.R.K. and A.S.S.; software, B.R.K. and A.S.S.; validation, B.R.K., A.S.S. and K.S.S.; formal analysis, B.R.K.; investigation, B.R.K., A.S.S. and K.S.S.; data curation, B.R.K.; writing—original draft preparation, B.R.K. and A.S.S.; writing—review and editing, A.S.S. and K.S.S. All authors have read and agreed to the published version of the manuscript.

Funding

This research received no external funding.

Data Availability Statement

The data presented in this study are available in the research papers quoted in Table 1.

Acknowledgments

The authors are deeply grateful to the anonymous reviewers for their detailed comments, valuable insights and constructive feedback, which significantly improved the quality of the manuscript.

Conflicts of Interest

The authors declare no conflicts of interest.

References

  1. Adhikary, B.B.; Mutsuyoshi, H. Prediction of shear strength of steel fiber RC beams using neural networks. Constr. Build. Mater. 2006, 20, 801–811. [Google Scholar] [CrossRef]
  2. Ahn, N.; Jang, H.; Park, D.K. Presumption of Shear Strength of Steel Fiber Reinforced Concrete Beam Using Artificial Neural Network Model. J. Appl. Polym. Sci. 2007, 103, 2351–2358. [Google Scholar] [CrossRef]
  3. Hossain, K.M.A.; Gladson, L.R.; Anwar, M.S. Modeling shear strength of medium to ultra-high-strength steel fiber-reinforced concrete beams using artificial neural network. Neural Comput. Appl. 2017, 28, 1119–1130. [Google Scholar] [CrossRef]
  4. Naik, U.; Kute, S. Span-to-depth ratio effect on shear strength of steel fiber-reinforced high-strength concrete deep beams using ANN model. Int. J. Adv. Struct. Eng. 2013, 5, 29. [Google Scholar] [CrossRef]
  5. Gandomi, A.; Alavi, A.; Yun, G. Nonlinear modeling of shear strength of SFRC beams using linear genetic programming. Struct. Eng. Mech. 2011, 38, 1–25. [Google Scholar] [CrossRef]
  6. Shahnewaz, M.; Alam, M.S.; Tannert, T. Shear strength prediction of steel fiber reinforced concrete beams from genetic programming and its sensitivity analysis. In Proceedings of the 9th RILEM International Symposium on Fiber Reinforced Concrete, Vancouver, BC, Canada, 19–21 September 2016; pp. 1183–1192. [Google Scholar] [CrossRef]
  7. Slater, E.; Moni, M.; Alam, M.S. Predicting the shear strength of steel fiber reinforced concrete beams. Constr. Build. Mater. 2012, 26, 423–436. [Google Scholar] [CrossRef]
  8. Kara, I.F. Empirical modeling of shear strength of steel fiber reinforced concrete beams by gene expression programming. Neural Comput. Appl. 2013, 23, 823–834. [Google Scholar] [CrossRef]
  9. Islam, M.S.; Alam, S. Principal Component and Multiple Regression Analysis for Steel Fiber Reinforced Concrete (SFRC) Beams. Int. J. Concr. Struct. Mater. 2013, 7, 303–317. [Google Scholar] [CrossRef]
  10. Sarveghadi, M.; Gandomi, A.H.; Bolandi, H.; Alavi, A.H. Development of prediction models for shear strength of SFRCB using a machine learning approach. Neural Comput. Appl. 2019, 31, 2085–2094. [Google Scholar] [CrossRef]
  11. Islam, M.S. Simplified shear-strength prediction models for steel-fibre-reinforced concrete beams. Constr. Mater. 2021, 174, 88–100. [Google Scholar] [CrossRef]
  12. Yaseen, Z.M.; Deo, R.C.; Hilal, A.; Abd, A.M.; Bueno, L.C.; Salcedo-Sanz, S.; Nehdi, M.L. Predicting compressive strength of lightweight foamed concrete using extreme learning machine model. Adv. Eng. Softw. 2018, 115, 112–125. [Google Scholar] [CrossRef]
  13. Kennedy, J.; Eberhart, R. Particle swarm optimization. In Proceedings of the ICNN’95—International Conference on Neural Networks, Perth, Australia, 27 November–1 December 1995; pp. 1942–1948. [Google Scholar]
  14. Yang, H.; Zhang, S.; Deng, K.; Du, P. Research into a Feature Selection Method for Hyperspectral Imagery Using PSO and SVM. J. China Univ. Min. Technol. 2007, 17, 473–478. [Google Scholar] [CrossRef]
  15. Cucchiara, C.; Mendola, L.L.; Papia, M. Effectiveness of stirrups and steel fibres as shear reinforcement. Cem. Concr. Compos. 2004, 26, 777–786. [Google Scholar] [CrossRef]
  16. Dinh, H.H.; Parra-montesinos, G.J.; Wight, J.K. Shear Strength Model for Steel Fiber Reinforced Concrete Beams without Stirrup Reinforcement. J. Struct. Eng. 2010, 137, 1039–1051. [Google Scholar] [CrossRef]
  17. Aoude, H.; Belghiti, M.; Cook, W.D.; Mitchell, D. Response of steel fiber-reinforced concrete beams with and without stirrups. Struct. J. 2012, 109, 359–367. [Google Scholar] [CrossRef]
  18. Spinella, N.; Colajanni, P.; Mendola, L.L. Nonlinear analysis of beams reinforced in shear with stirrups and steel fibers. Struct. J. 2012, 109, 53–64. [Google Scholar] [CrossRef]
  19. Amin, A.; Foster, S.J. Shear strength of steel fibre reinforced concrete beams with stirrups. Eng. Struct. 2016, 111, 323–332. [Google Scholar] [CrossRef]
  20. Navas, F.O.; Navarro-Gregori, J.; Herdocia, G.L.; Serna, P.; Cuenca, E. An experimental study on the shear behaviour of reinforced concrete beams with macro-synthetic fibres. Constr. Build. Mater. 2018, 169, 888–899. [Google Scholar] [CrossRef]
  21. Yoo, D.Y.; Yang, J.M. Effects of stirrup, steel fiber, and beam size on shear behavior of high-strength concrete beams. Cem. Concr. Compos. 2018, 87, 137–148. [Google Scholar] [CrossRef]
  22. Gali, S.; Subramaniam, K.V.L. Efficiency of steel fibers in shear resistance of reinforced concrete beams without stirrups at different moment-to-shear ratios. Eng. Struct. 2018, 188, 249–260. [Google Scholar] [CrossRef]
  23. Moradi, M.; Aletaha, S.H.; Asadzadeh, E.; Qomzade, M.M. Shear Strength of Fiber-Reinforced Concrete Beams with Stirrups. Iran. J. Sci. Technol. Trans. Civ. Eng. 2022, 46, 865–888. [Google Scholar] [CrossRef]
Figure 1. Structure of artificial neurons.
Buildings 15 01265 g001
Figure 2. Structure of artificial neural network.
Buildings 15 01265 g002
Figure 3. Basic structure of convolutional neural network.
Buildings 15 01265 g003
Figure 4. The correlation between input parameters and the target shear strength.
Buildings 15 01265 g004aBuildings 15 01265 g004b
Figure 5. Heat map representation of correlation between variables.
Buildings 15 01265 g005
Figure 6. Representation of feature importance.
Buildings 15 01265 g006
Figure 7. Scatter-plots displaying the actual-versus-predicted shear strengths in training results.
Buildings 15 01265 g007
Figure 8. Scatter-plots displaying the actual-versus-predicted shear strengths in testing results.
Buildings 15 01265 g008
Figure 9. The relative error distribution over the testing phase of the models.
Buildings 15 01265 g009
Table 1. Comprehensive dataset of shear strength results of SFRC beams.
SNbda/dfcVfARcRtRvVSCReference
11502192.8041.20.00000.0011.660.001.23[15]
21502192.8041.20.00002.9211.660.482.72
31502192.8041.20.00002.9211.661.603.47
41502192.0041.20.00000.0011.660.001.51
51502192.0041.20.00002.9211.660.481.83
61502192.0041.20.00002.9211.661.604.34
71502192.8041.21.00600.0011.660.002.93
81502192.8041.22.00600.0011.660.003.15
91502192.8041.21.00602.9211.660.483.03
101502192.8041.21.00602.9211.661.603.53
111502192.8041.20.00002.9211.660.482.72
121502192.0041.21.00600.0011.660.003.50
131502192.0041.22.00600.0011.660.003.52
141502192.0041.21.00602.9211.660.483.68
151502192.0041.22.00602.9211.660.485.28
161523813.4442.80.00002.0012.320.001.10[16]
171523813.4442.80.00002.0012.320.001.10
181523813.4444.80.75552.2109.040.002.90
191523813.4444.80.75552.2109.040.002.80
201523813.5038.11.00552.2109.040.003.00
211523813.5038.11.00552.2109.040.003.10
221523813.5038.11.00552.0012.320.003.50
231523813.5038.11.00552.0012.320.002.60
241523813.4431.01.50552.0012.320.002.60
251523813.4431.01.50552.0012.320.003.40
261523813.4444.91.50552.0012.320.003.30
271523813.4444.91.50552.0012.320.003.30
281523813.4449.21.00802.0012.320.003.00
291523813.4449.21.00802.0012.320.003.80
301523813.4443.30.75802.2109.040.003.30
311523813.4443.30.75802.2109.040.003.30
322056103.5050.80.75550.9409.380.002.90
332056103.5050.80.75550.9409.380.002.70
342056103.5028.70.75800.9409.380.002.80
352056103.5028.70.75800.9409.380.002.80
362056103.5042.30.75550.9207.130.002.80
372056103.5029.60.75800.9207.130.002.10
382056103.5029.60.75800.9207.130.001.80
392056103.5044.41.50550.9409.380.003.50
402056103.5042.81.50800.9409.380.003.40
412056103.5037.00.00000.9207.130.001.30
422056103.5037.00.00000.9207.130.071.80
431502023.0023.30.00000.0012.620.001.20[17]
441502023.0021.30.50550.0012.620.001.57
451502023.0019.61.00550.0012.620.001.86
463004373.1023.30.0002.0006.540.000.95
473004373.1021.30.50552.0006.540.001.18
483004373.1019.61.00552.0006.540.001.51
491502192.8075.70.00000.0011.450.001.11
501502192.8075.70.00002.8611.450.452.59[18]
511502192.8080.01.00550.0011.450.003.46
521502192.8080.01.00552.8611.450.453.79
531502192.0075.70.00000.0011.450.002.07
541502192.0075.70.00002.8611.450.453.96
551502192.0080.01.00550.0011.450.004.29
561502192.0080.01.00552.8611.450.455.42
573006222.8134.00.00001.8810.690.261.26[19]
583006222.8134.00.32671.8810.690.001.47
593006222.8134.00.32671.8810.690.121.95
603006222.8134.00.32671.8810.690.261.79
613006222.8146.00.29671.8810.690.131.73
623006222.8146.00.29671.8810.690.241.91
633006222.8136.00.00001.8810.690.120.96
643006222.8136.00.68671.8810.690.002.02
653006222.8136.00.68671.8810.690.122.48
663006222.8136.00.68671.8810.690.262.87
673054703.8939.70.38671.1109.840.001.63[20]
683054694.8739.70.38671.1113.320.001.59
692294723.8839.70.38671.4812.740.001.43
702294694.8739.70.38671.4813.320.001.52
713054773.8439.70.38671.1109.840.262.30
723054774.7939.70.38671.1112.740.262.26
732294773.8439.70.38671.4812.740.382.50
742294754.8139.70.38671.4811.580.382.26
753054733.8740.60.00001.1109.840.001.08
763054744.8240.60.00001.1112.740.001.17
772294733.8740.60.00001.4812.740.001.26
782294714.8540.60.00001.4812.740.001.05
793054733.8740.60.00001.1109.840.281.64
803054734.8340.60.00001.1112.740.281.66
812294743.8640.60.00001.4812.740.382.16
822294744.8240.60.00001.4812.740.382.03
833004203.2160.50.00000.4516.020.456.16[21]
843004203.2162.30.75640.0016.020.006.52
854506483.2660.50.00000.1611.090.415.97
864506483.2662.30.75640.0011.090.005.44
876008873.2660.50.00000.1008.240.385.37
886008873.2662.30.75640.0008.240.003.89
891252221.8033.70.00000.0007.240.002.41[22]
901252221.8035.40.50800.0007.240.002.89
911252221.8039.10.75800.0007.240.004.21
921252222.2531.40.00000.0007.240.001.87
931252222.2537.60.50800.0007.240.003.02
941252222.2540.30.75800.0007.240.003.29
951252223.0034.90.00000.0007.240.001.59
961252223.0038.00.50800.0007.240.002.42
971001003.0041.70.00003.7814.800.002.40[23]
981001003.0041.70.00003.7814.800.243.19
991001003.0041.70.00003.7814.800.242.80
1001001003.0041.70.00003.7814.800.302.99
1011001003.0041.70.00003.7814.800.303.63
1021001003.0028.90.00003.7814.800.001.81
1031001003.0028.90.00003.7814.800.242.84
1041001003.0028.90.00003.7814.800.302.99
1051001003.0038.80.75443.7814.800.003.53
1061001003.0038.80.75443.7814.800.244.32
1071001003.0038.80.75443.7814.800.304.46
1081001003.0033.70.75443.7814.800.003.09
1091001003.0033.70.75443.7814.800.243.63
1101001003.0033.70.75443.7814.800.303.97
1111001003.0035.21.50443.7814.800.004.07
1121001003.0035.21.50443.7814.800.244.22
1131001003.0035.21.50443.7814.800.304.31
1141001003.0044.11.50443.7814.800.004.07
1151001003.0044.11.50443.7814.800.244.27
1161001003.0044.11.50443.7814.800.304.51
Table 2. Statistical characteristics of the Dataset.
SCBda/dfcVfARCRtRvVSC
Min.1001001.8019.60.00000.006.540.000.95
Max.6008874.8780.02.00803.7816.021.606.52
µ1943553.1342.10.57401.7511.350.162.82
σ94.71950.6912.60.55311.3002.480.291.22
Ku4.68−0.720.872.66−0.39−1.56−1.11−0.6814.020.26
Sk1.800.390.481.480.63−0.330.16−0.233.290.62
Table 3. Relative errors of training data.
Min. Relative Error (%)Max. Relative Error (%)MAPE (%)MAERMSE R 2 SI
SVR-PSO0.0545.848.180.190.240.960.08
ANN-PSO0.0214.103.030.090.140.980.05
CNN-PSO0.0115.213.200.090.140.980.05
Table 4. Relative errors of testing data.
Min. Relative Error (%)Max. Relative Error (%)MAPE (%)MAERMSE R 2 SI
SVR-PSO0.7825.409.910.280.370.880.13
ANN-PSO0.3919.259.770.260.320.890.12
CNN-PSO0.2055.0113.190.360.570.810.21
Disclaimer/Publisher’s Note: The statements, opinions and data contained in all publications are solely those of the individual author(s) and contributor(s) and not of MDPI and/or the editor(s). MDPI and/or the editor(s) disclaim responsibility for any injury to people or property resulting from any ideas, methods, instructions or products referred to in the content.

