1. Introduction
As the world grapples with the urgency of climate change, many private sector companies, particularly countries, are searching for new sustainable technologies and applications that will reduce energy consumption and carbon footprint. In this context, relevant laws, implementation incentives and restrictions are applied globally and locally in countries. The energy consumed by buildings, 30% of the total final energy consumption, is second highest after industry. With the use of appropriate insulation and high-efficiency equipment, this demand can be reduced by 15%, a reduction that surpasses the total electricity generation of several countries, including the Netherlands [
1]. Therefore, thermal insulation stands as a cornerstone among factors that exert the most influence on the energy consumption of a building for sustainable practices.
Liu et al. (2021) [
2] listed the importance of the 10 factors that exert the most influence on the energy consumption of a building, from high to low: roof heat transfer coefficient (HTC) > thermal insulation thickness > internal wall HTC > solar HTC throughout window > ratio of window to wall > floor HTC > energy efficiency of air conditioning > interior temperature > fresh air volume > temperature of natural ventilation. Among these 10 parameters, the HTC value primarily hinges on the thickness of the thermal insulation and its inherent properties. Yet, its efficacy hinges not only on its presence but also on its optimal thickness, striking a balance between thermal performance and economic viability.
In Türkiye, a standard called TS825 “Thermal Insulation Rules in Buildings” exists, which outlines the minimum insulation requirements for buildings to minimize heat loss and establishes the legal framework for energy efficiency, similar to the European EN 12831 standard. However, since this standard was published in 2008, its relevance to current conditions is frequently debated, and there are many calls for its update. Kon and Caner (2021) [
3] determined the energy consumption for heating and cooling and CO
2 and SO
2 emissions of buildings in 20 capitals of Europe, including Ankara, according to TS825. It was observed that the recommended and/or legally required total heat transfer values listed for developed European countries were lower for Ankara. As mentioned above, this indicates the need for updating and improving the TS825 standard [
3]. Aydın and Bıyıklıoğlu (2020) [
4] determined the optimal insulation thicknesses for Türkiye by using life cycle cost analysis (LCCA) and compared them with the U-values recommended by the standard. The authors discussed the discrepancies and emphasized the need for an update to the TS825 standard.
Furthermore, TS825 determines the minimum insulation requirements for buildings solely based on thermal loss and gain calculations, without considering economic and environmental factors. This singular approach can lead to errors in the decision making and implementation processes. In this context, understanding the interplay between insulation thickness, annual energy efficiency gains, carbon emission reduction, and sustainable applications, along with long-term economic implications, has increased interest in sustainability and led to the development of LCCA. This analysis involves assessing expenses across all stages of a product’s lifespan, from creation to disposal, with the goal of reducing overall costs and providing economic advantages to both producers and users [
5]. Complementing LCC, competitive cost analysis identifies crucial operational cost factors to aid in strategic decision making. The correlation between globalization, competitiveness, and improved industrial performance underscores the importance of cost management across the production and operational process [
6,
7].
There are studies all over the world on thermal insulation to reduce the energy consumption of a building by using the LCCA method. Muddu et al. (2021) [
8] proposed optimum insulation thickness (OIT) for typical walls in twenty-five locations in Ireland for the renovation of existing buildings. The material payback period (PP), CO
2 emissions, and annual heat energy consumption are all taken into account when calculating OIT. The strategy used is based on the LCCA method and heating degree day (HDD) for various combinations of insulation material, type of heat energy, and wall configuration. The findings show that the potential yearly cost savings (up to 170 EUR/m
2) and carbon emissions (up to 50 kg/m
2) are significantly influenced by the type of configuration, heat energy, wall materials, and insulation. Ali et al. (2024) [
9] discussed various thermal insulation materials, emphasizing their properties, performance and environmental impacts. The authors researched recent trends that can enhance energy efficiency and sustainability in buildings. Additionally, the authors stated that different conditions require different applications and that the commonly accepted insulation materials, which have been in use for many years, are not suitable for all conditions and bring about several drawbacks. Deshmukh and Madhura (2025) [
10] analyzed key factors in optimizing thermal efficiency, environmental impacts, and the economic viability of buildings by utilizing sustainable composite materials. The authors aimed to identify the most sustainable material choice by analyzing their thermal performance and associated costs. Ziapour et al. (2020) [
11] determined the OIT using LCCA and the HDD method when the composite prefabricated wall block was used as an external wall member in three provinces of Iran. These provinces are chosen from the warm, cold and semi-arid climate areas. A special integration of polystyrene, polyurethane, and air gap was used as the insulation material. The findings, based on cooling and heating, demonstrated that when air conditions warm, the OIT rises, resulting in increased cost savings and a shorter PP. The OIT for cooling and heating varied between 10.6 cm and 16.35 cm, and the PP changed between 0.33 and 0.57 years. Further, 19% of power consumption is used for climate control systems in the residential sector (6% for rural and 13% for urban households), and 95% of homes in Mexico do not keep thermal insulation. Shrestha et al. (2014) [
12] proposed a protocol for assessing the lifetime energy and environmental impacts of insulation materials, which considers all life cycle stages, such as raw material acquisition, manufacturing, installation and use, disposal treatment. Through this protocol, the authors delineated standardized calculation methodologies for avoided operational energy (AOE) and avoided environmental impact (AEI), which typically wield significant influence over the total environmental impact of insulation materials but have historically lacked precise definition. AOE expresses the difference between the energy consumed by the optimal insulation application following the prescribed protocol and that of the current insulation or non-insulated application over its lifetime. With higher AOE values, in accordance with the proposed protocol, it was stated that there is a potential to reduce total energy consumption for heating and cooling applications. Seo and Foliente (2021) [
13] investigated the reduction potential of the carbon footprint through residential buildings in Australia with economically and environmentally sustainable retrofit methods. According to the findings, when structures are renovated with insulation and double-glazed windows, the environmental benefits increase over the course of a home’s life cycle more quickly than the economic benefits. The city has the potential to reduce 0.372 million tons of life cycle greenhouse gas emissions and save 3937 TJ of life cycle energy annually. Climate control systems are thought to consume 4.5-times as much electricity as the whole residential sector. The power consumption of air conditioner control systems (such as electric heaters, fans, and air conditioners) in all locations in Mexico (4525 urban and 187,719 rural locations) was determined by Rosas-Flores and Rosas-Flores (2020) [
14]. Locations were divided into three climate regions: tropical, mild, and extremely hot. The OIT of the roofs and walls was calculated according to the different insulation stuffs, polyurethane, expanded polystyrene, glass-wool, rockwool, and extruded polystyrene. The repayment time for extremely hot zones changed between 6.1 and 7.5 years. By 2030, if the recommended adequate insulation system is applied to all current and future homes, it will potentially save 73.63 TWh in electricity, which equates to 38.66 tons of CO
2 emissions. It has been noted that, based on the reviewed studies, the OIT cannot be achieved through an engineering approach alone; a comprehensive evaluation of engineering, economic, and environmental factors is necessary. In addition to the studies carried out all over the world, a few studies have also been performed in Türkiye. The OIT of the building’s external wall surface and exergy cost savings in the provinces of Kars, Trabzon, Ankara, and Izmir were determined using thermo-economic analysis. Polyurethane and expanded polystyrene were used, and natural gas was selected. OIT values were 0.107, 0.06, 0.077, and 0.046 m in Kars, Trabzon, Ankara, and Izmir, respectively, for the expanded polystyrene material, as well as 0.055 m in Kars, 0.0304 m in Trabzon, 0.039 m in Ankara, and 0.023 m in Izmir for the polyurethane material. The minimum savings were seen in Izmir, whereas the maximum savings were seen in Kars. Exergy cost savings for the polyurethane and expanded polystyrene materials were 51% and 56.6% in Kars and 22% and 27% in Izmir, respectively [
15]. Ekici et al. (2012) [
16] computed OIT according to the wall types (concrete, brick, and stone), four cities from different climate zones (Kayseri, Elazıg, Istanbul, and Antalya), four different insulation materials (foamed polyurethane, extruded polystyrene, and expanded polystyrene). PP, energy savings, and OIT were calculated. It was indicated that PP, energy savings, and OIT changed between 0.714 and 9.104 years, 0.038 USD/m
2 and 250.415 USD/m
2, and 0.2 cm and 18.6 cm, respectively.
This study aims to fully underline the expression ‘optimum’ by examining insulation thickness from both economic and engineering perspectives by combining the TS825 engineering approach with LCCA. It is conducted in cooperation with the Silifke Chamber of Commerce and Industry to explore its pivotal role in curbing carbon emissions and reducing energy consumption while maximizing financial benefits and to raise the social awareness of end users and productivity and competitiveness for businesses. Within this study, the OIT was calculated for 81 provinces in Türkiye according to five various insulation materials and five different heating sources. EPS, XPS, PUR, glasswool, and rockwool are used as insulation materials. Electricity, LPG, fuel oil, coal, and natural gas are chosen as heating sources. A brick wall model that is open to the ambient air was chosen. Based on TS825, the HDD method and LCCA were used. The heat loss from the wall was computed, and OITs and energy savings were determined according to the LCCA. The effect of the heating source, location, insulation material, fuel and insulation price, interest and inflation rate, and project lifetime on OIT was considered for 81 provinces in Türkiye.
The findings of this comprehensive study provide valuable insights into the optimal insulation thickness for 81 provinces in Türkiye, considering different factors, such as climatic conditions, energy sources, insulation materials and economic parameters. This study sheds light on the importance of energy-efficient building practices and their impact on our environment and economy, and it serves as a guide to inform decision makers, industry professionals, and the public alike.
3. Results and Discussion
This study seeks to comprehensively explore the concept of the ‘optimum’ insulation thickness by evaluating it from both economic and engineering perspectives using life cycle cost analysis (LCCA). By incorporating LCCA and average heating degree day (HDD) values, this study calculates the ideal insulation thickness for 81 provinces in Türkiye. However, for a more focused analysis, tables are presented in this section for five representative cities: Istanbul (the largest city), Ankara (the second largest and the capital), Izmir (the third largest city), Mersin (hottest city and where Silifke Chamber of Commerce and Industry is located), and Ardahan (the coldest city). Due to the complexity of providing all figures for 81 provinces, figures are provided with a reference to the capital of Türkiye, Ankara, to aid understanding of the analysis. Additionally, the full analysis results (the OIT, the PP, annual savings and emission reduction for different insulation materials according to natural gas, coal, fuel oil, LPG and electricity as heating source) for all 81 provinces in Türkiye are given in the
Supplementary Materials.
There are two parameters that affect the total heating cost of an insulated building. These are insulation and heating source costs. Heat loss is reduced due to the increase in insulation thickness in buildings. Therefore, the energy requirement for heating the unit area is reduced, and the total cost is reduced. However, as mentioned in the Materials and Methods, increasing the insulation thickness more than necessary could even lead to negative outcomes during its lifetime. When the initial investment cost is examined according to the PWF value throughout the application life, the economic viability of the project can be discussed. In this context, the value at which the total cost is minimal is expressed as the OIT.
When choosing the insulation material for a building, it is necessary to consider not only the type of material but also the type of heating source (fuel) used. Although the use of natural gas has become widespread in Türkiye, there are still regions where it cannot be delivered due to its location. For this reason, calculating the insulation thickness with a single fuel source will not reflect reality. In addition to that, insulation materials can be produced regionally as different types due to reasons, such as thermal conductivity, moisture retention, fire resistance, ease of production and material availability. For this reason, calculating the insulation thickness with a single insulation material will also not reflect reality. In this context, calculations were carried out with five different insulation materials: extruded polystyrene (XPS), expanded polystyrene (EPS), polyurethane foam (PUR), glasswool, and rockwool. There were also four different heating sources: natural gas, coal, fuel oil, LPG, and electricity.
The effects of heating source and insulation material on the OIT according to LCCA are given in
Table 5 for the five listed cities. As can be seen in
Table 5, OIT changes according to the insulation material and heating source as well. One of the factors affecting the OIT is the thermal resistance of the wall. As the thermal resistance of the wall increases, the required insulation thickness decreases. Therefore, the insulation thickness to be applied to walls with high thermal resistance can be lowered. The degree day values for Türkiye varied between 878 (for the province of Hatay and the city of Iskenderun) and 5443 (for Ardahan province) in the study of Bolattürk (2006) [
18]. This shows that a building located in the province of Ardahan requires 6.2-times more energy for heating than the one in Iskenderun with the same characteristics. This serious change in energy demand also significantly affects the OIT.
It can be said that there is no practical application that can be used in every condition; it depends on various conditions. Even this can lead to an awareness to select the proper insulation material and even the proper heating source. As mentioned in the Materials and Methods section, the insulation applications are carried out in two ways after the construction of the structure. That means that the heating source was already selected. Therefore, proper insulation material must be selected according to these values. In addition to that, if there are two options as heat sources (electricity as air conditioner and natural gas, for example), the more suitable solution for heating can be selected according to
Table 5.
As can be seen in
Table 5, different OITs are obtained for different insulation materials and heating sources. For this reason, as mentioned in the third paragraph of the Results and Discussion section, it is very important to carry out this study with more than one heating source and insulation material. PUR insulation material seems to be the most suitable choice according to
Table 5. However, not enough data were shared to say this. Any interpretation based solely on this table will be nothing more than misleading. As stated in the Materials and Methods section, examining the OIT with LCCA will provide accurate information about the economics and applicability of the project.
To better understand the results presented in
Table 5 and to evaluate the findings from an economic perspective, the effects of the heating source and insulation material on the PP according to LCCA are given in
Table 6 for the five listed cities. In light of the data presented in
Table 5, PUR appears to be the most suitable choice; however, when both engineering and economic factors are considered together, it becomes evident that making a selection based solely on
Table 5 would be a highly flawed decision. As can be seen in the table, PUR insulation material seems to be the worst choice. The reason for this is its cost. All other insulation materials presented values close to each other. It can be said that XPS insulation material seems the best for most locations. However, as previously mentioned, if the selection of insulation materials is made solely based on engineering and/or economic factors, a comprehensive approach would be compromised. A decision that takes into account not only engineering and economic factors but also environmental and production aspects will ensure both an integrated and sustainable solution in the long term. Insulation materials can be produced regionally as different types due to reasons, such as thermal conductivity, moisture retention, fire resistance, ease of production and material availability. In addition to that, global agreements signed by countries (The United Nations Framework Convention on Climate Change), laws passed to reduce carbon emissions, etc., play a major role in the selection of the insulation material to be used in applications. Shrestha et al. (2014) [
12] examined the environmental effects of various insulation materials from the manufacturing stage to the disposal process in their study. They emphasized that the insulation material to be chosen should be recyclable, the waste rate during installation should be low, the materials used during production should be of recycled origin, etc. The ratio of carbon dioxide equivalent emission reduction compared to non-insulation for different insulation materials and heating sources is given in
Table 7. It should also be noted that the insulation material itself generates carbon emissions, both directly and indirectly, from the beginning of its production process throughout its entire lifespan. In a study conducted by Resalati (2022) [
19], the embodied carbon emissions of insulation materials, such as EPS, XPS, PUR, rockwool, and glasswool, were examined from the beginning of their production processes, based on an estimated 15-year lifetime, considering both direct and indirect emissions. The results showed that the lowest embodied carbon values were determined for glasswool, rockwool, EPS, XPS, and PUR, respectively, with the primary factor for the lower values of glasswool and rockwool, as their production is from natural materials. Additionally, total emission values for different heating systems and insulation materials were also analyzed for 20 capitals of Europe, including Ankara [
3]. Therefore, this environmental factor can be a crucial decision-making element when selecting insulation materials. This aspect must certainly be taken into account.
In light of the results obtained, it can be said that there is no “the suitable insulation material” for all locations and conditions; the OIT alone is not a sufficient and acceptable concept. All factors concerning energy and engineering economy, economic viability, environmental impacts, and producibility should be meticulously evaluated and calculated, tailored to the specific location determined with clarity. Only in this way will the expression ‘optimum’ insulation thickness be valid. This result is consistent with the interpretations provided by authors in similar studies previously conducted in the literature [
20].
Based on the results obtained from
Table 5,
Table 6 and
Table 7, EPS and XPS are found to be the most suitable insulation materials for the capital city of Türkiye. In addition to that, natural gas is very widely used in Ankara; therefore, to better understand the LCCA, individual analysis is given in
Figure 1 and
Figure 2 for Ankara with the insulation materials EPS and XPS and the heating source as natural gas.
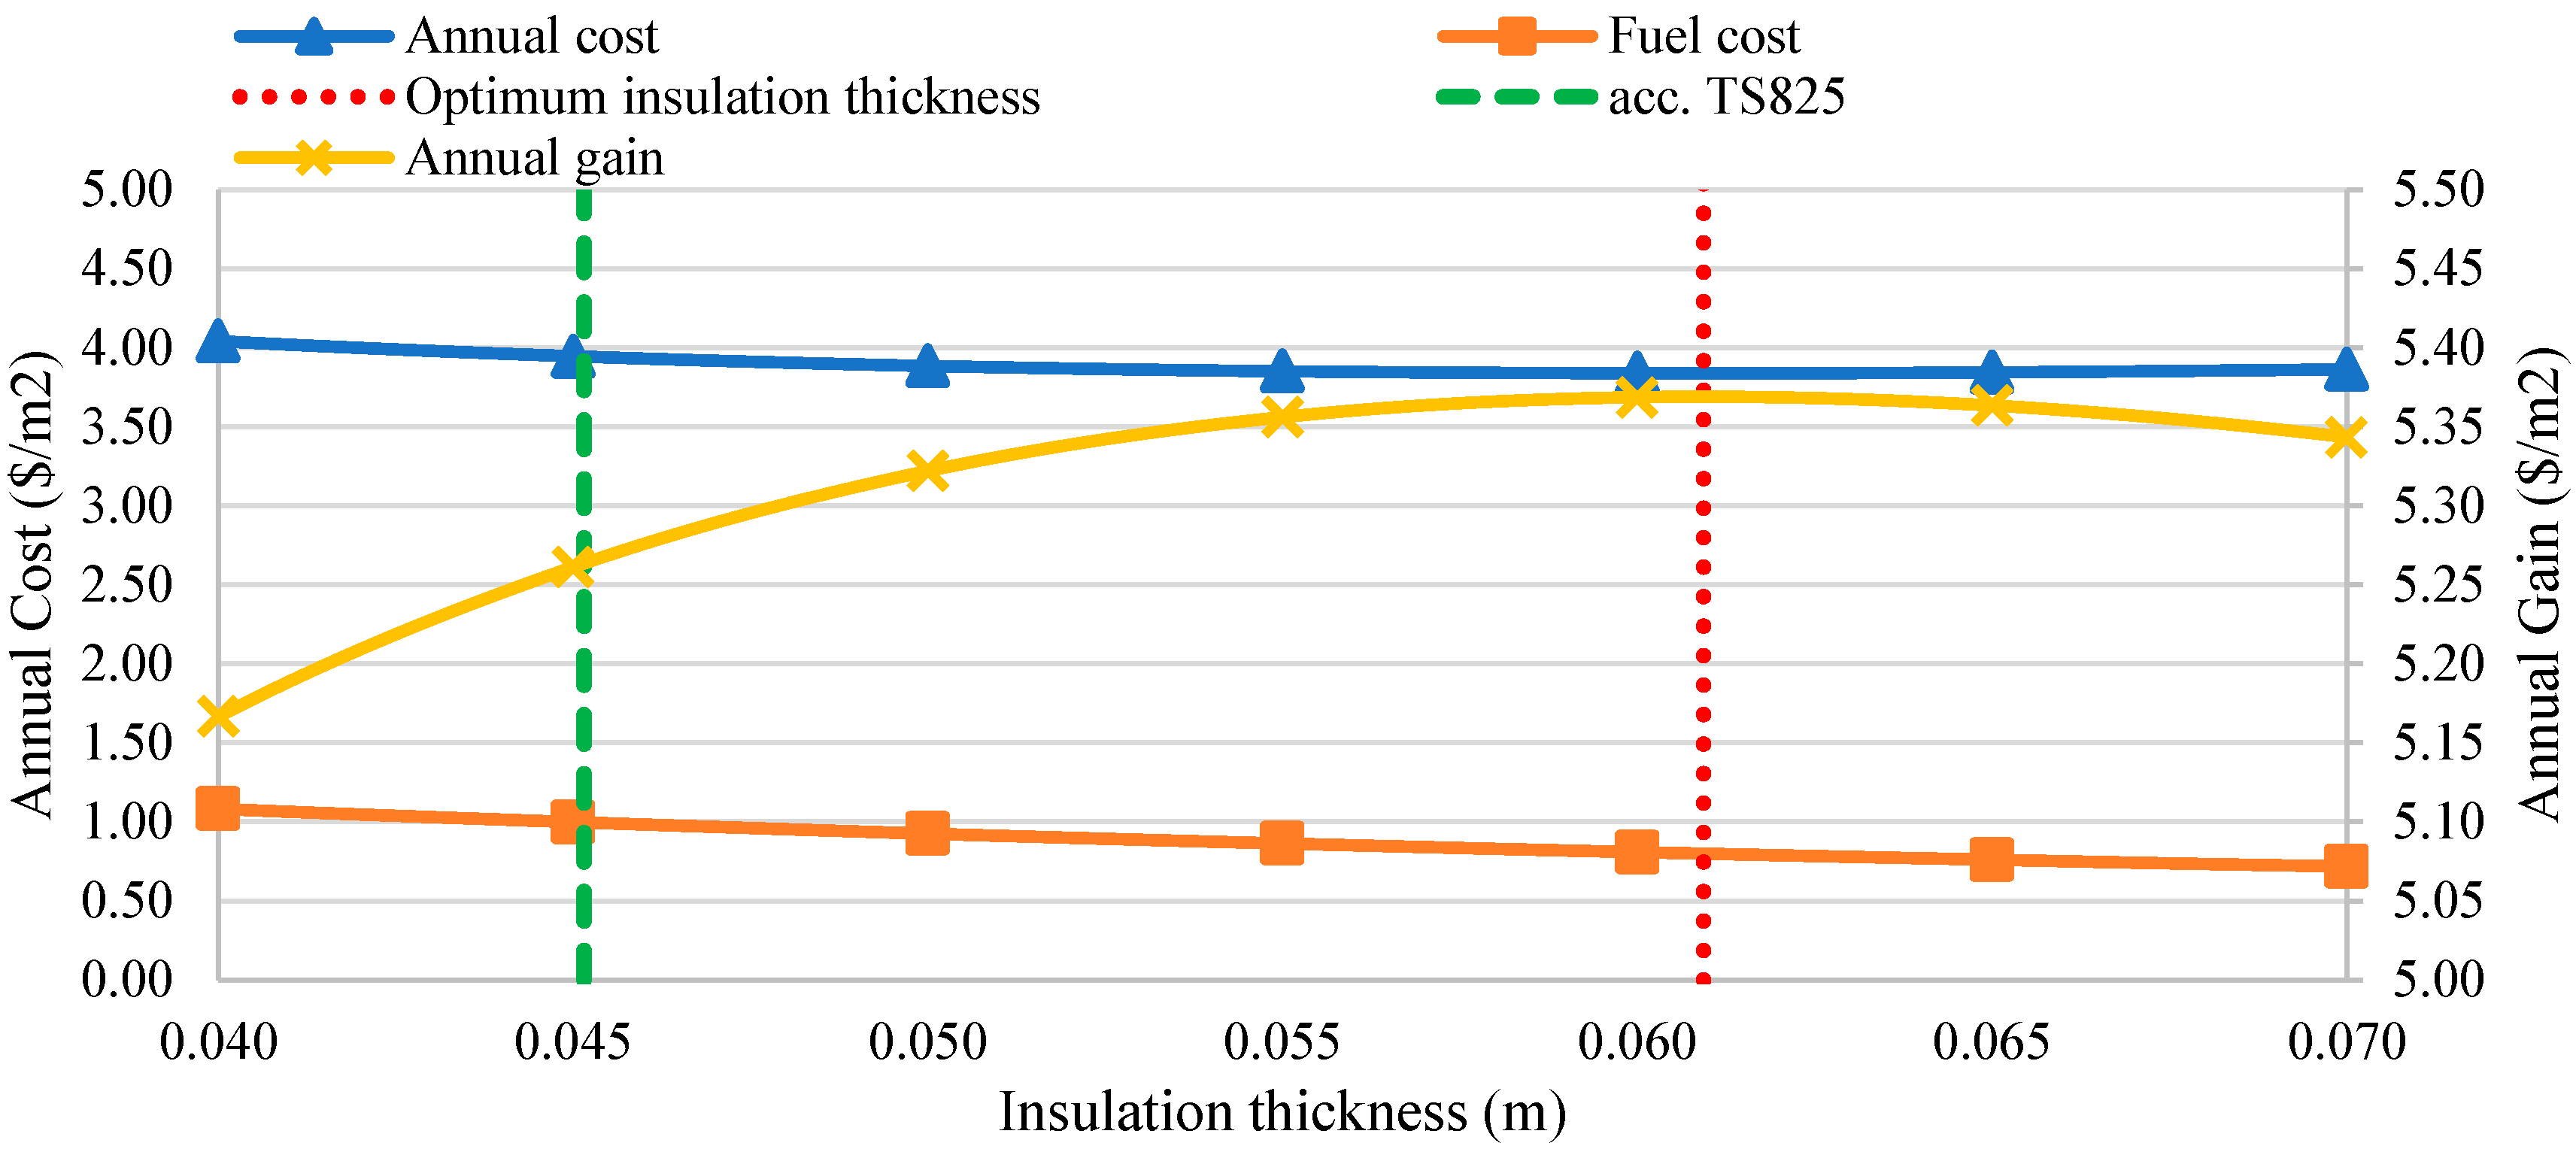
OIT was calculated as 60.9 and 45.9 mm for Ankara with the heating source as natural gas and insulation materials as XPS and EPS, respectively. Under these conditions, the total heat transfer coefficient for the use of XPS and EPS insulation materials was calculated as 0.401 W/m
2K and 0.505 W/m
2K, respectively. The total heat transfer coefficient naturally varies depending on the type of fuel used, as the optimum insulation thickness calculated with LCCA differs for different heating systems, even for the same wall, leading to changes in the total U-value. For instance, when coal is used as the fuel, the total heat transfer coefficients for XPS and EPS are calculated to be 0.265 W/m
2K and 0.334 W/m
2K, respectively. In the previously mentioned TS825 standard, the recommended limit value for Ankara province is specified as 0.5 W/m
2K, without varying based on the heating system or insulation material (no different value has been provided). Firstly, this can be quite confusing. When considering the selection of the heating system and insulation material, the availability of materials, and environmental factors for the relevant location, the TS825 standard alone does not provide sufficient guidance for determining the optimum solution for the different applications. The insulation thickness corresponding to the recommended total heat transfer coefficient of 0.5 W/m
2K is defined by the TS825 standard for Ankara, using natural gas and XPS, alongside the optimum insulation thickness calculated through the LCCA presented in
Figure 3. As can be seen in
Figure 3, the insulation thickness calculated using a purely engineering approach results in a increase in total fuel costs, overall costs, and a reduction in annual savings. In addition to that, based on the LCCA, the payback period for the optimum insulation thickness is 1.715 years, while the payback period calculated using the TS825 reference is 1.75 years. At first glance, the thinner insulation thickness may seem more appealing, but from a holistic perspective, it falls short in every aspect. For this reason, the result of an analysis based solely on an engineering approach, which is labeled as “optimum”, is far from reality and inaccurate.
As can be seen in
Figure 1 and
Figure 2, as expected, increasing insulation thickness increases annual gain and decreases emission reduction and annual cost for fuel. However, there is a limit in terms of economic viability. With insulation, continuous annual gains will be achieved compared to no insulation. However, as can be seen in the figures, the peak of the annual gain will indicate the OIT. Although every thickness of insulation materials before this point provides annual gains, it is not fully suitable for the optimum. At every thickness after this point, although the annual gain remains positive up to a point, it offers less gain than the peak point. Similarly, it would not be correct to use the expression optimum for this region.
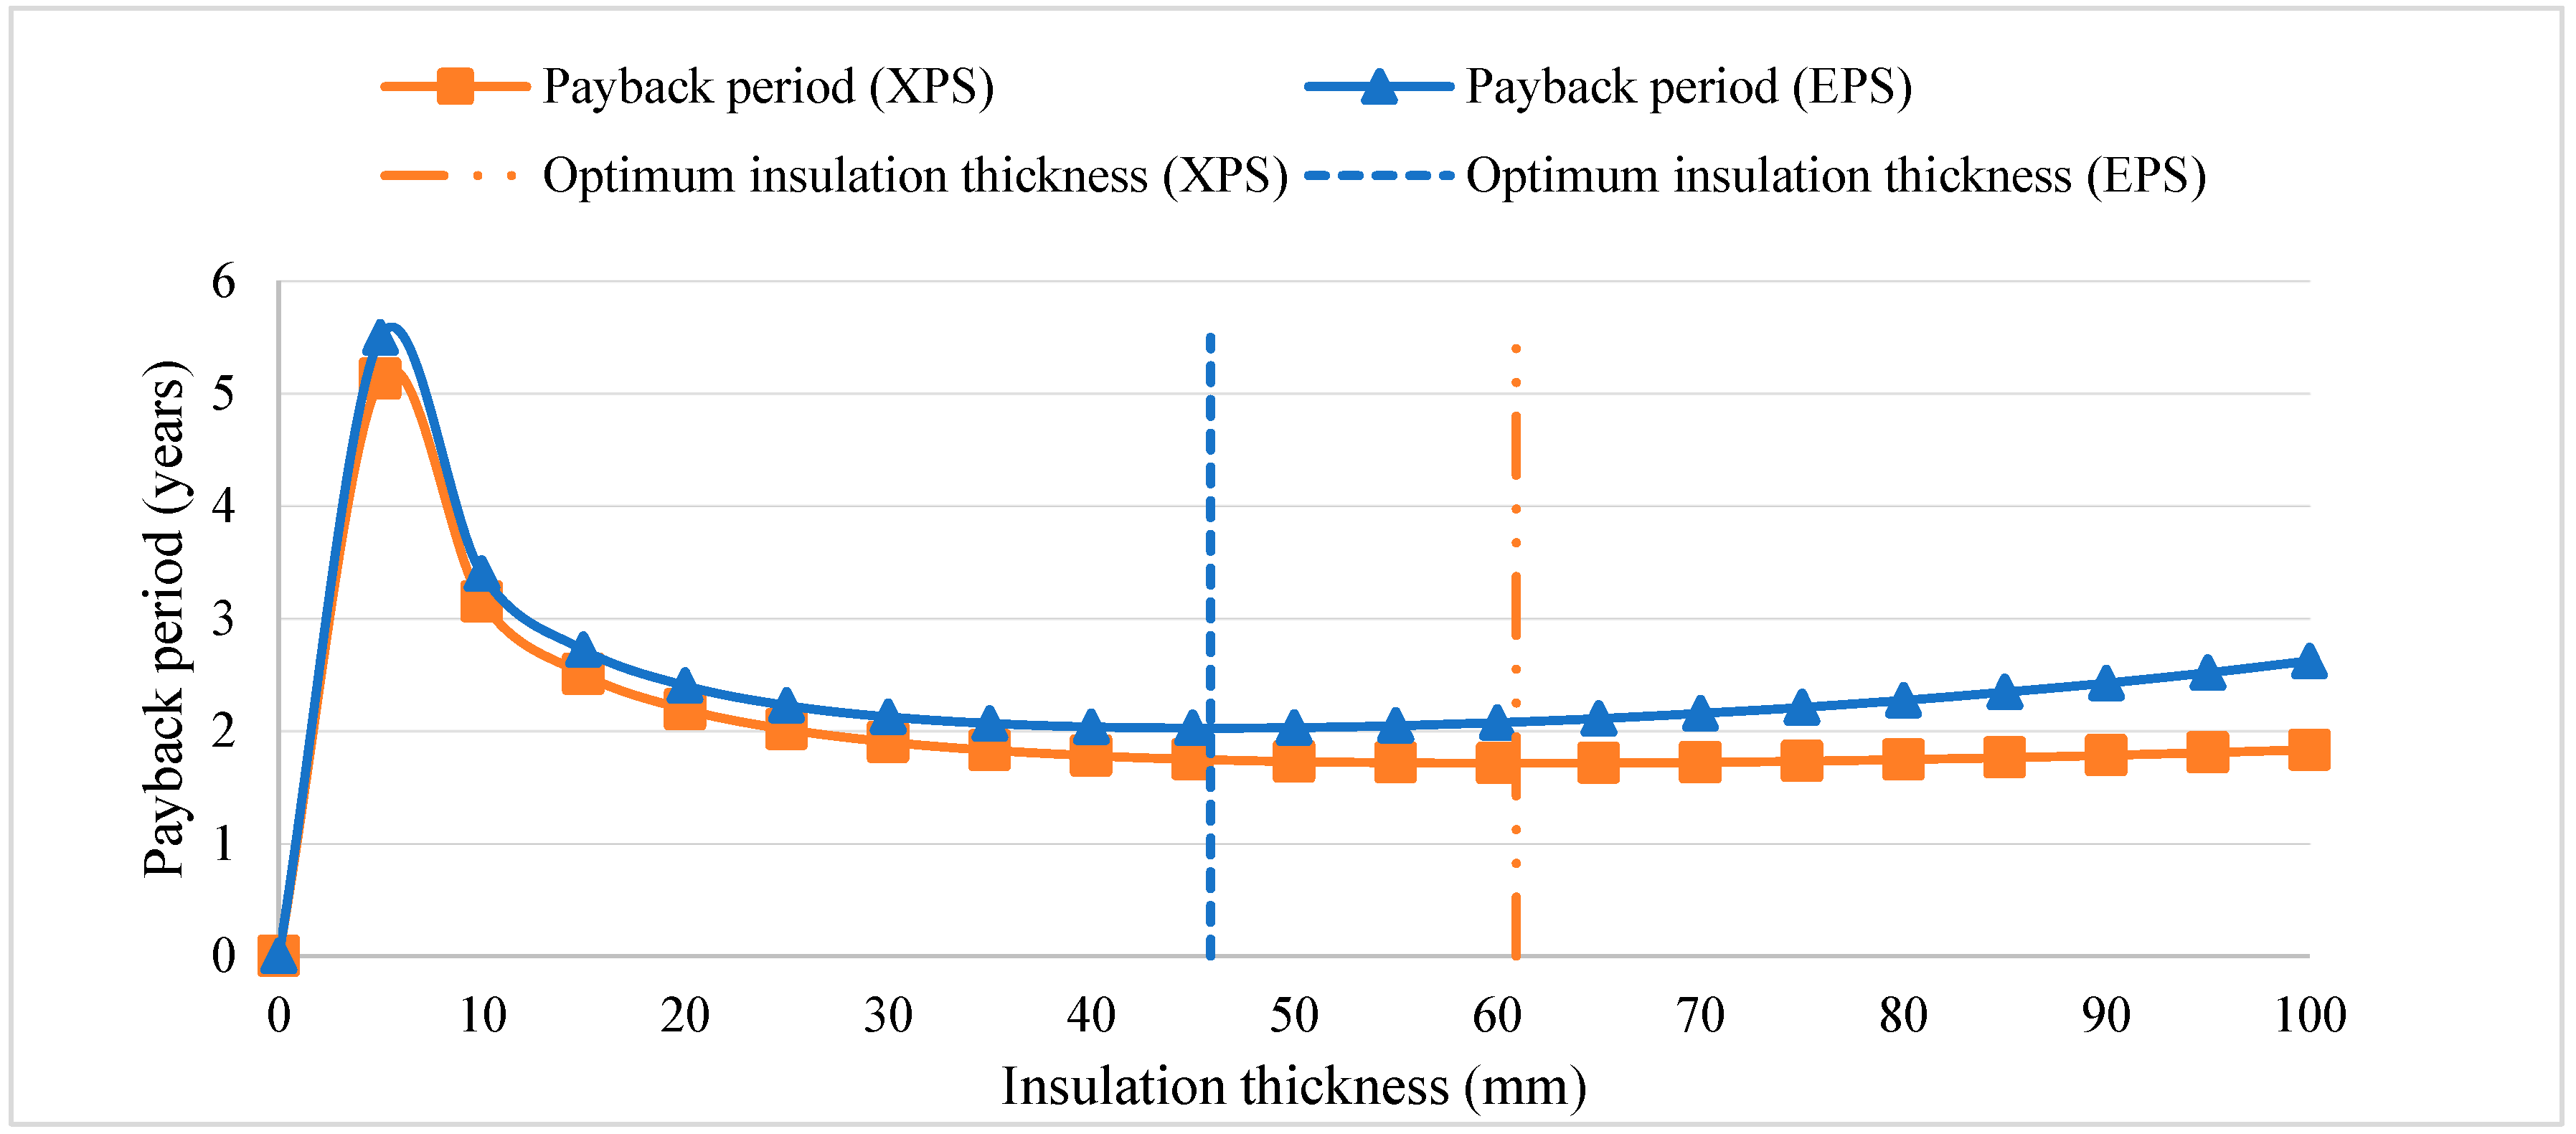
Moreover, a comparison between EPS and XPS for Ankara with the use of natural gas in terms of PP is given in
Figure 4. As can be seen in the figure, OIT with the use of EPS is less than with the use of XPS. However, the PPs were calculated as 1.71 and 2.03 for XPS and EPS, respectively. When considering environmental factors, XPS stands out with a greater reduction in emissions (
Table 7). As mentioned before, the OIT by itself is not a sufficient determinant. Other factors, according to LCCA, should be examined to achieve the optimum value.
As mentioned in the first paragraph of the Results and Discussion section, it is not feasible to present all figures for the 81 provinces. However, the results of all analyses conducted for the five selected cities, as well as for Ankara, chosen for individual analysis, are provided in the
Supplementary Materials with full details.
As a result, the effective implementation of building insulation strategies in Türkiye requires collaboration between policymakers, the private sector, and consumers. First, government regulations should focus on updating the existing TS825 standard to align with the European EN 12831 standard. In this regard, minimum insulation requirements should be tightened, and region-specific insulation policies should be developed based on Türkiye’s diverse climate conditions. Moreover, tax incentives and subsidies should be introduced to encourage insulation investments. For example, Germany’s “KfW Energy Efficiency Program” provides low-interest loans and grants to promote insulation applications. A similar model in Türkiye could significantly enhance the competitiveness of SMEs and large industrial enterprises. However, certain barriers hinder the implementation of these strategies, including high initial investment costs, lack of awareness, and price fluctuations in locally produced insulation materials. Therefore, these challenges should be addressed through awareness campaigns and long-term financing models to ensure the widespread adoption of insulation practices.
4. Conclusions
In this collaborative study, the primary goal was to raise awareness among end-users, practitioners, and producers by calculating the optimum insulation thickness (OIT) for 81 provinces in Türkiye using life cycle cost analysis (LCCA). Five different insulation materials (EPS, XPS, PUR, glasswool, and rockwool) and five distinct heating sources (electricity, LPG, fuel oil, coal, and natural gas) were considered. The results underscore the significant influence of variables, such as the chosen heating source, insulation material, inflation and interest rates, fuel price, and insulation cost, in determining the OIT.
The key findings of this study include the following:
There is no single “optimum insulation application” that is suitable for all conditions.
The OIT alone is not a sufficient determinant; its efficacy depends on finding an optimal thickness that balances economic viability. Factors, such as the heating source, insulation material, inflation and interest rates, project lifetime, and carbon emissions, must be considered through LCCA to determine the optimum value.
Insulation should not be regarded solely as an investment cost, with doubts about its profitability dispelled. This study demonstrates that a well-executed insulation project can recoup its costs within an average of 2 years.
Proper insulation implementation can lead to a reduction in carbon emissions by approximately 90% and an annual cost reduction of around 65%, resulting in short payback periods.
Despite PUR appearing as the optimal choice for thermal insulation, its economic viability is hindered by higher payback periods and lower carbon emission reductions.
XPS and EPS insulation materials emerge as potentially suitable choices for various conditions in terms of both thermal engineering and economic viability, although a preliminary assessment is necessary based on the heating source and engineering economics.
This study aims to bridge the gaps in the literature and serve as a guiding resource for businesses and end-users to adopt energy-efficient building practices, with a particular focus on proper insulation application. Beyond its environmental and economic benefits, proper insulation contributes significantly to business competitiveness by improving operational efficiency and reducing energy expenses, which can free up resources for innovation, expansion and other strategic investments. In today’s socially aware marketplace, businesses that prioritize sustainability gain a significant advantage by attracting environmentally mindful consumers, who increasingly favor companies that demonstrate a commitment to reducing carbon emissions and energy consumption. This not only improves brand perception and consumer trust but also ensures long-term success.
Furthermore, investing in energy-efficient building practices can future-proof businesses against rising energy costs and regulatory pressures. As energy prices continue to fluctuate and governments implement stricter environmental regulations, businesses that have already implemented energy-efficient solutions, including proper insulation, will be better positioned to adapt. Fostering societal awareness of these advantages is crucial for reducing overall energy consumption and emissions. By spreading knowledge and empowering the public to advocate for and incentivize improved standards in business practices, productivity, competitiveness, and sustainability across industries can be enhanced. Possible future developments and limitations include the following:
For developing countries like Türkiye, which have a high dependence on foreign sources for energy and raw materials and consequently experience periodic economic fluctuations in fuel and insulation material prices, as well as variations in interest and inflation rates, it is crucial to periodically repeat such studies.
The consideration of microclimatic conditions can be crucial in the results obtained from calculations conducted for a specific location and/or application.
A specific study that includes the embodied carbon emissions of the insulation materials used and calculates the total carbon emissions over the entire building lifetime would be highly insightful.
A study that analyzes the gains and losses of applying the insulation thickness corresponding to the recommended U-value specified in the TS825 standard, which forms the legal framework for insulation applications in Türkiye, compared to the optimum insulation thickness across the entire country would be highly insightful (as exemplified in
Figure 3).
The primary factor driving the need for a revision of this nearly 17-year-old standard is the findings of this and similar academic studies. In this context, conducting comparative analyses with equivalent studies from developed countries could provide valuable insights for establishing the foundations of a future revised standard.


