Impact of Business Diversification on the Business Performance of Construction Firms in the Republic of Korea
Abstract
1. Introduction
2. Background
2.1. Trends in Market Fluctuations by Business Area in Korean Construction Firms
2.2. Literature Review
3. Research Methodology
4. Empirical Analysis
4.1. Variables and Data Collection
4.2. Empirical Procedure
4.3. Results
5. Discussion and Conclusions
Author Contributions
Funding
Data Availability Statement
Acknowledgments
Conflicts of Interest
References
- Palepu, K. Diversification strategy, profit performance, and the entropy measure. Strateg. Manag. J. 1985, 6, 239–255. [Google Scholar] [CrossRef]
- Chang, Y.; Thomas, H. The impact of diversification strategy on risk-return performance. Strateg. Manag. J. 1989, 10, 271–284. [Google Scholar] [CrossRef]
- Kim, H.J.; Reinschmidt, K.F. Association of risk attitude with market diversification in the construction business. J. Manag. Eng. 2011, 27, 66–74. [Google Scholar] [CrossRef]
- Oyewobi, L.O.; Windapo, A.O.; Cattell, K.S. Impact of business diversification on South African construction companies’ corporate performance. J. Financ. Manag. Prop. Constr. 2013, 18, 110–127. [Google Scholar] [CrossRef]
- Ibrahim, Y.M.; Ibrahim, A.M.; Kabir, B. Geographic diversification, performance, and the risk profile of UK construction firms. J. Eng. Des. Technol. 2009, 7, 171–185. [Google Scholar] [CrossRef]
- Amit, R.; Livnat, J. Diversification strategies, business cycles and economic performance. Strateg. Manag. J. 1988, 9, 99–110. [Google Scholar] [CrossRef]
- Mathur, I.; Singh, M.; Gleason, K.C. Multinational diversification and corporate performance: Evidence from European firms. Eur. Financ. Manag. 2004, 10, 439–464. [Google Scholar] [CrossRef]
- Chakrabarti, A.; Singh, K.; Mahmood, I. Diversification and performance: Evidence from East Asian firms. Strateg. Manag. J. 2007, 28, 101–120. [Google Scholar] [CrossRef]
- Cheah, C.Y.J.; Garvin, M.J.; Miller, J.B. Empirical study of strategic performance of global construction firms. J. Constr. Eng. Manag. 2004, 130, 808–817. [Google Scholar] [CrossRef]
- Choi, J.; Russell, J.S. Long-term entropy and profitability change of United States public construction firms. J. Manag. Eng. 2005, 21, 17–26. [Google Scholar] [CrossRef]
- Yee, C.Y.; Cheah, C.Y.J. Fundamental analysis of profitability of large engineering and construction firms. J. Manag. Eng. 2006, 22, 203–210. [Google Scholar] [CrossRef]
- Yee, C.Y.; Cheah, C.Y. Interactions between business and financial strategies of large engineering and construction firms. J. Manag. Eng. 2006, 22, 148–155. [Google Scholar] [CrossRef]
- Kim, H.; Reinschmidt, K.F. Market structure and organizational performance of construction organizations. J. Manag. Eng. 2012, 28, 212–220. [Google Scholar] [CrossRef]
- Han, M.; Lee, S.; Kim, J. Effectiveness of diversification strategies for ensuring financial sustainability of construction companies in the Republic of Korea. Sustainability 2019, 11, 3076. [Google Scholar] [CrossRef]
- Han, S.H.; Diekmann, J.E.; Lee, Y.; Ock, J.H. Multicriteria financial portfolio risk management for international projects. J. Constr. Eng. Manag. 2004, 130, 346–356. [Google Scholar] [CrossRef]
- Gunhan, S.; Arditi, D. International expansion decision for construction companies. J. Constr. Eng. Manag. 2005, 131, 928–937. [Google Scholar] [CrossRef]
- Rumelt, R.O. Strategy, Structure and Economic Performance; Harvard University Press: Cambridge, MA, USA, 1974. [Google Scholar]
- Itami, H.; Kagono, T.; Yoshihara, H.; Sakuma, A. Diversification strategies and economic performance. Jpn. Econ. Stud. 1982, 11, 78–106. [Google Scholar] [CrossRef]
- Lecaw, D.J. Bargaining power, ownership, and profitability of transnational corporations in developing countries. J. Int. Bus. Stud. 1984, 15, 27–43. [Google Scholar] [CrossRef]
- Buhner, R. Assessing international diversification of West German corporations. Strateg. Manag. J. 1986, 8, 25–37. [Google Scholar] [CrossRef]
- Melicher, R.W.; Rush, D.F. Evidence on the acquisition-related performance of conglomerate firms. J. Financ. 1974, 29, 141–149. [Google Scholar] [CrossRef]
- Khanna, T.; Palepu, K. Is corporate affiliation profitable in emerging markets? An analysis of diversified Indian business groups. J. Financ. 2000, 55, 867–891. [Google Scholar] [CrossRef]
- Lang, L.H.P.; Stulz, R.M. Tobin’s q, corporate diversification, and firm performance. J. Polit. Econ. 1994, 102, 1248–1280. [Google Scholar] [CrossRef]
- Berger, P.G.; Ofek, E. Diversification’s effect on firm value. J. Financ. Econ. 1995, 37, 39–65. [Google Scholar] [CrossRef]
- Comment, R.; Jarrell, G.A. Corporate focus and stock returns. J. Financ. Econ. 1995, 37, 67–87. [Google Scholar] [CrossRef]
- Cheah, Y.J. Fundamental Analysis and Conceptual Model for Corporate Strategy in Global Engineering and Construction Markets. Ph.D. Thesis, Massachusetts Institute of Technology, Cambridge, MA, USA, 2002. [Google Scholar]
- Kim, H.; Reinschmidt, K.F. Diversification by the largest US contractors. Can. J. Civ. Eng. 2011, 38, 800–810. Available online: https://cdnsciencepub.com/doi/full/10.1139/l11-056 (accessed on 4 March 2025).
- Han, S.H.; Kim, D.Y.; Jang, H.S.; Choi, S. Strategies for contractors to sustain growth in the global construction market. Habitat Int. 2010, 34, 1–10. [Google Scholar] [CrossRef]
- Cheah, C.Y.J.; Kang, J.; Chew, D.A.S. Strategic analysis of large local construction firms in China. Constr. Manag. Econ. 2007, 25, 25–38. [Google Scholar] [CrossRef]
- Baffoe-Bonnie, J. The dynamic impact of macroeconomic aggregates on housing prices and stock of houses: A national and regional analysis. J. Real Financ. Econ. 1998, 17, 179–197. [Google Scholar] [CrossRef]
- Cooley, T.F.; Leroy, S.F. Atheoretical macroeconometrics: A critique. J. Monet. Econ. 1985, 16, 283–308. [Google Scholar] [CrossRef]
- Sims, C.A. Macroeconomics and Reality. Econometrica 1980, 48, 1–48. [Google Scholar] [CrossRef]
- Enders, W. Applied Econometric Time Series, 4th ed.; John Wiley & Sons: New York, NY, USA, 2015. [Google Scholar]
- Xu, J.; Moon, S. Stochastic forecast of construction cost index using a cointegrated vector autoregression model. J. Manag. Eng. 2013, 29, 10–18. [Google Scholar] [CrossRef]
- Wong, J.M.W.; Ng, S.T. Forecasting construction tender price index in Hong Kong using vector error correction model. Constr. Manag. Econ. 2010, 28, 1255–1268. [Google Scholar] [CrossRef]
- DeJong, D.N.; Whiteman, C.H. Reconsidering ‘trends and random walks in macroeconomic time series’. J. Monet. Econ. 1991, 28, 221–254. [Google Scholar] [CrossRef]
- Lean, C.S. Empirical tests to discern linkages between construction and other economic sectors in Singapore. Constr. Manag. Econ. 2001, 19, 355–363. [Google Scholar] [CrossRef]
- Chan, S. Responses of selected economic indicators to construction output shocks: The case of Singapore. Constr. Manag. Econ. 2002, 20, 523–533. [Google Scholar] [CrossRef]
- Shahandashti, S.M.; Ashuri, B. Forecasting engineering news-record construction cost index using multivariate time series models. J. Constr. Eng. Manag. 2013, 139, 1237–1243. [Google Scholar] [CrossRef]
- Jacquemin, A.P.; Berry, C.H. Entropy measure of diversification and corporate growth. J. Indust. Econ. 1979, 27, 359–369. [Google Scholar] [CrossRef]
- Van Kranenburg, H.; Hagedoorn, J.; Pennings, J. Measurement of international and product diversification in the publishing industry. J. Media Econ. 2004, 17, 87–104. [Google Scholar] [CrossRef][Green Version]
- Granger, C.W.J.; Newbold, P. Spurious regressions in econometrics. J. Econom. 1974, 2, 111–120. [Google Scholar] [CrossRef]
- Engle, R.F.; Granger, C.W.J. Cointegration and error correction: Representation, estimation and testing. Econometrica 1987, 55, 251–276. [Google Scholar] [CrossRef]
- Boswijk, H.P. Efficient inference on cointegration parameters in structural error correction models. J. Econom. 1995, 69, 133–158. [Google Scholar] [CrossRef]
- Granger, C.W.J. Investigating causal relations by econometric models and cross-spectral methods. Econometrica 1969, 37, 424–438. [Google Scholar] [CrossRef]
- Sims, C.A. Are forecasting models usable for policy analysis? Fed. Res. Bank Minneap. Q. Rev. 1986, 10, 2–16. [Google Scholar] [CrossRef]


| Variables | Descriptions | Period | Frequency |
|---|---|---|---|
| DR | Debt ratio | 2002:01–2021:04 | Quarterly |
| PR | Return on assets | 2002:01–2021:04 | Quarterly |
| DIV | Diversification index | 2002:01–2021:04 | Quarterly |
| DCO_B | Domestic building construction orders | 2002:01–2021:04 | Quarterly |
| DCO_C | Domestic civil construction orders | 2002:01–2021:04 | Quarterly |
| DCO_P | Domestic plant construction orders | 2002:01–2021:04 | Quarterly |
| ICO_B | Overseas building construction orders | 2002:01–2021:04 | Quarterly |
| ICO_C | Overseas civil construction orders | 2002:01–2021:04 | Quarterly |
| ICO_P | Overseas plant construction orders | 2002:01–2021:04 | Quarterly |
| Model | Variables | Level | 1st Differencing | ||
|---|---|---|---|---|---|
| t-Statistic | p-Value | t-Statistic | p-Value | ||
| Model A | DR | −1.878555 | 0.6562 | −10.33223 | 0.0000 |
| DIV | 0.103109 | 0.9968 | −10.97727 | 0.0000 | |
| DCO_B | −2.209993 | 0.4773 | −9.796758 | 0.0000 | |
| DCO_C | −2.346306 | 0.4044 | −11.26830 | 0.0001 | |
| DCO_P | −0.894180 | 0.9510 | −14.04714 | 0.0001 | |
| ICO_B | −2.745949 | 0.2217 | −16.23612 | 0.0001 | |
| ICO_C | −1.981707 | 0.6019 | −15.22386 | 0.0001 | |
| ICO_P | −0.187719 | 0.9923 | −9.743657 | 0.0000 | |
| Model B | PR | −2.011848 | 0.5855 | −10.19177 | 0.0000 |
| DIV | 0.103109 | 0.9968 | −10.97727 | 0.0000 | |
| DCO_B | −2.209993 | 0.4773 | −9.796758 | 0.0000 | |
| DCO_C | −2.346306 | 0.4044 | −11.26830 | 0.0001 | |
| DCO_P | −0.894180 | 0.9510 | −14.04714 | 0.0001 | |
| ICO_B | −2.745949 | 0.2217 | −16.23612 | 0.0001 | |
| ICO_C | −1.981707 | 0.6019 | −15.22386 | 0.0001 | |
| ICO_P | −0.187719 | 0.9923 | −9.743657 | 0.0000 | |
| Lag | Model A | Model B |
|---|---|---|
| 0 | −5.946037 | 1.505765 |
| 1 | −15.44402 * | −6.772626 * |
| 2 | −13.13306 | −5.149130 |
| 3 | −10.95312 | −3.501270 |
| 4 | −8.808585 | −1.465867 |
| 5 | −7.223426 | 0.453622 |
| 6 | −6.360115 | 2.045458 |
| 7 | −7.785306 | 3.037413 |
| Period | Null Hypothesis | Test Statistic | 0.05 Critical Value | p-Value |
|---|---|---|---|---|
| Model A | r = 0 * | 161.3306 | 134.6780 | 0.0005 |
| r ≤ 1 * | 110.1466 | 103.8473 | 0.0179 | |
| r ≤ 2 | 67.36635 | 76.97277 | 0.2154 | |
| r ≤ 3 | 45.97894 | 54.07904 | 0.2156 | |
| r ≤ 4 | 30.42135 | 35.19275 | 0.1494 | |
| r ≤ 5 | 16.92765 | 20.26184 | 0.1352 | |
| r ≤ 6 | 7.077615 | 9.164546 | 0.1224 | |
| Model B | r = 0 * | 147.7874 | 125.6154 | 0.0011 |
| r ≤ 1 * | 100.0392 | 95.75366 | 0.0245 | |
| r ≤ 2 | 56.36185 | 69.81889 | 0.3636 | |
| r ≤ 3 | 36.18875 | 47.85613 | 0.3869 | |
| r ≤ 4 | 22.92340 | 29.79707 | 0.2499 | |
| r ≤ 5 | 11.79374 | 15.49471 | 0.1671 | |
| r ≤ 6 | 3.103941 | 3.841466 | 0.0781 |
| Model A | Model B | ||||||||||||||
|---|---|---|---|---|---|---|---|---|---|---|---|---|---|---|---|
| Causality | Lag | F-Statistic | p-Value | Causality | Lag | F-Statistic | p-Value | ||||||||
| DIV | → | ICO_B | 1 | 10.1558 | 0.0021 | PR | → | ICO_P | 1 | 3.47199 | 0.0663 | ||||
| DIV | → | ICO_C | 1 | 6.04062 | 0.0163 | DIV | → | ICO_B | 1 | 10.1558 | 0.0021 | ||||
| ICO_P | → | DIV | 1 | 7.36094 | 0.0083 | DIV | → | ICO_C | 1 | 6.04062 | 0.0163 | ||||
| DCO_B | → | ICO_P | 1 | 3.15506 | 0.0797 | ICO_P | → | DIV | 1 | 7.36094 | 0.0083 | ||||
| DCO_P | → | DCO_C | 1 | 4.46459 | 0.0379 | DCO_B | → | ICO_P | 1 | 3.15506 | 0.0797 | ||||
| DCO_C | → | ICO_B | 1 | 8.72897 | 0.0042 | DCO_P | → | DCO_C | 1 | 4.46459 | 0.0379 | ||||
| ICO_P | → | DCO_C | 1 | 5.39575 | 0.0229 | DCO_C | → | ICO_B | 1 | 8.72897 | 0.0042 | ||||
| DCO_P | → | ICO_B | 1 | 10.1529 | 0.0021 | ICO_P | → | DCO_C | 1 | 5.39575 | 0.0229 | ||||
| ICO_P | → | DCO_P | 1 | 4.27374 | 0.0422 | DCO_P | → | ICO_B | 1 | 10.1529 | 0.0021 | ||||
| ICO_P | → | ICO_C | 1 | 15.5422 | 0.0002 | ICO_P | → | DCO_P | 1 | 4.27374 | 0.0422 | ||||
| ICO_C | → | ICO_P | 1 | 3.45533 | 0.0670 | ICO_P | → | ICO_C | 1 | 15.5422 | 0.0002 | ||||
| DR | → | ICO_C | 2 | 4.43051 | 0.0153 | ICO_C | → | ICO_P | 1 | 3.45533 | 0.0670 | ||||
| DIV | → | ICO_B | 2 | 5.24214 | 0.0075 | DCO_P | → | PR | 2 | 3.09389 | 0.0514 | ||||
| DIV | → | ICO_C | 2 | 3.01808 | 0.0551 | DIV | → | ICO_B | 2 | 5.24214 | 0.0075 | ||||
| DCO_B | → | DCO_C | 2 | 3.18712 | 0.0472 | DIV | → | ICO_C | 2 | 3.01808 | 0.0551 | ||||
| DCO_P | → | DCO_C | 2 | 3.03069 | 0.0545 | DCO_B | → | DCO_C | 2 | 3.18712 | 0.0472 | ||||
| DCO_C | → | ICO_B | 2 | 4.51397 | 0.0142 | DCO_P | → | DCO_C | 2 | 3.03069 | 0.0545 | ||||
| DCO_P | → | ICO_B | 2 | 7.10735 | 0.0015 | DCO_C | → | ICO_B | 2 | 4.51397 | 0.0142 | ||||
| ICO_C | → | ICO_B | 2 | 3.86101 | 0.0255 | DCO_P | → | ICO_B | 2 | 7.10735 | 0.0015 | ||||
| ICO_P | → | ICO_B | 2 | 10.0054 | 0.0001 | ICO_C | → | ICO_B | 2 | 3.86101 | 0.0255 | ||||
| ICO_P | → | ICO_C | 2 | 9.11922 | 0.0003 | ICO_P | → | ICO_B | 2 | 10.0054 | 0.0001 | ||||
| ICO_C | → | ICO_P | 2 | 3.31651 | 0.0419 | ICO_P | → | ICO_C | 2 | 9.11922 | 0.0003 | ||||
| DR | → | ICO_C | 3 | 2.85098 | 0.0436 | ICO_C | → | ICO_P | 2 | 3.31651 | 0.0419 | ||||
| DIV | → | ICO_B | 3 | 2.76652 | 0.0483 | DIV | → | ICO_B | 3 | 2.76652 | 0.0483 | ||||
| ICO_B | → | DCO_C | 3 | 2.26156 | 0.0890 | ICO_B | → | DCO_C | 3 | 2.26156 | 0.0890 | ||||
| DCO_C | → | ICO_B | 3 | 2.93181 | 0.0395 | DCO_C | → | ICO_B | 3 | 2.93181 | 0.0395 | ||||
| DCO_P | → | ICO_B | 3 | 3.60447 | 0.0176 | DCO_P | → | ICO_B | 3 | 3.60447 | 0.0176 | ||||
| ICO_C | → | ICO_B | 3 | 2.83321 | 0.0445 | ICO_C | → | ICO_B | 3 | 2.83321 | 0.0445 | ||||
| ICO_P | → | ICO_B | 3 | 6.37981 | 0.0007 | ICO_P | → | ICO_B | 3 | 6.37981 | 0.0007 | ||||
| ICO_P | → | ICO_C | 3 | 7.86123 | 0.0001 | ICO_P | → | ICO_C | 3 | 7.86123 | 0.0001 | ||||
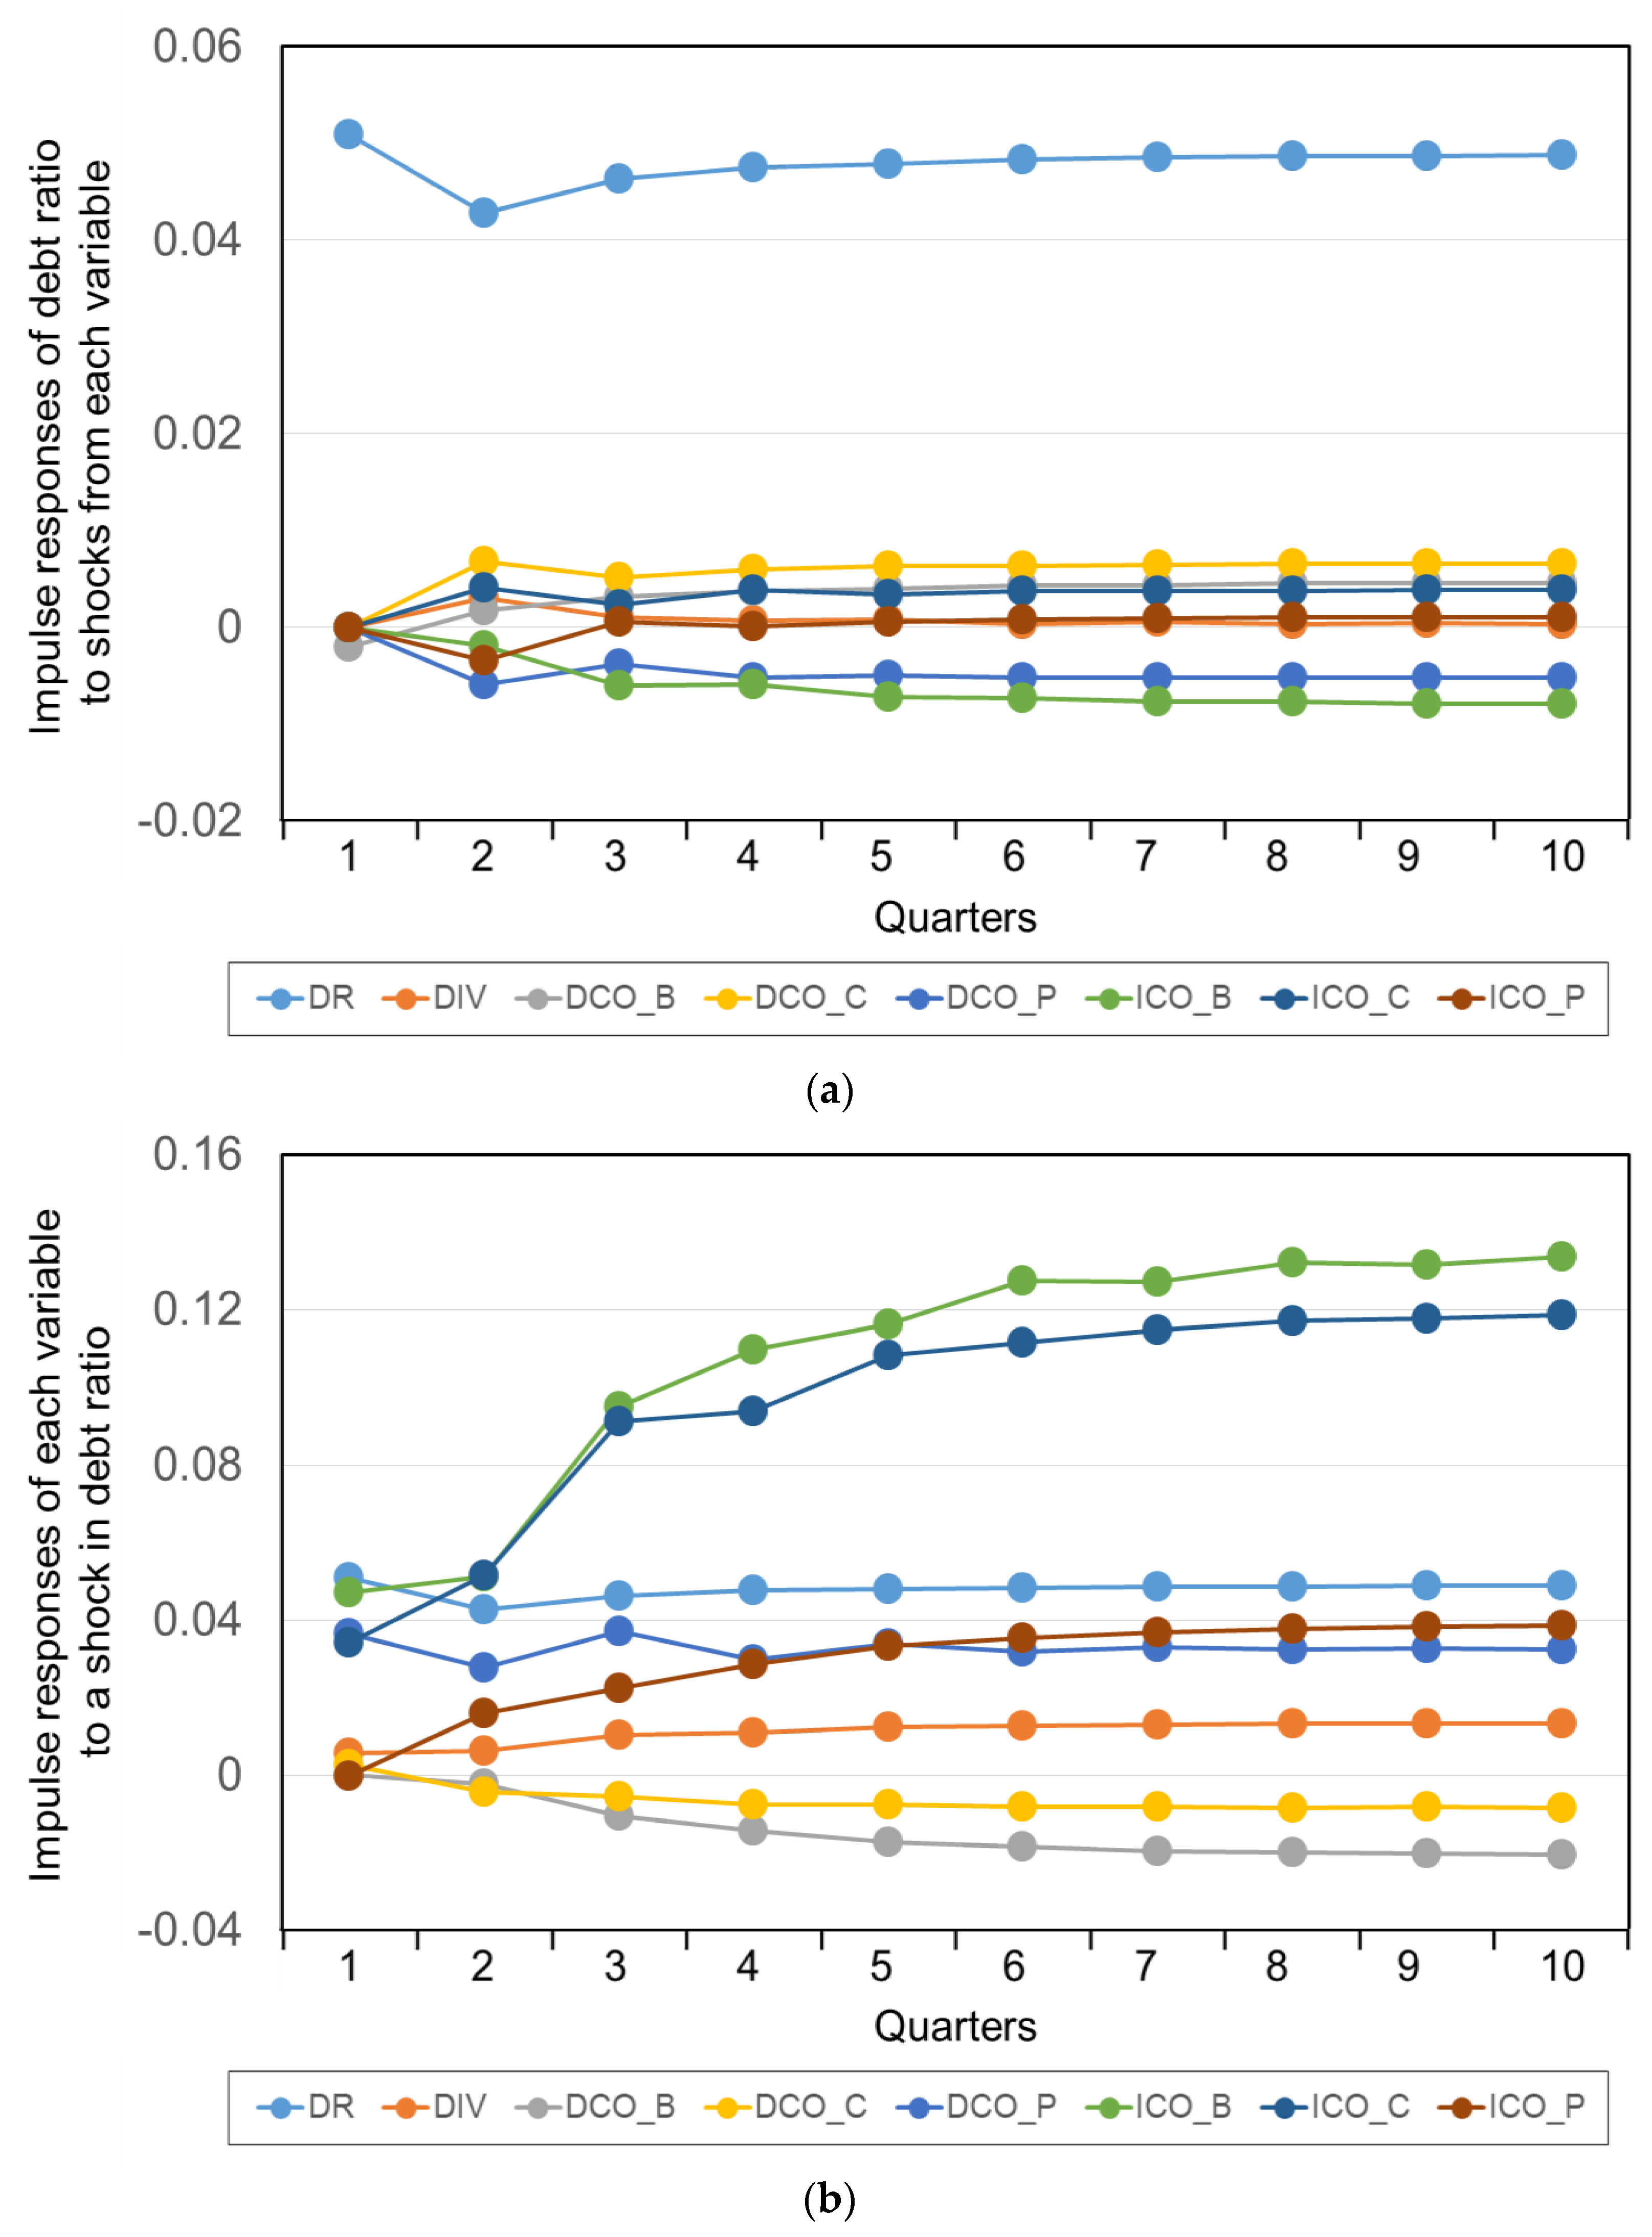
| Period (Month) | DR | |||||||
|---|---|---|---|---|---|---|---|---|
| DR | DIV | DCO_B | DCO_C | DCO_P | ICO_B | ICO_C | ICO_P | |
| 1 | 0.050892 | 0.000000 | −0.002016 | 0.000000 | 0.000000 | 0.000000 | 0.000000 | 0.000000 |
| 2 | 0.042755 | 0.003038 | 0.001668 | 0.006737 | −0.005882 | −0.001963 | 0.004032 | −0.003402 |
| 3 | 0.046304 | 0.000962 | 0.003123 | 0.005110 | −0.003791 | −0.006037 | 0.002276 | 0.000526 |
| 4 | 0.047530 | 0.000662 | 0.003676 | 0.005993 | −0.005202 | −0.005891 | 0.003796 | 0.000135 |
| 5 | 0.047832 | 0.000838 | 0.003945 | 0.006305 | −0.004938 | −0.007159 | 0.003375 | 0.000528 |
| 6 | 0.048302 | 0.000344 | 0.004367 | 0.006319 | −0.005173 | −0.007298 | 0.003751 | 0.000828 |
| 7 | 0.048502 | 0.000515 | 0.004370 | 0.006488 | −0.005169 | −0.007667 | 0.003703 | 0.000847 |
| 8 | 0.048611 | 0.000331 | 0.004536 | 0.006490 | −0.005244 | −0.007733 | 0.003776 | 0.000979 |
| 9 | 0.048705 | 0.000378 | 0.004543 | 0.006553 | −0.005230 | −0.007867 | 0.003793 | 0.000976 |
| 10 | 0.048737 | 0.000324 | 0.004596 | 0.006547 | −0.005267 | −0.007886 | 0.003802 | 0.001032 |
| Period (Month) | DR | |||||||
|---|---|---|---|---|---|---|---|---|
| DR | DIV | DCO_B | DCO_C | DCO_P | ICO_B | ICO_C | ICO_P | |
| 1 | 0.050892 | 0.005580 | 0.000000 | 0.002763 | 0.036338 | 0.047197 | 0.034140 | −0.000296 |
| 2 | 0.042755 | 0.006071 | −0.002237 | −0.004521 | 0.027668 | 0.051144 | 0.051586 | 0.015930 |
| 3 | 0.046304 | 0.010246 | −0.010698 | −0.005511 | 0.037189 | 0.095063 | 0.091310 | 0.022307 |
| 4 | 0.047530 | 0.010762 | −0.014480 | −0.007677 | 0.029828 | 0.109595 | 0.093808 | 0.028653 |
| 5 | 0.047832 | 0.012241 | −0.017287 | −0.007510 | 0.033928 | 0.116297 | 0.108380 | 0.033315 |
| 6 | 0.048302 | 0.012516 | −0.018424 | −0.008176 | 0.031888 | 0.127240 | 0.111509 | 0.035219 |
| 7 | 0.048502 | 0.012973 | −0.019628 | −0.008145 | 0.032860 | 0.127188 | 0.114644 | 0.036789 |
| 8 | 0.048611 | 0.013125 | −0.019962 | −0.008391 | 0.032344 | 0.132067 | 0.117005 | 0.037662 |
| 9 | 0.048705 | 0.013255 | −0.020393 | −0.008348 | 0.032642 | 0.131636 | 0.117589 | 0.038105 |
| 10 | 0.048737 | 0.013325 | −0.020524 | −0.008463 | 0.032453 | 0.133579 | 0.118563 | 0.038460 |
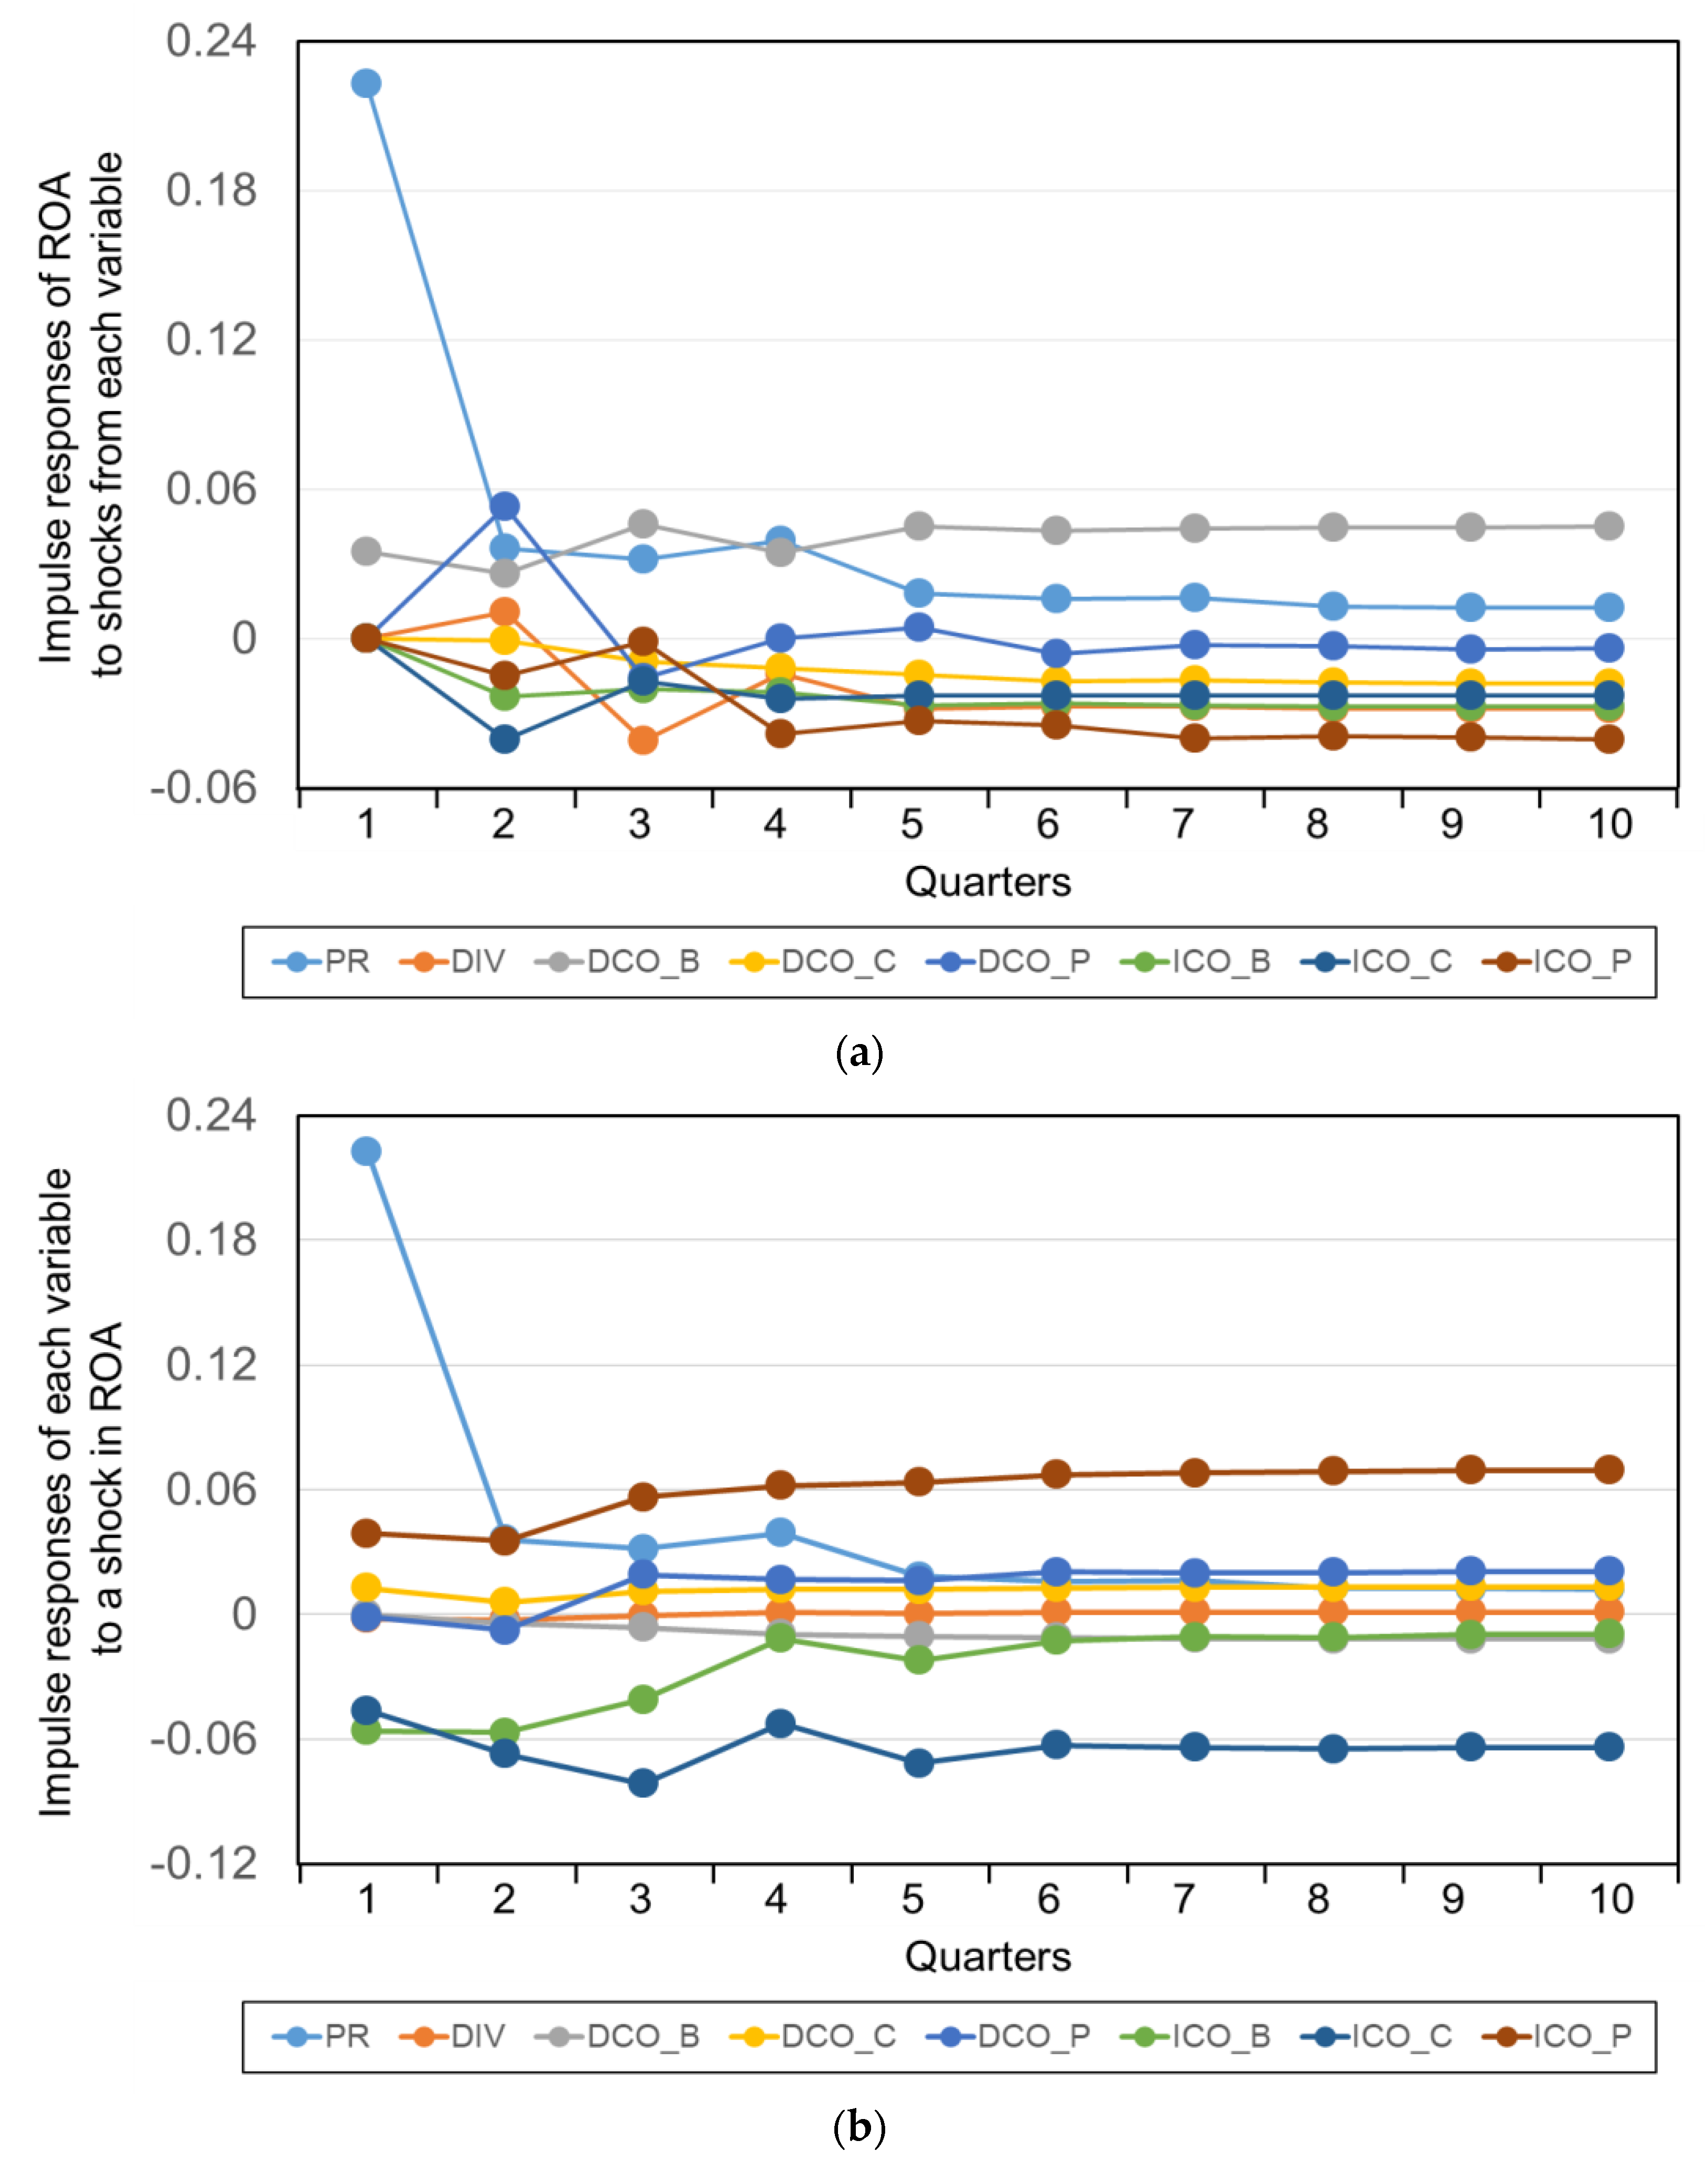
| Period (Month) | PR | |||||||
|---|---|---|---|---|---|---|---|---|
| PR | DIV | DCO_B | DCO_C | DCO_P | ICO_B | ICO_C | ICO_P | |
| 1 | 0.222758 | 0.000000 | 0.035012 | 0.000000 | 0.000000 | 0.000000 | 0.000000 | 0.000000 |
| 2 | 0.036133 | 0.010644 | 0.025964 | −0.000768 | 0.053076 | −0.023279 | −0.040405 | −0.015088 |
| 3 | 0.031585 | −0.041220 | 0.045891 | −0.009096 | −0.015942 | −0.020071 | −0.017068 | −0.001430 |
| 4 | 0.039321 | −0.014220 | 0.034549 | −0.011945 | −0.000192 | −0.021616 | −0.024343 | −0.038518 |
| 5 | 0.018267 | −0.028019 | 0.045099 | −0.014686 | 0.004508 | −0.026766 | −0.022881 | −0.033166 |
| 6 | 0.016062 | −0.027429 | 0.043094 | −0.017035 | −0.006083 | −0.026115 | −0.023120 | −0.034691 |
| 7 | 0.016301 | −0.027242 | 0.043924 | −0.016761 | −0.002763 | −0.026752 | −0.022967 | −0.039935 |
| 8 | 0.012856 | −0.028109 | 0.044696 | −0.017838 | −0.003127 | −0.027428 | −0.023002 | −0.039195 |
| 9 | 0.012578 | −0.028399 | 0.044673 | −0.017951 | −0.004290 | −0.027449 | −0.023074 | −0.039813 |
| 10 | 0.012315 | −0.028347 | 0.044805 | −0.018077 | −0.003932 | −0.027530 | −0.022968 | −0.040535 |
| Period (Month) | PR | |||||||
|---|---|---|---|---|---|---|---|---|
| PR | DIV | DCO_B | DCO_C | DCO_P | ICO_B | ICO_C | ICO_P | |
| 1 | 0.222758 | −0.002071 | 0.000000 | 0.012782 | −0.001137 | −0.056046 | −0.046358 | 0.038986 |
| 2 | 0.036133 | −0.002657 | −0.004523 | 0.005952 | −0.007682 | −0.056753 | −0.067185 | 0.035159 |
| 3 | 0.031585 | −0.000840 | −0.006256 | 0.011210 | 0.019165 | −0.040903 | −0.081503 | 0.056425 |
| 4 | 0.039321 | 0.000907 | −0.009498 | 0.012154 | 0.016843 | −0.011493 | −0.052483 | 0.061903 |
| 5 | 0.018267 | 0.000248 | −0.010521 | 0.012080 | 0.016115 | −0.022211 | −0.071769 | 0.063549 |
| 6 | 0.016062 | 0.001096 | −0.011045 | 0.012877 | 0.020568 | −0.012658 | −0.063058 | 0.067397 |
| 7 | 0.016301 | 0.001081 | −0.011511 | 0.013038 | 0.019863 | −0.010784 | −0.063997 | 0.068161 |
| 8 | 0.012856 | 0.001156 | −0.011782 | 0.013093 | 0.020291 | −0.011166 | −0.064706 | 0.068776 |
| 9 | 0.012578 | 0.001231 | −0.011845 | 0.013206 | 0.020747 | −0.009658 | −0.064001 | 0.069375 |
| 10 | 0.012315 | 0.001256 | −0.011962 | 0.013251 | 0.020782 | −0.009514 | −0.064062 | 0.069543 |
Disclaimer/Publisher’s Note: The statements, opinions and data contained in all publications are solely those of the individual author(s) and contributor(s) and not of MDPI and/or the editor(s). MDPI and/or the editor(s) disclaim responsibility for any injury to people or property resulting from any ideas, methods, instructions or products referred to in the content. |
© 2025 by the authors. Licensee MDPI, Basel, Switzerland. This article is an open access article distributed under the terms and conditions of the Creative Commons Attribution (CC BY) license (https://creativecommons.org/licenses/by/4.0/).
Share and Cite
Kwak, S.; Lee, S.; Kim, K.; Kim, J. Impact of Business Diversification on the Business Performance of Construction Firms in the Republic of Korea. Buildings 2025, 15, 1238. https://doi.org/10.3390/buildings15081238
Kwak S, Lee S, Kim K, Kim J. Impact of Business Diversification on the Business Performance of Construction Firms in the Republic of Korea. Buildings. 2025; 15(8):1238. https://doi.org/10.3390/buildings15081238
Chicago/Turabian StyleKwak, Sungho, Sanghyo Lee, Kyonghoon Kim, and Jaejun Kim. 2025. "Impact of Business Diversification on the Business Performance of Construction Firms in the Republic of Korea" Buildings 15, no. 8: 1238. https://doi.org/10.3390/buildings15081238
APA StyleKwak, S., Lee, S., Kim, K., & Kim, J. (2025). Impact of Business Diversification on the Business Performance of Construction Firms in the Republic of Korea. Buildings, 15(8), 1238. https://doi.org/10.3390/buildings15081238


