
Financial Metrics and Environment, Social, Governance (ESG) Performance: A Cross Border Comparison of China and the UK Construction Industries


Abstract
1. Introduction
2. Literature Review
“How do financial metrics influence ESG performance, and how does this relationship vary across institutional frameworks, particularly between China and the UK?”
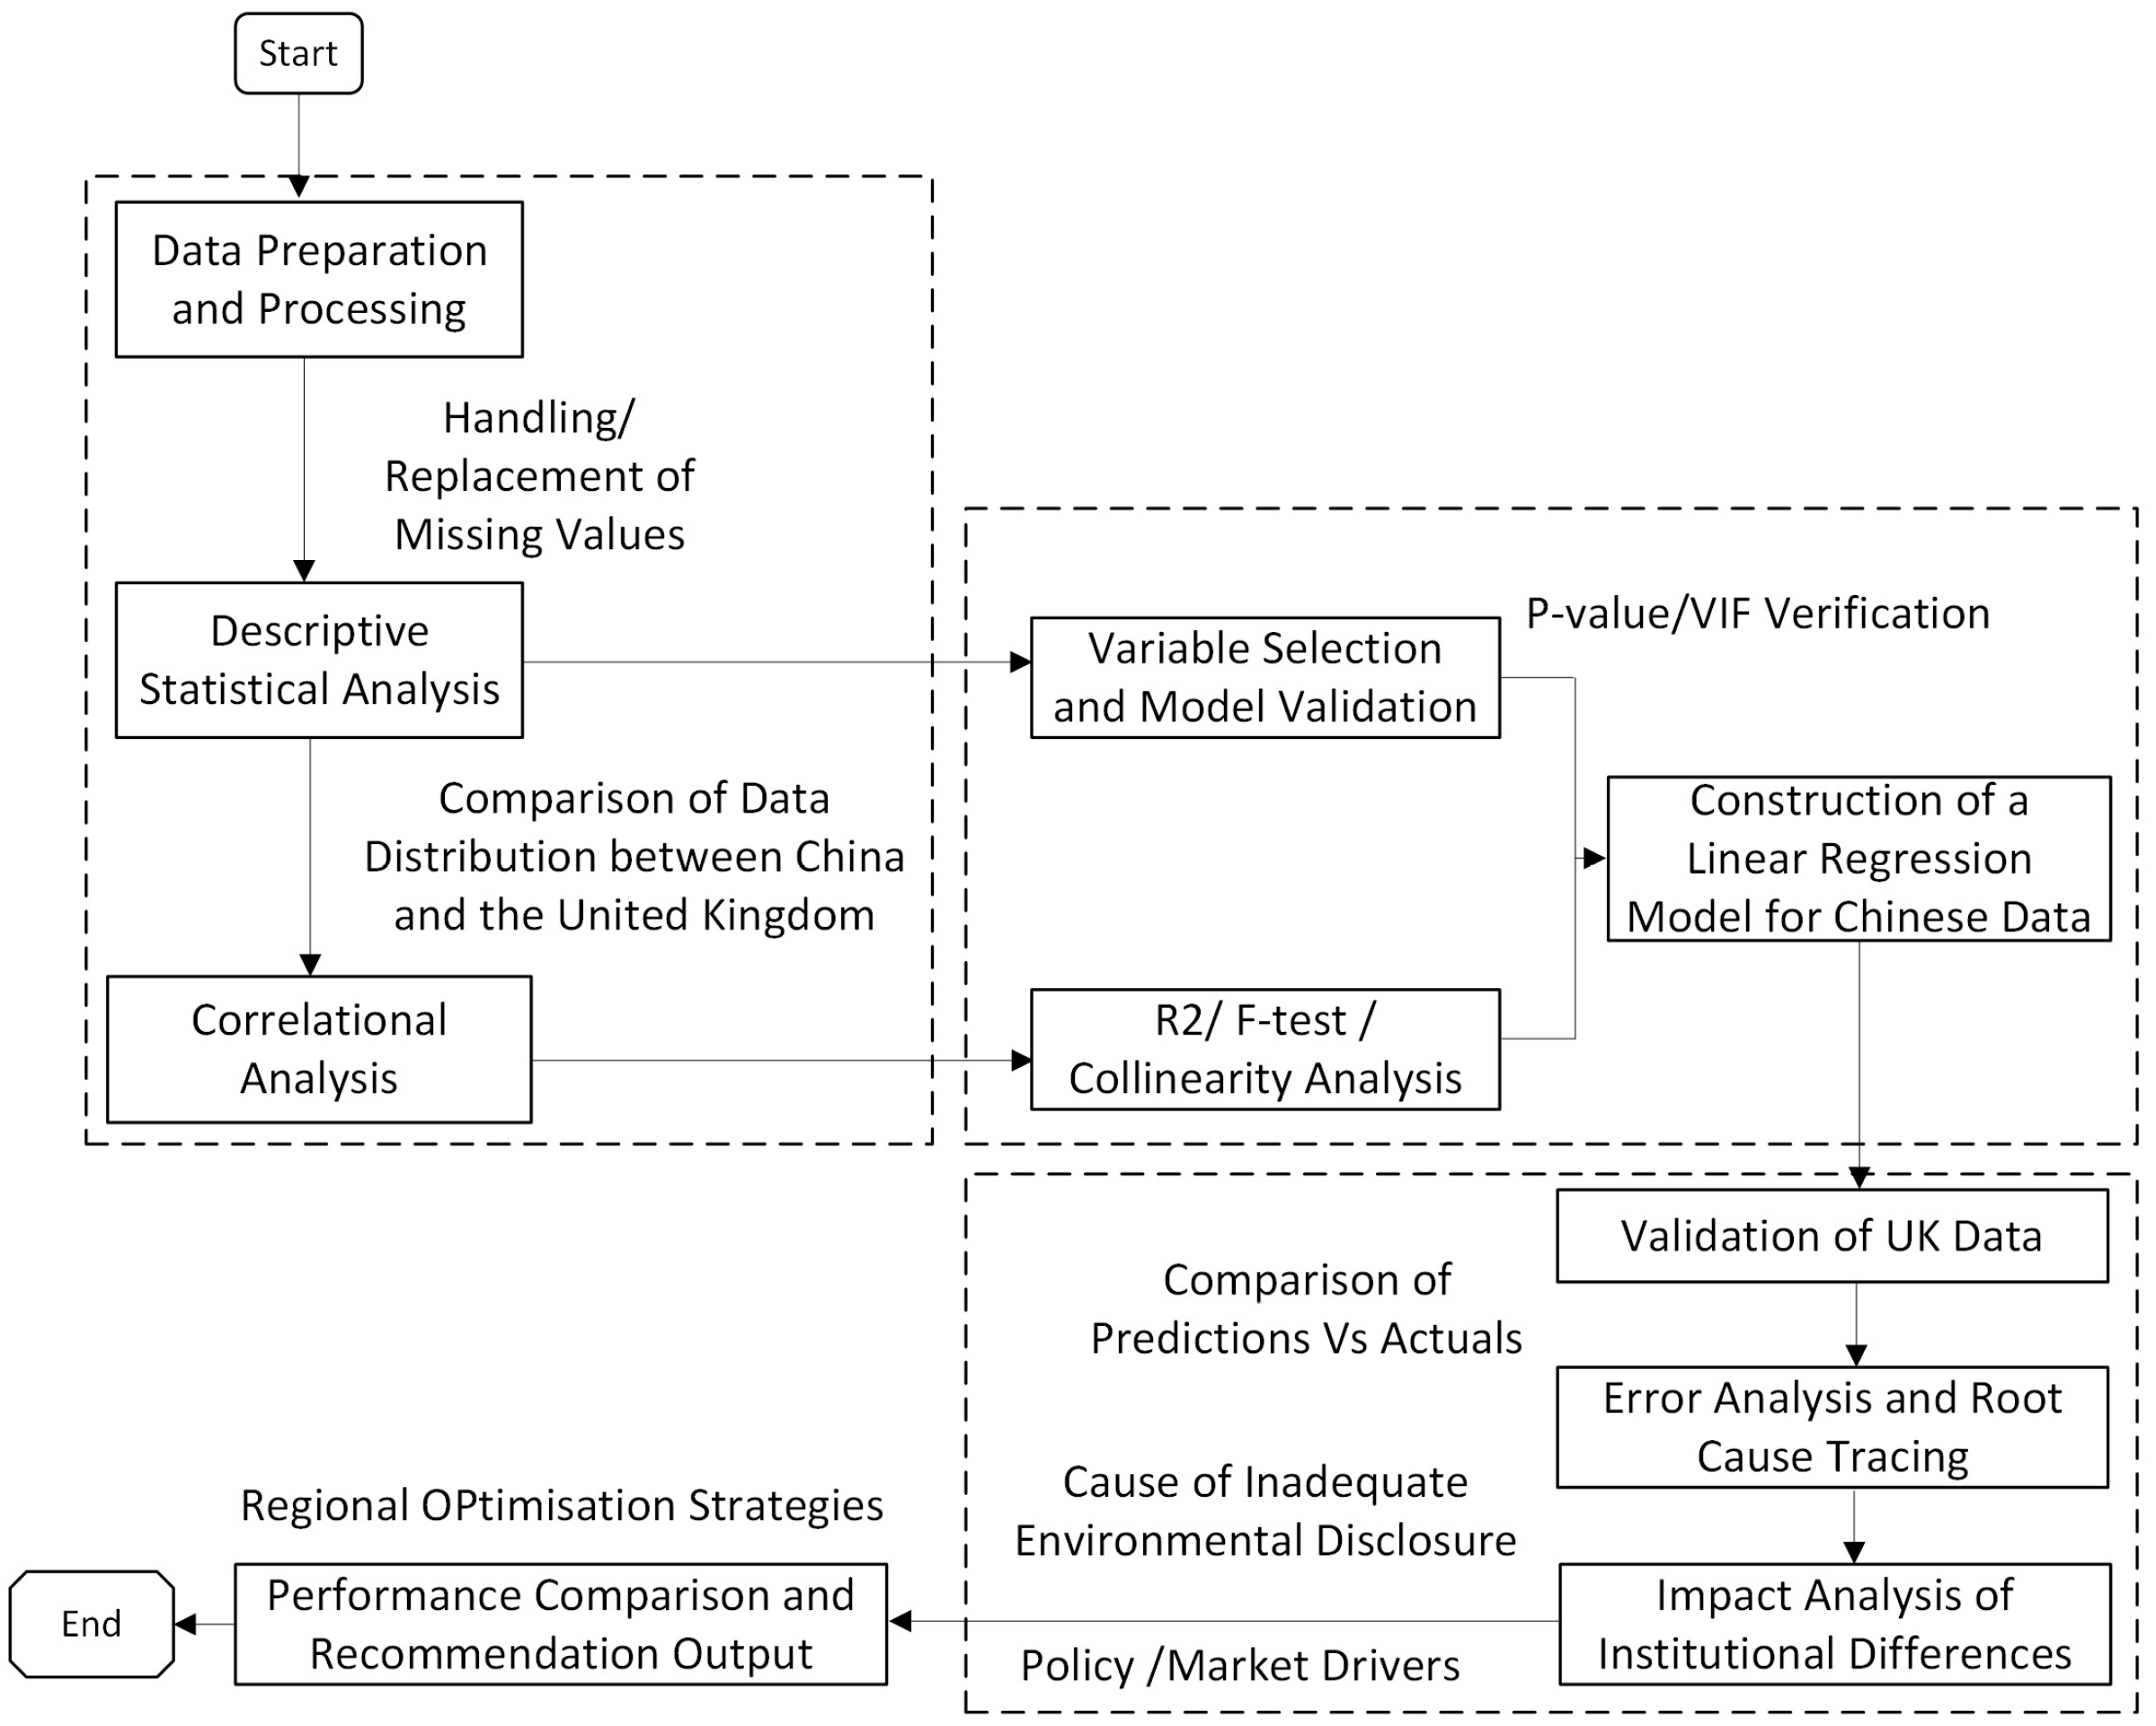
3. Method
3.1. Methodology
3.2. Research Design
3.3. Data Collection and Preprocessing
3.3.1. Data Sources
- ifinD—Provides financial (e.g., ROA, current ratio, debt-to-equity ratio) and ESG data for 97 Chinese construction companies.
- Bloomberg—Supplies standardised ESG scores and financial metrics for 15 UK construction firms.
- Fame—Offers financial information on UK companies, ensuring a cross-validation of financial ratios.
3.3.2. Data Cleaning and Reliability Measures
- Handling Missing Data—Companies with excessive missing values (≥10% of key financial and ESG metrics) were excluded, reducing the Chinese sample from 108 to 97 firms.
- Outlier Detection and Adjustment—Extreme values in financial ratios were identified using boxplots and histograms. Outliers were either capped at the 1st/99th percentiles or set to zero if their presence was deemed to distort the model.
- Ensuring Data Consistency—ESG scoring methodologies across databases were cross-validated to align weighting and definition structures.
3.3.3. Variable Selection for the Study
3.4. Statistical Modelling
3.4.1. Regression Model Specification
- Yi = ESG score of firm i.
- n = number of dependent variables.
- β0, Intercept term.
- β1…, βn = Regression coefficients of independent variables.
- ϵi = Error term accounting for unexplained variance.
- Yi represents the actual dependent variable values.
- represents the predicted values.
- βj are the regression coefficients.
- λ (the tuning parameter) controls the amount of regularisation.
3.4.2. Model Evaluation Metrics
- R-Squared (R2) and Adjusted R2—Measures the proportion of variance explained by the model. Values closer to 1 indicate a better fit, while lower values suggest limited explanatory power. However, excessively high R-squared values may indicate multicollinearity among independent variables, potentially leading to instability and inaccurate coefficient estimates.
- ANOVA F-Test—Assesses the statistical significance of independent variables in predicting ESG scores. For categorical data, the test also identifies statistically significant group differences in the dependent variable [66].
- Durbin–Watson Statistic—Tests for autocorrelation in residuals.
- Mean Absolute Error (MAE) and Root Mean Squared Error (RMSE)—Evaluate model accuracy.
- Tolerance and Variance Inflation Factor (VIF) are used to detect multicollinearity among independent variables. From the data, it can be observed that the tolerance of all variables is greater than 0.1, and the VIF is less than 10, indicating that there is no serious multicollinearity problem among the independent variables.
3.5. Cross-Country Validation
4. Results and Analysis
4.1. ESG Disclosure and Financial Performance in the Construction Industry
4.1.1. Descriptive Statistics and ESG Disclosure Trends of Chinese and British Construction Enterprises
4.1.2. Financial Performance and Variability
4.1.3. Regression Analysis and Model Validation
5. Discussion
5.1. Financial Determinants of ESG Performance
5.2. Are There Significant Regional Differences in the Financial-ESG Relationship?
5.3. How ESG Performance Rating Influences ESG Leadership Across Geographic Regions
6. Conclusions and Recommendations
Supplementary Materials
Author Contributions
Funding
Data Availability Statement
Conflicts of Interest
References
- Martin, H.; Chebrolu, D.; Chadee, A.; Brooks, T. Too good to waste: Examining circular economy opportunities, barriers, and indicators for sustainable construction and demolition waste management. Sustain. Prod. Consum. 2024, 48, 460–480. [Google Scholar] [CrossRef]
- Wang, Y.; Pan, W. Assessing embodied carbon emissions from material consumption in Hong Kong’s building sector from 2012 to 2050 under uncertainty. Build. Environ. 2025, 267, 112137. [Google Scholar] [CrossRef]
- World Green Building Council. Bringing Embodied Carbon Upfront: Coordinated Action for the Building and Construction Sector to Tackle Embodied Carbon; World Green Building Council: London, UK, 2019. [Google Scholar]
- UNEP. 2020 Global Status Report for Building and Construction. Towards a Zero-Emissions, Efficient and Resilient Buildings and Construction; UNEP: Nairobi, Kenya, 2020. [Google Scholar]
- Macarthur, E.; Heading, H. How the circular economy tackles climate change. Ellen MacArthur Found 2019, 1, 1–71. [Google Scholar]
- Haralambie, C.M.I.; Haralambie, G.A. How to Improve Corporate Reporting. Saudi J. Econ. Financ. 2025, 9, 7–13. [Google Scholar] [CrossRef]
- Organization, I.L. Good Practices and Challenges in Promoting Decent Work in Construction and Infrastructure Projects. In Proceedings of the Paper for Discussion at the Global Dialogue Forum, Sectoral Policies Department, Geneva, Switzerland, Dubrovnik, 19–20 November 2015. [Google Scholar]
- Martin, H.; Miller, A.; Milling, A.; Martin, M. Examining corruption prominence in SIDS–the curse and the cure for construction tender practices. J. Facil. Manag. 2023, 21, 387–411. [Google Scholar] [CrossRef]
- Mamic, M.; Tomic, I.A. Unlocking Long-Term Value: Exploring the Dynamics of ESG Practices in Corporate Sustainability. In Proceedings of the Economic and Social Development (Book of Proceedings), 110th International Scientific Conference on Economic and Social, Dubrovnik, Croatia, 5–6 April 2024; p. 221. [Google Scholar]
- Bayramov, I.; Nguyen, T. ESG Metrics: Exploring Their Role in Predicting Systemic Risks in the European Financial System; Lund University: Lund, Sweden, 2024. [Google Scholar]
- Chopra, S.S.; Senadheera, S.S.; Dissanayake, P.D.; Withana, P.A.; Chib, R.; Rhee, J.H.; Ok, Y.S. Navigating the Challenges of Environmental, Social, and Governance (ESG) Reporting: The Path to Broader Sustainable Development. Sustainability 2024, 16, 606. [Google Scholar] [CrossRef]
- Ayyoob, A.; Sajeev, A. Navigating Sustainability: Assessing the Imperative of ESG Considerations in Achieving SDGs. In ESG Frameworks for Sustainable Business Practices; IGI Global: Hershey, PA, USA, 2024; pp. 53–84. [Google Scholar]
- Clark, G.L.; Feiner, A.; Viehs, M. From the Stockholder to the Stakeholder: How Sustainability can Drive Financial Outperformance. SSRN Electron. J. 2014. [Google Scholar] [CrossRef]
- Povilonis, J.R. Contracting for ESG: Sustainability-Linked Bonds and a New Investor Paradigm. Bus. Law 2021, 77, 625. [Google Scholar]
- Saavedra García, M.L. Business Sustainability and financial performance. Cuad. Adm. 2022, 38, 72. [Google Scholar] [CrossRef]
- Friede, G.; Busch, T.; Bassen, A. ESG and financial performance: Aggregated evidence from more than 2000 empirical studies. J. Sustain. Financ. Invest. 2015, 5, 210–233. [Google Scholar] [CrossRef]
- Narula, R.; Rao, P.; Kumar, S.; Matta, R. ESG scores and firm performance-evidence from emerging market. Int. Rev. Econ. Financ. 2024, 89, 1170–1184. [Google Scholar] [CrossRef]
- Abiola-Adams, O.; Azubuike, C.; Sule, A.K.; Okon, R. Strategic liquidity management: Best practices for optimizing cash flows in multinational corporations. Gulf J. Adv. Bus. Res. 2025, 3, 143–156. [Google Scholar] [CrossRef]
- Park, E.; Kim, Y.; Lee, A.; Kim, J.; Kong, H. Study on the global sustainability of the Korean construction industry based on the GRI standards. Int. J. Environ. Res. Public Health 2023, 20, 4231. [Google Scholar] [CrossRef]
- Vali, J.; Yadav, P.; Thota, U. AI for Climate Action: Enhancing Sustainable Development Through ESG Analytics. In Proceedings of the Second International Workshop on Artificial Intelligence: Empowering Sustainable Development, Lucknow, India, 2 October 2024. [Google Scholar]
- Li, J.; Wu, T.; Hu, B.; Pan, D.; Zhou, Y. Artificial intelligence and corporate ESG performance. Int. Rev. Financ. Anal. 2025, 102, 104036. [Google Scholar] [CrossRef]
- Qureshi, F.; Qureshi, S.; Ismail, I.; Yarovaya, L. Unlocking economic insights: ESG integration, market dynamics and sustainable transitions. Energy Econ. 2025, 145, 108407. [Google Scholar] [CrossRef]
- Lee, M.J.; Pak, A.; Roh, T. The interplay of institutional pressures, digitalization capability, environmental, social, and governance strategy, and triple bottom line performance: A moderated mediation model. Bus. Strategy Environ. 2024, 33, 5247–5268. [Google Scholar] [CrossRef]
- Yan, Y.; Cheng, Q.; Huang, M.; Lin, Q.; Lin, W. Government environmental regulation and corporate ESG performance: Evidence from natural resource accountability audits in China. Int. J. Environ. Res. Public Health 2022, 20, 447. [Google Scholar] [CrossRef]
- Sheth, J.N.; Parvatiyar, A. Sustainable marketing: Market-driving, not market-driven. J. Macromarketing 2021, 41, 150–165. [Google Scholar] [CrossRef]
- Atz, U.; Van Holt, T.; Liu, Z.Z.; Bruno, C.C. Does sustainability generate better financial performance? Review, meta-analysis, and propositions. J. Sustain. Financ. Invest. 2023, 13, 802–825. [Google Scholar] [CrossRef]
- Sulaiman, N.N.; Omar, A.J.; Pakir, F.; Mohamad, M. Evaluating Environmental, Social and Governance (ESG) Practice Among Malaysian Public Listed Construction Companies Using FTSE Russell Rating Model. Int. J. Sustain. Constr. Eng. Technol. 2024, 15, 25–40. [Google Scholar] [CrossRef]
- Wang, J.; Xue, F. Emerging Trends of ESG in the Construction Sector: A Promising Pathway to Sustainable and Responsible Development. In Proceedings of the 28th International Symposium on Advancement of Construction Management and Real Estate, Nanjing, China, 4–6 August 2023; pp. 2033–2044. [Google Scholar]
- Li, R.Y.M.; Li, B.; Zhu, X.; Zhao, J.; Pu, R.; Song, L. Modularity clustering of economic development and ESG attributes in prefabricated building research. Front. Environ. Sci. 2022, 10, 977887. [Google Scholar] [CrossRef]
- Bezerra, R.R.R.; Martins, V.W.B.; Macedo, A.N. Validation of challenges for implementing ESG in the construction industry considering the context of an emerging economy country. Appl. Sci. 2024, 14, 6024. [Google Scholar] [CrossRef]
- Wu, F.; Zhu, B.; Tao, S. Can good ESG performance of listed companies reduce abnormal stock price volatility? Mediation effects based on investor attention. PLoS ONE 2024, 19, e0307535. [Google Scholar] [CrossRef] [PubMed]
- Freeman, R.E. Strategic Management: A Stakeholder Approach; Cambridge University Press: Cambridge, UK, 2010. [Google Scholar]
- Ali, A.; Kelley, D.J.; Levie, J. Market-driven entrepreneurship and institutions. J. Bus. Res. 2020, 113, 117–128. [Google Scholar] [CrossRef]
- Pfeffer, J. A resource dependence perspective on intercorporate relations. Intercorporate Relat. Struct. Anal. Bus. 1987, 1, 25–55. [Google Scholar]
- Brulhart, F.; Gherra, S.; Quelin, B.V. Do stakeholder orientation and environmental proactivity impact firm profitability? J. Bus. Ethics 2019, 158, 25–46. [Google Scholar] [CrossRef]
- DiMaggio, P.J.; Powell, W.W. The iron cage revisited: Institutional isomorphism and collective rationality in organizational fields. Am. Sociol. Rev. 1983, 48, 147–160. [Google Scholar] [CrossRef]
- Allen, F.; Zhang, C.; Zhao, M. China’s Financial System: Opportunities and Challenges; National Bureau of Economic Research: Cambridge, MA, USA, 2012. [Google Scholar]
- Sergakis, K. Shareholder stewardship: Autonomy and sociality. J. Corp. Law Stud. 2023, 23, 497–535. [Google Scholar] [CrossRef]
- Bose, S. Evolution of ESG Reporting Frameworks. In Values at Work; Palgrave Macmillan: Cham, Switzerland, 2020; pp. 13–33. [Google Scholar]
- Akpan, J.U.; Oluwagbade, O. Social and environmental responsibility in accounting: Beyond financial metrics. Int. J. Soc. Sci. Manag. Res. 2023, 9, 163–188. [Google Scholar] [CrossRef]
- Zhang, A.; Deng, R.; Wu, Y. Does the green credit policy reduce the carbon emission intensity of heavily polluting industries? -Evidence from China’s industrial sectors. J. Environ. Manag. 2022, 311, 114815. [Google Scholar] [CrossRef]
- Klapper, L.F.; Love, I. Corporate governance, investor protection, and performance in emerging markets. J. Corp. Financ. 2004, 10, 703–728. [Google Scholar] [CrossRef]
- Ma, H.; Zeng, S.; Lin, H.; Chen, H.; Shi, J.J. The societal governance of megaproject social responsibility. Int. J. Proj. Manag. 2017, 35, 1365–1377. [Google Scholar] [CrossRef]
- Landi, G.C.; Rapone, V. The Impact of Adopting Corporate Social Responsibility on Corporate Financial Performance: Evidence From Italian Listed Companies. Int. J. Account. Financ. Report 2018, 8, 307. [Google Scholar] [CrossRef]
- Moro-Visconti, R. ESG-Driven Valuation: From Father Profit to Mother Nature. In Augmented Corporate Valuation: From Digital Networking to ESG Compliance; Springer: Berlin/Heidelberg, Germany, 2022; pp. 235–314. [Google Scholar]
- Field, A. Discovering Statistics Using IBM SPSS Statistics; Sage Publications Limited: London, UK, 2024. [Google Scholar]
- Hair, J.F. Multivariate Data Analysis: An Overview. In International Encyclopedia of Statistical Science; Springer: Berlin/Heidelberg, Germany, 2011; pp. 904–907. [Google Scholar]
- Guo, T.; Jamet, N.; Betrix, V.; Piquet, L.-A.; Hauptmann, E. Esg2risk: A deep learning framework from egg news to stock volatility prediction. arXiv 2020, arXiv:2005.02527. [Google Scholar] [CrossRef]
- Bhattacharya, B.; Kirgo, M. A Sneak Peek into Machine Learning Methods for ESG Factor Score Computation. In Sustainable Investing: Problems and Solutions; World Scientific: Singapore, 2025; pp. 195–222. [Google Scholar]
- Agosto, A.; Cerchiello, P.; Giudici, P. Bayesian learning models to measure the relative impact of ESG factors on credit ratings. Int. J. Data Sci. Anal. 2023, 5, 1–12. [Google Scholar] [CrossRef]
- Garrido-Merchán, E.C.; Piris, G.G.; Vaca, M.C. Bayesian optimization of ESG (Environmental Social Governance) financial investments. Environ. Res. Commun. 2023, 5, 055003. [Google Scholar] [CrossRef]
- Aydoğmuş, M.; Gülay, G.; Ergun, K. Impact of ESG performance on firm value and profitability. Borsa Istanb. Rev. 2022, 22, S119–S127. [Google Scholar] [CrossRef]
- Zhang, D.; Liu, L. Does ESG Performance Enhance Financial Flexibility? Evidence from China. Sustainability 2022, 14, 11324. [Google Scholar] [CrossRef]
- Fatemi, A.; Glaum, M.; Kaiser, S. ESG performance and firm value: The moderating role of disclosure. Glob. Financ. J. 2018, 38, 45–64. [Google Scholar] [CrossRef]
- Ozdemir, B.; Cubukgil, E. Managing differences in economic and regulatory capital: An examination of return of equity (ROE) maximising strategies. J. Risk Manag. Financ. Inst. 2014, 7, 328–344. [Google Scholar] [CrossRef]
- Andoko, A.; Angeline, A. The Influence Of Debt To Equity Ratio, Operating Profit Margin Ratio And Operating Expense Toward Entity Income Tax Of Infrastructure, Utility And Transportation Companies Listed On The Indonesia Stock Exchange. Int. J. Soc. Policy Law 2023, 4, 58–68. [Google Scholar]
- Shrotriya, V. Analysis of return on total assets (ROTA) and return on capital employed (ROCE) of IFFCO limited. Int. J. Res. Anal. Rev. 2019, 6, 746–754. [Google Scholar]
- Klingenberg, B.; Timberlake, R.; Geurts, T.G.; Brown, R.J. The relationship of operational innovation and financial performance—A critical perspective. Int. J. Prod. Econ. 2013, 142, 317–323. [Google Scholar] [CrossRef]
- Sihombing, R.; Maffett, M.G.; Ilham, R.N. Financial ratio analysis and common size to assess financial performance at PT Astra Agro Lestari Tbk and its subsidiaries. J. Account. Res. Util. Financ. Digit. Assets 2022, 1, 139–147. [Google Scholar] [CrossRef]
- D’Amato, V.; D’Ecclesia, R.; Levantesi, S. Fundamental ratios as predictors of ESG scores: A machine learning approach. Decis. Econ. Financ. 2021, 44, 1087–1110. [Google Scholar] [CrossRef]
- Anggarani, D.; Marlina, L.; Andani, L. Does Cash Turnover and Total Asset Turnover Affect the Net Profit Margin at PT Bank Jabar Banten Syariah for the 2013–2022 Period? Rev. Islam. Econ. Financ. 2024, 7, 85–106. [Google Scholar]
- Su, X.; Yan, X.; Tsai, C.L. Linear regression. Wiley Interdiscip. Rev. Comput. Stat. 2012, 4, 275–294. [Google Scholar] [CrossRef]
- Estrella, A.; Mishkin, F.S. Predicting US recessions: Financial variables as leading indicators. Rev. Econ. Stat. 1998, 80, 45–61. [Google Scholar] [CrossRef]
- Hoffmann, J.P. Linear Regression Models: Applications in R; Chapman and Hall/CRC: Parkway, NW, USA, 2021. [Google Scholar]
- Hoerl, A.E.; Kennard, R.W. Ridge regression: Biased estimation for nonorthogonal problems. Technometrics 1970, 12, 55–67. [Google Scholar] [CrossRef]
- Das, B.K.; Jha, D.N.; Sahu, S.K.; Yadav, A.K.; Raman, R.K.; Kartikeyan, M. Analysis of variance (ANOVA) and design of experiments. In Concept Building in Fisheries Data Analysis; Springer: Berlin/Heidelberg, Germany, 2022; pp. 119–136. [Google Scholar]
- Khan, M.A. ESG disclosure and firm performance: A bibliometric and meta analysis. Res. Int. Bus. Financ. 2022, 61, 101668. [Google Scholar] [CrossRef]
- Wu, L.; Liu, S.; Qi, L.; Lin, D. Mandatory disclosure and corporate ESG performance: Evidence from China’s “explanation for nondisclosure” requirement. Corp. Soc. Responsib. Environ. Manag. 2025, 32, 176–191. [Google Scholar] [CrossRef]
- Alsayegh, M.F.; Abdul Rahman, R.; Homayoun, S. Corporate sustainability performance and firm value through investment efficiency. Sustainability 2022, 15, 305. [Google Scholar] [CrossRef]
- Pfeffer, J.; Salancik, G. External control of organizations—Resource dependence perspective. In Organizational Behavior 2; Routledge: Abingdon, UK, 2015; pp. 355–370. [Google Scholar]
- Xie, J.; Nozawa, W.; Yagi, M.; Fujii, H.; Managi, S. Do environmental, social, and governance activities improve corporate financial performance? Bus. Strategy Environ. 2019, 28, 286–300. [Google Scholar] [CrossRef]
- Waddock, S.A.; Graves, S.B. The corporate social performance–financial performance link. Strateg. Manag. J. 1997, 18, 303–319. [Google Scholar] [CrossRef]
- Cardinale, R. State-owned enterprises’ reforms and their implications for the resilience and vulnerability of the Chinese economy: Evidence from the banking, energy and telecom sectors. Netw. Spat. Econ. 2022, 22, 489–514. [Google Scholar] [CrossRef]
- Scobell, A.; Burke, E.J.; Cooper, C.A., III; Lilly, S.; Ohlandt, C.J.; Warner, E.; Williams, J.D. China’s Grand Strategy: Trends, Trajectories, and Long-Term Competition; Rand Corporation: Arlington, VA, USA, 2020. [Google Scholar]
- Wang, Y.; Guo, C.-H.; Chen, X.-J.; Jia, L.-Q.; Guo, X.-N.; Chen, R.-S.; Zhang, M.-S.; Chen, Z.-Y.; Wang, H.-D. Carbon peak and carbon neutrality in China: Goals, implementation path and prospects. China Geol. 2021, 4, 720–746. [Google Scholar] [CrossRef]
- Liu, J.; Lau, S.; Liu, S.S.; Hu, Y. How firm’s commitment to ESG drives green and low-carbon transition: A longitudinal case study from hang lung properties. Sustainability 2024, 16, 711. [Google Scholar] [CrossRef]
- Brammer, S.; Millington, A. Does it pay to be different? An analysis of the relationship between corporate social and financial performance. Strateg. Manag. J. 2008, 29, 1325–1343. [Google Scholar] [CrossRef]
- Lashitew, A.A. Corporate uptake of the Sustainable Development Goals: Mere greenwashing or an advent of institutional change? J. Int. Bus. Policy 2021, 4, 184–200. [Google Scholar] [CrossRef]
- Zioło, M.; Bąk, I.; Cheba, K.; Filipiak, B.Z.; Spoz, A. Environmental, social, governance risk versus cooperation models between financial institutions and businesses. Sectoral approach and ESG risk analysis. Front. Environ. Sci. 2023, 10, 1077947. [Google Scholar] [CrossRef]

| Indicator | Mean | SD | Min | Max | Skewness |
|---|---|---|---|---|---|
| ESG Disclosure Score | 51.49 | 8.49 | 30.99 | 72.52 | 0.067 |
| Social Disclosure Score | 46.67 | 8.63 | 26.25 | 71.60 | −0.065 |
| Governance Disclosure Score | 50.65 | 13.97 | 22.73 | 82.74 | 0.043 |
| Environmental Disclosure Score | 60.84 | 5.91 | 46.35 | 73.56 | 0.123 |
| Indicator | Mean | SD | Min | Max | Skewness |
|---|---|---|---|---|---|
| ESG Disclosure Score | 46.03 | 11.66 | 25.00 | 65.23 | 0.086 |
| Social Disclosure Score | 29.42 | 11.39 | 13.57 | 56.32 | 0.642 |
| Governance Disclosure Score | 73.40 | 19.37 | 35.00 | 109.65 | −0.413 |
| Environmental Disclosure Score | 35.12 | 16.42 | 7.88 | 71.82 | 1.041 |
| Indicator | China (Mean ± SD) | UK (Mean ± SD) | Skewness (China/UK) |
|---|---|---|---|
| Profit Margin (%) | −48.15 ± 188.60 | 6.59 ± 7.77 | −6.153/0.122 |
| Return on Shareholders’ Funds (%) | 4.27 ± 14.91 | 11.09 ± 14.17 | 9.019/−2.048 |
| Return on Capital Employed (%) | −1.64 ± 43.16 | 9.31 ± 10.01 | −2.129/−0.886 |
| Current Ratio | 1.3 ± 0.71 | 0.87 ± 0.28 | 2.316/0.696 |
| Gearing (%) | 71.97 ± 19.94 | 41.21 ± 35.30 | 0.362/1.457 |
| Return on Total Asset | 0.75 ± 4.40 | 5.21 ± 5.56 | 0.416/−1.95 |
| EBIT margin | 1.29 ± 12.06 | 6.60 ± 7.19 | 9.743/−0.161 |
| Net Assets Turnover | 2.55 ± 3.67 | 2.75 ± 2.72 | 3.204/1.456 |
| Model | Coefficients | |||||||
|---|---|---|---|---|---|---|---|---|
| Unstandardised Coefficients | Standardised Coefficients | t | Sig. | 95.0% Confidence Interval for β | Correlations | |||
| β | Std. Error | β | Lower Bound | Upper Bound | Zero-Order | |||
| (Constant) | −0.198 | 2.160 | −0.092 | 0.927 | −4.493 | 4.097 | ||
| Social Information Disclosure Score | 0.392 | 0.021 | 0.399 | 18.288 | 0.000 | 0.350 | 0.435 | 0.777 |
| Governance Disclosure Score | 0.386 | 0.014 | 0.635 | 26.686 | 0.000 | 0.357 | 0.414 | 0.907 |
| Environmental Disclosure Score | 0.209 | 0.029 | 0.146 | 7.118 | 0.000 | 0.151 | 0.268 | 0.536 |
| Profit Margin | 0.000 | 0.001 | 0.010 | 0.524 | 0.602 | −0.001 | 0.002 | 0.274 |
| Return on Shareholders’ Funds | 0.004 | 0.014 | 0.007 | 0.299 | 0.766 | −0.023 | 0.032 | 0.144 |
| Return on Capital Employed | −0.002 | 0.005 | −0.012 | −0.491 | 0.624 | −0.012 | 0.007 | 0.269 |
| Current ratio | 0.255 | 0.339 | 0.021 | 0.753 | 0.454 | −0.419 | 0.929 | 0.138 |
| Gearing | 0.007 | 0.012 | 0.016 | 0.545 | 0.587 | −0.018 | 0.031 | −0.095 |
| Return on Total Assets | 0.088 | 0.037 | 0.045 | 2.358 | 0.021 | 0.014 | 0.162 | 0.101 |
| EBIT margin | −0.013 | 0.014 | −0.018 | −0.936 | 0.352 | −0.040 | 0.014 | −0.012 |
| Net Assets Turnover | 0.102 | 0.046 | 0.044 | 2.228 | 0.029 | 0.011 | 0.193 | 0.094 |
| Name | Actual | Forecast/Prediction | Discrepancy | Proportion/Percentage |
|---|---|---|---|---|
| Watkin Jones PLC | 25.00 | 24.42 | 0.58 | 2.33% |
| Vistry Group PLC | 35.07 | 36.07 | −1.01 | −2.87% |
| Severfield PLC | 42.13 | 47.39 | −5.26 | −12.49% |
| Renew Holdings PLC | 41.11 | 40.89 | 0.22 | 0.53% |
| Persimmon PLC | 43.30 | 43.10 | 0.20 | 0.46% |
| Morgan Sindall Group PLC | 52.91 | 54.90 | −1.99 | −3.76% |
| Kier Group PLC | 36.70 | 36.23 | 0.47 | 1.27% |
| Henry Boot PLC | 47.68 | 50.93 | −3.25 | −6.81% |
| Galliford Try Holdings PLC | 32.00 | 31.29 | 0.71 | 2.22% |
| Crest Nicholson Holdings Plc | 43.89 | 46.53 | −2.64 | −6.01% |
| Costain Group PLC | 56.25 | 59.68 | −3.42 | −6.09% |
| Berkeley Group Holdings PLC | 62.75 | 64.59 | −1.84 | −2.94% |
| Bellway PLC | 65.23 | 62.83 | 2.40 | 3.69% |
| Barratt Redrow PLC | 60.31 | 58.08 | 2.24 | 3.71% |
| Balfour Beatty PLC | 46.13 | 48.34 | −2.21 | −4.79% |
Disclaimer/Publisher’s Note: The statements, opinions and data contained in all publications are solely those of the individual author(s) and contributor(s) and not of MDPI and/or the editor(s). MDPI and/or the editor(s) disclaim responsibility for any injury to people or property resulting from any ideas, methods, instructions or products referred to in the content. |
© 2025 by the authors. Licensee MDPI, Basel, Switzerland. This article is an open access article distributed under the terms and conditions of the Creative Commons Attribution (CC BY) license (https://creativecommons.org/licenses/by/4.0/).
Share and Cite
Martin, H.; Zhou, Y.; Raman, R. Financial Metrics and Environment, Social, Governance (ESG) Performance: A Cross Border Comparison of China and the UK Construction Industries. Buildings 2025, 15, 1236. https://doi.org/10.3390/buildings15081236
Martin H, Zhou Y, Raman R. Financial Metrics and Environment, Social, Governance (ESG) Performance: A Cross Border Comparison of China and the UK Construction Industries. Buildings. 2025; 15(8):1236. https://doi.org/10.3390/buildings15081236
Chicago/Turabian StyleMartin, Hector, Yuheng Zhou, and Raghu Raman. 2025. "Financial Metrics and Environment, Social, Governance (ESG) Performance: A Cross Border Comparison of China and the UK Construction Industries" Buildings 15, no. 8: 1236. https://doi.org/10.3390/buildings15081236
APA StyleMartin, H., Zhou, Y., & Raman, R. (2025). Financial Metrics and Environment, Social, Governance (ESG) Performance: A Cross Border Comparison of China and the UK Construction Industries. Buildings, 15(8), 1236. https://doi.org/10.3390/buildings15081236