Abstract
High-rise building structures with podiums are widely present, and establishing a fast numerical prediction method to evaluate their wind-induced response characteristics is of great significance for engineering applications. This article proposes a process algorithm based on the AR (autoregression) method to solve the time history of fluctuating wind speed and determine fluctuating wind load. The simulated fluctuating wind speed spectrum obtained through this algorithm matches the target wind speed spectrum, and the wind-induced response characteristics of high-rise buildings with podiums were studied using MIDAS GEN (2021) structural analysis software. In order to evaluate the influence of different parameters on the wind-induced vibration response of high-rise buildings with podiums, a total of 11 comparative conditions were set, including the presence or absence of podiums, podium height, podium area, and podium layout conditions. A comprehensive time history analysis was conducted on the displacement, acceleration, shear force, and overturning moment of the wind-induced vibration response of high-rise buildings with podiums. The results indicate that in high-rise buildings with podiums, adding podiums and increasing their height and area can help suppress the inter-story displacement of the main building and the inter-story acceleration, inter-story shear force, and intra-story overturning moment of the middle and lower floors, which is beneficial for the safety and stability of the high-rise building structure. The layout of the podium has an impact on the wind-induced vibration response of the main building. When the podium and main building are symmetrically arranged in the downwind direction, the maximum displacement of each floor is small, while the maximum displacement curve of buildings with asymmetric layout at the junction of the podium and main building is not smooth. The design of the central layout of the podium and main building can effectively reduce the maximum shear force and maximum overturning moment of the higher floors of the building, but the effect is opposite at lower floors.
1. Introduction
As the name suggests, wind-induced vibration is the term used to describe the shaking of structures. The effect of wind on building vibration was not immediately apparent in an era when buildings were typically not very tall. It was only later, with the development of high-rise structures and wide-span bridges, etc., that wind-induced vibration events started to become more common and even resulted in wind-damaged engineering structures such as buildings and bridges, like the Tacoma Suspension Bridge in the United States in 1940 [1], that people started to investigate this effect. Numerous academics have investigated wind vibration in buildings. To study the wind loads of supertall multi-tower conjoined buildings from the perspectives of mean and pulsating wind pressure characteristics and vortex volume distribution, researchers Shitang Ke and Hao Wang [2,3] performed wind tunnel tests based on large vortex simulation for a supertall three-tower conjoined building. In order to study the spatial distribution characteristics of downwind pulsating wind loads and pulsating wind speed coherence functions, Zeng Jadong and Li Mingshui et al. [4] conducted surface pressure simultaneous measurement experiments on a rectangular rigid model. They then proposed a model expression for the downwind pulsating wind load coherence function of a rectangular building that can involve flow field and structural parameters like wind field category, vertical spacing, and others. In order to study the interrelationships reflecting the statistical coupling between modal responses under spatially–temporally varying dynamic wind excitation, M.F. Huang and C.M. Chan et al. [5] use a 60-story asymmetric full-size steel–concrete hybrid building as an example. They then propose a framework for analyzing lateral torsional wind vibration forces in high-rise buildings based on three-dimensional modal vibration patterns. In order to study wind-induced torsional loads on rectangular high-rise buildings, Vladimir Guzmán-Sols and Adrian Pozos-Estrada et al. [6] conducted wind tunnel tests on five rigid models with the same dimensions and various aspect ratios. Based on the results, they proposed a parameter on the variation of foundation torque coefficients with aspect ratio and wind direction for rectangular high-rise buildings that agrees well with the experimental results equations. A popular area of study in recent years has been the damage theory analysis of high-rise building structures. The numerical simulation study of these structures’ wind vibration response characteristics has some value for engineering [7,8,9].
A survey of existing domestic and foreign research shows that few studies of this kind have been carried out, despite the fact that the main podium one-piece high-rise building structure is a common structure in a class of projects. In this study, the pulsating wind velocity at various heights is solved using the AR approach [10], and the pulsating wind load is calculated using a formula. Finally, the software simulates the building’s response to wind vibration under pulsing wind stress.
2. Overview of AR Method
The pulsating wind speed time range must be resolved first in order to obtain the building pulsating wind load time range by self-programming. The wind tunnel test, harmonic synthesis method, and linear filtering method are the current three methods for determining the pulsing wind speed. A series of artificially generated random numbers with zero mean and a white spectrum are input into the filter for processing and are then output as a random process with a specific spectrum. This technique is known as the linear filtering method, also known as the white noise filtering method. The linear filter method can be further broken down into the autoregressive (AR), sliding average, etc. Due to its benefits of low computational effort, quick computation, and high accuracy in determining the pulsing wind speed of buildings, the AR method has been extensively employed by a significant number of academics [11,12,13].
The basic idea behind the AR method’s steps is to first locate the stochastic process, then determine the regression coefficients given the stochastic process. The M-dimensional AR model can be used to represent the pulsing wind velocity field.
The expression is where is the autocorrelation matrix of order I × I (I = q × M), and the elements in can be obtained using the Wiener–Khinchin formula:
In Equation (4), the variable n represents the frequency of fluctuating wind speed; the variable r represents a spatial vector; and signify the average wind speed at and in the space; and , , and denote the left–right, front–back, and top–bottom attenuation coefficients of a space, respectively.
By multiplying both sides of Equation (1) simultaneously right by v(t) = [v1 (t), v2 (t), …, vm (t)] and then substituting the derived autoregressive coefficient matrix ψ_k, we can obtain the expression:
Thus, the random vector N(t) with a zero mean given the variance may be calculated from L, which stands for the lower triangular matrix. The expression is as follows:
By inserting the resulting into Equation (1), it is possible to find the pulsing wind velocity process vector with time interval t and spatial correlation.
The expression employed in this study, which uses the Davenport [15] pulsating wind speed spectrum, is as follows:
3. Pulsating Wind Load Solution
The program is created using the AR method, imported into the MATLAB (R2024a) software, and run to output the pulsating wind speed time history data and the pulsating wind speed time history graph at each point. Finally, the calculated simulated spectrum curve is compared with the target spectrum curve to confirm the accuracy of the simulated wind speed time history data.
3.1. Computational Model
The study conditions are shown in Table 1. The main building is 40 m in length, width, and height. The model size is shown in Figure 1. Measurement point locations are 10, 28, 56, 84, 112, 140, 168, and 196 m on the center line of the main building’s windward side. The measurement point map is shown in Figure 2. The podium area working condition measurement point distribution and 24 m podium working condition are the same.

Table 1.
Simulated working condition Table.
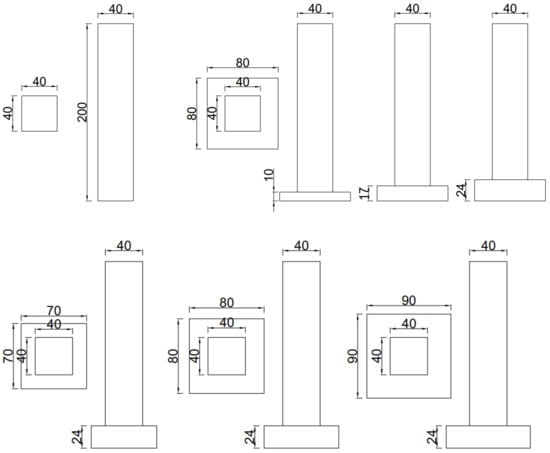
Figure 1.
Dimension drawing of the building model.

Figure 2.
Diagram of windward-side measuring points on buildings under varying operational circumstances.
3.2. Time History Simulation of Fluctuating Wind Speed
Wang Xiuqiong [16] conducted a pertinent study regarding the Davenport wind speed spectrum and provided more reasonable values for the ground roughness coefficient k according to different roughness types, including 0.00129 for Class A landforms, 0.00215 for Class B landforms, 0.00464 for Class C landforms, and 0.01291 for Class D landforms (in the Code for Structural Loads of Buildings (GB50009-2012) [17]. The ground roughness is divided into four categories, i.e., A, B, C, and D. Since B is the studied landform type, 0.00215 is used as the k value. Only height correlation is taken into account for spatial correlation; hence, is the only number used (empirical value). Equation (4) uses the wind speed exponential law to calculate the variables and . The wind speed exponential law’s expression is as follows:
The reference wind pressure in this study is 0.25 at a height of 10 m, based on the following equation between wind pressure and wind speed:
Moreover, 20 m/s can be calculated as the reference wind speed at 10 m, and the other necessary values are established as given in Table 2.

Table 2.
Parameter setting of fluctuating wind speed time history simulation.
According to the calculation of the MATLAB program, the fluctuating wind speed at each height is shown in Figure 3.
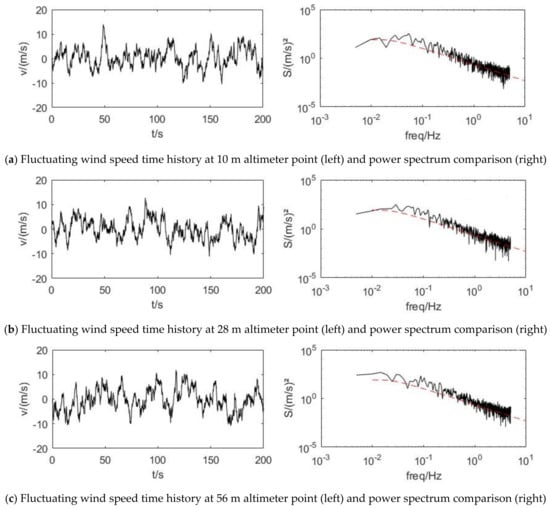
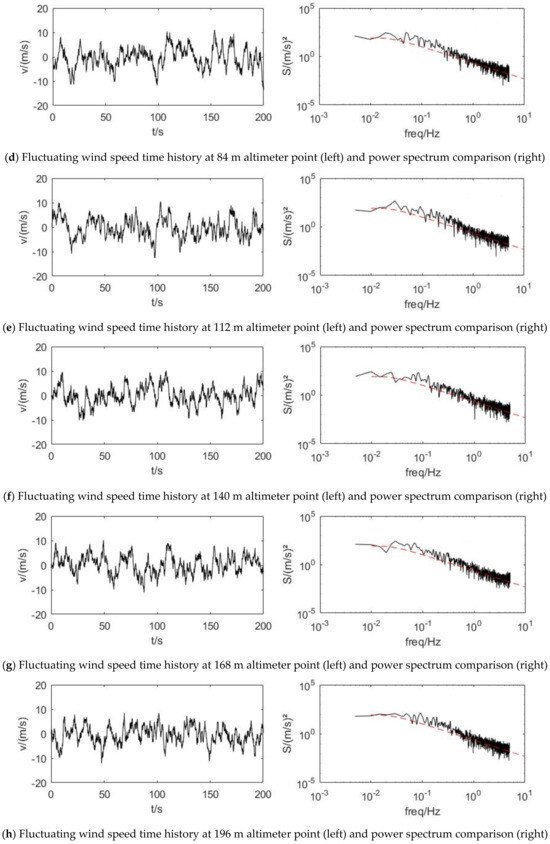
Figure 3.
Fluctuating wind speed time history at each altimeter point and power spectrum comparison (the red dashed line in the right figure represents the target power spectrum, while the black solid line represents the simulated power spectrum).
According to Figure 3, each height measurement point’s peak pulsing wind speed is maintained at roughly 10 m/s, and they all oscillate up and down at 0. The simulated spectrum curve (black straight line on the right figure) produced by MATLAB software for each height measurement point is more consistent with the target spectrum curve (red dashed line on the right figure), as can be seen from the power spectrum comparison graph, demonstrating that there is some degree of confidence in the simulated pulsating wind speed time range data in this section.
The pulsating wind pressure time range data can be calculated using the obtained pulsating wind speed time range data, and the pulsating wind load time range data can be calculated using a different formula. The wind pressure includes both average and pulsing wind pressure since the natural wind in the atmospheric environment is made up of both average and pulsating wind. The equation for the link between wind speed and wind pressure is:

Table 3.
Summary of average wind speed at each height measuring point.

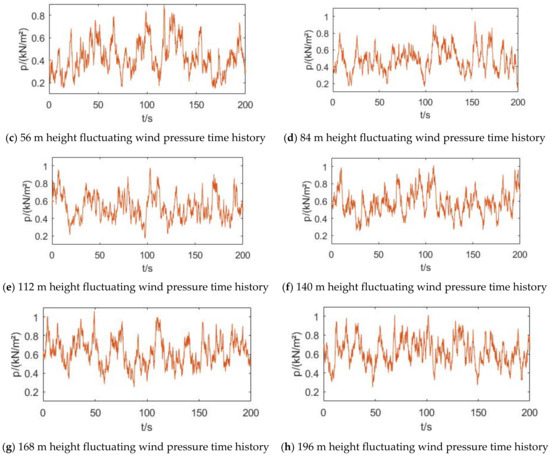
Figure 4.
Time history of fluctuating wind pressure at each height measuring point.
Based on the calculated fluctuating wind pressure time history data, the fluctuating wind load time history can be directly calculated through the following formula:
In this study, the windward area A of the simulated height measurement point is calculated as the product of the measurement point’s distance from two neighboring measurement sites divided by half, then multiplied by the breadth of the windward surface. indicates the building wind carrier type coefficient, which is specified in the Code for Structural Loads of Buildings (GB50009-2012) [17].
To be conservative, the wind load coefficient on the windward side and the wind load coefficient on the leeward side are typically superimposed to take 1.4 when designing and calculating the wind resistance performance of the building. This is because in the wind resistance design of the building structure, the wind pressure on the windward side of the building and the wind suction force on the leeward side of the building should be in the same direction. The wind load coefficient on the windward side is taken to be 1.25 in this study, and Figure 5 displays the wind load time range for each height measurement point derived from Equation (14).
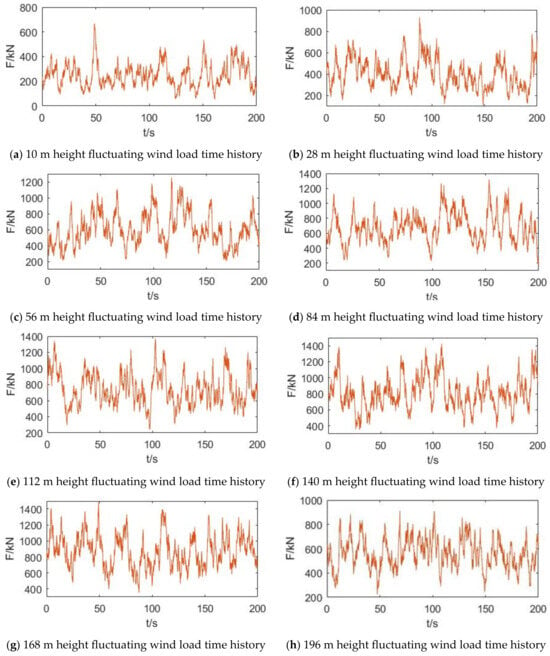
Figure 5.
Time history of fluctuating wind load at each height measuring point.
4. Verification of Numerical Simulation Results of Wind-Induced Vibration Response
The computational model and wind tunnel test data for the verification examples are sourced from reference [18]. The wind tunnel test model is a single-story high-rise building model with a length, width, and height of 30 m × 15 m × 240 m. Reference [18] obtained through wind tunnel tests that the maximum displacement of the top layer is 0.438 m. The numerical simulation conditions in this article are consistent with those in reference [18]. The incoming wind direction is perpendicular to the long side, and the ground roughness type is Class B with a roughness of 0.15. The initial wind speed at a height of 10 m is 28.5 m, and the damping ratio is set to 0.02.
By using Midas Gen (2021) software to perform time history analysis on the model and output displacement data for each layer of the model. Due to space limitations, this article only compares the mean results of displacement response at the top level. The average maximum displacement of the top layer obtained through numerical simulation is about 0.53 m, while the average maximum displacement of the top layer obtained from wind tunnel experiments in reference [16] is about 0.438 m. Considering that the model used in the original wind tunnel experiment was a scaled-down model and other factors, the results were relatively small, and the differences in the results were within an acceptable range. Therefore, the numerical calculation method for wind vibration response results in this paper is feasible.
5. Wind-Induced Vibration Analysis
For the convenience of comparison, the damping calculation method for high-rise building structures in this article adopts the modal damping method, and the damping ratio is uniformly set to 0.05. Regarding the setting of boundary conditions in modal simulation of high-rise building structures, the bottom nodes of the podium of high-rise buildings are set to general elastic support boundary conditions. All other boundary nodes are free and have sliding boundary conditions. The boundary conditions for other operating conditions are also set in the same way.
5.1. Comparison of Wind Vibration Results Between High-Rise Buildings with and Without Podiums
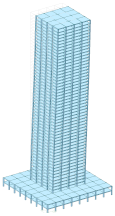
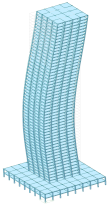
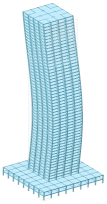
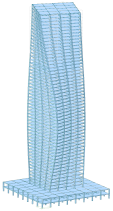
Prior to performing the time analysis, the modal analysis of the finite element model’s first 16 orders of vibration patterns is performed using the eigenvalue analysis method in Midas Gen, which may guarantee the model’s plausibility. Under the condition of calculating the vibration mode to the 16th order, Table 4 shows the first six orders of the vibration mode diagram for the high building without a podium.

Table 4.
The first six vibration modes of the finite element model for high-rise buildings with podiums (10 m).
The requirements for vibration types of high-rise buildings in the Code for Vibration Analysis of Buildings mainly include basic vibration modes such as translation, torsion, bending, and planar torsional coupling. Modal analysis was conducted on the finite element models of high-rise buildings with podium heights of 10 m, 17 m, and 24 m, respectively. The analysis results for podium heights of 10 m are shown in Table 4. According to Table 4, the vibration types of each mode basically meet the requirements of the first six vibration types of high-rise buildings in the Technical Code for Concrete Structures of Tall Buildings [19], indicating that the finite element model is properly set.
The numerical simulation results of wind-induced vibration response for two working conditions (high-rise buildings with and without podiums) are visualized and compared through post-processing, as shown in Figure 6, Figure 7, Figure 8 and Figure 9. Figure 6 shows the variation of top displacement over time and the comparison of maximum displacement for each floor. Figure 7 shows the comparison of the highest acceleration of each floor and the variation of the top floor acceleration over time. Figure 8 shows the comparison of maximum shear forces on each floor and the variation of bottom shear force over time. Figure 9 depicts the time history of the bottom overturning moment and the comparison of the maximum overturning moment on each floor.
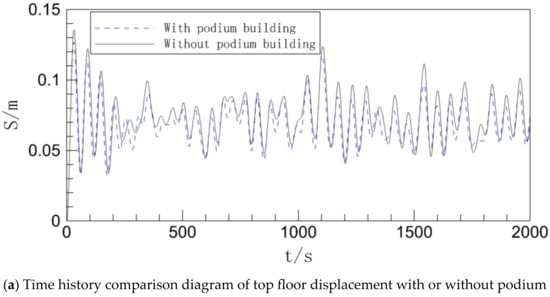
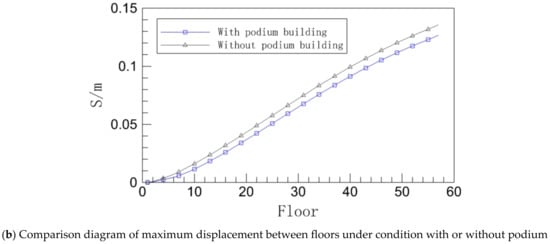
Figure 6.
Inter-story displacement of the podium with or without working conditions.
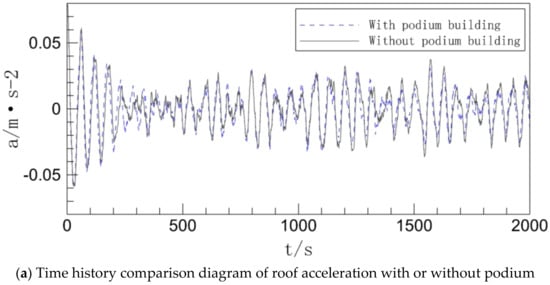
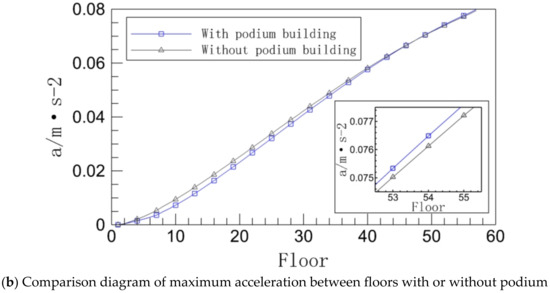
Figure 7.
Inter-story acceleration of a podium with or without working conditions.
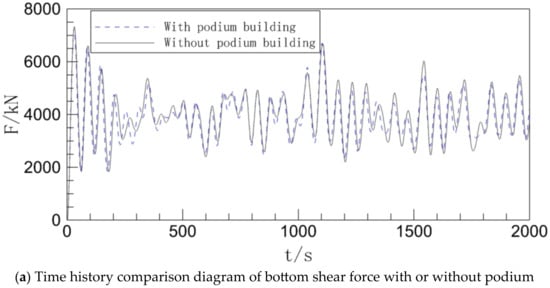
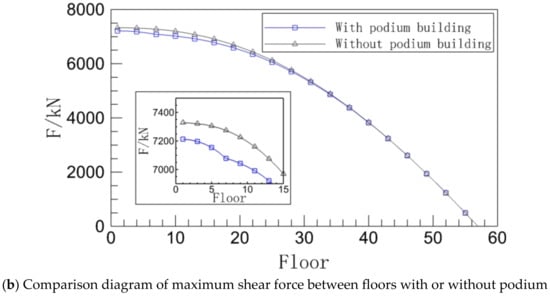
Figure 8.
Inter-story shear of the building with or without a podium.
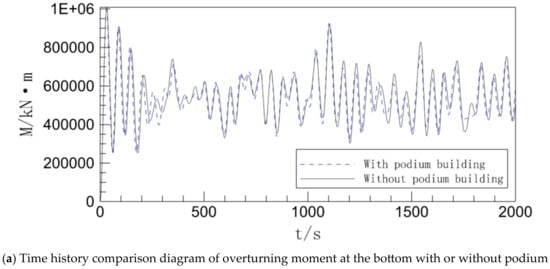
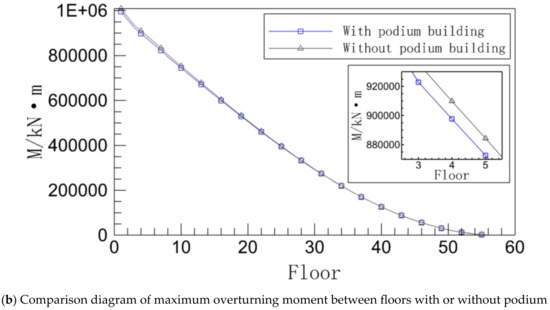
Figure 9.
Overturning moment between floors of the podium with or without working conditions.
When looking at Figure 6a, it is clear that there are not many differences between the two working conditions, as evidenced by the displacement time history curves of the top level of the building with and without a podium. Even still, the peak of the curve shows that the curve without a podium has a slightly bigger overall numerical magnitude than the one with a podium, showing that the displacement pulsation of the top floor of the building without a podium is larger.
In both operating situations, the maximum inter-story displacement can be seen in Figure 6b to significantly increase as the floor height increases. This is in keeping with the general rule of wind load on high-rise buildings since as a building’s height increases, so does its flexibility, making it more susceptible to wind stress. When the displacement curves for the two working conditions are compared, it is clear that the maximum displacement between each floor in the working condition without a podium is greater than that in the working condition with a podium, and the difference between the two gradually grows as the floor increases.
In general, adding a podium at the base of a high-rise building helps to reduce the wind-induced vibration displacement response of the entire structure because the podium structure at the base increases the building’s bottom stiffness to some extent, increasing the building’s overall wind resistance.
Figure 7a demonstrates that the acceleration time history curves of the top level of the building with and without the podium are still very comparable in both situations, much like the displacement time history scenario. The maximum acceleration difference between the two working conditions does not increase with the height of the building but instead begins at zero and increases until it reaches its maximum value around the tenth floor, after which it decreases until the two curves essentially coincide, and finally, the acceleration of the working condition without a podium is lower than the acceleration of the working condition with a podium, as can be seen from the detailed diagram in the lower right corner of Figure 7b. The stiffness difference is what drives the curve’s development tendency. The inter-story acceleration of a building drops as its stiffness rises, and the inter-story acceleration of a building with a podium condition is lower from the bottom level than it would be without a podium condition because the podium makes the bottom of the building stiffer. The influence of the bottom podium on the building’s inter-story stiffness then steadily reduces as the number of floors rises. Overall, the podium predominantly suppresses inter-story acceleration in the middle and lower floors, and the strength of the suppression weakens as the number of stories rises.
The time history curves for bottom shear in the two operating circumstances are essentially the same, as can be seen in Figure 8a. The difference between the peaks of the time history curves for the cases with and without podiums demonstrates that the effect of the podium on the building’s bottom shear is not immediately apparent. The maximum acceleration between floors in both working circumstances drops noticeably with an increase in floor height, as shown in Figure 8b. The difference in maximum acceleration between floors is primarily visible in the lower floors, and the inter-story shear force without podium condition is greater than that with podium condition. However, the difference in shear force between the two does not increase with the height of the building; instead, it starts at zero until the maximum value is reached around the tenth floor, then it gradually decreases until the two curves essentially coincide. Overall, the middle and low levels still represent the majority of the podium’s effect on the building’s inter-story shear, and the strength of the impact will continue to diminish as the number of stories rises.
Because there is a transformation relationship between the shear force and the overturning moment, it can be seen from Figure 9a that the shape of the bottom overturning moment time history curve under the two working conditions is essentially the same as the bottom shear time history curve in Figure 8a. This indicates that the podium’s influence on the building’s bottom overturning moment is as minimal as the bottom shear force.
Figure 9b demonstrates that the amplitude and variety of the two curves’ differences are still comparable to Figure 8b. This means that rather than increasing as a building’s height rises, the difference between the two overturning moments instead increases from 0 until it reaches its greatest value around the 10th story, then reduces until the two curves almost converge. The scale in Figure 9 is too tiny, and the overturning moment values are quite great, which reduces the distance between the two, causing the curves to be very similar.
Overall, the middle and lower floors still reflect the majority of the podium’s shear stress on the overturning moment between the building’s floors, and the severity of the effect reduces as the number of stories rises.
In order to better analyze and compare the numerical simulation results, the key node layers in the building model were selected for quantitative comparison, highlighting the influence of the presence of the podium on the wind-induced vibration response results. The data comparison is shown in Table 5. From Table 5, it can be seen that under the same conditions, the average values of various parameters in the middle floors of the main body of high-rise buildings with podiums are lower than those in the corresponding positions of buildings without podiums. However, at the top level of the main body of high-rise buildings, except for the top level with a podium where the displacement is smaller than that without a podium, all other top-level response parameters with a podium are higher than those without a podium. It can be inferred that one of the reasons for this phenomenon is the presence of podiums, which leads to a relative increase in the bottom stiffness and a relative decrease in the upper stiffness effect of the building.

Table 5.
Comparison of key data with or without podium working conditions.
5.2. The Influence of Podium Height on Wind-Induced Vibration Results
Figure 10 shows the time history of the top floor displacement and the maximum displacement of each floor under the three working conditions. Figure 11 shows the time history of the top floor acceleration and the maximum acceleration of each floor. Figure 12 shows the time history of the bottom shear force and the maximum inter-story shear force of each floor. Figure 13 shows the time history of the bottom overturning moment and the maximum overturning moment of each floor.

Figure 10.
Inter-story displacement under podium height condition.

Figure 11.
Inter-story acceleration under podium height condition.

Figure 12.
Inter-story shear under podium height condition.
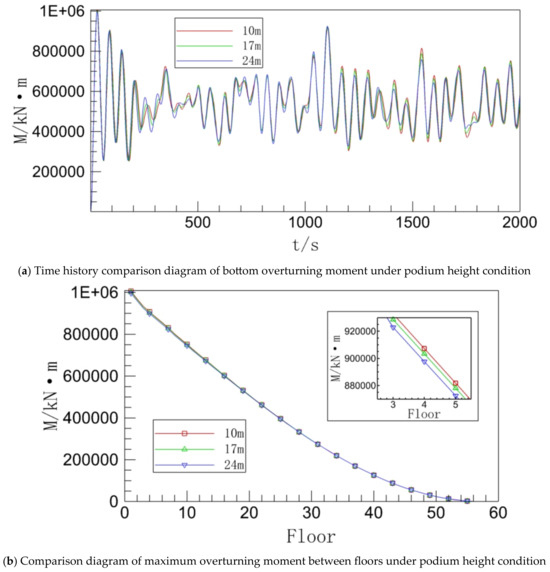
Figure 13.
Overturning bending moment between building floors under podium height condition.
It can be seen from Figure 10a that with the increase in the podium height, the overall value of the displacement time history curve of the top floor is gradually decreasing, and from the peak value of the curve under the three working conditions, the overall amplitude of the curve is also decreasing. This shows that the higher the podium, the smaller the displacement fluctuation amplitude of the top floor of the building. By observing Figure 10b, it can be seen that with the increase in the number of building floors, the maximum inter-floor displacement under the three working conditions shows an obvious increasing trend. Secondly, comparing the maximum displacement curves between the floors under the three working conditions, it can be clearly seen that the maximum displacement between the floors of the building gradually decreases with the increase in the podium height, and the curve difference between the three working conditions gradually increases with the increase in the floors.
The podium structure at the bottom of the high-rise building can boost the bottom stiffness of the building to a certain level, improving the building’s total wind resistance, according to the research of the working conditions with and without the podium. Similar to this, the research of the podium height condition revealed that as the podium height increased, the stiffness of the building’s main body increased. As a result, the building’s inter-story displacement decreased and the displacement pulsation amplitude increased.
As the podium’s height increases, it is evident from Figure 11a that both the amplitude and period of the pulsation of the acceleration time history curve are gradually diminishing. As can be observed from Figure 11b, the acceleration rises noticeably as the floor height rises, and the maximum acceleration curve between floors follows the expected trend. The acceleration difference between each curve, which starts at zero and increases until it reaches its maximum value around the tenth floor, then gradually decreases until the two curves essentially coincide, can be seen in Figure 11b. During this time, the maximum acceleration magnitude between building floors gradually decreases with the increase in podium height. The acceleration numbers are in the opposite order of magnitude as before, starting at about the 45th story of the building, and the difference in acceleration is growing. The detailed image in Figure 12b’s lower right corner makes it easy to determine the magnitude difference between the acceleration values. Following analysis of the podium height scenario, it was discovered that elevating the podium can successfully reduce inter-story acceleration in the building’s middle and lower floors, similar to the cases with and without a podium. Reaching the middle and upper stories, this suppression effect is totally reversed as the floors rise higher.
The bottom shear time history curves for the three working conditions are extremely similar, as can be shown in Figure 12a. The three have different pulsation amplitudes, but there is no noticeable difference between them, so it can be concluded that altering the podium’s height does not significantly affect the building’s bottom shear.
As the floors rise higher, it is clear from Figure 12b that the maximum inter-story shear forces for the three operating conditions only differ marginally at the lower floors. The shear force difference between the curves in the figure is not as noticeable as it would be in the case with and without the podium because the value of the shear force at the base of the building does not vary significantly as a result of the little increase in podium height. However, as can be seen from the detailed diagram in the lower right corner of Figure 12b, the maximum inter-story shear force close to the intersection level of the main structure of the building and the podium gradually reduces with an increase in podium height.
Figure 13a reveals that the bottom overturning moment time history curve’s trend and period for the three working conditions are essentially identical to those of Figure 11a. This is due to the fact that shear force and overturning moment have a transformation connection that is comparable to the situation in operating conditions with and without a podium. Because the overturning moment values in Figure 13b are quite high and the shear forces between the layers for the three working conditions have been somewhat similar. The three curves’ differences are thus barely discernible and even close to overlapping. The inter-story overturning moment of the middle and lower floors of the building does, however, gradually decrease with an increase in podium height, as shown by the detailed diagram in Figure 13b’s right corner.
Similarly, in order to better analyze the data, important location nodes in the building model were selected for quantitative comparison to highlight the effect of podium height. The data comparison is shown in Table 6.

Table 6.
Comparison of key data of podium height working conditions.
From Table 6, it can be seen that as the height of the podium increases, the average values of various parameters and the parameters of the middle floor decrease. But at the top level, except for displacement, all other parameters increase with the height of the podium building. It can be inferred that one of the reasons for this phenomenon is still the relative weakening of the stiffness effect on the upper part of the building.
5.3. The Influence of Podium Area on Wind-Induced Vibration Results
The finite element models of the three podium area working conditions perform modal analysis. The specific settings for the three area conditions are shown in Table 1. Perform wind vibration response calculation and post-processing analysis on finite element models under three types of podium floor area conditions.
Following the time history analysis, Figure 14, Figure 15 and Figure 16 show the time history of the top floor displacement and the maximum displacement of each floor, the time history of the top floor acceleration and the maximum acceleration of each floor under the three working conditions, the time history of the bottom shear force and the maximum inter-story shear force of each floor under the three working conditions, and Figure 17 shows the time history of the bottom overturning bending moment and maximum overturning moment between floors under podium area condition under podium area condition.
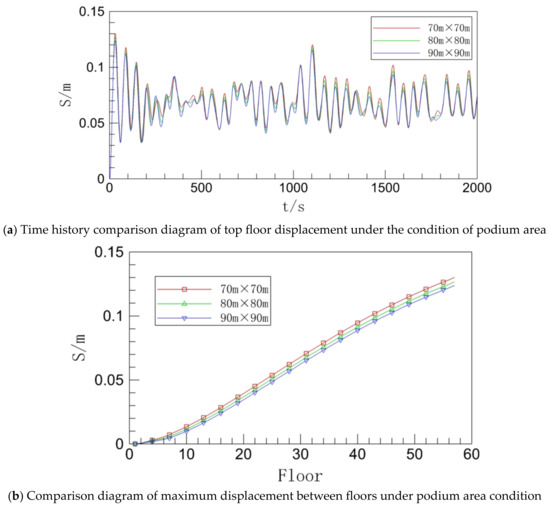
Figure 14.
Inter-story displacement under podium area condition.
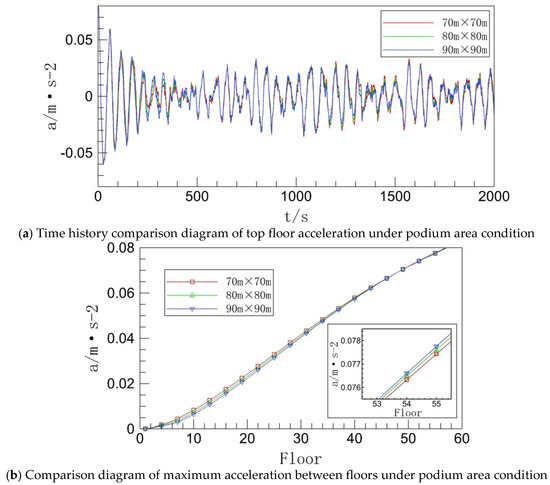
Figure 15.
Inter-story acceleration under podium area condition.
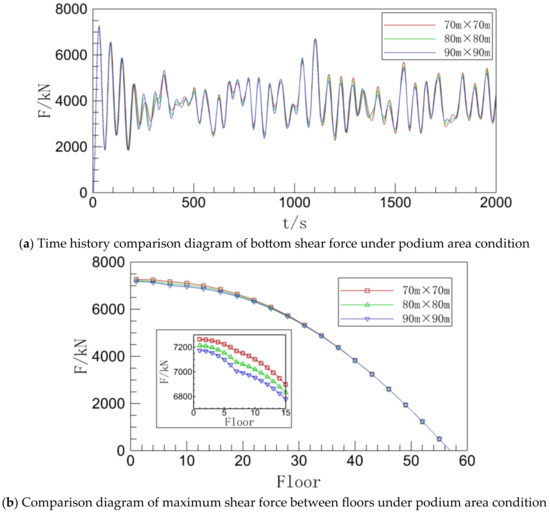
Figure 16.
Inter-story shear under podium area condition.

Figure 17.
Overturning bending moment between building floors under podium area condition.
The displacement time history curve for the top floor of the building under the three operating conditions has a very similar trend and period, as can be shown in Figure 14a. The overall value of the displacement time history curve of the top level, however, gradually declines as the podium’s surface area grows. Additionally, under the three operating conditions, the overall amplitude of the curve is likewise falling from the apex of the curve. This suggests that the displacement pulsation amplitude of the building’s top floor decreases as the podium’s area increases. The maximum displacement between floors in all three sets of working situations grows dramatically with the addition of building floors, as can be seen by first looking at Figure 14b. Second, when comparing the three curves, it is clear that as the height of the podium rises, the maximum displacement between floors of the building progressively reduces, and as floors rise, the disparity in the curves between the three groups of working circumstances gradually grows.
Combining the two sets of displacement diagrams, it is clear that expanding the podium area in the main podium one-story high-rise building is a good way to reduce the building’s overall response to wind-induced vibration displacement. This is because the inter-story displacement of the building will decrease and the displacement pulsation amplitude will weaken as the size of the podium increases, increasing the stiffness of the main body of the building. This situation is comparable to the former working condition, and the outcomes are as anticipated.
As demonstrated in Figure 15a, with an increase in podium floor area, the acceleration time history curves’ pulsation amplitude increases. As can be observed from Figure 15b, the maximum acceleration curves between floors grow significantly as the number of floors increases, and these changes essentially fulfill the expected requirements. The acceleration difference between each curve does not increase as the building height rises; instead, it increases from zero until it reaches its maximum value somewhere around the tenth floor, then it starts to decline until the two curves essentially coincide, during which point the acceleration magnitude decreases as the podium area grows. Beginning at the 45th level, the magnitude sequence of the acceleration values is reversed from what it was, followed by a growing discrepancy in the acceleration values, which lasts all the way to the building’s top floor. The detailed graphic shows the magnitude and sequence of the acceleration values close to the top floor. In general, expanding the podium’s area can successfully reduce the building’s middle and lower floors’ inter-story acceleration. By reaching the middle and upper floors, however, this suppression effect will be completely contrary to the prior one, while the difference is still minimal. Similar results to this one have been seen in previous working conditions.
The bottom shear time history curves for the three working conditions are quite similar to one another, as can be seen in Figure 16a. It can be seen that the podium height of a slight modification for the building bottom shear does not have a very visible impact since the overall difference in the pulsation amplitude of the three is not very great.
The maximum acceleration between floors under the three operating circumstances only minimally varies at the lower floors, as can be shown in Figure 16b, as the floor area increases. Due to the relatively slight change in the area of the podium, the change in the shear force at the base of the building is not obviously evident. However, as can also be seen from the detailed diagram in the lower left corner of Figure 16b, the value of the largest inter-story shear force in the area around the location where the building’s main structure and the podium meet diminishes as the area of the podium increases.
It is evident from Figure 17a that the bottom overturning moment time history curves under the three working conditions have a trend and period that are essentially the same as the bottom shear time history curves in Figure 16a due to a transformation relationship between the shear force and the overturning moment. The value of the overturning moment at the base of the building does not vary obviously because the change in the area of the podium is rather minor.
In Figure 17b, the distinctions between the three curves are not immediately apparent and have even come very close to overlapping since the shear forces between the layers in the three operating conditions have been extremely close and the values of the overturning moments have been quite large. The inter-story overturning moment of the building’s middle and lower floors, however, gradually reduces with an increase in podium area, as shown by the detailed subfigure in the right corner of Figure 17b, and the law is compatible with this change in the condition of the podium height.
The following is a summary of the research results on different podium area working conditions. Nodes from important parts of each model are selected for quantitative comparison, highlighting the podium effect. The data comparison is shown in Table 7.

Table 7.
Comparison of key data for podium area working conditions.
From Table 7, it can be seen that as the area of the podium increases, the average values of various parameters and the parameters of the middle floor decrease. But at the top level, except for displacement, all other parameters increase with the increase in the podium area, which is similar to the first two working conditions, once again verifying the reliability of the simulation results. The three parameters of acceleration, shear force, and bending moment decrease with the increase in podium area at the lower level of the building but increase with the increase in podium area at the middle and upper levels, showing the opposite variation. It can be inferred that one of the reasons for this phenomenon is still the weakening of the stiffness effect of the upper part of the building.
6. The Influence of Podium Layout on Wind-Induced Vibration Results
6.1. Calculation Models for Several Podium Layouts
In all layout methods, the size of the podium is 60 m × 60 m × 10 m, and the cross-sectional size of the main body is the same as that of the building without a podium. The overall height of the building is 90 m. C1, C2, and C3 are symmetrical layouts, while C4, C5, and C6 are asymmetrical layouts. The model is shown in Figure 18.
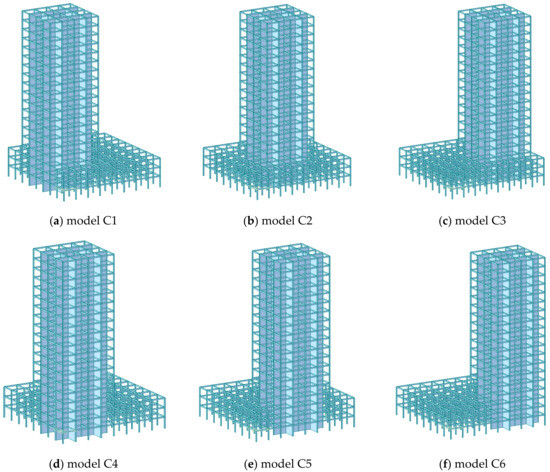
Figure 18.
Finite element model of working conditions for podium layout.
The top views of the six models presented in this section are shown in Figure 19.
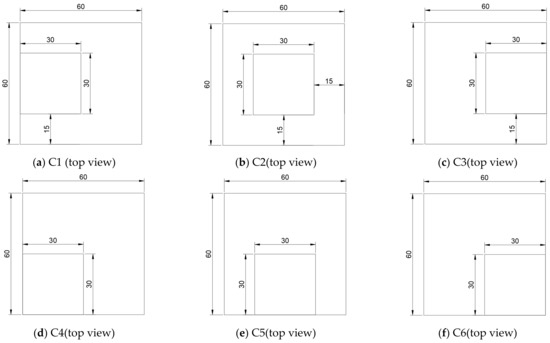
Figure 19.
Top view of architectural models with different podium layouts.
The loading method of pulsating wind load (nodal dynamic load) on the attached podium building is shown in Figure 20.

Figure 20.
Schematic diagram of fluctuating wind load loading on the building of conditions for podium layout (the red arrow in the figure indicates the loading position and direction of wind load).
6.2. Analysis of Numerical Simulation Results of Wind-Induced Vibration Response
The maximum displacement of each layer under six working conditions is shown in Figure 21, and the values of the maximum displacement, average displacement, and the ratio of maximum displacement to average displacement of key layers are shown in Table 8. It can be seen that the maximum displacement of a symmetrical layout always increases with the height of the floor, while the displacement of an asymmetrical layout undergoes a sudden change at the junction of the podium and the main body. Moreover, the maximum displacement of an asymmetrical layout is generally greater than that of a symmetrical layout.

Figure 21.
Comparison diagram of displacement (S) of buildings in the conditions of podium layout.

Table 8.
Displacement of key floors in the conditions of podium layout.
The maximum shear force and maximum overturning moment of each floor under six working conditions are shown in Figure 22 and Figure 23, respectively. The values of maximum shear force and overturning moment of key floors are shown in Table 9. It can be seen that the maximum overturning moment and maximum shear force trend of the six working conditions are similar, but the difference is that the maximum shear force graph is convex on the top and concave on the bottom. Like the maximum displacement, the maximum shear force curves and maximum overturning moment curves of C1 and C3, C4 and C6 completely overlap. Except for the layout at the center, the maximum shear force curves of the other five layouts have small differences and are not smooth at the junction between the podium and the main body. The maximum shear force and maximum overturning moment of the layout at the center of the high-rise area are smaller than those of the other working conditions, while the values of the layout at the center of the low-rise area are relatively large.
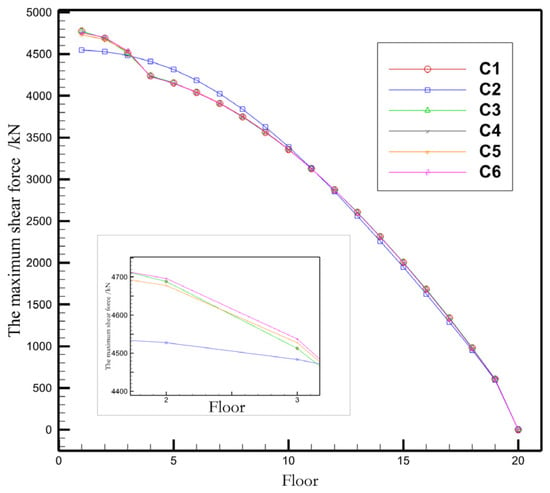
Figure 22.
Comparison diagram of the maximum shear forces of buildings in the conditions of podium layout.

Figure 23.
Comparison diagram of the overturning moment of buildings in the conditions of podium layout.

Table 9.
Shear force and overturning moment of key floors in the conditions of podium layout.
From the above analysis, it can be concluded that the overall displacement of symmetrical layout is smaller than that of asymmetrical layout. It is speculated that this is due to the relative weakening of stiffness caused by eccentric layout, resulting in an increase in displacement. By observing the maximum shear force and maximum overturning moment of each floor, it can be concluded that the design of the central podium layout can appropriately reduce the maximum shear force and overturning moment of the higher floors of the building, but the effect is opposite in lower floors.
7. Conclusions
In order to study the wind-induced response characteristics of the main podium one-piece high-rise building structure, this paper presents a process algorithm for solving the pulsating wind speed time history and determining the pulsating wind load based on the AR method. It then applies this algorithm to the study of the wind-induced response characteristics of the structure, and the following conclusions are drawn:
- (1)
- It is discovered that the building’s response to wind-induced displacement is mostly impacted by the podium’s existence or absence. The middle and bottom floors of the building exhibit the most visible effects of the podium’s presence or absence on the acceleration response, bottom shear, and bottom overturning moment, and the influence diminishes with increasing building height.
- (2)
- As the height and area of the podium increase, the maximum displacement and average value of each floor of the building steadily decrease, and this effect is particularly evident in the upper floors. But as the height and area of the podium increase, the wind-induced vibration acceleration at the lower and middle levels of high-rise buildings decreases significantly, while the upper level is not obvious, and the shear force and overturning moment at the bottom of the building slightly decrease.
- (3)
- The layout of the podium has an impact on the wind-induced vibration response of the main building. When the podium and main building are symmetrically arranged in the downwind direction, the maximum displacement of each floor is small, while the maximum displacement curve of buildings with asymmetric layout at the junction of the podium and main building is not smooth. The design of the central layout of the podium and main building can effectively reduce the maximum shear force and maximum overturning moment of the higher floors of the building, but the effect is opposite at lower floors.
Author Contributions
Conceptualization, H.Q.; Methodology, G.J.; Software, Z.C.; Formal analysis, G.J.; Resources, L.D.; Data curation, Z.C. and L.D.; Writing—original draft, G.J. and Z.C.; Visualization, A.T.; Project administration, H.Q.; Funding acquisition, H.Q. All authors have read and agreed to the published version of the manuscript.
Funding
This research was funded by the National Natural Science Foundation of China (No. 52478575) and the Scientific Research Foundation of Hunan Provincial Education Department (No. 22B0270).
Data Availability Statement
The original contributions presented in this study are included in the article. Further inquiries can be directed to the corresponding author.
Conflicts of Interest
The authors declare no conflict of interest.
References
- Von Kármán, T. Collapse of the Tacoma Narrows Bridge. Reson 2005, 10, 97–102. [Google Scholar] [CrossRef]
- Wang, H.; Ke, S. Study on Wind Response and Equivalent Static Wind Load of Super-Tall Multi-Tower Conjoined Buildings Based on Wind Tunnel Test. Build. Struct. 2018, 48, 103–108. [Google Scholar]
- Ke, S.T.; Wang, H. Study on Large Eddy Simulation of Wind Load Disturbance Effect of Super Tall Continuous Building. J. Hunan Univ. (Nat. Sci. Ed.) 2017, 44, 53–62. [Google Scholar]
- Zeng, J.; Li, M.; Li, S. Spatial Correlation of Downwind Pulsating Wind Loads on Rectangular High-Rise Buildings. J. Harbin Inst. Technol. 2017, 49, 150–155. [Google Scholar]
- Huang, M.F.; Chan, C.M.; Kwok, K.C.; Hitchcock, P.A. Cross Correlations of Modal Responses of Tall Buildings in Wind-Induced Lateral-Torsional Motion. J. Eng. Mech. 2009, 135, 802–812. [Google Scholar] [CrossRef]
- Guzmán-Solís, V.; Pozos-Estrada, A.; Gómez, R. Experimental Study of Wind-Induced Shear, Bending, and Torsional Loads on Rectangular Tall Buildings. Adv. Struct. Eng. 2020, 23, 2982–2995. [Google Scholar] [CrossRef]
- Xie, W.; Li, Z.; Du, W.; Fu, X. Coupling Vibration Characteristics and Wind-Induced Responses of Large-Span Transmission Lines under Multi-Dimensional Wind. Buildings 2024, 14, 3462. [Google Scholar] [CrossRef]
- Zhang, Z.; Xiao, Z.; Ma, W.; Liu, X. Wind-Induced Vibration Characteristics and Shading Effects of a Double-Layer Cable-Supported Photovoltaic Module System Based on Wind Tunnel Test. Buildings 2025, 15, 550. [Google Scholar] [CrossRef]
- Zhao, S.; Chen, J.; Yue, J.; Yan, Z.; Liu, J.; Zhang, B.; Chen, J. Sectional Model Wind Tunnel Test and Research on the Wind-Induced Vibration Response of a Curved Beam Unilateral Stayed Bridge. Buildings 2022, 12, 1643. [Google Scholar] [CrossRef]
- Liu, J.; Lu, N.; Duan, H.; Liu, S.K.; Zhang, L.L. Research on Wind Vibration Response and Wind Vibration Coefficients of Double-High Transmission Towers. J. Xi’an Univ. Archit. Technol. (Nat. Sci. Ed.) 2020, 52, 9–14+29. [Google Scholar]
- Li, C.; Du, M.; Han, B. Simulation of Pulsating Wind Velocity Timescales for Super Tall Buildings Based on Ar Model. Earthq. Eng. Eng. Vib. 2008, 28, 87–94. [Google Scholar]
- Yuan, B.; Ying, H.; Xu, J. Simulation of Pulsating Wind Speed Based on Linear Filtering Method and Its Matlab Program Implementation. Struct. Eng. 2007, 4, 55–61. [Google Scholar]
- Liu, L.W.; Sui, J.Y.; Liu, Z.X. Simulation of Pulsating Wind Loads on High-Rise Structures. In Proceedings of the 16th National Conference on Structural Engineering, Taiyuan, China, 19 October 2007. [Google Scholar]
- Xie, Z. Autoregressive Model Fitting, Spectral Estimation of Parametric Models and Aic Criterion. Math. Stat. Manag. 1985, 1, 38–42. [Google Scholar]
- Davenport, A.G. The Relationship of Reliability to Wind Loading. J. Wind. Eng. Ind. Aerodyn. 1983, 13, 3–27. [Google Scholar]
- Wang, X.; Cui, J. Formulation of the Coefficient K in the Davenport Spectrum and Its Engineering Applications. J. Tongji Univ. (Nat. Sci. Ed.) 2002, 7, 849–852. [Google Scholar]
- GB50009-2012; China Academy of Building Research; Tongji University; China Academy of Building Design; et al. Code for Structural Loading of Buildings. China Architecture & Building Press: Beijing, China, 2012.
- Su, Y. Comparative Study on Downwind Displacement Response of Rectangular High-Rise Buildings in Domestic and Foreign Standards. Master’s Thesis, Southwest Jiaotong University, Chengdu, China, 2016. [Google Scholar]
- JGJ 3-2010; China Academy of Building Research; Beijing Architectural Design and Research Institute; East China Architectural Design and Research Institute Co. Technical Regulations for Concrete Structures of High-Rise Buildings. China Architecture & Building Press: Beijing, China, 2010.
Disclaimer/Publisher’s Note: The statements, opinions and data contained in all publications are solely those of the individual author(s) and contributor(s) and not of MDPI and/or the editor(s). MDPI and/or the editor(s) disclaim responsibility for any injury to people or property resulting from any ideas, methods, instructions or products referred to in the content. |
© 2025 by the authors. Licensee MDPI, Basel, Switzerland. This article is an open access article distributed under the terms and conditions of the Creative Commons Attribution (CC BY) license (https://creativecommons.org/licenses/by/4.0/).

