Abstract
To solve the problem of state evaluations of small- and medium-span bridges such as concrete continuous girder bridges, this paper developed an extended model based on game theory. Aiming at Nash equilibrium, the combined weighting–fuzzy hierarchical comprehensive evaluation model was constructed by the combination of the analytic hierarchy process and the entropy weight method, which was corrected using the BP neural network. A three-span prestressed concrete continuous girder bridge in Wuhan was evaluated using health monitoring data and manual inspection information and compared to the results obtained using the traditional methods. The evaluation results showed that the error between the first-order frequency and the measured frequency was reduced from 17.95% to 9.00% and the bridge’s overall state score was 89.72. The evaluation model constructed by the method in this paper can take into account the contents of health monitoring and manual detection and coordinate the subjective and objective weights. Compared to the results of the analytic hierarchy process model and the fuzzy comprehensive evaluation model, the proposed model is reliable and applicable.
1. Introduction
With the rapid development of the economy, China’s bridge construction has advanced by rushes and made remarkable achievements. The completion of bridges is only the starting point for realizing their life value, and only by ensuring health and safety can bridges fully play their intended roles [1]. During their service life, bridges will inevitably suffer from structural damage accumulation and resistance decay due to the coupling effects of load fatigue, environmental corrosion, and material aging, thereby reducing their ability to resist catastrophic events. If these damages are not discovered and repaired in time, they can affect traffic safety, shorten the service life of bridges, and even lead to sudden bridge failures and collapses [2]. To reduce such bridge accidents, structural health monitoring technology has gradually expanded from the fields of aviation, aerospace, and machinery to the bridge field, providing new ideas for continuous, objective, quantitative, and holistic research on bridge conditions [3,4].
Compared to the traditional inspection methods, bridge health monitoring of bridges involves the comprehensive application of structural control, material science, non-destructive assessment, destructive assessment, signal processing, sensing technology, and other aspects. It is a scientific integration of multiple disciplines and has many advantages, e.g., (1) real-time online monitoring to ensure the normal operation of the bridge, (2) presenting the bridge structure information, which is convenient for quantitative analysis, and (3) reflecting the real state of the bridge at a deep level, which provides reference for daily management and maintenance. More than 90% of urban bridges in the country are built by concrete, and the continuous beam bridge is one of the most popular bridge types in urban bridge construction due to its good mechanical properties, small deformation, less expansion joints, less maintenance workload, good seismic performance, smooth and comfortable driving, and simple and beautiful shape [5,6]. However, the health monitoring system of the existing concrete continuous beam bridge is relatively imperfect, and the measurement points are generally less arranged. The results obtained by relying solely on the monitoring data may not be accurate. Therefore, it is imperative to evaluate the status of concrete continuous beam bridges according to manual detection based on the monitoring results to provide security.
In terms of bridge health monitoring, Mehrabi et al. [7] summarized and analyzed the safety monitoring data of 25 long-span cable-stayed bridges worldwide regarding safety monitoring. Sung et al. [8] installed a multi-scale diagnostic system on a cable-stayed bridge, combining such means as acceleration sensors and gyroscopes for monitoring. Junwon et al. [9] summarized the research progress in the field of bridge structure safety monitoring and proposed the research direction in this field. Li et al. [10,11,12] established a practical health monitoring system based on the practical engineering background of the Runyang Yangtze River Bridge. Zhang et al. [13] applied a large-scale bridge health monitoring system to the Dongjiang Bridge, monitoring various functional indices separately. Yu et al. [14] researched and implemented an integrated bridge monitoring system for data acquisition, transmission, storage, processing, and result display. Most of the above studies focused on suspension bridges and cable-stayed bridges, while there have been few studies on existing concrete continuous beam bridges. Moreover, too much emphasis is placed on the layout of sensors and too little on the processing and evaluation of monitoring data.
In terms of condition assessment, Melhem et al. [15] established an overall bridge assessment program using expert system tools and proposed a fuzzy weighting method. Mark et al. [16] incorporated fuzzy mathematics theory into the structure evaluation system, which consisted of bridge management optimization and inspection modules, addressing issues such as limited expert resources and high costs. Qin et al. [17] analyzed the various components of the superstructure of a cable-stayed bridge based on its monitoring data by adopting a five-degree index assessment method and proposed a comprehensive evaluation index based on weighting coefficients. As such, subjective separation of health monitoring and manual testing only rely on monitoring data for state assessments, but the existing concrete continuous beam bridge health monitoring system is not perfect, and the results are often not accurate. Furthermore, the determination of index weights relies too much on the subjective wishes of experts and scholars and ignores the objectivity of index information.
In terms of health monitoring, most existing studies focus on large-span suspension bridges and cable-stayed bridges, while research on medium- and small-span concrete continuous beam bridges is relatively scarce. In terms of condition assessment, the existing methods subjectively separate health monitoring from manual inspection. Due to cost issues, the layout of monitoring sensors for medium- and small-span bridges is generally sparse. Relying solely on monitoring data for condition assessments often yields inaccurate results. How to utilize monitoring data to achieve data fusion and effectively make accurate assessments of the overall safety status of bridge structures is one of the most important issues in the field of bridge safety. Therefore, it is necessary to further research and develop existing condition assessment methods.
To sum up, numerous studies have been conducted on bridge health monitoring and condition assessment by domestic and foreign scholars, but there are still some deficiencies. The relatively well-established health monitoring systems worldwide focus on suspension bridges and cable-stayed bridges, while the health monitoring measurement points for existing urban bridges are relatively scarce. Further research is needed on how to accurately assess the overall condition of concrete continuous girder bridges by effectively using existing monitoring data. To solve the problem of state evaluations of small- and medium-span bridges such as concrete continuous girder bridges, this work developed an extended model based on game theory. The combined weighting–fuzzy hierarchical comprehensive evaluation model was constructed by using the combination of the analytic hierarchy process and the entropy weight method, which was corrected using the BP neural network. A three-span prestressed concrete continuous girder bridge in Wuhan was evaluated using health monitoring data and manual inspection information and compared to the results obtained using the traditional methods. This extended model can further improve the condition assessment of concrete continuous girder bridges.
2. Condition Assessment Extended Model
There are various models for the state assessment of bridges due to its complex structure, mainly including the analytic hierarchy model and fuzzy comprehensive model [18,19,20,21,22]. The analytic hierarchy model is one of the most commonly used methods of a state evaluation, which divides each component of the bridge by level and evaluates the complex bridge by classification, while its determination of the index weight is too dependent on experts’ subjective will. The fuzzy comprehensive model has the advantages of a simple model, clear process, and being easy to master, which is suitable for the complex multi-level problem of overall bridge evaluation. The two evaluation models are combined to establish an extended model in this work based on game theory for better reflecting the real bridge state.
2.1. Analytic Hierarchy Model (AHM)
The analytic hierarchy model covers its establishment, judgment matrix construction, and consistency check. The hierarchical structure model is constructed according to the attributes of each element by analyzing each assessment element of the bridge state assessment. The evaluation elements are divided into several levels according to attributes, where one level has a dominant position over another level and the other level is controlled by a higher level. The upper level and the next level are not in a specific relationship between domination and domination, and some elements of the next level cannot be dominated by elements of the upper level. There is an obstacle in the comparison calculation of the judgment matrix when there are more than nine elements in each level.
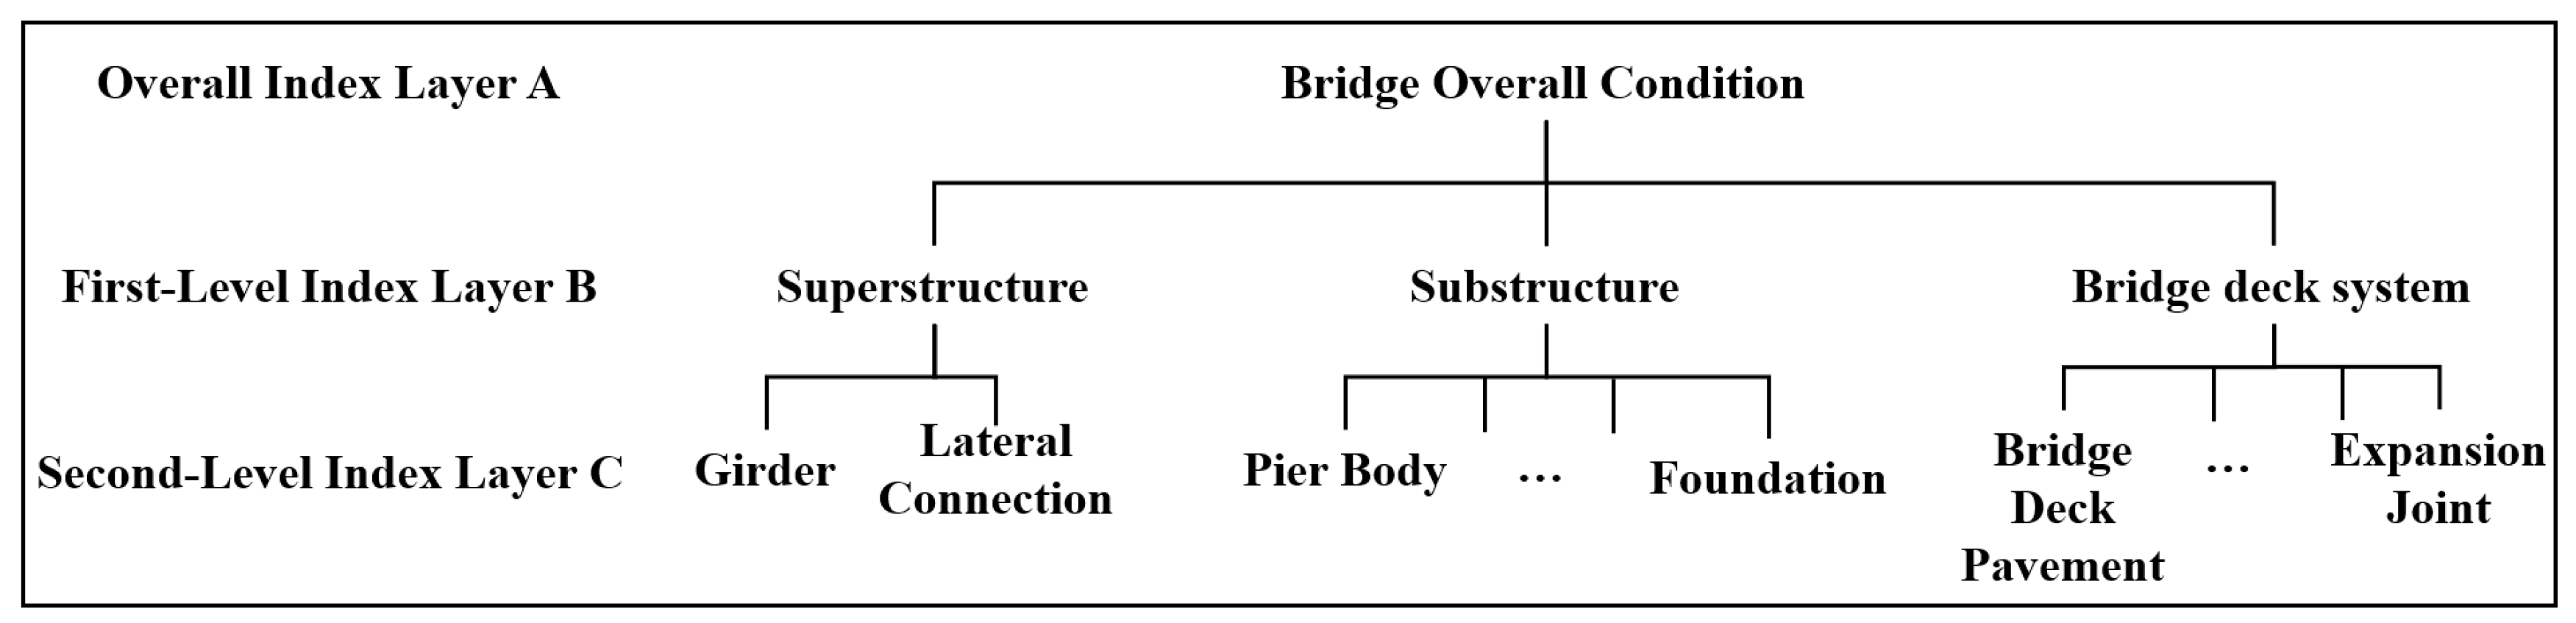
For the condition assessment of concrete continuous girder bridges, the overall index A represents the overall bridge condition. The evaluation indices are divided into the superstructure, substructure, and bridge deck system, forming the first-level index layer B. Within the first-level indices, the evaluation indices of the superstructure are further divided into girders and lateral connections, while other first-level indices are determined by other evaluation indices, thus forming the second-level index layer C. If necessary, the third-level index layer D, fourth-level index layer E, and so on can be established following the same pattern (Figure 1).
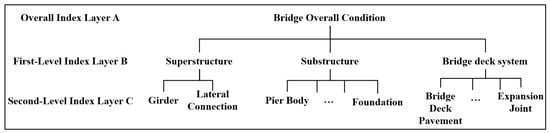
Figure 1.
Hierarchical structure division for condition assessments of concrete continuous girder bridges.
After establishing the model, judgment matrix construction should be executed. Taking the relationship between the overall index layer A and the first-level index layer B as an example, the judgment matrix for the first-level layer B can be represented as shown in Table 1.

Table 1.
Judgment matrix for first-level layer B.
In the matrix, bij represents the proportional scale of the importance of factor Bi to factor Bj. Currently, the widely used method is the nine-point scale, and the specific meanings are shown in Table 2.
Table 2.
Proportional scale of the relative importance.
To determine the weights of the indicators, four experts were invited to score the indicators on a percentage basis according to their importance. For the indicators under the substructure and deck system layers, the scores were referenced and adjusted by “Expert 5” in accordance with the “Technical Specifications for Maintenance of Urban Bridges”. This approach helps to identify which part is more important based on the consensus of expert opinions. The overall condition of the bridge is relatively complex, and the expert cognition is subjectively unstable due to various influences. The judgment matrix constructed may not be consistent. Hence, the consistency test of the model is needed. Consistency checks can proceed after the establishment and judgment matrix construction of the model. The consistency index (CI) can be calculated using Equation (1):
where CI = 0 indicates complete consistency; the further CI deviates from 0, the worse the consistency. The random index (RI) for a single-level judgment matrix varies with the order n of the matrix, and its values are shown in Table 3.
Table 3.
RI values for different matrix orders.
The consistency ratio (CR) can be calculated using Equation (2):
where CR ≤ 0.1 indicates that the matrix meets the condition of complete consistency; if CR > 0.1, corrections are required until passing the test.
The analytic hierarchy process (AHP) is highly dependent on expert opinions and, thus, has a strong subjective nature, making it difficult to be fully convincing. In contrast, the entropy weight method (EWM) is an objective approach based on mathematical principles. However, it often overlooks subjective preferences, potentially leading to results that deviate significantly from reality.
2.2. Entropy Weight Model (EWM)
The concept of entropy first appeared in thermodynamics and was later introduced into information theory as a measure of information. The EWM is an objective weighting method that utilizes the amount of information provided by the entropy value of indices to determine weights, which can ensure that the established indices reflect most of the original information, thereby making the evaluation results more scientific and reasonable.
(1) The specific steps to determine indices using the EWM are shown below: (1) Construct the decision matrix, i.e., given m evaluation objects and n evaluation indices, an m-by-n decision matrix X can be constructed, where xij represents the value assigned to the jth evaluation index by the ith evaluation object.
(2) Standardize the decision matrix, i.e., the matrix X is standardized based on the nature of the indices to eliminate the influence of the index dimension. The benefit index can be calculated using Equation (4):
Furthermore, the cost index can be calculated using Equation (5):
where max(xj) and min(xj) are the maximum and minimum values of the jth evaluation index.
(3) Calculate the characteristic proportion pij of the ith evaluation object under the jth index:
(4) The entropy value ej of the evaluation index can be calculated using Equation (7):
(5) The difference coefficient dj of the evaluation index can be calculated using Equation (8):
A larger dj corresponds to a larger amount of information and, accordingly, a larger weight value of the evaluation index.
(6) The entropy weight of the evaluation index can be determined using Equation (9):
2.3. Extended Model
The AHM is highly subjective and may not be fully convincing. The EWM is mathematically rigorous and can often ignore the will of decisionmakers, thus leading to significant deviations from reality. The AHM and EWM are combined with Nash equilibrium as the coordination goal based on game theory in this work. The evaluation model constructed in this paper is capable of integrating health monitoring and manual inspection data, making it suitable for medium- and small-span bridges with sparse monitoring sensor layouts. For large-span bridges, this model can serve as a basis for optimizing sensor placement. When combined with manual inspection, it can further enhance the reliability of the assessment results. Through mutual comparison and coordination, an optimal result that takes both subjective and objective weights into account can be found. The specific steps for combination weighting based on game theory are described below.
(1) Construct the linear combination of weight vectors
Let the weight values obtained from AHM and the EWM be w1 and w1, respectively. The linear combination is expressed as
where q1 and q2 are the linear combination coefficients.
(2) Determine the Objective Function
To minimize the deviation, the optimal weight can be obtained. Therefore, the objective function is defined as
(3) Solve for the optimal combination coefficients
By taking the first derivative of F(X), a linear equation system can be derived for the optimal combination coefficients:
The optimal combination coefficients r1* and r2* are obtained by solving this equation system. These coefficients are then normalized:
(4) Calculate the Combined Weights
The loss function used for training the BP neural network is the mean relative error (MRE) function, defined as
:
the measured value of the ith sample.
:
the predicted value of the ith sample.
3. Engineering Practice
3.1. Project Overview
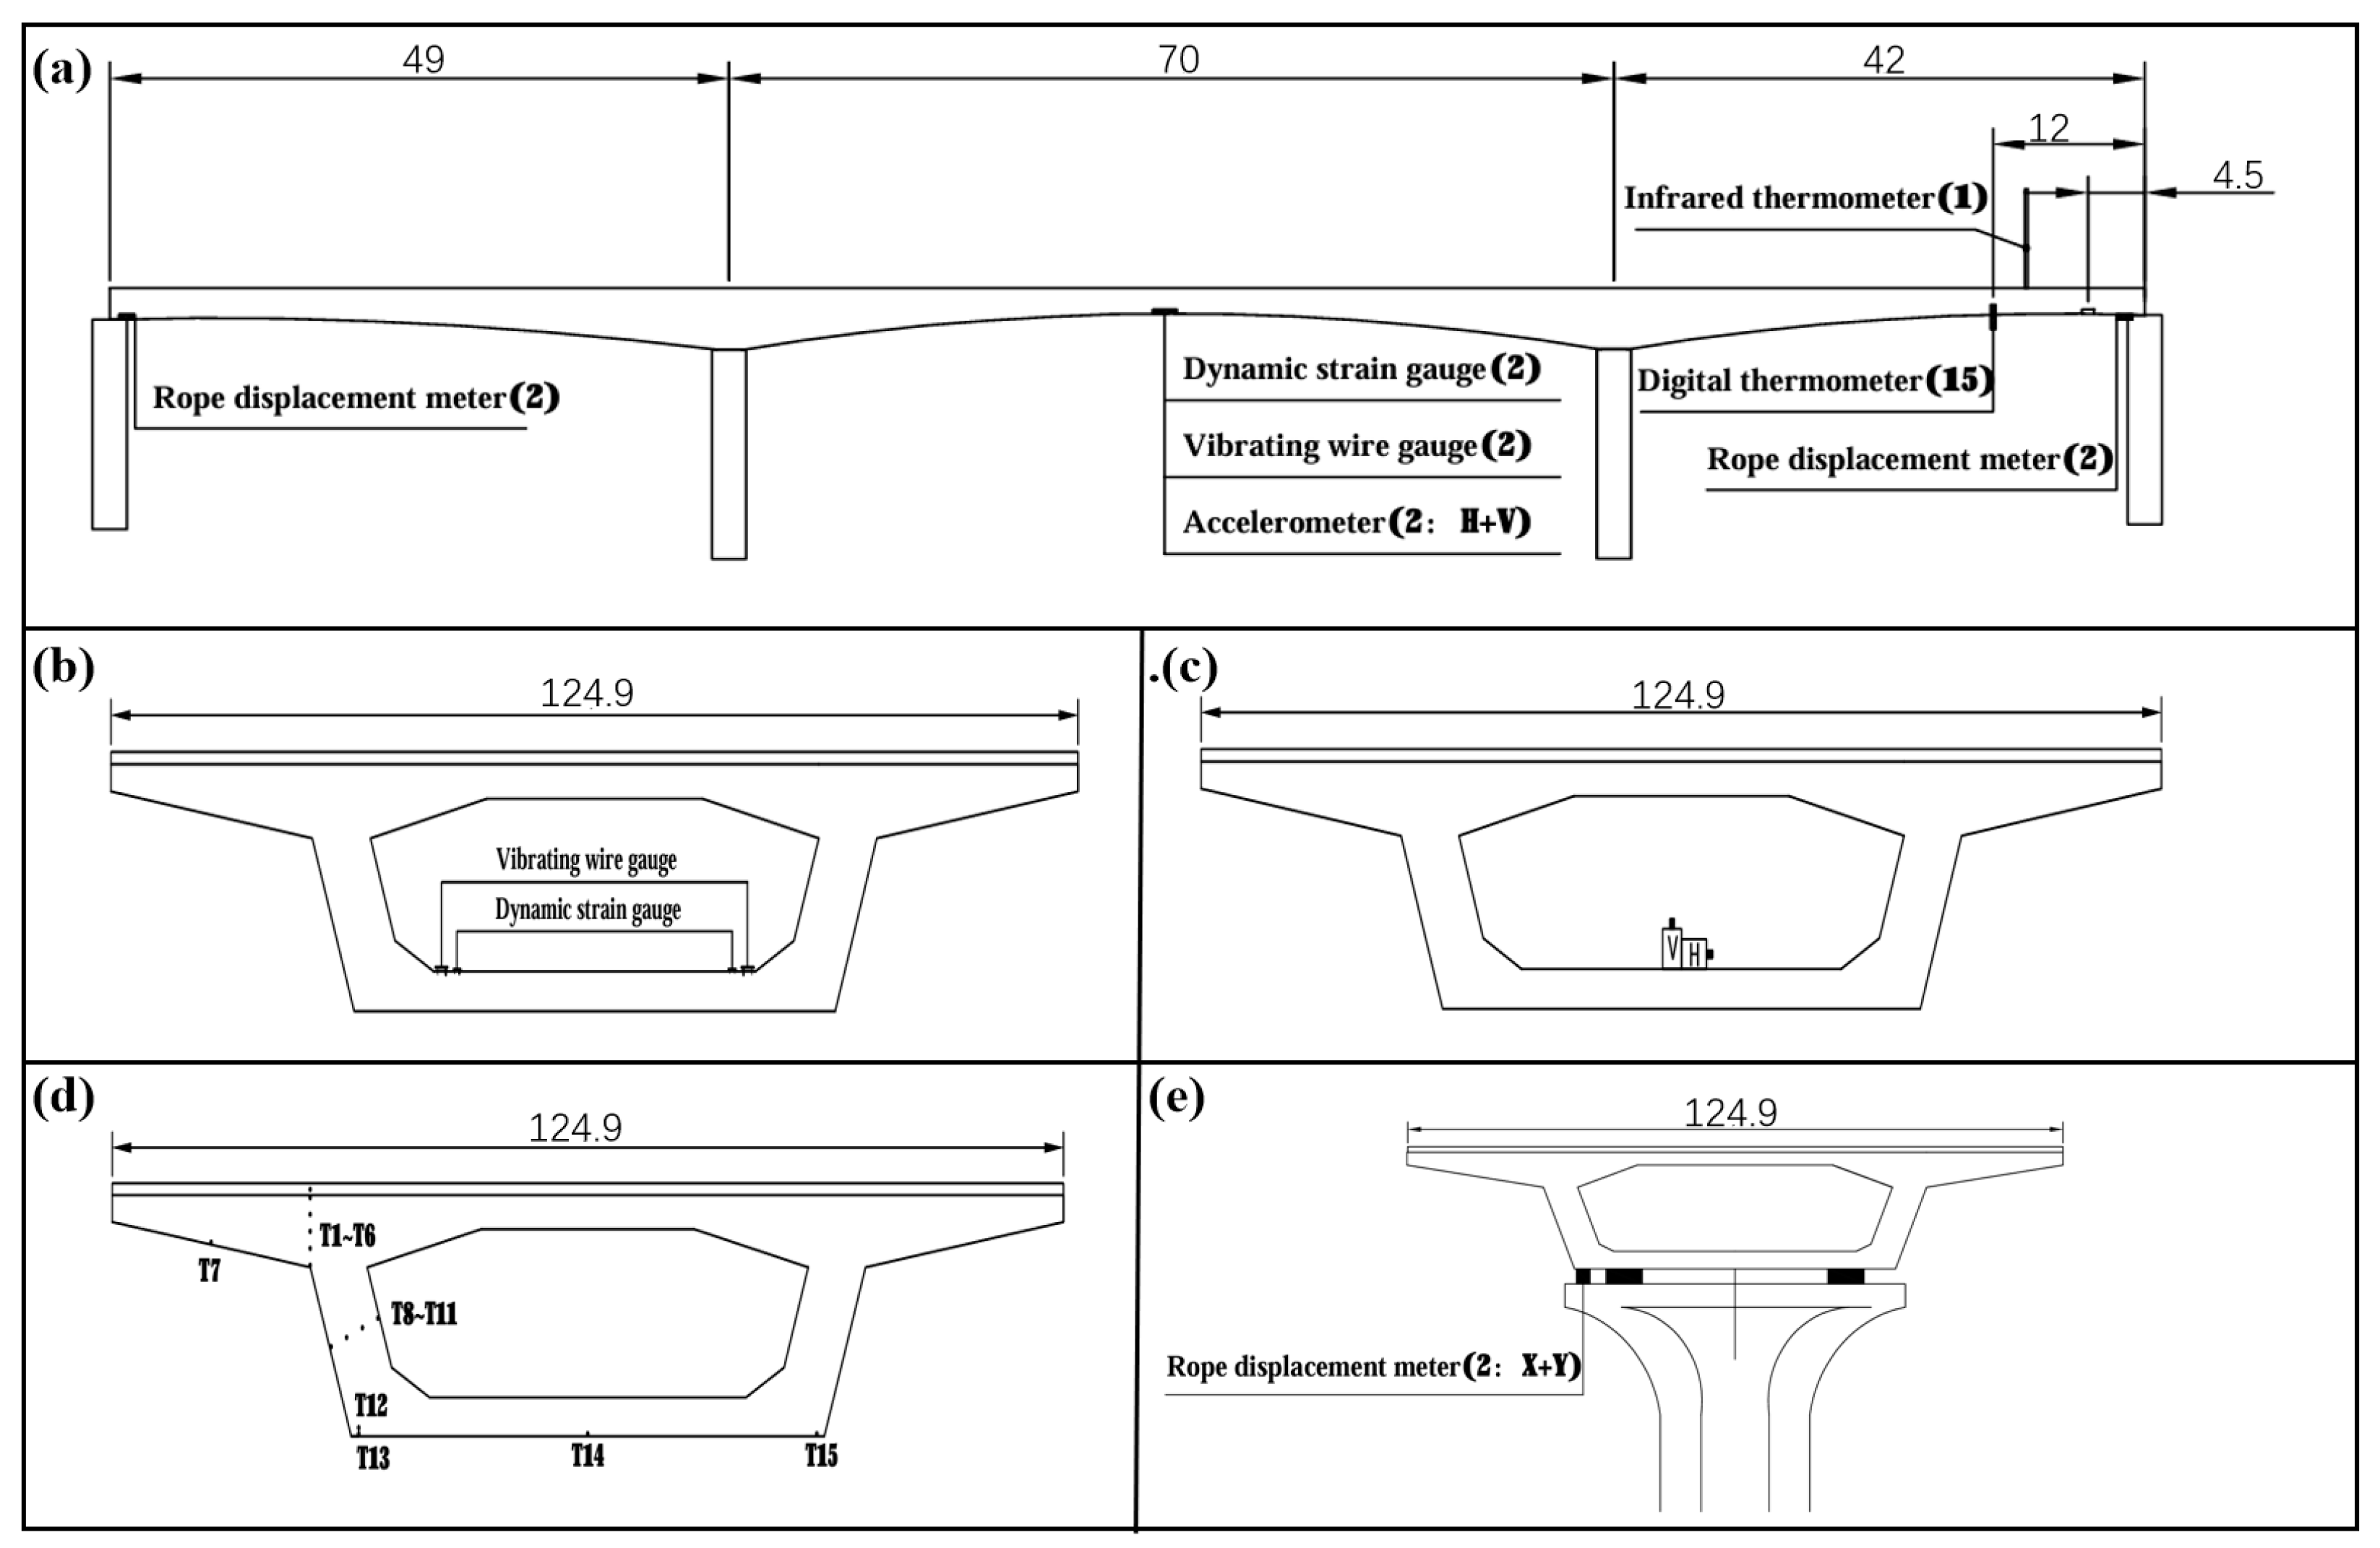
A three-span prestressed concrete variable cross-section continuous girder bridge in Wuhan City has a total length of 161m (49 m + 70 m + 42 m). The concrete strength grade of the upper box girder is C50 and that of the pier columns is C40. GCPZ pot rubber bearings are used as the support system. The top slab of the box girder is 12.49 m wide, the cantilever is 2.5 m long, the end of the top slab cantilever is 22 cm thick, and the root of the cantilever is 70 cm thick. The bottom slab thickness varies from 32 cm at the mid-span to 70 cm at the root, while the top slab thickness remains unchanged at 28 cm. The web thickness varies from 50 cm to 70 cm from the mid-span to the root. The girder height is 2.0 m at the side support and 4.0 m at the central support. The height of the box girder and the thickness of the bottom slab vary according to a quadratic parabola. The top of the box girder is designed with a unidirectional cross-slope, while the bottom slab is horizontal.
The data used in this study were collected from 1 May 2021 to 30 June 2021, including static strain data, pier–beam relative displacement data, dynamic strain data, and vibration data. The static strain data were collected using vibrating wire strain gauges at 2 measurement points, the pier–beam relative displacement data were collected using draw-wire displacement transducers at 4 measurement points, the dynamic strain data were collected using dynamic strain gauges at 2 measurement points, the vibration data were collected using accelerometers at 2 measurement points, and the temperature data were collected using digital thermometers at 15 measurement points. The key parameters included the objective function and optimal combination coefficients for the game theory-based combined weighting, the layout of each level of the model, and the membership functions for each monitoring indicator. Before being applied to the model, the data underwent preprocessing using an improved boxplot method based on Lagrange interpolation to eliminate and impute outliers. In accordance with the “Technical Standard for Maintenance of Urban Bridges” (CJJ 99-2017), the technical condition of bridges is determined using the bridge condition index (BCI).
3.2. Monitoring Scheme
Based on the specific investment and corresponding requirements, this concrete continuous girder bridge has been monitored regarding atmospheric temperature, cross-section temperature, relative displacement between piers and girders, acceleration, dynamic strain, and static strain. The specific layout is shown in Figure 2.
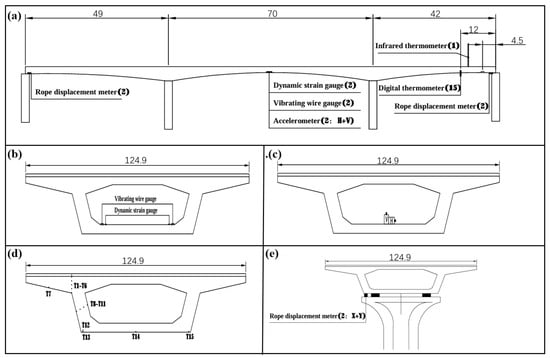
Figure 2.
Establishment of the baseline finite element model: (a) vertical layout of the measurement points (unit: m), (b) cross-section layout of the strain measurement points (unit: m), (c) cross-section layout of the vibration measurement points (unit: m), (d) cross-section layout of the temperature measurement points (unit: m), and (e) cross-section layout of the displacement measurement points (unit: m).
3.3. Initial Finite Element Model
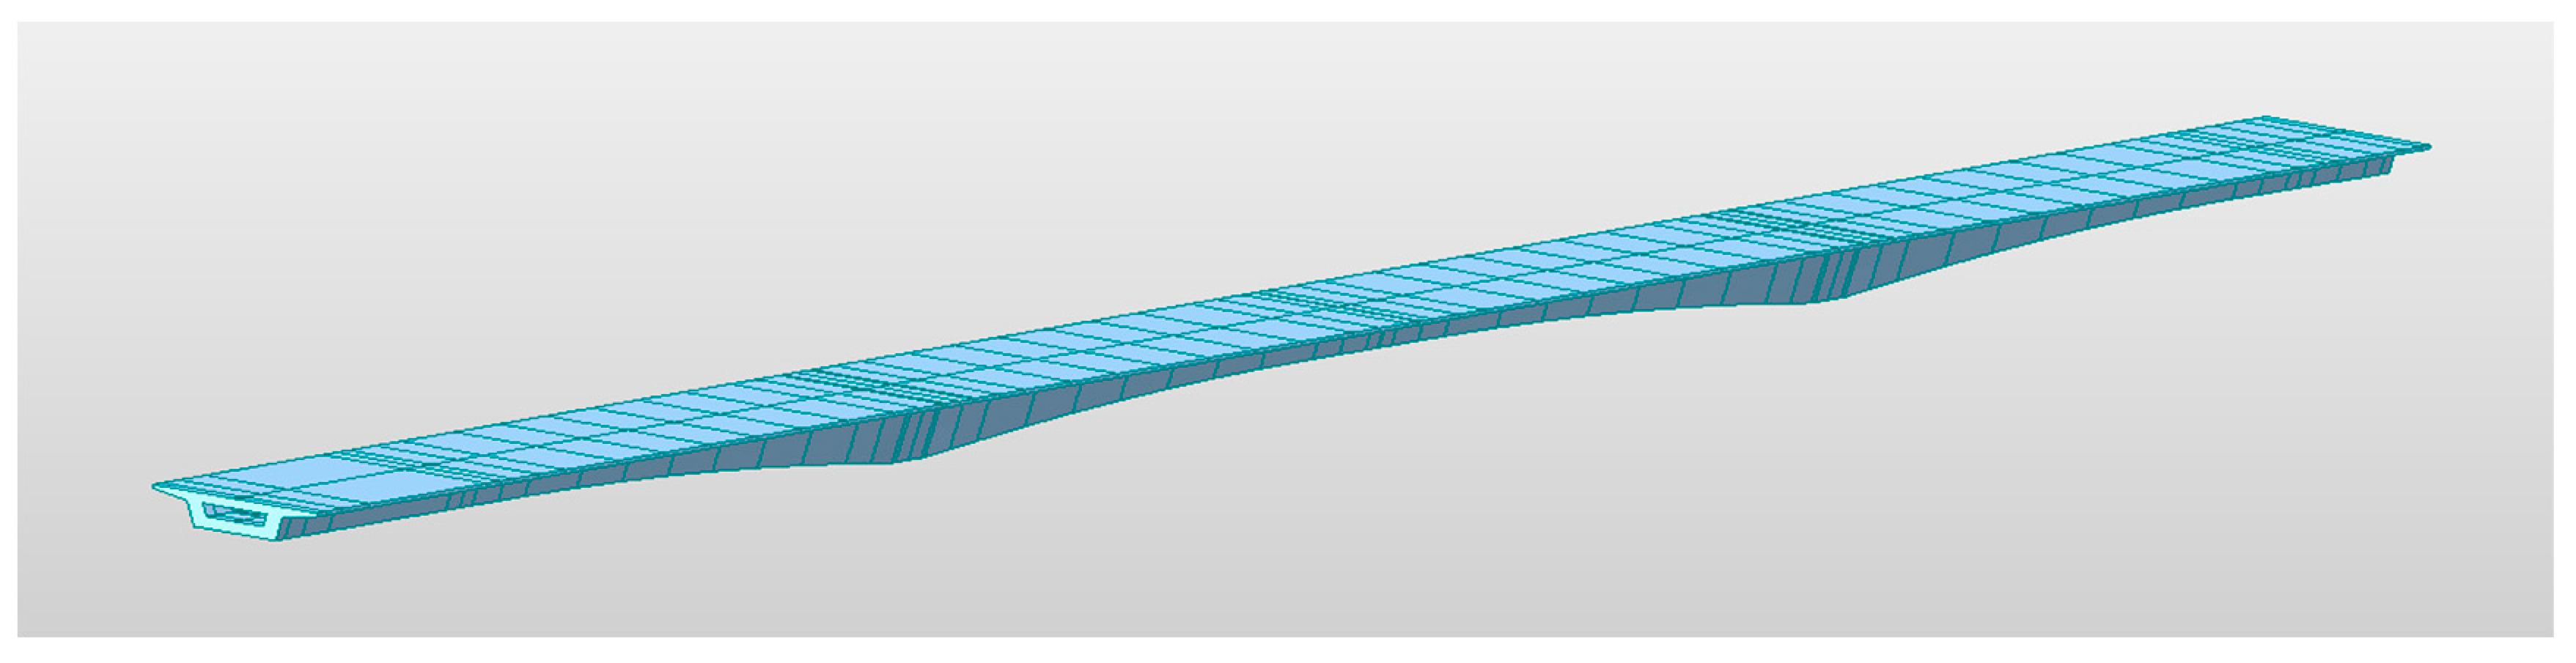
According to the bridge design documents and relevant specifications, the bridge is modeled using the general purpose finite element software Midas Civil. The full-bridge model employs girder elements, with a total of 50 nodes and 49 elements. Each element has two nodes, and the nodes are rigidly connected. The boundary conditions between the box girder and pier columns are simulated using hinges to mimic the support. Post-tensioning is used to simulate prestressing, and high-strength, low-relaxation stress steel strands are used as the prestressing tendons. The strand properties, initial stress, and prestress losses are all handled according to specifications, and a total of 452 prestressing strands are constructed. The dead load is applied by converting the weight of the box girder concrete into a load, and the secondary dead load is simulated using a uniformly distributed load. The load is converted into mass before the eigenvalue calculations to improve the computational accuracy. The initial design parameters for concrete and steel strands are shown in Table 4, and the model discrete diagram is shown in Figure 3. The author refined the initial finite element model based on a BP neural network. Compared to the original finite element model, the refined model exhibited calculated deflections and first-order frequencies at various sections that were closer to the measured values.
Table 4.
Initial design parameters.
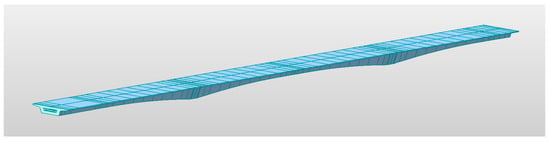
Figure 3.
Original finite element model.
3.4. Finite Element Model Correction
The modification of the finite element model is based on the results of dynamic and static load tests. By modifying some parameters of the finite element model, the calculated value of the model is consistent with the test value. According to the testing data, model revision can be divided into the dynamic finite element and static finite element. Based on the static load test and test results, the initial model is corrected with necessary and reasonable corrections. The test value is accurate, and the noise interference is less.
By referring to Reference [22], the finite element model is corrected using a BP neural network based on the bridge static load testing. The BP neural network was first proposed by D.E. Rumelhart and Mc Clelland, which is a kind of multi-layer forward neural network with a hidden layer and can solve the problem of the connection weight of a hidden unit in a multi-layer network. The BP neural network is based on the BP learning algorithm, which includes an input layer, hidden layer, and output layer. Among them, the input layer is the input end of the sample information, the hidden layer is the sample information processing end for simulating the calculation process, and the output layer is the output end of the result information. In theory, the three-layer BP neural networks can approximate any continuous function.
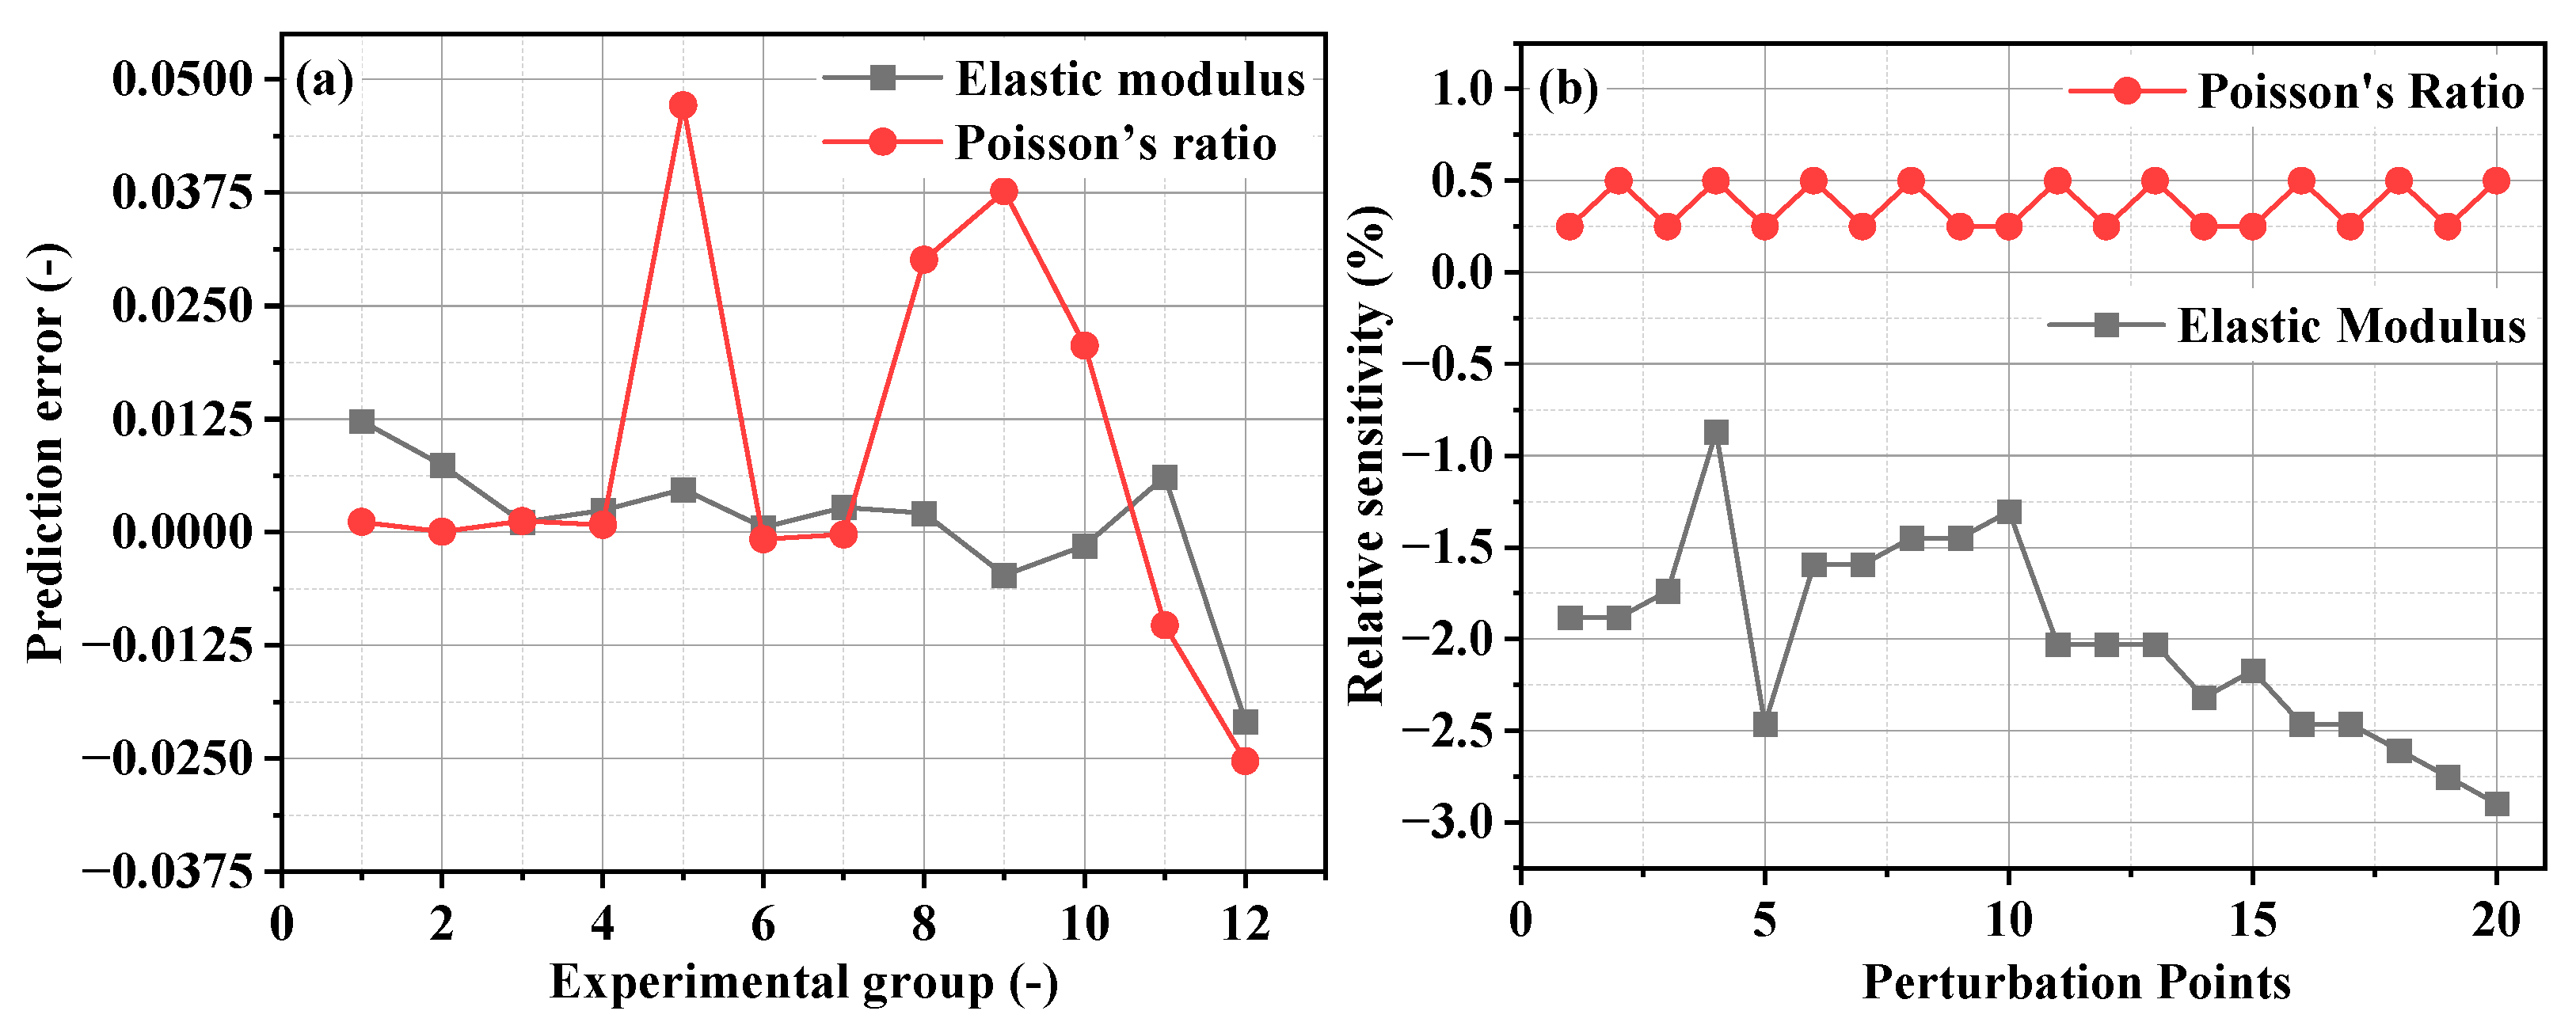
According to Reference [22], the elastic modulus (E) is set between 3.105 × 10⁴ MPa and 4.105 × 10⁴ MPa, and the Poisson’s ratio (u) is set between 0.100 and 0.267, which are homogenized, as shown in Table 5. The E value and u value of each test combination were input into the finite element model, and the deflection value of the corresponding working condition was obtained as the input sample of the BP neural network. The BP neural network training was realized by Matlab programming(Version 9.11), and the elastic modulus E and Poisson’s ratio u of the concrete were predicted and fitted. After 88 runs, the convergence requirements were met. The maximum relative error between the predicted value of E and the actual value was 0.021, and the maximum relative error between the predicted value and the actual value of u was 0.047, which met the requirements (Figure 4a).
Table 5.
Test combination parameter.
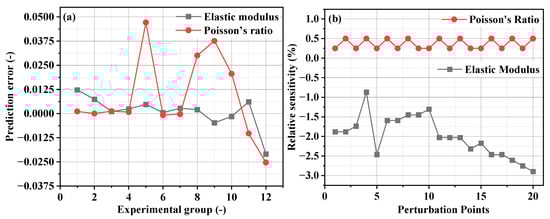
Figure 4.
(a) Prediction error of the BP neural network and (b) sensitivity analysis.
The sensitivity of the bridge parameters, such as the elastic modulus (E) and Poisson’s ratio (u), was calculated using the first-order difference method (Figure 4b). Similar to the case in Reference [22], the relative sensitivity of the elastic modulus E varies widely, and the relative sensitivity of the Poisson’s ratio u exhibits frequent numerical perturbations. Therefore, the elastic modulus E and Poisson’s ratio u are selected as the two parameters for finite element correction. After calculation, E = 4.098 × 10⁴ MPa and u = 0.112. This parameter combination is entered into the original finite element model to obtain the corrected finite element model. After the model correction, the calculated deflections of all the sections are closer to the measured deflections. To verify the accuracy of the correction, the first-order frequencies before and after the correction are compared. The measured first-order frequency is 1.855 Hz, the first-order frequency of the original model is 1.522 Hz, and the first-order frequency of the corrected model is 1.688 Hz. The error is reduced from 17.95% to 9.00%. The first-order frequency of the corrected model is closer to the measured value, indicating the accuracy of the correction.
4. Results and Discussion
4.1. Establishment of the Overall Evaluation Criteria
Based on the Technical Standard of Maintenance for City Bridge (C JJ99-2017), the overall condition evaluation criteria for prestressed concrete variable-section continuous girder bridges are determined according to the final score D. When 100 ≥ D ≥ 90, the bridge is classified as Class I, requiring normal maintenance only; when 90 > D ≥ 80, it is classified as Class II, necessitating minor repairs to address minor damage and preventive maintenance; when 80 > D ≥ 66, it falls into Class III, requiring medium repairs to periodically reinforce general or local damage areas; when 66 > D ≥ 50, medium repair is also needed to address more significant damage, regularly monitor the damaged areas, and carry out load tests for speed limit determination; if D < 50, the bridge requires major repairs, immediate shutdown for comprehensive remediation, and partial improvement or individual addition within the original technical level. The bridge’s overall condition evaluation criteria are presented in Table 6.
Table 6.
Overall bridge condition evaluation criteria.
4.2. Establishment of the Fuzzy Hierarchical Model
In the early stage, the development of bridge structure health monitoring systems lagged, and the construction of evaluation index systems relied heavily on manual inspection indices. As bridge structure health monitoring systems mature gradually, the construction of evaluation index systems tends to focus on health monitoring. However, existing index systems often subjectively segregate manual inspection and health monitoring, relying solely on one type of condition information for evaluation. For concrete continuous girder bridges, which are mostly medium-to-small-span structures with limited investment, the number of health monitoring measurement points deployed is relatively small. Relying solely on health monitoring data for the evaluation will greatly reduce the accuracy of the evaluation model. Therefore, this paper integrates health monitoring indices with manual inspection indices to construct an evaluation index system and establish an overall evaluation model suitable for concrete continuous girder bridges, as shown in Figure 5.
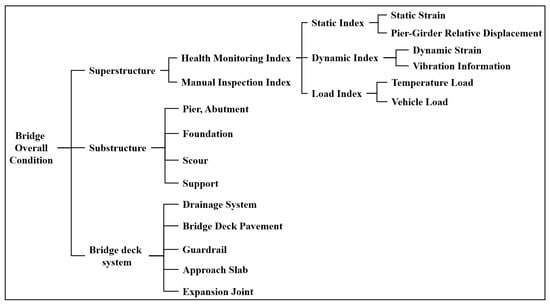
Figure 5.
Overall bridge evaluation model.
4.3. Determination of the Index Weights
The weights of the indices from the second to the fifth levels in the evaluation model are scored by inviting four experts on a 100-point scale based on importance. For the sub-indices under the substructure and bridge deck system layers, an “expert 5” is set up for correction concerning the Technical Standard of Maintenance for City Bridge. Firstly, the scores for the importance of each index are converted into a proportional scale of relative importance to construct a judgment matrix, and the AHM weights are calculated using the AHM method. Secondly, the importance scores of each index are normalized, and the EWM method is used to calculate the EWM weights. Finally, based on game theory with the goal of Nash equilibrium, the combined weights are obtained by combining the AHM weights and EWM weights. The AHM weights, EWM weights, and combined weights of each index are shown in Table 7, Table 8, Table 9, Table 10, Table 11 and Table 12. Among them, the maximum value of the consistency ratio (CR) of the AHM method is 0.06, which is less than 0.10, indicating that the consistency test is passed.
Table 7.
Weights of the second-level indices.
Table 8.
Weights of the sub-indices under the superstructure layer.
Table 9.
Weights of the sub-indices under the substructure layer.
Table 10.
Weights of the sub-indices under the bridge deck system layer.
Table 11.
Importance weights of the fourth-level indices.
Table 12.
Importance evaluation scores of the fifth-level indices.
The AHM weights of the sub-indices under the health monitoring index layer are calculated based on the strength reserve method, and the strength reserve of each measurement point is used to construct the judgment matrix [23,24,25]. For the strain measurement points, the corresponding stress maximum value is calculated from the extreme values in the monitoring data series, and the strength reserve is obtained by dividing it by the results of the finite element model. For pier–girder relative displacement measurement points, the strength reserve is obtained by dividing the extreme value in the monitoring data series by the limit value specified in the Technical Standard of Maintenance for City Bridge. For vibration measurement points, the strength reserve is obtained by dividing the extreme value in the monitoring data series by the limit value specified in the Ontario Highway Bridge Design Code. The EWM weights of the sub-indices under the health monitoring index layer are calculated based on the normalized monitoring data series, and the combined weights are obtained based on game theory with the goal of Nash equilibrium. The weights of the sub-indices under the health monitoring index layer are shown in Table 13.
Table 13.
Weights of the sub-indices under the health monitoring index layer.
4.4. Evaluation Analysis
4.4.1. Evaluation Results of the Bottom-Level Detection Indices
The bottom-level detection indices belonging to the superstructure, substructure, and bridge deck system are evaluated sequentially according to the evaluation formulas in the Technical Standard of Maintenance for City Bridge. The results are shown in Table 14.
Table 14.
Evaluation results of the bottom-level detection indices.
4.4.2. Evaluation Results of the Health Monitoring Indices
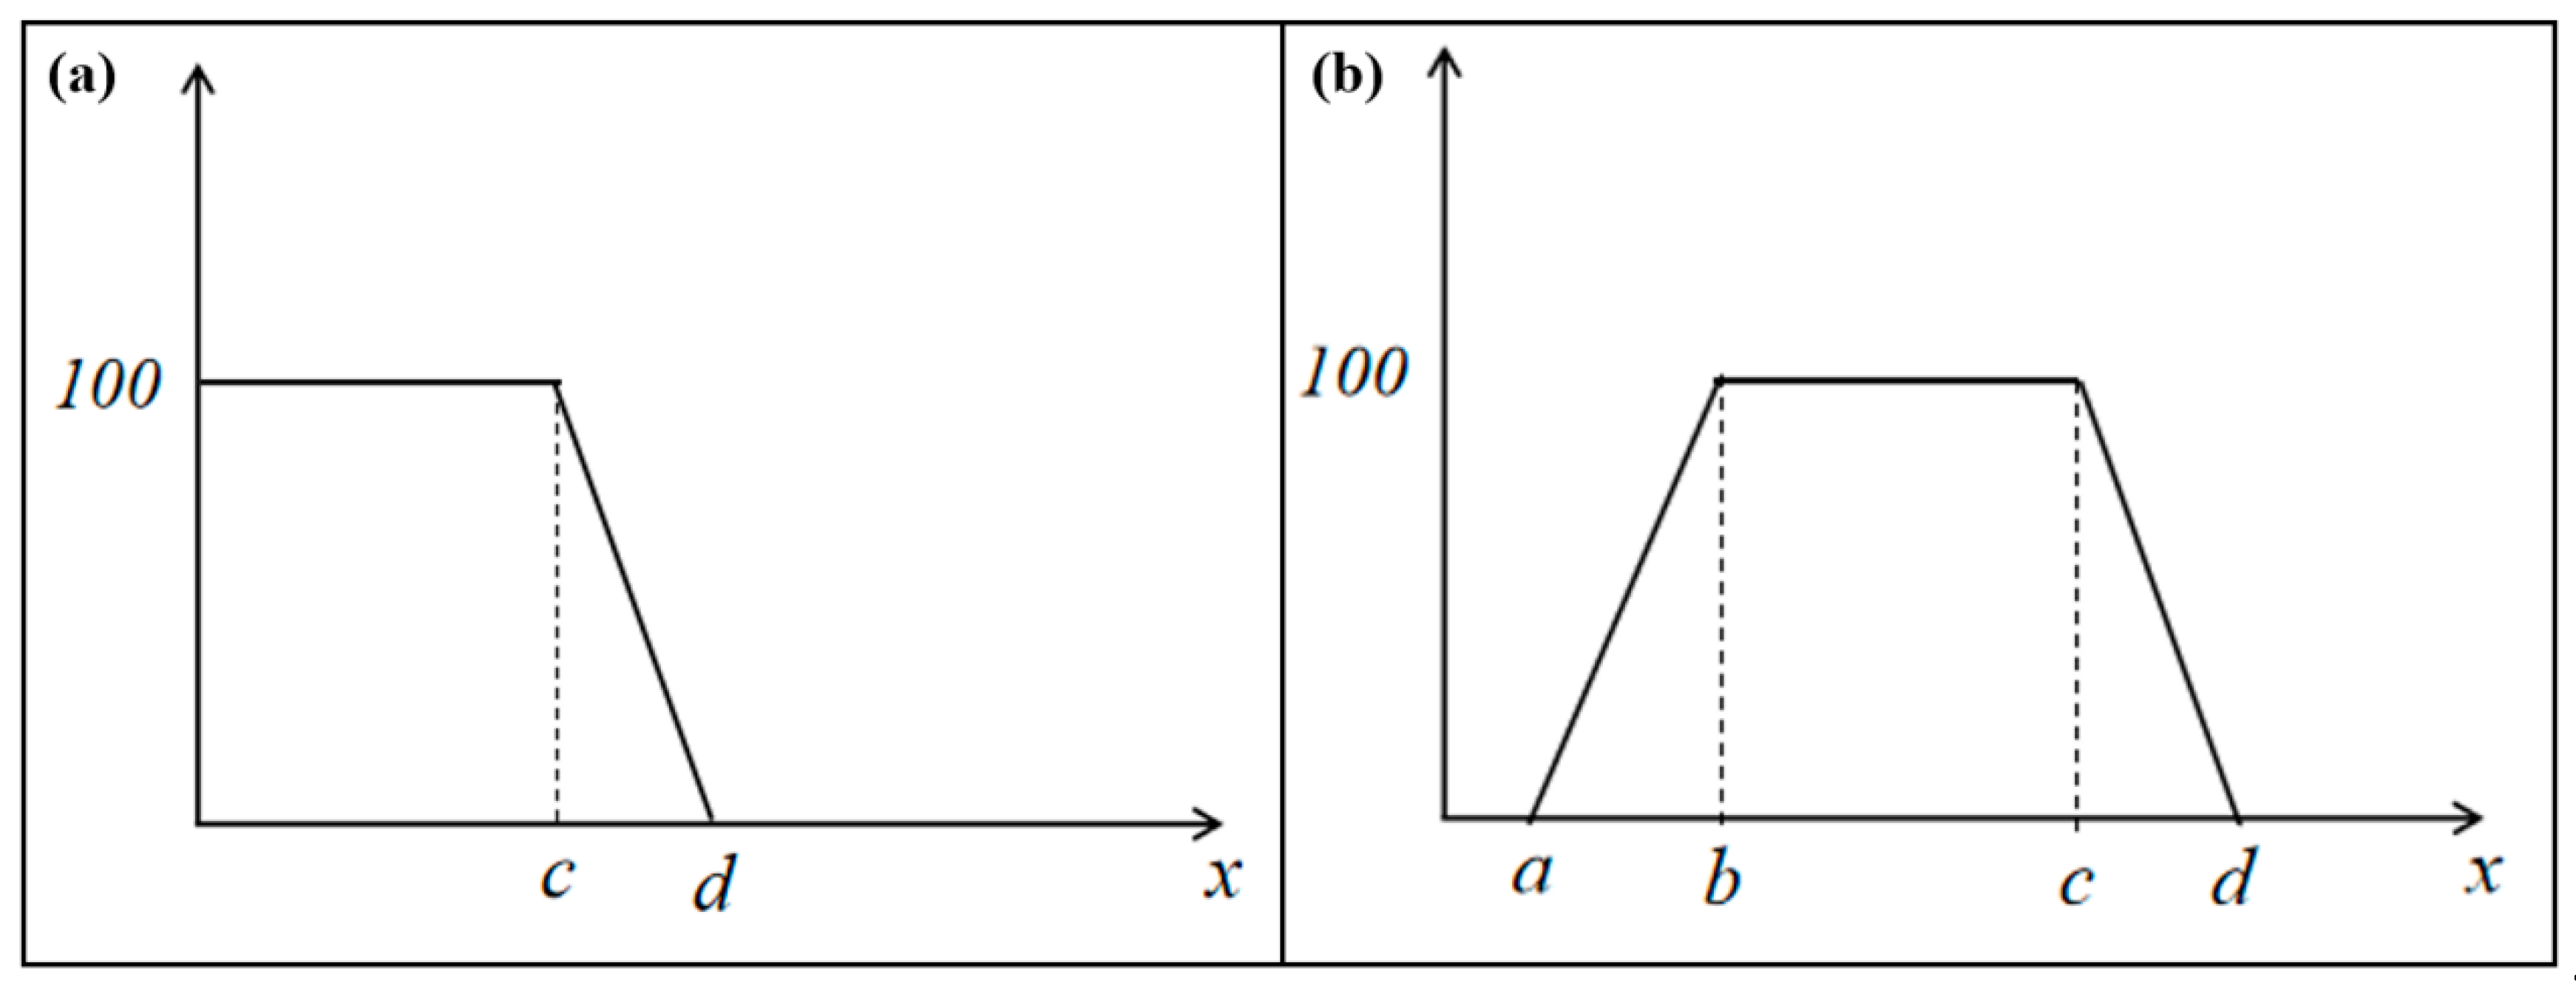
Due to limited funds, the bridge is not equipped with a vehicle weighing system, and the vehicle load index score is determined statistically. According to statistics, the bridge primarily accommodates small- and medium-sized vehicles, with few large vehicles, and traffic flows smoothly without congestion during the statistical period, resulting in a vehicle load evaluation score of 100 points. For the evaluation of health monitoring indices, an open left membership function is selected for the pier–girder relative displacement index, while a symmetric trapezoid membership function is chosen for the rest of the monitoring indices, as shown in Figure 6.
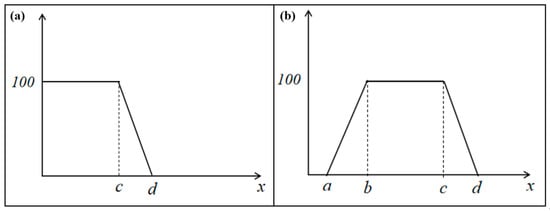
Figure 6.
Membership function: (a) a: open left and (b) b: symmetric trapezoid.
Among them are the limit parameters (a,d): The limits for the strain indices and pier–girder relative displacement indices are determined based on the finite element model calculations under the load combination (1.1 dead load + 1.3 shrinkage and creep + 1.3 temperature load + 1.3 vehicle load). The limit for pier–girder relative displacement is calculated according to 5L1/2 (where L is the main span length) specified in the Technical Standard of Maintenance for City Bridge. For vibration information indices, the corresponding frequency is obtained through the Fourier transform of the monitoring data series before evaluation, and the frequency limit is set at ±10% of the measured frequency value. The temperature load index limit is calculated concerning the General Code for the Design of Highway Bridges and Culverts. The values of the limit parameters for each monitoring index are shown in Table 15. The optimal value parameters (b,c): The vibration frequency is ±4% of the measured frequency value, while the rest of the indices are statistical values with a 95% confidence level within the corresponding time range. The monitoring data between 1 May 2021 and 30 June 2021 were selected for evaluation, and the evaluation results are presented in Table 14. Therefore, the total score of the health monitoring index layer is 91.41.
Table 15.
Detailed evaluation of the sub-indices under the health monitoring index layer.
4.5. Overall Condition Evaluation Results
The score values of the superstructure layer, substructure layer, and bridge deck system layer are 89.37, 90.75, and 88.45, respectively. The overall condition evaluation score D is 89.72, indicating a need for minor damage repair and preventive maintenance, with a focus on monitoring the longitudinal displacement at the pier top. By using the AHM model in the Technical Standard of Maintenance for City Bridge, the bridge scores 93.23 points. By applying the fuzzy comprehensive evaluation model, the bridge belongs to Category A. Compared with the results from these models, the evaluation results from the model constructed in this paper are not significantly different, demonstrating the reliability and applicability of the proposed method, which are worthy of further improvement and promotion.
In this work, the assessment was conducted on a three-span prestressed concrete continuous beam bridge. Using the AHP model from the “Technical Specifications for Maintenance of Urban Bridges”, the bridge scored 93.23 points. Using the fuzzy comprehensive evaluation model, the bridge was classified as Category A. However, using the combined weighting–fuzzy hierarchical comprehensive evaluation model based on game theory presented in this paper, the bridge scored 89.37 points. The differences in the assessment results from these methods illustrate the impact of weights on the final outcomes. When the scores of each part of the bridge remain unchanged, the final assessment result depends on the magnitude of the weights assigned to each part.
The evaluation model constructed in this paper can take into account both health monitoring and manual inspection and coordinate the subjective and objective weights. Compared with the results of the analytic hierarchy process and the fuzzy comprehensive evaluation method, it is reliable and applicable and deserves further promotion and validation. At present, numerical simulation calculations are needed to obtain reliable assessment limits for the monitoring indicators. In subsequent research, a wide range of experts and scholars can be invited to evaluate the importance of each bridge component and to establish a numerical model library, so as to determine unified and standardized assessment indicators and limits, simplify the assessment process, and further promote its application.
Due to the limited time and expertise of the authors, as well as insufficient engineering conditions, this study has only assessed a concrete continuous beam bridge in Wuhan. Future work could involve surveys of concrete continuous beam bridges in different regions and of various types. By inviting experts to evaluate the importance of bridge components and establishing a numerical model library, it would be possible to determine the unified and standardized assessment criteria and limits. This approach would simplify the assessment process and facilitate broader applications.
5. Conclusions
In this paper, a combined weighting–fuzzy hierarchical comprehensive evaluation method based on game theory was developed by combining monitoring data with manual inspection and applied to a three-span prestressed concrete continuous girder bridge in Wuhan. The main research findings are as follows:
(1) A finite element model is established according to the actual engineering conditions, and the model is corrected using the BP neural network based on the bridge static load test. After the model correction, the calculated deflections of each section are closer to the measured deflections, and the error between the first-order frequency and the measured frequency is reduced from 17.95% to 9.00%. The accurate model correction provides a reference for determining the index weights and evaluation limits.
(2) A combination weighting–fuzzy hierarchical comprehensive evaluation model was constructed based on game theory and the Nash equilibrium goal, which determined the overall evaluation criteria. This model can take into account both health monitoring and manual detection and coordinate subjective and objective weights.
(3) The combined weighting–fuzzy hierarchical comprehensive model was applied to a three-span prestressed concrete continuous girder bridge in Wuhan, which comprehensive score was 89.72. This indicates that the bridge needs to be repaired for minor damage and preventive maintenance. Compared to the results of the AHM model and EWM model, this extended model is reliable and applicable and deserves further improvement and promotion.
Author Contributions
Conceptualization, J.Y. and R.Q.; methodology, J.Y.; software, J.Y.; validation, J.Y., H.L. and J.T.; formal analysis, R.Q.; investigation, R.Q.; resources, R.Q.; data curation, J.Y.; writing—original draft preparation, J.Y.; writing—review and editing, J.Y.; visualization, Jun Tang; supervision, R.Q.; project administration, R.Q.; funding acquisition, R.Q. All authors have read and agreed to the published version of the manuscript.
Funding
This research was funded by [the National Program on Key R&D Project of China] grant number [2022YFE0210500] and Open Research Project of China-Pakistan Belt and Road Joint Laboratory on Smart Disaster Prevention of Major Infrastructures.
Data Availability Statement
Data available on request from the authors.
Conflicts of Interest
Author Jiali Yue was employed by the company Zhejiang Guangchuan Engineering Consulting Co., Ltd. And author Jun Tang was employed by the company QuakeSafe Technologies Co., Ltd. The remaining authors declare that the research was conducted in the absence of any commercial or financial relationships that could be construed as a potential conflict of interest.
References
- Su, H.; Guo, C.; Wang, Z.; Han, T.; Kamanda, D.B.; Su, F.; Shang, L. Research on safety condition assessment methodology for single tower steel box girder suspension bridges over the sea based on improved AHP-fuzzy comprehensive evaluation. Sci. Rep. 2024, 14, 12079. [Google Scholar] [CrossRef]
- Tu, J.; Liu, H.; Li, C.; Liu, P.; Duan, Y. Correntropy-induced weighted gan for bridge anomaly detection. IEEE Sens. J. 2024, 24, 5335–5346. [Google Scholar] [CrossRef]
- Karakostas, C.; Quaranta, G.; Chatzi, E.; Zülfikar, A.C.; Çetindemir, O.; De Roeck, G.; Döhler, M.; Limongelli, M.P.; Lombaert, G.; Apaydın, N.M.; et al. Seismic assessment of bridges through structural health monitoring: A state-of-the-art review. Bull. Earthq. Eng. 2024, 22, 1309–1357. [Google Scholar] [CrossRef]
- Deshan, S.; Lingfeng, L.; Qiao, L. State-of-the-art review of the bridge health monitoring in 2019. J. Civ. Environ. Eng. 2020, 40, 115–125. (In Chinese) [Google Scholar]
- Li, C.; Chen, F.; Wang, D.; Lu, B.; Peng, W. Flexural behavior and ultimate capacity of adjacent box girders with expansion joint in the parapet. J. Bridge Eng. 2022, 36, 04022070. [Google Scholar] [CrossRef]
- Peng, W.; Tang, Z.; Wang, D.; Cao, X.; Dai, F.; Taciroglu, E. A forensic investigation of the Xiaoshan ramp bridge collapse. Eng. Struct. 2020, 224, 111203. [Google Scholar] [CrossRef]
- Mehrabi, A.B. In-Service evaluation of cable-stayed bridges, overview of available methods and findings. J. Bridge Eng. 2006, 6, 716–724. [Google Scholar] [CrossRef]
- Sung, S.H.; Park, J.W.; Nagayama, T.; Jung, H.J. A Multi-scale sensing and diagnosis system combining accelerometers and gyroscopes for bridge health monitoring. Smart Mater. Struct. 2014, 23, 5–15. [Google Scholar] [CrossRef]
- Seo, J.; Hu, J.W.; Lee, J. Summary review of structural health monitoring applications for highway bridges. J. Perform. Constr. Facil. 2016, 30, 401–408. [Google Scholar] [CrossRef]
- Li, A.Q.; Miao, C.Q.; Li, Z.X.; Han, X.L.; Wu, S.D.; Ji, L.; Yang, Y.D. Health monitoring system for the Runyang Yangtse River Bridg. J. Southeast Univ. 2003, 5, 544–548. [Google Scholar]
- Miao, C.Q.; Li, A.Q.; Han, X.L.; Li, Z.X.; Ji, L.; Yang, Y.D. Monitor strategy for the structural health monitoring system of Runyang Bridge. J. Southeast Univ. 2005, 35, 126–131. [Google Scholar]
- Li, A.Q.; Ding, Y.L.; Fei, Q.G.; Miao, C.Q. Environmental variability in modal frequency identification of Runyang Cable-Stayed Bridge. J. Southeast Univ. 2007, 2, 245–250. [Google Scholar]
- Zhang, Q. Design Implementation and Application of Large Bridge Health Monitoring System. Master’s Thesis, Chang’an University, Chang’an, China, 2019. [Google Scholar]
- Yu, C.; Zhang, G.; Zhao, Y.; Liu, X.; Ding, X.; Zhao, T. Bridge monitoring and warning system based on digital measurement technology. J. Shandong Univ. 2020, 50, 115–122. [Google Scholar]
- Melhem, H.G.; Cheng, Y. Prediction of remaining service life of bridge decks using machine learning. Comput. Civ. Eng. 2003, 17, 1–9. [Google Scholar] [CrossRef]
- Stewart, M.G.; Val, D.V. Role of load history in reliability-based decision analysis of aging bridges. J. Struct. Eng. 2012, 125, 776–783. [Google Scholar] [CrossRef]
- Qin, J.D.; Fang, S.E.; Zhang, W. Super structure state evaluation of cable -stayed bridge using 3A indicators. J. Civ. Environ. Eng. 2020, 48, 69–75. [Google Scholar]
- Lomiento, G.; Bonessio, N.; Benzoni, G.; Phillippi, D.; Hegemier, G.A. Capacity assessment of V-shaped RC bridge bents. J. Bridge Eng. 2014, 19, 266–280. [Google Scholar] [CrossRef]
- Xie, H.; Wang, Y.; Wu, H. Condition assessment of existing RC highway bridges in China based on SIE2011. J. Bridge Eng. 2014, 19, 1040–1405. [Google Scholar] [CrossRef]
- Sangree, R.H.; Schafer, B.W. Field experiments and numerical models for the condition assessment of historic timber bridges: Case study. J. Bridge Eng. 2008, 6, 595–601. [Google Scholar] [CrossRef]
- Liu, X.; Wang, B.; Huang, Q.; Ren, Y. Condition assessment model for cable-stayed bridges based on evidence reasoning framework. J. South China Univ. Technol. 2020, 48, 69–75. [Google Scholar]
- Qi, X. Updating and Carrying Capacity Assessment of Bridge Finite Element Model Based on Bridge Load Test. Master’s Thesis, Shenyang Jianzhu University, Shenyang, China, 2018. [Google Scholar]
- Zhu, E.; Bai, Z.; Zhu, L.; Li, Y. Research on bridge structure SAM based on real-time monitoring. J. Civ. Struct. Health Monit. 2022, 12, 725–742. [Google Scholar] [CrossRef]
- Sun, Y.Q. Study on Early Warning and safety Assessment of Bridge Structure Based on Safety Monitoring Data. Master’s Thesis, Tsinghua University, Beijing, China, 2018. [Google Scholar]
- Li, X. Research on Health Monitoring and Evaluation of Long-Span and High-Pier Concrete Continuous Rigid Frame Bridge. Ph.D. Thesis, Chang’an University, Xi’an, China, 2019. [Google Scholar]

Disclaimer/Publisher’s Note: The statements, opinions and data contained in all publications are solely those of the individual author(s) and contributor(s) and not of MDPI and/or the editor(s). MDPI and/or the editor(s) disclaim responsibility for any injury to people or property resulting from any ideas, methods, instructions or products referred to in the content. |
© 2025 by the authors. Licensee MDPI, Basel, Switzerland. This article is an open access article distributed under the terms and conditions of the Creative Commons Attribution (CC BY) license (https://creativecommons.org/licenses/by/4.0/).