Article

Experimental Study on Axial Compression Behavior of Fiber-Reinforced Lightweight Aggregate Concrete Columns Confined by Grid Stirrups

School of Civil Engineering, Chang’an University, Xi’an 710061, China
*
Author to whom correspondence should be addressed.
Buildings 2025, 15(7), 1206; https://doi.org/10.3390/buildings15071206
Submission received: 12 March 2025 / Revised: 28 March 2025 / Accepted: 5 April 2025 / Published: 7 April 2025
(This article belongs to the Section Building Structures)

Abstract

In this study, thirteen axial compression tests were conducted on stirrup-confined fiber-reinforced lightweight aggregate concrete (SFLWAC) columns. The effects of stirrup spacing, fiber type, and fiber volume content on the confinement effect of concrete were analyzed. The failure process and failure modes were investigated. The stress–strain curve of columns and the characteristic points of the curve were examined, and prediction models for peak stress and strain were proposed. The results indicate that increasing the volumetric stirrup ratio effectively enhances the lateral confinement force and increases the area of confined concrete. For specimens with a low volumetric stirrup ratio, the stirrups do not fully utilize their strength when the confined concrete reaches peak strength. The addition of fibers effectively improves the brittleness of lightweight aggregate concrete, with steel fibers providing a more pronounced improvement than carbon fibers. The proposed prediction models can accurately predict the axial compression behavior of SFLWAC.

1. Introduction

With the rapid development of modern building structures towards the directions of high-rise, long-span, and composite designs, lightweight aggregate concrete (LWAC) has gained widespread application in engineering due to its lightweight, high strength, and excellent thermal insulation properties [1,2]. However, the substantial internal porosity and pronounced brittleness of LWAC limit its use and further promotion in engineering applications.
Incorporation of suitable fibers in LWAC is an effective way to enhance the toughness and ductility of concrete. Research on fiber-reinforced lightweight aggregate concrete (FLWAC) has shown that different fibers have varying impacts. The reinforcing effect of fibers on concrete is mainly influenced by factors such as the type of fiber, the dosage of fibers, the shape of fibers, and the curing conditions of the fibers and cement-based materials. At present, steel fibers are widely used in practical engineering projects. Li et al. [3] added steel and polypropylene fibers to LWAC to study flexural performance. Steel fibers outperformed polypropylene fibers in enhancing both initial and residual flexural strengths, with steel fibers predominantly influencing the pre-peak segment of the stress–strain curve. Ye et al. [4] explored the effects of different volume fractions of steel fibers on the compressive, splitting tensile, and flexural strengths of FLWAC. Microsteel fibers provided the best toughness under the same fiber content; end-hooked and corrugated steel fibers achieved approximately 67% and 50% of the toughness of microsteel fibers, respectively. Ombres et al. [5] studied the properties of fiber-reinforced cementitious matrix at high temperatures and found that temperature has an adverse effect on concrete. The addition of lightweight aggregates and fibers might exacerbate this issue due to their potential for greater porosity and varying thermal expansion rates. Hassanpour et al. [6] examined the influence of small-volume steel fibers under different curing conditions on the mechanical properties of LWAC. Increasing the steel fiber volume fraction from 0% to 1% significantly increased compressive, splitting tensile, and flexural strengths at 28 days. Other fibers have also been investigated. Divya et al. [7] studied the mechanical properties and durability of basalt fiber-reinforced LWAC. Although basalt fibers and lightweight aggregates reduced the slump of the mixture, they improved the splitting tensile strength and elastic modulus without affecting compressive strength. Ecemis et al. [8,9] studied the flexural and shear properties of concrete reinforced with fibers made from rubber-type waste tires. They found that the incorporation of these fibers would lead to a decline in the performance of the concrete. However, it could effectively improve the utilization rate of waste materials.
The adoption of stirrup confinement is a commonly utilized method to improve the bearing capacity and ductility of LWAC. Research on stirrup-confined lightweight aggregate concrete (SLWAC) has also been extensive. The main research parameters include the cross-sectional form of stirrups, the spacing of stirrups, and the reinforcement ratio, etc. Zivkovic et al. [10] conducted research on the performance of stirrup-confined high-strength LWAC beams and found that the stirrup spacing and the concrete cover thickness have a significant impact on their flexural performance. Baraa et al. [11] carried out research on the axial compression performance of steel bar-confined LWAC. The study found that steel bar reinforcement improved the mechanical properties of LWAC, enhancing the toughness and deformation capacity of the concrete. Wu et al. [12] completed the axial compression performance tests of square columns made of LWAC with various forms of stirrup confinement. They believed that the square spiral stirrups have an insignificant effect on enhancing the bearing capacity, while the composite stirrups can provide stronger lateral confinement, which can effectively improve the bearing capacity and ductility of the specimens. Qian et al. [13] studied the seismic performance of square columns made of stirrup-confined lightweight aggregate concrete. It was found that the failure mode of lightweight aggregate concrete columns could be improved, and the seismic performance of the concrete could be enhanced by reducing the stirrup spacing.
The incorporation of fiber reinforcement and stirrup confinement significantly enhances the performance of concrete. There is relatively little research currently available on stirrup-confined fiber-reinforced lightweight aggregate concrete (SFLWAC), and the experimental data is limited. Campione [14] reported that fiber inclusion enhanced energy dissipation capacity and residual strength, delayed concrete cover spalling in axially compressed short columns, and increased the strain at the stress peak. Haddad [15] found that at 400 °C, the strength and rigidity of short columns decreased significantly, but the peak stress and compressive toughness strain increased; adding steel fibers mitigated the loss of mechanical properties after heating. Wu et al. [16] pointed out that hybrid fibers have a good effect on improving the ductility of spiral stirrup-confined LWAC. When the volume fractions of both PF and CF are 0.4%, the improvement effect on the specimens is optimal. Overall, confining LWAC with both stirrups and fibers effectively enhances its performance. However, the comparative effects of different fiber types and stirrup configurations on LWAC remain unclear.
In this paper, 13 SFLWAC columns, incorporating both stirrup and fiber confinement effects, were subjected to axial compression tests. Focusing on the analysis of specimen cracking behavior, deformation patterns, and stress–strain curves, combined with the characteristic values of the curves, the effects of parameters such as fiber type, fiber content, and stirrup ratio on the axial compressive properties, especially the post-peak behaviors, were quantitatively evaluated to assess the confinement effect and plastic deformation capacity of the concrete. Additionally, the peak stress and peak strain models suitable for SFLWAC were established and validated, based on the stirrup confinement mechanism and fiber confinement effect. The results provide a theoretical basis and technical support for promoting the application of SFLWAC.

2. Experimental Program

2.1. Raw Materials

In this study, P.O. 42.5 ordinary Portland cement was used as the binder, and low-calcium fly ash served as the supplementary cementitious material, the chemical composition and fineness are provided in Table 1. The coarse aggregate consisted of grade 900 shale ceramsite, while river sand was employed as the fine aggregate. The physical properties of the aggregates are summarized in Table 2. Steel fibers (SF) and carbon fibers (CF) were incorporated to enhance the ductility of the lightweight aggregate concrete. The physical properties of the fibers are provided in Table 3. For longitudinal reinforcement, HRB 400 steel bars with a diameter of 10 mm were used, and HPB 300 steel bars with a diameter of 6 mm were employed for the stirrups. The characteristics of the steel bars are outlined in Table 4. Additionally, a BKS-199 polycarboxylic acid superplasticizer was added to improve the workability of the concrete mix, the dosage of superplasticizer was 0.6% by weight of the binder, and it was shown to provide a water reduction of 20%.

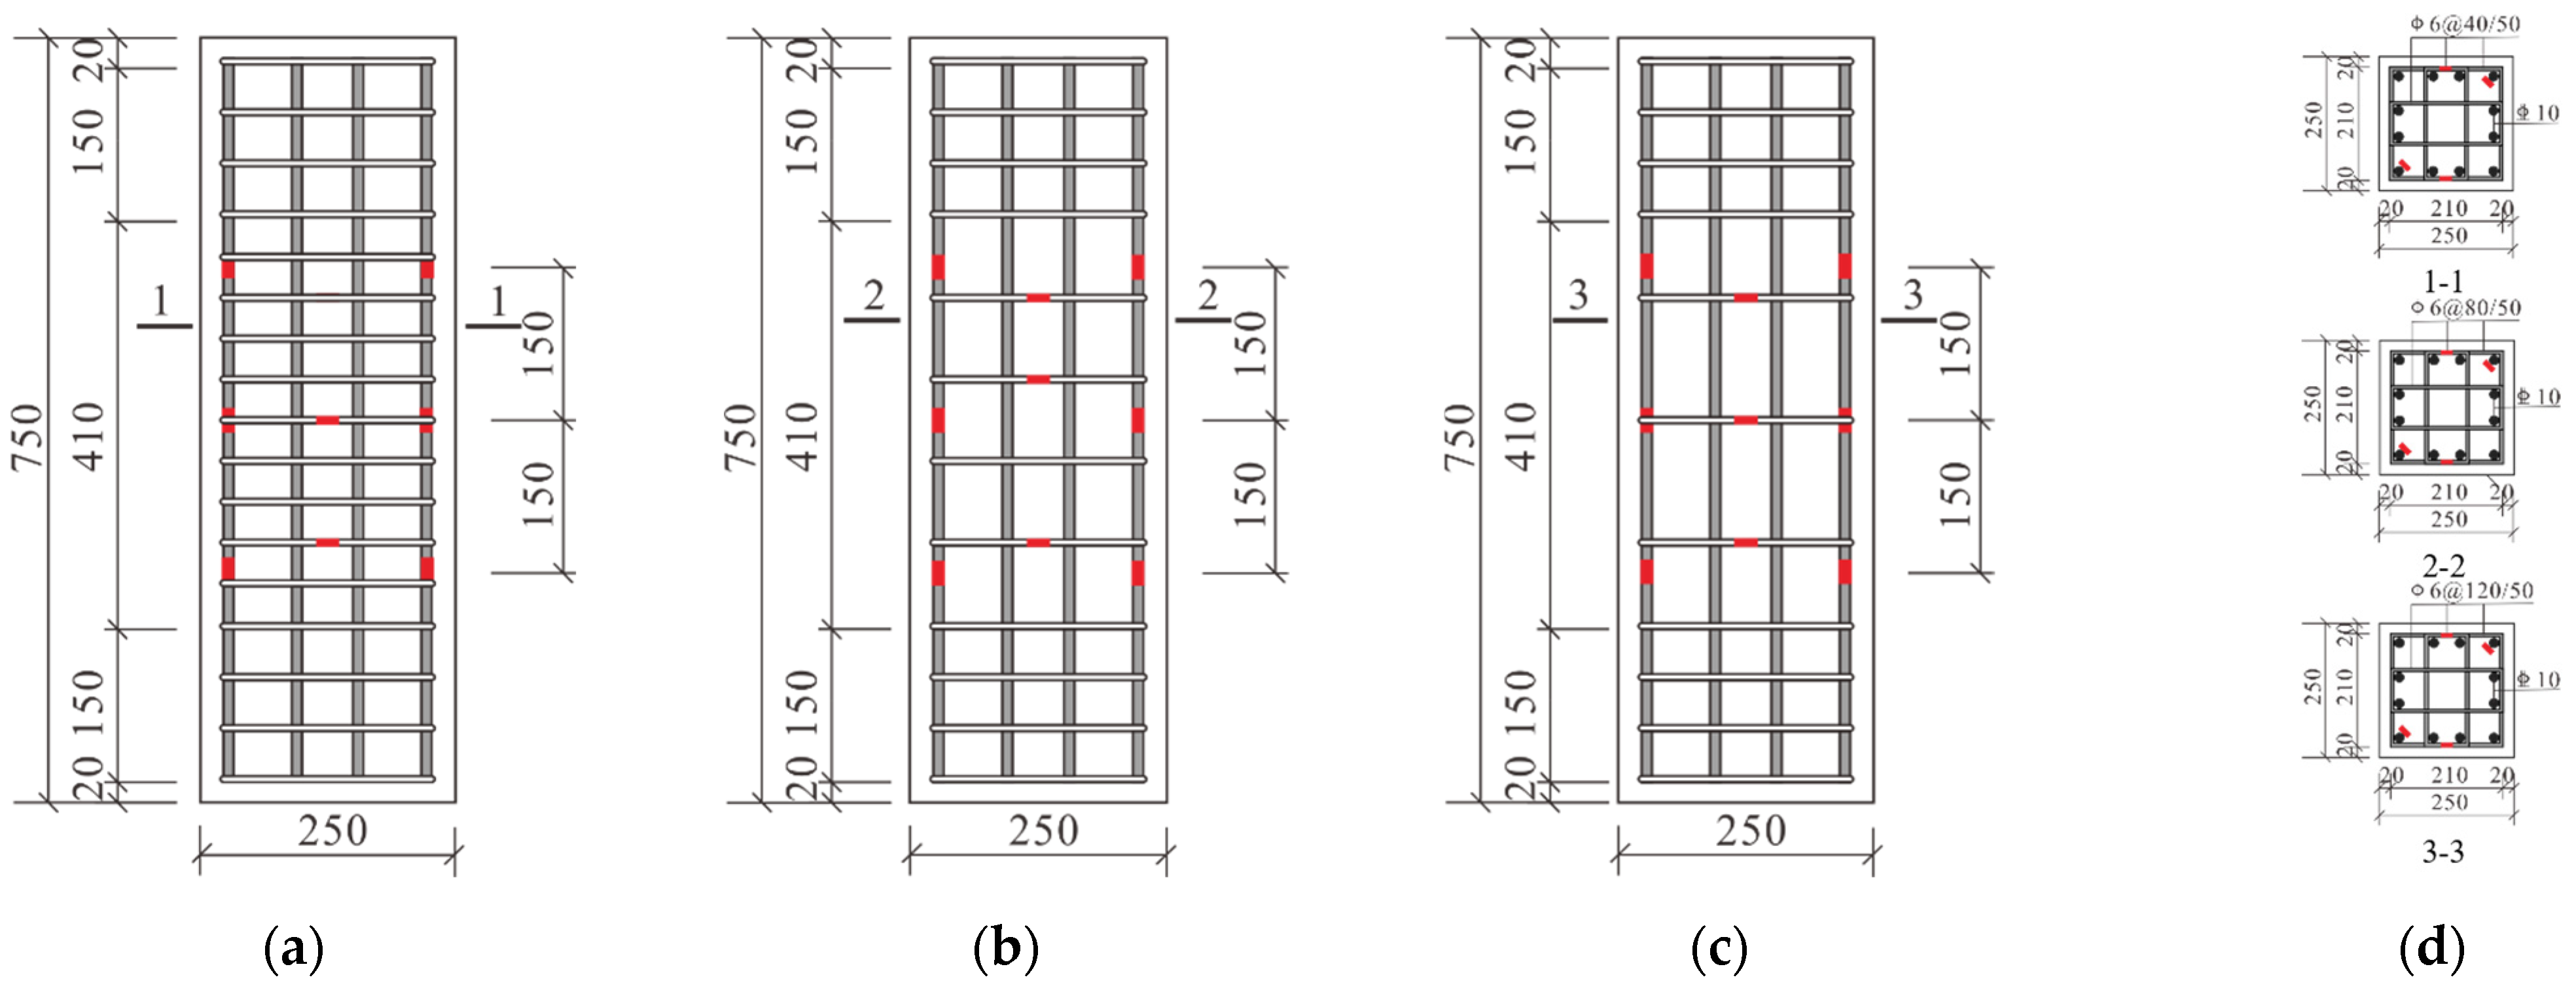
2.2. Specimen Design

To investigate the uniaxial compressive behavior of SFLWAC with varying fiber types, fiber contents, and stirrup spacing, thirteen specimens, each with dimensions of 250 mm × 250 mm × 750 mm, were designed. The specimens were prepared using LWAC with a compressive strength of 40 MPa. The concrete mix proportions are provided in Table 5. And, the fiber volume contents of the specimens were 0.3%, 0.6%, and 0.9%, respectively. This percentage was chosen based on previous studies [12,16,20,21] and pre-tests, ensuring a balance between enhancing the mechanical properties of the fiber-reinforced concrete and maintaining the mix’s workability. Fiber contents in this range have been shown to improve the toughness, crack resistance, and mechanical strength of concrete. To ensure the fibers can be uniformly distributed in the concrete, the test specimens were mixed using a forced mixer. Meanwhile, when mixing concrete, manually add fibers in small quantities to premix first. The compressive strength of the concrete in each group of specimens was measured on the day of testing. The variables for each specimen group are summarized in Table 6, and the cross-sectional and reinforcement details of the specimens are shown in Figure 1.

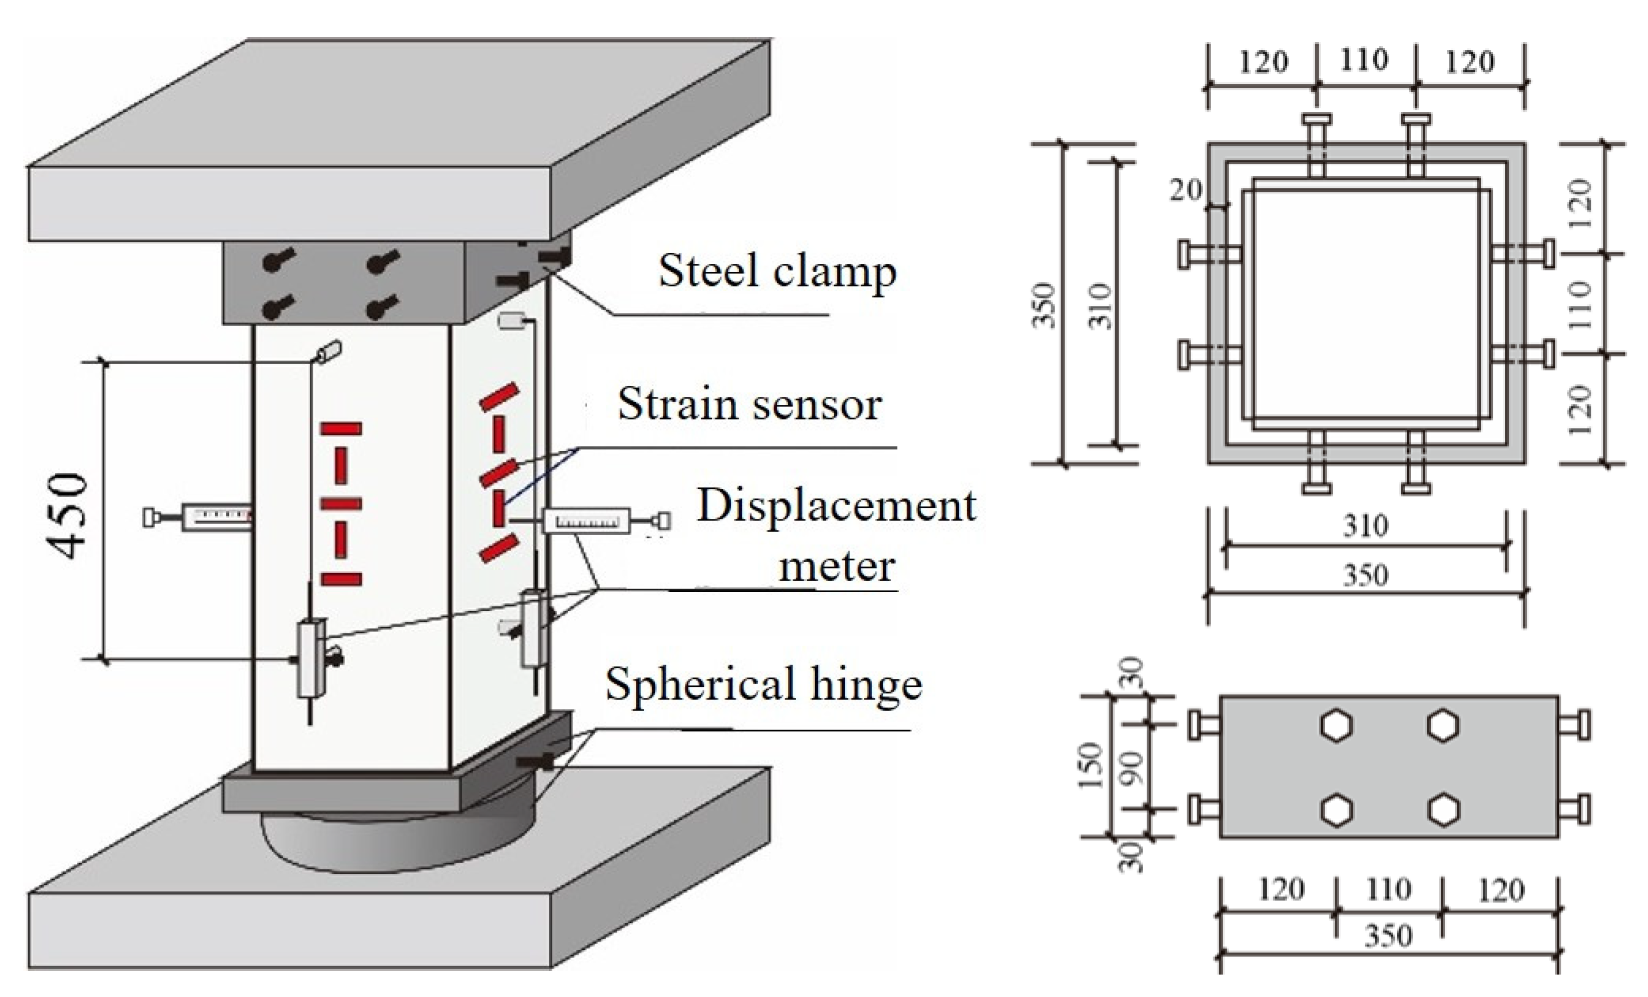
2.3. Test Loading and Measurement

All specimens were tested after a 28-day curing time under standard conditions of a temperature of 23 °C and humidity of 98%. The test was carried out by using a 500 ton long-column testing machine for loading. The loading device and the installation are shown in Figure 2. To prevent the ends of the specimens from being damaged, a steel sleeve was installed on the upper part, and a spherical joint was arranged at the bottom of the column to ensure that the components could withstand axial loads. Before the test started, the end of the column was first ground smooth, and a thin layer of fine sand was applied between the specimen and the loading platens, and the levelness of the specimen was checked in both the horizontal and vertical directions. Then preloading was applied at a rate of 0.1 mm/min to ensure uniform contact between the specimen and the loading platens. Displacement-controlled loading was employed, with a loading rate of 0.2 mm/min. To permit subsequent study of the entire failure process of the specimen, particularly the post-peak behavior, the loading was stopped when the load of the test specimen remained stable, or the bearing capacity dropped to 0.6 times the peak load. According to the previous research of the group, at this point, the specimen had already experienced significant damage, and further loading would not yield meaningful data on the specimen’s behavior. The test data were collected by using DH3820 strain gauges and displacement meters, with a collection frequency of 10 Hz.
The measurement contents of the test include the axial load and displacement of the specimens, the vertical and horizontal strains of the intermediate concrete, the strains of the longitudinal reinforcement and stirrups, etc. The vertical displacement meters were installed in the middle area of each side of the specimens to measure the axial deformation. Meanwhile, horizontal displacement meters were placed on both sides of the middle section of the specimens to measure the lateral displacement. Five concrete strain sensors were arranged on one side surface of the specimens to measure the lateral and vertical strains of the concrete columns during the test process. Three steel bar strain gauges were installed on the two diagonal longitudinal bars of the specimens, and three steel bar strain gauges were also set on the stirrups to record the strains of the stirrups. The specific positions of the concrete strain gauges, and steel bar strain sensors on longitudinal bars and stirrups are shown in Figure 1 and Figure 2. The physical parameters of LVDTs and strain gauges are shown in Table 7.

3. Results and Discussion

3.1. Test Phenomenon and Failure Mode

During the test loading process, the behavior of each specimen was similar. In the initial loading stage, the load was mainly borne by the concrete, and the specimen remained in the elastic stage, with no noticeable changes on the concrete surface. As the load increased to 45% of the peak load, both the concrete and steel jointly bore the load. Slight surface cracking was observed, with both the number and length of the cracks increasing as the load continued to rise, accompanied by audible cracking sounds. At this stage, the load–displacement curve of the specimen remained nearly linear, with minimal lateral expansion deformation of the concrete, and the stirrups had little restraining effect. When the load reached 65% of the peak load, the first vertical crack appeared on the surface of the specimen, with a width of 0.02 mm and a length of about 1.5 cm. Due to varying stirrup ratios, the first crack appeared at different locations. For specimens with a stirrup spacing of 40 mm, the first crack emerged at the center of the specimen, whereas for those with a stirrup spacing of 80 mm or 120 mm, the first crack appeared closer to the corners. As the load increased, vertical cracks appeared at each corner of the specimen, and the number and length of the cracks increased rapidly, while the concrete spalled slightly where the cracks developed. When the load reached the peak load, the lateral expansion deformation of the core concrete increased rapidly, and numerous vertical cracks were observed on the specimen surface, part of which gradually developed diagonally, and the crack widths expanded significantly. The concrete cover began to spall, and the concrete of the specimen without fiber mixing spalled earlier. As the load dropped to 80% of the peak load, the rate of stress reduction slowed. Vertical primary cracks were formed in the specimens with stirrup spacing of 40 mm, and diagonal primary cracks were formed in the specimens with stirrup spacing of 80 mm or 120 mm. The concrete in the core area was crushed, and the column suffered severe damage. Notably, the columns with fiber reinforcement exhibited better integrity compared to those without fiber. At 60% of the peak load, the concrete in the center of the specimen collapsed, causing the column body to tilt and the longitudinal reinforcement to bend. The final failure patterns of each specimen are shown in Figure 3.

3.2. Major Experimental Results

The test results of each specimen are shown in Table 8. The axial load of the specimens is jointly borne by the concrete in the confined area, the concrete cover, and the longitudinal rebar. The peak stress of the confined LWAC can be calculated by the following formula:
f cc = P max P cov P s A cc
A cc = A co i = 1 n c i 2 α
where Pmax is axial load, Pcov is the load borne by the concrete cover, and Pcov = Acovσcov; Ps is the load borne by the longitudinal rebar, Ps = Asσs; Acc, Acov and As are, respectively the cross-sectional area of the concrete in the bearing area, the cross-sectional area of the concrete cover and the cross-sectional area of the longitudinal rebar. σcov and σs are the stresses of the concrete and the reinforcement obtained through the wood performance test. ci is the clear distance between the i-th adjacent longitudinal rebars; α is the curve shape constant, with a value of 5.5.
fcc′/fco′ was used to evaluate the strength improvement of the specimen, εcc/εco was used to reflect the increase of the peak strain of the confined concrete, and the ductility of the specimen can be expressed in terms of ε0.85/εcc to determine the ductility to determine the deformation ability of the specimen after the peak [16].

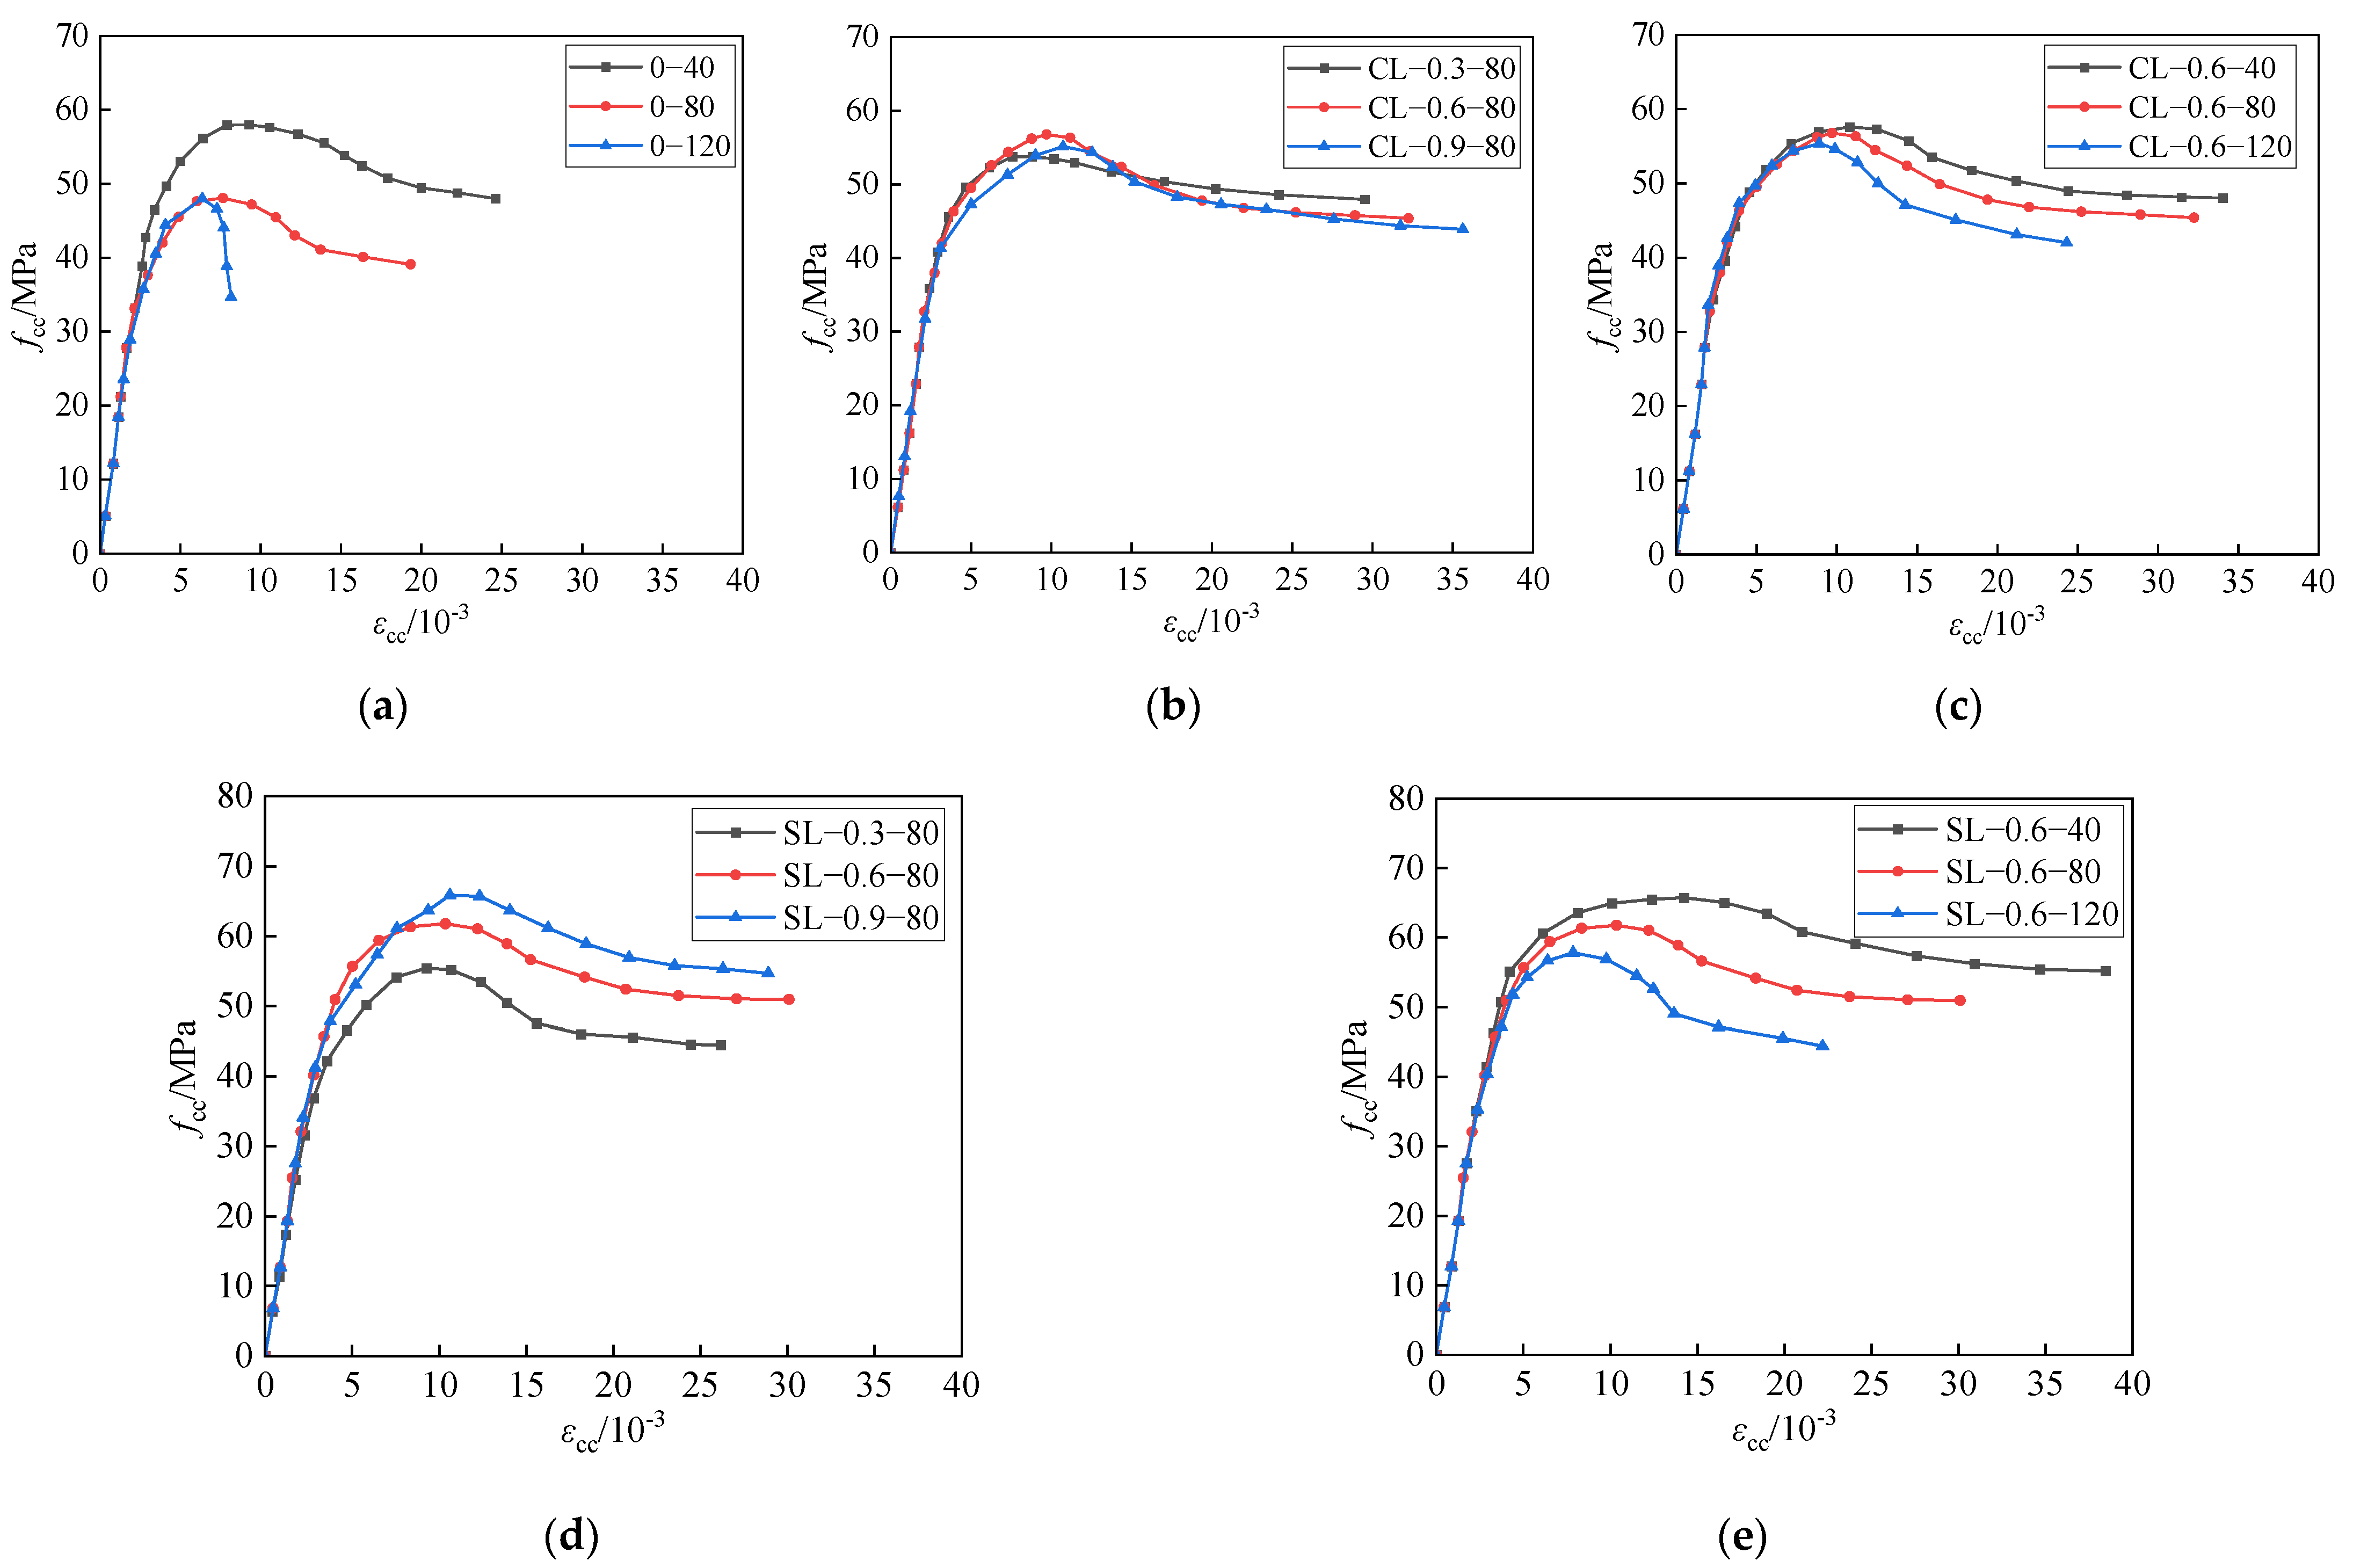
3.3. Stress–Strain Curve of the Specimen

The stress–strain curves of each specimen are shown in Figure 4. It can be seen that the peak stress of each specimen increases as the stirrup spacing decreases. Except for CL-0.6–40, the peak stress of the fiber-reinforced specimens is higher than that of the plain concrete specimens under the same stirrup spacing, and it increases with the fiber content. Under the same conditions, the peak stress of the specimens with steel fiber reinforced is higher than that of the specimens with carbon fiber. Adding steel fibers can improve the load-bearing capacity of the specimens. After reaching the peak stress, the specimens with fiber reinforcement experience a longer period of rapid decline in stress compared to those without fiber reinforcement.
The shape of the stress–strain curves was correlated with fiber and stirrup spacing. For the rising section of the curve, steel fibers led to a steeper slope, indicating improved initial stiffness compared to carbon fibers. This is particularly evident in the specimens with higher fiber content (0.6% and 0.9%), where the load was transferred more efficiently in the early stages of loading. For the descending section of the stress–strain curve, specimens with smaller stirrup spacing (40 mm) exhibited a less steep descent, indicating better post-peak stability. This was particularly true for the specimens with steel fiber reinforcement, where the descending section was significantly more gradual, implying better energy dissipation and delayed failure.

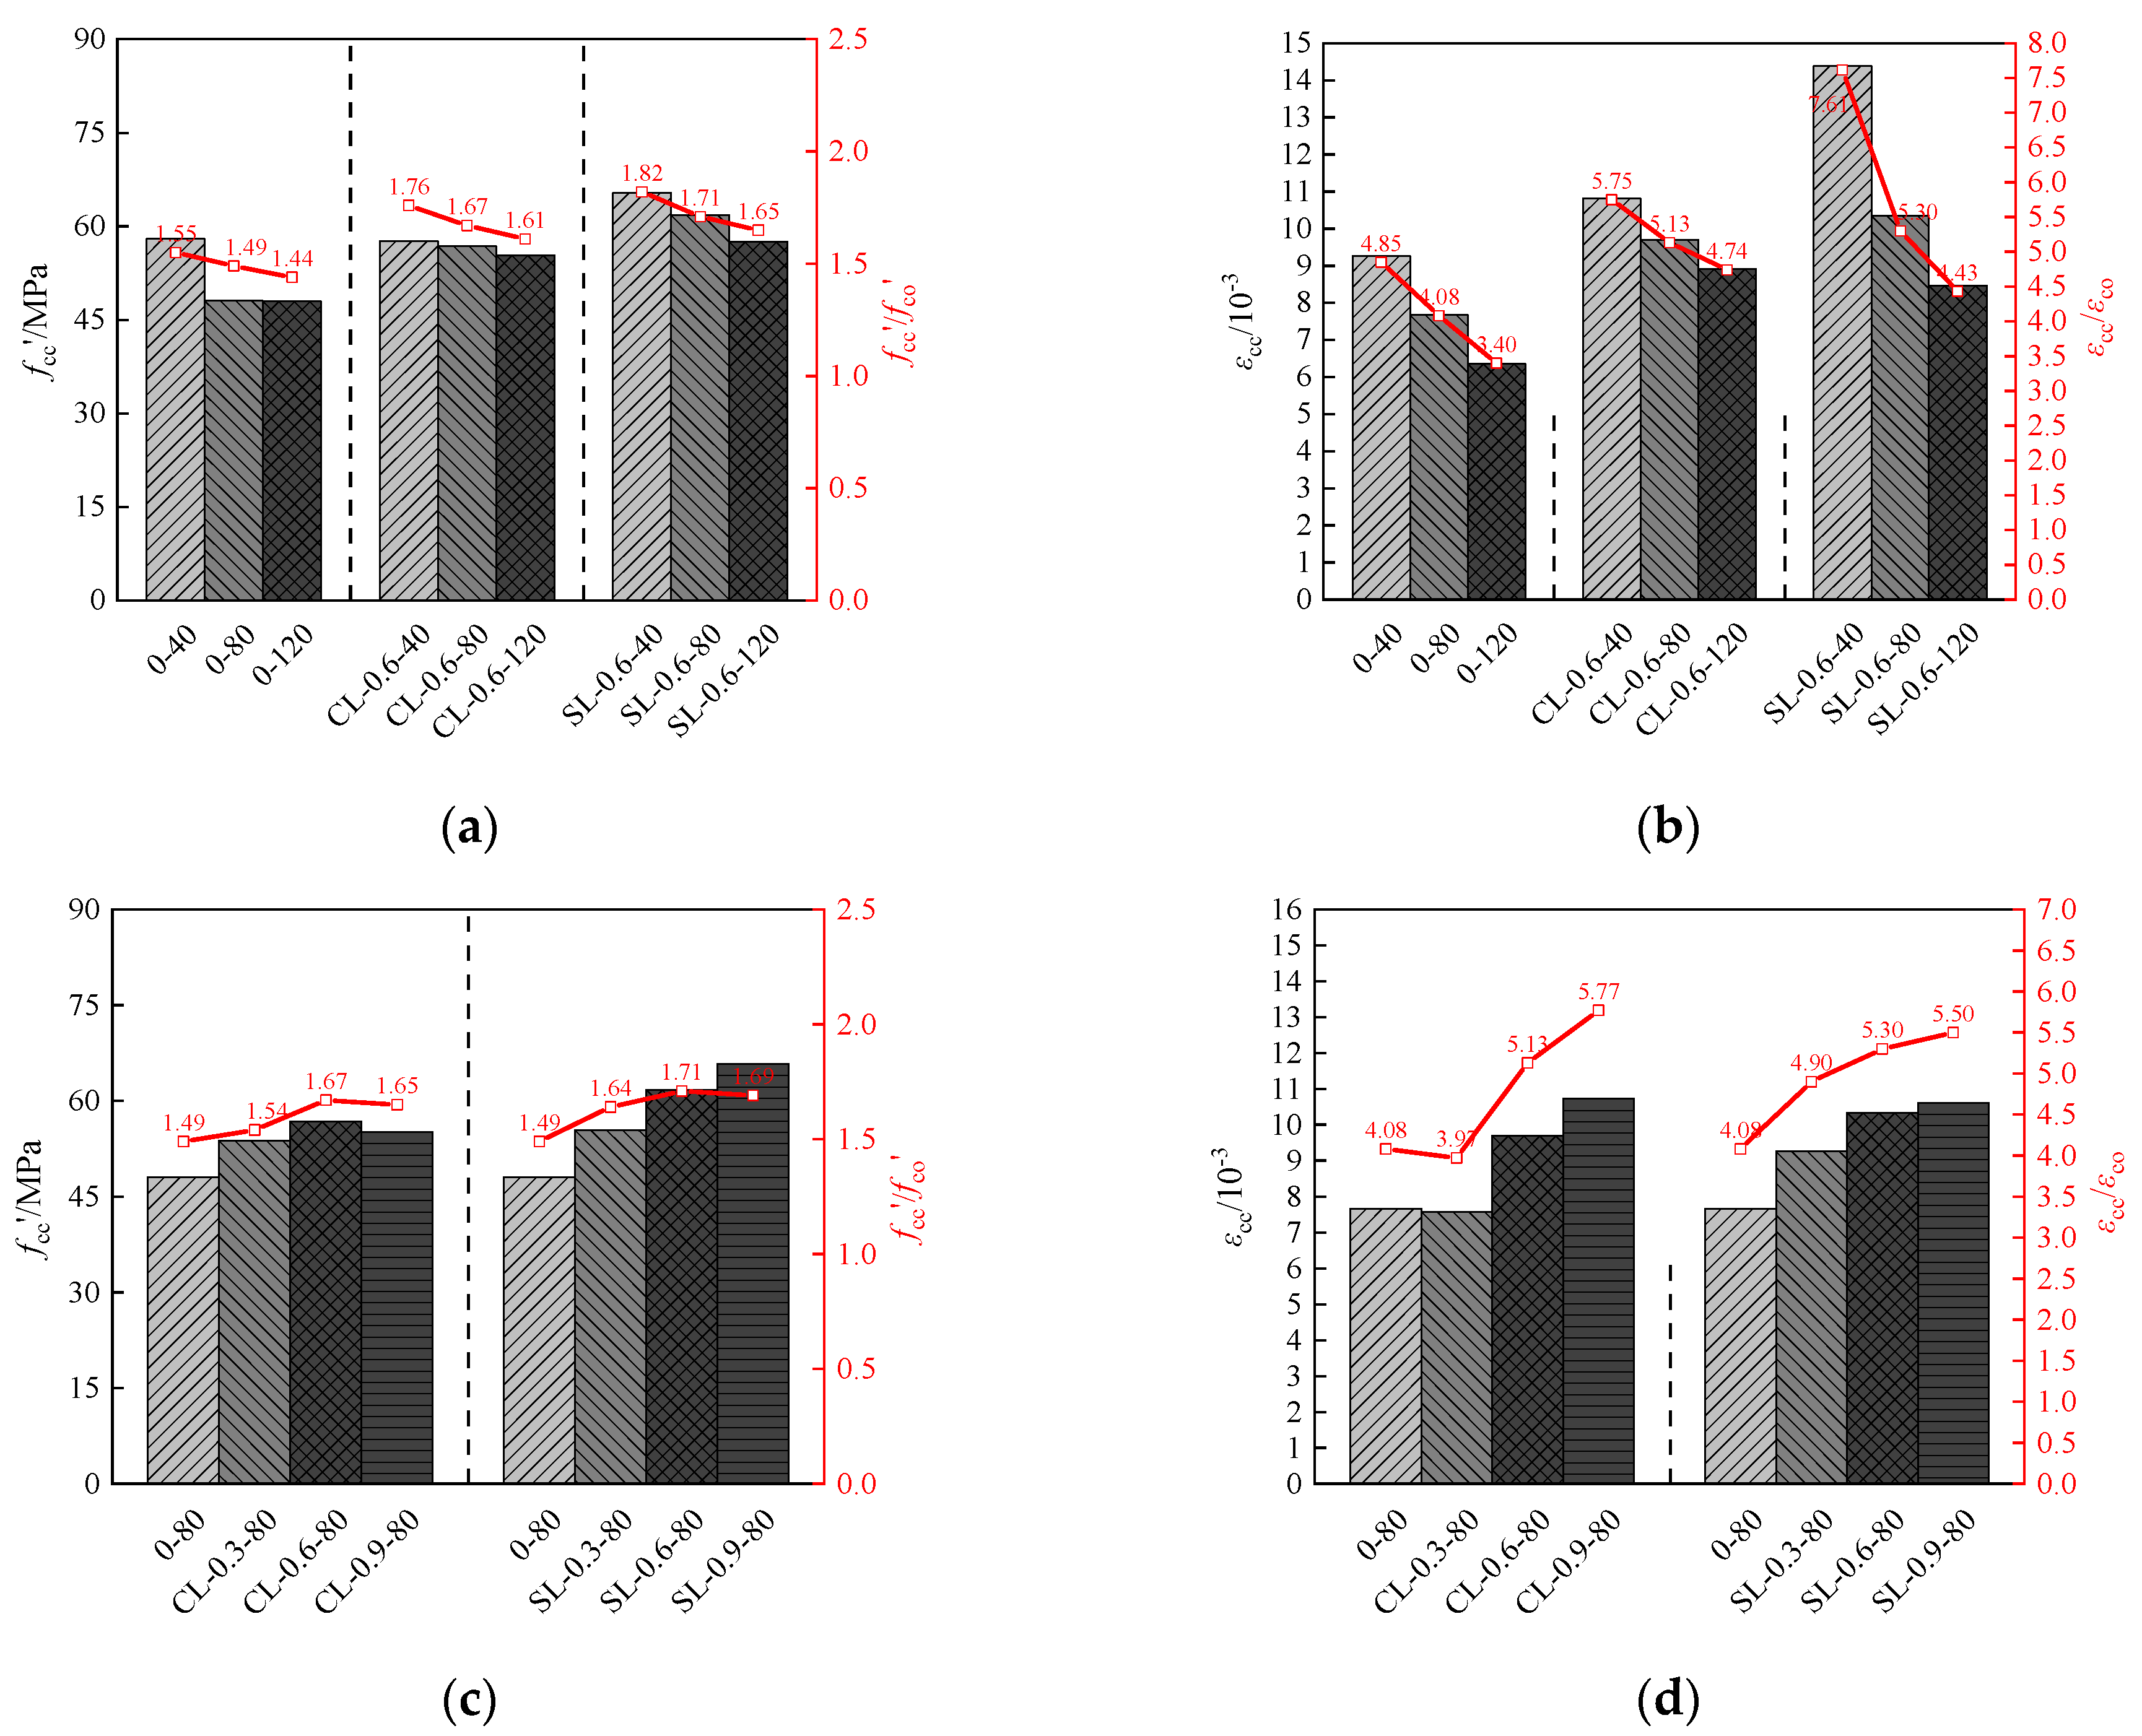
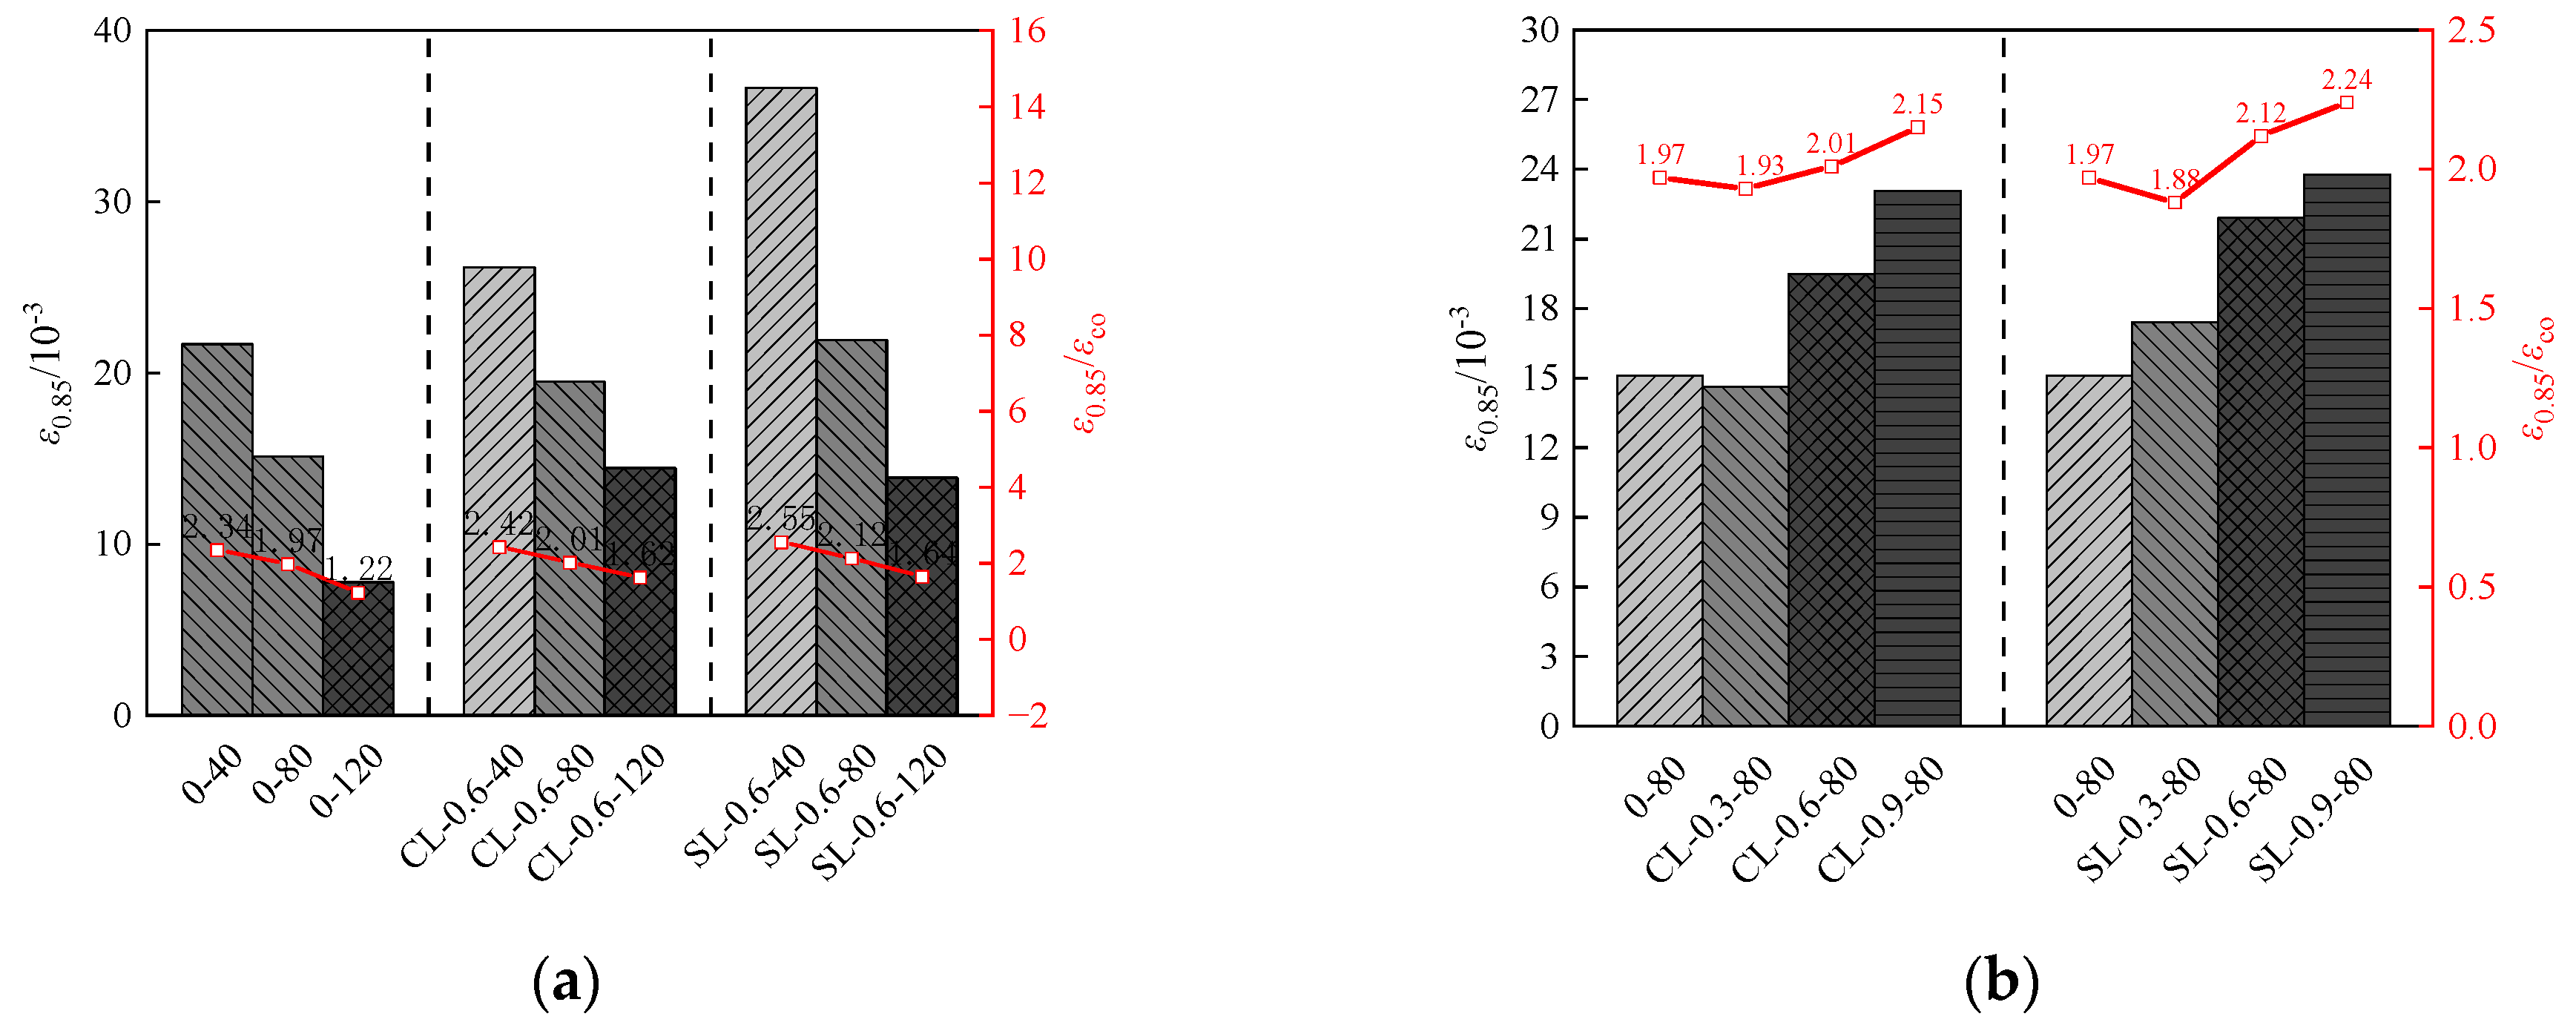
3.4. Analysis of Influencing Factors

3.4.1. Stirrup Spacing

The stress–strain relationship curves of the columns were normalized, as shown in Figure 5 and Figure 6. It can be observed that, for specimens with the same type and content of fiber, reducing the stirrup spacing has minimal effect on the ascending section of the stress–strain curve, but significantly influences the peak point and the descending section. A smaller stirrup spacing improves the ductility of the specimens. As the stirrup spacing decreases, both the peak stress increases and the slope of the descending section decreases.
For specimens with the same fiber volume fraction, the trends for both carbon fiber and steel fiber specimens are similar: the peak stress and normalized peak stress increase as the stirrup spacing decreases. The increase in peak stress for the non-fiber specimens ranges from 3.5% to 7.6%, while for the fiber specimens, it ranges from 3.1% to 10.3%. As the stirrup spacing decreases, both the peak strain εcc and the normalized peak strain εcc/εco increase. For fiber specimens, the increase in εcc/εco ranges from 8.2% to 71.8%. Reducing the stirrup spacing can enhance the confinement force in the core area and the peak strain. For specimens with steel fibers, the effect of the stirrup spacing on the ductility is more pronounced; smaller stirrup spacing leads to better ductility. Reducing the stirrup spacing is an effective method to improve the ductility of fiber-lightweight aggregate concrete.

3.4.2. Fiber Type and Fiber Content

The effect of fiber type and content on the peak stress and peak strain of the specimens was clearly significant. The addition of fibers enhances the strength of lightweight aggregate concrete and reduces its brittleness, although it has a limited effect on increasing the elastic modulus. Among the fiber-reinforced specimens, the peak stress of the specimens is higher than that of the specimens without fibers, and it increases as the fiber content rises. For SF specimens, the increase in normalized peak stress (fcc′/fco′) ranged from 3.1% to 10.3%; for CF specimens, the increase in fcc′/fco′ ranged from 3.5% to 7.6%. Under the same fiber content and stirrup spacing, the fcc′/fco′ of the SF specimens is higher than that of the CF specimens. The normalized peak strain (εcc/εco) of all specimens increased with increasing fiber content. For steel fiber specimens, the increase of εcc/εco ranges from 8.2% to 71.8%; for carbon fiber specimens, the increase of εcc/εco ranges from 8.2% to 53.3%. The test results showed that the steel fibers provide a greater enhancement in both fcc′/fco′ and εcc/εco compared to carbon fibers, and the improvements were more obvious with the increase of the fiber content. The influence of fiber content on ductility, as shown in the graph, indicates that the ductility index of the fiber-reinforced specimens is higher than that of the plain concrete specimens. Under the same stirrup spacing and fiber content, specimens with steel fibers exhibit a higher ductility index than those with carbon fibers. Therefore, the addition of steel fibers is more effective in improving the ductility of the specimens.
Steel and carbon fibers play different roles in concrete due to their various physical and mechanical properties [22]. Steel fiber has a high modulus of elasticity and strong cohesion with concrete [4]. Steel fibers withstand tensile force through the bond with the cement paste, the damaged surface of the steel fiber, by pulling out to increase the energy absorption, blocking the crack development path, so that the flexural and tensile strength and toughness of the concrete are significantly improved, and can inhibit the development of macroscopic cracks. Carbon fibers in the form of monofilaments or extremely thin fiber bundles dispersed in the cement paste, the destruction of carbon fibers at the surface through the fracture to achieve energy absorption, and then provide a toughening effect, but its impact on the ductility is relatively weak. With appropriate fiber content, increasing fiber content can enhance the interaction between fibers and provide a better reinforcement effect, hence further improving the ductility of concrete.
In comparison to the results of existing research, the steel fibers mainly affect the pre-peak segment of the stress–strain curve and can improve the initial stiffness of the specimen [3]. Other fibers such as hybrid carbon and polypropylene fibers have the same effect when applied to circular columns, especially enhancing the post-peak performance of the specimens [16]. Without fiber incorporation, the square spiral stirrups, compared to the grid stirrups, could provide stronger lateral restraint and effectively increase the bearing capacity and ductility of the specimens [12].

4. Peek Stress and Strain Prediction Model

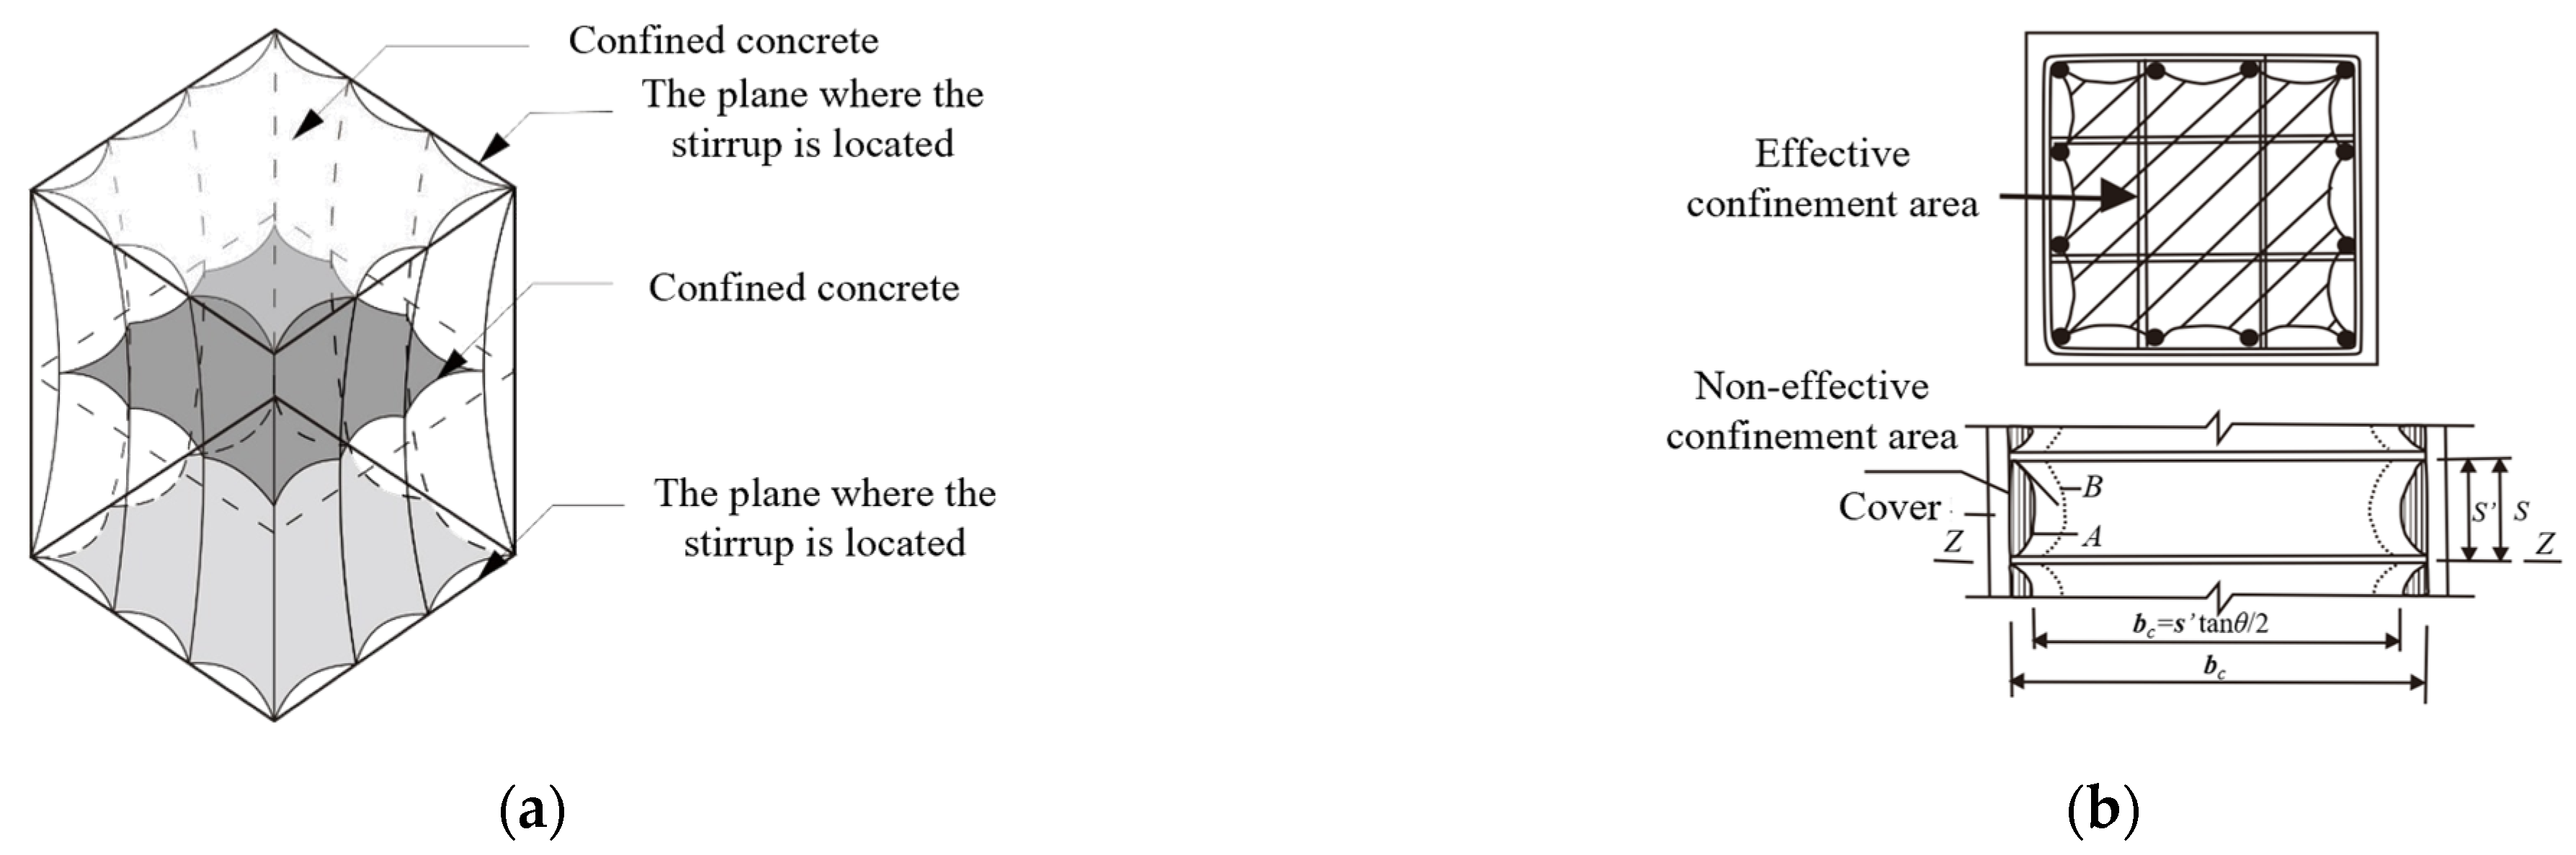
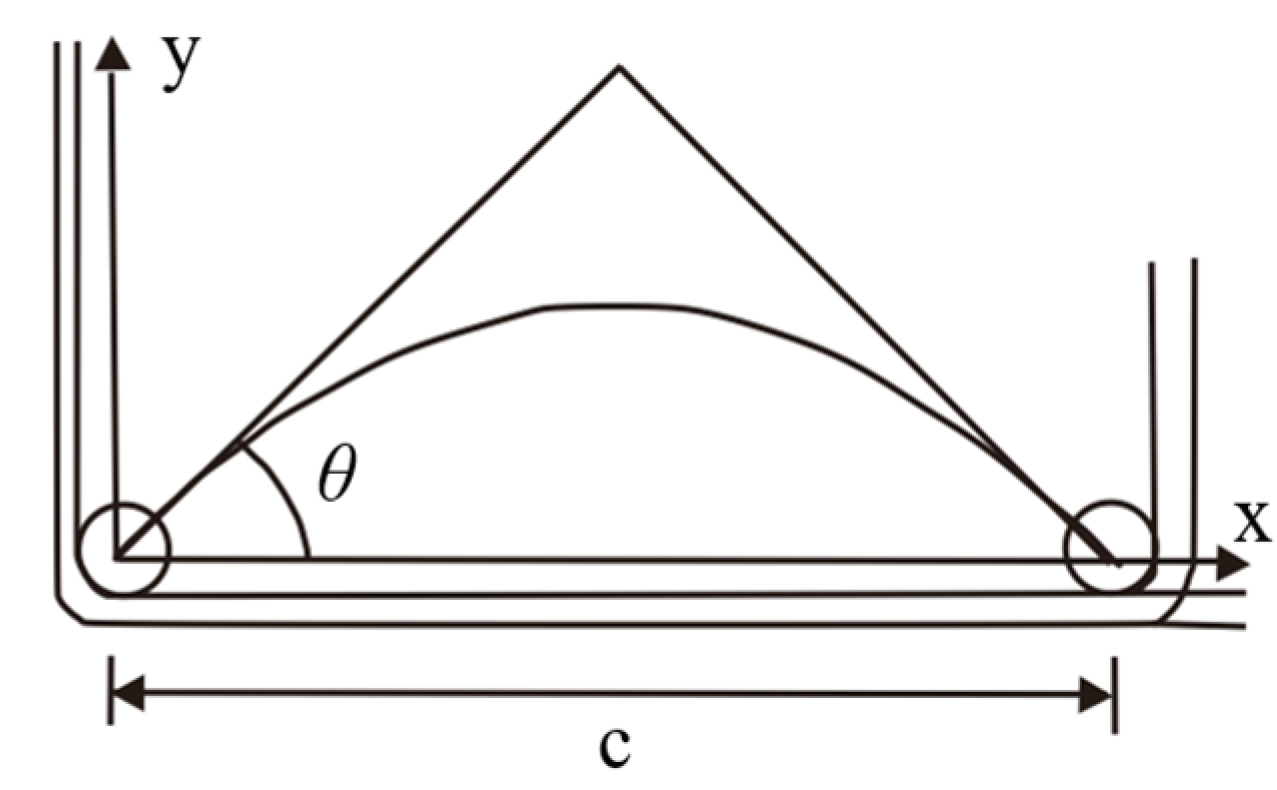
4.1. Stirrup Restraint Mechanism

As shown in Figure 7a, the lateral restraining force provided by the stirrups in the square column is unevenly distributed both vertically and across the cross-section of the stirrups. The magnitude of the restraining force depends on the form of stirrup arrangement and the spacing of longitudinal bars. Figure 7b illustrates the effective confinement area of the concrete, where the shaded region represents this zone. It is assumed that the ineffective confinement area, caused by the “arch effect”, forms a quadratic parabola with an initial tangent slope of θ, as shown in Figure 8. In the horizontal direction, the “arch effect” occurs between the longitudinal bars, while in the vertical direction, it occurs between the horizontal stirrups. The effective confinement area of the concrete can be determined by subtracting the ineffective confinement area from the area of the concrete in the core zone:
A e = A co i = 1 n c i 2 α
where c2/α is the area enclosed by the parabola; ci is the net distance between the i adjacent longitudinal bars; α is the shape constant of the curve.
Sheikh [23] defined the ratio of the area of the effectively constrained area to the concrete area of the core area as λ:
λ = 1 i = 1 n c i 2 α A c o
Then, the effective constraint area Ae between the adjacent two transverse stirrups is calculated as follows:
A e = λ ( B 0.5 s tan θ ) ( H 0.5 s tan θ )
Ahmad and Shah [24] defined the effective constraint effect coefficient ke as:
k e = A e A cc
Substituting Equations (4) and (5) into Equation (6) yields:
k e = 1 - i = 1 n ( c i ) 2 α B H 1 0.5 s tan θ / B 1 0.5 s tan θ / H 1 ρ s
Sheikh [23] suggested θ = 45° and α = 5.5, Li et al. [25] suggested θ = 30° and α = 8, and Bahn [26] suggested that the specimen parameters of high-strength concrete should be α = 6 and θ = 30°. The effective lateral binding force of stirrups (fle) is calculated using the following formula:
f le = k e f l
where fl is the equivalent stirrup lateral restraint. Equivalence of effective binding forces (Figure 9), from the balance of forces, obtains:
n f s A s t = f l s d c
For the square stirrup:
f l = f s s ( A stx + A sty b c + d c )
Nielsen [27] believed that the influence of the fiber reinforcement index klf on the characteristic parameters of the specimen is linear. Aoude et al. [28] considered the restraining force flf provided by the fibers from a microscopic perspective, and its calculation formula is:
f lf = F pf × N f
where Nf is the number of fibers; Fpf is the tensile strength of the fiber.
Paultre [29] proposed that the frictional bond strength of the fiber τb is a constant, and Aoude [28] suggested that τb = 0.6 × fco2/3, and that the average embedded length of the fiber is lf/4, which obtains the binding force of the fiber:
f lf = N f τ b π d f l f / 4
Since the fibers are randomly distributed in space, Nf is determined by the formula:
N f = 4 η θ v f π d f 2
where ηθ is the fiber efficiency factor; Aveston [30] suggested a value of 0.5, and Foster suggested a value of 3/8 based on Maage’s study [31]. Substituting Equation (12) into Equation (11) yields:
f lf = η θ τ b v f l f d f = η θ τ b k lf

4.2. Modified Model

4.2.1. Constraint on the Selection of Efficiency Indicators

Currently, there are two main methods for establishing the calculation model of the peak point: (1) The method represented by Mander [32], which used keλt (where λt is the eigenvalue of the coupling and ke is the effective constraint coefficient) as the key parameter; (2) Represented by Cusson [33], Ile = fle/fco′ (where fle is the effective lateral constraint) was taken as the key parameter.
Comparing the two constraint efficiency indices, the first method has a wide range of applications and simple to calculate. However, it does not fully account for the influence of stirrup configuration, and the stirrup may not yield in actual use, potentially overestimating the restraint effect of the stirrups. Cusson et al. used Ile to evaluate the stirrup restraint efficiency, considering the stirrup yield and the arch effect in the concrete when it reaches peak stress, leading to more accurate results. To incorporate the effect of fibers, the Ilf (Ilf = flf/fco′) was used as the constraint index.

4.2.2. Peak Stress and Peak Strain Calculation Model

Table 9 presents six typical calculation models for the peak point. Except that the Aoude model takes into account the influence of the fiber restraining force when calculating the peak stress, none of the other models consider the influence of the fiber addition on the parameters of the peak point.
Table 10 shows the calculation results of the ratios between the predicted values from each model and the test values. It can be observed that there is considerable deviation in the calculation results of the peak parameters for the same specimen across the models. Almost all models tend to underestimate the peak stress of the specimen. However, the Aoude model overestimates the peak stress for the SF specimen, which may be due to the fact that carbon fibers with a greater slenderness ratio, resulting in a large-calculated value. In contrast, the average ratio for peak stress across all models, except for the Mander model, are approximately 0.2, indicating that these models significantly underestimate the peak strain. The Mander model appears to provide more accurate predictions for peak strain.
All models do not fully consider the effects of fiber reinforcement. These models focus primarily on the confinement effects provided by the stirrups, which are inadequate when considering the additional confinement and bridging effect provided by fibers. While stirrup confinement is well-accounted for in the models, the combined confinement from fibers and stirrups in SFLWAC enhances the material’s ability to withstand greater strains before failure, but this interaction is not adequately reflected in most models, leading to a significant underprediction of peak strain. Furthermore, all models were originally developed for conventional concrete and did not specifically consider the properties of lightweight aggregate concrete. The LWAC typically exhibits a lower elastic modulus compared to normal concrete. This affects the stress–strain behavior, particularly at the peak strain stage, as the lower stiffness results in higher deformations before failure. The axial compressive behavior of concrete is also related to numerous factors such as the cross-sectional form of the stirrups, the type of fibers, and the fiber content. Therefore, the calculation models require modification to better incorporate fiber reinforcement effects, LWAC properties, and the combined confinement mechanisms.
In the early stages of the experiment, relevant literature on SFLWAC was reviewed. The literature was filtered based on specific criteria, including stirrup configuration, specimen size, and fiber type. A total of 151 sets of experimental data meeting these conditions were obtained, as shown in Table 11.
Combined with the experimental data of this paper, the calculation expressions for the peak stress and peak strain of the SFLWAC were obtained through regression analysis. In order to quantitatively analyze the contribution of the fibers to the confined LWAC, the εcc′ of the SFLWAC and the ∆εc,f of the fiber reinforcement together constitute the peak strain of the SFLWAC specimen:
ε c c = ε cc + Δ ε c , f
The results of regression analysis are shown in Figure 10.
The prediction models for the peak stress and peak strain of SFLWAC obtained through regression analysis are:
f cc = f co 1 + 2.1 f le f co 0.75
ε cc = ε co 1 + 3.44 f le f c o 0.74
To account for the contribution of fibers to the peak strain of the SFLWAC specimens, the strain of the fiber reinforcement (∆εc,f) is determined through regression analysis of test results of the fiber-reinforced specimens, as follows:
Δ ε c , f = 8.46 ε co f lf f co 0.21
The prediction models of the peak strain εcc of the SFLWAC specimen are:
ε cc = ε co 1 + 3.44 f le f c o 0.74 + 8.46 f lf f co 0.21

5. Conclusions

In this paper, the behavior of stirrup-confined fiber-reinforced lightweight aggregate concrete (SFLWAC) under compressional loading was conducted, focusing on the effects of different fiber types, fiber content, and stirrup spacing on the mechanical properties of the specimens. The SFLWAC peak stress and peak strain models considering the combined stirrup and fiber-reinforced confinement effects were established.
(1) The failure pattern of the SFLWAC showed vertical and diagonal cracks on the surface of the specimen, leading to concrete spalling and aggregate shear damage, severe damage to columns, and buckling of longitudinal reinforcement.
(2) Under the same fiber type and content, reducing the stirrup spacing had minimal effect on the ascending section of the stress–strain curve of SFLWAC, while could increase the peak stress and peak strain of the specimen, decrease the slope of the descending section of the curve, enhance the confinement force in the core area, and effectively improve the ductility of the fiber lightweight aggregate concrete. Furthermore, the effect on ductility was more pronounced in specimens reinforced with steel fibers.
(3) Specimens with steel fibers exhibited higher normalized peak stress compared to those with carbon fibers, under the same fiber content and stirrup spacing. Increasing the fiber content led to higher normalized peak strain for all specimens, improving the strength of the lightweight aggregate concrete, and reducing its brittleness. Steel fiber was particularly effective in improving the brittleness compared to carbon fiber.
(4) Based on the stirrup confinement mechanism and fiber reinforcement effect, a prediction model of peak stress and peak strain for SFLWAC was established. Verified by comparison with experimental data, this model can accurately predict the axial compression performance of SFLWAC, providing a reliable theoretical basis for its application in practical engineering.

Author Contributions

Conceptualization, S.C. and T.W.; methodology, S.C.; validation, S.C., Y.H. and G.S.; formal analysis, S.C. and Y.H.; investigation, S.C., Y.H. and G.S.; data curation, S.C. and G.S.; writing—original draft preparation, S.C.; writing—review and editing, S.C. and T.W.; project administration, T.W.; funding acquisition, T.W. All authors have read and agreed to the published version of the manuscript.

Funding

This research was funded by the National Natural Science Foundation of China [52378122]; the Key Research and Development Projects of Shaanxi Province [2022SF-608].

Data Availability Statement

The original contributions presented in the study are included in the article, further inquiries can be directed to the corresponding author.

Conflicts of Interest

The authors declare no conflicts of interest.

References

  1. Bian, Z.; Huang, Y.; Liu, Y.; Lu, J.-X.; Fan, D.; Wang, F.; Poon, C.S. A novel foaming-sintering technique for developing eco-friendly lightweight aggregates for high strength lightweight aggregate concrete. J. Cleaner Prod. 2024, 448, 141499. [Google Scholar]
  2. Gao, Y.; Liu, G.; Han, X.; Gao, Q.; Ren, J. Research on the design method of mix proportion of ceramsite lightweight aggregate concrete. Constr. Build. Mater. 2024, 433, 136665. [Google Scholar]
  3. Li, J.; Niu, J.; Wan, C.; Liu, X.; Jin, Z. Comparison of flexural property between high performance polypropylene fiber reinforced lightweight aggregate concrete and steel fiber reinforced lightweight aggregate concrete. Constr. Build. Mater. 2017, 157, 729–736. [Google Scholar]
  4. Ye, Y.; Liu, J.; Zhang, Z.; Wang, Z.; Peng, Q. Experimental Study of High-Strength Steel Fiber Lightweight Aggregate Concrete on Mechanical Properties and Toughness Index. Adv. Mater. Sci. Eng. 2020, 2020, 5915034. [Google Scholar]
  5. Ombres, L.; Mazzuca, P.; Verre, S. Effects of thermal conditioning at high temperatures on the response of concrete elements confined with a PBO-FRCM composite system. J. Mater. Civ. Eng. 2020, 34, 04021413. [Google Scholar] [CrossRef]
  6. Hassanpour, M.; Shafigh, P.; Mahmud, H.B. Mechanical properties of structural lightweight aggregate concrete containing low volume steel fiber. Arab. J. Sci. Eng. 2014, 39, 3579–3590. [Google Scholar]
  7. Divyah, N.; Thenmozhi, R.; Neelamegam, M.; Prakash, R. Characterization and behavior of basalt fiber-reinforced lightweight concrete. Struct. Concr. 2021, 22, 422–430. [Google Scholar]
  8. Ecemiş, A.S.; Madenci, E.; Karalar, M.; Fayed, S.; Althaqafi, E.; Özkılıç, Y.O. Bending Performance of Reinforced Concrete Beams with Rubber as Form of Fiber from Waste Tires. Materials 2024, 17, 4958. [Google Scholar] [CrossRef]
  9. Ecemiş, A.S.; Madenci, E.; Karalar, M.; Fayed, S.; Althaqafi, E.; Özkılıç, Y.O. Shear performance of reinforced concrete beams with rubber as form of fiber from waste tire. Steel Compos. Struct. 2024, 51, 337–349. [Google Scholar]
  10. Zivkovic, J.; Øverli, J.A. Confinement in bending of high-strength lightweight aggregate concrete beams. Structures 2022, 39, 419–433. [Google Scholar]
  11. Al-Eliwi, B.J.; Ekmekyapar, T.; Al-Samaraie, M.I.; Doğru, M.H. Behavior of reinforced lightweight aggregate concrete-filled circular steel tube columns under axial loading. Structures 2018, 16, 101–111. [Google Scholar] [CrossRef]
  12. Wei, H.; Wu, T.; Liu, X.; Zhang, R. Investigation of stress-strain relationship for confined lightweight aggregate concrete. Constr. Build. Mater. 2020, 256, 119432. [Google Scholar] [CrossRef]
  13. Qian, Z.; Wang, J.; Liu, Y.; Xu, Q. Axial compressive performance of partially encased steel-concrete composite stub columns filled with lightweight aggregate concrete. Eng. Struct. 2023, 291, 116422. [Google Scholar] [CrossRef]
  14. Campione, G.; La Mendola, L. Behavior in compression of lightweight fiber reinforced concrete confined with transverse steel reinforcement. Cem. Concr. Compos. 2004, 26, 645–656. [Google Scholar] [CrossRef]
  15. Haddad, R.H.; Ashour, D.M. Thermal performance of steel fibrous lightweight aggregate concrete short columns. J. Compos. Mater. 2013, 47, 2013–2025. [Google Scholar] [CrossRef]
  16. Wu, T.; Sun, L.; Wei, H.; Liu, X. Uniaxial performance of circular hybrid fibre-reinforced lightweight aggregate concrete columns. Eng. Struct. 2021, 238, 112263. [Google Scholar] [CrossRef]
  17. GB/T 14684-2022; Sand for Construction. China General Administration for Market Regulation: Beijing, China, 2022.
  18. GB/T 14685-2022; Pebble and Crushed Stone for Construction. China General Administration for Market Regulation: Beijing, China, 2022.
  19. GB/T 14337-2022; Man-Made Fibre-Test Method for Tensile Properties of Staple Fibre. China General Administration for Market Regulation: Beijing, China, 2022.
  20. Wei, H.; Wu, T.; Yang, X. Properties of lightweight aggregate concrete reinforced with carbon and/or poly-propylene fibers. Materials 2020, 13, 640. [Google Scholar] [CrossRef]
  21. Wu, T.; Wei, H.; Liu, X.; Liu, Q. Experimental study on axial compression performance of stirrup confined high-strength lightweight aggregate concrete columns. Eng. Mech. 2018, 35, 203–213. [Google Scholar]
  22. Hassanpour, M.; Shafigh, P.; Mahmud, H.B. Lightweight aggregate concrete fiber reinforcement–A review. Constr. Build. Mater. 2012, 37, 452–461. [Google Scholar] [CrossRef]
  23. Sheikh, S.; Uzumeri, S.M. Analytical model for concrete confinement in tied columns. ASCE J. Struct. Div. 1982, 108, 2703–2722. [Google Scholar] [CrossRef]
  24. Ahmad, S.H.; Shah, S.P. Complete triaxial stress-strain curves for concrete. ASCE J. Struct. Div. 1982, 108, 728–742. [Google Scholar] [CrossRef]
  25. Li, H. High Strength Concrete and Its Combined Structure; Science Press: Beijing, China, 2004. [Google Scholar]
  26. Bahn, B.Y.; Han, B.S.; Shin, S.W. A model of confined concrete in high-strength reinforced concrete tied columns. Mag. Concr. Res. 2003, 55, 203–214. [Google Scholar]
  27. Nielsen, C. Ultra High Strength Steel Fiber Reinforced Concrete; Technical University of Denmark: Copenhagen, Denmark, 1995. [Google Scholar]
  28. Aoude, H. Structural Behaviour of Steel Fiber Reinforced Concrete Members; McGill University: Montreal, QC, Canada, 2008. [Google Scholar]
  29. Paultre, P.; Eid, R.; Langlois, Y.; Lévesque, Y. Behavior of steel fiber-reinforced high-strength concrete columns under uniaxial compression. ASCE J. Struct. Eng. 2010, 136, 1225–1235. [Google Scholar] [CrossRef]
  30. Aveston, J.; Mercer, R.A.; Sillwood, J.M. Fiber reinforced cements-scientific foundation for specification. In: Compos.-Stand. Test. Des. Proc. Natl. Phys. Lab. Conf, UK. 1974; 93–103. [Google Scholar]
  31. Maage, M. Interaction between steel fibers and cement based matrixes. Mater. Constr. 1977, 10, 297–301. [Google Scholar] [CrossRef]
  32. Mander, J.B.; Priestley, M.J.N.; Park, R. Theoretical stress-strain model for confined concrete. ASCE J. Struct. Eng. 1988, 114, 1804–1826. [Google Scholar] [CrossRef]
  33. Cusson, D.; Paultre, P. Stress-strain model for confined high-strength concrete. ASCE J. Struct. Eng. 1995, 121, 468–477. [Google Scholar] [CrossRef]
  34. Légeron, F.; Paultre, P. Uniaxial confinement model for normal- and high-strength concrete columns. ASCE J. Struct. Eng. 2003, 129, 241–252. [Google Scholar] [CrossRef]
  35. Khaloo, A.R.; Eldash, K.; Ahmad, S.H. Model for lightweight concrete columns confined by either single hoops or interlocking double spirals. ACI Struct. J. 1999, 96, 883–890. [Google Scholar]
  36. Lim, J.C.; Ozbakkaloglu, T. Stress-strain model for normal-and light-weight concretes under uniaxial and triaxial compression. Constr. Build. Mater. 2014, 71, 492–509. [Google Scholar] [CrossRef]
  37. Manrique, M.A.; Bertero, V.V.; Popov, E.P. Mechanical Behavior of Lightweight Concrete Confined by Different Types of Lateral Reinforcement; College of Engineering University of California: Berkeley, CA, USA, 1979. [Google Scholar]
  38. Shah, S.P.; Naaman, A.E.; Moreno, J. Effect of confinement on the ductility of lightweight concrete. Int. J. Cem. Compos. Lightweight Concr. 1983, 5, 15–25. [Google Scholar] [CrossRef]
  39. Martinez, S.; Nilson, A.H.; Slate, F.O. Spirally reinforced high-strength concrete columns. ACI J. 1984, 81, 431–442. [Google Scholar]
  40. Hlaing, M.M.; Huan, W.T.; Thangayah, T. Response of spiral-reinforced lightweight concrete to short-term compression. J. Mater. Civ. Eng. ASCE 2010, 22, 1295–1303. [Google Scholar]
  41. Khaloo, A.R.; Bozorgzadeh, A. Influence of confining hoop flexural stiffness on behavior of high-strength lightweight concrete columns. ACI Struct. J. 2001, 98, 657–664. [Google Scholar]
  42. Basset, R.; Uzumeri, S.M. Effect of confinement on the behaviour of high-strength lightweight concrete columns. Can. J. Civ. Eng. 1986, 13, 741–751. [Google Scholar] [CrossRef]
Figure 1. Dimensions and reinforcement of the specimens: (a) 40 mm; (b) 80 mm; (c) 120 mm; (d) Section.
Buildings 15 01206 g001
Figure 2. Test equipment.
Buildings 15 01206 g002
Figure 3. Failure mode of specimens.
Buildings 15 01206 g003
Figure 4. Stress–strain curves of specimens: (a) Stress–strain comparison of plain concrete specimens with different spacings; (b) Stress–strain comparison of specimens with different carbon fiber contents; (c) Stress–strain comparison of carbon fiber specimens with different spacing; (d) Comparison of stress–strain specimens with different steel fiber contents; (e) Stress–strain comparison of steel fiber specimens with different spacing.
Buildings 15 01206 g004
Figure 5. Effect of stirrup spacing and fiber content on stress and strain: (a) Effect of stirrup spacing on peak stress; (b) Effect of stirrup spacing on peak strain; (c) Effect of fiber content on peak stress; (d) Effect of fiber content on peak strain.
Buildings 15 01206 g005
Figure 6. Effect of stirrup spacing and fiber content on ductility: (a) Effect of stirrup spacing on ductility; (b) Effect of fiber content on ductility.
Buildings 15 01206 g006
Figure 7. Lateral confining area of tic-tac-toe compound stirrup: (a) Stirrup constraint area; (b) Stirrup plane constraint area.
Buildings 15 01206 g007
Figure 8. Non-lateral confining area estimation.
Buildings 15 01206 g008
Figure 9. Stress of equivalent stirrup lateral confining.
Buildings 15 01206 g009
Figure 10. Regression analysis result. (a) Peak stress enhancement ratio and (b) Peak strain enhancement ratio.
Buildings 15 01206 g010
Table 1. Chemical compositions and physical properties of cementitious materials.
MaterialChemical Composition/%Loss on Ignition
/%
Fineness
/m2/kg
SiO2Al2O3Fe2O3CaOMgOSO3K2ONa2O
Cement20.365.673.8462.812.682.510.870.191.07329
Fly ash53.2633.994.722.460.551.401.211.12.02420
Table 2. Properties of aggregate.
AggregatePS/mmρ1/(kg·m3)ρ2/(kg·m3)W/%f/MPa
Shale ceramsite5–1687015252.176.57
Sand0.75–4.7514002375--
Notes: The experiments were carried out in accordance with GB/T 14684-2022 [17] and GB/T 14685-2022 [18], PS is the particle size; ρ1 is the bulk density; ρ2 is the apparent density; W is the 24 h water absorption; f is the cylinder compressive strength.
Table 3. Properties of fiber.
Fiberl/mmd/μmρ/(kg·m3)Es/GPafsf/MPa
CF8618242383800
SF1318578001953100
Notes: The experiments were carried out in accordance with GB/T 14337-2022 [19], l is the length; d is the diameter; ρ is the density; Es is the elastic modulus; fsf is the tensile strength.
Table 4. Properties of rebars.
Rebard/mmfy/MPafu/MPaEs × 105/MPaεy × 10−3
HRB40010 mm4545582.02.270
HPB3006 mm5236172.12.490
Notes: d is the diameter; fy is yield strength; fu is the ultimate strength; Es is the elastic modulus; εy is the yield strain.
Table 5. Mixture proportion of concrete.
CementFly AshSuperplasticizerShale CeramsiteSandWater
53973.53.5537540214
Table 6. Test design.
SpecimenStirrup ParametersFiber TypesFiber Content/vol%
s/mmρv/%
0–40403.0--
0–80801.5--
0–1201201.0--
CL-0.3–80801.5CF0.3
CL-0.6–40403.0CF0.6
CL-0.6–80801.5CF0.6
CL-0.6–1201201.0CF0.6
CL-0.9–80801.5CF0.9
SL-0.3–80801.5SF0.3
SL-0.6–40403.0SF0.6
SL-0.6–80801.5SF0.6
SL-0.6–1201201.0SF0.6
SL-0.9–80801.5SF0.9
Notes: s is the stirrup spacing, ρv is volumetric stirrup ratio.
Table 7. LVDT and strain gauge physical parameters.
LVDTTest AccuracyVariation of the Displayed ValueBasic ErrorCorrection Factor
0.01 mm<±3 με(8 h)<±5 με0.003 με/mm
Strain GaugeSensitivity factorMeasurement accuracyResistance accuracyStrain limitation
2.0 ± 0.010.1 με120 ± 0.3 Ω20,000 um/m
Table 8. Main test results.
SpecimenPmax/kNfcu/MPafc′/MPafco′/MPafcc′/MPaεcc/10−3εco/10−3ε0.85/10−3fcc′/fco′εcc/εcoε0.85/εcc
0–402702.1147.7143.8937.3157.979.261.9121.681.554.852.34
0–802273.1341.2237.9232.2348.057.671.8815.111.494.081.97
0–1202269.642.6139.2033.3247.976.361.877.761.443.401.22
CL-0.3–802519.4944.6841.1134.9453.757.581.9114.631.543.971.93
CL-0.6–402685.6941.7938.4532.6857.5910.811.8826.161.765.752.42
CL-0.6–802649.6943.5840.0934.0856.769.701.8919.491.675.132.01
CL-0.6–1202589.214440.4834.4155.368.911.8814.441.614.741.62
CL-0.9–802579.4142.8139.3933.4855.1310.731.8623.071.655.772.15
SL-0.3–802591.8843.3239.8533.8855.429.261.8917.411.644.901.88
SL-0.6–403020.974642.3235.9765.3414.381.8936.681.827.612.55
SL-0.6–80286646.0542.3736.0161.7610.341.9521.911.715.302.12
SL-0.6–1202681.344.5641.0034.8557.498.461.9113.881.654.431.64
SL-0.9–803042.3649.8445.8538.9765.8310.621.9323.781.695.502.24
Mean value2651.6044.4740.9234.7856.809.541.9019.691.635.032.01
Standard Deviation Values 225.15 2.33 2.14 1.82 5.20 1.91 0.02 6.92 0.10 1.01 0.35
Notes: fcu is the compressive strength of concrete cubes; fc′ is the compressive strength of cylinders, and fc′/fcu = 0.93; fco′ is the compressive strength of unconfined lightweight aggregate concrete, and it is recommended that fco′/fc′ = 0.85; fcc′ is the compressive strength of lightweight aggregate concrete in the confined area; εcc is the axial strain corresponding to the confined concrete when it reaches the peak stress; εco is the axial strain corresponding to the unconfined concrete when it reaches the peak stress; ε0.85 is the axial strain corresponding to the stress dropping to 85% of the peak stress.
Table 9. Typical peak point calculation model.
Presented byPeak Stress fcc′Peak Strain εcc
Mander [32] f cc = f co ( 1.254 + 2.254 1 + 7.94 I le 2 I le ) ε cc = ε co 1 + 5 f cc / f co 1
Cusson [33] f cc = f co 1.0 + 2.1 I le 0 . 7 ε cc = ε co + 0.21 I le 1.7
Legeron and Paultre [34] f cc = f co + 1.0 + 2.4 I le 0 . 7 ε cc = ε co + 1 + 35 I le 1 . 2
Khaloo [35] f cc = f co + 3.1 2.1 I le 0 . 06 f le ε cc = ε co + 0.22 2 I le 0 . 06 I le 2
Lim [36] f cc = f co + 5.2 + f co 0.91 I le f co - 0 . 06 ε cc = ε co + 0.045 I le 1.15
Aoude [28] f cc = f co 1 + 2.4 I le 0.7 + 4.1 I lf ε cc = ε co + 0.21 I le 1.7
Table 10. Comparison of model predicted values with experimental values.
Specimen NumberMander ModelCusson ModelLegeron ModelKhaloo ModelLim ModelAoude Model
fcc′
calc/test
εcc
calc/test
fcc′
calc/test
εcc
calc/test
fcc′
calc/test
εcc
calc/test
fcc′
calc/test
εcc
calc/test
fcc′
calc/test
εcc
calc/test
fcc′
calc/test
εcc
calc/test
0–400.770.770.760.210.680.320.720.210.790.210.780.21
0–800.750.850.750.250.690.310.710.250.770.250.770.25
0–1200.750.940.760.290.710.340.720.290.760.290.770.29
CL-0.3–800.720.930.730.250.670.310.690.250.740.251.470.25
CL-0.6–400.690.830.680.170.600.280.640.170.710.172.010.17
CL-0.6–800.670.850.670.190.620.240.640.190.680.192.050.19
CL-0.6–1200.670.850.680.210.630.240.650.210.680.212.090.21
CL-0.9–800.680.740.680.170.620.220.650.170.690.172.780.17
SL-0.3–800.680.860.680.200.630.260.650.200.700.200.730.20
SL-0.6–400.660.670.650.130.580.200.610.130.680.130.730.13
SL-0.6–800.640.860.650.190.600.230.620.190.660.190.730.19
SL-0.6–1200.650.960.660.230.620.260.630.230.660.230.740.23
SL-0.9–800.650.810.660.180.610.220.620.180.670.180.770.18
Mean value0.6910.8400.6930.2050.6350.2640.6580.2050.7070.2051.2630.205
Variance0.00180.00650.00170.00180.00160.00200.00150.00180.00190.00180.52450.0018
Table 11. Collected database.
ResearchersThe Amount of SpecimensPeak StressPeak Stress
Enhancement Ratio
Peak Strain
Increase Ratio
ε0.85/εcc
Manrique [37]2134.82~38.641.04~1.241.08~1.581.62~4.92
Shah [38]433.64~49.211.01~1.561.34~1.461.12~1.84
Martinez [39]4125.67~59.171.41~1.761.23~4.501.16~6.78
Hlaing [40]1435.21~65.201.42~1.271.22~3.081.04~1.53
Khaloo [35,41]2452.49~70.521.01~1.881.10~4.431.15~1.73
Wu [21]1242.76~52.181.09~1.471.23~2.361.31~6.34
Basset [42]1533.43~38.521.08~1.581.07~1.432.01~8.43
Wu [16]2031.67~55.321.34~2.481.32~8.251.42~3.37
Disclaimer/Publisher’s Note: The statements, opinions and data contained in all publications are solely those of the individual author(s) and contributor(s) and not of MDPI and/or the editor(s). MDPI and/or the editor(s) disclaim responsibility for any injury to people or property resulting from any ideas, methods, instructions or products referred to in the content.

