Article

Study on the Dynamic Deformation Characteristics of Artificial Structural Loess

Shaanxi Key Laboratory of Safety and Durability of Concrete Structures, Xijing University, Xi’an 710123, China
*
Author to whom correspondence should be addressed.
Buildings 2025, 15(7), 1198; https://doi.org/10.3390/buildings15071198
Submission received: 4 March 2025 / Revised: 31 March 2025 / Accepted: 4 April 2025 / Published: 6 April 2025
(This article belongs to the Special Issue Building Vibration and Soil Dynamics—2nd Edition)

Abstract

:
Due to the difficulties in sampling, high sensitivity to humidity, and inconvenience in storage, undisturbed loess is prone to changes in its original structure. Therefore, trace amounts of cement and salt are added to remolded soil to simulate the structure of undisturbed loess. The GDS dynamic three-axial test apparatus was used to investigate the influence of dry density, cement content, and confining pressure (CP) on the dynamic distortion characteristics of artificially structured soil. Based on dynamic triaxial tests, the Hardin–Drnevich (H-D) model was established through fitting analysis. The research findings indicate that increased dry density, cement content, and CP can enhance the soil’s resistance to distortion. Under dynamic loading, the higher the CP, the smaller the damping ratio of the soil. With a dry density of 1.20 g/cm3 and 2% cement, the dynamic modulus of the artificially structured loess is similar to that of undisturbed loess. With a dry density of 1.60 g/cm3 and 2% cement, the CP is 200 kPa, the soil’s dynamic modulus of elasticity (DM-E) peak value is 113.14 MPa, and the damping ratio is 0.258. The good agreement between trial data and the predicted results demonstrates that the H-D hyperbolic model is appropriate for representing the DM-E of artificially structured loess. A three-dimensional model of the dynamic deformation characteristics and microstructure of artificial structural loess under dynamic loads was established. The findings can guide the study of the mechanical properties of loess under dynamic loading.

1. Introduction

Due to the difficulty of sampling undisturbed loess, even a slight mistake can easily damage its original structure. Therefore, the method of simulating undisturbed loess using artificial structural loess is adopted to better understand its properties and behavior. The structural properties of loess involve the characteristics of soil particles and pores in terms of morphology, size, and spatial distribution. We also focus on the bonding effect between soil particle skeletons, which is very important for maintaining the stability and integrity of loess structures [1,2,3]. In recent years, with the acceleration of urbanization, the seismic safety of underground engineering has faced severe challenges [4,5]. Due to the structural characteristics of loess, it is sensitive to dynamic loads such as earthquake loads, traffic loads, etc. Under dynamic loads, the loess particles will vibrate and rearrange, causing cracks in the soil structure and reducing the strength of the loess [6,7]. In this context, numerous scholars have explored the preparation of artificial soil and conducted in-depth research on its feasibility and effectiveness. Related research results show that artificial structural soil is more regular and uniform in structure and has higher strength [8,9,10,11,12].
Some scholars have studied the mechanical properties of improved loess and concluded that improved loess has a more stable structure, enhancing soil stability and improving dynamic characteristics. Xu et al. [13] investigated the effects of acid rain on the microstructure and mechanical properties of cement-modified loess. The researchers exposed treated soil samples to simulated acid rain with varying pH levels and analyzed changes in strength and microstructure using confined compression tests and scanning electron microscopy (SEM). The results demonstrated that as the acid rain acidity increased, the modified soil’s unconfined compressive strength (UCS) gradually decreased. Concurrently, the pore structure shifted from tiny pores to larger meso- and macro-pores, leading to the collapse of some loosely packed pore frameworks. The chemical interaction between the acid rain solution and cement-stabilized soil contributed to increased solution acidity, primarily due to the dissolution of calcium carbonate and other mineral components. Zhang et al. [14] successfully replicated natural loess’s collapsibility characteristics and structural features through an artificial preparation method. The study prepared synthetic loess samples by adding industrial salts, calcium oxide, and gypsum powder to remolded soil. Experimental results demonstrated that the engineered loess exhibited superior overall performance to natural samples, with its collapsibility effectively regulated by adjusting the percentage of industrial salts. Test data revealed that as the salt content increased, the structural parameters of the artificial loess showed an initial increase followed by a decreasing trend during the shearing process. Notably, significant differences were observed in the variation patterns of structural parameters between artificially prepared loess samples and undisturbed natural specimens under different confining pressure conditions. Axel et al. [15] found the mechanical characteristics of cement-reinforced loess through bending strength and unconfined compressive strength tests. The results indicate that cement and soil particles are interconnected to form a cement grid, reducing the pores in the soil and improving its stability. Chen et al. [16] showed the engineering properties of loess treated with red mud (RM) industrial waste and minimal cement (CL) content. The RMC-treated loess exhibited remarkably reduced water sensitivity alongside enhanced dynamic modulus (DM-E), demonstrating a 150 kPa increase in dynamic cohesion compared to untreated soil. Notably, a significant improvement in dynamic characteristics was maintained even at elevated moisture contents. Leaching tests further verified that the concentrations of hazardous elements in RMC-treated loess were substantially below regulatory thresholds, confirming this approach as an environmentally sustainable solution that offers dual economic and ecological advantages.
Some researchers have studied the microstructure of improved loess and found that the structure of loess becomes denser, effectively converting macropores and mesopores into micropores while improving overall compaction. Chen et al. [1] introduced an innovative approach for fabricating ASL specimens by adding quicklime (CaO) to loess, which triggered calcium carbonate cementation formation. Their systematic study examined how CaO incorporation alters loess’s mechanical characteristics. Laboratory tests demonstrated that CaO addition actively facilitated CaCO₃ precipitation, with the newly formed calcium carbonate crystals showing homogeneous dispersion within the ASL matrix. The cementation process effectively bonded adjacent soil particles through CaCO₃ precipitation, leading to substantial soil structure densification. This microstructural modification considerably improved the loess’s shear resistance capacity. Moreover, the uniform coating of soil particles by calcium carbonate precipitation effectively diminished the material’s susceptibility to water. Yang et al. [17] studied the mechanical improvement of loess through stabilization with cement and silica fume. Direct shear and triaxial tests were performed to assess the shear strength characteristics under different admixture ratios. The experimental results showed that the combination of silica fume and cement significantly enhanced the shear resistance of loess, with an optimal mix proportion of 10% silica fume and 3% cement. At a confining pressure of 200 kPa, the stabilized loess demonstrated a 34.9% increase in shear strength compared to untreated samples. SEM indicated that hydration products from both additives created gel-like matrices around soil particles, effectively converting macro- and mesopores into micropores while improving overall compactness. Increasing cement content will gradually improve the soil’s shear and unconfined compressive strength. Yuan et al. [18] systematically investigated the mechanical properties of cement-stabilized loess (CSL) with varying cement contents. The experimental data indicated that the UCS and shear strength of CSL specimens showed an increasing trend with higher cement addition. A particularly noteworthy finding was that when the cement content was below 2%, these mechanical parameters displayed rapid improvement, whereas the enhancement rate became less pronounced when exceeding this threshold. SEM microstructural analysis revealed that the cement-treated loess developed a more compact fabric, with the near disappearance of inter-aggregate voids. Concurrently, the proportion of micropores increased significantly while meso- and macropores were substantially reduced.
Most scholars have studied the shear and unconfined compressive properties of artificial structural loess and have demonstrated that artificial structural loess can simulate the structure and mechanical characteristics of intact loess. However, there is a paucity of research concerning its dynamic deformation effects. Therefore, this article uses the British GDS dynamic triaxial test instrument to conduct artificial structural loess dynamic deformation influence tests, and analyzes the impact of CP, dry density, and cement content on loess dynamic deformation and damping ratio. The DM-E of loess was predicted using Hardin–Drnevich’s hyperbolic model. Based on the results of macroscopic mechanics experiments and microscopic experiments, a surface model was established to describe the influence of different microscopic structure levels on the dynamic elastic modulus of artificial structural loess. This study can guide the dynamic deformation problem in loess areas.

2. Materials and Methods

2.1. Test Materials

The test loess was taken from Chang’an District, and the soil extraction site is shown in Figure 1. The depth of soil extraction was between 2.0 m and 3.0 m. Suitable square soil samples were cut out on the side walls of the pit, wrapped in multiple layers of black plastic bags, and sealed tightly by wrapping the soil blocks in all directions with transparent adhesive tapes to ensure that the moisture was not lost as much as possible. The above and below surfaces of the soil blocks were marked. The basic physical properties of loess are shown in Table 1
The particle grading of the loess selected in this paper is determined by the screening method (0.075–0.5 mm particle size) and the density meter method (less than 0.075 mm particle size), as shown in Figure 2.
The edible salt used in the test was purchased from Cangzhou Salt Group Yinshan Salt Co., Ltd. (Huanghua, China). Its appearance is white or gray-white, mostly irregular poly prismatic crystals. Its chemical properties are relatively stable, with good water solubility. The physical characteristics are shown in Table 2.
Quick condensation PO52.5 cement from Tangshan Jidong Cement Co., Ltd. (Beijing, China) is an early-strength, non-radioactive green product; its appearance is usually gray and white. The physical characteristics are shown in Table 3.

2.2. Sample Preparation

Sift the selected loess through a 2 mm sieve and dry it. Weigh a certain mass of dry soil according to different dry densities, then weigh 2% of the edible salt and the required cement mass for the experimental plan. Mix edible salt with cement in the soil and stir with water. Then, seal it and let it stand for 24 h to evenly distribute the moisture in the soil. After geotechnical testing standard GB/T 50123-2019 [19], the sample size used is 39.1 mm × 80 mm. The procedure for the specimen preparation is described in Figure 3.

2.3. Test Method

The British GDS dynamic three-axis test instrument was used to study the influence of artificial structural loess dynamic deformation characteristics. The fixed salt content is 2%, and the optimal moisture content is 15.4%. According to the geotechnical testing standard (GB/T50123-2019) [19], the test CP was determined to be 100 kPa, 150 kPa, and 200 kPa by sampling depth. Based on previous research results, the dry densities were determined to be 1.20, 1.40, and 1.60 g/m3 [13], and the cement content was 0, 1, 2, and 4%, respectively [1,17]. The dynamic triaxial test adopts a sine wave simulation of a cyclic load with a loading frequency of 1 Hz. We then performed the step-by-step loading of the soil sample, with 10 vibrations per step. The termination condition for this triaxial test is that the axial dynamic strain of the specimen reaches 5% or the number of vibrations reaches 10,000 times. The experimental design is shown in Table 4.

3. Results

3.1. Analysis of the Influence of CP on the DM-E of Artificial Structural Loess

The CP mainly influences the DM-E of undisturbed soil and artificial structural soil. When the dry density and cement content are constant, the higher the CP and the greater the DM-E. Figure 4 shows the Edεd relationship curves for a cement content of 2% and different CP at dry densities of 1.20, 1.40, and 1.60 g/m3. The higher the dry densities, the smaller the difference in DM-E between different CPs. With the same dry density, the higher the CP and the greater the DM-E of the soil. As the dynamic strain increases, the DM-E shows a gradually decreasing trend. The peak value of the Edεd curve is the highest when the CP is 200 kPa. This is because in the initial stage, as the CP increases, the contact between soil pellets becomes tighter, the amount of points of contact between them increases, the soil pores decrease, and stress can be more effectively transmitted, thereby exhibiting a higher DM-E, which is in line with the conclusion of reference [17]. By raising the dynamic strain, the original balance between soil particles is broken, and the soil structure gradually becomes loose and unable to resist stress so that the DM-E will decrease effectively. When the dry density is 1.20 g/m3 and the cement content is 2%, the DM-E of artificial structural loess is similar to that of undisturbed loess.

3.2. Analysis of the Influence of Dry Density on the DM-E of Artificial Structural Loess

Figure 5 shows the Edεd relationship curves of cement content of 2% and different dry densities under CP of 100, 150, and 200 kPa to demonstrate the effect of dry density on the DM-E of artificial structural loess. As can be seen from the figure, the higher the dry density, the higher the DM-E of soil, and the stronger the resistance to deformation, the more consistent the findings are with the conclusions presented in the references [14]. With the rise in CP, the DM-E of soil also increases gradually. With the rise in dynamic strain, the DM-E gradually decreases. Under the CP of 200 kPa, the dry density of 1.20 g/cm3 starts to slow down when the dynamic strain is 0.50%, and the dry density of 1.60 g/cm3 starts to slow down when the dynamic strain is 1.50%, indicating that the higher the dry density, the stronger the resistance to deformation. At CP of 100 kPa and 200 kPa, the initial DM-E of 1.60 g/cm3 with dry density is 23.77 MPa and 35.66 MPa higher than that of 1.20 g/cm3 with dry density. This is because as the dry density increases, soil porosity decreases, and the soil particles are arranged more closely, which limits soil deformation and thus exhibits a higher DM-E. As dynamic strain increases, the soil particle structure is constantly destroyed, and the soil’s resistance to distortion decreases, so the DM-E decreases gradually. Figure 4 and Figure 5 show that the dynamic modulus trend fluctuates under different confining pressures and dry densities. This may be due to the structural damage to the soil structure caused by structural loess under dynamic loads, resulting in data fluctuations.

3.3. Analysis of the Influence of Cement Content on the DM-E of Artificial Structural Loess

The DM-E of the soil is influenced by the cement content used. Figure 6 shows the Edεd relationship curves of 1.20 g/cm3 dry density and CP of 100, 150, and 200 kPa with different cement content. It can be seen from the figure that the addition of cement slows down the rate at which the Edεd curve becomes flat, and the more cement is added, the higher the DM-E of soil and the stronger the resistance to deformation. When the dry density is 1.20 g/cm3, and the cement content is 1, 2, and 4%, the maximum DM-E under 150 kPa CP is 53.64, 65.30, and 80.42 MPa. This is because the cement content represents the cementation state of the soil; the higher the cement content, the better the soil cementation; the higher the contact area between the soil pellets, the more adequate the contact between the particles; the more potent the occluding ability, the more difficult it is for the soil particles to mismove each other; the less susceptible the soil is to deformation during stress, that is, the greater the external force required to produce a specific shear strain, which is reflected in the higher value of the DM-E. The findings are consistent with the conclusions presented in the references [15].

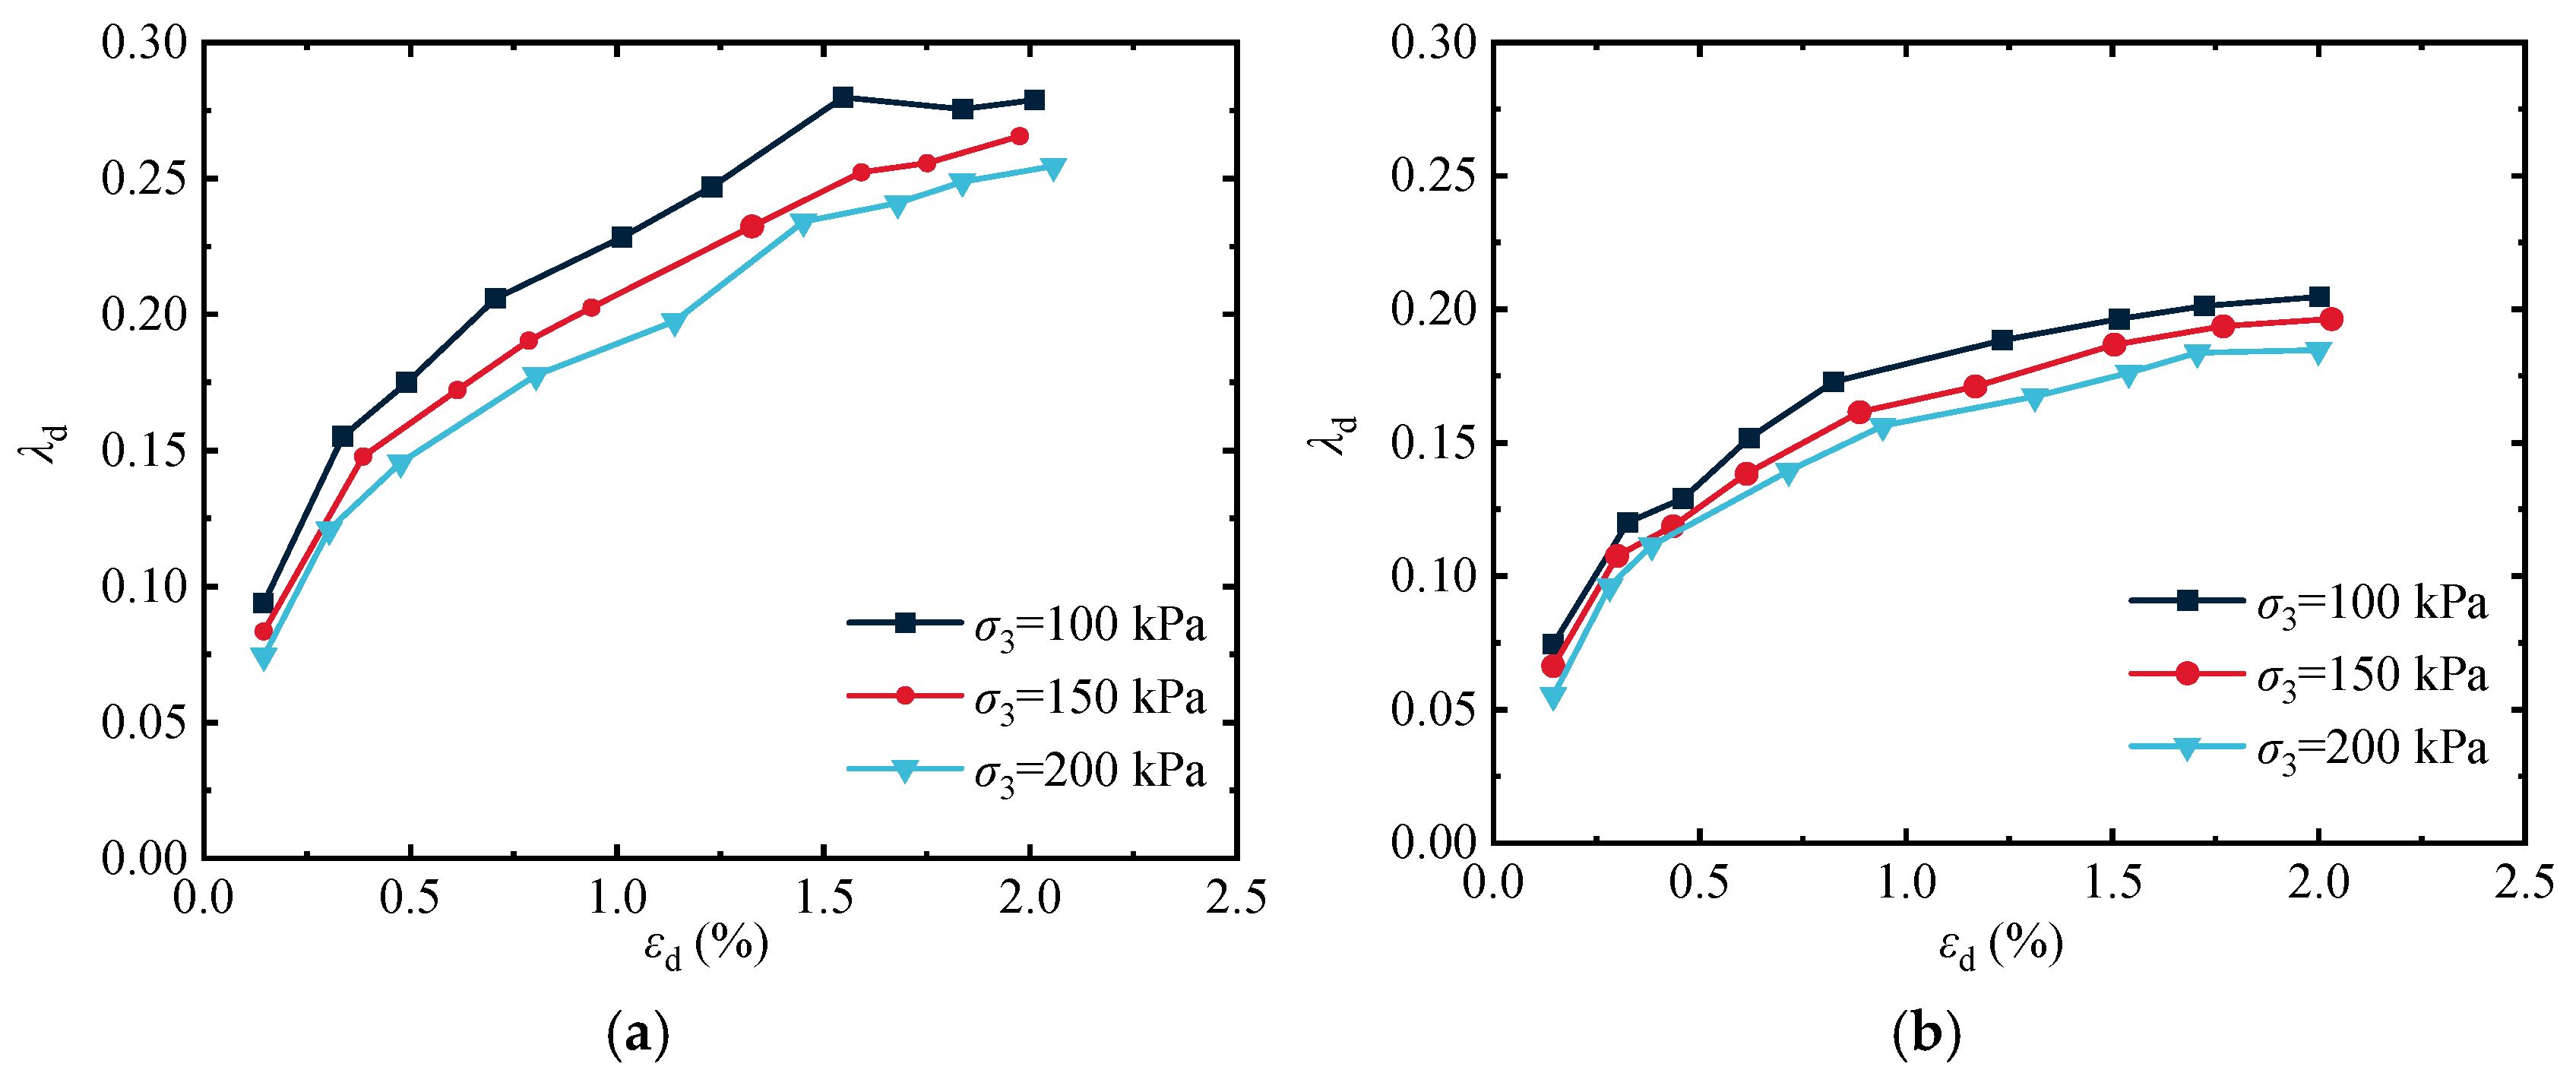
3.4. Analysis of the Influence of CP on the Damping Ratio of Artificial Structural Loess

The damping fraction λ of soil reflects the hysteresis of the relationship between dynamic stress and dynamic strain caused by internal friction between particles under cyclic load, indicating that the energy of cyclic load dissipates due to the internal resistance of the soil. The result mainly leads to vibration attenuation; the soil with a sizeable damping ratio will have more excellent vibration attenuation and energy dissipation under dynamic load. The damping ratio calculation diagram is shown in Figure 7.
λ = 1 4 π W Δ W .
Formula λ is the damping fraction; ΔW is the area of the closed interval enclosed by the hysteresis curve; the soil acts on cyclic loads dissipated energy; W is the area of the triangular ABO, the total energy of the dynamic load action in the cycle.
Figure 8 shows the correlation between damping fraction and dynamic strain at different dry densities with a cement content of 2% under CP of 100, 150, and 200 kPa. It can be observed that the damping ratio of soil increases rapidly with the development of dynamic strain. When the dynamic strain εd > 2%, the damping ratio stabilizes to a specific value, reaching the maximum damping ratio. When the dry density is constant, the damping fraction of artificial structural loess increases with the increasing dynamic strain and decreases with the rising CP. When the CP is continuous, the damping ratio will slowly increase with the increase in the dry density. This phenomenon occurs because the consolidation CP exerts axial tension on the soil, restricting the relative motion between particles and weakening the energy dissipation mechanism. Under higher CP, the overall structure of the soil becomes more stable, local deformation is suppressed, and energy is not quickly dissipated, resulting in a decrease in the damping fraction, which is in line with the conclusion of reference [20]. The number of contact points between soil particles increases as the dry density increases. Under dynamic action, the friction between particles is enhanced, allowing the soil to dissipate vibration energy more effectively.

4. Study on Dynamic Elastic Modulus Model of Artificial Structural Loess

4.1. Model Establishment

Experimental results indicate that the soil has viscoelastic characteristics under dynamic loads so that the soil can be equivalent to a viscoelastic body, and the dynamic stress–strain relationship of the soil can be studied using a viscoelastic model. Studies have shown that the DM-E of artificial structural loess conforms to H-D’s hyperbolic model [21,22]. Based on this, the dynamic stress–strain curve of artificial structural loess is fitted, the corresponding model parameters of H-D are calculated, and the influence of different factors on the H-D model parameters is analyzed.
a = 1 E 0 ,
where a is the parameter and E0 is the initial elastic modulus.
σ d = ε d a + b ε d ,
where σd is the dynamic stress in the axial direction acting on the soil sample, εd is the recoverable axial dynamic strain, and b is the model parameter.
Equation (1) becomes converted to
E d = σ d ε d = 1 a + b ε d ,
where Ed is the DM-E, when εd→0, Edmax = 1/a, Edmax is the maximum DM-E.
Equation (4) can be converted to
1 E d = a + b ε d .

4.2. Model Parameter Acquisition

Table 5 shows the fitting data for cement dosages of 0, 1, 2, and 4% and dry densities of 1.20, 1.40, and 1.60 g/cm3 under CP of 100, 150, and 200 kPa. The coefficient of determination shows that the fitting effect is good, with an average determination coefficient of 0.955. Under the exact cement dosage and CP conditions, the values of a and b decrease as the value of dry density increases; that is, the initial DM-E increases with the rise in dry density. At the exact CP and dry density conditions, the initial DM-E increases by increasing cement content. Under the precise cement dosage and dry density conditions, the initial DM-E increases with the rise in CP. According to the H-D model fitting parameters, it is possible to see that the artificial structural loess with a dry density of 1.20 g/cm3 and a cement content of 2% can simulate the selected undisturbed loess in this experiment well.

4.3. Model Verification

The measured values are compared to the predicted values to verify model reliability. Figure 9 shows the 1/Edεd fitting curves of undisturbed loess with a cement content of 2% and different CP at dry densities of 1.20, 1.40, and 1.60 g/cm3. The graph shows that the measured results agree with the predicted results, with a positive correlation. The average coefficient of determination is 0.955, indicating that H-D’s hyperbolic model is appropriate for studying the DM-E of artificial structural loess.

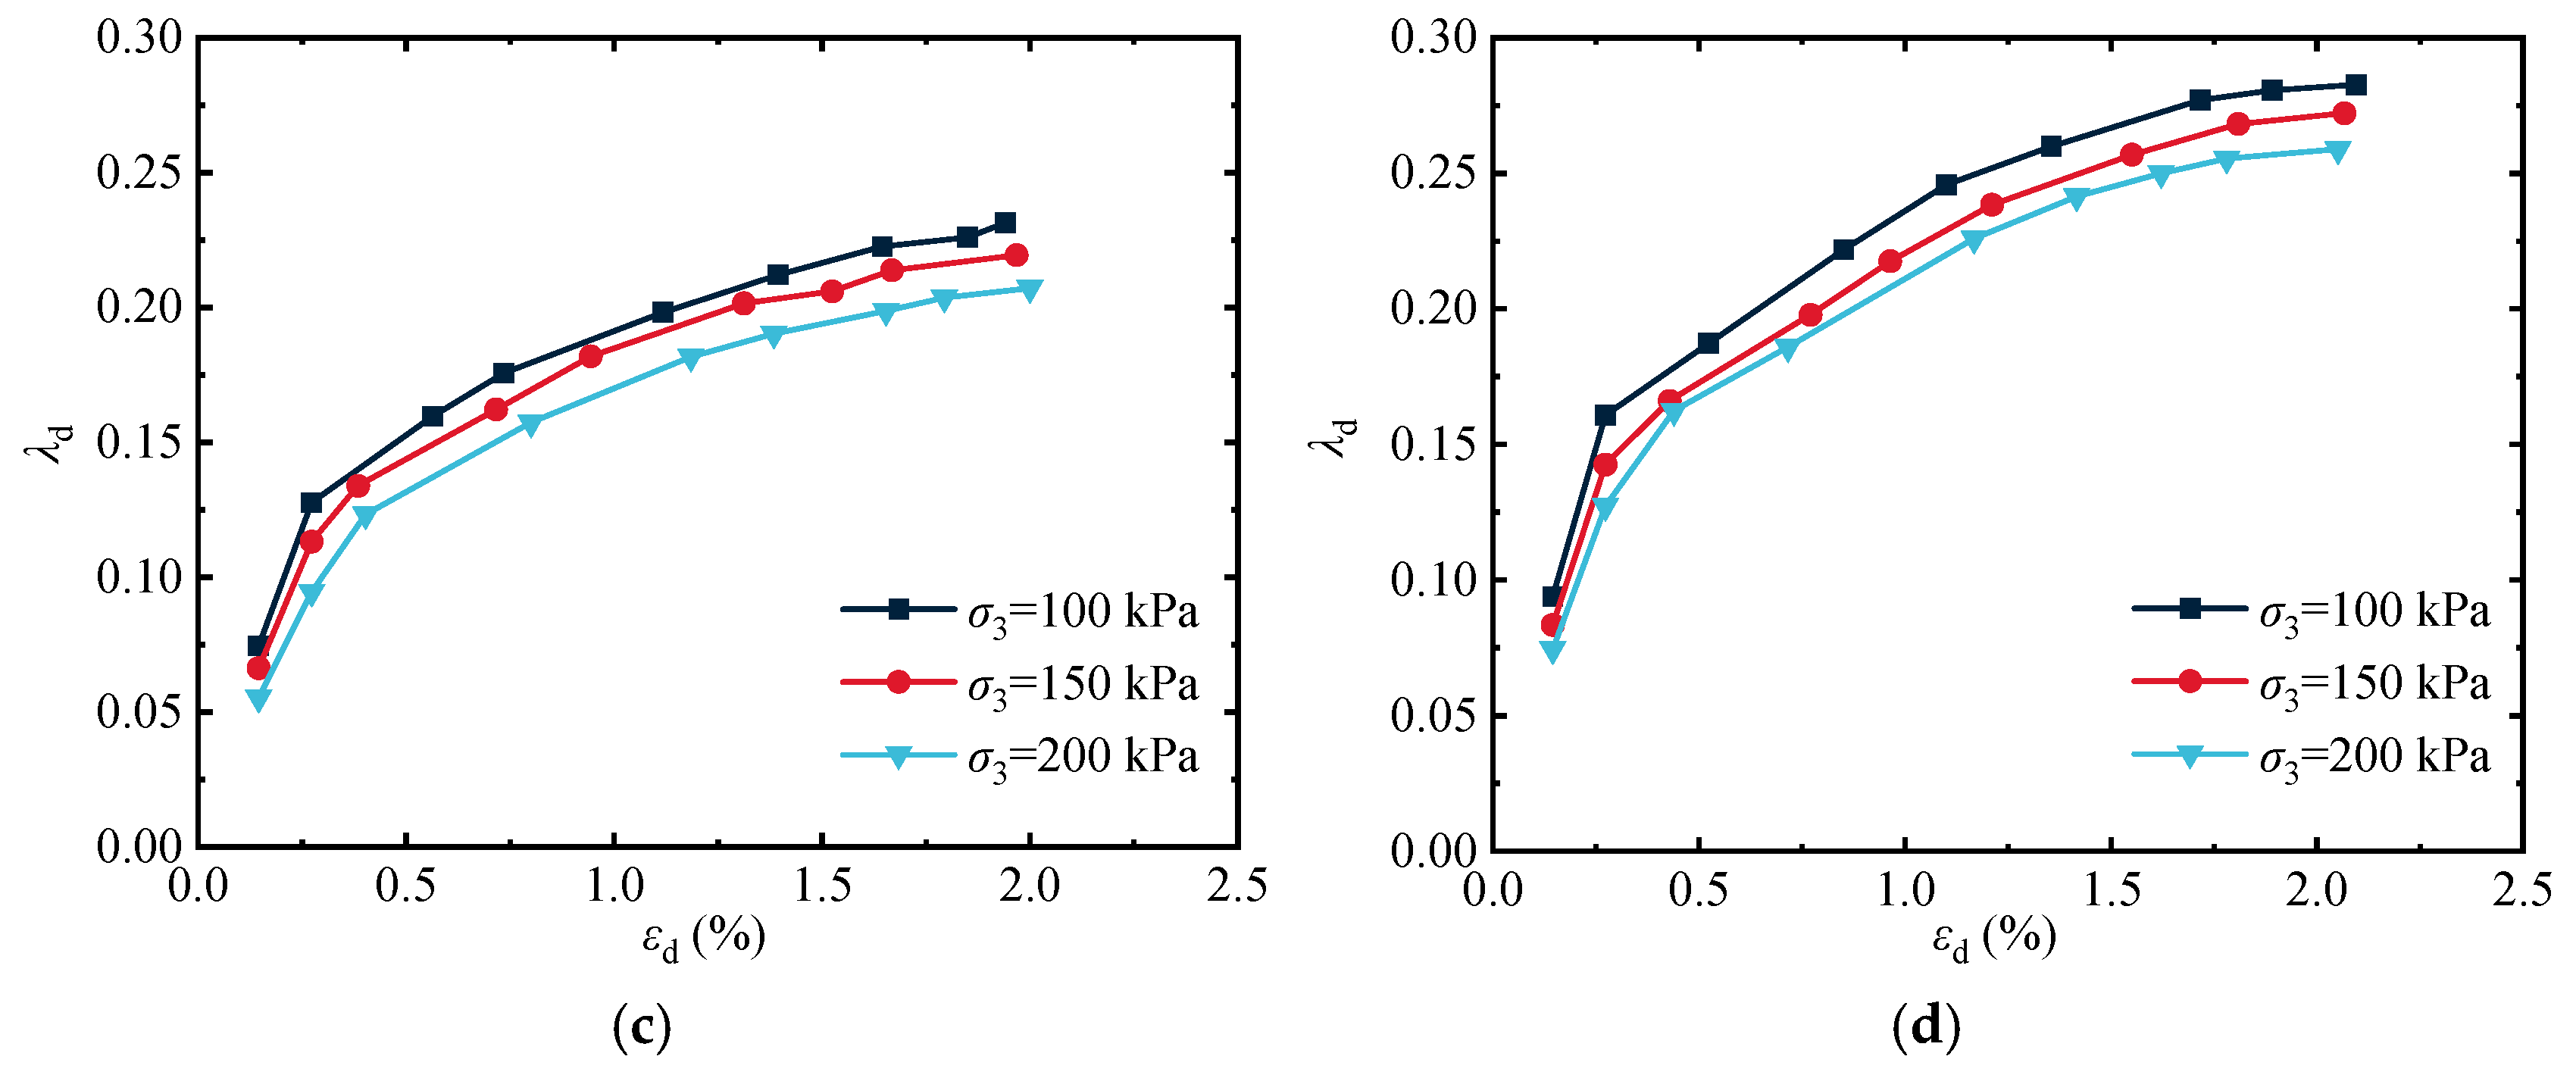
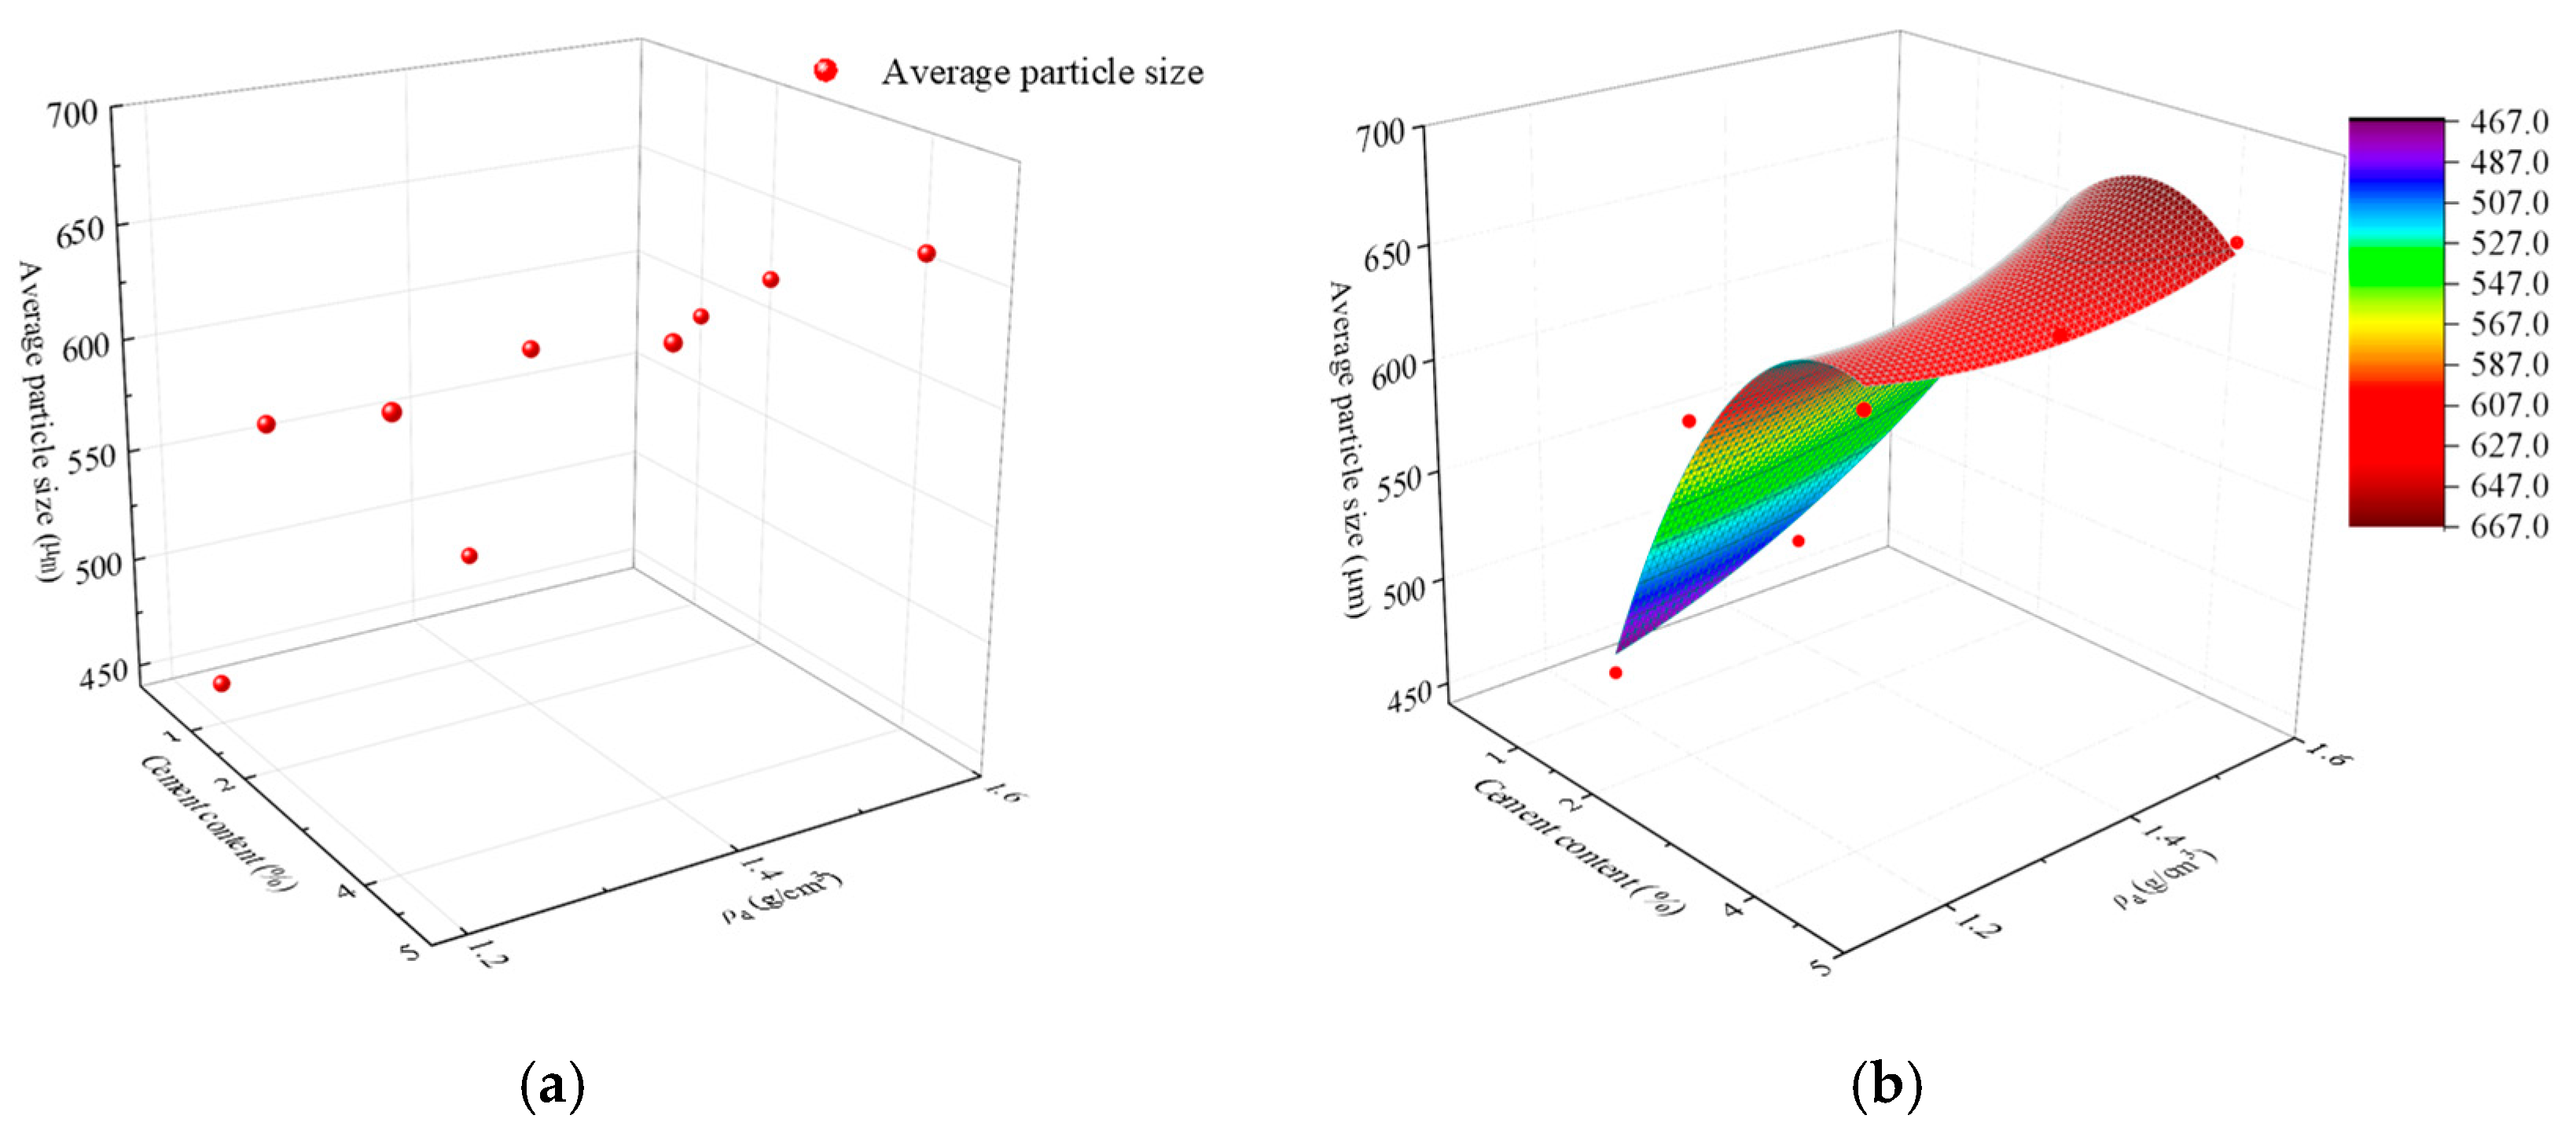
5. The Relationship Between Microstructure and Maximum Dynamic Modulus of Artificially Structured Loess

As illustrated in Table 6, the particles’ microstructure parameters were acquired through particle analysis and mercury intrusion tests. A three-dimensional model was created to indirectly represent the relationship between cement content, dry density, average particle size, proportion of large pores, and maximum dynamic elastic modulus.
Figure 10a,b illustrates the nonlinear curved surface model established from the artificial structural loess experimental data. The model’s average particle size, cement content, and dry density are considered variables, with a goodness of fit R2 of 0.9470.
d ¯ = 1552 + 352.24 D 2447.56 ρ d 24.67 D 2 + 1177.88 ρ d 2 144.01 D ρ d ,
where d ¯ is the average particle size, D is the cement content, and ρd is dry density.
It is evident that the three-dimensional surface model of the average particle size, cement content, and dry density of artificially structured loess under varying conditions exhibits a “platform shape”. Taking the Z-axis as the focus of the study, as the cement content increases, the color scale of the model transitions from purple to red, indicating a gradual increase in the average particle size. When the cement content and dry density reach their maximum values simultaneously, the average particle size also peaks. Therefore, when the cement content and dry density of artificial structural loess are at their highest, the average particle size attains its maximum value.
Figure 11a,b illustrates the nonlinear surface model depicting the relationship between the proportion of large pores in artificially structured loess, cement content, and dry density, with a goodness of fit R2 of 0.9745.
n = 50.82 366.36 D 12.46 ρ d ,
where n is the proportion of macropores.
The analysis results indicate that under varying conditions, the proportion of large pores, cement content, and dry density of artificial structural loess display a “slope” shape in the three-dimensional surface model. Considering the Z-axis as the research focus, an increase in cement content leads to a noticeable change in color depth, transitioning from red to blue. At the same time, the proportion of large pores gradually decreases. When the cement content of artificial structural loess is 2%, and the dry density is 1.60 g/cm3, the proportion of large pores decreases slowly. The 3D surface model shows that the corresponding “slope” surface begins to descend gradually. When the cement content and dry density of artificial structural loess reach their maximum values, the proportion of large pores attains its minimum value.
Figure 12a,b shows the three-dimensional nonlinear relationship model between the average maximum elastic modulus of artificial structural loess, the proportion of large pores, and the average particle size, with a high fitting accuracy R2 of 0.9387.
The average maximum elastic modulus, the proportion of large pores, and the average particle size of artificially structured loess under different conditions exhibit a “slope” shape in the three-dimensional surface model. Taking the Z-axis as the research object, as the average particle size increases, there is a significant change in the depth of color. From blue to red, the average maximum dynamic elastic modulus increases. As the proportion of large pores gradually decreases, the average maximum dynamic elastic modulus increases. When the average particle size of artificially structured loess is the largest, and the proportion of large pores is the smallest, the average maximum dynamic elastic modulus peaks.
By substituting Formulas (6) and (7) into Formula (8), a three-dimensional surface model of the average maximum dynamic elastic modulus of artificial structural loess under different conditions concerning cement content and dry density can be obtained. It can be seen that the three-dimensional surface model of the average maximum dynamic elastic modulus of artificial structural loess concerning cement content and dry density is mutually influenced by dry density and cement content.
E ¯ d max = 126.1 + 0.0593 d ¯ 2.903 n ,
where E ¯ d max is the average maximum dynamic modulus of elasticity.
E ¯ d max = 1084.43 D 108.96 ρ d 1.46 D 2 69.85 ρ d 2 8.54 D ρ d + 70.58 .

6. Conclusions

Conduct dynamic triaxial tests using a GDS bidirectional dynamic triaxial testing system to analyze consolidation CP, cement content, and dry density. The influence of artificial structural loess DM-E and using H-D’s hyperbolic model to calculate the corresponding model parameters. The influence of CP on the damping fraction of artificial structural loess was analyzed, and the main conclusions are as follows:
(1)
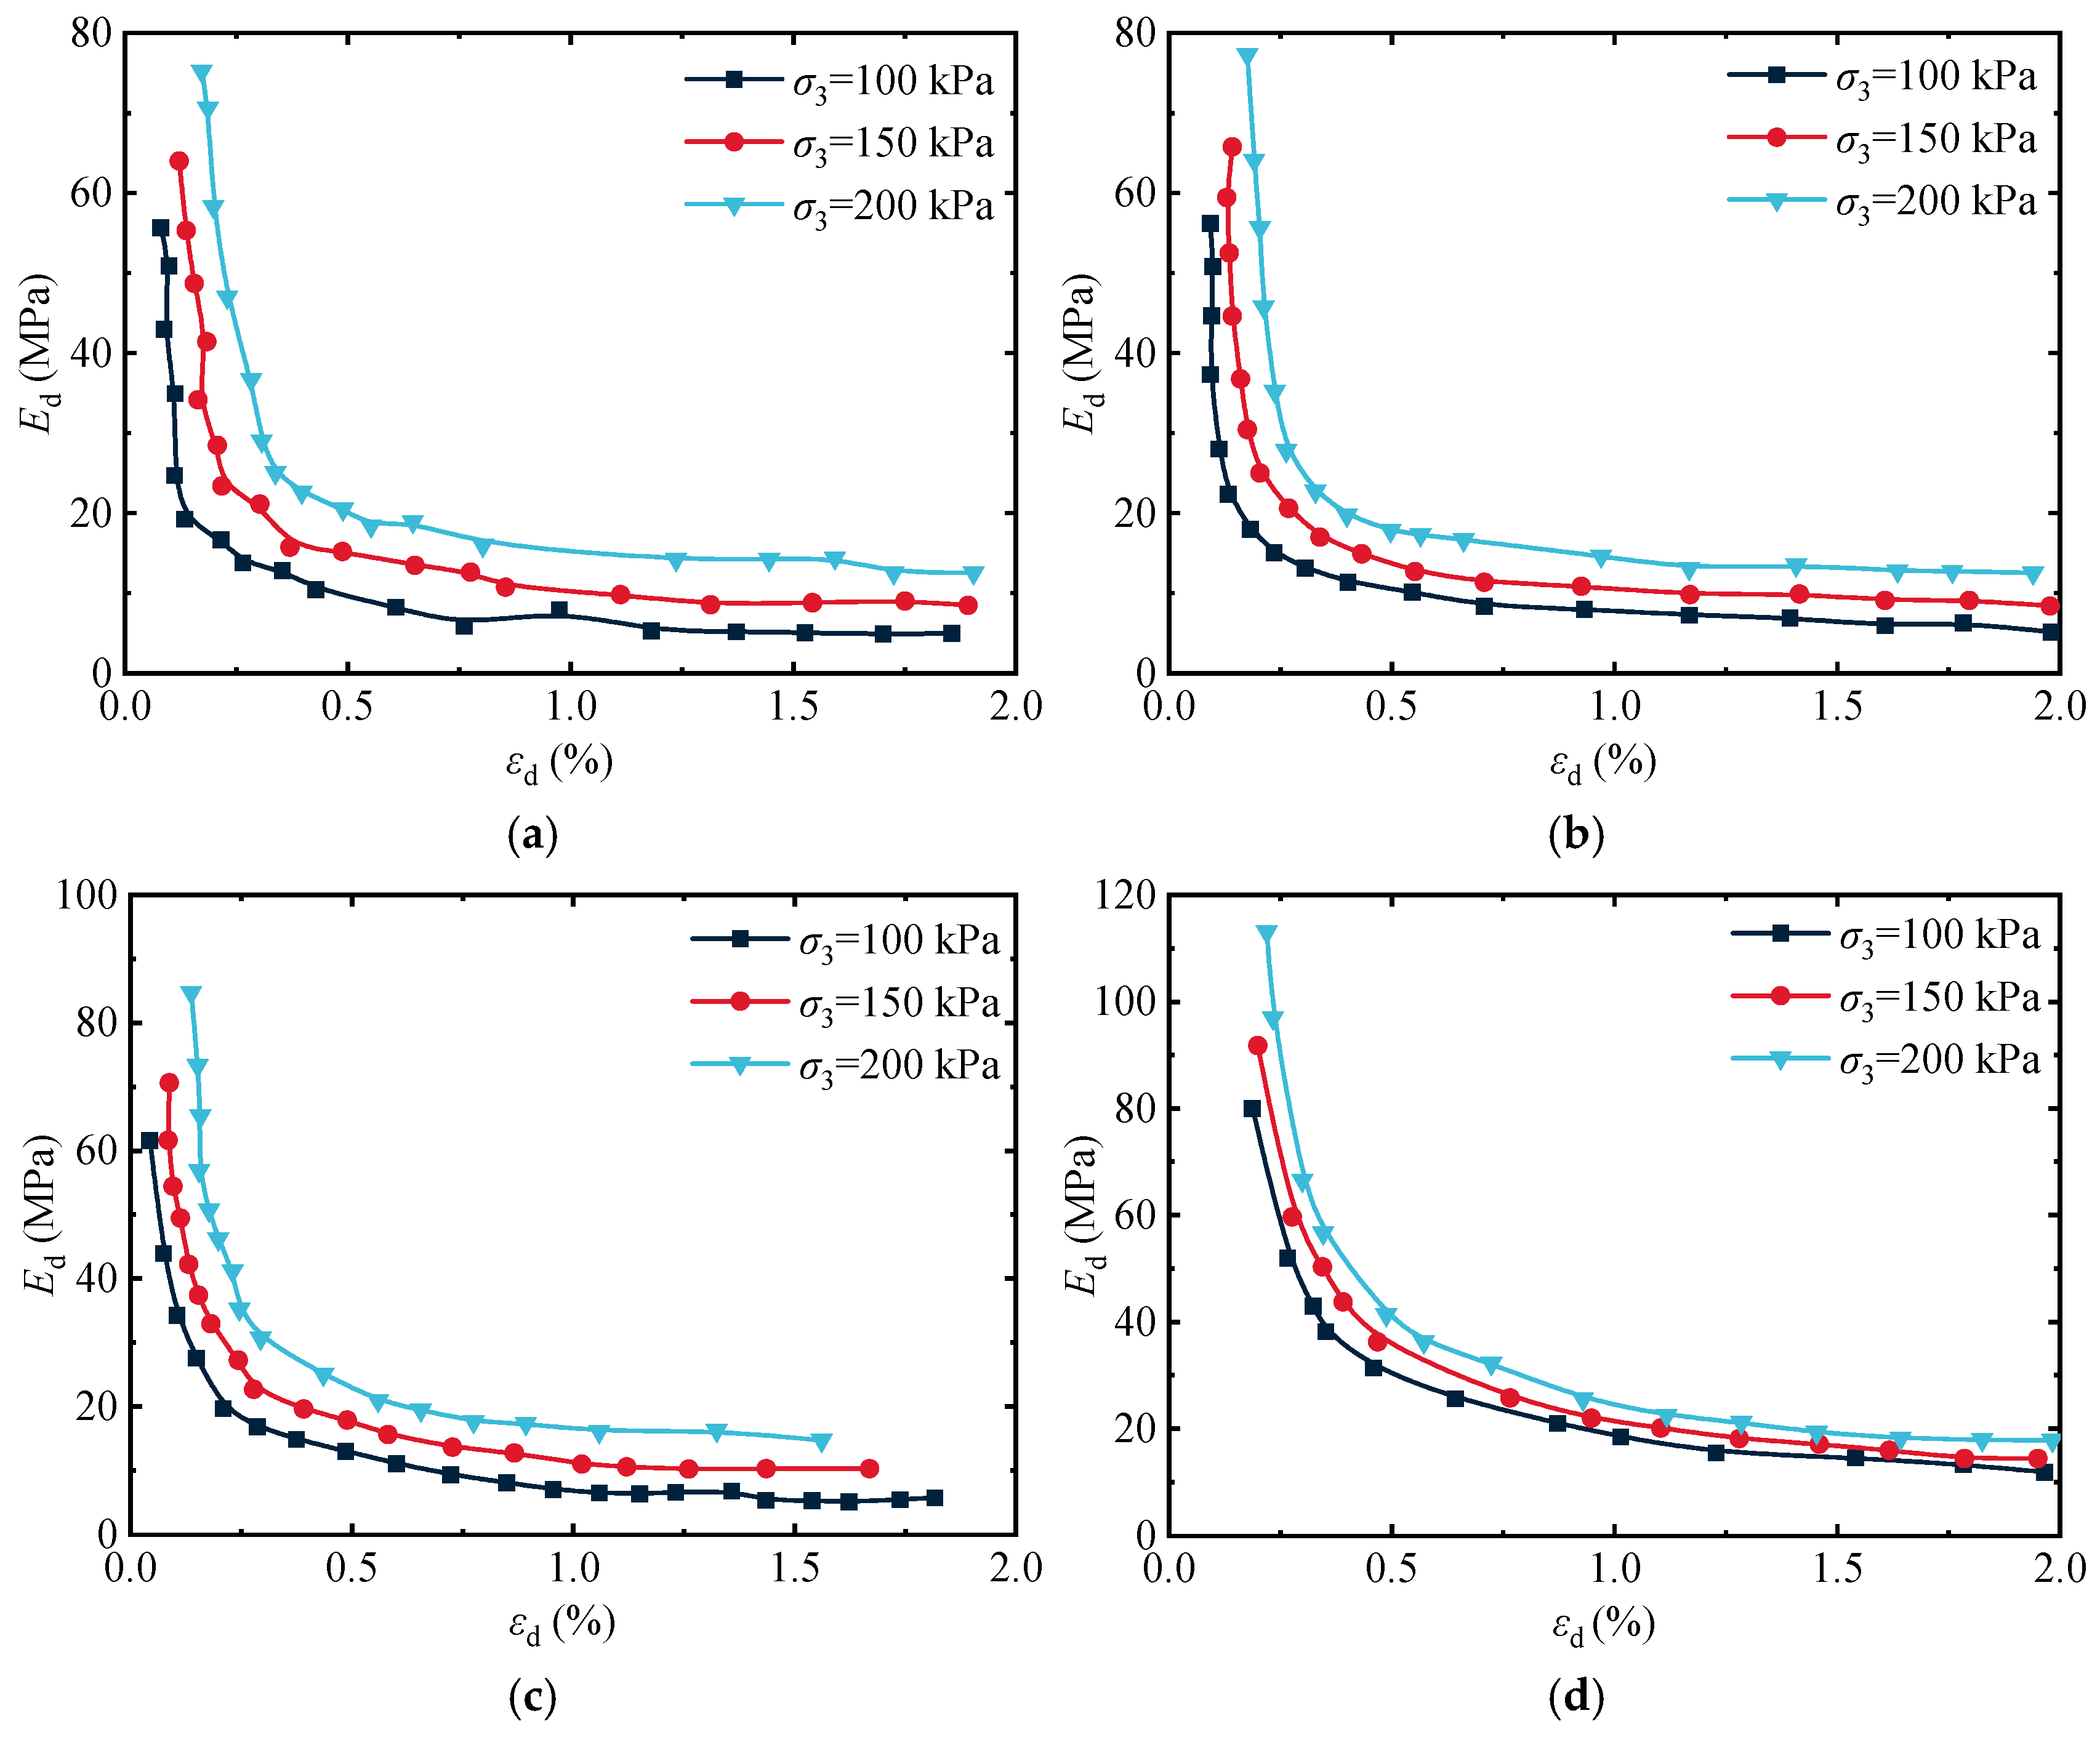
With the CP increasing, the DM-E of the soil gradually increases. As the dynamic strain rises, the DM-E of the soil gradually decreases. This is because, with the rise in CP, the contact between soil particles becomes tighter. Under a CP of 100 kPa, the dynamic elastic moduli of artificial structural loess with a cement content of 2% and dry densities of 1.20, 1.40, and 1.60 g/cm3 are 42.2, 52.7, and 66.1 MPa, respectively.
(2)
Under CP of 100 kPa and 200 kPa, the initial DM-E of soil with a dry density of 1.60 g/cm3 is 23.77 MPa and 35.66 MPa higher than that with a dry density of 1.20 g/cm3, indicating that the higher the dry density, the higher the DM-E of the soil and the more potent its ability to resist deformation.
(3)
When the dry density is 1.20 g/cm3, and the cement content is 1, 2, and 4%, the maximum dynamic elastic moduli under a CP of 150 kPa are 53.64, 65.30, and 80.42 MPa. With the increase in cement content, the bonding properties of the soil become better. As dynamic loading increases, the original balance between soil particles is broken, and the soil structure gradually becomes loose, unable to effectively resist stress so that the DM-E will decrease.
(4)
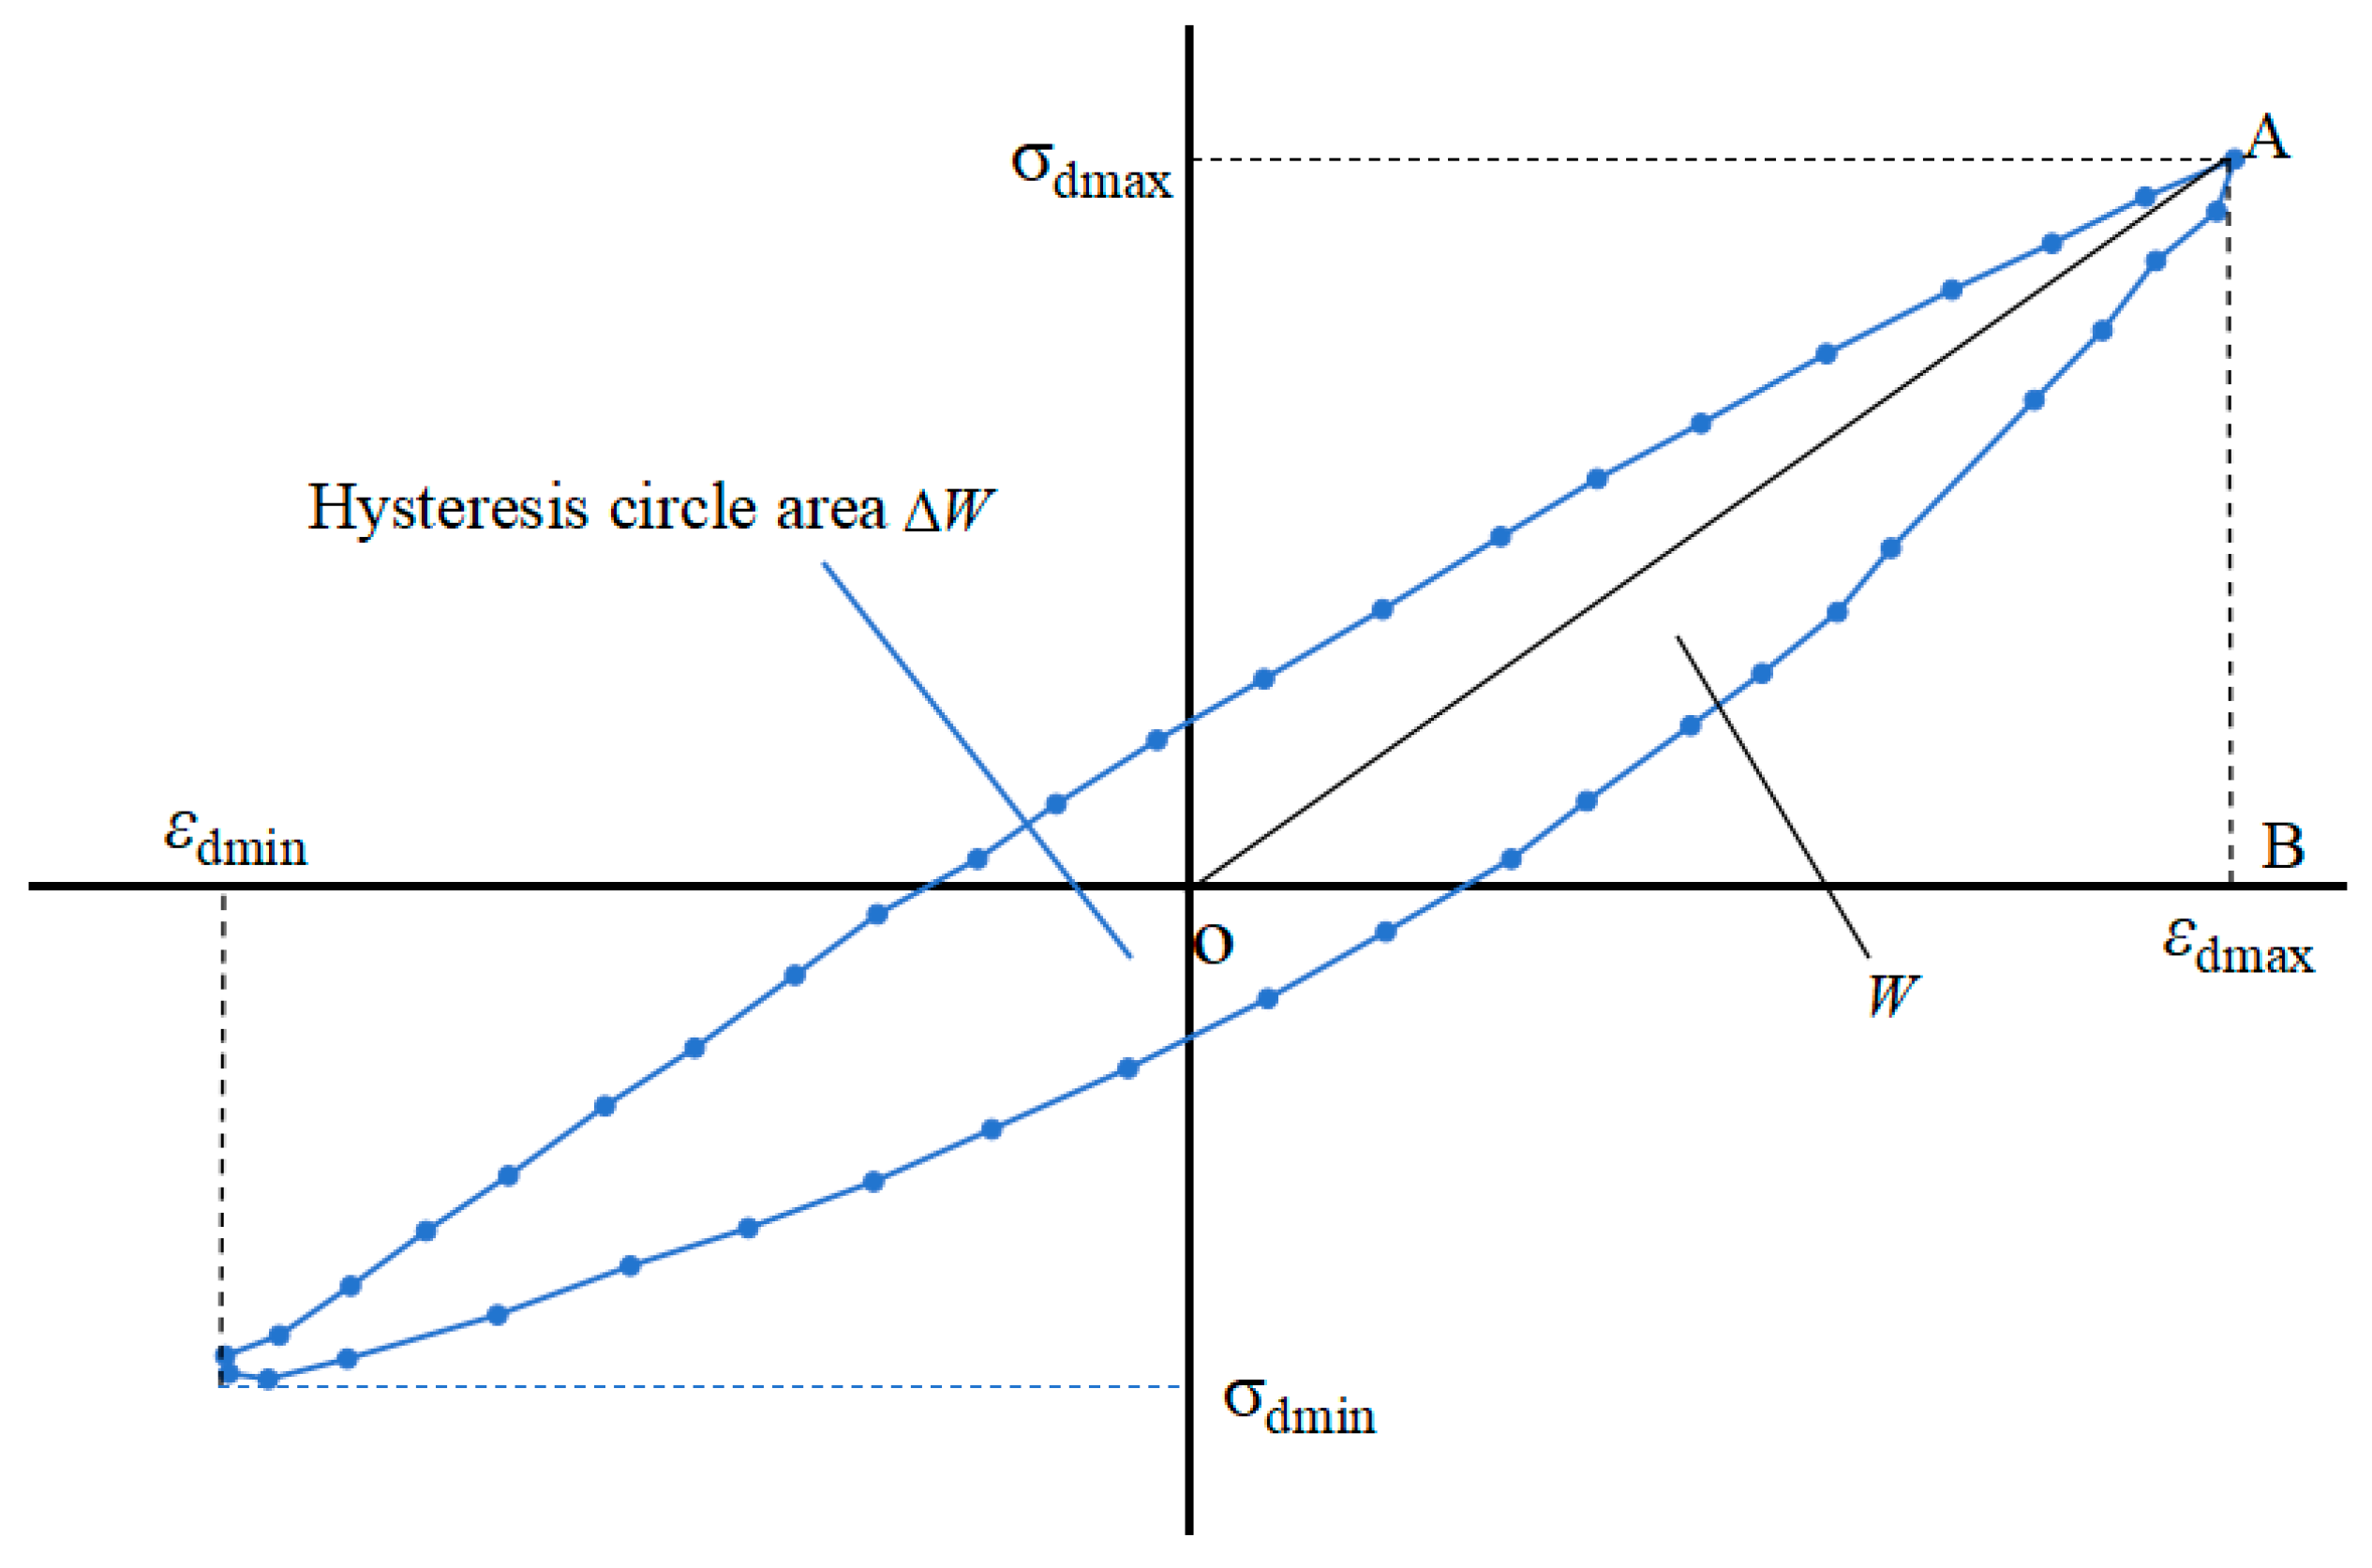
The damping fraction of loess generally shows an upward trend as the dynamic load increases. When the dynamic strain εd > 2%, the damping ratio stabilizes to a specific value, reaching the maximum damping ratio. Moreover, the impact of consolidation CP on the damping fraction also has a precise regularity, manifested as the more significant the CP, the smaller the damping ratio. Cement, as a bonding material, can absorb energy under dynamic loads, raise the damping fraction of the soil, and play a role in vibration reduction.
(5)
The relationship curve between the modulus of elasticity and dynamic strain of artificial structural loess conforms to the H-D hyperbolic model, and the fitting degree of parameters a and b is high. The average correlation coefficient is 0.955, indicating that the experimental and predicted results are promising. The proven model and parameter valuation method are appropriate for studying the DM-E of artificial structural loess.
(6)
Based on the results of macroscopic mechanics experiments and microscopic experiments, a surface model was established to describe the influence of different microscopic structure levels on the dynamic elastic modulus of artificial structural loess. The model is suitable for describing the impact of microscopic structure parameters on the dynamic elastic modulus of artificial structural loess.

Author Contributions

Conceptualization, Y.X.; methodology, M.S. and X.H.; writing—original draft, Y.Y.; validation, Y.Z.; writing—review and editing, M.S.; funding acquisition, Y.X. and Y.Z. All authors have read and agreed to the published version of the manuscript.

Funding

This study was supported by the Natural Science Basic Research Program of Shaanxi Province (2023-JC-QN-0322), the Shaanxi Provincial Department of Education Service Local Special Research Program Project (22JE018, 23JE018, and 23JE019) and the Open Research Fund of the Yangtze River Academy of Sciences (CKWV20231170/KY).

Data Availability Statement

The original contributions presented in the study are included in the article, further inquiries can be directed to the corresponding author.

Conflicts of Interest

The authors declare no conflicts of interest.

References

  1. Chen, H.; Li, H.; Jiang, Y.; Yu, Q.; Yao, M.; Shan, W. Feasibility study on artificial preparation of structured loess. Geosci. Lett. 2022, 9, 21. [Google Scholar] [CrossRef]
  2. Pan, L.; Zhu, J.G.; Zhang, Y.F. Evaluation of structural strength and parameters of collapsible loess. Int. J. Geomech. 2021, 21, 04021066. [Google Scholar]
  3. Li, Y.; Wang, Y.; Aydin, A. Loess structure: Evolution and a scale-based classification. Earth Sci. Rev. 2024, 249, 104665. [Google Scholar] [CrossRef]
  4. Cui, C.; Xu, M.; Xu, C.; Zhang, P.; Zhao, J. An ontology-based probabilistic framework for comprehensive seismic risk evaluation of subway stations by combining Monte Carlo simulation. Tunn. Undergr. Space Technol. 2023, 135, 105055. [Google Scholar]
  5. Meng, K.; Cui, C.; Liang, Z.; Li, H.; Pei, H. A new approach for longitudinal vibration of a large-diameter floating pipe pile in visco-elastic soil considering the three-dimensional wave effects. Comput. Geotech. 2020, 128, 103840. [Google Scholar] [CrossRef]
  6. Qiao, F.; Chang, C.; Bo, J.; Wang, L.; Wang, J. Study on the dynamic characteristics of loess. Sustainability 2023, 15, 5428. [Google Scholar] [CrossRef]
  7. Wu, Z.; Zhang, D.; Wang, S.; Liang, C.; Zhao, D. Dynamic-response characteristics and deformation evolution of loess slopes under seismic loads. Eng. Geol. 2020, 267, 105507. [Google Scholar]
  8. Consoli, N.C.; da Silva, A.; Barcelos, A.M.; Festugato, L.; Favretto, F. Porosity/cement index controlling flexural tensile strength of artificially cemented soils in Brazil. Geotech. Geol. Eng. 2020, 38, 713–722. [Google Scholar]
  9. Zhang, X.; Li, Y.; Liu, Y.; Huang, Y.; Wang, Y.; Lu, Z. Characteristics and prevention mechanisms of artificial slope instability in the Chinese Loess Plateau. Catena 2021, 207, 105621. [Google Scholar] [CrossRef]
  10. Wu, Z.; Xu, S.; Chen, D.; Zhao, D.; Zhang, D. An experimental study of the influence of structural parameters on dynamic characteristics of loess. Soil Dyn. Earthq. Eng. 2020, 132, 106067. [Google Scholar]
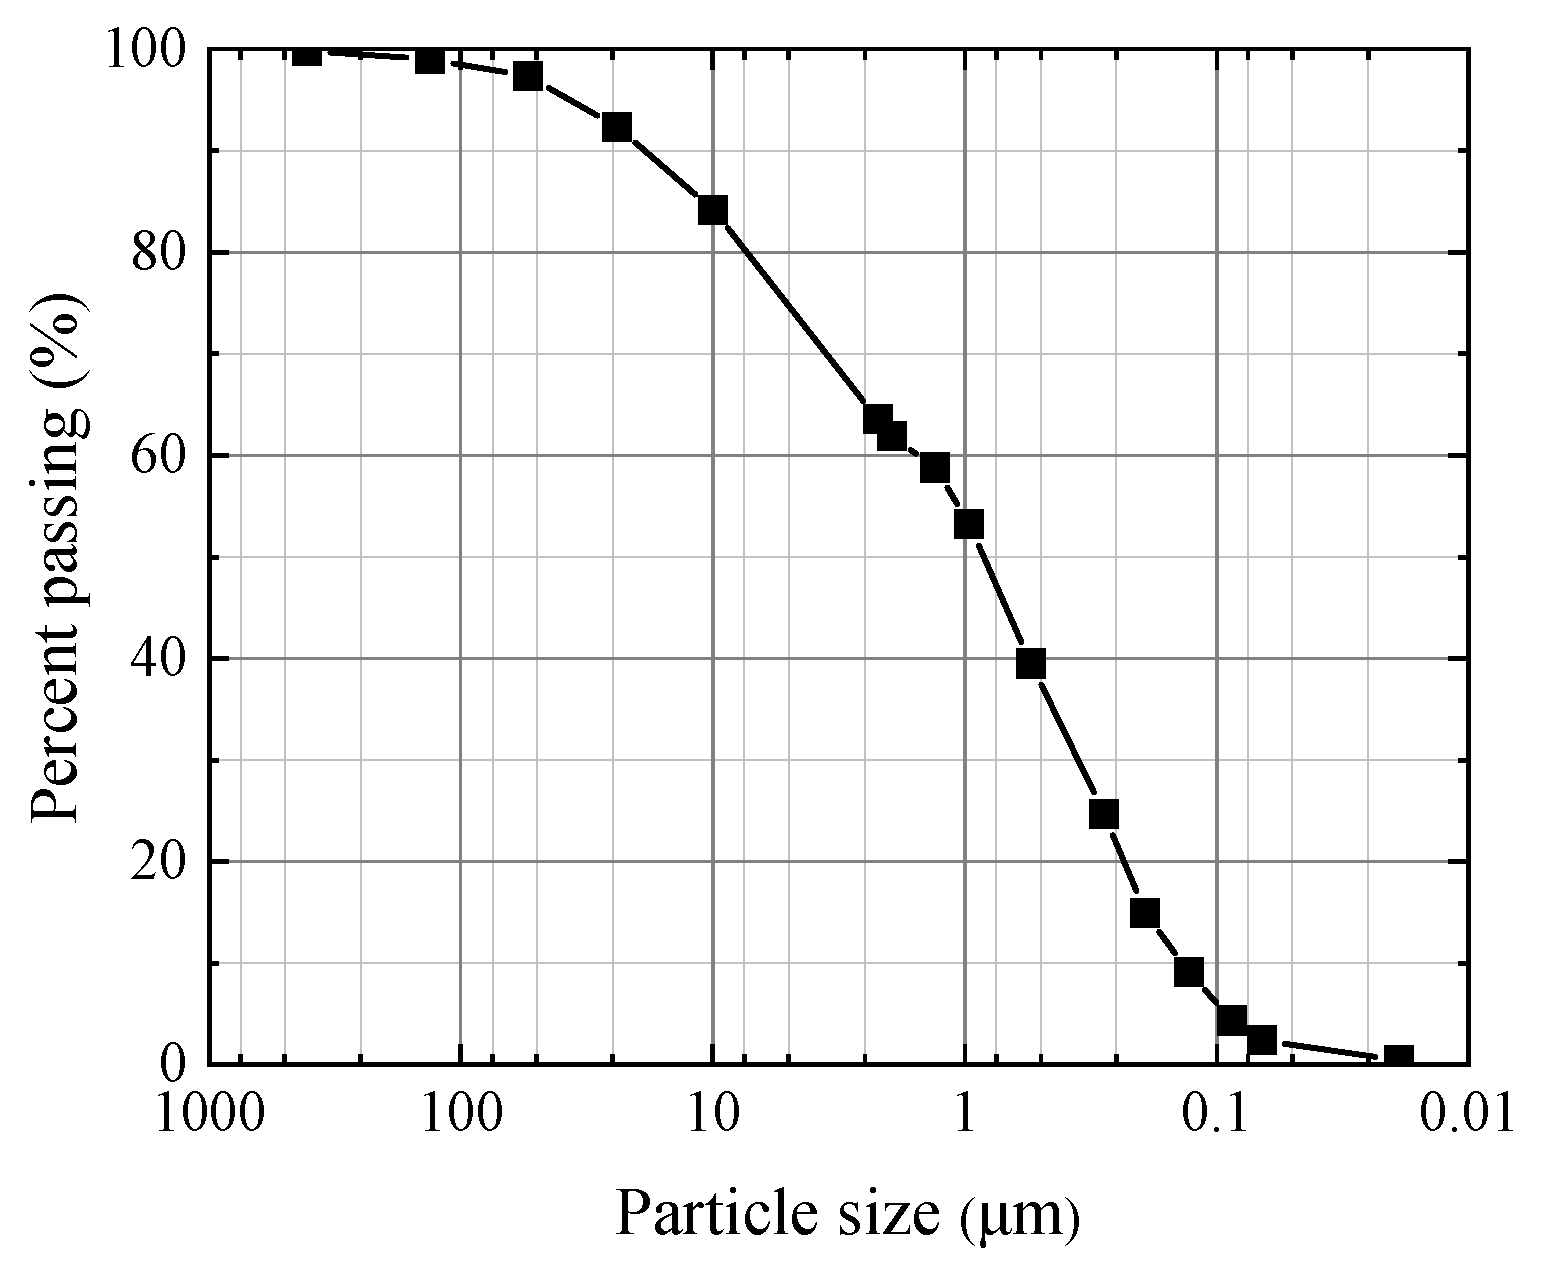
  11. Li, P.; Pan, Z.; Xiao, T.; Wang, J. Effects of molding water content and compaction degree on the microstructure and permeability of compacted loess. Acta Geotech. 2023, 18, 921–936. [Google Scholar] [CrossRef]
  12. Ni, W.; Nie, Y.; Lü, X.; Fan, M. Mechanical behavior and microstructure evolution of Malan loess under dynamic compaction. Environ. Earth Sci. 2024, 83, 76. [Google Scholar] [CrossRef]
  13. Xu, Z.; Wu, Y.; Ma, Q.; Wang, J.; Li, L. Study of the law of strength attenuation and microstructure damage to cement improved loess under acid rain erosion. Environ. Earth Sci. 2024, 83, 555. [Google Scholar] [CrossRef]
  14. Zhang, Y.; Song, Z.; Chen, H.; Ruan, L.; He, S. Experimental study on collapsible and structural characteristics of artificially prepared loess material. Sci. Rep. 2023, 13, 4113. [Google Scholar] [CrossRef]
  15. Axel, M.; Li, X.A.; Wen, F.; An, M.X. Microstructure and strength parameters of cement-stabilized loess. Geotechnics 2023, 3, 161–178. [Google Scholar] [CrossRef]
  16. Chen, R.; Cai, G.; Congress, S.S.C.; Dong, X.; Duan, W. Dynamic properties and environmental impact of waste red mud-treated loess under adverse conditions. Bull. Eng. Geol. Environ. 2021, 80, 93–113. [Google Scholar] [CrossRef]
  17. Yang, X.; Hu, Z.; Li, L.; Wang, X.; Zhou, X. Strength properties, microstructural evolution, and reinforcement mechanism for cement-stabilized loess with silica micro powder. Case Stud. Constr. Mater. 2024, 20, e02848. [Google Scholar] [CrossRef]
  18. Yuan, K.; Liu, K.; Yi, G.; Bowen, Y. Mechanical properties and evolution of microstructure of cement stabilized loess. J. Renew. Mater. 2022, 10, 3611. [Google Scholar] [CrossRef]
  19. G/BT 50123-2019; Standard for Geotechnical Testing Method. Construction Ministry of PRC: Beijing, China, 2019.
  20. Huang, C.X.; Wang, X.H.; Zhou, H.; Qin, D.C. Dynamic elastic modulus and damping ratio of unsaturated red clay. Geotech. Geol. Eng. 2020, 38, 873–881. [Google Scholar] [CrossRef]
  21. Wang, J.; Zhao, M.J.; Zhang, J.Z.; Hao, Y.Z.; He, R.X. Effect of wetting and drying cycles on the dynamic properties of compacted loess. Adv. Civ. Eng. 2022, 8748109. [Google Scholar] [CrossRef]
  22. Liu, W.; Qu, S.; Nie, Z.; Zhang, J. Effects of density and moisture variation on dynamic deformation properties of compacted lateritic soil. Adv. Mater. Sci. Eng. 2016, 5951832. [Google Scholar] [CrossRef]
Figure 1. Overview of sampling locations.
Buildings 15 01198 g001
Figure 2. Xian loess size grading curve.
Buildings 15 01198 g002
Figure 3. Sample preparation process diagram: (a) dry soil; (b) salt; (c) cement; (d) mixed; (e) add water and seal; (f) material loading and sample preparation; (g) finished product.
Buildings 15 01198 g003
Figure 4. Influence of CP on the DM-E of artificial structural loess: (a) ρd = 1.52 g/cm3; (b) ρd = 1.20 g/cm3; (c) ρd = 1.40 g/cm3; (d) ρd = 1.60 g/cm3.
Buildings 15 01198 g004
Figure 5. Influence of dry density on the DM-E of artificial structural loess: (a) σ3 = 100 kPa; (b) σ3 = 150 kPa; (c) σ3 = 200 kPa.
Buildings 15 01198 g005
Figure 6. The impact of cement content on the DM-E of artificial structural loess: (a) σ3 = 100 kPa; (b) σ3 = 150 kPa; (c) σ3 = 200 kPa.
Buildings 15 01198 g006
Figure 7. Schematic diagram of damping ratio calculation.
Buildings 15 01198 g007
Figure 8. Influence of CP on the damping ratio of artificial structural loess: (a) ρd = 1.52 g/cm3; (b) ρd = 1.20 g/cm3; (c) ρd = 1.40 g/cm3; (d) ρd = 1.60 g/cm3.
Buildings 15 01198 g008aBuildings 15 01198 g008b
Figure 9. Comparison of experimental and predicted values under different CP: (a) ρd = 1.52 g/cm3; (b) ρd = 1.20 g/cm3; (c) ρd = 1.40 g/cm3; (d) ρd = 1.60 g/cm3.
Buildings 15 01198 g009
Figure 10. Three-dimensional surface model of artificially structured loess under different conditions: (a) 3D scatterplot of mean particle size; (b) 3D model of average particle size.
Buildings 15 01198 g010
Figure 11. Three-dimensional surface model of artificially structured loess under different conditions: (a) 3D scatter plot of macropore ratio; (b) 3D model of macropore ratio.
Buildings 15 01198 g011
Figure 12. Three-dimensional surface model of artificially structured loess under different conditions: (a) 3D scatter plot of average maximum elastic modulus; (b) average maximum elastic modulus 3D model diagram.
Buildings 15 01198 g012
Table 1. Basic physical properties of loess.
Specific Gravity
(Gs)
Water Content
(%)
Dry
Density
(g/cm3)
Initial Porosity RatioPlasticity
Limit
(%)
Liquid Limit
(%)
Plasticity Index
2.7112.641.520.9720.5435.7815.24
Table 2. Essential physical characteristics of edible salt.
Density
(g/cm3)
Fusion Point
(°C)
Boiling Point
(°C)
pH
2.168011465neutral
Table 3. Essential physical characteristics of cement.
Density
(g/cm3)
Fineness
(μm)
Setting Time
(min)
Water-Retaining PropertyCompressive Strength
(MPa)
Flexural Strength
(MPa)
38015–10Good244
Table 4. Dynamic triaxial test scheme.
Confining Pressure
σ3 (kPa)
Dry Density
ρ (g/cm3)
Saltiness
(%)
Cement Content
(%)
1001.5200
1.2021
22
24
1501.5200
1.4021
22
24
2001.5200
1.6021
22
24
Table 5. Parameters of Hardin–Drnevich model for artificial structural loess.
Cement Content
(%)
Dry
Density
(g/cm3)
Confining Pressure
σ3 (kPa)
abR2Edmax
(MPa)
01.521000.01250.04150.905055.669
1500.01010.03650.952664.016
2000.00900.02980.943275.279
11.21000.02800.04870.972642.299
1500.01820.04270.969453.262
2000.01260.03690.978569.557
1.41000.02410.04260.877652.783
1500.01640.03370.959862.999
2000.01660.02550.886778.051
1.61000.01330.03120.972766.175
1500.00980.02720.974583.155
2000.00620.02480.9892103.344
21.21000.03380.08320.917356.201
1500.02050.07590.944165.800
2000.01480.06340.953477.306
1.41000.01690.08740.966961.580
1500.01470.07730.973570.628
2000.01030.05760.961584.758
1.61000.01190.03790.976379.980
1500.00970.03340.964997.794
2000.00870.02770.9483113.156
41.21000.02030.06370.965667.642
1500.01490.04980.967180.724
2000.00860.04890.953090.493
1.41000.01500.03820.924986.422
1500.01020.03240.927296.584
2000.00830.02920.9463106.773
1.61000.00680.026850.9815102.750
1500.00700.022540.9657118.861
2000.00450.021710.9865140.775
Table 6. Average maximum dynamic elastic modulus and artificial structural loess microstructure data under different conditions.
Cement Content
(%)
Dry
Density
(g/cm3)
Average Particle Size (μm)Proportion of Macropores
(%)
Average Edmax
(MPa)
11.2458.431.6755.039
1.4490.8829.5564.611
1.6582.0027.4584.224
21.2591.6729.3866.436
1.4601.9725.572.322
1.6612.9223.996.977
41.2628.3221.4379.620
1.4633.8718.3296.593
1.6650.80316.17120.795
Disclaimer/Publisher’s Note: The statements, opinions and data contained in all publications are solely those of the individual author(s) and contributor(s) and not of MDPI and/or the editor(s). MDPI and/or the editor(s) disclaim responsibility for any injury to people or property resulting from any ideas, methods, instructions or products referred to in the content.

