Article

From 2D to 3D Urban Analysis: An Adaptive Urban Zoning Framework That Takes Building Height into Account

1
School of Geomatics and Urban Spatial Informatics, Beijing University of Civil Engineering and Architecture, Beijing 100044, China
2
Institute of Computing Technology, China Academy of Railway Sciences, Beijing 100081, China
*
Author to whom correspondence should be addressed.
Buildings 2025, 15(7), 1182; https://doi.org/10.3390/buildings15071182
Submission received: 7 March 2025 / Revised: 22 March 2025 / Accepted: 27 March 2025 / Published: 3 April 2025
(This article belongs to the Special Issue New Challenges in Digital City Planning)

Abstract

:
The vertical heterogeneous structures formed during the evolution of urban agglomerations, driven by globalization, pose challenges to traditional two-dimensional spatial analysis methods. This study addresses the vertical heterogeneity and spatial multiscale problem in three-dimensional urban space and proposes an adaptive framework that takes into account building height for multiscale clustering in urban areas. Firstly, we established a macro-, meso- and micro-level analysis system for the characteristics of urban spatial structures. Subsequently, we developed a parameter-adaptive model through a dynamic coupling mechanism of height thresholds and average elevations. Finally, we proposed a density-based clustering method that integrates the multiscale urban analysis with parameter adaptation to distinguish urban spatial features at different scales, thereby achieving multiscale urban regional delineation. The experimental results demonstrate that the proposed clustering framework outperforms traditional density-based and hierarchical clustering algorithms in terms of both the Silhouette Coefficient and the Davies–Bouldin Index, effectively resolving the problem of vertical density variation in urban clustering.

1. Introduction

Driven by the acceleration of urbanization and the rapid advancement of information technology, three-dimensional (3D) urban models have emerged as a novel paradigm for spatial data representation, offering critical data support for modern urban zoning, management, and analysis [1,2]. These models digitally reconstruct the physical morphology and functional distribution of cities, offering a more intuitive and comprehensive perspective for analyzing urban spatial structures [3,4]. Compared to traditional two-dimensional (2D) imagery, 3D models enable the more accurate characterization of vertical dimensional information and spatial attributes, such as building heights, floor distributions, and volumetric features [5,6,7]. This three-dimensional representation has facilitated research across multiple domains, including urban planning, disaster response, and environmental monitoring [8,9].
In this context, spatial clustering techniques, as critical tools for urban spatial data analysis [10,11], have been widely applied in urban planning, resource management, and environmental monitoring [12,13,14]. By classifying spatial data, these techniques reveal intrinsic relationships and distribution patterns among spatial units [15,16]. However, traditional spatial clustering methods primarily focus on 2D analysis and struggle to address the vertical heterogeneity inherent in 3D urban models [17,18]. Early studies addressing 3D clustering problems often adopted 2D spatial analysis frameworks, such as planar partitioning algorithms like K-means and CLARANS [19,20], relying on dimensionality reduction to approximate 3D data clustering [21,22]. Nevertheless, these methods still have limitations: (1) Euclidean distance metrics fail to capture heterogeneous spatial distributions in 3D environments [23], and (2) predefined cluster assumptions inherently conflict with the self-organizing principles of urban spaces [24]. Consequently, research on clustering 3D urban models has evolved along two trajectories: algorithmic improvements and innovative applications in urban contexts.
For algorithmic improvements, efforts focus on overcoming 3D-specific challenges, such as adaptive parameter tuning [25,26]. For instance, Zhang et al. proposed a parameter-adaptive DBSCAN variant (WOA-DBSCAN) using a whale optimization algorithm, balancing parameter adaptability with clustering performance [27]. Xiao et al. integrated Gaussian mixture models with density-based clustering (DBSCAN) under multi-constraint conditions to automatically identify urban agglomerations [28]. To address limited accuracy in detecting small-to-medium objects (e.g., pedestrians and vehicles) within dense urban environments, Li et al. enhanced point-cloud-based 3D object detection techniques [29]. Meanwhile, Shao et al. introduced a scalable orthogonal-regression-based subspace clustering (ORSC) method for large-scale, high-dimensional 3D datasets [30]. In application-driven innovations, researchers have aligned 3D clustering with practical urban challenges, including functional zoning, building typology classification, and urban expansion analysis [31,32,33]. Guo et al. developed a 3D building reconstruction algorithm leveraging density-based spatial clustering [34]. Similarly, clustering methods have been applied to urban disaster management [35,36], where analyzing building heights, structural types, and spatial distributions supports risk assessment for earthquakes and other hazards [37,38].
While existing studies have achieved breakthroughs in algorithmic innovation and application expansion within the domain of three-dimensional spatial clustering [39,40,41], existing research still exhibits deficiency in identifying vertical spatial self-similarity and interpreting multi-level functional structures in urban contexts [42]. Contemporary methodologies are still subject to several critical limitations. Firstly, although hierarchical clustering methods are capable of constructing multiscale structures, they necessitate the pre-specification of hierarchical partitioning rules and fail to achieve cross-scale feature coupling. Secondly, spectral clustering algorithms encounter an exponential increase in computational complexity when processing high-dimensional urban data. Furthermore, machine learning-based models, with their parameter optimization mechanisms predominantly focused on horizontal density variations, exhibit insufficient responsiveness to vertical heterogeneity induced by building height gradients. This leads to difficulties in differentially setting density thresholds for high-rise building clusters and low-rise urban blocks [43]. Additionally, the dynamic parameter adjustments are overly reliant on empirical presets, which, when confronted with the non-uniform distribution characteristics of three-dimensional urban spaces, struggle to effectively accommodate multi-dimensional clustering demands [44,45].
Therefore, to address the aforementioned challenges, this study proposes a three-dimensional multiscale density clustering framework based on the traditional DBSCA algorithm [34]. Compared to traditional DBSCAN and other 3D clustering models, the innovativeness of this framework is manifested in three distinct aspects: (1) The implementation of an adaptive computation of the minimum points threshold through a dynamic coupling mechanism of height threshold constraints and average elevation, effectively mitigating the over-segmentation issue of clustering algorithms in regions with elevation heterogeneity. (2) The design of multiscale parameter linkage rules, transcending the limitations of fixed meso-level hierarchies in hierarchical clustering methods, enabling the collaborative identification of macro-, meso-, and micro-level features to capture urban spatial structures at varying scales.
The remainder of this paper is organized as follows: Section 2 details the rationale for selecting the study area and the architecture of the 3D multiscale density clustering framework, including the design of parameter optimization strategies. Section 3 presents the clustering results at different scales, obtained from applying the framework to the experimental area. Section 4 validates the framework’s performance through comparative experiments. Finally, Section 5 discusses the practical applications of the research outcomes in urban planning and outlines current limitations and potential future research directions.

2. Materials and Methods
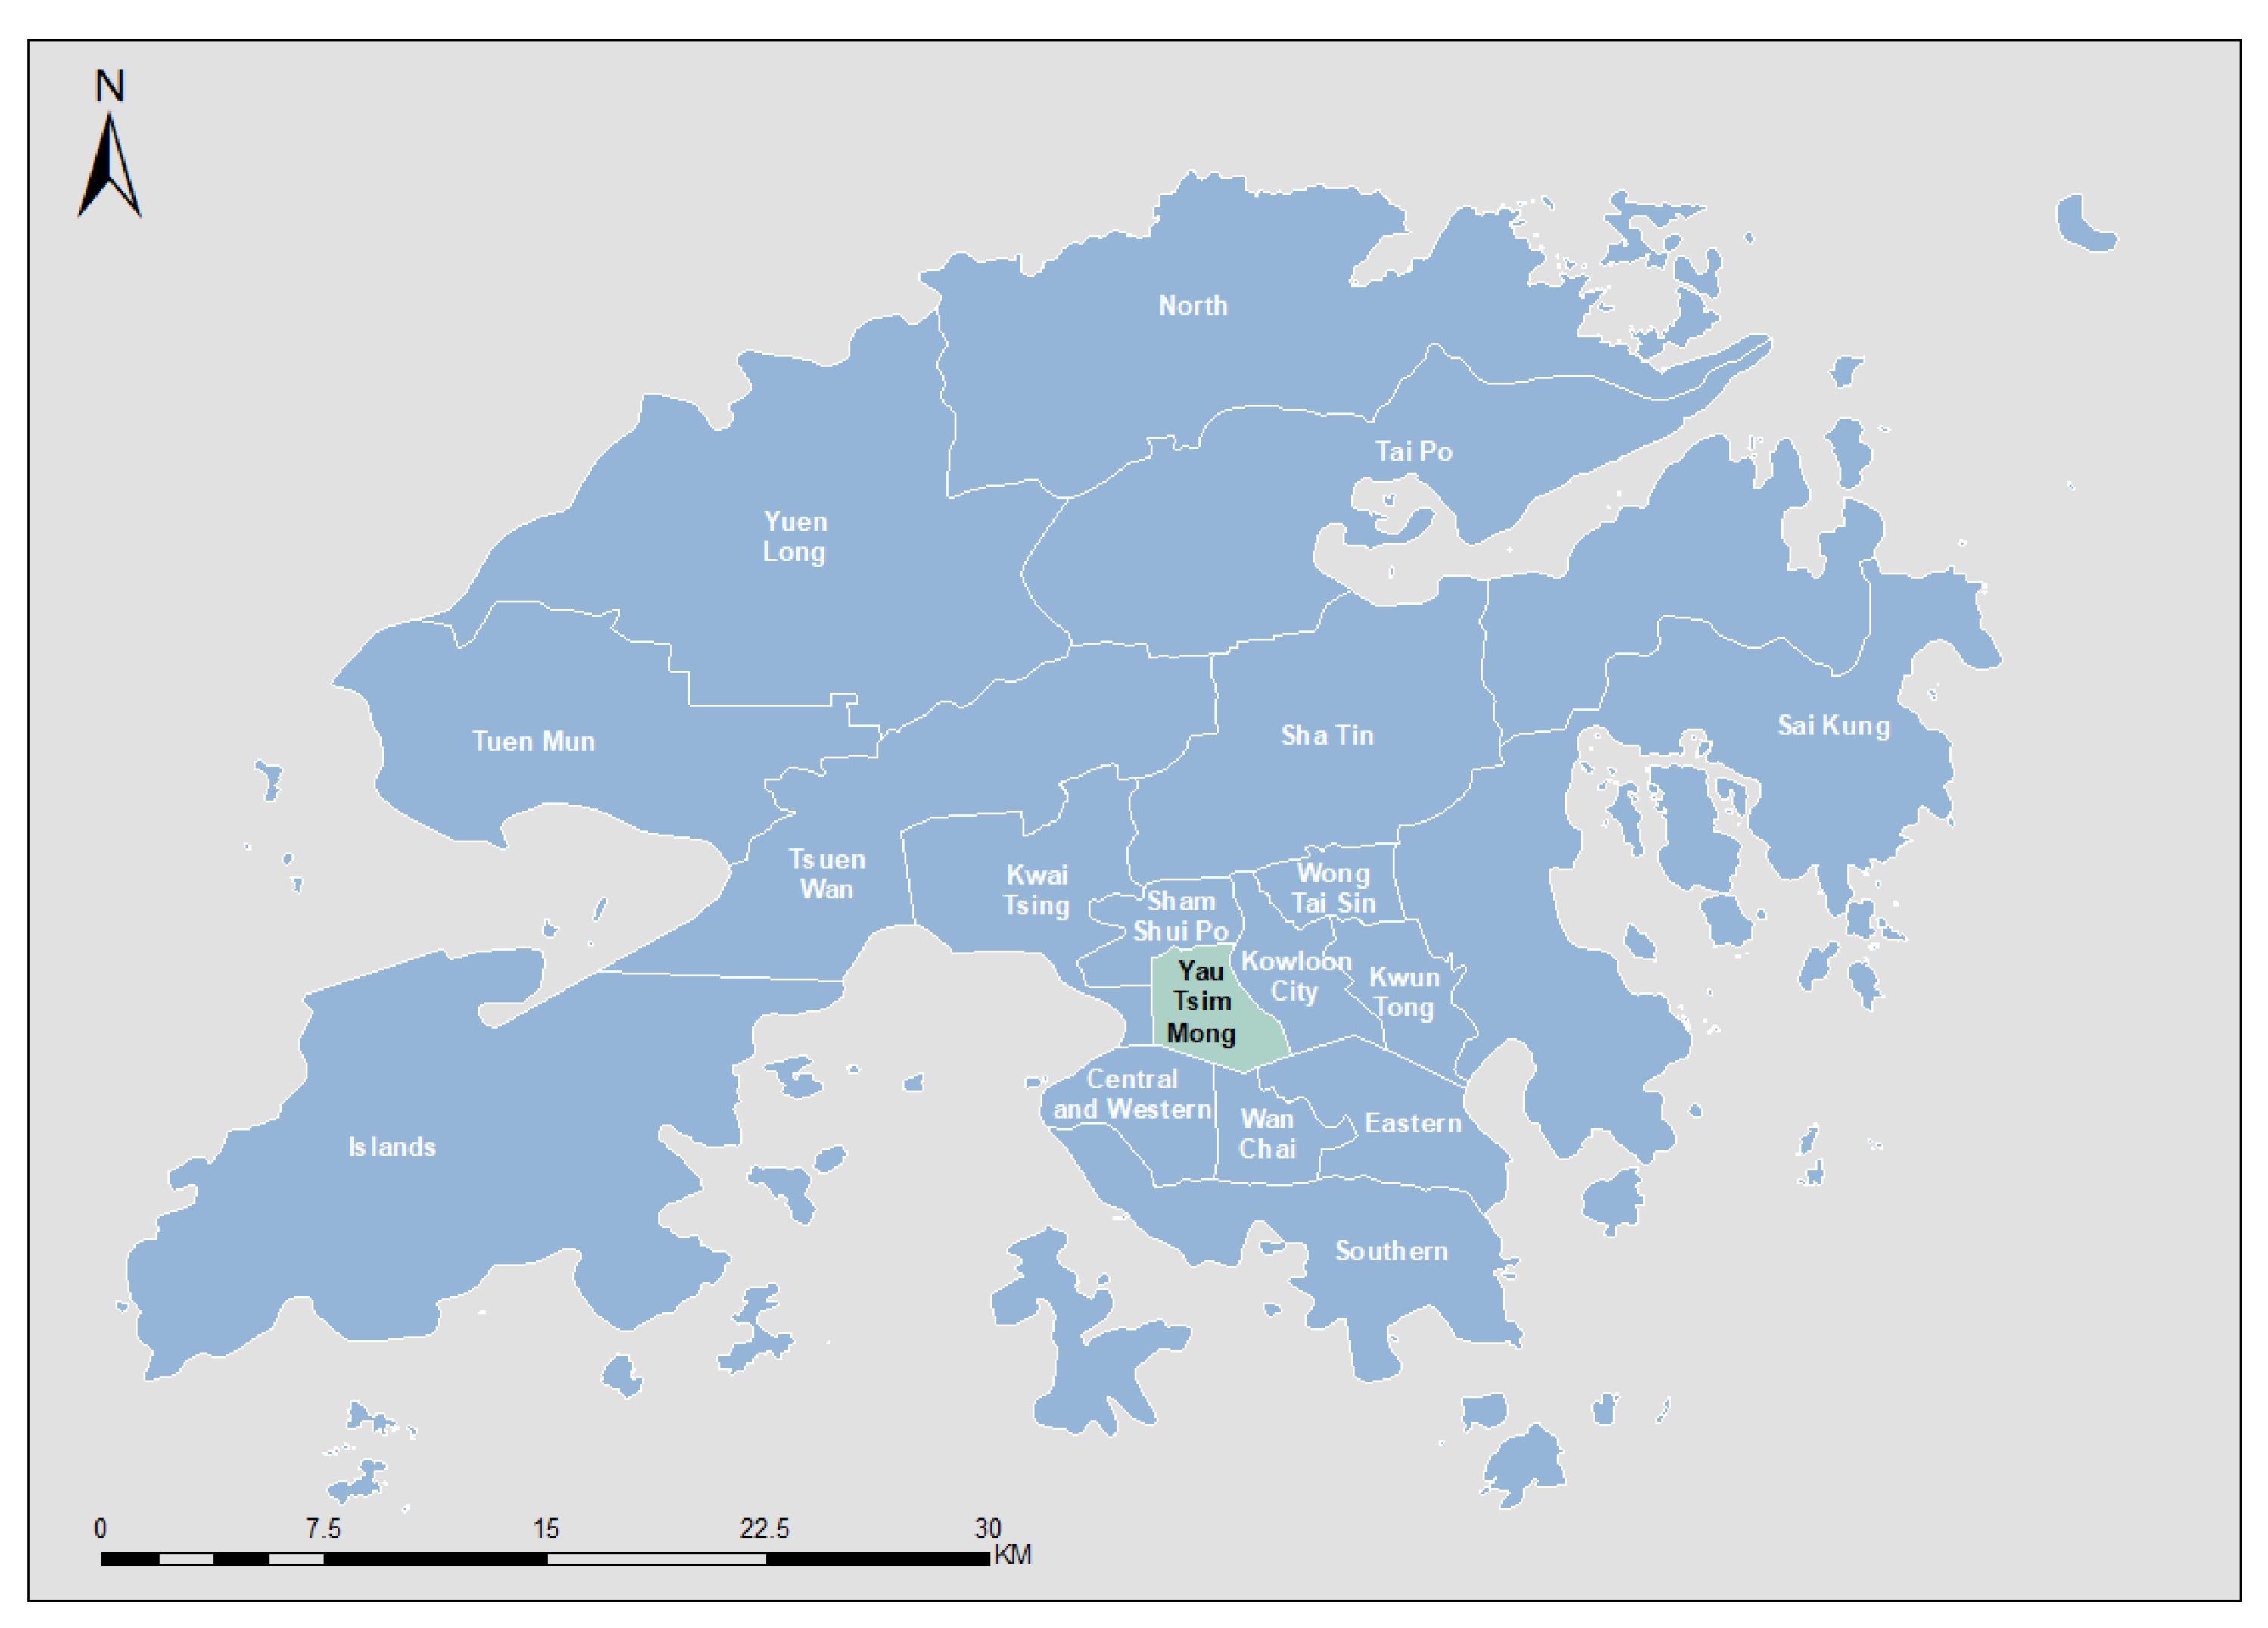
2.1. Study Area

Hong Kong, located in the southern part of China, is one of the most popular tourist cities globally [46,47,48]. As a tourist city, the urban morphology and architectural structures of Hong Kong play a crucial role in the development of its tourism industry [49]. These characteristics not only affect the experiences of tourists but also influence the sustainable development and ecological environment of the city [50]. Therefore, studying the urban morphology of Hong Kong is of significant importance for understanding and improving its tourism industry [51].
The focus of this study is the Yau Tsim Mong District in Hong Kong. This area, with geographical coordinates ranging from 22.295° N to 22.328° N latitude and 114.152° E to 114.177° E longitude, primarily comprises three neighborhoods: Yau Ma Tei, Tsim Sha Tsui, and Mong Kok (the specific location is shown in Figure 1). The Yau Tsim Mong District is characterized by its complex and diverse architectural spatial forms, making it of significant academic interest for studying urban morphology [52].
This study focuses on the Yau Tsim Mong District as the case study area, selected for its remarkable diversity in architectural forms. Tsim Sha Tsui is dominated by high-rise commercial buildings, whereas Mong Kok features densely packed low-rise residential structures. The multiscale spatial characteristics of this district, ranging from the macro urban profile to the micro community structure, offer an ideal setting to validate the dynamic parameter adjustment capabilities of our proposed algorithm. The data utilized in this study are sourced from the 2023 oblique photogrammetry model of the Yau Tsim Mong District in Hong Kong, with horizontal and vertical accuracies of ±0.30 m and ±0.50 m, respectively.

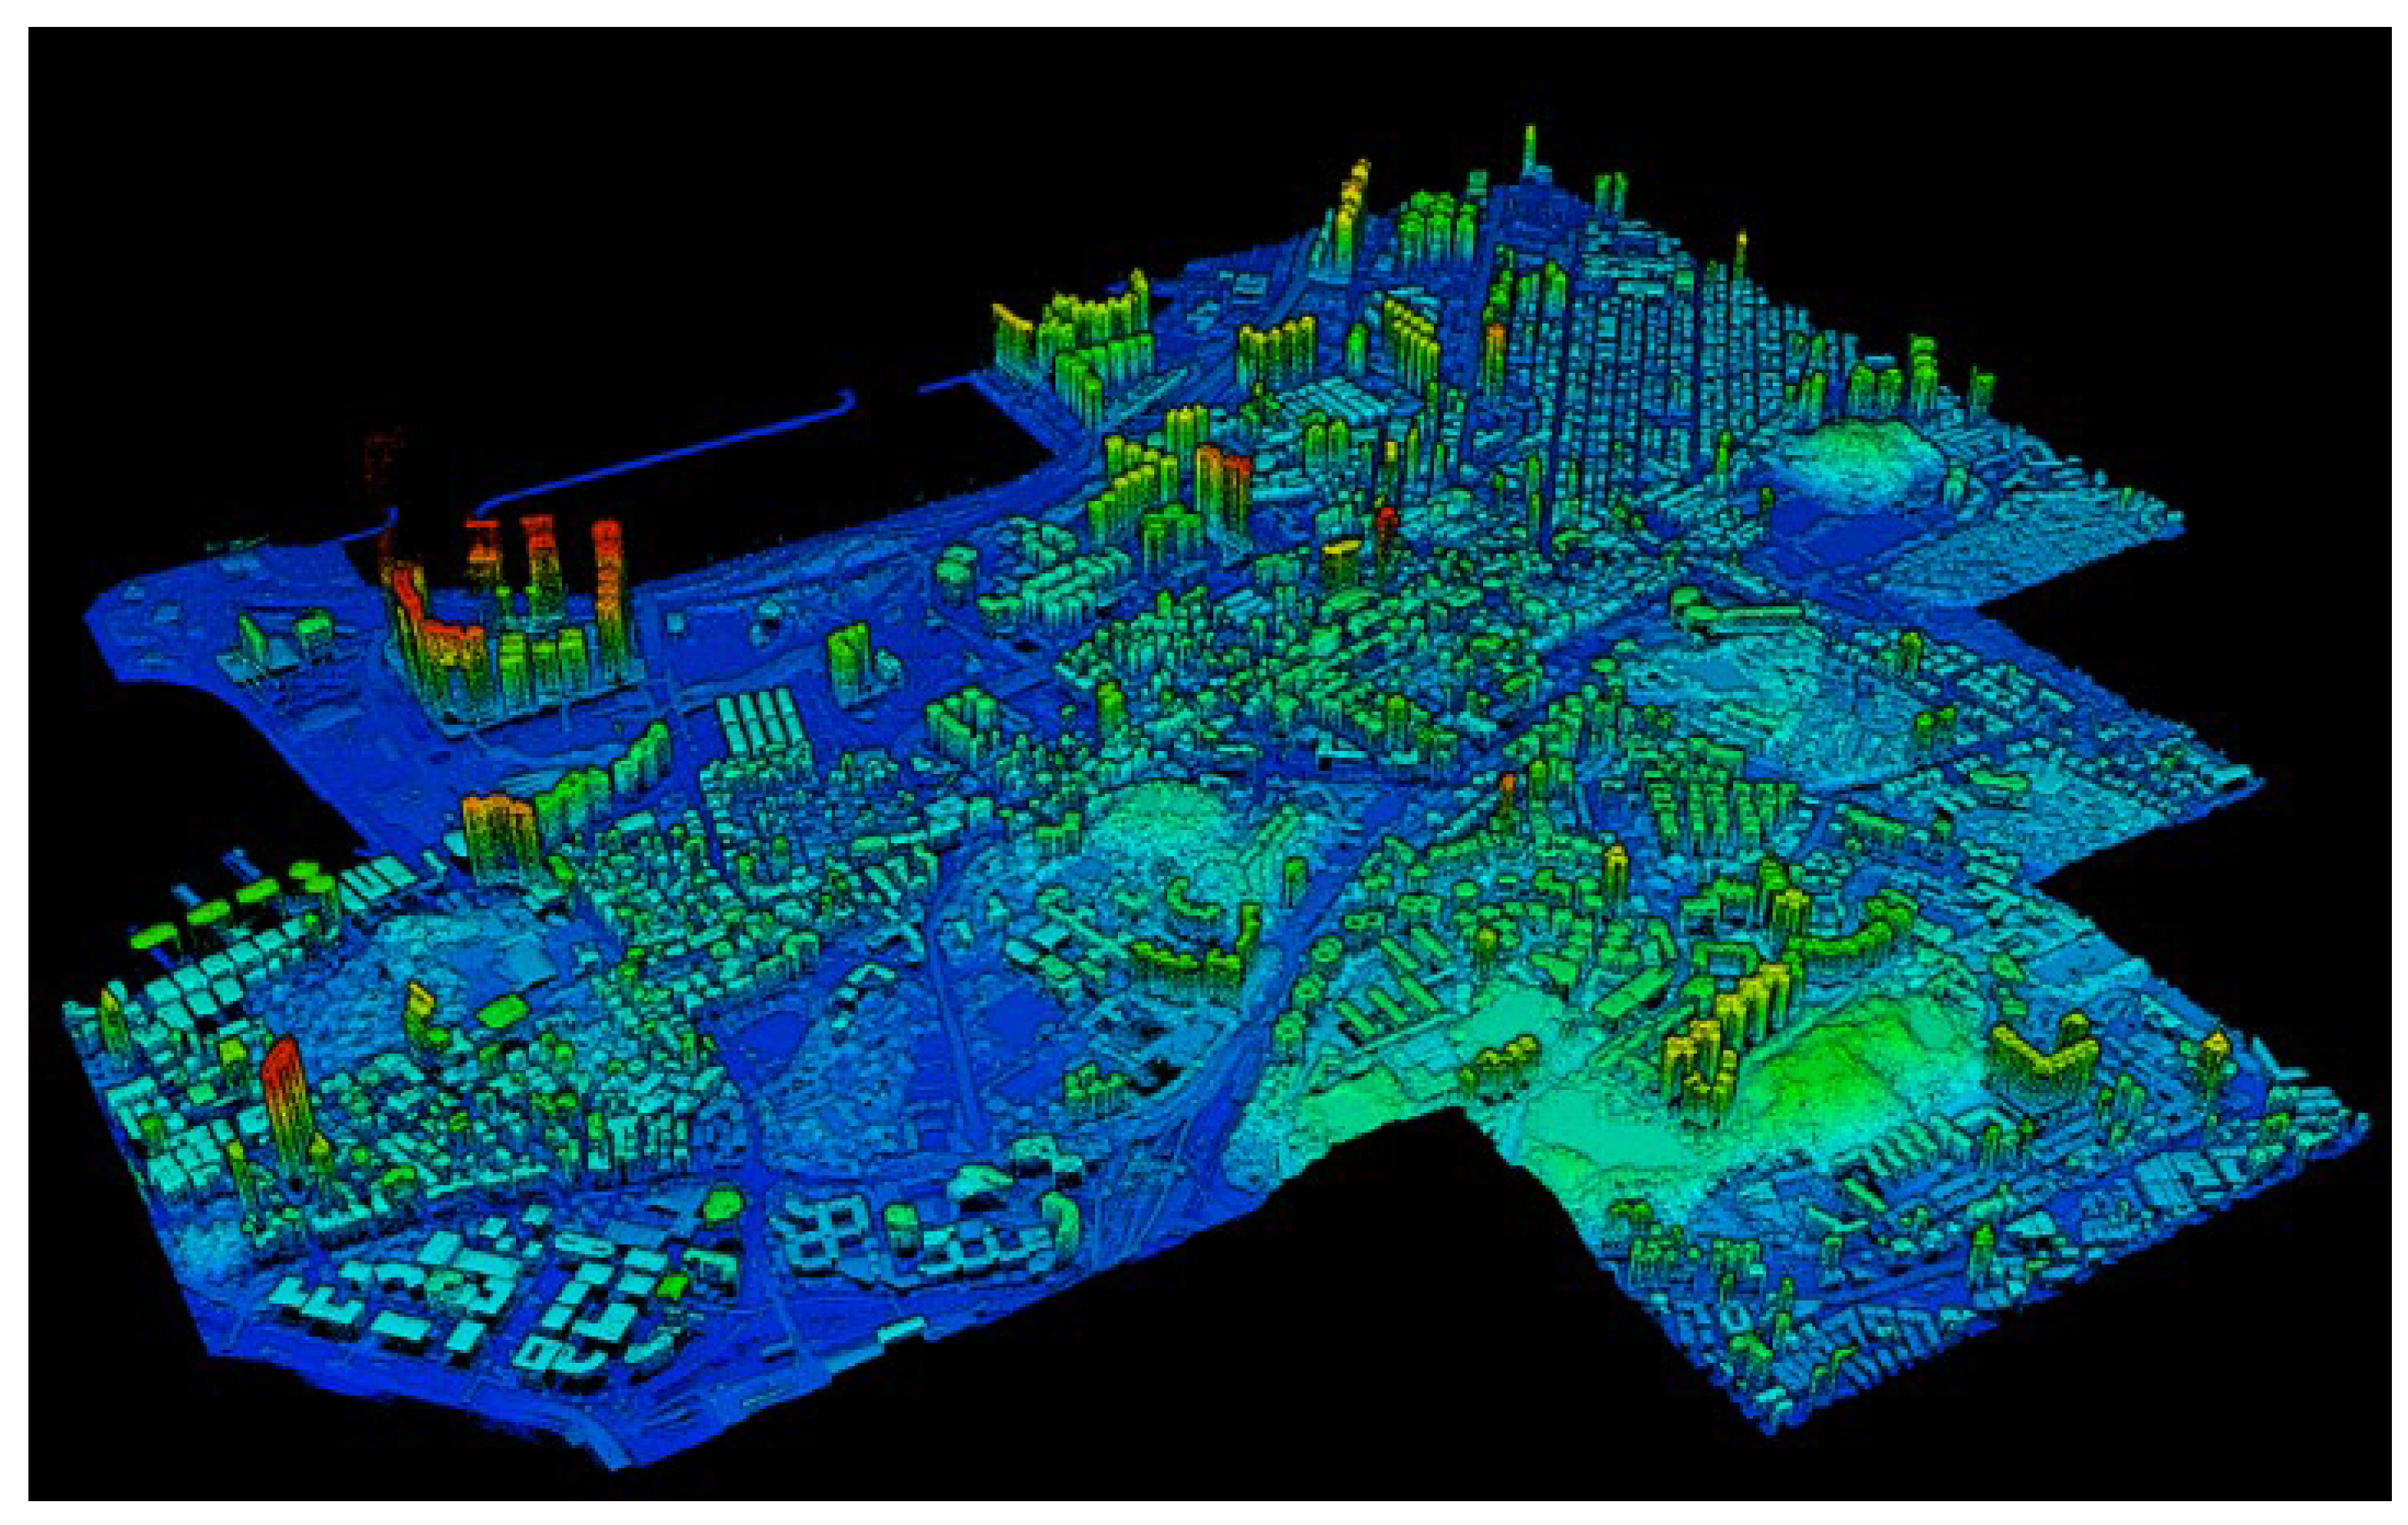
2.2. Data Preprocessing

To ensure consistency in the analysis of urban building morphology, the original dataset was preprocessed through a series of steps. First, the elevation data from the Digital Elevation Model (DEM) was standardized to zero to eliminate the influence of natural terrain variations on building height comparisons. This created a uniform horizontal reference plane for all buildings, ensuring standardized height calculations across the study area. Subsequently, the oblique photogrammetric model of Hong Kong’s Yau Tsim Mong District was converted into a point cloud (in LAS format) with XYZ coordinates. To improve the data quality, three refinement steps were applied: converting the model to a point cloud, normalizing elevation data, and removing ground point cloud data. Finally, buildings were segmented based on spatial location, and the height of each segmented building was calculated. The extracted building features were exported in the Shapefile format with geographic coordinates to capture the three-dimensional characteristics of the urban environment. The results of the preprocessing steps are illustrated in Figure 2.

2.3. DBSCAN Algorithm

This study employed the DBSCAN (Density-Based Spatial Clustering of Applications with Noise) algorithm to conduct a clustering analysis based on spatial density connectivity. The core idea of the DBSCAN algorithm is based on the adjustment of two key parameters: the maximum distance radius ( ϵ ) and the minimum number of points required to form a cluster ( M i n P t s ). The maximum distance radius, ϵ , defines the range of the neighborhood, while the M i n P t s determines the minimum density threshold for a core point to be established. Specifically, when the number of sample points within the ϵ of a given point is greater than or equal to M i n P t s , that point is classified as a core point. Based on this principle, the DBSCAN algorithm categorizes the points in the dataset into three types: core points, border points, and noise points. The specific definitions are as follows: if the number of sample points within the ϵ neighborhood of a given point is greater than or equal to M i n P t s , that point is classified as a core point; if a point is not a core point but lies within the ϵ neighborhood of a core point, it is classified as a border point; points that are neither core points nor border points are classified as noise points.
The clustering process of the DBSCAN algorithm is as follows: First, a random unmarked point is selected from the dataset. Using this point as the center and ϵ as the radius, the number of points within its neighborhood is calculated. If the number of points in the neighborhood is greater than or equal to M i n P t s , the point is marked as a core point, and all the points in its neighborhood are assigned to the same cluster. The algorithm then continues to check the points in this neighborhood; if any of them are new core points, the clustering range is further expanded until no new points can be added. If the number of points in the neighborhood of the initial point is less than M i n P t s , that point is marked as a noise point or a border point. This process is repeated by selecting new unmarked points from the dataset until all the points are classified as either cluster points or noise points, ultimately dividing the dataset into several clusters and noise points.
The advantage of the DBSCAN algorithm lies in its ability to automatically identify clusters of arbitrary shapes while being robust to noise points. By adjusting the two parameters, ϵ and M i n P t s , it can flexibly adapt to different density distributions of data [53].

2.4. Three-Dimensional Multiscale Adaptive Clustering Framework

The traditional DBSCAN algorithm reveals significant limitations when processing three-dimensional urban models. These limitations primarily stem from the vertical heterogeneity present in urban environments, particularly pronounced in megacities [54]. In areas with vertical sparsity, the DBSCAN algorithm struggles to adapt to local height variations, resulting in a notable decline in clustering performance [55].
To address the inherent limitations of the DBSCAN algorithm in processing high-dimensional urban data, we propose a multiscale adaptive clustering method incorporating building heights to resolve vertical heterogeneity in urban scenarios. Specifically, our framework comprises three components:
  • Multiscale delineation:
Based on urban spatial structural characteristics, the urban environment is divided into macro-, meso-, and micro-scale hierarchies [56]. Domain radii and height thresholds for different stages are defined according to Hong Kong statutory planning documents and urban design standards, establishing a foundation for dynamic parameter calculation.
  • Dynamic parameter adaptation mechanism:
Building upon the traditional DBSCAN algorithm, two key morphological parameters—the average building height and the height threshold—are introduced to dynamically calculate and adaptively adjust the minimum number of points, thereby enhancing the flexibility and adaptability of the clustering algorithm.
  • Multiscale clustering:
By combining the neighborhood radius with the dynamically adjusted minimum number of points, adaptive clustering across multiple scales is achieved. Additionally, the traditional 2D Euclidean distance is replaced with a 3D Euclidean distance, incorporating the z-coordinate to mitigate the influence of the vertical dimension on the clustering of urban 3D models.

2.4.1. Multiscale Partitioning

The Yau Tsim Mong district of Hong Kong is characterised by significant vertical heterogeneity, irregular boundaries and dense buildings, making traditional isometric grid analysis difficult. [57,58]. This study adopts a multiscale spatial clustering framework based on morphological adaptability, deconstructing urban spatial hierarchy characteristics through a “macro scale, meso scale, micro scale” three-tier scale, with the following division criteria:
  • Macro scale
The macro scale focuses on identifying the city-level functional structure, using an 800 m neighborhood radius and a 100 m height threshold. Fu, J., and others, through the parameter self-adaptation optimization method in spatial analysis, found that a 792 m neighborhood radius could effectively cluster urban areas [59], which is highly consistent with the 800 m influence radius of transit stations in the Transit-Oriented Development (TOD) model [60]. In selecting the height threshold, we found that super high-rise buildings, such as Hong Kong’s ICC and IFC, typically exceed 300 m in height, but the average height of their cluster core areas (such as the CBD) is concentrated between 80 and 150 m. Therefore, the height threshold is set at 100 m, which is in line with the median height of the core areas of super high-rise building clusters (80–150 m) and can effectively distinguish between the CBD and secondary mixed-use areas.
  • Meso scale
The meso scale is aimed at the division of block units, using a 400 m neighborhood radius and a 40 m height threshold. Li, N., and others have successfully applied this 500 m neighborhood radius to the analysis of Seoul’s urban texture [61]. For medium- to high-rise building clusters (35–45 m), this scale can reveal the spatial differentiation patterns between mixed-use areas and single-function blocks [62].
  • Micro scale
The micro scale focuses on the identification of community-level units, using a 200 m neighborhood radius and a 20 m height threshold. Afrianto, F., and others have found that this scale parameter has a significant clustering effect in the calculation of urban community fractal dimensions [63]. The 20 m height threshold typically corresponds to the building height in residential areas, and using this threshold for point cloud clustering can help identify and differentiate between various types of residences [64]. Yang Wang and others have shown through empirical research in 53 Chinese cities that a 21 m building height threshold can optimize the thermal performance and ventilation efficiency of residential areas while ensuring a moderate development density [65]. The scale parameter system adheres to the spatial development guidelines outlined in Hong Kong-related construction documents and studies, such as the “Hong Kong 2030+ Planning Vision” and the “Railway Development Strategy 2014”, and validates the universality of parameters through a bibliometric analysis [66,67,68,69]. The determination of optimal clustering parameters was systematically verified through a sensitivity analysis and clustering quality metrics. For example, for the macro-scale clustering, a vertical threshold of 100 m and a neighborhood radius of 800 m were used to validate the selection of M i n P t s . The results demonstrate the optimal separation (average silhouette width = 0.63 ± 0.15). After fine-tuning, the specific parameter indicators are shown in Table 1.

2.4.2. Dynamic Parameter Adjustment

To effectively mitigate the issue of over-clustering in dense vertical structures, this study proposes a dynamic-adjustment-based adaptive mechanism for the M i n P t s parameter. (The specific process is shown in Figure 3. This mechanism dynamically calculates and adjusts the value of M i n P t s by analyzing real-time changes in the average building height and height threshold, thereby better adapting to the spatial density characteristics across different height levels.
In this algorithm, the first step in dynamic parameter calculation is to compute the average height ( H a v g ) of the point cloud dataset. Since the DBSCAN algorithm relies on the distance relationships between points to define neighborhoods, and the height of points in 3D space directly affects density estimation and clustering results, the average height serves as a critical basis for dynamically adjusting M i n P t s . The formula for calculating the average height is as follows:
H a v g = 1 N i = 1 N z i
In Equation (1), N represents the total number of points in the dataset, and z i denotes the height coordinate of the i t h   p o i n t .After calculating H a v g , it serves as a reference value for dynamically adjusting the M i n P t s parameter. In urban or architectural point cloud data, regions with significant height variations often correspond to different building structures or terrain features, making the average height a critical characteristic.
In the traditional DBSCAN algorithm, M i n P t s is a predefined parameter typically determined by empirical or domain-specific knowledge. Its role is to determine whether a point is a core point, i.e., whether there are at least M i n P t s points within its ϵ. In our proposed algorithm, due to the potential impact of height variations on clustering structures, the value of the M i n P t s needs to be dynamically adjusted based on the H a v g of the dataset. Specifically, the dynamic adjustment of the M i n P t s in our proposed algorithm follows the following rules:
M i n P t s = M i n P t s 0 + Δ M i n P t s × I ( H a v g > H t )
In Equation (2), M i n P t s 0 represents the initial value of M i n P t s , Δ M i n P t s is the increment based on height variations, and I is an indicator function. When H a v g exceeds the threshold H t , I equals 1, indicating that M i n P t s needs to be adjusted; otherwise, I equals 0. This implies that when the average height exceeds a certain threshold, the M i n P t s will increase incrementally; otherwise, it remains unchanged.

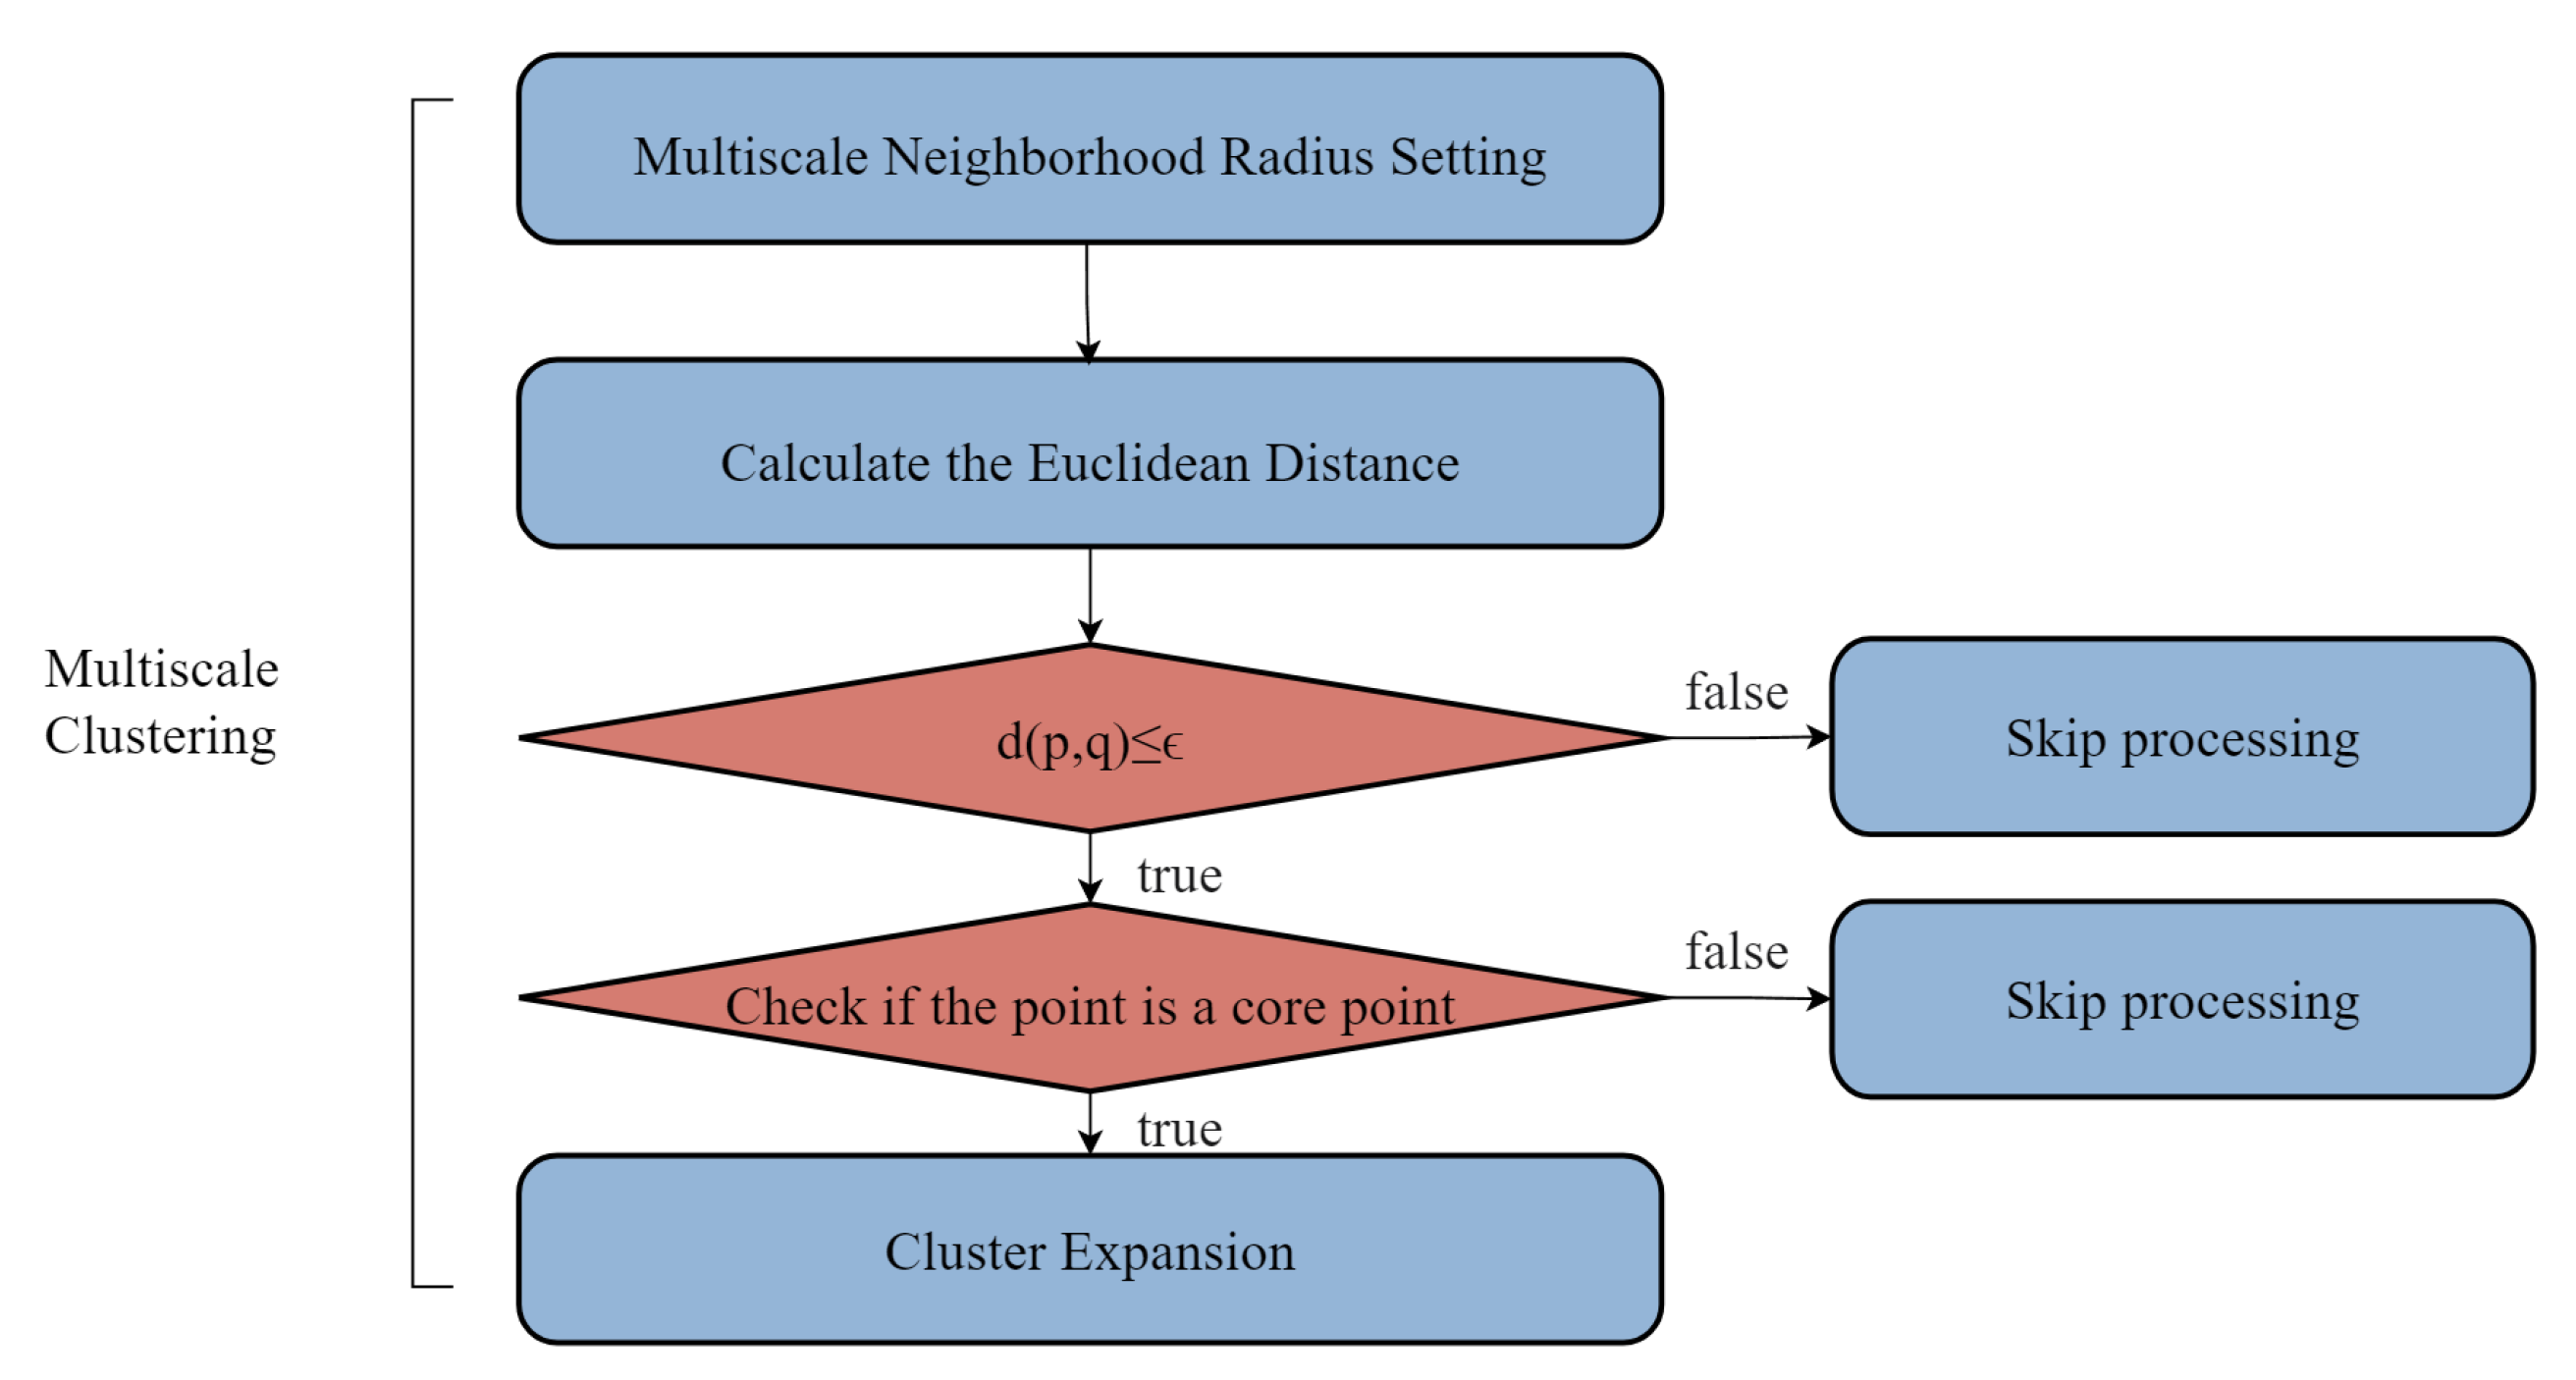
2.4.3. Multiscale Spatial Clustering
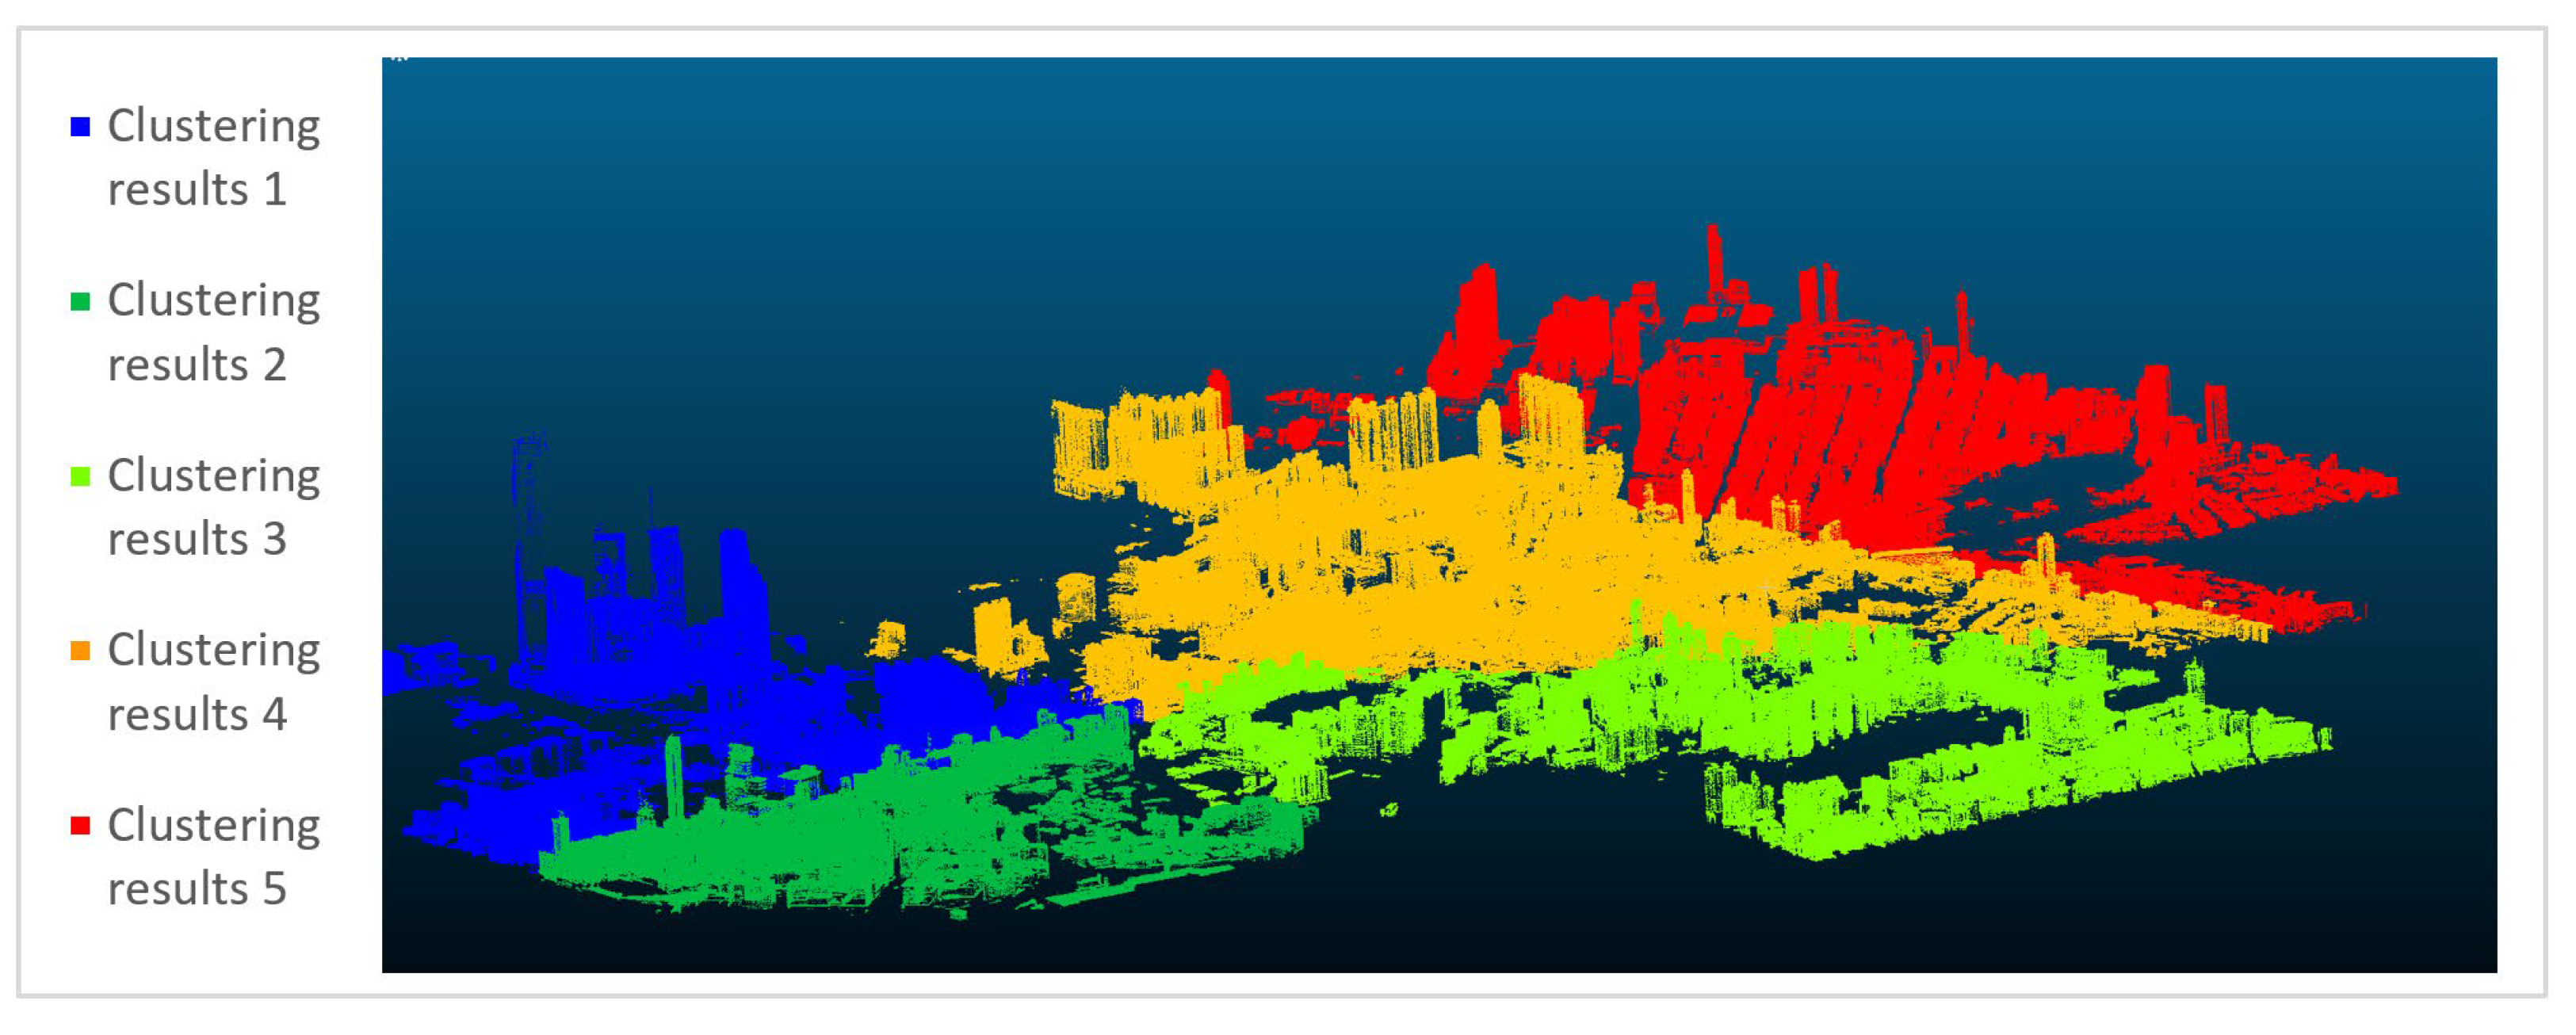
The framework employs a multiscale clustering strategy to address the multi-layered complexity in urban morphological analysis. The core idea of multiscale clustering is to analyze data at different scales, constructing hierarchical clustering results. At each scale, a unique set of clustering results is obtained, reflecting the characteristics and structures of the data at that specific scale. To effectively capture the vertical heterogeneity in clustering urban 3D models, the traditional 2D Euclidean distance is replaced with a 3D Euclidean distance, incorporating the z-coordinate to account for the vertical dimension. The specific process is shown in Figure 4.
Specifically, the clustering process at each scale is as follows: Before clustering, the values of M i n P t s and ϵ for each stage are determined. This allows us to calculate the distances between the points within the urban area to determine whether they belong to the same cluster.
Suppose we have two points, p = ( x p , y p , z p ) and q = ( x q , y q , z q ) . The Euclidean distance d ( p , q ) between them is calculated using the following formula:
d ( p , q ) = ( x p x q ) 2 + ( y p y q ) 2 + ( z p z q ) 2
In Equation (3), p = ( x p , y p , z p ) and q = ( x q , y q , z q ) represent the 3D coordinates of points p and q , respectively, and d ( p , q ) denotes their spatial distance. This distance measurement method takes into account the 3D spatial distribution of points, making it suitable for highly variable 3D datasets.
In DBSCAN, a core point is defined as a point that has at least M i n P t s points within its ϵ . Specifically, for a point, p , in the dataset, the number of points within its ϵ is | N ( p , ϵ ) | . If the following condition is satisfied, the point is considered a core point:
| N ( p , ϵ ) | M i n P t s
In Equation (4), | N ( p , ϵ ) | represents the number of points within the ϵ of point p. If this number is greater than or equal to the adjusted M i n P t s , point p is considered a core point.
After identifying the core points, our proposed algorithm performs clustering through recursive expansion. If point p is determined to be a core point, all points within its ϵ that meet the density requirement are included in the same cluster. The specific expansion rules are as follows:
C p = C p { q | q N ( p , ϵ ) | N ( q , ϵ ) | M i n P t s }
In Equation (5), C ( p ) represents the cluster containing point p, N ( p , ϵ ) denotes the ϵ of point p , and q is a point within the neighborhood. If q is also a core point, it will further expand its neighborhood. The expansion process is recursive, meaning that for every newly added point to the cluster, it is checked whether it is a core point. If so, the expansion continues. This process repeats until no further core points can be expanded.

3. Results

In this study, we employed the improved algorithm to perform a multiscale spatial clustering analysis on the point cloud data of urban buildings in the Yau Tsim Mong District of Hong Kong. During the clustering process, we adjusted key parameters such as the H t , M i n P t s , and ϵ , according to various hierarchical needs. The specific calculation results can be seen in Table 2. This adjustment accommodates the layered clustering requirements from the macro to the micro levels. We employed the improved algorithm to perform a multiscale spatial clustering analysis on the point cloud data of urban buildings in the Yau Tsim Mong District of Hong Kong. During the clustering process, we adjusted key parameters, such as H t , M i n P t s , and ϵ , according to various hierarchical needs, ensuring the algorithm’s adaptability to the intricate spatial characteristics of the urban environment. This adjustment accommodates the layered clustering requirements from macro to micro levels, enabling a comprehensive exploration of urban spatial patterns at different resolutions. The following are the results of the clustering analysis.
This study effectively addresses the challenge of vertical heterogeneity in urban spatial analysis by introducing a method for dynamically calculating the minimum number of points based on height thresholds and average building heights. In the multiscale clustering analysis, we resolved the inaccuracies of traditional methods, which often split the same building or area into two clusters when processing structures with complex vertical configurations. As shown in Figure 5, Figure 6 and Figure 7, our proposed parameterized framework based on density clustering not only successfully achieved the classification of building clusters at the macro scale but also precisely delineated neighborhoods at the micro scale. The experimental results not only validate the effective identification of major urban functional zones but also provide robust empirical support for the initial research hypothesis.

4. Discussion

4.1. Research Results and Significance

This study investigated the spatial structural characteristics of 3D urban models through a multiscale clustering analysis. To overcome the limitations of conventional DBSCAN—including fixed parameterization, inadequate vertical heterogeneity handling, and single-scale analysis—we proposed a 3D multiscale adaptive clustering framework (3D-MAC). By hierarchically decomposing urban spaces into macro-, meso-, and micro-scale layers and integrating dynamic parameter adaptation mechanisms, the framework significantly enhances the clustering precision and adaptability for 3D urban models.
Methodologically, preprocessing techniques, such as height normalization, were applied to the input 3D urban point cloud data to eliminate environmental noise and correct topographic variations. Subsequently, the study area was partitioned into macro, meso, and micro scales based on their distinct spatial characteristics. Finally, at each scale, the M i n P t s parameter was dynamically adjusted according to hierarchical height thresholds, while the neighborhood radii were synergistically optimized to achieve the multiscale clustering of 3D urban models.
By integrating adaptive parameter tuning (building-height-driven) with a multiscale architecture, the framework bridges the gap between static DBSCAN configurations and the evolving demands of multi-resolution spatial analysis. Simultaneously, it enhances the accuracy of traditional urban zoning methods in addressing vertical heterogeneity, offering a robust solution for capturing complex urban spatial patterns across dimensions.

4.2. Comparison with Existing Research

To validate the effectiveness of the proposed 3D multiscale adaptive clustering framework, we conducted comparative experiments under identical conditions using traditional DBSCAN, HDBSCAN, and our framework on the Yau Tsim Mong District dataset in Hong Kong. The experiments were systematically evaluated based on parameters (Table 2) and performance metrics, including the Silhouette Coefficient, the Davies–Bouldin Index, and computational time. The Silhouette Coefficient, ranging from [−1, 1], measures the compactness and separation of sample clusters, with higher values indicating a better clustering quality. The Davies–Bouldin Index, on the other hand, is a clustering validity metric based on intra-cluster and inter-cluster distances, where lower values signify better inter-cluster separation. The results (Table 3) demonstrate that our framework exhibits significant advantages in multiscale clustering tasks. Due to the limitations of isotropic density measurement in traditional DBSCAN, spatial over-clustering tends to occur in high-density areas. Our framework effectively addresses this issue by dynamically adjusting the M i n P t s parameter, incorporating height thresholds and average elevation features. Compared to 2D DBSCAN, our method achieves an average improvement of 13.35% in the Silhouette Coefficient across three scales, while the average Davies–Bouldin Index decreases by 7.92%, indicating the simultaneous optimization of cluster compactness and separation. It is worth noting that the 3D extension introduces increased computational complexity. On average, our framework requires 9 h and 30 min to process data at the macro, meso, and micro scales, representing a 27.33% increase in runtime compared to 2D DBSCAN (Table 4).

4.3. Future Research Directions

This study proposes three promising avenues for future research. First, although our framework demonstrates exceptional clustering performance in addressing vertical heterogeneity, it significantly increases the computational time compared to traditional DBSCAN implementations. In subsequent research, spatial indexing techniques, such as Octree, could be employed to reduce the computational time required for clustering. Additionally, methods like GPU Parallelization and Approximate Nearest Neighbor Optimization could be introduced to further enhance the computational efficiency of the 3D multiscale adaptive clustering framework, thereby addressing the computational bottlenecks in processing large-scale urban data.
Second, the analytical framework could benefit from adopting more comprehensive urban morphology analysis methods. Future research could focus not only on isolated urban elements but also delve deeper into the integrated relationships between key morphological components defined by urban morphology theory, such as urban planning patterns, architectural forms, and land use configurations. Through such a comprehensive analysis, we can more holistically identify urban morphological characteristics, fully considering the complex interactions between street networks, plot geometries, building typologies, and functional zoning. To further enhance the depth and breadth of the analysis, integrating multi-source urban data streams—including transportation networks, socio-economic indicators, and environmental parameters—could help construct an interdisciplinary, comprehensive analytical framework.
Finally, in terms of practical applications, the next step could involve integrating the analysis results with existing City Information Models (CIMs), enabling urban planners to more intuitively understand the impact of different planning scenarios on urban morphology and, thus, make more informed decisions. In policy formulation, by quantifying the relationships between urban morphology and socio-economic or environmental factors, decision-makers could develop more effective urban development strategies and policies.

5. Conclusions

This study investigates the impact of vertical heterogeneity in 3D urban models on the accuracy of urban spatial clustering and proposes a multiscale fusion framework to address the challenges of smart city planning. By integrating dynamic parameter adaptation and multiscale analysis into traditional density-based clustering methods, the research aims to enhance the precision of urban spatial partitioning.
The results demonstrate that the proposed framework significantly outperforms traditional DBSCAN and hierarchical clustering methods in handling vertical density variations and multiscale spatial heterogeneity. Key innovations include the dynamic coupling of height thresholds and average building heights to adaptively adjust parameters, as well as the hierarchical decomposition of urban spaces into macro, meso, and micro scales. These improvements enable the framework to distinguish high-rise commercial clusters at the macro scale, delineate street boundaries at the meso scale, and identify residential communities at the micro scale, effectively addressing the limitations of static parameterization and isotropic density assumptions in previous studies. The research results provide a spatial foundation for urban analysis, supporting applications such as land use efficiency evaluation, infrastructure planning, and digital twin development. For instance, by using clustered regional zoning as a benchmark and integrating multi-source urban data (e.g., transportation networks and socio-economic indicators), it is possible to simulate and predict various thematic aspects of cities at different scales. Furthermore, in terms of the computational efficiency, future work could explore methods such as CPU-GPU heterogeneous computing (NVIDIA CUDA) and distributed spatial indexing (Apache Sedona) to optimize the processing of large-scale datasets. By incorporating advanced urban morphology theories, the framework can be further refined to enhance its adaptability in complex urban environments.

Author Contributions

T.S. and F.K.; methodology, S.Y.; validation, T.S.; formal analysis, S.Y.; investigation, D.S.; resources, D.S. and Z.R.; data curation, X.W.; writing—original draft, Z.R.; writing—review and editing, T.S., and Z.R.; visualization, X.W.; supervision, F.K. and S.Y.; project administration, X.W.; funding acquisition. All authors have read and agreed to the published version of the manuscript.

Funding

This research was funded by the Technology Research and Development Plan of China State Railway Group Co., Ltd. (Grant No. K2023S019). The authors wish to extend their sincere thanks for the support from China State Railway Group Co., Ltd.

Data Availability Statement

The raw data supporting the conclusions of this article will be made available by the authors on request.

Acknowledgments

Tao Shen would like to extend special thanks to Xueying Wang of China State Railway Group Co., Ltd. for his help.

Conflicts of Interest

The authors declare no conflicts of interest.

References

  1. Pelorosso, R. Modeling and urban planning: A systematic review of performance-based approaches. Sustain. Cities Soc. 2020, 52, 101867. [Google Scholar] [CrossRef]
  2. Anders, K.; Winiwarter, L.; Mara, H.; Lindenbergh, R.C.; Vos, S.E.; Höfle, B. Fully automatic spatiotemporal segmentation of 3D LiDAR time series for the extraction of natural surface changes. ISPRS J. Photogramm. Remote Sens. 2021, 173, 297–308. [Google Scholar] [CrossRef]
  3. Julin, A.; Jaalama, K.; Virtanen, J.; Pouke, M.; Ylipulli, J.; Vaaja, M.T.; Hyyppä, J.; Hyyppä, H. Characterizing 3D City Modeling Projects: Towards a Harmonized Interoperable System. ISPRS Int. J. Geo-Inf. 2018, 7, 55. [Google Scholar] [CrossRef]
  4. Rao, Y.; Zhou, J.; Zhou, M.; He, Q.; Wu, J. Comparisons of three-dimensional urban forms in different urban expansion types: 58 sample cities in China. Growth Change 2020, 51, 1766–1783. [Google Scholar] [CrossRef]
  5. Pepe, M.; Fregonese, L.; Crocetto, N. Use of SfM-MVS approach to nadir and oblique images generated throught aerial cameras to build 2.5D map and 3D models in urban areas. Geocarto Int. 2019, 37, 120–141. [Google Scholar] [CrossRef]
  6. Vartholomaios, A. A machine learning approach to modelling solar irradiation of urban and terrain 3D models. Comput. Environ. Urban Syst. 2019, 78, 101387. [Google Scholar] [CrossRef]
  7. Palliwal, A.; Song, S.; Tan, H.T.; Biljecki, F. 3D city models for urban farming site identification in buildings. arXiv 2020, arXiv:2007.14203. [Google Scholar] [CrossRef]
  8. Zuo, Z.; Xinhai, L.; Xiang, L.; Min, Z.; Gui, J. 3-D Visualization and Spatial Morphology Analysis of Urban Benchmark Land Prices for Residential Use: A Case Study of Wuhan, China. J. Tsinghua Univ. 2018, 58, 941–952. [Google Scholar] [CrossRef]
  9. Hu, D.; Minner, J.S. UAVs and 3D City Modeling to Aid Urban Planning and Historic Preservation: A Systematic Review. Remote Sens. 2023, 15, 5507. [Google Scholar] [CrossRef]
  10. Lu, H.; Li, F.; Yang, G.; Sun, W. Multi-scale impacts of 2D/3D urban building pattern in intra-annual thermal environment of Hangzhou, China. Int. J. Appl. Earth Obs. Geoinf. 2021, 104, 102558. [Google Scholar] [CrossRef]
  11. Cheng, X.; Liu, J.; Liu, H.; Lu, S. A systematic review of evidence of additional health benefits from forest exposure. Landsc. Urban Plan. 2021, 212, 104123. [Google Scholar] [CrossRef]
  12. Zhou, J.; Zhang, S.; Wang, H.; Ding, Y. Spatial Coupling Analysis of Urban Waterlogging Depth and Value Based on Land Use: Case Study of Beijing. Water 2025, 17, 529. [Google Scholar] [CrossRef]
  13. Xia, X.; Jian, L.; Ouyang, K.; Liu, X.; Liang, X.; Zhang, Y.; Li, B. Assessment of Ventilation Potential and Construction of Wind Corridors in Chengdu City Based on Multi-Source Data and Multi-Model Analysis. Land 2024, 13, 1671. [Google Scholar] [CrossRef]
  14. Sun, B.; Li, Y.; Zhang, Y.; Guo, T. Multi-source heterogeneous data fusion prediction technique for the utility tunnel fire detection. Reliab. Eng. Syst. Saf. 2024, 248, 110154. [Google Scholar] [CrossRef]
  15. Bi, Q.; Azman, A.S.; Satter, S.M.; Khan, A.I.; Ahmed, D.; Riaj, A.A.; Gurley, E.S.; Lessler, J. Micro-Scale Spatial Clustering of Cholera Risk Factors in Urban Bangladesh. PLoS Negl. Trop. Dis. 2016, 10, e0004400. [Google Scholar] [CrossRef]
  16. Franch-Pardo, I.; Napoletano, B.M.; Rosete-Vergés, F.A.; Billa, L. Spatial analysis and GIS in the study of COVID-19. A review. Sci. Total Environ. 2020, 739, 140033. [Google Scholar] [CrossRef]
  17. Wang, H.; Song, C.; Wang, J.; Gao, P. A raster-based spatial clustering method with robustness to spatial outliers. Sci. Rep. 2024, 14, 4103. [Google Scholar] [CrossRef]
  18. Yao, Y.; Liu, Y.; Guan, Q.; Hong, Y.; Wang, R.; Wang, R.; Liang, X. Spatiotemporal distribution of human trafficking in China and predicting the locations of missing persons. Comput. Environ. Urban Syst. 2021, 85, 101567. [Google Scholar] [CrossRef]
  19. Ng, R.T.; Han, J. CLARANS: A Method for Clustering Objects for Spatial Data Mining. IEEE Trans. Knowl. Data Eng. 2002, 14, 1003–1016. [Google Scholar] [CrossRef]
  20. Ikotun, A.M.; Ezugwu, A.E.; Abualigah, L.; Abuhaija, B.; Jia, H. K-Means Clustering Algorithms: A Comprehensive Review, Variants Analysis and Advances in the Era of Big Data. Inf. Sci. 2022, 622, 178–210. [Google Scholar] [CrossRef]
  21. Xia, Z.; Chen, Y.; Xu, C. Multiview PCA: A Methodology of Feature Extraction and Dimension Reduction for High-Order Data. IEEE Trans. Cybern. 2021, 52, 11068–11080. [Google Scholar] [CrossRef]
  22. Zhang, J.; Yu, J.; Tao, D. Local Deep-Feature Alignment for Unsupervised Dimension Reduction. IEEE Trans. Image Process. 2018, 27, 2420–2432. [Google Scholar] [CrossRef]
  23. Du, H.; Zhao, S.; Zhang, D.; Wu, J. Novel clustering-based approach for Local Outlier Detection. In Proceedings of the 2016 IEEE Conference on Computer Communications Workshops, San Francisco, CA, USA, 10–14 April 2016; pp. 802–811. [Google Scholar] [CrossRef]
  24. Ester, M.; Kriegel, H.P.; Sander, J. A Density-Based Algorithm for Discovering Clusters in Large Spatial Databases with Noise. In Proceedings of the 2nd International Conference on Knowledge Discovery and Data Mining, Portland, OR, USA, 2–4 August 1996; Simoudis, E., Han, J.W., Fayyad, U.M., Eds.; AAAI Press: Portland, OR, USA, 1996; pp. 226–231. [Google Scholar]
  25. Gao, S.; Cheng, M.; Zhao, K.; Zhang, X.; Yang, M.; Torr, P.H. Res2Net: A New Multi-Scale Backbone Architecture. IEEE Trans. Pattern Anal. Mach. Intell. 2019, 43, 652–662. [Google Scholar] [CrossRef]
  26. Hausler, S.; Garg, S.; Xu, M.; Milford, M.; Fischer, T. Patch-NetVLAD: Multi-Scale Fusion of Locally-Global Descriptors for Place Recognition. In Proceedings of the 2021 IEEE/CVF Conference on Computer Vision and Pattern Recognition, Nashville, TN, USA, 20–25 June 2021; pp. 14136–14147. [Google Scholar] [CrossRef]
  27. Zhang, X.; Zhou, S. WOA-DBSCAN: Application of Whale Optimization Algorithm in DBSCAN Parameter Adaption. IEEE Access 2023, 11, 91861–91878. [Google Scholar] [CrossRef]
  28. Xiao, T.; Wan, Y.; Jin, R.; Qin, J.; Wu, T. Integrating Gaussian Mixture Dual-Clustering and DBSCAN for Exploring Heterogeneous Characteristics of Urban Spatial Agglomeration Areas. Remote Sens. 2022, 14, 5689. [Google Scholar] [CrossRef]
  29. Zhang, W.; Dong, X.; Cheng, J.; Wang, S. Advanced Point Cloud Techniques for Improved 3D Object Detection: A Study on DBSCAN, Attention, and Downsampling. World Electr. Veh. J. 2024, 15, 527. [Google Scholar] [CrossRef]
  30. Shao, J.; Wang, X.; Yang, Q.; Plant, C.; Böhm, C. Synchronization-based scalable subspace clustering of high-dimensional data. Knowl. Inf. Syst. 2016, 52, 83–111. [Google Scholar] [CrossRef]
  31. Zhang, Z.; Dou, Y.; Liu, X.; Gong, Z. Multi-Hierarchical Spatial Clustering for Characteristic Towns in China: An Orange-Based Framework to Integrate GIS and Geodetector. J. Geogr. Sci. 2023, 33, 618–638. [Google Scholar] [CrossRef]
  32. Lin, A.; Huang, B.; Wu, H.; Luo, W. An MIU-based deep embedded clustering model for urban functional zoning from remote sensing images and VGI data. Int. J. Appl. Earth Obs. Geoinf. 2024, 128, 103689. [Google Scholar] [CrossRef]
  33. Zhu, J.; Lang, Z.; Yang, J.; Wang, M.; Zheng, J.; Na, J. Integrating Spatial Heterogeneity to Identify the Urban Fringe Area Based on NPP/VIIRS Nighttime Light Data and Dual Spatial Clustering. Remote Sens. 2022, 14, 6126. [Google Scholar] [CrossRef]
  34. Guo, Z.; Liu, H.; Pang, L.; Fang, L.; Dou, W. DBSCAN-based point cloud extraction for Tomographic synthetic aperture radar (TomoSAR) three-dimensional (3D) building reconstruction. Int. J. Remote Sens. 2020, 42, 2327–2349. [Google Scholar] [CrossRef]
  35. Liu, H.; Tong, Y.; Han, J.; Zhang, P.; Lu, X.; Xiong, H. Incorporating Multi-Source Urban Data for Personalized and Context-Aware Multi-Modal Transportation Recommendation. IEEE Trans. Knowl. Data Eng. 2022, 34, 723–735. [Google Scholar] [CrossRef]
  36. Wang, D.; Wang, X.; Liu, L.; Wang, D.; Zeng, Z. Urban Signatures in the Spatial Clustering of Precipitation Extremes over Mainland China. J. Hydrometeorol. 2021, 22, 639–656. [Google Scholar] [CrossRef]
  37. Fang, X.; Xu, Z.; Ji, H.; Wang, B.; Huang, Z. A Grid-Based Density Peaks Clustering Algorithm. IEEE Trans. Ind. Inform. 2023, 19, 5476–5484. [Google Scholar] [CrossRef]
  38. Yangtianzheng, Z.; Ying, G. Spatial Patterns and Trends of Inter-City Population Mobility in China—Based on Baidu Migration Big Data. Cities 2024, 151, 105124. [Google Scholar] [CrossRef]
  39. Chowdhury, S.; Helian, N.; de Amorim, R.C. Feature weighting in DBSCAN using reverse nearest neighbours. Pattern Recognit. 2023, 137, 109314. [Google Scholar] [CrossRef]
  40. He, Y.; Tan, H.; Luo, W.; Mao, H.; Ma, D.; Feng, S.; Fan, J. MR-DBSCAN: An Efficient Parallel Density-Based Clustering Algorithm Using MapReduce. In Proceedings of the 2011 IEEE 17th International Conference on Parallel and Distributed Systems, Tainan, Taiwan, 7–9 December 2011; pp. 473–480. [Google Scholar] [CrossRef]
  41. Lulli, A.; DellAmico, M.; Michiardi, P.; Ricci, L. NG-DBSCAN: Scalable Density-Based Clustering for Arbitrary Data. Proc. VLDB Endow. 2016, 10, 157–168. [Google Scholar] [CrossRef]
  42. Gulen, M.F.; Samson, N.; Keller, A.; Schwabenland, M.; Liu, C.; Glück, S.; Thacker, V.V.; Favre, L.; Mangeat, B.; Kroese, L.J.; et al. cGAS–STING Drives Ageing-Related Inflammation and Neurodegeneration. Nature 2023, 620, 374–380. [Google Scholar] [CrossRef]
  43. Miranda, F.; Ortner, T.; Moreira, G.; Hosseini, M.; Vuckovic, M.; Biljecki, F.; Silva, C.T.; Lage, M.; Ferreira, N. The State of the Art in Visual Analytics for 3D Urban Data. Comput. Graph. Forum 2024, 43, e15112. [Google Scholar] [CrossRef]
  44. Zheng, Y.; Lin, Y.; Zhao, L.; Wu, T.; Jin, D.; Li, Y. Spatial Planning of Urban Communities via Deep Reinforcement Learning. Nat. Comput. Sci. 2023, 3, 748–762. [Google Scholar] [CrossRef]
  45. Sander, J.; Ester, M.; Kriegel, H.; Xu, X. Density-Based Clustering in Spatial Databases: The Algorithm GDBSCAN and Its Applications. Data Min. Knowl. Discov. 1998, 2, 169–194. [Google Scholar]
  46. Liu, Z.; Wang, A.; Weber, K.; Chan, E.H.; Shi, W. Categorisation of Cultural Tourism Attractions by Tourist Preference Using Location-Based Social Network Data: The Case of Central, Hong Kong. Tour. Manag. 2022, 90, 104488. [Google Scholar] [CrossRef]
  47. Karunarathne, A.Y.; Lee, G. The Geographies of the Dynamic Evolution of Social Networks for the Flood Disaster Response and Recovery. Appl. Geogr. 2020, 125, 102274. [Google Scholar] [CrossRef]
  48. Tai, A.C.; Wong, D.W.; Lee, H.F.; Qiang, W. Tourism’s Long- and Short-Term Influence on Global Cities’ Economic Growth: The Case of Hong Kong. PLoS ONE 2022, 17, e0275152. [Google Scholar] [CrossRef]
  49. Liu, S.; Kwok, Y.T.; Ren, C. Investigating the Impact of Urban Microclimate on Building Thermal Performance: A Case Study of Dense Urban Areas in Hong Kong. Sustain. Cities Soc. 2023, 94, 104509. [Google Scholar] [CrossRef]
  50. Ye, X.; Wang, L.; Xiong, C.; Wang, X.; Wen, G.; Yu, D.; Guo, Z.; Wang, W.; Lv, Z.; Wu, H.; et al. Shallow 3D Structure Investigation of Some Cities in the Guangdong–Hong Kong–Macao Greater Bay Area. Seismol. Res. Lett. 2024, 95, 2000–2012. [Google Scholar] [CrossRef]
  51. Fan, D.; Zeng, X.; Wang, H.; Wang, M.; Li, Q.; Jiang, H.; Li, S. The Role of Ecological Space Structure Optimization in Synergetic Sustainable Development: Evidence from the Guangdong–Hong Kong–Macao Greater Bay Area. Forests 2024, 15, 2225. [Google Scholar] [CrossRef]
  52. Shen, T.; Zhou, W.; Yuan, S.; Huo, L. Spatiotemporal Characterization of the Three-Dimensional Morphology of Urban Buildings Based on Moran’s I. Sustainability 2024, 16, 6540. [Google Scholar] [CrossRef]
  53. Schubert, E.; Sander, J.; Ester, M.; Kriegel, H.; Xu, X. DBSCAN Revisited, Revisited. ACM Trans. Database Syst. 2017, 42, 1–21. [Google Scholar] [CrossRef]
  54. Biljecki, F.; Ledoux, H.; Stoter, J. An Improved LOD Specification for 3D Building Models. Comput. Environ. Urban Syst. 2016, 59, 25–37. [Google Scholar] [CrossRef]
  55. Huang, X.; Cao, R.; Cao, Y. A Density-Based Clustering Method for the Segmentation of Individual Buildings from Filtered Airborne LiDAR Point Clouds. J. Indian Soc. Remote Sens. 2018, 47, 907–921. [Google Scholar] [CrossRef]
  56. Liu, M.; Yan, J.; Dai, T. A Multi-Scale Approach Mapping Spatial Equality of Urban Public Facilities for Urban Design. Heliyon 2023, 9, e18281. [Google Scholar] [CrossRef] [PubMed]
  57. Chen, B.; Zhang, H.; Wong, C.U.; Chen, X.; Li, F.; Wei, X.; Shen, J. Research on the Spatial Distribution Characteristics and Influencing Factors of Educational Facilities Based on POI Data: A Case Study of the Guangdong-Hong Kong-Macao Greater Bay Area. ISPRS Int. J. Geo-Inf. 2024, 13, 225. [Google Scholar] [CrossRef]
  58. Tang, B.; Chen, Z.; Zhang, Y.; Sun, H. A Study on the Evolution of Economic Patterns and Urban Network System in Guangdong-Hong Kong-Macao Greater Bay Area. Front. Public Health 2022, 10, 973843. [Google Scholar] [CrossRef]
  59. Fu, J.; Jing, C.; Du, M.; Fu, Y.L.; Dai, P. Study on Adaptive Parameter Determination of Cluster Analysis in Urban Management Cases. ISPRS Int. Arch. Photogramm. Remote Sens. Spat. Inf. Sci. 2017, 42, 1143–1150. [Google Scholar] [CrossRef]
  60. Zhou, Y.; Xu, J.L.; Yang, H.; Han, Y.J.; Li, F. Intersection and Passageway Designs of Urban Agglomeration Connection Road. Appl. Mech. Mater. 2013, 361–363, 2330–2338. [Google Scholar] [CrossRef]
  61. Li, N.; Quan, S. Identifying Urban Form Typologies in Seoul Using a New Gaussian Mixture Model-Based Clustering Framework. Environ. Plan. B Urban Anal. City Sci. 2023, 50, 2342–2358. [Google Scholar] [CrossRef]
  62. Kartal, S.; Inceoğlu, M. Evaluating Street Character Using the 3D Fractal Analysis Method: Lefkoşa. J. Des. Studio 2023, 5, 207–222. [Google Scholar] [CrossRef]
  63. Afrianto, F. Fractal Dimensions Analysis of Urban Agglomeration at Road Intersections in Metropolitan Malang Raya. IOP Conf. Ser. Earth Environ. Sci. 2023, 1186, 012010. [Google Scholar] [CrossRef]
  64. Esch, T.; Zeidler, J.; Palacios-Lopez, D.; Marconcini, M.; Roth, A.; Mönks, M.; Leutner, B.F.; Brzoska, E.; Metz-Marconcini, A.; Bachofer, F.; et al. Towards a Large-Scale 3D Modeling of the Built Environment: Joint Analysis of TanDEM-X, Sentinel-2 and Open Street Map Data. Remote Sens. 2020, 12, 2391. [Google Scholar] [CrossRef]
  65. Srinivasan, K.; Selvakumar, K. Comparative Study of Pre-Engineered Building and Space Truss Building with Different Span. Indian J. Eng. Mater. Sci. 2022, 29, 428–431. [Google Scholar] [CrossRef]
  66. Zhang, L.; Wan, W.; Lv, B.; Li, Q.; Sun, K.; Wan, Q. Identification of Urban Traffic Accident Hotspots Using Getis-Ord Gi and DBSCAN Algorithmsimes. In Proceedings of the 2024 3rd International Conference on Cloud Computing, Big Data Application and Software Engineering (CBASE), Hangzhou, China, 11–13 October 2024; pp. 93–99. [Google Scholar] [CrossRef]
  67. Caudillo-Cos, C.; Montejano-Escamilla, J.A.; Tapia-McClung, R.; Ávila-Jiménez, F.G.; Barrera-Alarcón, I. Defining Urban Boundaries Through DBSCAN and Shannon’s Entropy: The Case of the Mexican National Urban System. Cities 2024, 149, 104969. [Google Scholar] [CrossRef]
  68. Zou, Y.; Wang, Z.; Wang, X.; Lv, T. A Clustering Algorithm Based on Local Relative Density. Electronics 2025, 14, 481. [Google Scholar] [CrossRef]
  69. Zhang, X.; Lauber, L.; Liu, H.; Shi, J.; Wu, J.; Pan, Y. Research on the Method of Travel Area Clustering of Urban Public Transport Based on Sage-Husa Adaptive Filter and Improved DBSCAN Algorithm. PLoS ONE 2021, 16, e0259472. [Google Scholar] [CrossRef]
Figure 1. Study area.
Buildings 15 01182 g001
Figure 2. Data processing situation.
Buildings 15 01182 g002
Figure 3. Dynamic parameter adjustment.
Buildings 15 01182 g003
Figure 4. Multiscale Spatial Clustering.
Buildings 15 01182 g004
Figure 5. Macro clustering results (1:24,000).
Buildings 15 01182 g005
Figure 6. Meso clustering results (1:10,000).
Buildings 15 01182 g006
Figure 7. Micro clustering results (1:2000).
Buildings 15 01182 g007
Table 1. Spatial scale Clustering parameters ( H t with ϵ ).
Clustering Phase H t ϵ
Macro100 m 800 m
Meso40 m 400 m
Micro20 m200 m
Table 2. DBSCAN Clustering parameters ( H t and ϵ ).
Clustering Phase ϵ M i n P t s
Macro800 m 55
Meso400 m 82
Micro200 m 101
Table 3. Comparison of Davies–Bouldin Index and Silhouette Coefficient.
ModelSilhouette CoefficientDavies–Bouldin Index
MacroMesoMicroMacroMesoMicro
DBSCAN0.650.550.430.720.850.93
HDBSCAN0.520.470.440.890.951.02
Our0.710.630.500.650.810.84
Table 4. Comparison of algorithm computation time.
MetricClustering PhaseDBSCANOur
TimesMacro6 h25 min8 h 52 min
Meso7 h14 min9 h 03 min
Micro8 h55 min10 h 35 min
Disclaimer/Publisher’s Note: The statements, opinions and data contained in all publications are solely those of the individual author(s) and contributor(s) and not of MDPI and/or the editor(s). MDPI and/or the editor(s) disclaim responsibility for any injury to people or property resulting from any ideas, methods, instructions or products referred to in the content.

