Article

Thermal Environmental Impact of Urban Development Scenarios from a Low Carbon Perspective: A Case Study of Wuhan

1
School of Urban Design, Wuhan University, Wuhan 430072, China
2
Research Center for Digital City, Wuhan University, Wuhan 430072, China
3
School of Digital Construction and Blasting Engineering, Jianghan University, Wuhan 430056, China
4
State Key Laboratory of Precision Blasting, Jianghan University, Wuhan 430056, China
5
School of Architecture and Urban Planning, Guizhou University, Guiyang 550025, China
*
Author to whom correspondence should be addressed.
Buildings 2025, 15(2), 208; https://doi.org/10.3390/buildings15020208
Submission received: 3 December 2024 / Revised: 7 January 2025 / Accepted: 10 January 2025 / Published: 12 January 2025
(This article belongs to the Special Issue New Challenges in Digital City Planning)

Abstract

Amidst the increasingly escalating global concern regarding climate change, adopting a low-carbon approach has become crucial for charting the future developmental trajectory of urban areas. It also offers a novel angle for cities to avoid high-temperature risks. This paper estimates carbon emissions in Wuhan City from both direct and indirect aspects. Then, the ANN (artificial neural network)–CA (Cellular Automata) model is employed to establish three distinct development scenarios (Ecological Priority, Tight Growth, and Natural Growth) to predict future urban expansion. Additionally, the WRF (Weather Research and Forecasting Model)—UCM (Urban Canopy Model) model is used to investigate the thermal environmental impacts of varying urban development scenarios. This study uses a low-carbon perspective to explore how cities can develop scientifically sound urban strategies to meet climate change challenges and achieve sustainable development goals. The conclusions are as follows: (1) The net carbon emission for Wuhan in 2022 is estimated to be approximately 20.8353 million tonnes. Should the city maintain an average annual emission reduction rate of 10%, the carbon sink capacity of Wuhan would need to be enhanced by 382,200 tonnes by 2060. (2) In the absence of anthropogenic influence, there is a propensity for the urban construction zone of Wuhan to expand primarily towards the southeast and western sectors. (3) The Ecological Priority (EP) and Tight Growth (TG) scenarios are effective in alleviating the urban thermal environment, achieving a reduction of 0.88% and 2.48%, respectively, in the urban heat island index during afternoon hours. In contrast, the Natural Growth (NG) scenario results in a degradation of the urban thermal environment, with a significant increase of over 4% in the urban heat island index during the morning and evening periods. (4) An overabundance of urban green spaces and water bodies could exacerbate the urban heat island effect during the early morning and at night. The findings of this study enhance the comprehension of the climatic implications associated with various urban development paradigms and are instrumental in delineating future trajectories for low-carbon sustainable urban development models.

1. Introduction

Urbanization represents a pivotal driving force of surface environmental transformation [1]. The sprawl of urban areas can trigger substantial modifications in the physical characteristics of the Earth’s surface and the structure of the atmospheric boundary layer. Such alterations can precipitate a cascade of problems concerning the deterioration of the urban thermal environment [2]. One of the most prominent issues is the urban heat island effect. It is also generally acknowledged as a distinct feature of the urban climate [3]. This phenomenon pertains to the disparity in surface heat balance characteristics between urban and suburban areas [4]. It brings about the circumstance where atmospheric and surface temperatures in urban areas are higher than those in surrounding suburbs. This local warming phenomenon has a profound negative impact on the quality of the ecological environment [5] and human well-being [6]. Previous research has shown that the urban heat island effect may lead to the accumulation of air pollutants in cities [7]. Consequently, investigating the influence of urban expansion on the urban thermal environment has emerged as a significant research topic. Most existing studies focus on two principal facets: socio-economic development and land use change.
On the one hand, urbanization can lead to a significant increase in the urban population and human economic activities. This growth can result in higher energy consumption and waste heat emissions in urban areas, both of which are key factors contributing to the deterioration of urban thermal environments [8]. Some scholars have attempted to select a range of economic and social development indicators to characterize the urbanization process, including population density [9], energy consumption [10], plot ratio [11], and GDP (Gross Domestic Product) [12]. By exploring the quantitative relationships between various indicators and urban temperatures, they delve into the interplay between the urbanization process and the development of urban heat islands. On the other hand, urbanization leads to copious changes in land use, which are accompanied by corresponding shifts in surface albedo, heat capacity, and other physical properties. A plethora of studies have demonstrated that changes in land use can significantly transform the urban thermal environment [13]. Some scholars have put forward the view that there is a significant positive correlation between urban area and the intensity of the urban heat island effect [14]. In particular, the expansion of impervious surfaces in urban areas [15] and the reduction in blue–green spaces [16] contribute substantially to the increase in urban surface temperatures. For example, the direction of growth of impervious surfaces in Wuhan City is basically consistent with the direction of urban heat island expansion [17]. This indicates that the expansion of impervious surfaces plays a dominant role in exacerbating the urban heat island effect [18]. Additionally, some scholars propose that the reduction in inland water bodies during the urbanization process in Wuhan has also intensified the urban heat island effect to a certain extent [19].
The aggravating effect of urban expansion on the urban heat island phenomenon has been thoroughly recorded in research. However, urbanization represents a complex and dynamic process that involves the interplay of various elements, including buildings, vegetation cover, and traffic volumes [20]. For example, urban water bodies and the built environment exert a particular synergistic influence on the thermal environment [21]. These coupling effects have a significant bearing on the urban climate, yet the relationships among these interactions remain inadequately understood and quantified. Consequently, existing research findings do not comprehensively encapsulate the specific impacts of urbanization on the urban thermal environment, complicating efforts to provide effective guidance for urban planning and regulation. Furthermore, although certain attention has been paid to predicting urban development scenarios, there is a comparatively meager focus on future climate change. This deficiency impedes our capacity to foresee and address potential climate-linked challenges concomitant with the urbanization process.
To address these shortcomings, research ought to adopt a holistic perspective and employ more comprehensive methods to simulate and investigate the effects of climate change under various urbanization scenarios. Through simulation, it becomes possible to predict the long-term impacts of urbanization on the climate. Based on these predictions, effective adjustments can be made to the city’s socio-economic and land use development objectives. Such adjustments can help mitigate the risks of urban climate deterioration in the future and promote sustainable urban development. There is an urgent necessity for increased interdisciplinary collaboration and innovative research methods to foster a deeper understanding of the complex relationship between urbanization and climate change, as well as to provide scientific and practical guidance for urban planning. Currently, there is a limited amount of academic research in this area, with most studies focusing on forecasting urban development scenarios using the Cellular Automata (CA) model [22,23]. Scholars have devised a series of modeling methods, including artificial neural network (ANN)–Cellular Automata (CA) [24], Multi-Objective Linear Programming [25], GFCA Urban [26], Dyna-Clue [27], and CLUE-S [28]. These contributions have established a solid foundation for further exploration of the climate impacts associated with future urban development scenarios. The Weather Research and Forecasting Model (WRF) is a numerical simulation tool known for its high accuracy, strong scalability, portability, and user-friendliness [29]. Its integrated Urban Canopy Model (UCM) module is capable of simulating the urban meteorological field within urban canopies (the region from the ground to the top of buildings) [30]. In recent years, the WRF has been employed to investigate the relationship between urban expansion and the urban thermal environment [31]. Zhou availed himself of this model to probe the impact of urban expansion mode on urban heat island [32]. These investigations hinge on historical land use change simulation. Several researchers have successfully integrated the output from urban expansion models into the WRF framework, facilitating the simulation of urban meteorological fields [33]. This indicates that there are effective methods for exploring the climatic differences associated with various future urban development scenarios. However, only a sparse number of studies have adopted this methodology.
Against the backdrop of global climate change, low-carbon development has emerged as a crucial direction for urban growth. Countries such as Japan [34], Germany [35], and Sweden [36] have proposed strategies for constructing low-carbon cities. These strategies primarily focus on two aspects: initially, controlling carbon sources [37], which involves reducing carbon emissions from human activities; secondly, enhancing carbon sinks [38], by increasing carbon absorption capacity through the incorporation of water bodies and green spaces. These measures provide a fresh perspective for adjusting the socio-economic and land use structures of urban development, thereby helping to mitigate the risks associated with rising temperatures. However, current research has notable shortcomings in integrating low-carbon strategies with the climate impacts of urban expansion. Firstly, there is often a lack of comprehensive analysis regarding the specific climate effects of low-carbon measures across various urban development scenarios. Secondly, existing studies provide limited guidance on how to incorporate low-carbon principles into urban planning and expansion processes, as well as how these measures can be harmonized with the prevailing socio-economic development models of cities. Further research is warranted on the implementation of low-carbon strategies during urban expansion, focusing on tailoring these strategies to the specific conditions of individual cities. The goal is to develop expansion models that align with low-carbon development objectives while also addressing the economic and social needs of the local context. This requires more detailed simulations and assessments of the climatic effects of low-carbon measures, along with optimized adjustments to urban land use, energy consumption [39], and industrial structure. The ultimate goal is to facilitate a low-carbon transition in urban development and effectively mitigate climate risks. Studies have shown that over 70 large- and medium-sized cities in China have experienced a ring-like expansion and disorderly sprawl in their urban spatial patterns [40]. This expansion model has been demonstrated to exacerbate the urban heat island effect [41]. Analogous trends have also been observed in the urbanization processes of many developing countries. For instance, Wuhan, designated as a low-carbon pilot city and a comprehensive reform pilot zone for a “dual-type” society in China, has followed a typical pattern of sprawling expansion, resulting in a distinct concentric circular structure. This indicates that its urban layout is highly representative. The transformation in this economic development model, along with the growth of impervious urban surfaces, has indeed negatively impacted the regional climate [42]. In addition, as a central hub city in China, Wuhan’s climatic characteristics are broadly representative of the middle and lower reaches of the Yangtze River region, facing similar summer climate challenges of heat and humidity as cities like Nanjing, Chongqing, and Hangzhou. Therefore, using Wuhan as a case study is not only exemplary but also provides valuable planning references and environmental optimization strategies for other cities with similar climatic and spatial layout features that are susceptible to urban heat islands.
This study aims to explore how cities can formulate scientific and rational urban development strategies to effectively address climate change challenges by revealing the specific impacts of different urban development models on the urban thermal environment from a low-carbon perspective. The research tasks mainly include the following four points: (1) Calculate and predict urban carbon emissions; (2) explore feasible land use structure adjustment strategies under a low-carbon orientation; (3) design future urban scenarios that integrate different development strategies; (4) provide effective recommendations for cities to avoid the risk of high urban temperatures. The research outcomes elucidate the specific impacts of different urban development patterns on the urban thermal environment and provide a reference for Wuhan in formulating scientifically sound and rational urban development strategies. In addition, this paper innovatively proposes a climate analysis method. It cleverly integrates a low-carbon perspective, enabling effective quantification of the climatic impacts of urban expansion. This allows urban managers to better incorporate the needs of low-carbon urban development when conducting urban planning and policy-making, with significant theoretical and practical implications.
Overall, the unique contribution of this study lies in providing a new perspective and tool for sustainable urban development. It not only helps achieve a balance between urban expansion and environmental protection, but also promotes long-term planning and scientific decision-making on the path of low-carbon sustainable development. It has broad prospects for promotion and application and can be referenced and utilized by all cities with the need for low-carbon development and the risk of heat invasion.

2. Study Area and Data Sources
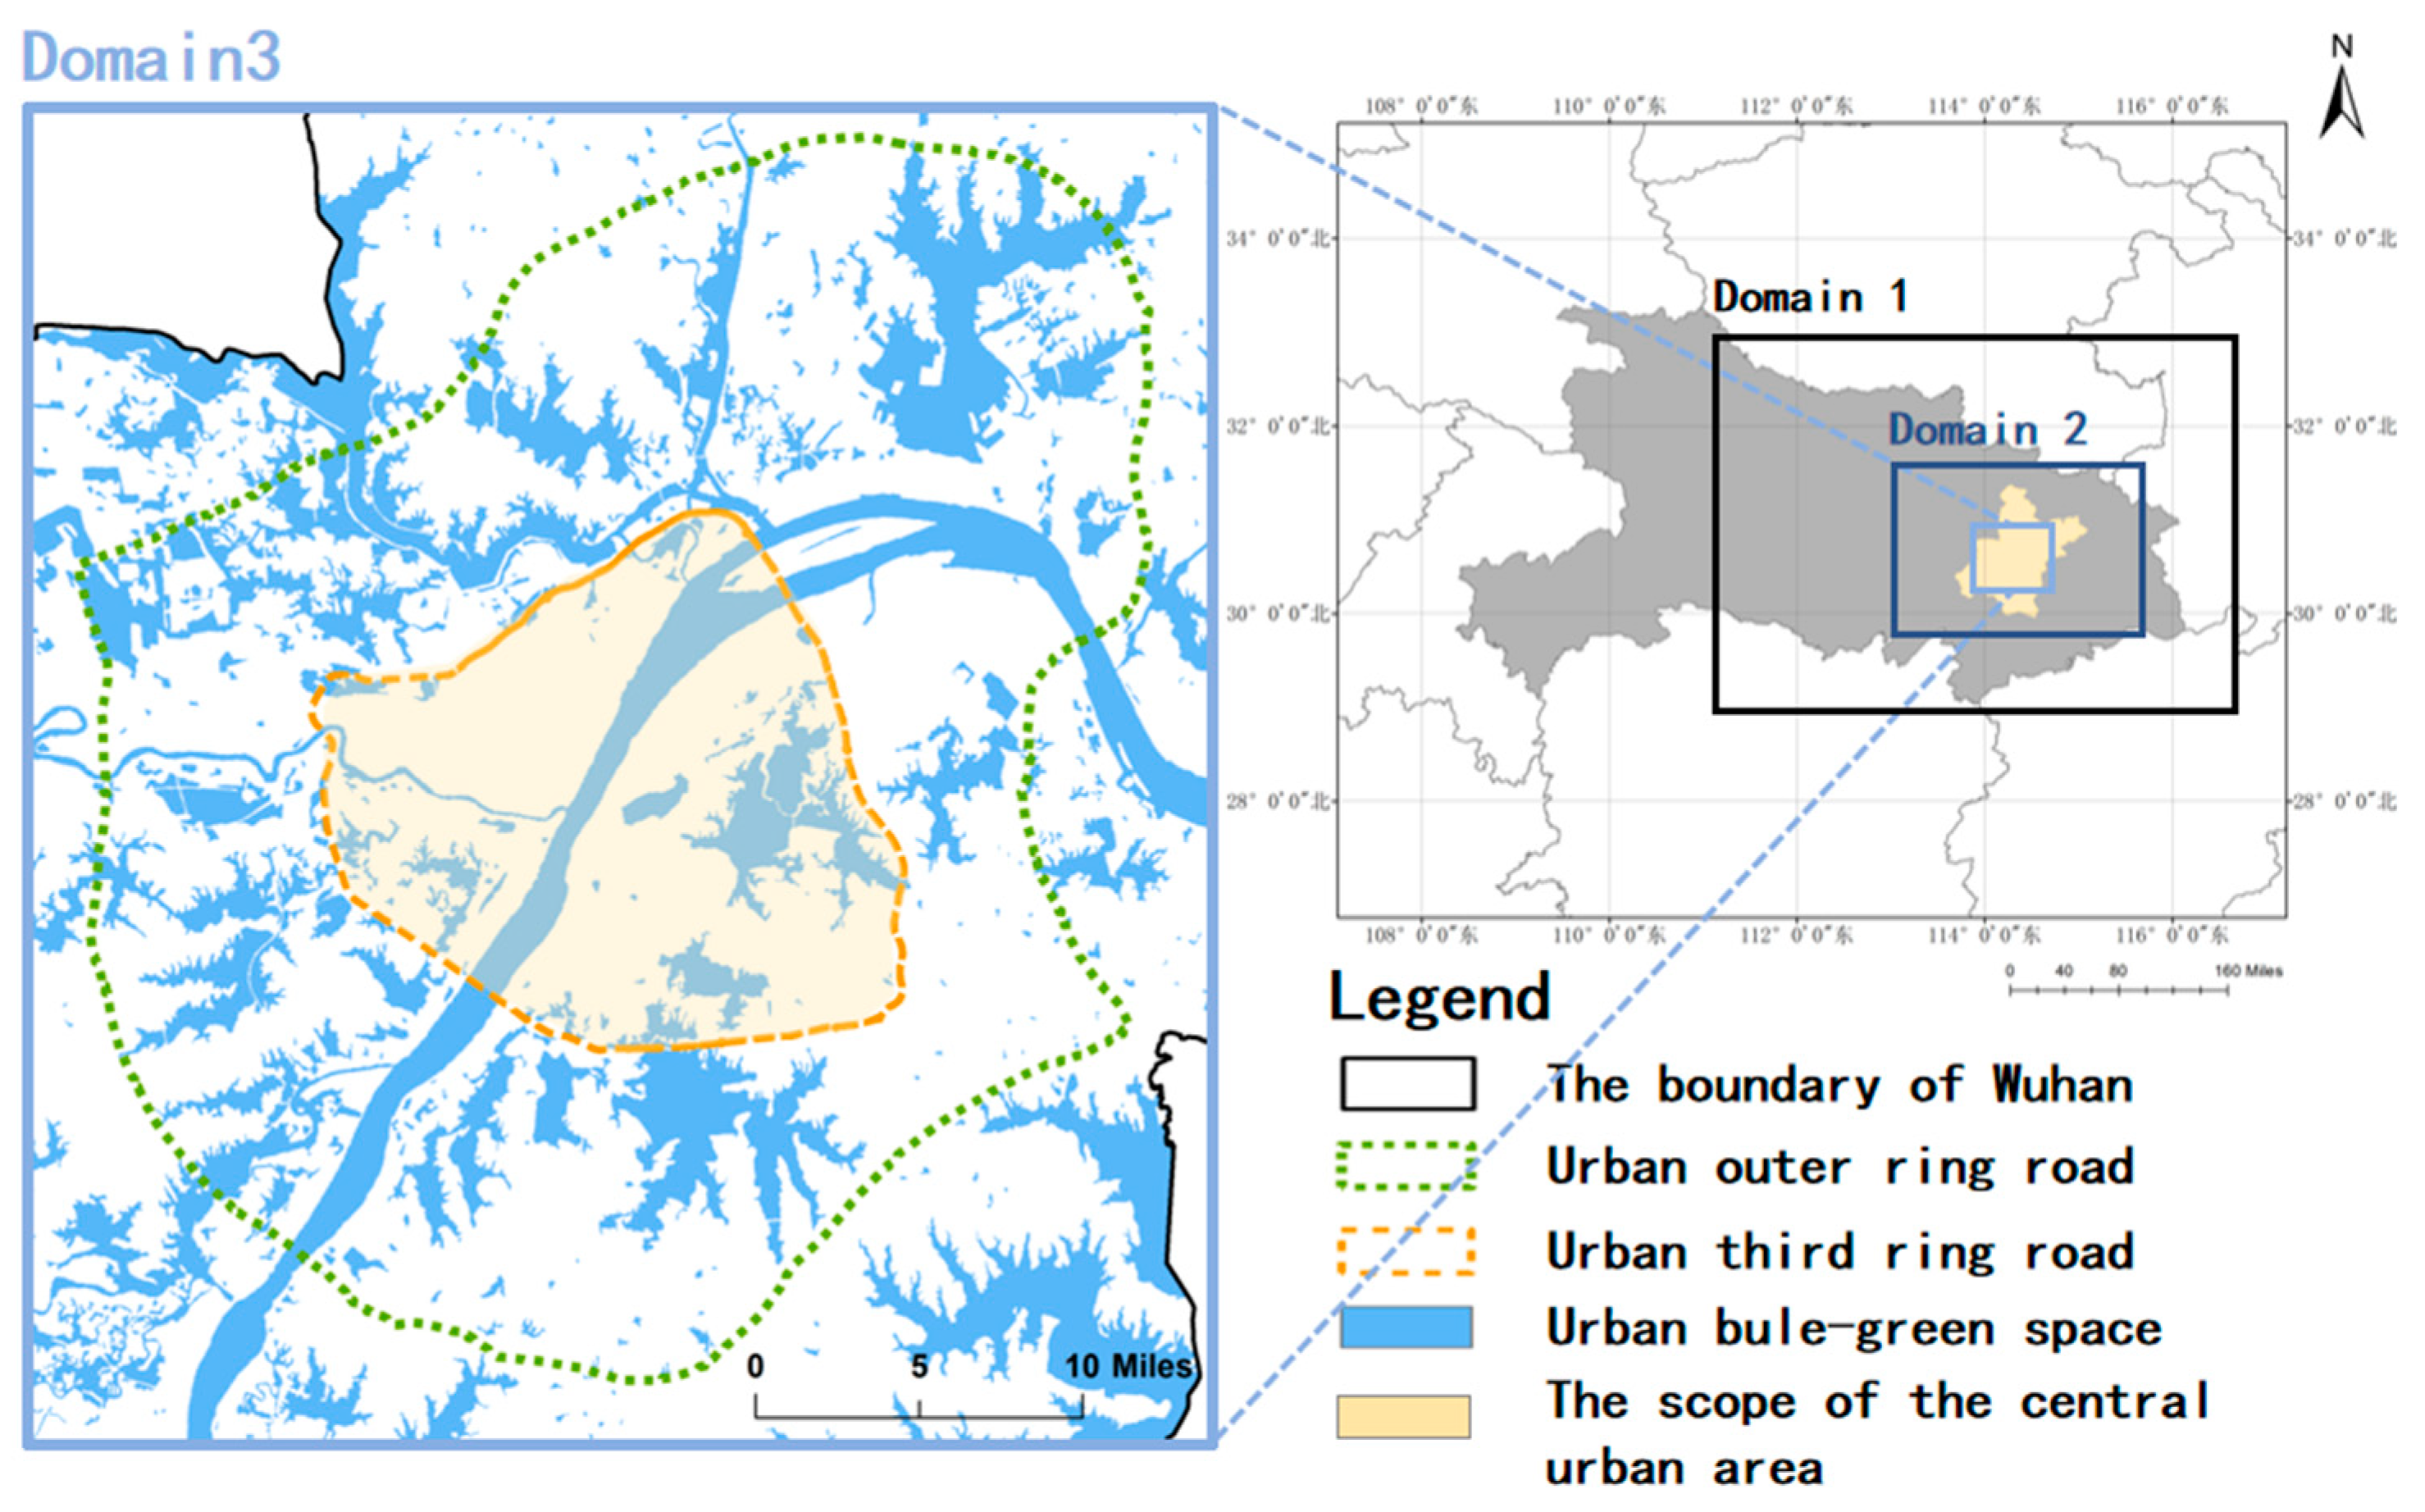
2.1. Study Area

Wuhan is the capital of Hubei Province in China (Figure 1), situated at 113°41′–115°05′ latitude and 29°58′–31°22′ longitude. The city’s urban layout is shaped by the Yangtze and Han rivers, which flow through it, effectively dividing the city into three distinct areas: Wuchang, Hankou, and Hanyang. The urban area spans 8569.15 km2 and had a permanent population of 13,774,000 at the end of 2023. As a pivotal component of the “Rise of Central China” strategy and the sole megacity in central China, Wuhan is facing significant opportunities for economic development. However, as the city undertakes the task to establish a two-oriented society, it must address the adverse effects of rapid urbanization on the ecological environment. The inversion results from the Landsat 8 remote sensing imagery in Figure 1 show that more than half of the space within the outer ring road of Wuhan has experienced the urban heat island effect (the temperature difference between urban areas and suburbs exceeds 2 °C). Therefore, it is essential to investigate the climate impact differences associated with various urban development scenarios from a low-carbon perspective. It can inform the pilot construction of low-carbon cities in Wuhan and provide a reference for the selection of scientific and reasonable urbanization modes.

2.2. Data Sources

The data employed in this study encompass meteorological data, fundamental geographic information, and socioeconomic statistics.
(1) The meteorological data set comprises two distinct types of data: meteorological reanalysis data and station observation data. The meteorological reanalysis data are derived from the FNL data set, which is provided by the National Center for Environmental Prediction (NCEP) in the United States. The station observation data are obtained from three meteorological stations in the Wuhan area: the Jiangxia station, the Caidian station, and the Huangpi station.
(2) The fundamental geographic information data encompass the following: Wuhan land use data, digital elevation model (DEM) data, road network data, and night-time lighting data. The land use data comprise remote sensing interpretation data obtained from the Resource and Environmental Science Data Center of the Chinese Academy of Sciences [43]. The DEM data are obtained from the website of the Geospatial Data Cloud: http://www.gscloud.cn (accessed on 10 March 2024). The road network data are sourced from the National Basic Geographic Database of China. The night-time lighting data are also obtained from website of the Resource and Environmental Science Data Centre of the Chinese Academy of Sciences: http://www.resdc.cn (accessed on 16 March 2024).
(3) Socio-economic statistics encompass a range of data, including population data, GDP statistics, and energy consumption data. The data are sourced from the Hubei Statistical Yearbook (1990–2020), the Wuhan Statistical Yearbook (1990–2020), the Wuhan Statistical Bulletin on National Economic and Social Development (1990–2020), and other pertinent materials.

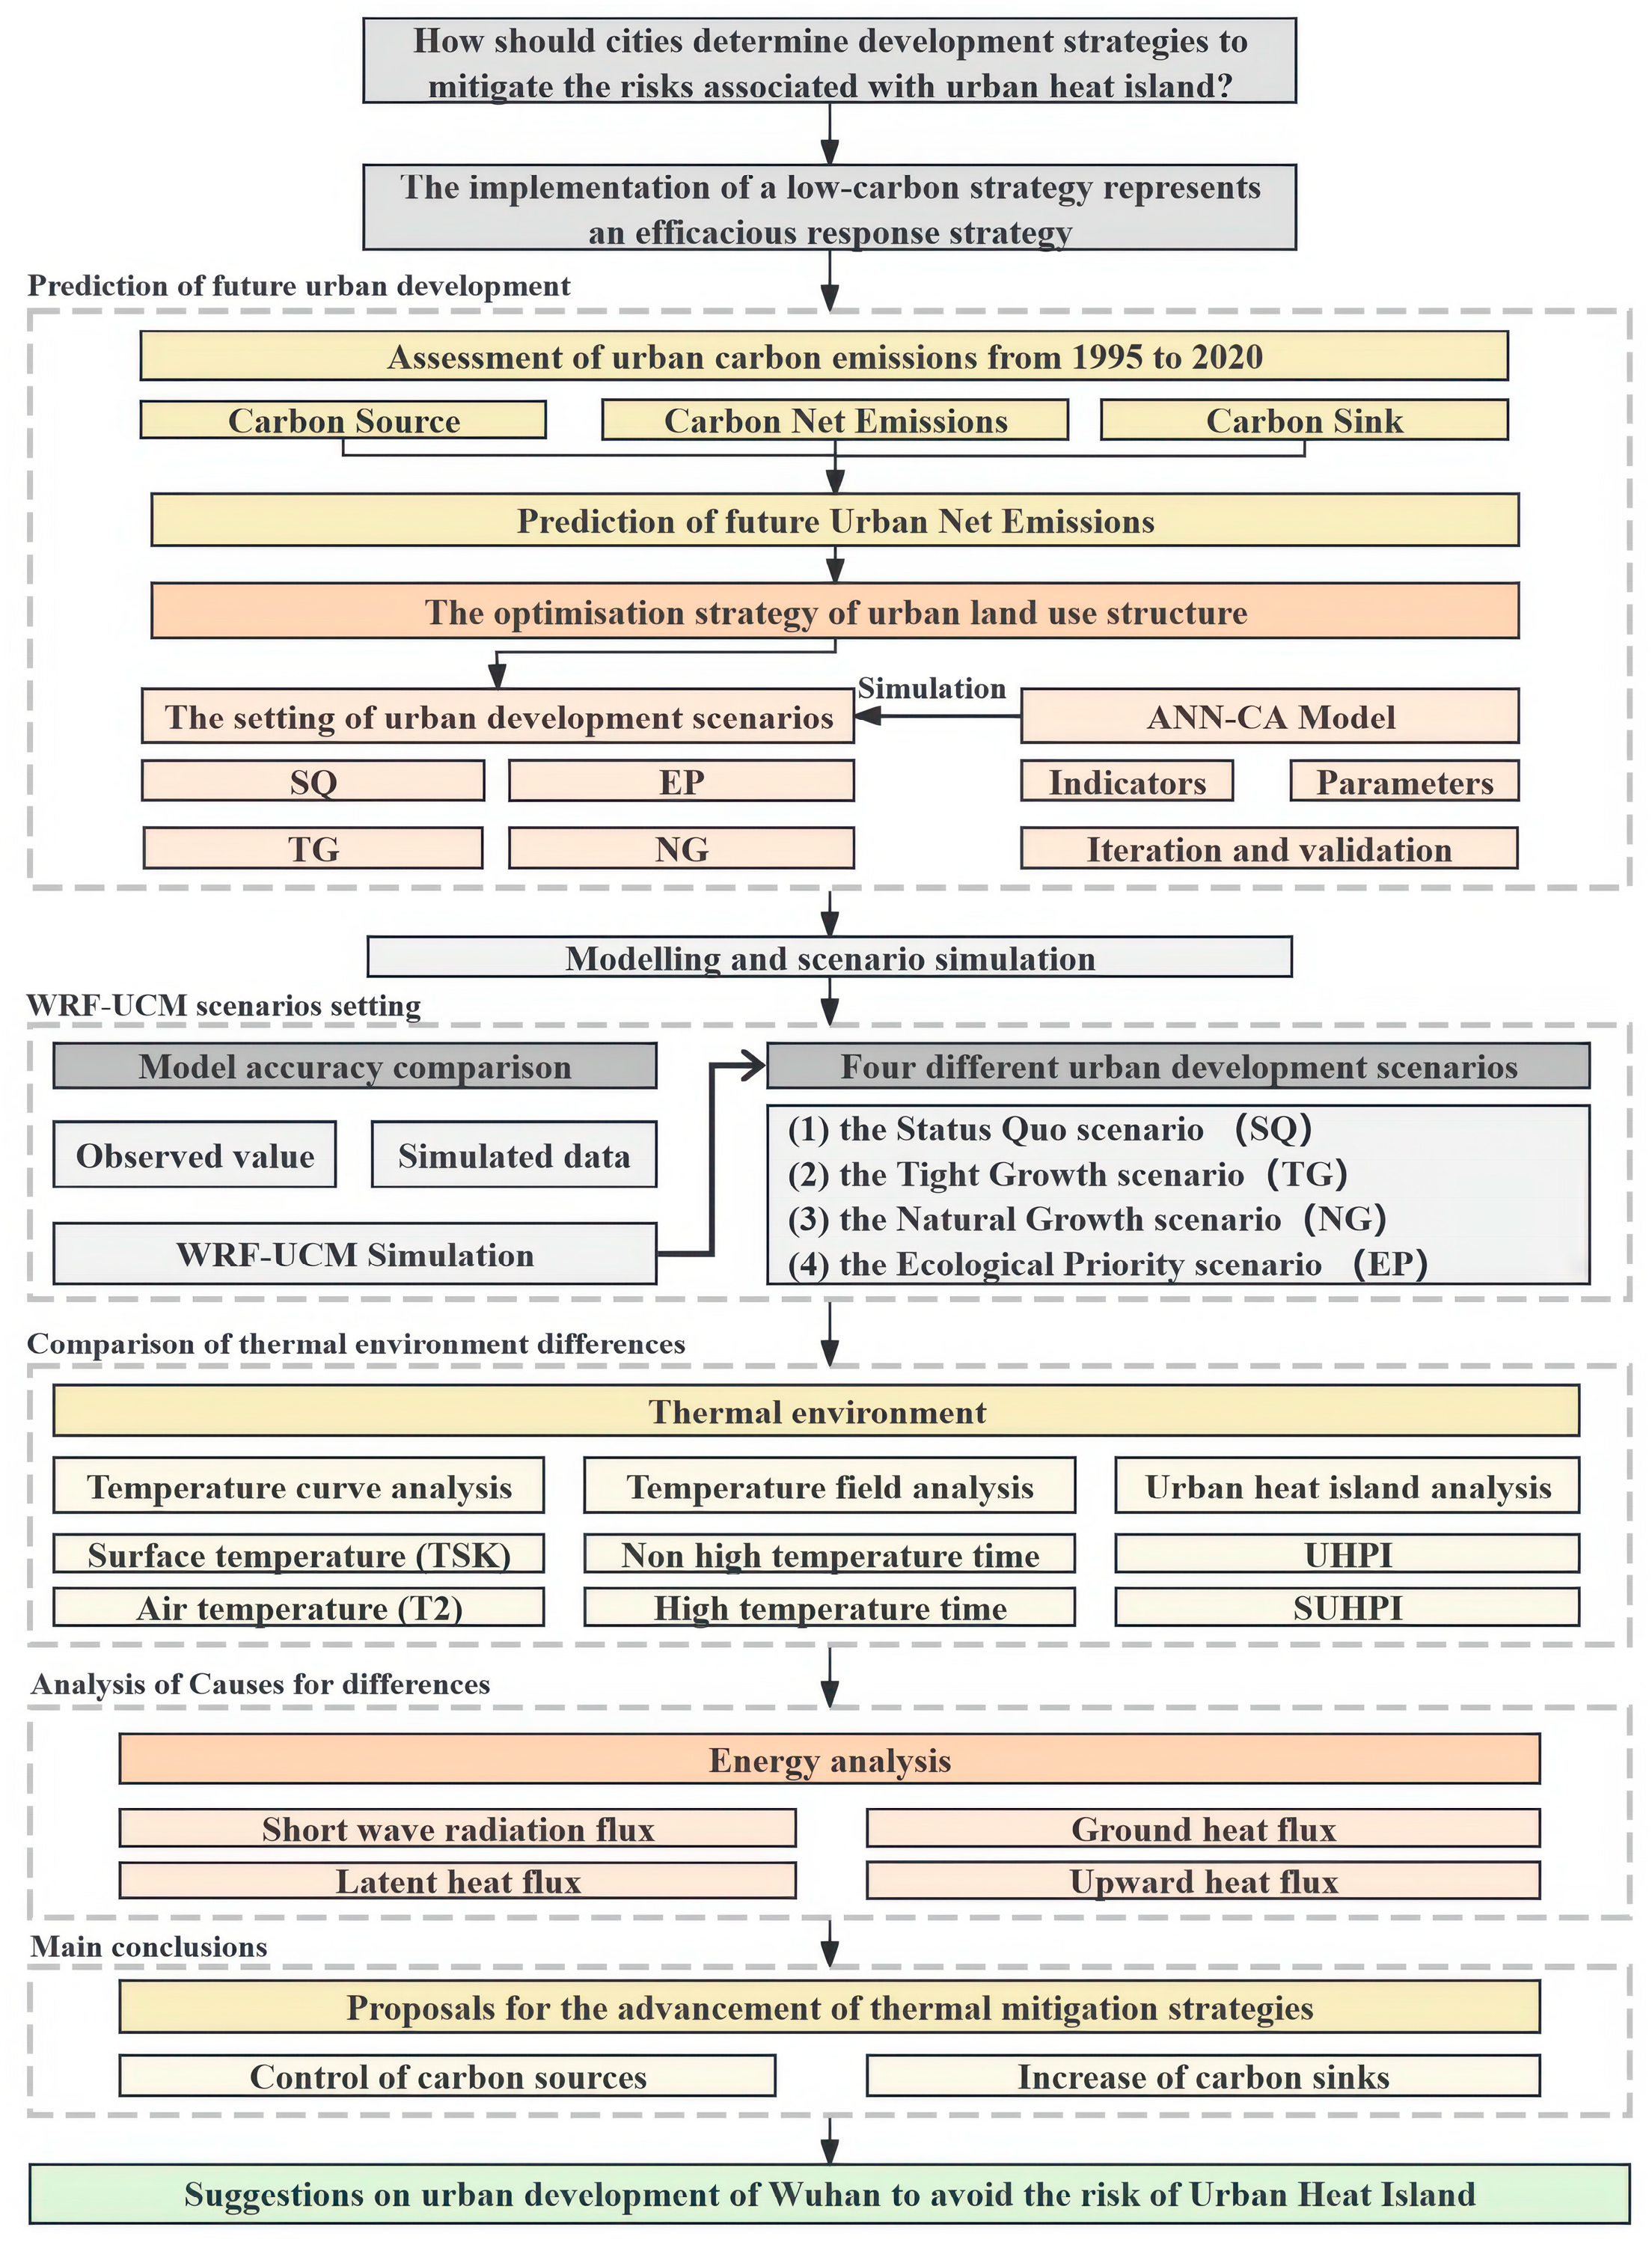
3. Methods and Model

This study commences by estimating the historical carbon sources, carbon sinks, and net carbon emissions of Wuhan City, followed by forecasting future carbon emissions. Subsequently, adjustment strategies for land use structure are proposed based on these projected values. The Cellular Automaton model is then employed to simulate three distinct urban development scenarios: Natural Growth, Ecological Priority, and Tight Growth. Ultimately, a comparative experiment is conducted using the Urban Canopy Model (UCM) to explore the impacts of these varying urban development scenarios on the urban thermal environment. The technical approach is illustrated in Figure 2.

3.1. Carbon Emission Calculation Method

The calculation of urban carbon emissions is categorized into direct and indirect carbon emissions. Direct carbon emissions arise from five types of land use: cultivated land, forest land, grassland, water bodies, and unused land. The exact emissions are calculated by determining the carbon emission coefficient that applies to the specific land use type in question. The specific calculation process is shown in Equation (1).
C z =   C i =   T i × δ i
Cz is the direct carbon emissions. Ci denotes the different land use types. Ti indicates the area of each land use type. δi is the carbon emission coefficient for each type of land use. The equation calculates the total direct carbon emissions by summing the products of the area of each land use type and its corresponding carbon emission.
Indirect carbon emissions are calculated by the total consumption of seven types of fossil fuels: coal, coke, crude oil, gasoline, diesel, fuel oil, and kerosene. The standard coal conversion coefficient and carbon emission coefficients utilized in the above calculation are derived from the IPCC Guidelines for National Greenhouse Gas Inventories (2006) and the Guidelines for Provincial Greenhouse Gas Inventories (Table 1). The specific calculation process is shown in Equation (2).
C J =   C j = j = 1 n   E j × δ j × λ j
CJ is the total carbon emissions from construction land. Cj denotes the total carbon emissions from the j-th type of energy source. Ej is the consumption amount of the j-th type of energy. δi is the carbon emission coefficient for the j-th type of energy. λj is the standard carbon conversion factor for different types of energy. For natural gas, the average low calorific value is measured in kilojoules per cubic meter (kJ/m3), and the carbon emission coefficient is measured in kilograms of carbon per cubic meter (kgC/m3).

3.2. Urban Development Scenario Prediction Method
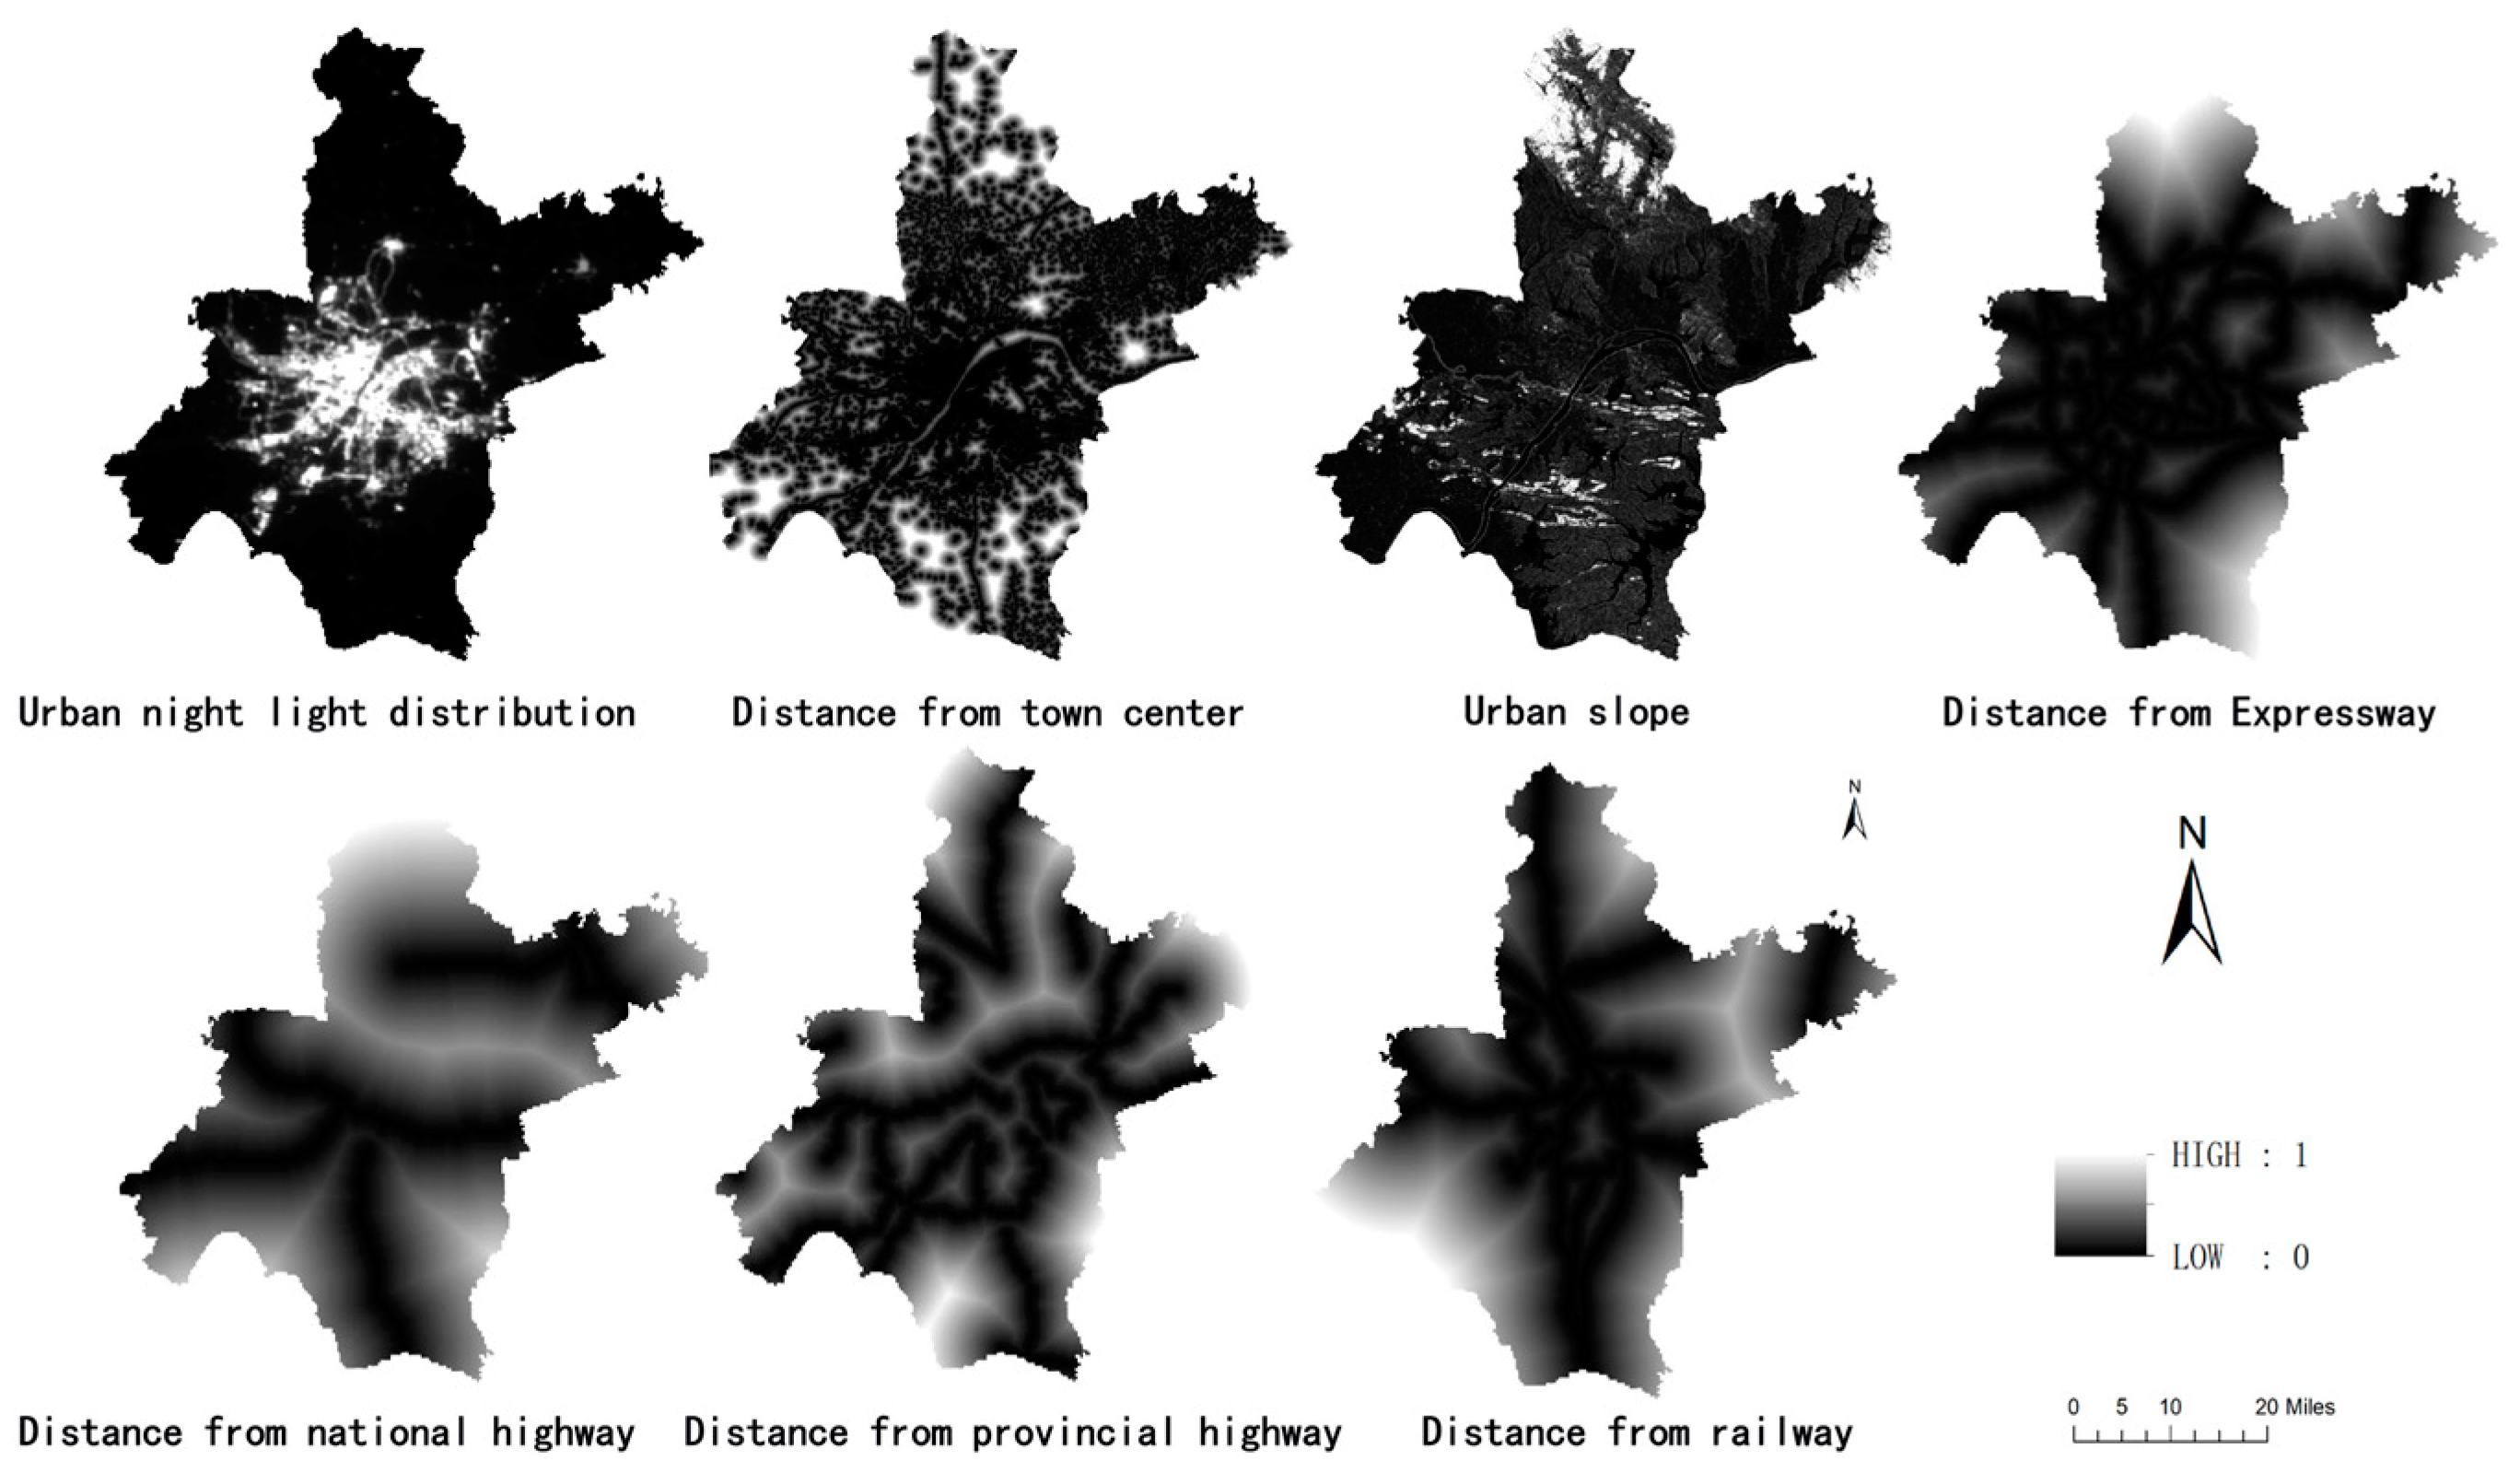
3.2.1. ANN-CA Model

The ANN (artificial neural network)–CA (Cellular Automata) model integrates an artificial neural network (ANN) with a Cellular Automata model (CA) framework. This hybrid approach leverages the strengths of ANNs in handling nonlinear complex systems and the capabilities of the CA in dynamically simulating intricate spatial changes. The model is divided into three levels: data input, hidden layer, and calculation development. Its operational principle is based on training and simulating processes that mimic human neural networks. During the training phase, the model’s parameters are derived from the input training data, which are subsequently utilized in the simulation step for operational execution. The model’s straightforward architecture, along with user-defined conversion rules and parameters, enhances its ability to generate effective representations of complex spatial relationships. It is particularly well suited for simulating the evolution of land use patterns.

3.2.2. Development Scenario Setting

The Wuhan 2035 Urban Transformation and Planning Report indicates that the city is expected to gradually decrease the amount of new construction land by 2025 and transition to a “zero increment” approach after 2030. Based on this, three development scenarios are established to predict the expansion under the context of future carbon neutrality.
(1) Tight Growth (TG): Wuhan will implement a policy of zero growth in construction land by 2030. Concurrently, the city will pursue a strategy to enhance urban carbon sinks through land use restructuring, thereby aiming to achieve carbon neutrality by 2060.
(2) Natural Growth (NG): Wuhan will complete its development according to the urban development strategy outlined in the aforementioned report. This involves a transition starting in 2025 to a phase of constrained growth, followed by a gradual shift to zero growth by 2030. This scenario does not take into account the attainment of carbon neutrality goals.
(3) Ecological Priority (EP): Wuhan aims to reduce urban carbon emissions by an average annual rate of 10%. Simultaneously, the city plans to achieve carbon neutrality by 2060 through the stringent regulation of unplanned urban expansion and the enhancement of carbon sinks.

3.2.3. Experimental Process

Firstly, the artificial neural network is trained. This process involves loading the land use data and spatial constraint factors (Figure 3) and extracting the cell transformation rules based on land use data from 2005 and 2015. Subsequently, the appropriate conversion suitability matrix, iteration count, diffusion parameters, conversion threshold, and other relevant parameters are set under three simulation scenarios. After several adjustments, the following optimal training parameters are finally determined: the cellular neighborhood range is set to 7 × 7, the learning rate of the neurons is set to 0.2, the number of iterations is set to 1000, and the Kappa coefficient can reach up to 91%. Finally, the spatial distribution characteristics of land use in Wuhan under three growth scenarios for the year 2060 are predicted based on the land use data from 2015.

3.3. Numerical Simulation Method

3.3.1. WRF-UCM Model

The Weather Research and Forecasting Model (WRF) is a mesoscale weather forecasting model that is developed by several scientific research institutions in the United States. It is a non-static equilibrium numerical model with cross-scale research capabilities. It also incorporates a comprehensive physical parameterization scheme. By selecting an appropriate physical scheme, it is possible to simulate various microphysical processes, including solar radiation, cumulus convection, and the deposition of rain and snow. This simulation mechanism is well suited for addressing the majority of mesoscale meteorological research scenarios. Since version 2.2, the Urban Canopy Model (UCM) has been integrated into the WRF model as a module. This integration significantly enhances the accuracy of meteorological simulations in urban canopy areas. This is because the UCM model takes into account the geometric characteristics of the city, the shielding effect of buildings on radiation, and the radiation reflection process of buildings. The impact of varying urban underlying surfaces on the atmosphere can be assessed by adjusting parameters such as land use type, heat capacity, and plot ratio [44]. To ensure optimal performance, it is essential to select the most suitable physical parameterization scheme for each module within the WRF model, tailored to the specific simulation requirements. The WRF-UCM model facilitates the exploration of differences in meteorological elements across various urban development scenarios by substituting the underlying surfaces of different cities. Please refer to Table 2 for the selected physical scheme.

3.3.2. Case Setting

The objective of this study is to examine the differential impact of urban climate change resulting from distinct urban development scenarios in Wuhan. The four cases comprise one scenario representing the current situation and three scenarios depicting future developments. The scenarios are as follows: the status quo of land use in 2015 (SQ), the Tight Growth scenario for 2060 (TG), the Natural Growth scenario for 2060 (NG), and the Ecological Priority scenario for 2060 (EP).

3.3.3. Setting of Simulation Parameters

This paper presents three nested grids (Figure 4), designated as Domain 1 (4.5 km), Domain 2 (1.5 km), and Domain 3 (0.5 km). The dimensions of the two-dimensional grids are 74 × 66, 103 × 94 and 121 × 130. The outer grid provides boundary conditions for the inner grids. The coordinates of the simulated center point are 114.30° E and 30.50° N. The vertical height is set at 20 km, and the number of interpolation layers is 35. The initial field is based on the FNL data from NCEP/NCAR. In the Domain 3, urban construction land is categorized into three levels of land use intensity: low (31), medium (32), and high (33). Each level of land use intensity has specific urban canopy parameters (Table 3). Low-intensity land is primarily situated in areas outside the outer ring road. The main urban canopy parameters configured for this type of land use are as follows: the roof level is 15 m, the construction land ratio is 60%, and the anthropogenic heat is 160 watts per square meter (W/m2). Medium-intensity land is concentrated between the second and third ring roads. Its roof level is 21 m, the construction land ratio is 65%, and the anthropogenic heat parameter is 214 W/m2. High-intensity land is predominantly found within the second ring road of the city. Its roof level is 27 m, the construction land ratio is 70%, and the anthropogenic heat parameter is 277 W/m2. For the settings of other parameters, please refer to Table 3. Since the WRF model was jointly developed by American research institutions, its default urban canopy parameters are more suitable for American cities. By referring to the “Wuhan City Land Use and Construction Intensity Management Regulations”, different land use intensity zones in Wuhan are delineated, along with corresponding canopy parameters. These parameters also are updated based on data obtained from the Wuhan Municipal Natural Resources Bureau. For the calculation of anthropogenic heat parameters, cities with similar construction scales to Wuhan are initially referenced, and ultimately, the data are derived from the energy consumption figures in the Wuhan Statistical Yearbook.
Considering the need to conserve computational resources, this study selected a period within 2013–2023 that can best represent the characteristics of Wuhan’s summer climate, namely high temperature, low rainfall, and light wind. A one-week meteorological simulation was conducted from 00:00 on 20 July 2017 to 00:00 on 27 July 2017. During this period, the daily maximum temperature in Wuhan consistently exceeded 37 °C, reaching up to 40 °C. Similar extreme heat periods are also frequently experienced by many other cities, such as Tokyo, Beijing, Shanghai, New Delhi, and Cairo. Therefore, selecting this period for simulation can directly reflect the mitigation effects of different development scenarios on extreme heatwaves. The simulation results will serve as a more appropriate reference for cities to address future heat risks.

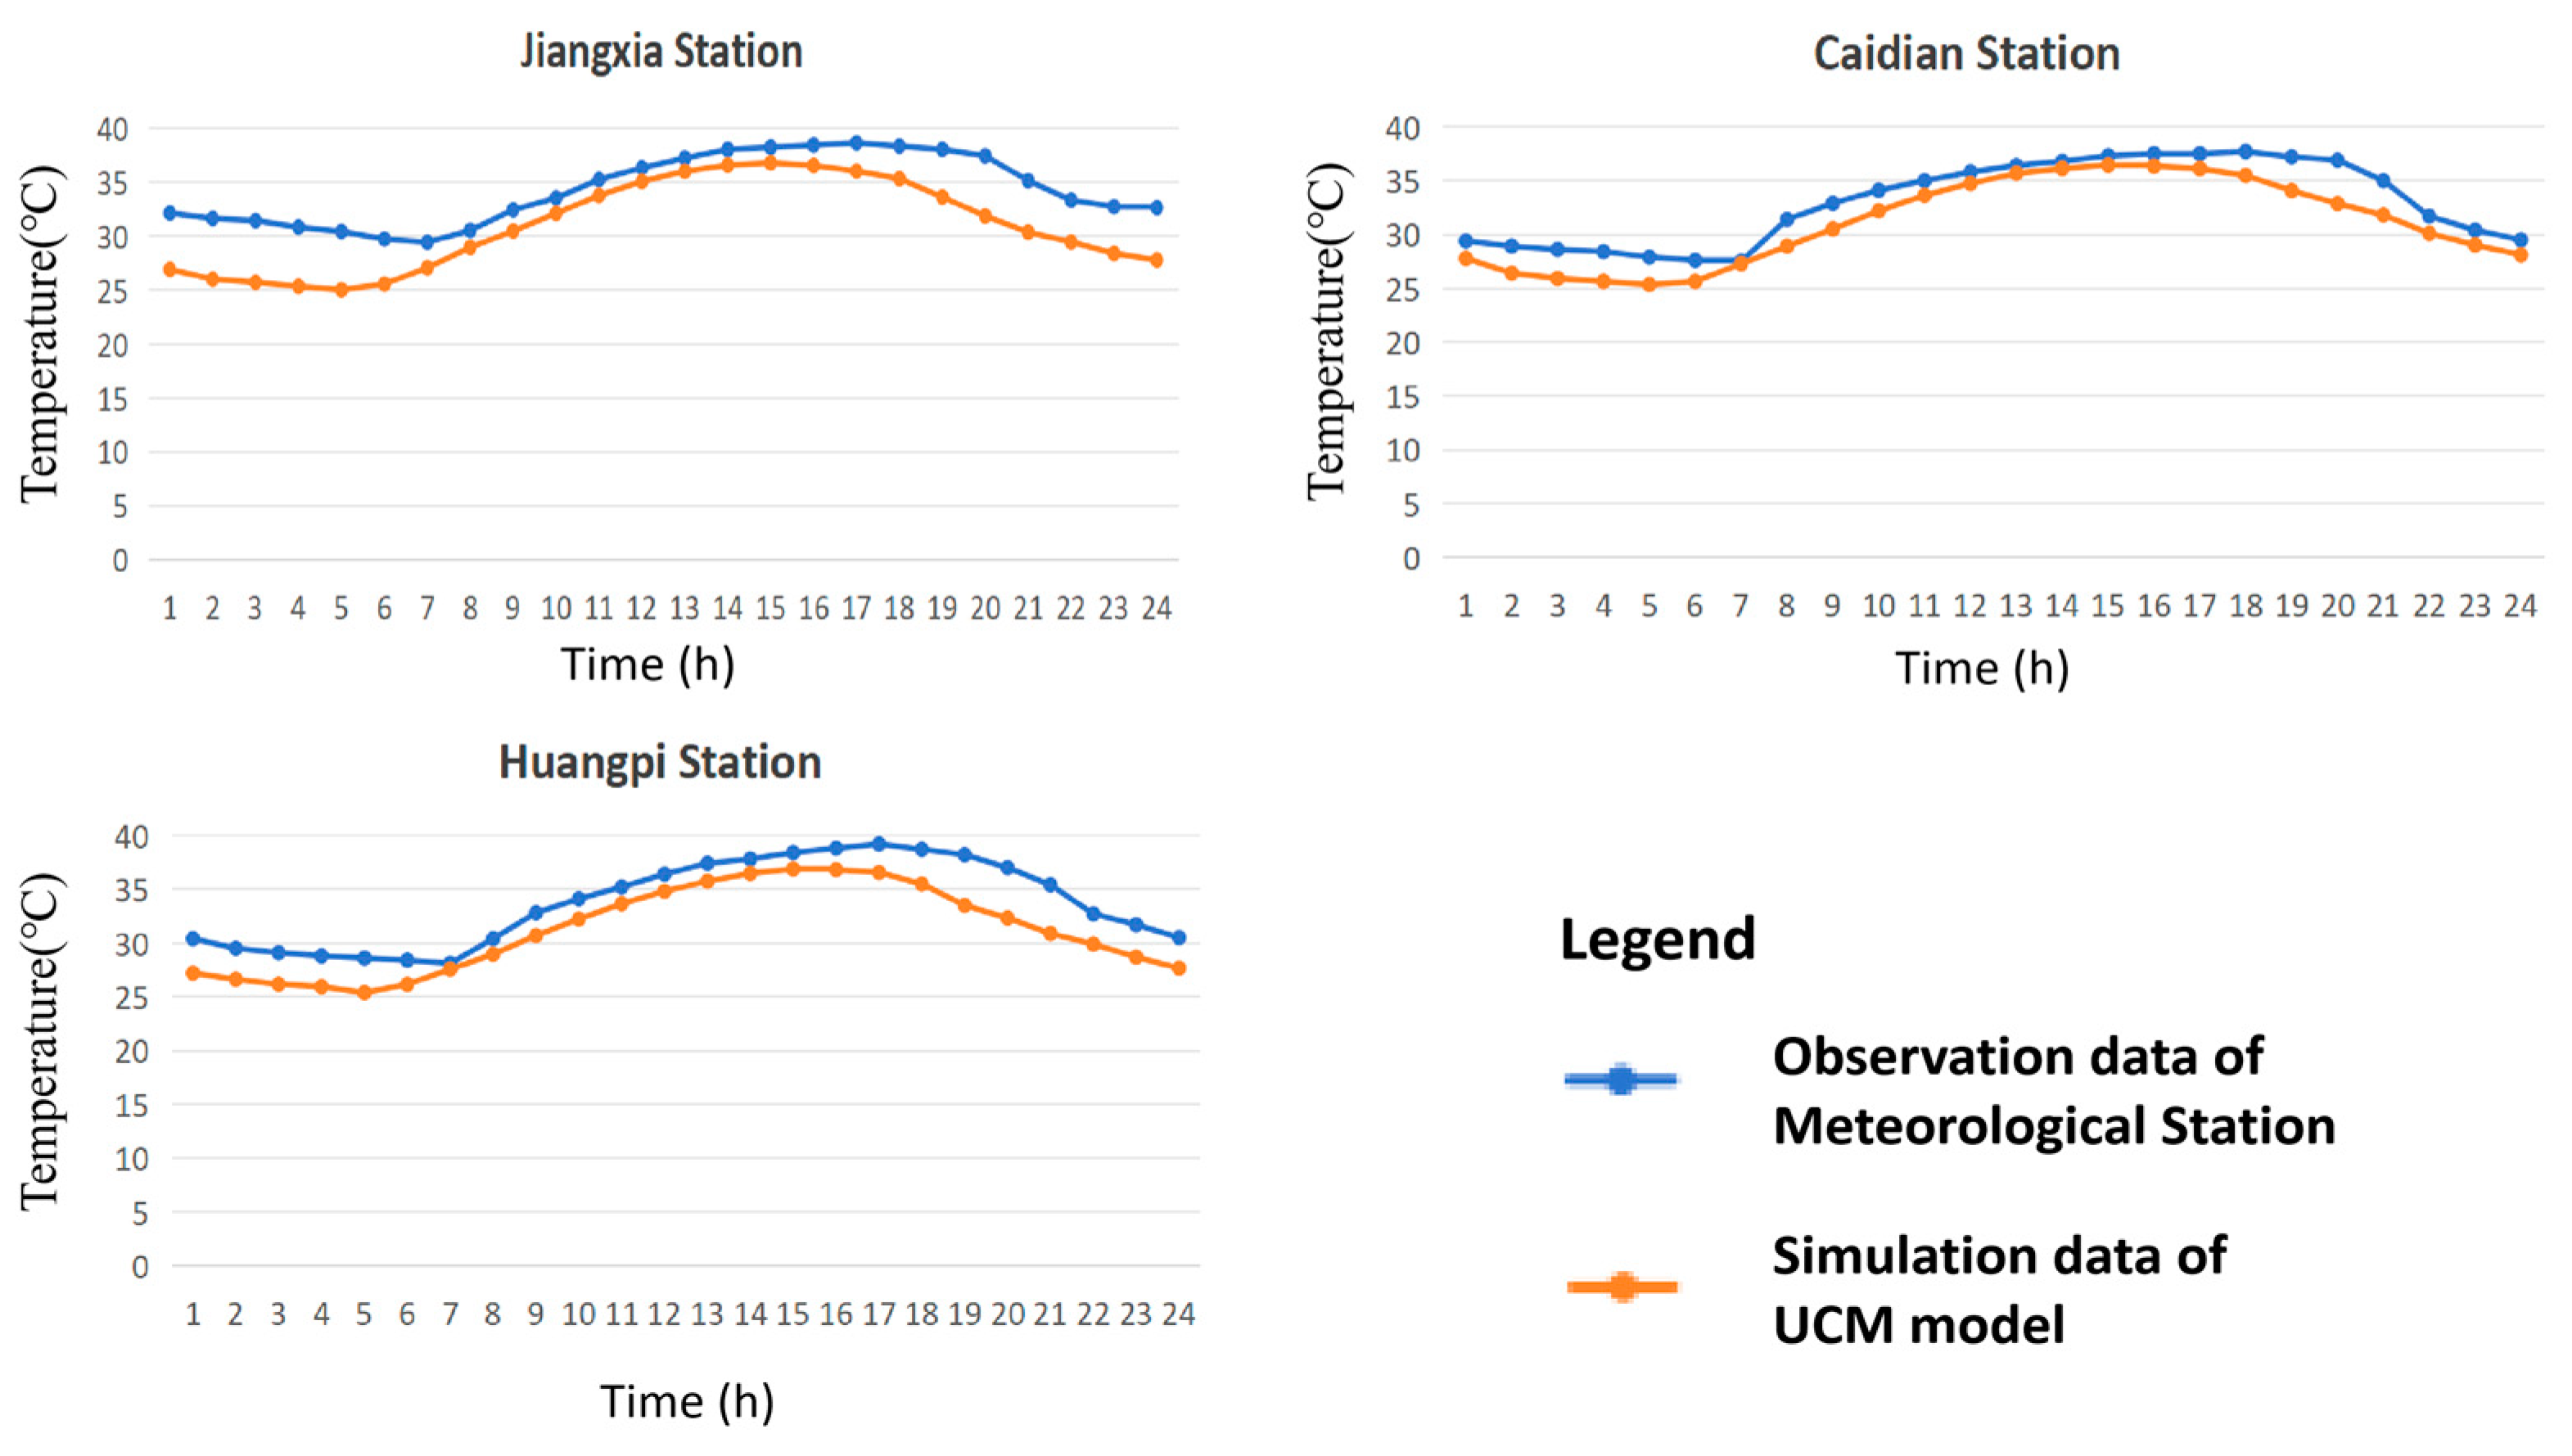
3.3.4. Verification of Model Effectiveness

The temperature observation results from Wuhan Jiangxia Station, Caidian Station, and Huangpi Station on 23 July 2017 are compared with the simulation results of the UCM model. To better present the results, a comparison chart of temperature curves between simulated and observed data has been created (Figure 5). Additionally, an error metric analysis table for the simulated and observed data is obtained (Table 4). Figure 5 shows that the hourly temperature curves for the three stations closely resemble the simulated value curves. Table 4 indicates that the mean deviation and root mean square error of the UCM model can generally be within 3. And the correlation coefficients all exceed 0.92. There is a strong correlation between the simulation results and the observed data. The WRF-UCM model can effectively simulate the meteorological elements in the urban canopy area.

4. Results

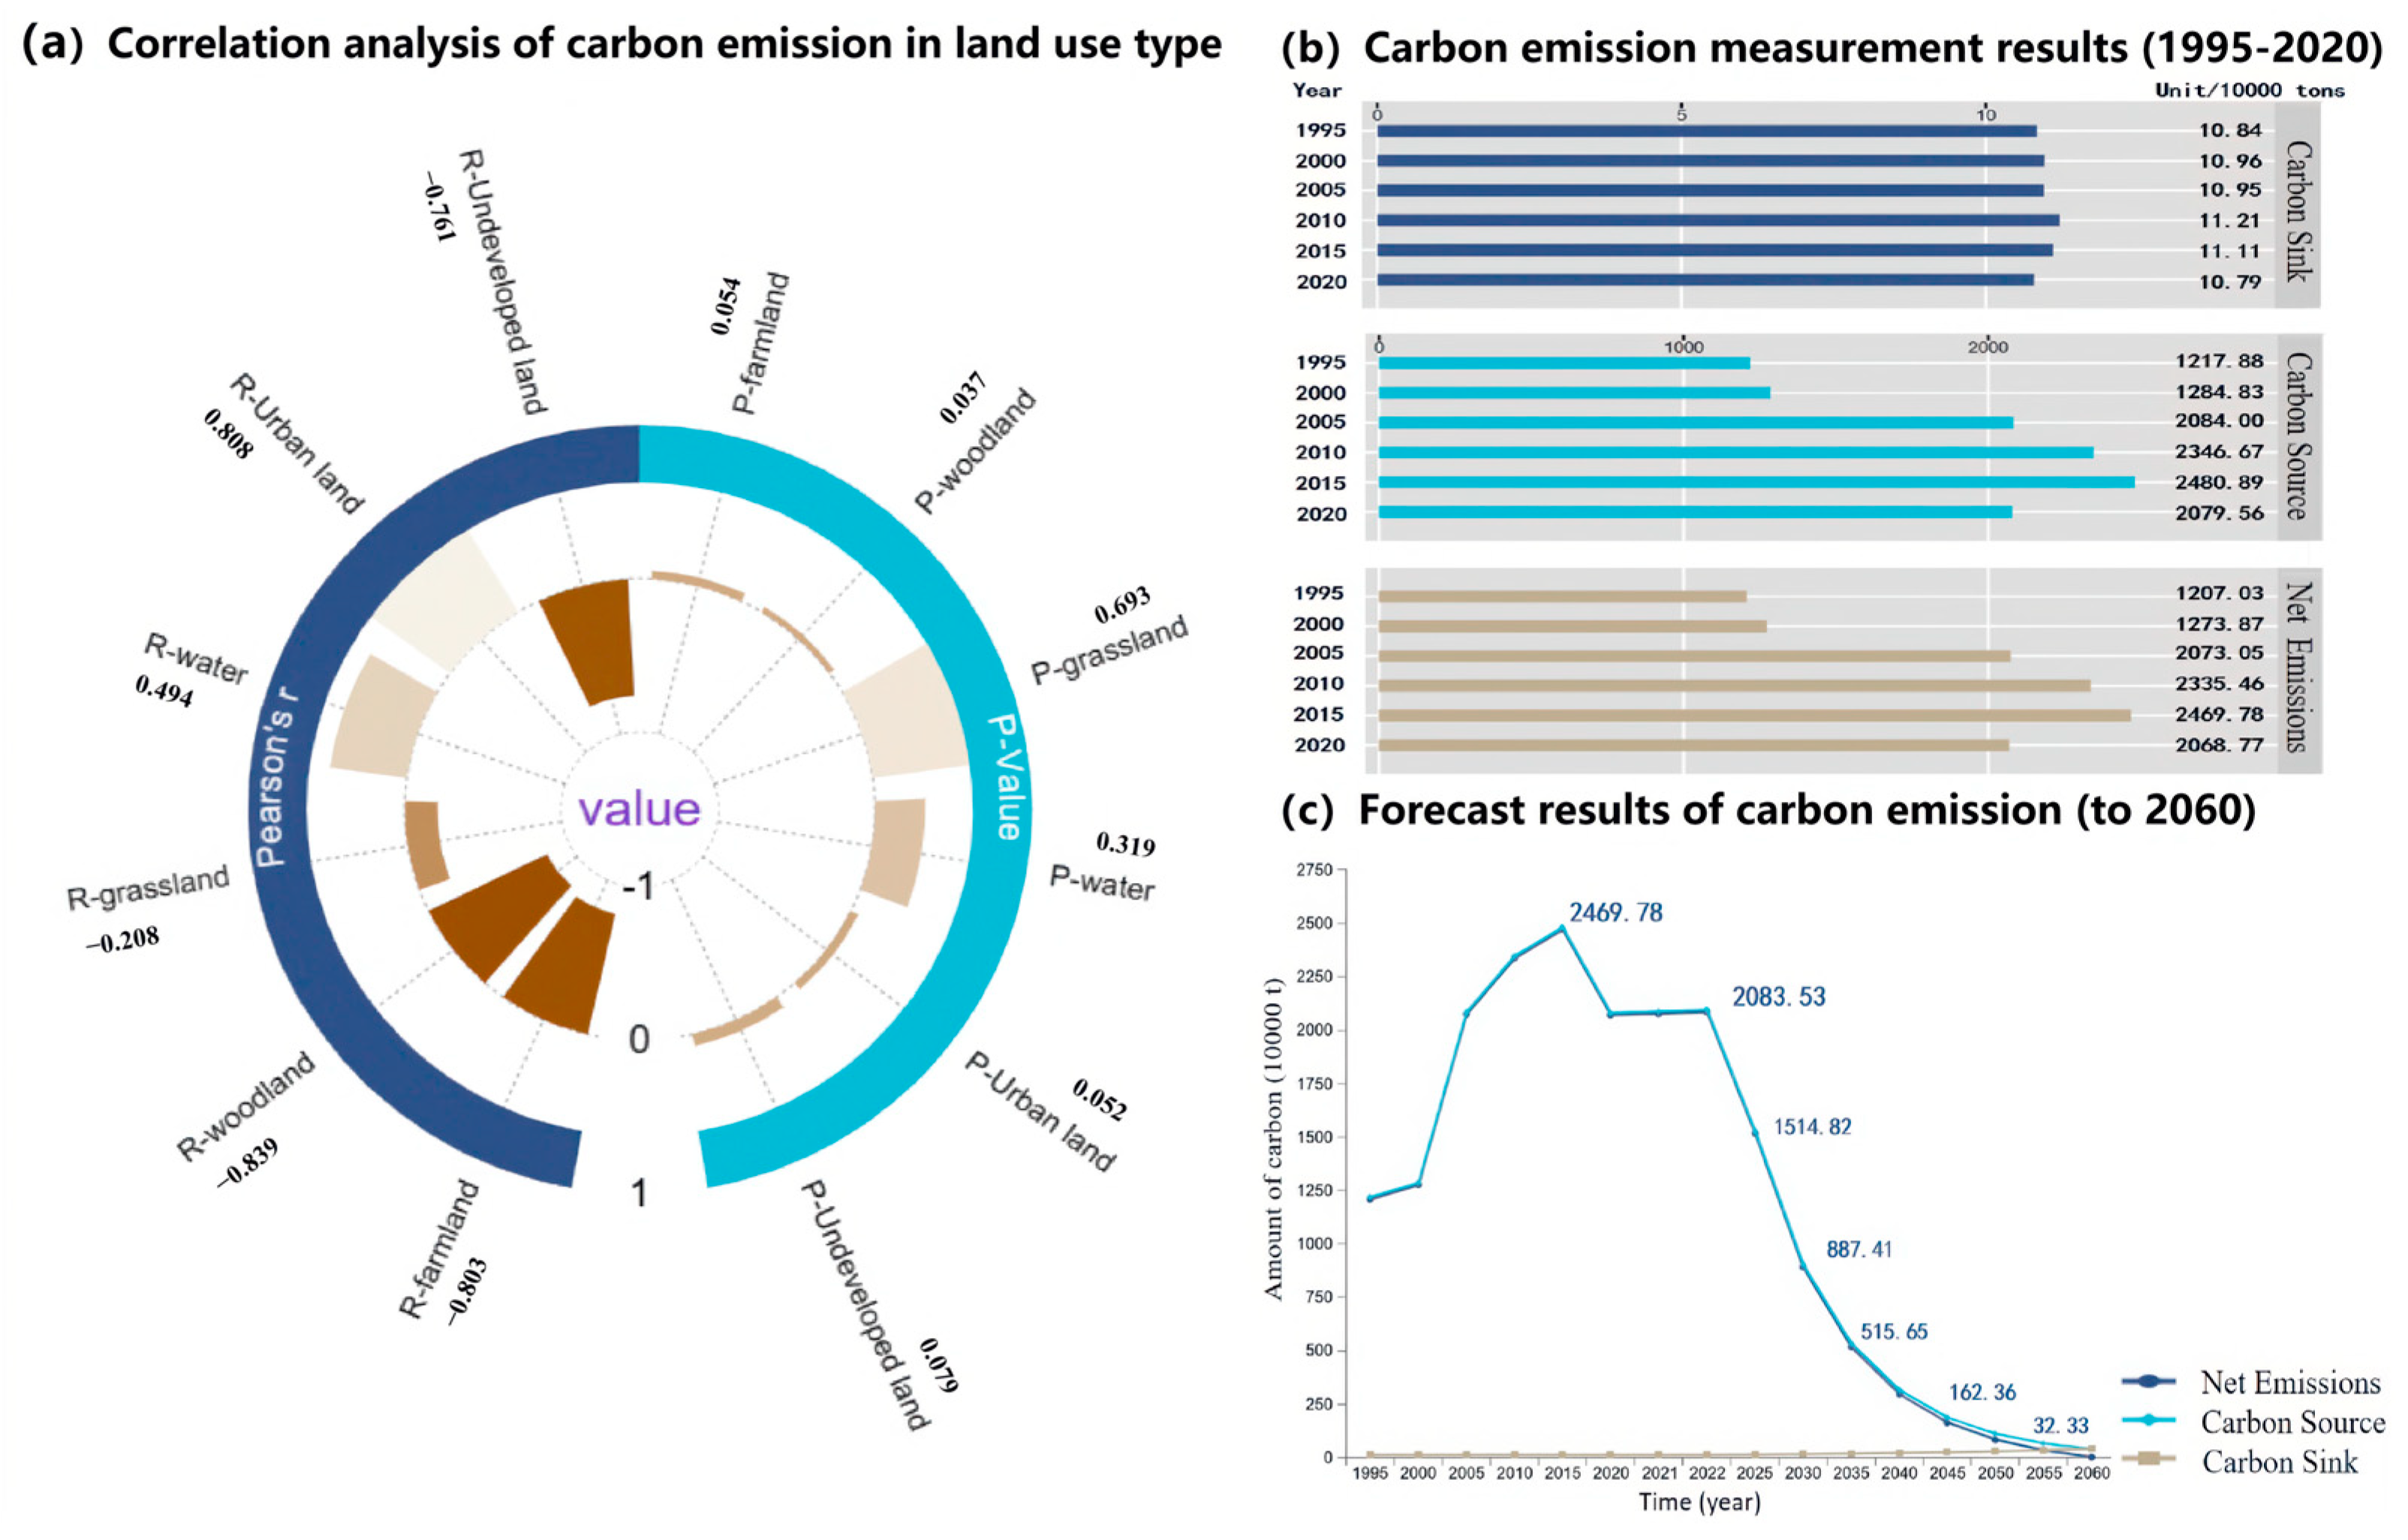
4.1. Carbon Emission Calculation and Forecast Results of Wuhan City

This paper presents an estimation of total carbon sources, carbon sinks, and net carbon emissions associated with six types of land use, based on statistical data regarding land use changes from 1995 to 2020. Figure 6b indicates that in 1995, the net carbon emissions in Wuhan City exceeded 12.07 million tons. The emissions then showed a trend of first increasing and then decreasing. Specifically, the emissions rose to 24.70 million tons in 2015 and then decreased to 20.69 million tons by 2020. This could be associated with the impact of the COVID-19 pandemic, which emerged at the end of 2019 and led to a halt in production activities in the following year. Figure 6a is the correlation analysis of changes in land area and carbon emissions. It indicates that the correlation coefficients (Pearson’r) for cultivated land, forest land, and construction land exceed 0.8. This indicates that the changes in these three types of land use have a stronger correlation with the changes in carbon emissions in Wuhan City. To achieve low-carbon development in Wuhan, it is essential to focus on the adjustment of these three land types. The order of the p-values is forest land (0.037), construction land (0.052), and farmland (0.054), with the smallest p-value corresponding to forest land and the largest to cultivated land. It is evident that forest land and construction land serve as the largest carbon sinks and carbon sources, respectively. Based on the aforementioned conclusions, adjustments and optimizations to the land use structure will be focused on achieving the goal of carbon neutrality for Wuhan City.
Assuming that Wuhan will reach its carbon peak in 2022 and achieve carbon neutrality by 2060, future carbon emissions are forecasted. The prediction steps are as follows: (1) Calculate the carbon sources, carbon sinks, and net carbon emissions for the year of carbon peak in 2022, based on the annual average change rate from historical years (Figure 6c). (2) By determining the annual average emission reduction rate of 10%, the carbon emission values for Wuhan from 2022 to 2060 are predicted. Figure 6c shows that Wuhan’s carbon emissions can be reduced to 382,200 tons by 2060. To achieve carbon neutrality, the carbon sink must increase by the same amount. At this point, the net carbon emissions would be zero. Therefore, the average annual growth rate of the carbon sink should remain at 3.36%. The calculation results mentioned above will be utilized to finalize the establishment of subsequent urban development scenarios.

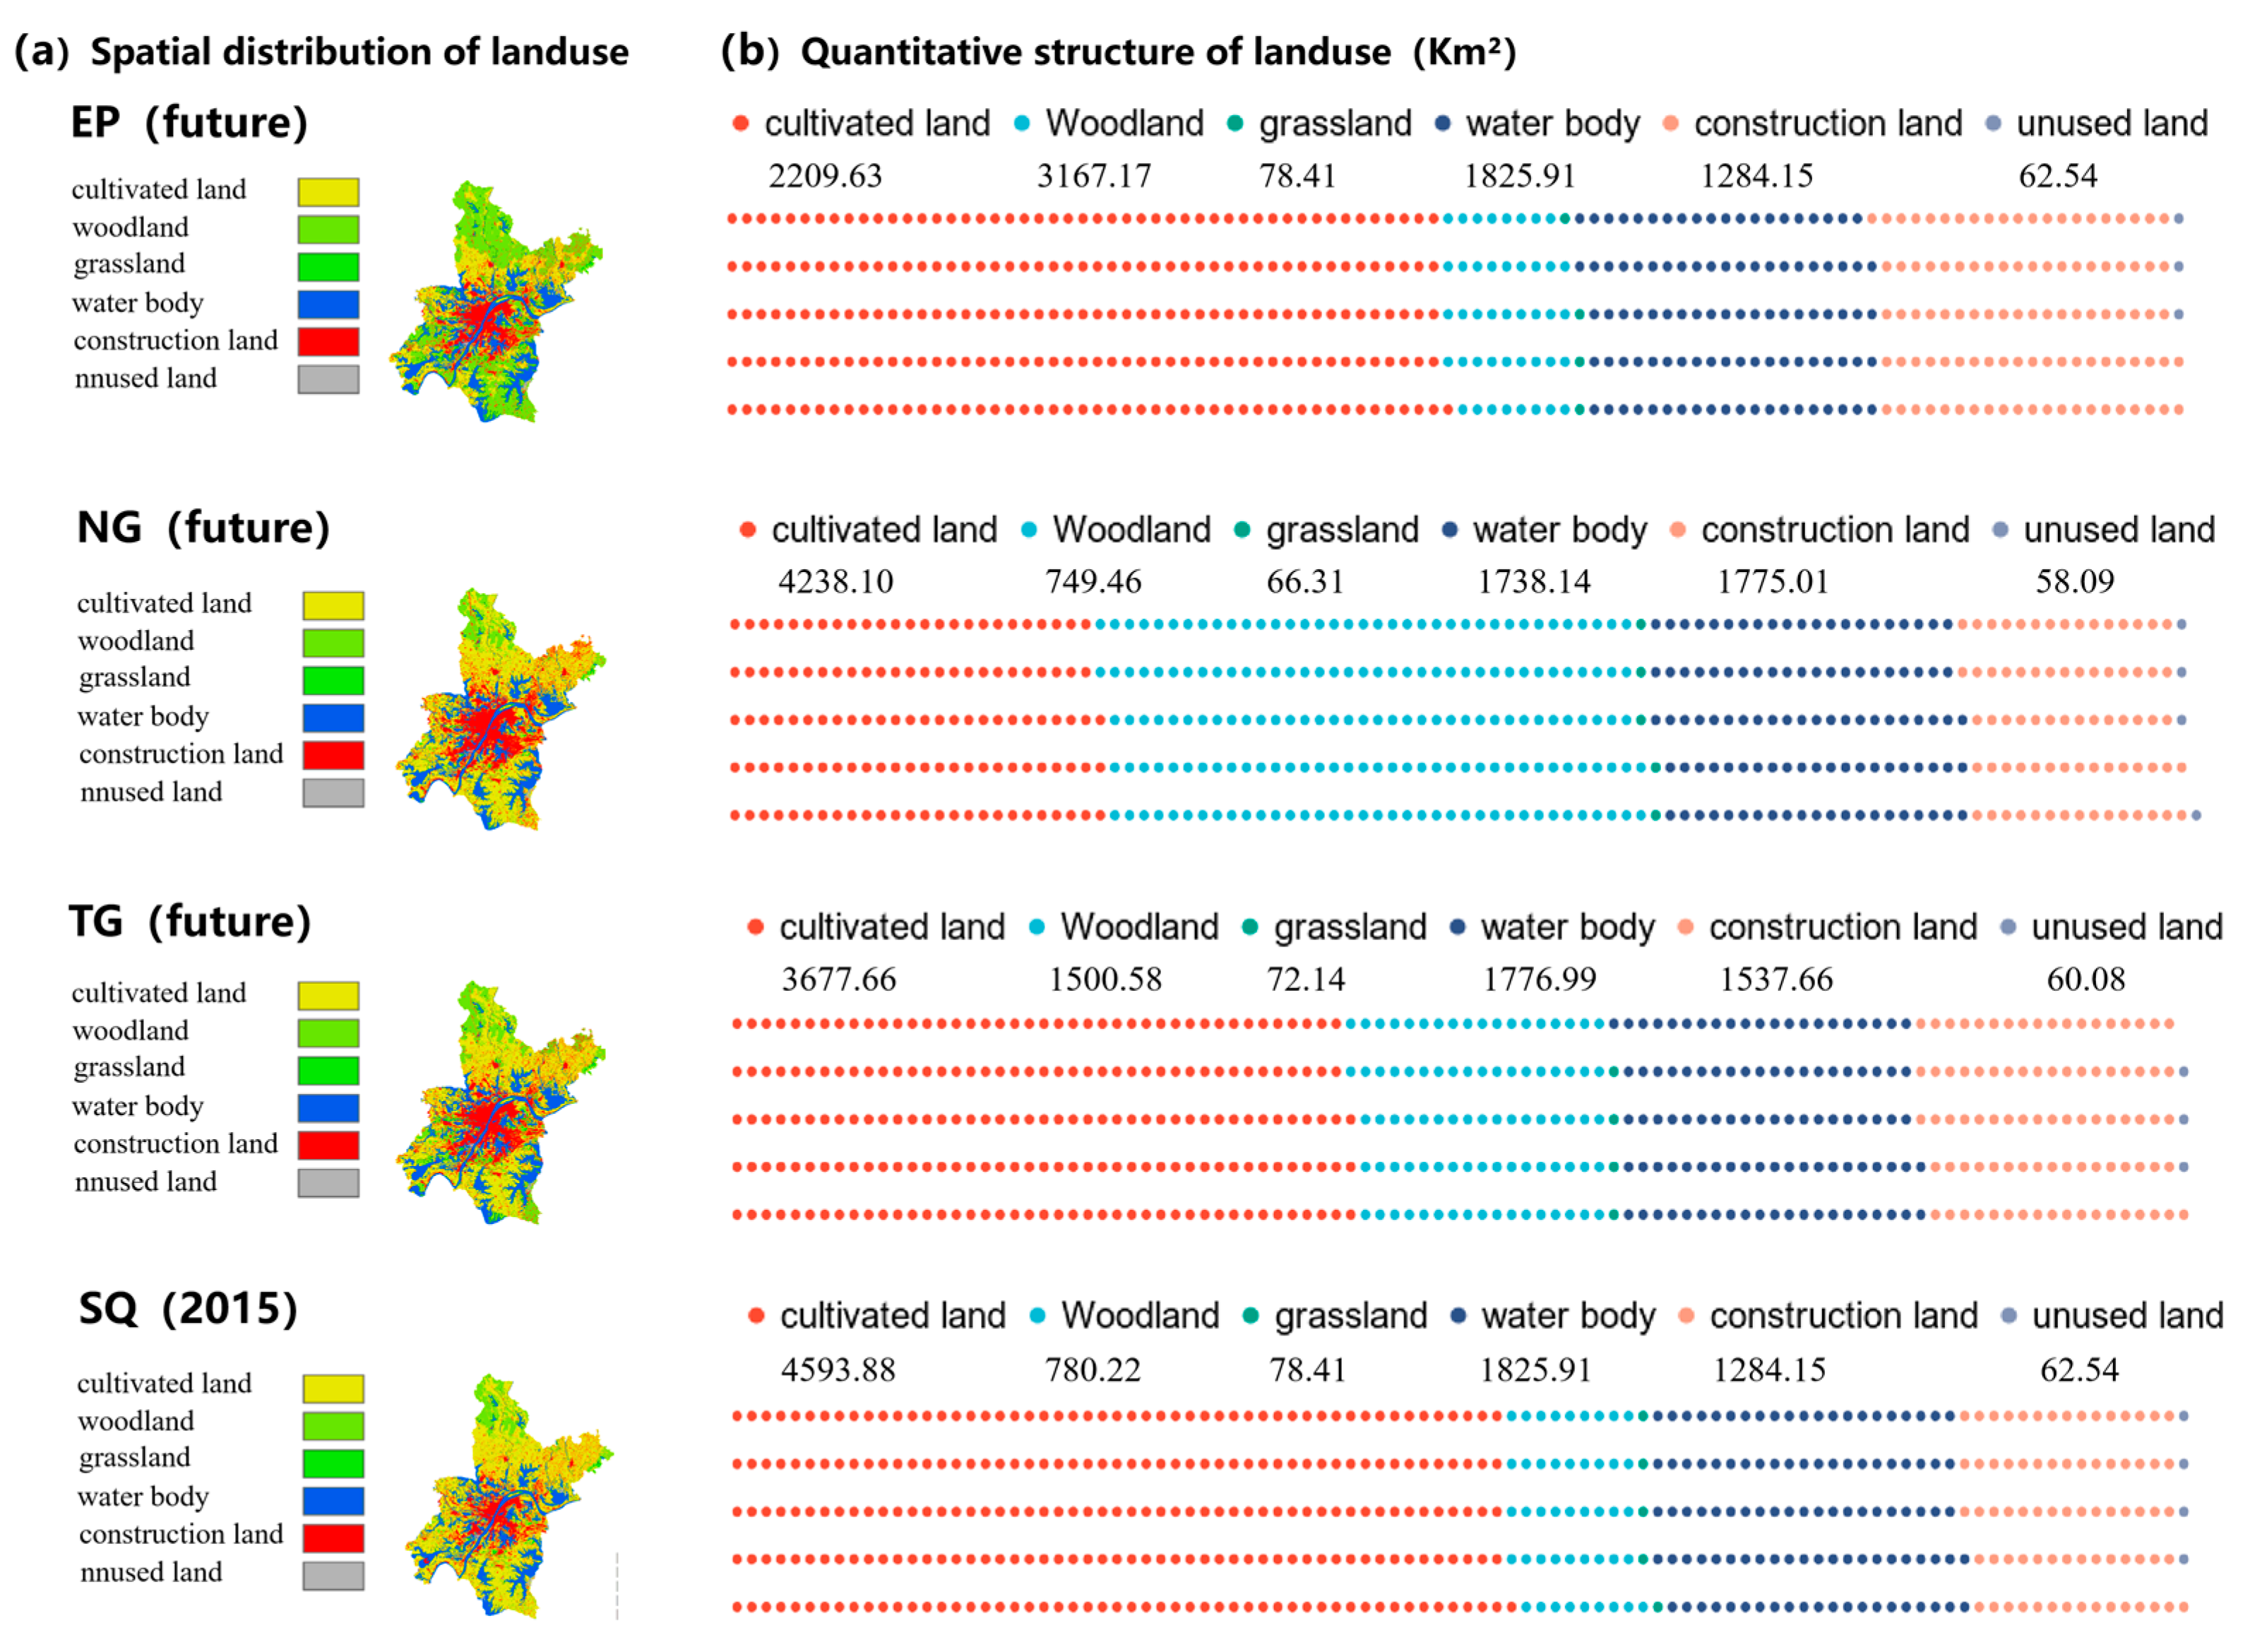
4.2. Prediction of Land Use Evolution in Wuhan City

In the Ecological Priority scenario (EP), the area designated for construction land in Wuhan remains unchanged. The carbon sink is projected to increase to 382,200 tons through the expansion of forested land. Other land use types will not experience significant conversion. The results show that, in comparison with the EP scenario in 2015, the area of forest land will expand to 3167.17 km2. The increase primarily comes from large areas of arable land on the northwest and southeast boundaries of Wuhan. The area of cultivated land decreases from 4593.88 km2 to 2209.63 km2. The area of other land remains unchanged. By 2060, the small woodlands surrounding the main urban area of Wuhan will be interconnected, particularly in the western and eastern regions. Under the EP scenario, forest land will become the most important type of land use structure in Wuhan city (Figure 7a).
In the Natural Growth scenario (NG), the projected growth of construction land in Wuhan is based on an annual growth rate of 4%. However, this rate is expected to gradually decline over time, reaching zero by 2035. The results indicate that construction land will increase to 1775.01 km2, while other land types will experience a decline. Compared to 2015, construction land will surpass water bodies to become the second largest type of land use in terms of area within Wuhan City’s land use structure. The primary sources of construction land growth include cultivated land, water bodies, and forested areas. Among them, cultivated land and water bodies account for 72.5% and 17.8% of the construction land sources, respectively. This indicates that under the NG scenario where there are no restrictions on the sources of construction land, there is a significant conflict between the expansion of Wuhan’s main urban areas and the use of arable land and water areas. In the western region of the Yangtze River, construction land is exhibiting a trend of extended development. Conversely, in the eastern region, construction land begins to connect in a fragmented manner. Overall, the development pattern of the Wuhan urban area can be described as a pie-shaped expansion (Figure 7b).
In the Tight Growth scenario (TG), the growth of construction land in Wuhan is projected to be 4% annually from 2010 to 2015, followed by a gradual decline in growth rates until reaching a zero increment by 2030. Simultaneously, the carbon sink can be enhanced by increasing the area of forest land. The results indicate a reduction in cultivated land to 3677.66 km2, while forest land expands to 1500.58 km2. The area of construction land increases to 1537.66 km2, and the remaining land area shows minimal change. The construction land area primarily expands in the southeast and west. The area of forest growth is basically consistent with the EP scenario and still mainly appears in the western and eastern parts of the main urban area. The main source of growth for two types of land is cultivated land.
In the three scenarios, the land types with the greatest potential for future conversion are forest land, construction land, and cultivated land. The most significant expansion of woodland occurred in the EP and TG scenarios, particularly in the northwest and southeast corners of Wuhan, as well as in the southwest and east of the main urban area. The expansion of construction land is primarily concentrated in the southeast and west. The southeastward expansion is largely due to the concentration of transportation infrastructure in this region, which facilitates land development. The westward expansion of construction land in the main urban area is supported by the fact that the land in question had already been connected before the growth began. This creates a strong construction inertia that promotes the outward spread of construction land. In all three scenarios, cultivated land is diminished, providing a source of land for the expansion of forest and construction areas.

4.3. Analysis of Thermal Environment Change in Land Expansion Scenario in Wuhan

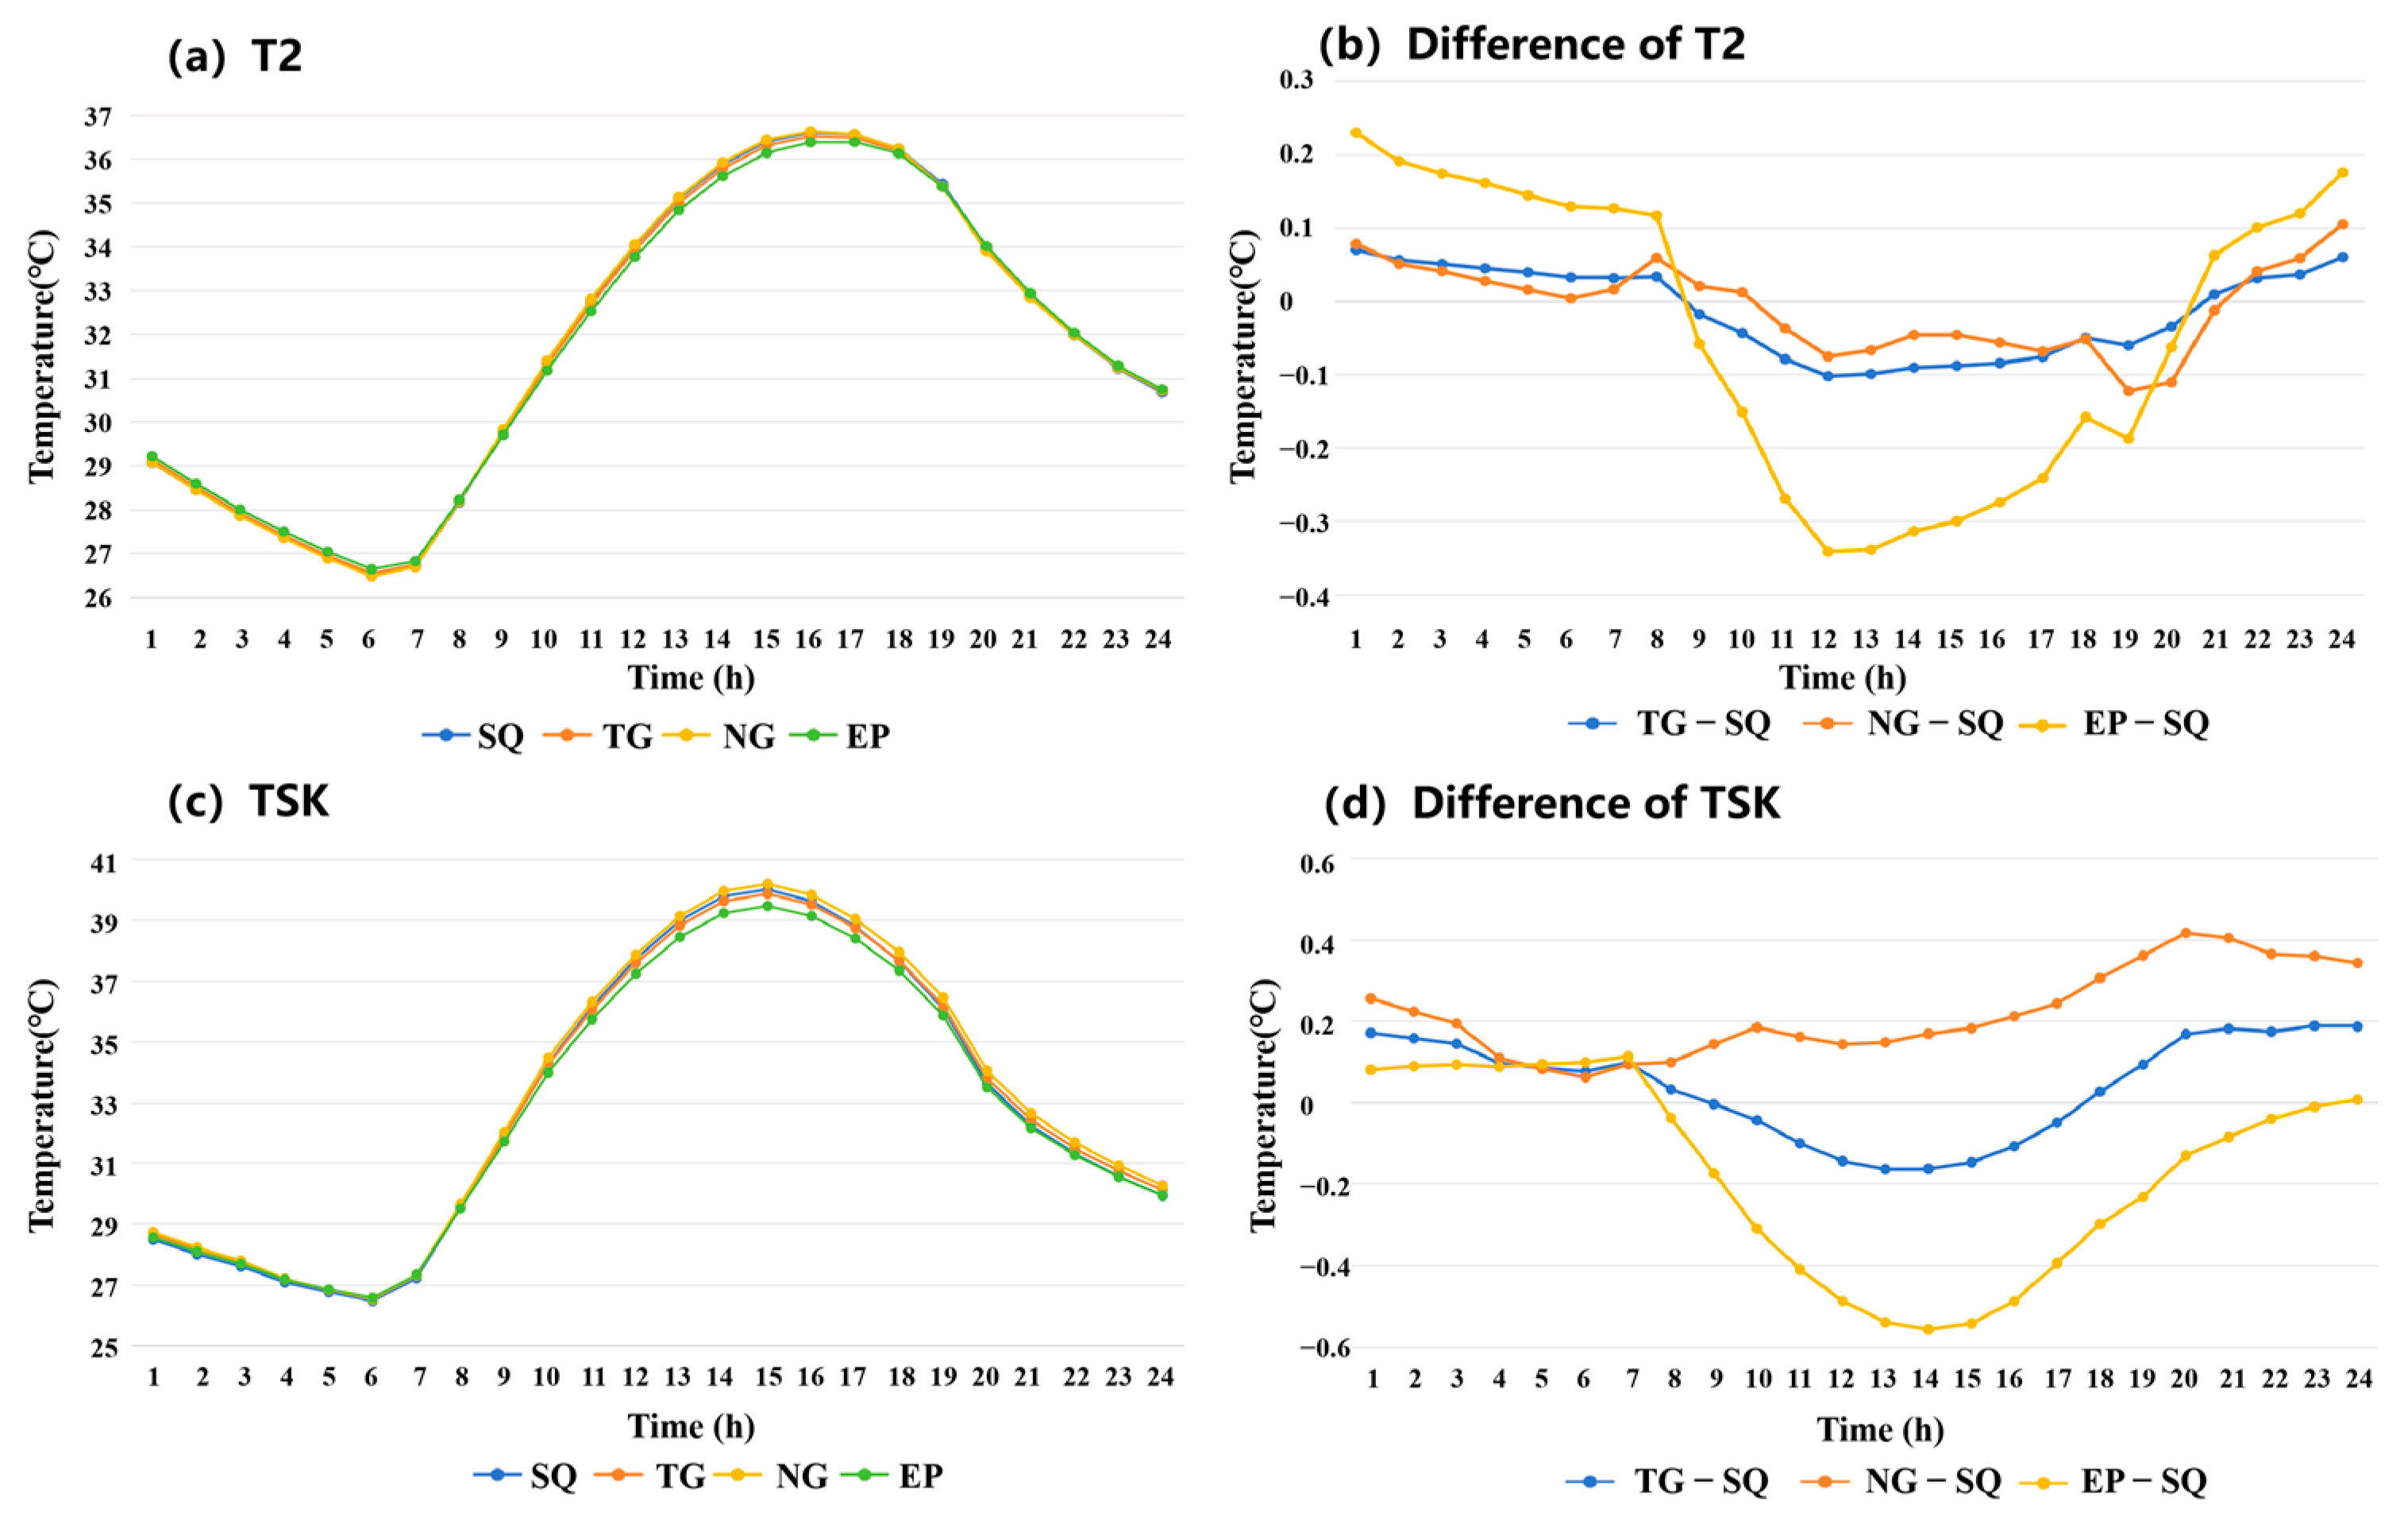
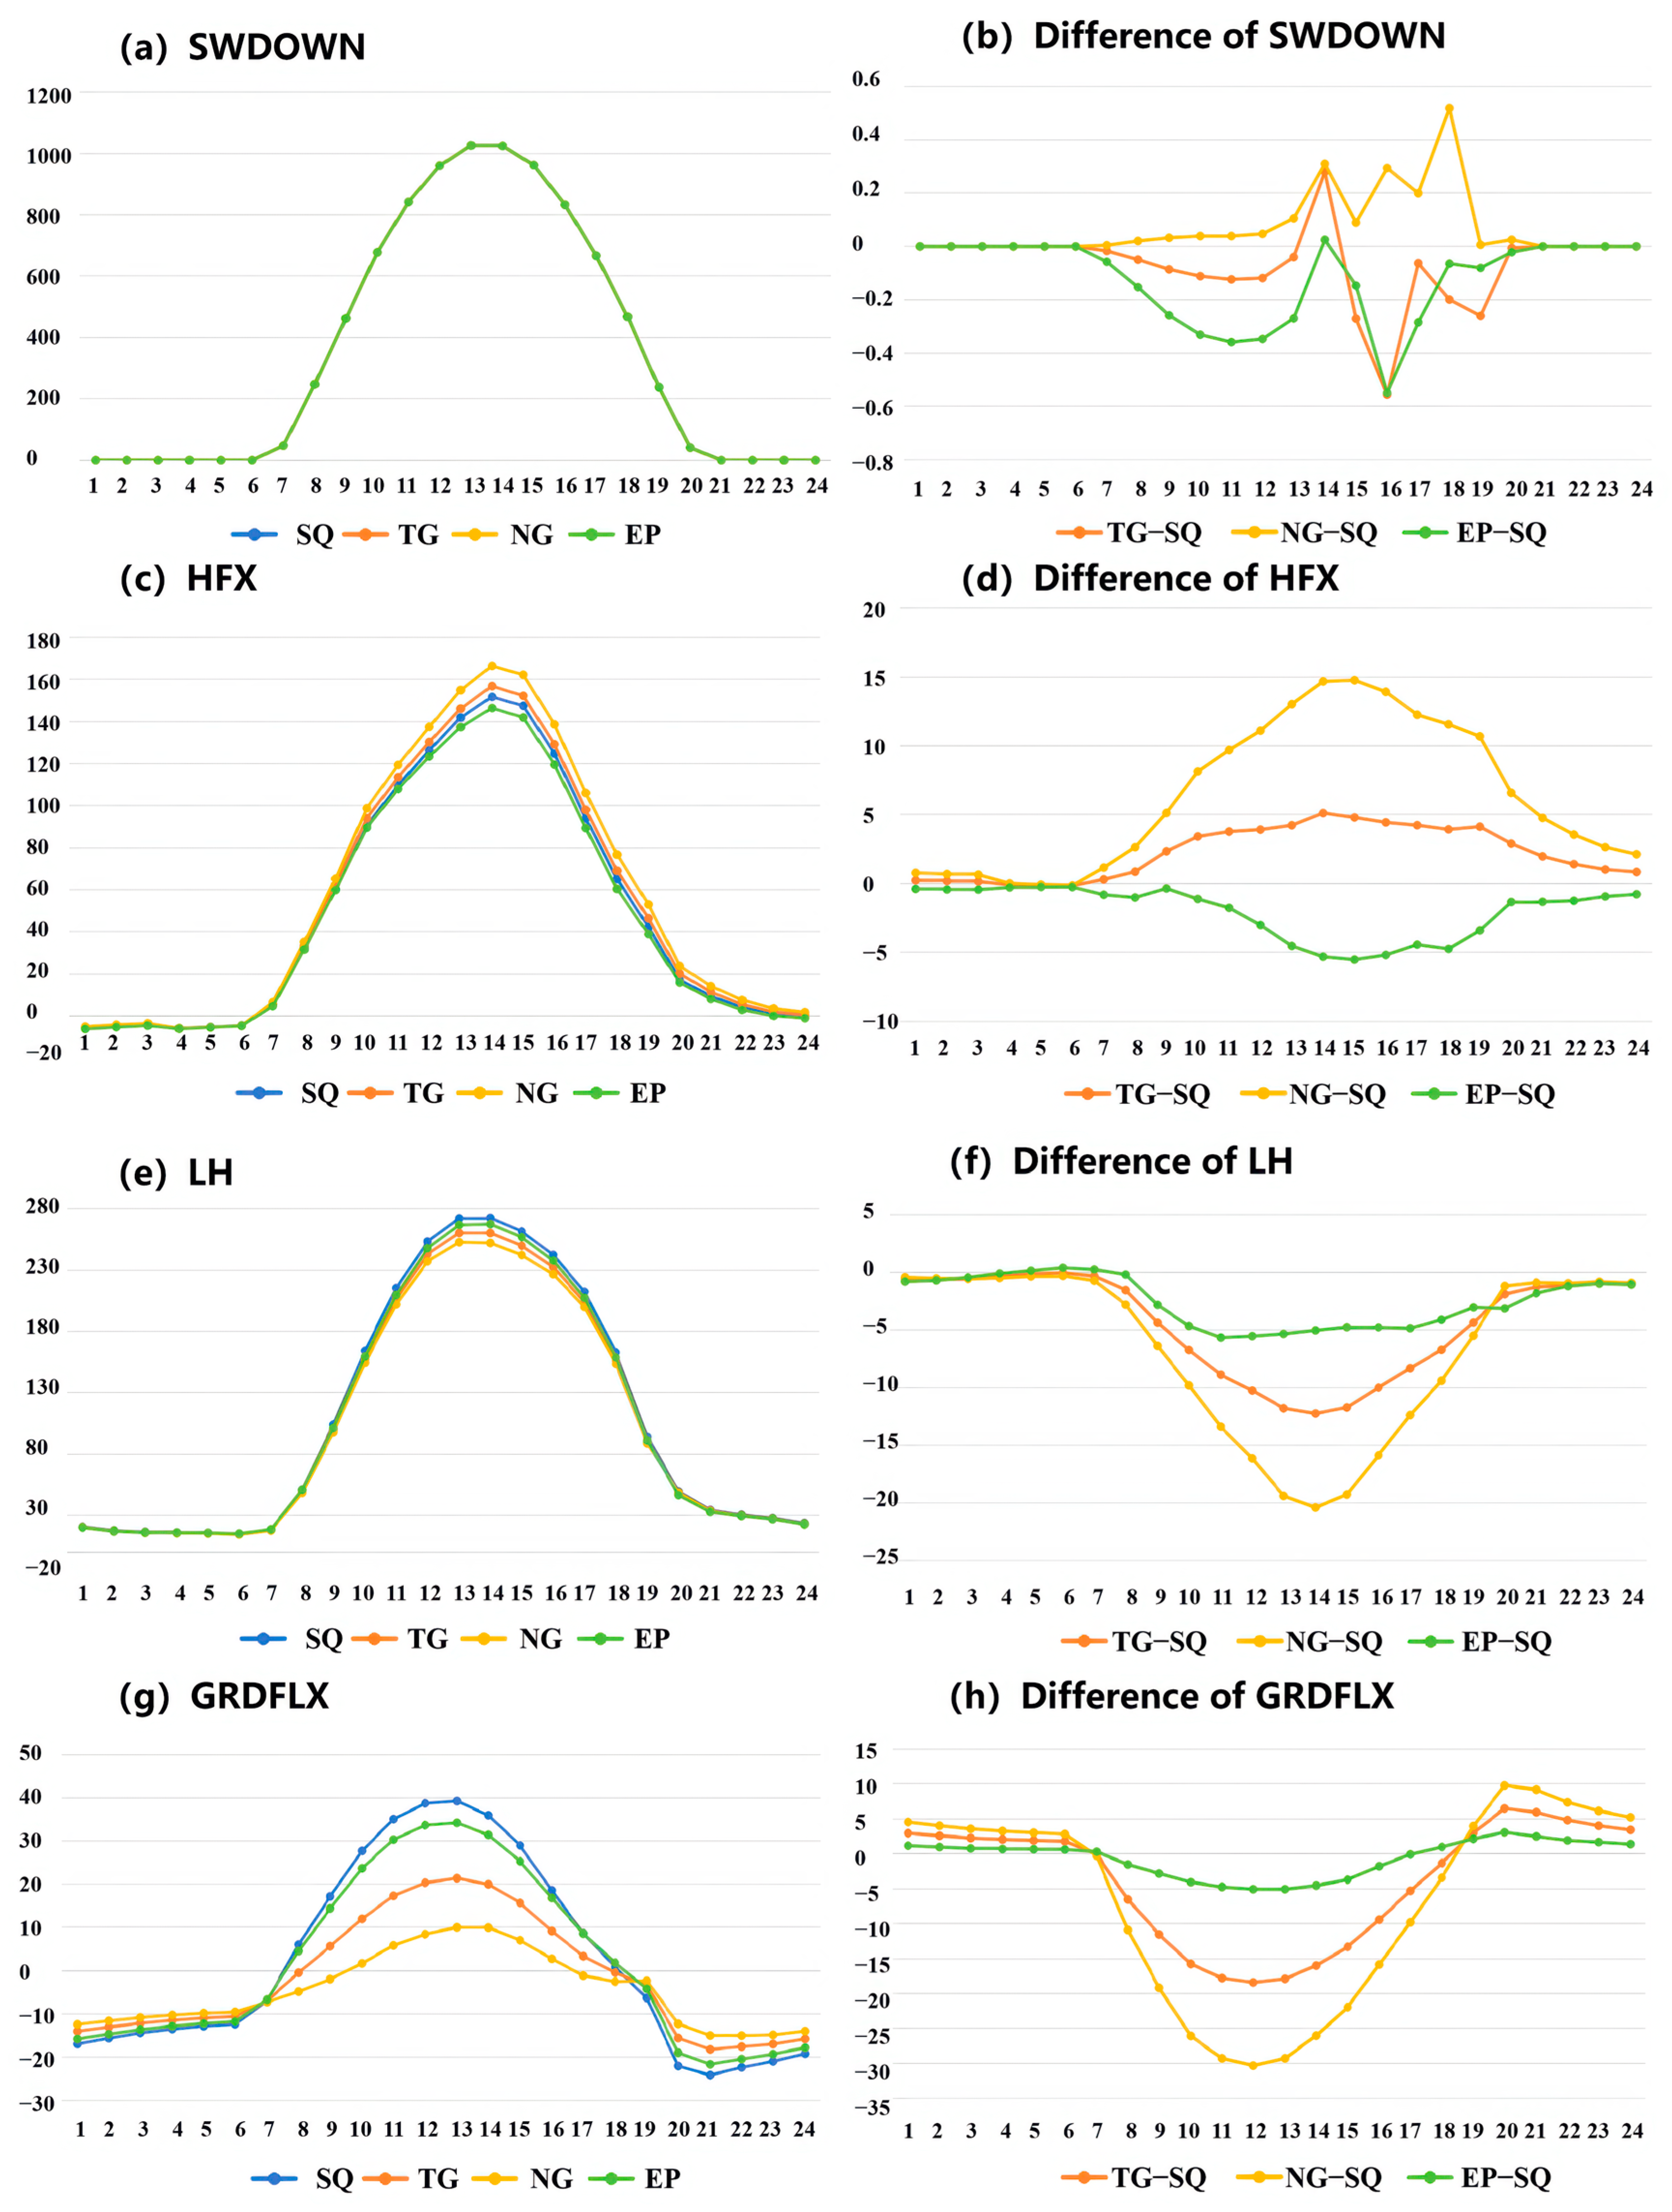
4.3.1. Temperature Curve Analysis

This paper calculates the average values of air and surface temperatures over a single day during the simulation period and presents the temperature curve for the entire day (Figure 8a,c). The results demonstrate that the temperature trends for the four cases are largely consistent throughout the day. Beginning at 00:00, the average air temperature (T2) and average surface temperature (TSK) for each case exhibit a downward trend, reaching a minimum at around 06:00. Subsequently, the temperatures for each case show an upward trend, peaking at around 16:00. At this point, the temperature order is NG > SQ > TG > EP. Following this peak, the temperatures for each case gradually decline. To quantify the specific impact of each development scenario on the thermal environment, the T2 and TSK values for cases TG, NG, and EP are compared with those of the current case SQ to derive the temperature difference curve (Figure 8b,d).
The T2 temperature difference curve illustrates that the air temperatures in the three cases are consistently lower than those of the SQ between 9:00 and 20:00. Among these, the temperature difference for the (EP-SQ) is the most significant, reaching up to 0.3 °C. The (NG-SQ) shows the smallest temperature difference. During the remaining period, temperatures are higher than those observed in this case, with the (EP-SQ) exhibiting the highest temperature, reaching a difference of up to 0.2 °C. In the latter half of the night, the temperature difference in the (NG-SQ) exceeds that of the (TG-SQ). However, in the early morning, the (TG-SQ) shows a greater temperature difference than the (NG-SQ). The temperature difference curve for TSK indicates that the surface temperature of the NG case is higher than that of the SQ case throughout the day, a phenomenon that is exclusively observed in the (EP-SQ) before 8:00. After 8:00, the temperature difference initially increases, followed by a subsequent decline, peaking at approximately 0.6 °C at 14:00. The temperature difference in the TG case is lower than that of the SQ case between 9:00 and 18:00, but higher than it at other times.

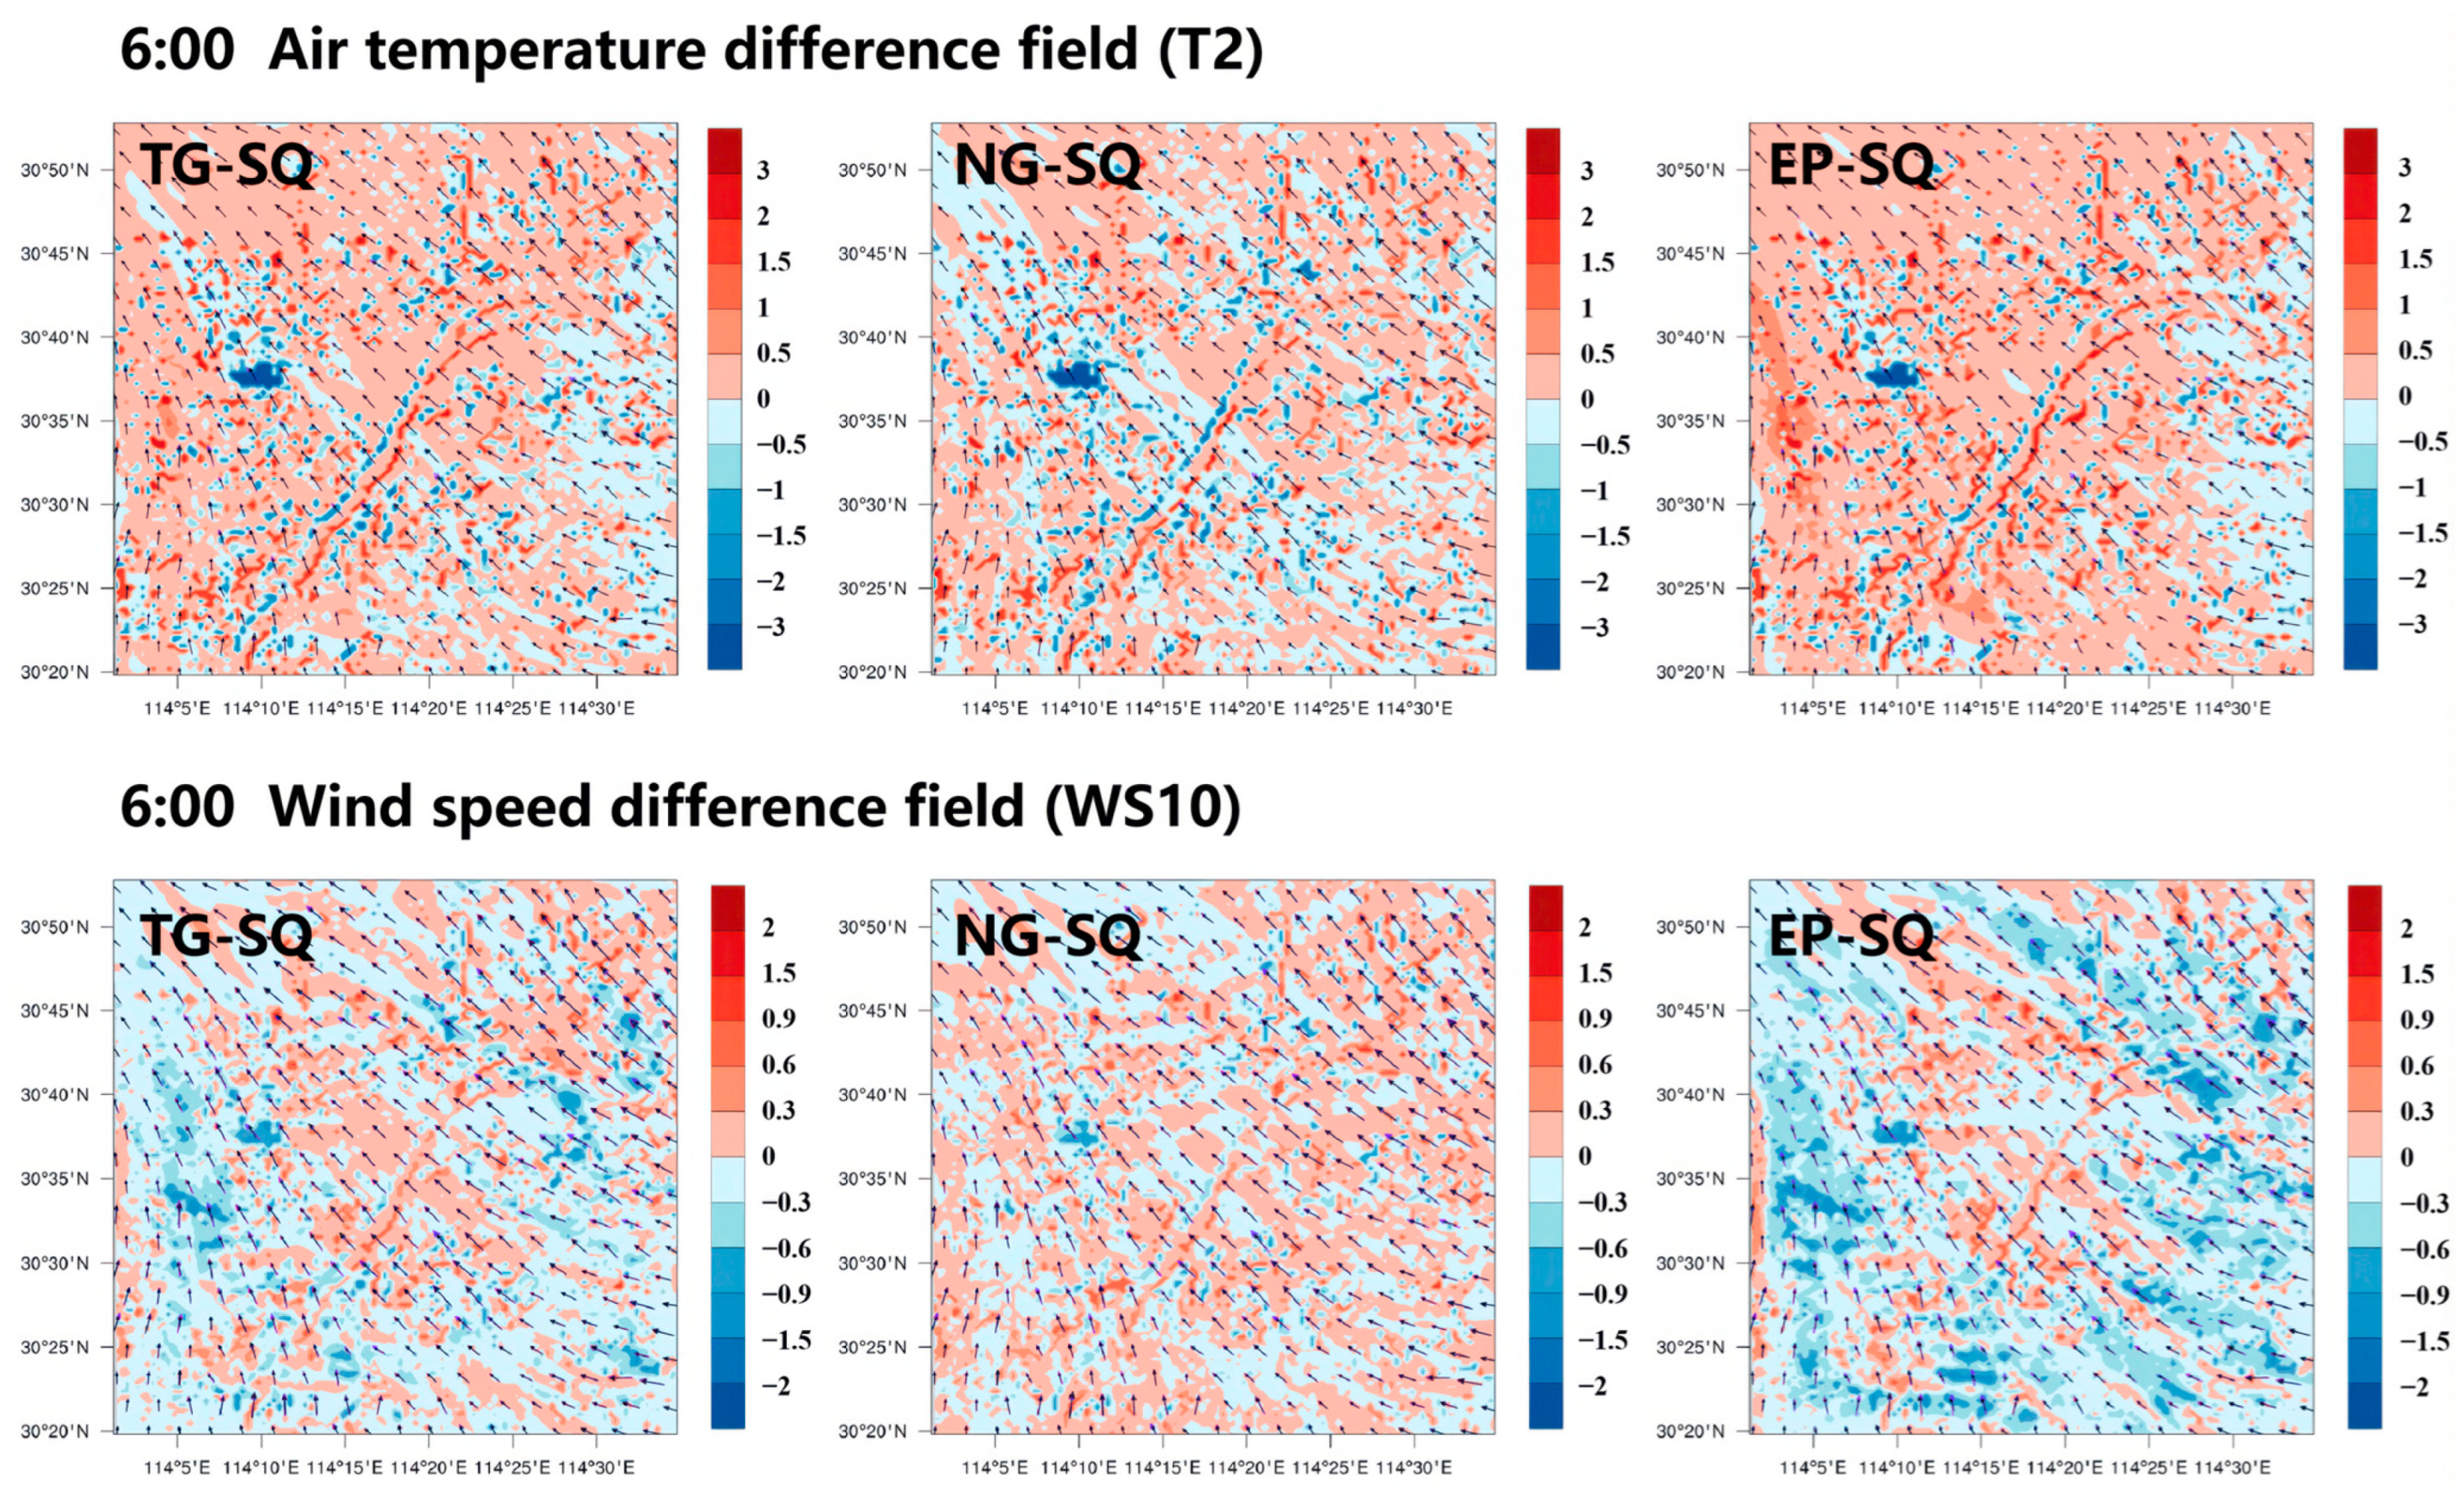
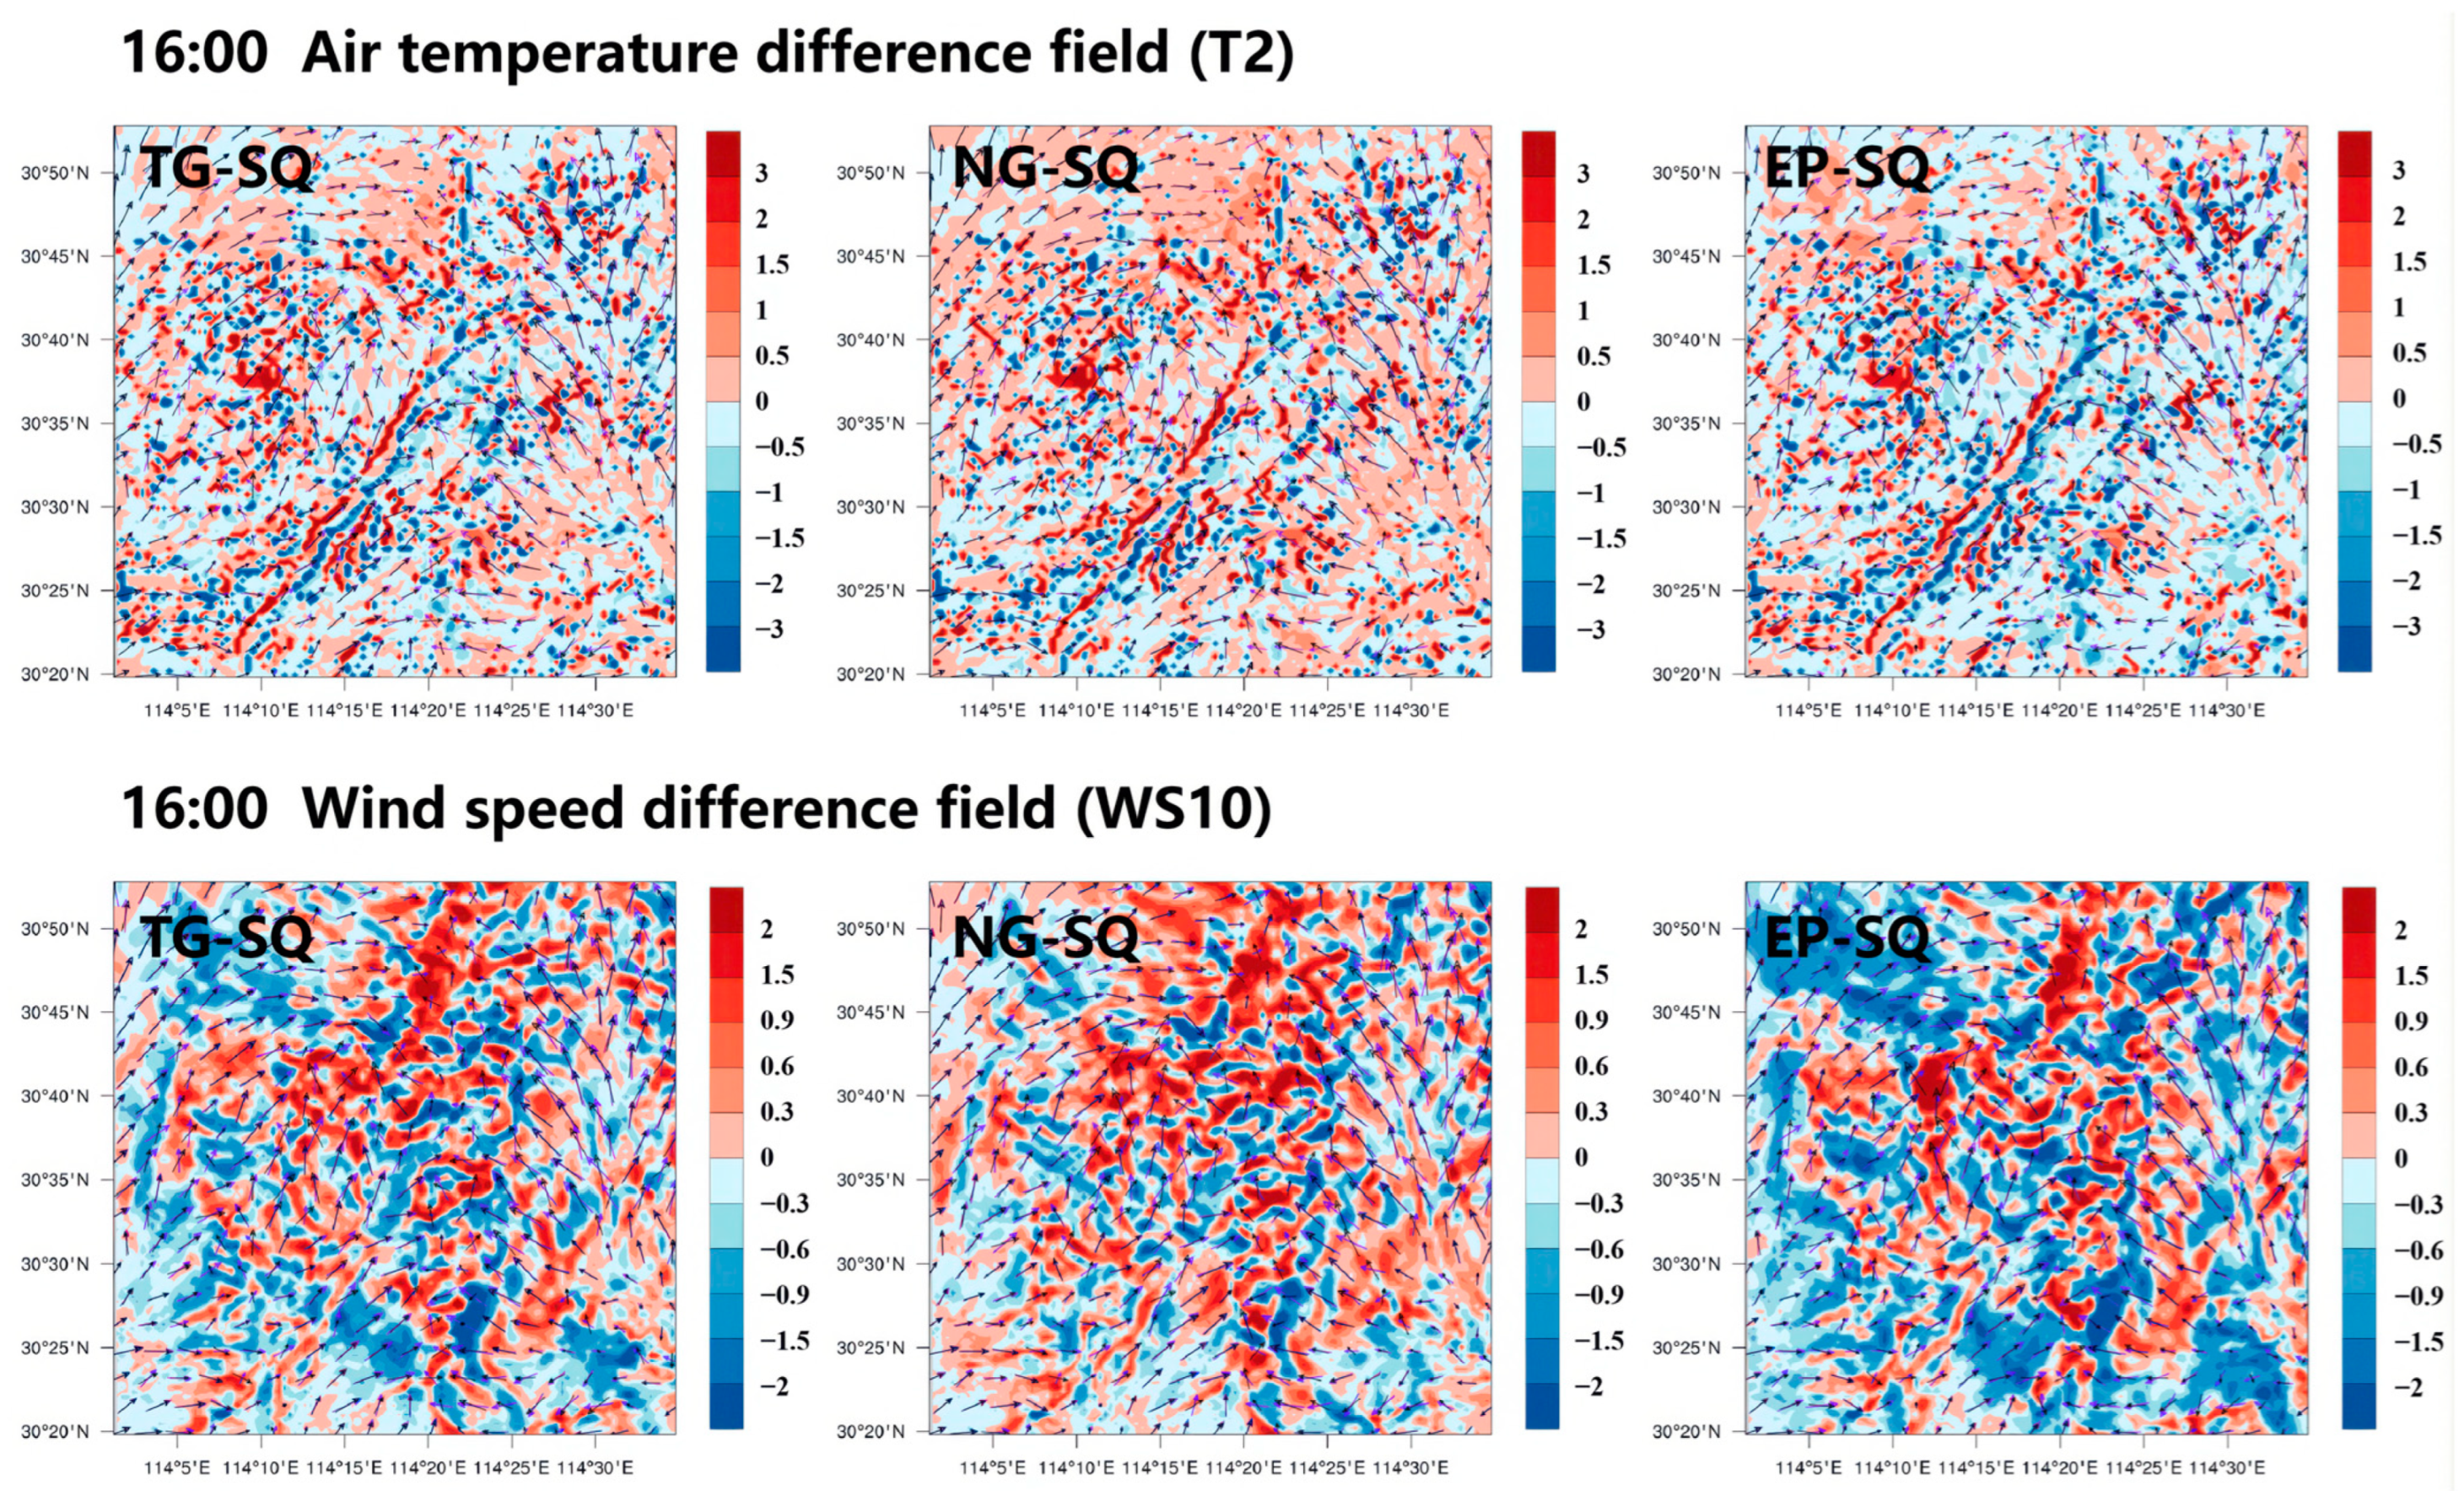
4.3.2. Analysis of Temperature and Difference Field

This paper analyzes the temperature difference field and wind speed difference field at two peak times (06:00 and 16:00). The differences among three future cases (TG, NG, EP) and the status quo (SQ) are examined (Figure 9 and Figure 10). At 06:00, the temperature difference field for the three future cases shows that the area with positive temperature differences is larger than the one with negative temperature differences. The maximum temperature difference can reach 3 °C, indicating a patchy distribution. The (NG-SQ) exhibits the smallest area of positive temperature differences, while the (EP-SQ) shows the largest. This suggests that the land use configurations of the three future cases will lead to a temperature increase in most areas at this time. The northwest region, located downwind of the temperature difference field, is almost entirely encompassed by the area of positive temperature differences, while the upwind region displays a relatively more negative temperature difference. This indicates that, at this time, a significant amount of heat is being transported from the southeast to the northwest due to the influence of a southeasterly wind direction. In the wind difference field, the (NG-SQ) shows the greatest coverage within the positive difference field, whereas the (TG-SQ) and (EP-SQ) are more limited in scope. The distribution of the wind positive difference field primarily extends from the southeast to the northwest, which aligns closely with the prevailing wind direction. It can be observed that the NG case results in an increase in urban wind speed at this time. Conversely, the TG and EP cases lead to an increase in wind speed within the central region, accompanied by a decrease in wind speed in the peripheral areas.
At 16:00, a significant number of scattered temperature difference spots emerge across the three cases. The temperature difference in these spots typically exceeds 2 °C. At this time, the area of negative temperature difference in the (EP-SQ) is considerably larger than the area of positive temperature difference. In contrast, the difference field of the (NG-SQ) indicates that the area of positive temperature difference is considerably larger than that of negative temperature difference. The positive and negative temperature difference areas in the (TG-SQ) are essentially comparable. This indicates that the EP case results in a significant decrease in the temperature at this time, optimizing the thermal environment. Conversely, the NG case leads to a notable increase in temperature. Compared to the NG case, the TG case exhibits a discernible regulatory effect on the thermal environment; however, this effect is less pronounced than that of the EP. In the field of wind difference, it is evident that there is no clear urban wind direction. The regions of positive and negative wind speed differences are cross-distributed, which aligns with the temperature difference regions. For instance, there is a greater prevalence of areas with positive wind speed differences that have a high probability of occurrence in locations where the temperature exceeds that of the SQ. This suggests that an increase in temperature activates air molecules within the region and subsequently leads to an increase in wind speed.

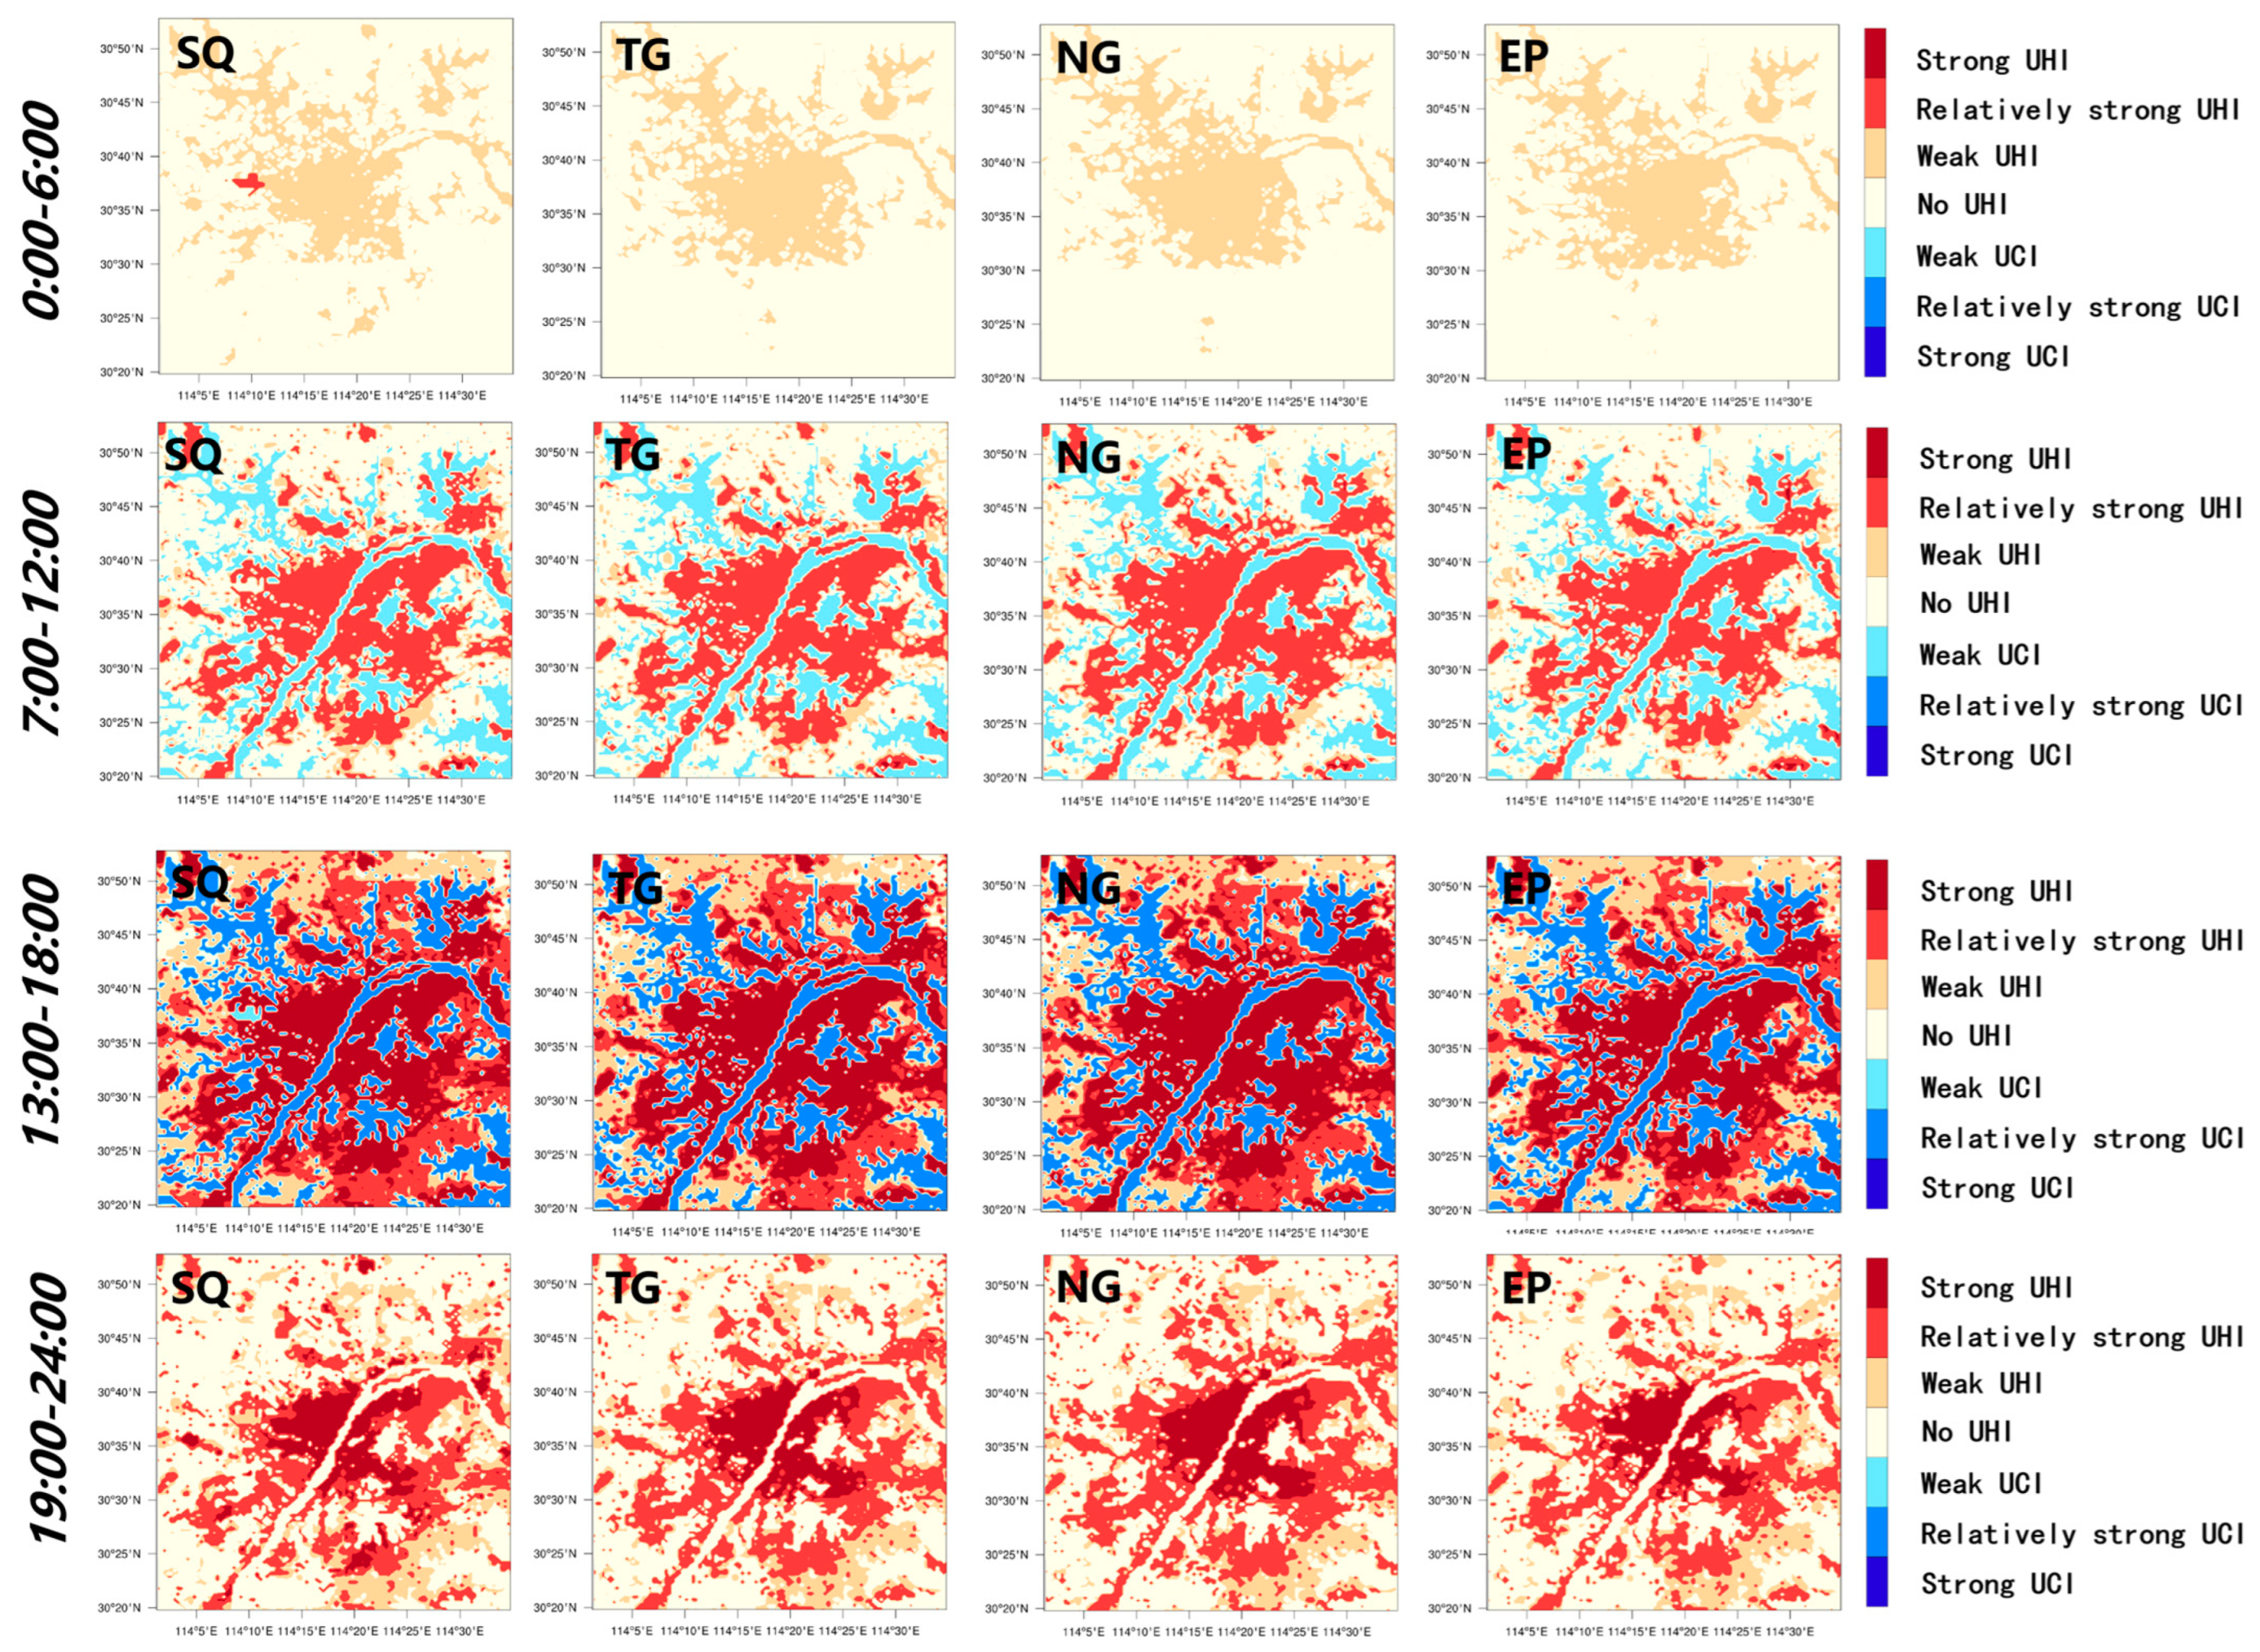
4.3.3. Analysis of Urban Heat Island Intensity

The difference in land surface temperature (LST) between the simulation area and the reference point in the outskirts is analyzed, and the intensity distribution map of each heat island case at different times of the day is presented (Figure 11). The results indicate that the city experiences a weak heat island effect during the early morning hours (00:00–06:00). In the morning (07:00–12:00), the heat island phenomenon within the built-up area begins to emerge, primarily manifesting as a strong heat island effect. In the afternoon (13:00–18:00), the urban built-up area predominantly exhibits a strong heat island effect, with the surrounding areas also exhibiting this phenomenon. At night (19:00–24:00), the urban heat island effect persists; however, the distribution of heat islands reveals a distinct circular structure compared to the afternoon. The central area is characterized as a strong heat island, while the majority of the peripheral areas are relatively strong heat islands.
The Urban Heat Island Proportion Index (UHPI) and the Strong Urban Heat Island Proportion Index (SUHPI) for each case are presented in Table 5. The results indicate that the UHPI for SQ case increases from 20.77% in the early morning to 68.17% in the afternoon. During the afternoon, the SUHI reaches 29.16%, which suggests that the extent of the urban heat island phenomenon is expanding, with 30% of the area exhibiting a strong heat island effect at noon. At night, the UHPI decreases to 50.54%, while the SUHPI drops to 7.93%. Although the scope and intensity of the heat island phenomenon decline, they remain more pronounced than those observed in the morning. The TG case expands the range of heat islands during both the morning and evening. In the afternoon, the extent of the heat island is reduced by 0.88%. Conversely, the NG results in a significant expansion of the heat island throughout the entire day. The differences in the morning and night in UHPI are as high as 4%, and this difference is considerably greater than in other cases. Additionally, the differences in the morning and night in SUHPI indicate that the range of intense heat islands expands by 4.25%. In the EP case, the heat island effect is enhanced in the early morning but inhibited during the remaining hours. In particular, it shows a reduction of 2.48% in the afternoon. Thus, the EP case has the most pronounced effect on optimizing the thermal environment, while the NG case has the least impact. In comparison to the NG case, the TG case also exerts a notable influence on the regulation of the urban thermal environment.

5. Discussion

5.1. Reasons for Thermal Environment Difference in Urban Scenarios

The preceding results indicate that the EP case has a beneficial influence on the thermal environment following sunrise, particularly during sunshine. The NG case can lead to a deterioration of the thermal environment throughout the day. Compared to the NG case, the degree of thermal environment deterioration associated with the TG case is significantly reduced. Furthermore, the TG case exerts a regulatory effect in the afternoon. This phenomenon occurs because the underlying surface compositions in different scenarios result in variations in the urban energy environment, which subsequently lead to differences in the urban thermal environment. Following sunrise, the surface receives a substantial amount of net radiation energy. The Earth’s surface achieves its energy balance through various processes, including atmospheric heating, water evaporation, soil heating, and other activities. This process can be represented by formula (3). To further explore the causes of the results, this paper extracts the average values of SWDOWN (Rn), GRDFLX (G), HFX, and LH from the simulation results. Subsequently, the differences in the energy environment across various scenarios are analyzed by plotting the energy average curve and the energy average difference curve for four cases (Figure 12). The SWDOWN curves for the four scenarios overlap, with a difference of less than 0.6 W/m2. The results indicate that the intensity of solar shortwave radiation received by the surface in each scenario is essentially comparable. The differences in the energy environment among the scenarios are manifested in the other three variables.
R n + A n = G + H + L H + Q A
An is the anthropogenic heat (heat generated by human activities), QA is the Thermal Advection (the advection heat entering the urban canopy is equal to the consumed advection heat, so it can be ignored), RN is the shortwave radiation flux (the shortwave radiation flux from the surface down), G is the Surface Flow (the heat flux of heat conduction between the surface and the lower layer), LH is the Latent Heat Flux (the heat exchange per unit area under the condition of constant temperature), HFX is the Sensible Heat Flux (the turbulent heat flux between the surface and the atmosphere).
During the daylight hours (06:00–19:00), the SWDOWN value for all cases begins to rise after sunrise, reaching a peak at 14:00 before starting to decline. It ultimately returns to zero after 19:00. The trends of other variable curves align with this pattern. However, a notable difference exists between the future cases (TG, NG, EP) and the SQ case. The order of values is as follows: for HFX, NG > TG > SQ > EP; for LH, SQ > EP > TG > NG; and for GRDFLX, SQ > EP > TG > NG. Therefore, compared to the SQ case, more energy is expended on heating the atmosphere (the NG case is the most, the EP case is the least) in future cases. Less energy is used to heat the surface (the NG case is the least, the EP case is the most) and for water vapor evaporation (the NG case is the least, the EP case is the most). This provides a compelling explanation for the temperature difference. There are more artificial surfaces composed of asphalt, cement, and other materials in the TG case and NG case. These artificial materials exhibit rapid heat absorption and dissipation, as well as a lower heat capacity compared to the water and grasslands that are more prevalent in the SQ and EP cases. This results in a reduction in energy that is required for surface heating in the TG and NG cases. The evaporation of natural surfaces is greater than that of artificial surfaces (positively correlated with the LH variable). Consequently, the TG and NG cases require less energy for water evaporation. In conclusion, the majority of the energy consumed in the NG and TG cases is used to heat the air. So, the NG case with a higher proportion of artificial surfaces exhibits the highest air temperature. The temperature in the EP case is lower than in other cases. That is the reason why the EP case has a regulation effect on the thermal environment during periods of sunshine.
Following sunset (19:00–6:00), the SWDOWN of each case is 0. The Earth’s surface no longer receives solar radiation but accumulates a certain amount of heat. The order of values is as follows: HFX (NG > TG > SQ > EP), GRDFLX (NG > TG > EP > SQ). The differences in LH are minimal. Compared to the SQ case, the NG and TG cases exhibit a greater capacity for heating the atmosphere, while the EP case exhibits a worse capacity. In the NG, TG, and EP cases, more energy is utilized for heating the soil. The GRDFLX becomes negative at this time, which indicates a shift in the heat transfer process from soil heat absorption to soil heat release. There is little difference in the energy used to evaporate water across each scenario. It can be observed that the energy source of the surface energy balance changes to upward heat release from the soil after sunset. Due to the distinctive physical characteristics of the artificial surfaces, the TG and NG cases release heat energy upwards more rapidly than in the other scenarios, which is then used to warm the air. As a result, the air temperature of the two scenarios is higher. The EP case has a greater proportion of natural surfaces than the SQ case. And these natural surfaces have a higher heat capacity and thermal inertia. Compared to the SQ case, the released energy is more effectively utilized to heat the shallow soil than to release the heated air upwards. So, the air temperature in the EP case is lower than that in the SQ case. The surface temperature is higher than that of the SQ case. This is why the EP case does not play a role in regulating the thermal environment in the non-sunshine period.

5.2. Development Suggestions for Wuhan in Response to Heat Stress

The analysis results indicate that a city can effectively alleviate the urban heat island effect by controlling the growth of construction land and increasing carbon sinks. This is also consistent with previous studies [45,46]. Regarding the management of construction land growth, Yu and Xie demonstrate that the expansion of urban construction land is closely related to the deterioration of the urban thermal environment [47,48]. However, not all urban expansion necessarily leads to a deterioration of the urban thermal environment. Some studies indicate that a decentralized urban layout can effectively mitigate the average urban heat island intensity and result in a reduced heat load in the downtown area [49,50]. Based on these findings, the impact of different urban layout modes on the thermal environment will be investigated in future research. The Natural Growth scenario illustrates that, in the absence of policy constraints on the direction or source of growth, the development of Wuhan is highly likely to exhibit a pie-shaped development model, with a concentration of growth in the southeast and west. This development can exacerbate the phenomenon of urban heat islands. It is recommended that the planning of Wuhan prioritizes the regulation of unrestrained construction land growth in these two directions.
In terms of increasing the carbon sink, the strategy proposed in this paper is to expand green spaces, such as forest land. Zhang and Li indicate that vegetation has an inhibitory effect on land surface temperature warming [51,52]. The simulation results of this paper also demonstrate that ecological land (water and vegetation) can play a beneficial role in regulating the thermal environment during the day [53]. It is important to note that these lands will release heat at night, which could have a negative impact on the urban microclimate. Therefore, it is necessary to propose mitigation strategies for the urban thermal environment that consider both day and night. This issue will be addressed in future research. The northwest and southeast corners of Wuhan, as well as the southwest and eastern parts of the main urban area, are identified as more suitable regions for increasing carbon sinks. Among these areas, the main urban area overlaps with the area suitable for the growth of construction land. There is a significant discrepancy in the coordination of land use types, which requires the attention of urban planners. Nevertheless, achieving urban carbon neutrality by enhancing the carbon sink function of ecological land presents a considerable challenge. In the future, Wuhan should prioritize the management of carbon sources.

5.3. Limitations and Prospects of This Study

Compared to previous studies, this research introduces a novel decision support method oriented towards climate adaptability. It integrates the concept of low-carbon development into the study of urban expansion and specifically assesses the climate impacts of various urban expansion scenarios, which is less common in previous studies and demonstrates a certain level of innovation. However, the study does have some limitations. First, the research may rely too much on theoretical models and predictions, while actual urban development is a dynamic and variable process influenced by a variety of unpredictable factors. Therefore, the method proposed in this paper may require further verification and adjustment in practical applications to ensure its effectiveness and applicability. In addition, the formulation and implementation of actual policies is a complex process that involves multiple factors, and the translation of research findings into practical operations may face challenges. Finally, the study of the integration of low-carbon strategies with the climate impacts of urban expansion may not be deep enough, and further research is needed to explore the specific climate impacts of low-carbon measures under different urban development scenarios, as well as how the low-carbon approach can be more effectively integrated into the urban planning and expansion process.

6. Conclusions

This paper employs the WRF-UCM model to investigate the disparities and underlying causes of thermal environments in disparate urban development scenarios in Wuhan from a low-carbon perspective. The research findings can inform the formulation of scientific and rational urban development strategies in Wuhan to circumvent future climate risks. This paper reaches the following conclusions:
(1) In 2022, the net carbon emissions of Wuhan city were approximately 20.8353 million tons. To achieve carbon neutrality by 2060 while maintaining an average annual emission reduction rate of 10%, Wuhan city’s carbon sinks would need to increase by 382,200 tons. However, achieving urban carbon neutrality through a significant increase in the carbon sinks function of ecological land is challenging, and Wuhan City should focus more on carbon sources control to meet its carbon neutrality goals in the future.
(2) The expansion of Wuhan city’s future construction land is mainly directed towards the southeast and west. Without restrictions, the construction land area of Wuhan city could reach 1775.01 km2. Particularly around the main urban area, there is a significant coordination conflict between different types of land use, which requires focused attention from urban planners and managers. Areas such as the northwest and southeast corners of Wuhan city and the southwestern and eastern regions of the main urban area are more suitable for consideration as areas to increase the carbon sinks.
(3) The Ecological Priority scenario can effectively regulate the urban thermal environment during non-early-morning hours, especially during the morning and afternoon, reducing the urban heat island area by 1.87% and 2.48%, respectively. However, the regulatory effect weakens at night, and during the early morning, it leads to a 1.5% increase in the heat island area.
(4) The Tight Growth scenario can reduce the heat island area by 0.88% in the afternoon and weaken the heat island intensity by 0.48% at night. Compared to the Natural Growth scenario, both the heat island area and intensity decrease during the early morning.
(5) Under the Natural Growth scenario, the urban thermal environment deteriorates significantly. Particularly, in the morning, the heat island area increases by 4.31%, and the heat island intensity increases by 4.25% in the afternoon.
The conclusion indicates that a low-carbon development strategy, which strictly controls the expansion of urban construction land while enhancing urban carbon sinks, can effectively regulate the urban thermal environment during the daytime. However, an excessive increase in blue–green spaces, such as water bodies and green areas, may exacerbate the urban heat island phenomenon during early mornings and nights due to excessive heat dissipation. This finding suggests that urban planning should strike a balance in the distribution of blue–green spaces to avoid the pitfall of solely pursuing green coverage rates, while urban planners are neglecting their potential negative impacts on the urban microclimate. Therefore, future research will further explore the optimal configuration and layout ratio of urban blue–green spaces. Additionally, strategies for mitigating the urban thermal environment will be investigated from a day–night synergy perspective. Moreover, efforts will be made to enhance the simulation accuracy of the model by integrating the UCP data set, dynamic scales, and other methodologies.

Author Contributions

K.L.; Conceptualization, Methodology, Formal Analysis, Writing—Original Draft. Q.Z.; Conceptualization, Supervision, Writing—Review and Editing. W.X.; Formal Analysis, Writing—Original Draft, Visualization. Y.S.; Investigation, Methodology, Data Curation. Y.L.; Investigation, Data Curation. All authors have read and agreed to the published version of the manuscript.

Funding

The authors disclose receipt of the following financial support for the research, authorship, and publication of this article: This work was supported by the projects of the National Natural Science Foundation of China (No. 52078389, 51378399 and 51878515), the Innovation and Entrepreneurship Training Project for College students (No. X202010500115), and the Natural Science Foundation Youth Project of Hubei (No. 2023AFB510).

Data Availability Statement

The original contributions presented in the study are included in the article; further inquiries can be directed to the corresponding author.

Conflicts of Interest

The authors declare that they have no known competing financial interests or personal relationships that could have appeared to influence the work reported in this paper.

Abbreviations

The following abbreviations are used in this manuscript:
Artificial neural networka computational model inspired by the human brain
Anthropogenic heatheat generated by human activities
Atmospheric boundary layerthe lowest part of the atmosphere
Cellular automatona discrete model studied in computability theory
Carbon neutralityachieving net-zero carbon footprint
Carbon peakcarbon emissions reach their highest level
Carbon sinka process or entity that absorbs and stores carbon
Carbon sourcea process or entity that releases carbon into the atmosphere
Impervious surfaceareas covered by materials that do not allow water to penetrate
Latent Heat Fluxheat exchange per unit area under the constant temperature
Plot ratiothe ratio of a building’s total floor area to the size of the land
Urban heat island effecturban areas are significantly warmer than their surrounding rural areas
Sensible Heat Fluxthe turbulent heat flux between the surface and the atmosphere
Shortwave Radiation Fluxthe shortwave radiation flux from the surface down
Surface albedothe fraction of solar radiation that is reflected by a surface
Surface Flowthe heat flux of heat conduction between the surface and the lower layer
Urban canopy layerthe top layer of an urban area, consisting of buildings, trees, and other structures

References

  1. Deng, X.; Cao, Q.; Wang, L.; Wang, W.; Wang, S.; Wang, L. Understanding the Impact of Urban Expansion and Lake Shrinkage on Summer Climate and Human Thermal Comfort in a Land-Water Mosaic Area. J. Geophys. Res. Atmos. 2022, 127, e2021JD036131. [Google Scholar] [CrossRef]
  2. Grimmond, C.S.B.; Oke, T.R. Turbulent heat fluxes in urban areas: Observations and a local-scale urban meteorological parameterization scheme (LUMPS). J. Appl. Meteorol. 2002, 41, 792–810. [Google Scholar] [CrossRef]
  3. Yang, L.; Qian, F.; Song, D.; Zheng, K. Research on Urban Heat-Island Effect. Procedia Eng. 2016, 169, 11–18. [Google Scholar] [CrossRef]
  4. Voogt, J.A.; Oke, T.R. Thermal remote sensing of urban climates. Remote Sens. Environ. 2003, 86, 370–384. [Google Scholar] [CrossRef]
  5. Ren, G.; Zhou, Y. Urbanization effect on trends of extreme temperature indices of national stations over mainland China, 1961~2008. J. Clim. 2014, 27, 2340–2360. [Google Scholar] [CrossRef]
  6. Dvir, R.; Vedlitz, A.; Ye, X. Worried (and) sick: How environmental hazards affect Americans health-related risk attitudes. Urban Inform. 2024, 3, 26. [Google Scholar] [CrossRef]
  7. Zeng, S.; Shi, H.; Song, X.; Jin, L. Impact of urban heat island effect on ozone pollution in different Chinese region. Urban Clim. 2024, 56, 102037. [Google Scholar] [CrossRef]
  8. Zhao, X.; Jiang, H.; Wang, H.; Zhao, J.; Qiu, Q.; Tapper, N.; Hua, L. Remotely sensed thermal pollution and its relationship with energy consumption and industry in a rapidly urbanizing Chinese city. Energy Policy 2013, 57, 398–406. [Google Scholar] [CrossRef]
  9. Lin, L.; Tan, Y.; Shen, Y.; Yu, Z.; Li, Z.; Lan, H. Impact of land cover and population density on land surface temperature: Case study in Wuhan, China. J. Appl. Remote Sens. 2014, 8, 084993. [Google Scholar] [CrossRef]
  10. Zhang, X.; Estoque, R.C.; Murayama, Y. An urban heat island study in Nanchang City, China based on land surface temperature and social-ecological variables. Sustain. Cities Soc. 2017, 32, 557–568. [Google Scholar] [CrossRef]
  11. Yang, J.; Yang, Y.; Sun, D.; Jin, C.; Xiao, X. Influence of urban morphological characteristics on thermal environment. Sustain. Cities Soc. 2021, 72, 103045. [Google Scholar] [CrossRef]
  12. Zhang, J.; Tian, L.; Lu, J. Temporal Evolution of Urban Heat Island and Quantitative Relationship with Urbanization Development in Chongqing, China. Atmosphere 2022, 13, 1594. [Google Scholar] [CrossRef]
  13. Singh, P.; Kikon, N.; Verma, P. Impact of land use change and urbanization on urban heat island in Lucknow city, Central India. A remote sensing based estimate. Sustain. Cities Soc. 2017, 32, 100–114. [Google Scholar] [CrossRef]
  14. Xiong, Y.; Peng, F.; Zou, B. Spatiotemporal influences of land use/cover changes on the heat island effect in rapid urbanization area. Front. Earth Sci. 2019, 13, 614–627. [Google Scholar] [CrossRef]
  15. Wang, Y.; Li, X.; Zhang, C.; He, W. Influence of spatiotemporal changes of impervious surface on the urban thermal environment: A case of Huai’an central urban area. Sustain. Cities Soc. 2022, 79, 103710. [Google Scholar] [CrossRef]
  16. Dai, Z.; Guldmann, J.; Hu, Y. Spatial regression models of park and land-use impacts on the urban heat island in central Beijing. Sci. Total Environ. 2018, 626, 1136–1147. [Google Scholar] [CrossRef]
  17. Yang, C.; Zhan, Q.; Gao, S.; Liu, H. How Do the Multi-Temporal Centroid Trajectories of Urban Heat Island Correspond to Impervious Surface Changes: A Case Study in Wuhan, China. Int. J. Environ. Res. Public Health 2019, 16, 3865. [Google Scholar] [CrossRef]
  18. Ma, Y.; Zhang, S.; Yang, K.; Li, M. Influence of spatiotemporal pattern changes of impervious surface of urban megaregion on thermal environment: A case study of the Guangdong—Hong Kong—Macao Greater Bay Area of China. Ecol. Indic. 2021, 121, 107106. [Google Scholar] [CrossRef]
  19. Zhou, X.; Ooka, R.; Chen, H.; Kawamoto, Y.; Kikumoto, H. Impacts of inland water area changes on the local climate of Wuhan, China. Indoor Built Environ. 2016, 25, 296–313. [Google Scholar] [CrossRef]
  20. Fei, F.; Wang, Y.; Yao, W.; Gao, W.; Wang, L. Coupling mechanism of water and greenery on summer thermal environment of waterfront space in China’s cold regions. Build. Environ. 2022, 214, 108912. [Google Scholar] [CrossRef]
  21. Cai, Z.; Han, G.; Chen, M. Do water bodies play an important role in the relationship between urban form and land surface temperature. Sustain. Cities Soc. 2018, 39, 487–498. [Google Scholar] [CrossRef]
  22. Zhou, L.; Dang, X.; Sun, Q.; Wang, S. Multi-scenario simulation of urban land change in Shanghai by random forest and CA-Markov model. Sustain. Cities Soc. 2020, 55, 102045. [Google Scholar] [CrossRef]
  23. Liang, X.; Liu, X.; Li, D.; Zhao, H.; Chen, G. Urban growth simulation by incorporating planning policies into a CA-based future land-use simulation model. Int. J. Geogr. Inf. Sci. 2018, 32, 2296–2316. [Google Scholar] [CrossRef]
  24. Xu, Y.; Tian, Y.; Sun, P. Study on Driving Forces and Spatial Simulation of Land Use Change in Zhangjiakou City Based on Logistic Regression Model. Acta Sci. Nat. Univ. Pekin. 2015, 51, 964–995. [Google Scholar] [CrossRef]
  25. Han, D.; Qiao, R.; Ma, X. Optimization of land-use structure based on the trade-off between carbon emission targets and economic development in Shenzhen, China. Sustainability 2019, 11, 11. [Google Scholar] [CrossRef]
  26. Luo, P.; Du, Q.; Lei, Y.; Chen, R.; Cao, W. Study on urban land use evolvement model based on Extended Cellular Automata. Geogr. Geo-Inf. Sci. 2004, 20, 48–51. [Google Scholar]
  27. Hasan, S.S.; Sarmin, N.S.; Miah, M.G. Assessment of scenario-based land use changes in the Chittagong Hill Tracts of Bangladesh. Environ. Dev. 2020, 34, 100463. [Google Scholar] [CrossRef]
  28. Mohammady, M.; Moradi, H.R.; Zeinivand, H.; Temme, A.; Yazdani, M.; Pourghasemi, H. Modeling and assessing the effects of land use changes on runoff generation with the CLUE-s and WetSpa models. Theor. Appl. Climatol. 2018, 133, 459–471. [Google Scholar] [CrossRef]
  29. Cao, Z.; Lian, L.; Gu, Z.; Zhu, P.; Li, B. Selection of WRF land use/cover data and usage in urban heat island simulations. Resour. Sci. 2015, 37, 1785–1796. [Google Scholar]
  30. Guo, F. Urban climate high resolution numerical simulation research based on WRF/UCM. J. Dalian Univ. Technol. 2016, 56, 502–509. [Google Scholar] [CrossRef]
  31. Yang, H.; Wang, Z.; Wang, J.; Meng, N. Study on the influence of land use change on the thermal environment in Beijing-Tianjin-Hebei Urban Agglomeratio. J. Nat. Resour. 2018, 33, 1912–1925. [Google Scholar] [CrossRef]
  32. Zhou, X.; Chen, H. Impact of urbanization-related land use land cover changes and urban morphology changes on the urban heat island phenomenon. Sci. Total Environ. 2018, 635, 1467–1476. [Google Scholar] [CrossRef] [PubMed]
  33. Chen, G.; Zhao, L.; Mochida, A.; Cai, Y. Evaluation and analysis of land use data based on CA-Markov in urban heat island effect simulation. Build. Sci. 2021, 37, 113–120. [Google Scholar] [CrossRef]
  34. Wang, D.; Wu, D.; Zhang, Z. Urban Transition and Its Planning in Tokyo. Urban Plan. Int. 2013, 28, 6–12. [Google Scholar]
  35. Kronsell, A. Legitimacy for climate policies: Politics and participation in the Green City of Freiburg. Local Environ. 2013, 18, 965–982. [Google Scholar] [CrossRef]
  36. Jönsson, E.; Holgersen, S. Spectacular, realisable and “everyday”: Exploring the particularities of sustainable planning in Malmö. City 2017, 21, 253–270. [Google Scholar] [CrossRef]
  37. Kais, S.; Sami, H. An econometric study of the impact of economic growth and energy use on carbon emissions: Panel data evidence from fifty eight countries. Renew. Sustain. Energy Rev. 2016, 59, 1101–1110. [Google Scholar] [CrossRef]
  38. Xu, Q.; Yang, R.; Dong, Y.; Liu, Y.; Qiu, L. The influence of rapid urbanization and land use changes on terrestrial carbon sources/sinks in Guangzhou, China. Ecol. Indic. 2016, 70, 304–316. [Google Scholar] [CrossRef]
  39. Zhu, C.; Ye, X.; Du, J.; Hu, Z.; Shen, Y.; Retchless, D. Simulating urban energy use under climate change scenarios and retrofit plans in coastal Texas. Urban Inform. 2024, 3, 13. [Google Scholar] [CrossRef]
  40. Wang, J.T.; Zhao, L.; Gao, S.S. High alert to the trend of excessive spread of cities in China during the period of rapid urbanization—Empirical study based on the data of 70 large and medium-sized cities. J. Tianjin Univ. Financ. Econ. 2013, 33, 20–28. [Google Scholar]
  41. Cui, Y.P.; Qin, Y.C. The spatial distribution of global urban heat island intensity and the influence of urban sprawl. In Proceedings of the 2013 21st International Conference on Geoinformatics, Kaifeng, China, 20–22 June 2013; pp. 1–4. [Google Scholar]
  42. Xie, Q.; Zhou, Z. Impact of urbanization on urban heat island effect based on TM imagery in Wuhan, China. Environ. Eng. Manag. J. 2015, 14, 647–655. [Google Scholar] [CrossRef]
  43. Xu, X.; Liu, J.; Zhang, S.; Li, R.; Yan, C.; Wu, S. Land Use in China Remote Sensing Monitoring Dataset (CNLUCC); Institute of Geographic Sciences and Human Resources: Beijing, China, 2018. [Google Scholar] [CrossRef]
  44. Chen, F.; Yang, X.; Zhu, W. WRF simulations of urban heat island under hot-weather synoptic conditions: The case study of Hangzhou City, China. Atmos. Res. 2014, 138, 364–377. [Google Scholar] [CrossRef]
  45. Yang, Z.; Chen, Y.; Wu, Z. How urban expansion affects the thermal environment? A study of the impact of natural cities on the thermal field value and footprint of thermal environment. Ecol. Indic. 2021, 126, 107632. [Google Scholar] [CrossRef]
  46. Zhang, M.; Tan, S.; Zhang, C.; Han, S.; Zou, S.; Chen, E. Assessing the impact of fractional vegetation cover on urban thermal environment: A case study of Hangzhou, China. Sustain. Cities Soc. 2023, 96, 104663. [Google Scholar] [CrossRef]
  47. Yu, W.; Shi, J.; Fang, Y.; Xiang, A.; Li, X.; Hu, C.; Ma, M. Exploration of urbanization characteristics and their effect on the urban thermal environment in Chengdu, China. Build. Environ. 2022, 219, 109150. [Google Scholar] [CrossRef]
  48. Xie, Q.; Sun, Q. Monitoring thermal environment deterioration and its dynamic response to urban expansion in Wuhan, China. Urban Clim. 2021, 39, 100932. [Google Scholar] [CrossRef]
  49. Li, W.; Li, X. Evolution of Urban Expansion and Its Microclimate in Changchun. Remote Sens. Inf. 2020, 35, 105–111. [Google Scholar]
  50. Yang, L.; Niyogi, D.; Tewari, M.; Aliaga, D.; Chen, F.; Tian, F.; Ni, G. Contrasting impacts of urban forms on the future thermal environment: Example of Beijing metropolitan area. Environ. Res. Lett. 2016, 11, 034018. [Google Scholar] [CrossRef]
  51. Zhang, Y.; Wang, Y.; Ding, N.; Yang, X. Assessing the Contributions of Urban Green Space Indices and Spatial Structure in Mitigating Urban Thermal Environment. Remote Sens 2023, 15, 2414. [Google Scholar] [CrossRef]
  52. Li, X.; Stringer, L.C.; Dallimer, M. The role of blue green infrastructure in the urban thermal environment across seasons and local climate zones in East Africa. Sustain. Cities Soc. 2022, 80, 103798. [Google Scholar] [CrossRef]
  53. Zhu, D.; Zhou, X.; Cheng, W. Water effects on urban heat islands in summer using WRF-UCM with gridded urban canopy parameters—A case study of Wuhan. Build. Environ. 2022, 225, 109528. [Google Scholar] [CrossRef]
Figure 1. Location of Wuhan City and distribution of urban thermal environment. Areas within the urban built-up area where the temperature difference is greater than 2 °C compared to the suburbs are considered heat island areas. Areas with a temperature difference of less than 2 °C are considered cold island areas.
Buildings 15 00208 g001
Figure 2. Research framework and technical route of this study.
Buildings 15 00208 g002
Figure 3. Spatial constraint factors used for scenario prediction.
Buildings 15 00208 g003
Figure 4. The range and location relationship of the three domains. Urban blue-green spaces are areas within cities that include water bodies and vegetation. Domain refers to the specific geographical area and the grid system defined for numerical weather prediction simulations.
Buildings 15 00208 g004
Figure 5. Comparison of daily temperature change and WRF-UCM simulation in Wuhan Meteorological Station (Jiangxia, Caidian and Huangpi). This figure verifies the error between simulation results and observation results by presenting the trend of temperature changes.
Buildings 15 00208 g005
Figure 6. Measurement and prediction results of carbon emission in Wuhan. (a) Correlation analysis of carbon emissions in land use type. (b) Carbon emission measurement results in historical years. (c) Forecast results of carbon emission in future years.
Buildings 15 00208 g006
Figure 7. Comparison of land use distribution and scale in 2015 and future scenarios. (a) Land use distribution in various development scenarios; (b) the quantitative structure of land use in various development scenarios.
Buildings 15 00208 g007
Figure 8. Temperature curve and temperature difference curve. (a) Air temperature, (b) air temperature difference, (c) surface temperature, (d) surface temperature difference.
Buildings 15 00208 g008
Figure 9. Temperature difference field and wind difference field at 6:00.
Buildings 15 00208 g009
Figure 10. Temperature difference field and wind difference field at 16:00.
Buildings 15 00208 g010
Figure 11. Urban heat island intensity in the simulated region. This figure is obtained by processing the surface temperature data output by WRF-UCM through the NCAR Command Language (NCL). It shows the heat island intensity of various urban scenarios at four different times throughout the day: early morning, morning, afternoon, and night.
Buildings 15 00208 g011
Figure 12. The energy curves and difference curves of SWDOWN, HFX, LH, and GRDFLX.
Buildings 15 00208 g012
Table 1. Coefficients related to carbon emission calculation.
Land UseCarbon Emission Coefficient (t/hm2)Energy Fold Standard Coal Coefficient (t/t)Carbon Emission Coefficient (tCO/t)
cultivated land0.497coal 0.71430.7559
forest land−0.581coke0.97140.855
grassland−0.021crude oil1.42860.5857
water −0.359gasoline1.47140.5538
unused land−0.005diesel1.45710.5921
fuel oil1.42680.6185
kerosene1.45710.5714
Table 2. Physical processes and scheme.
Physical ProcessPhysical Scheme
mp_physicsNew Thompson
ra_lw_physicsRRTM
ra_sw_physicsGoddard
bl_pbl_physicsMYJ Monin–Obukhov
sf_sfclay_physicsMonin–Obukhov (Janjic Eta)
cu_physicsKain–Fritsch (New Eta)
Table 3. Setting of urban canopy parameters in WRF-UCM. These parameters are contained within the URBPARW.TBL file. They are used to drive the operation of the Urban Canopy Model (UCM).
FactorLow (31)Medium (32)High (33)
Roof_level [m]152127
Frc_urb [fraction]0.60.650.7
Roof_width [m]254055
Road_width [m]202020
Anthropogenic heat [W/m2]160214277
Albedo0.150.150.15
Table 4. Comparative statistical tests of observed temperature and WRF-UCM-simulated temperature at Wuhan meteorological stations (Jiangxia, Caidian, and Huangpi). This table quantifies the error between simulation results and observation results through three error indicators. The * typically denotes statistical significance. For example, a single asterisk might indicate significance at the 95% confidence level.
Observation StationObserved Value (°C)Simulated Value (°C)Mean
Deviation
RMSECorrelation Coefficient
JiangXia34.2130.833.383.770.92 *
CaiDian32.9731.081.892.090.97 *
HuangPi33.6531.112.542.740.96 *
Table 5. Analysis results of urban heat island index. The table is derived by processing the surface temperature data output by WRF-UCM using the NCAR Command Language (NCL). It presents the differences in heat island intensity indicators between three future scenarios and the current situation. These indicator differences reflect the thermal environmental impacts of different urban development patterns.
CaseUHPI SUHPI
Before DawnMorningAfternoonNightAfternoonNight
SQ20.77%39.72%68.17%50.54%29.16%7.93%
TG-SQ1.96%1.46%−0.88%1.65%1.66%−0.48%
NG-SQ1.75%4.31%0.48%4.00%4.25%0.22%
EP-SQ1.50%−1.87%−2.48%−0.73%−1.37%−1.65%
Disclaimer/Publisher’s Note: The statements, opinions and data contained in all publications are solely those of the individual author(s) and contributor(s) and not of MDPI and/or the editor(s). MDPI and/or the editor(s) disclaim responsibility for any injury to people or property resulting from any ideas, methods, instructions or products referred to in the content.

