Article

Urban Megaprojects from Isolation to Integration: A Property Market Perspective on Flagship Buildings

by
Maximilian Neuger
and
Connie Susilawati
*
School of Economics and Finance, Faculty of Business and Law, Queensland University of Technology, 2 George Street, Brisbane, QLD 4000, Australia
*
Author to whom correspondence should be addressed.
Buildings 2025, 15(7), 1156; https://doi.org/10.3390/buildings15071156
Submission received: 27 February 2025 / Revised: 25 March 2025 / Accepted: 30 March 2025 / Published: 1 April 2025
(This article belongs to the Section Architectural Design, Urban Science, and Real Estate)

Abstract

This study investigates how the simultaneous development of multiple urban megaprojects creates synergistic effects in residential property markets, with significant implications for urban planning and policy. Through an enhanced hedonic pricing model incorporating inter-project interaction terms, the research quantifies both individual and collective impacts of concurrent developments on property values. Analysis of comprehensive transaction data (2016–2022) reveals complex patterns of complementary and competing effects between proximate megaprojects, demonstrating that their combined impact differs substantially from the sum of their individual effects. The findings highlight the critical importance of coordinated planning approaches that consider inter-project dynamics when designing urban regeneration strategies. This research provides the first empirical measurement of megaproject synergy effects, offering valuable insights for policymakers and investors in optimizing the economic outcomes of transformational flagship buildings.

1. Introduction

A contemporary trend in the provision of urban infrastructure is the use of so-called megaprojects or flagship projects—large-scale urban development initiatives [1,2,3,4]. Cities increasingly leverage flagship buildings as iconic symbols of urban regeneration [5] while simultaneously embracing place-making projects that prioritize social and cultural cohesion [4,6]. The urban intervention and emergence of mixed-use developments, often in the form of megaprojects or flagship projects, can create agglomeration effects in CBDs. The Alonso–Muth–Mills (AMM) monocentric city model [7,8,9] explains how transport costs can lead to the concentration of employment in a central business district (CBD) and a decline in land rents and population density with increasing distance from the center. This countervailing dynamic manifests when projects establish new centers of gravity through premium urban spaces and cultural amenities. Investments in mobility—such as rail systems, highways, and urban transit—can alter traditional monocentric patterns by reducing transport costs and travel times, thereby enhancing connectivity between peripheral and central areas. Zegras refers to these effects as “centrifugal” forces that push development outward [10]. Spatial restructuring induced by transportation improvements has been empirically demonstrated [1]. In contrast, one can hypothesize an opposite effect when major urban interventions occur in the CBD, exerting “centripetal” forces that increase demand in the urban core.
The resultant tension between centrifugal mobility effects and centripetal place-making impacts raises fundamental questions about the complex interplay of forces when multiple megaprojects are developed simultaneously within a city. This simultaneity of development may create unprecedented patterns of urban transformation that transcend traditional models of urban spatial economics. Consequently, the question arises whether synergy effects are present, and if so, how these synergy effects can be measured. The research question raised in this study is, “Are there synergy effects that go beyond the sum of individual megaproject impacts?”. This study hypothesizes that these interventions will trigger rapid property value appreciation in core areas, directly challenging the expected dispersal effects of enhanced mobility. Yuan et al. advocate a shift towards more sophisticated methodologies, moving beyond basic qualitative approaches to incorporate more advanced theories and quantitative analyses in megaproject research [11].
This study aims to fill these knowledge gaps by investigating not only the individual impacts of multiple concurrent megaprojects but also their potential synergy effects. This study addresses this critical gap by explicitly incorporating interaction terms within an enhanced hedonic pricing framework, enabling quantification of the incremental economic impacts of multiple concurrent megaproject developments. No existing study has explicitly measured how simultaneous proximity to multiple flagship projects generates either multiplicative benefits or competitive effects on residential property values.
Drawing from recent methodological recommendations for applying quantitative methods to megaproject research [12], this research provides empirical evidence that significantly enhances our understanding of the complex interplay among simultaneous flagship urban projects. We propose a hedonic pricing model augmented with interaction terms to capture these effects. The hedonic price modeling approach allows for the estimation of the implicit prices of various property attributes, including spatial proximity to megaprojects. By incorporating interaction terms, this study seeks to disentangle the intangible effects of each megaproject from the synergy effects that may result from concurrent development. The hedonic model is extended to include interaction variables that capture the additional impact on property prices arising when properties are proximate to multiple megaprojects simultaneously, over and above the sum of individual project effects. This approach distinctly identifies the incremental economic effects created by concurrent developments, representing a methodological and empirical innovation in both urban economics and property market research. Thus, this research contributes not only methodologically but also practically, offering essential insights for policymakers, urban planners, and real estate investors aiming to optimize the benefits of urban regeneration through strategically coordinated development initiatives.

2. Materials and Methods

2.1. Literature Review

Urban megaprojects have attracted substantial academic interest due to their significant implications for urban dynamics and real estate markets. These large-scale, mixed-use initiatives are increasingly pivotal instruments for urban transformation, aimed not only at driving economic growth but also at rebranding and regenerating urban spaces. These megaproject approaches, although distinct in focus, converge in their aim to reimagine urban spaces through transformative and innovative development strategies [1,2,3] Typically executed through public–private partnerships, these developments integrate diverse elements, including residential, commercial, cultural, and transport infrastructures [13,14,15]. However, the ambitious scope, high costs, and long timeframes of such projects raise critical questions about power, place, and the true beneficiaries of these urban ventures.
The problems associated with the stated public benefits of megaprojects invariably confront what Flyvbjerg terms the “Iron Law of Megaprojects”: over budget, over time, underdeliver on their promised benefits, ‘over and over again’ [16,17]. In a study of transportation infrastructure megaprojects, Flyvbjerg et al. [18] analyzed a sample of 258 projects across 20 countries and five continents over a 70-year period. The authors found that nine out of ten projects experienced cost overruns, with average overruns of 28% for all projects, 45% for rail projects, and 20% for road projects—findings that have been corroborated in subsequent studies [9]. This systematic pattern of underperformance raises fundamental questions about the true cost of these projects and their impact on the urban core. As these projects are often driven by public–private partnerships, an important question is how private (specifically residential) markets respond to such top-down urban interventions, and whether any intangible value from these megaprojects is manifested in residential property prices. The hypothesis is that, ceteris paribus, properties located closer to urban megaprojects will command a price premium over those that are further away—all else being equal.
The current state of the literature exposes the fragmented nature of megaproject research, highlighting substantial thematic concentrations such as sustainable development, governance, project management, risk assessment, and socio-economic impacts. Cottafava et al. [19] identify significant gaps, particularly regarding the limited attention given to the operational and end-of-life phases of megaprojects, insufficient economic evaluation of environmental and social impacts, and a deficiency in sustainability reporting. Furthermore, they critique the dominant ’predict and control’ planning method, which inadequately manages risks and uncertainties inherent in megaprojects, advocating for more adaptive frameworks such as Real Options Theory (ROT) [20]. Despite ROT’s potential in enabling flexible decision-making and better valuation of project uncertainties, its practical application remains hindered by mathematical complexity and a scarcity of empirical validation [20].
The economic rationale behind urban megaprojects typically includes their potential to stimulate local economies, attract global capital, and enhance city competitiveness [21]. Scholarship highlights the symbolic significance of flagship developments, positioning them as critical assets that communicate a city’s identity, modernity, and aspirations on a global stage [22]. Moreover, contemporary literature identifies the emergence of “placemaking” approaches aimed at integrating cultural and social dimensions within urban renewal strategies, thereby achieving more inclusive and cohesive urban environments [23,24].
The symbolic dimensions of megaprojects also attract considerable attention, especially regarding their role in legitimizing developments and mitigating public opposition. Studies emphasize how megaproject promoters frequently leverage international inter-referencing practices, iconic architectural elements, and narrative constructions to enhance the perceived legitimacy of projects and manage stakeholder expectations [25,26]. These symbolic strategies have proven effective in garnering consensus and deflecting criticism, yet they often mask deeper socio-economic disparities and governance issues, reflecting persistent challenges in aligning symbolic aspirations with substantive urban policy outcomes [25,27].
An understudied yet critical dimension in megaproject research concerns the synergy effects that emerge when multiple flagship developments are concurrently implemented within the same urban context. While prior research has analyzed the individual impacts of transportation infrastructure projects on surrounding property values [28], explicit empirical quantification of the synergy or interaction effects among simultaneous megaprojects remains limited. This limitation is especially pronounced regarding interactions between transportation megaprojects and other types of urban development. Although recent scholarly contributions conceptually recognize the potential for synergies [29,30], rigorous empirical analysis of these effects is still largely absent from the literature. Several case studies highlight both the benefits and complexities of synergy in urban megaprojects, including Santa Cruz de Tenerife’s integration of lessons from previous initiatives [31], Riyadh’s coordinated development of the Metro and King Abdullah Financial District emphasizing sustainability and walkability [30], Tokyo’s Hikifune neighborhood’s successful integration of housing, transportation, and public spaces for enhanced livability [32]), and Shenzhen’s harmonized planning of rail transit systems with land use, optimizing urban efficiency and sustainability [33]. Recent research explicitly calls for more sophisticated quantitative analyses to understand these inter-project dynamics better, especially given the complexities inherent in concurrent developments [19,31].
Despite the substantial attention devoted to project management within the context of urban megaprojects, academic discourse remains heavily dominated by qualitative studies [19,34]. A methodological imbalance exists, caused by a notable scarcity of empirical validation in the absence of statistically robust empirical validation [20,35]. This is in addition to an inadequate measurement of project outcomes [35] and an absence of longitudinal quantitative data [19]. Although the need for methodological sophistication in advanced statistical, econometric, and spatial analytical methods has been emphasized [35], the practical application of these quantitative techniques remains relatively limited. This scarcity extends to the systematic quantitative measurement of project outcomes, including the impacts and synergies of concurrent megaproject developments, thus restricting comprehensive and evidence-based conclusions on the determinants of project success and failure.

2.2. Hedonic Pricing Model

Hedonic price models are extensively utilized in the study of real estate to analyze how various characteristics of properties influence their market value or price. The core principle behind these models is to elucidate price variations across different properties by attributing these differences to the distinct features that each property possesses. Hedonic price models are based on the premise that the price of a heterogeneous good, such as a residential property, can be decomposed into the implicit prices of its constituent attributes [36]. Real estate is a heterogeneous good, and in housing, for example, key attributes typically include structural characteristics (e.g., size, number of bedrooms, age), locational factors (e.g., proximity to amenities, neighborhood quality), and environmental features (e.g., air quality, noise levels) [37,38]. The strength of hedonic pricing models allows us to put a monetary value behind externalities, such as the impact of air pollution [39,40,41,42]. Similarly, brownfield redevelopments [43] have been shown to positively influence surrounding property values. Further studies assessed the influence of amenities on property values, the effects of proximity to goals [44], environmental amenities [45], airport noise [39], and rail and transport [46], among other factors. Transportation infrastructure projects, such as rail transit systems [47,48] and highways [49,50], have been found to significantly affect property values, with proximity to these amenities generally commanding higher prices. The model specification and estimation for this paper are discussed in Section 2.5. The application of hedonic price models in real estate research has evolved over the years, with advancements in statistical techniques and the availability of rich datasets. Different model specifications have emerged, from parametric to semi-parametric methods to improve the explanatory power. The debate extends beyond the mere inclusion of attributes and largely focuses on model specification and the accuracy of models [51,52] and involves ordinary least squares [37,38,53] or generalized additive models (GAMs) [54,55,56,57] as well as spatial autoregresseive (SAR) and geographically weighted regression (GWR) models. Despite these advancements, ordinary least squares (OLS) regression has been the most commonly used method for estimating hedonic price models [37,38,53].

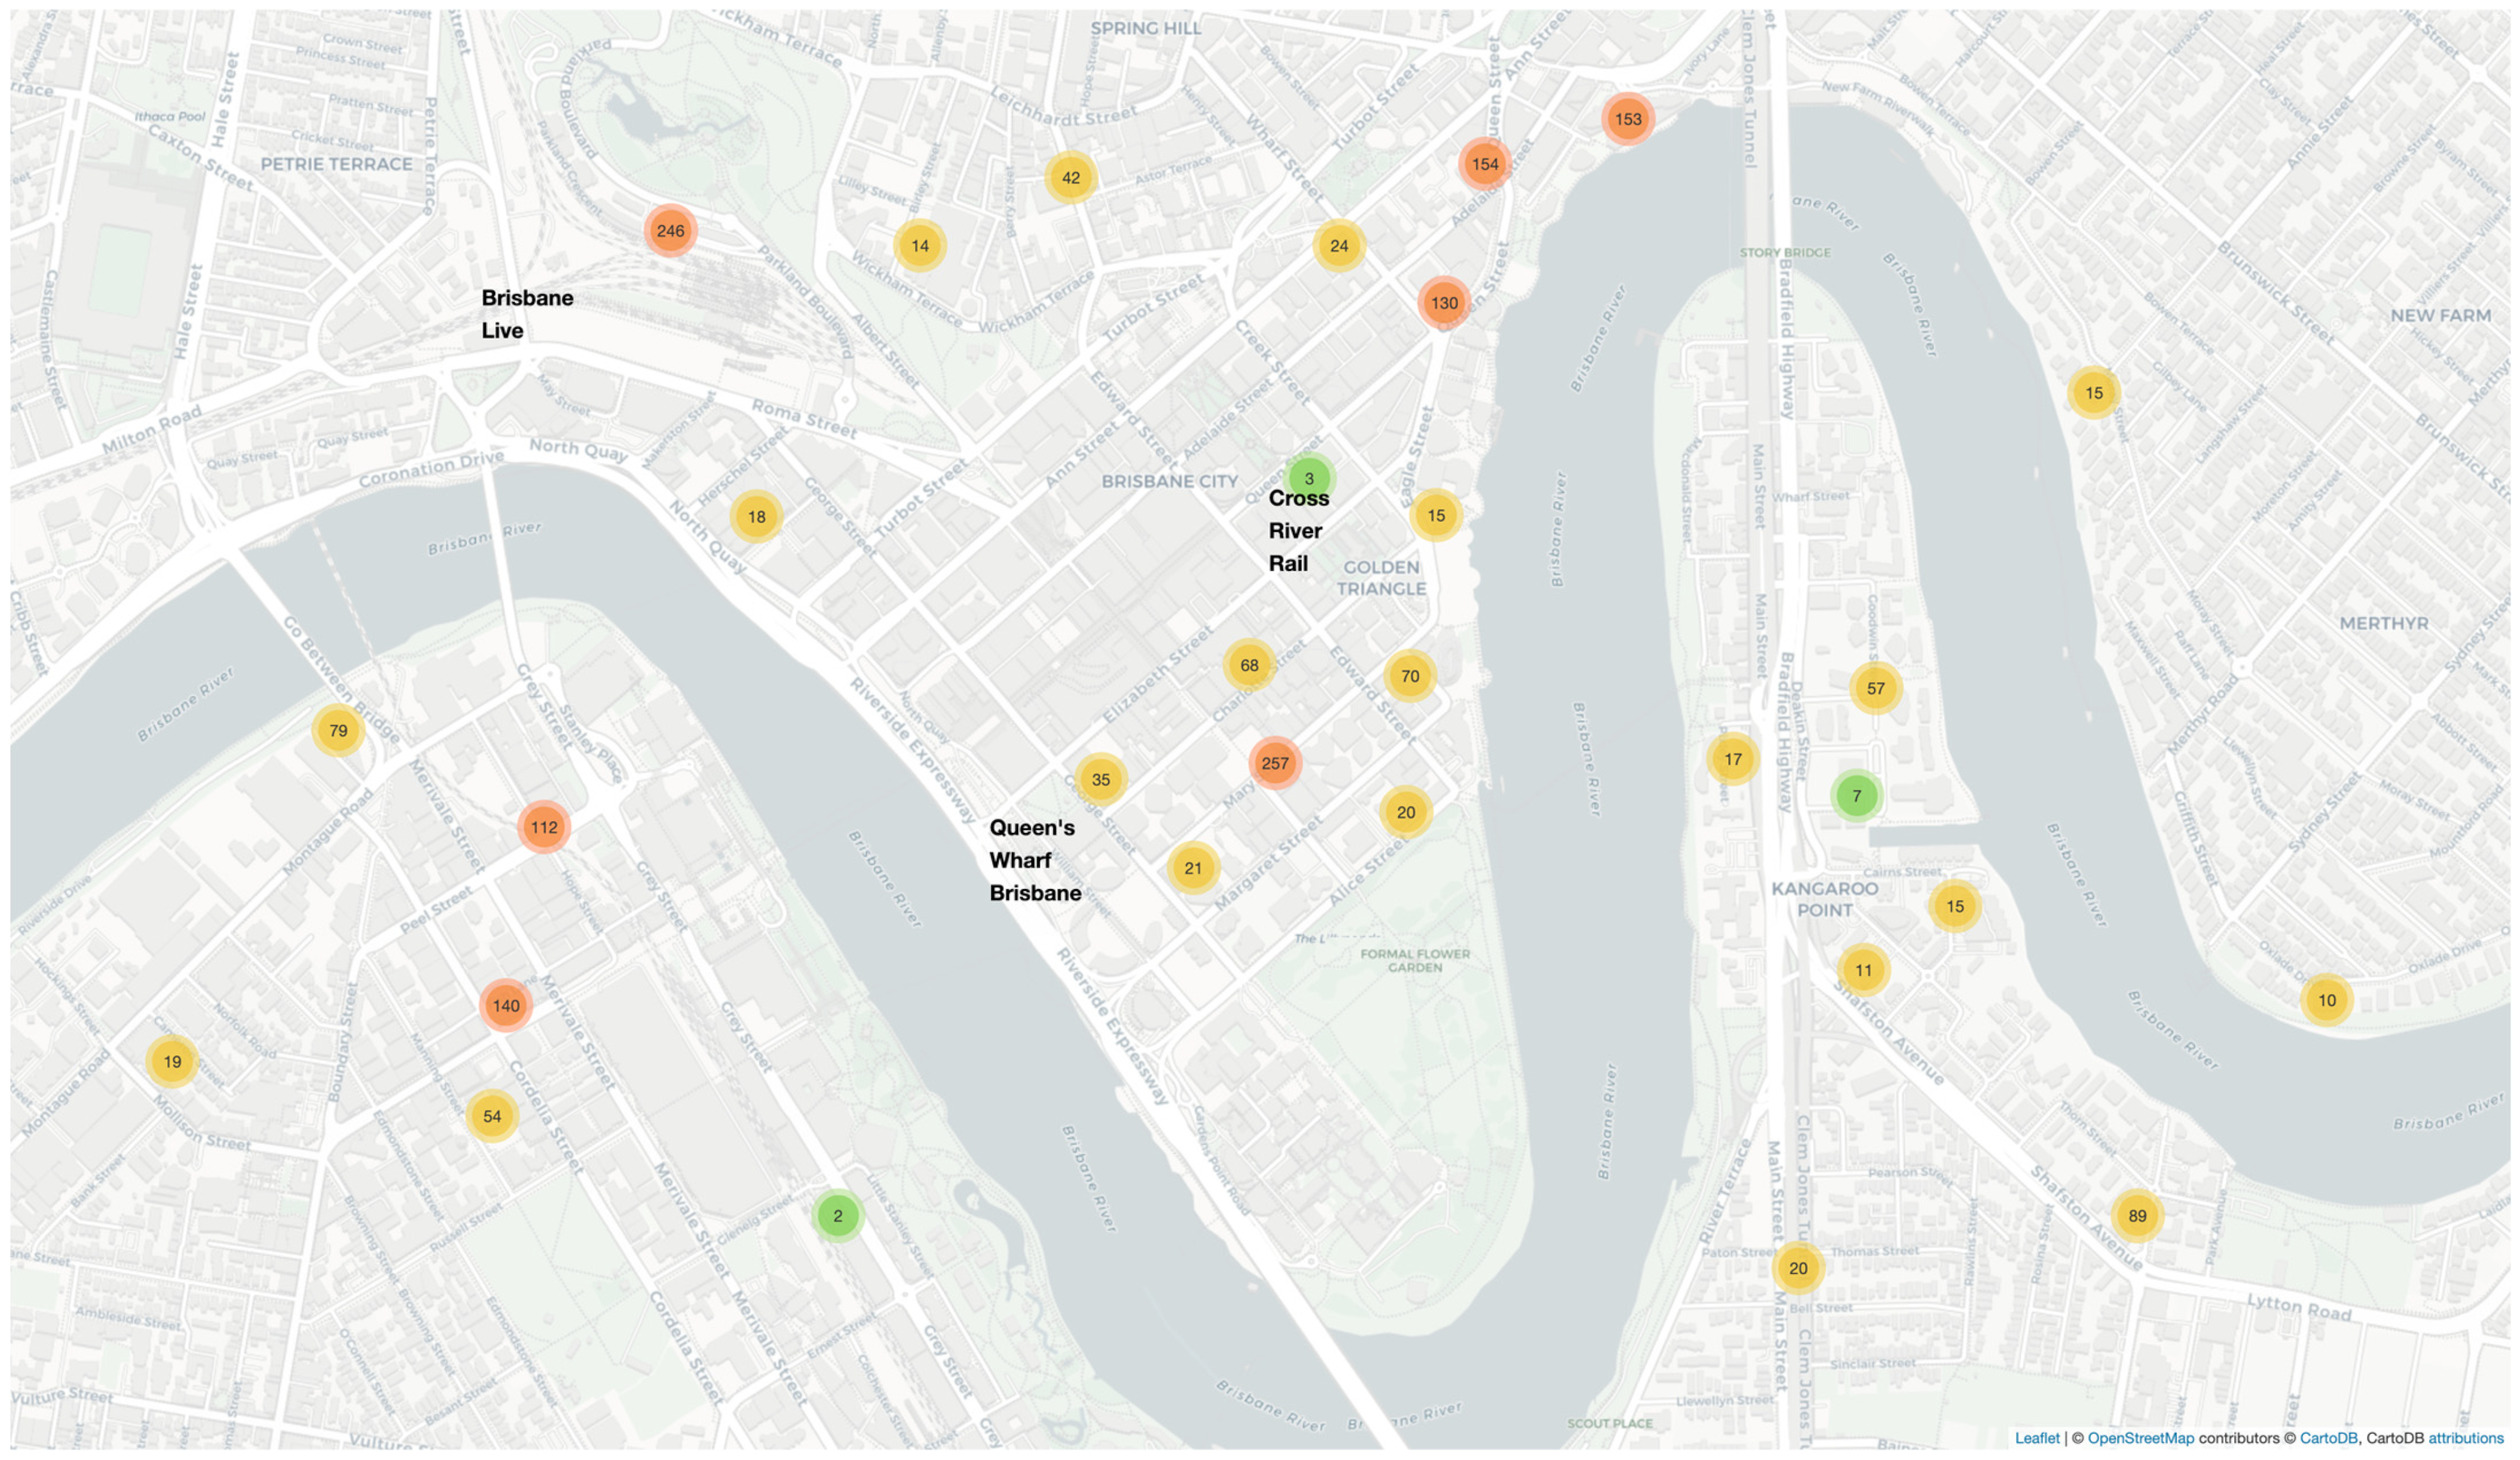
2.3. Study Area and Context

The empirical context for this study is Brisbane, Australia, which experienced significant urban transformation from 2016 to 2022, driven by the concurrent development of several large-scale urban regeneration projects (megaprojects). This simultaneous implementation of multiple megaprojects presents a unique opportunity to analyze potential synergy effects on residential property values. The convergence of these transformative developments, each expected to significantly impact Brisbane’s urban fabric, enables examination of their collective influence on property markets. This study specifically focuses on three major urban megaprojects located strategically in Brisbane’s Central Business District (CBD) and inner-city areas, each significantly reshaping their immediate urban environments:
  • Queen’s Wharf Brisbane: Located along Brisbane’s CBD riverfront, spanning from William Street to Alice Street, this USD 3.6 billion integrated resort project features luxury residential apartments, multiple hotels, high-end retail and dining precincts, extensive public spaces, and revitalized heritage structures [58].
  • Cross River Rail (CRR): This USD 5.4 billion infrastructure development includes a 10.2 km rail corridor from Dutton Park to Bowen Hills, with new underground stations in Brisbane’s inner city. This project unlocks a bottleneck in Brisbane’s CBD through enhanced accessibility, reduced travel times, and increased connectivity to core areas [59,60,61].
  • Brisbane Live: This USD 2.1 billion project is situated above the existing Roma Street railyard. The plan comprises a 17,000-seat entertainment arena, alongside new residential units, and commercial amenities. Its strategic location next to major transport nodes promises to attract increased activity in the area [62,63].
A comprehensive dataset of residential property transactions in Brisbane over this period is utilized, including property attributes, transaction details (sale prices), and straight-line distance measures for each megaproject considered. The selected megaprojects’ diverse yet complementary features, ranging from entertainment to residential, commercial, transport, and leisure functions, facilitate the analysis of complex interactions and synergy effects within the urban property market. The presence of several megaprojects occurring simultaneously in Brisbane provides a unique opportunity to investigate how these projects interact in influencing the surrounding real estate market.

2.4. Data Sources and Variables

This study draws upon residential property transaction data from PriceFinder, a comprehensive proprietary database that provides detailed information on property sales and attributes in the Australian market. The database is widely used in professional valuation practice in Australia. Figure 1 shows the distribution of sales price by postcode.
The dataset encompasses residential property transactions in Brisbane from January 2016 to December 2022 (N = 2859), spanning critical development phases of multiple urban megaprojects. This temporal range captures pre-announcement, construction, and early operational periods of the projects under study. This timeframe includes significant milestones, as seen in Table 1.
Data preprocessing followed a systematic protocol to ensure robustness and reliability. Initially, the raw dataset comprised 3142 residential property transactions. First, any transactions with missing or invalid information, such as those with zero or negative sale prices or missing property attributes, were removed. Second, the data were filtered to include only arm’s-length transactions, excluding any sales between related parties or non-market transactions, adhering to the legally permissibility aspect of the Highest and Best Use [67]. After preprocessing, the final dataset consists of 2859 residential property transactions in Brisbane recorded from 2016 until January 2022. While the dataset provides a comprehensive and representative sample of residential property transactions in Brisbane, there are some limitations and potential biases to acknowledge. First, the dataset only includes transactions that are reported in the PriceFinder database, and there may be some missing or unreported sales that are unrepresented. Second, the dataset does not include information on some potentially relevant property attributes, such as the quality of construction, renovation history, or energy efficiency. Third, the distance variables are based on straight-line distances and do not account for the actual transportation network or accessibility to the megaproject sites. The final key variables in the dataset can be seen in the table below. Table 2 presents the key variables employed in the analysis. Variables are categorized into property characteristics (structural attributes), location measures (distance variables), and project phase indicators (time dummies).
The Euclidian distance is used to measure the proximity of each property to the megaprojects. The straight-line distance (in kilometers) is calculated from the property coordinates to the centroid of each megaproject site using the latitude and longitude coordinates obtained from Nearmaps—Geographic Information Systems (GIS) software. These distance variables are used to capture the spatial relationship between each property and the megaproject. Appendix A visualizes the locational distribution in relation to the three megaprojects.

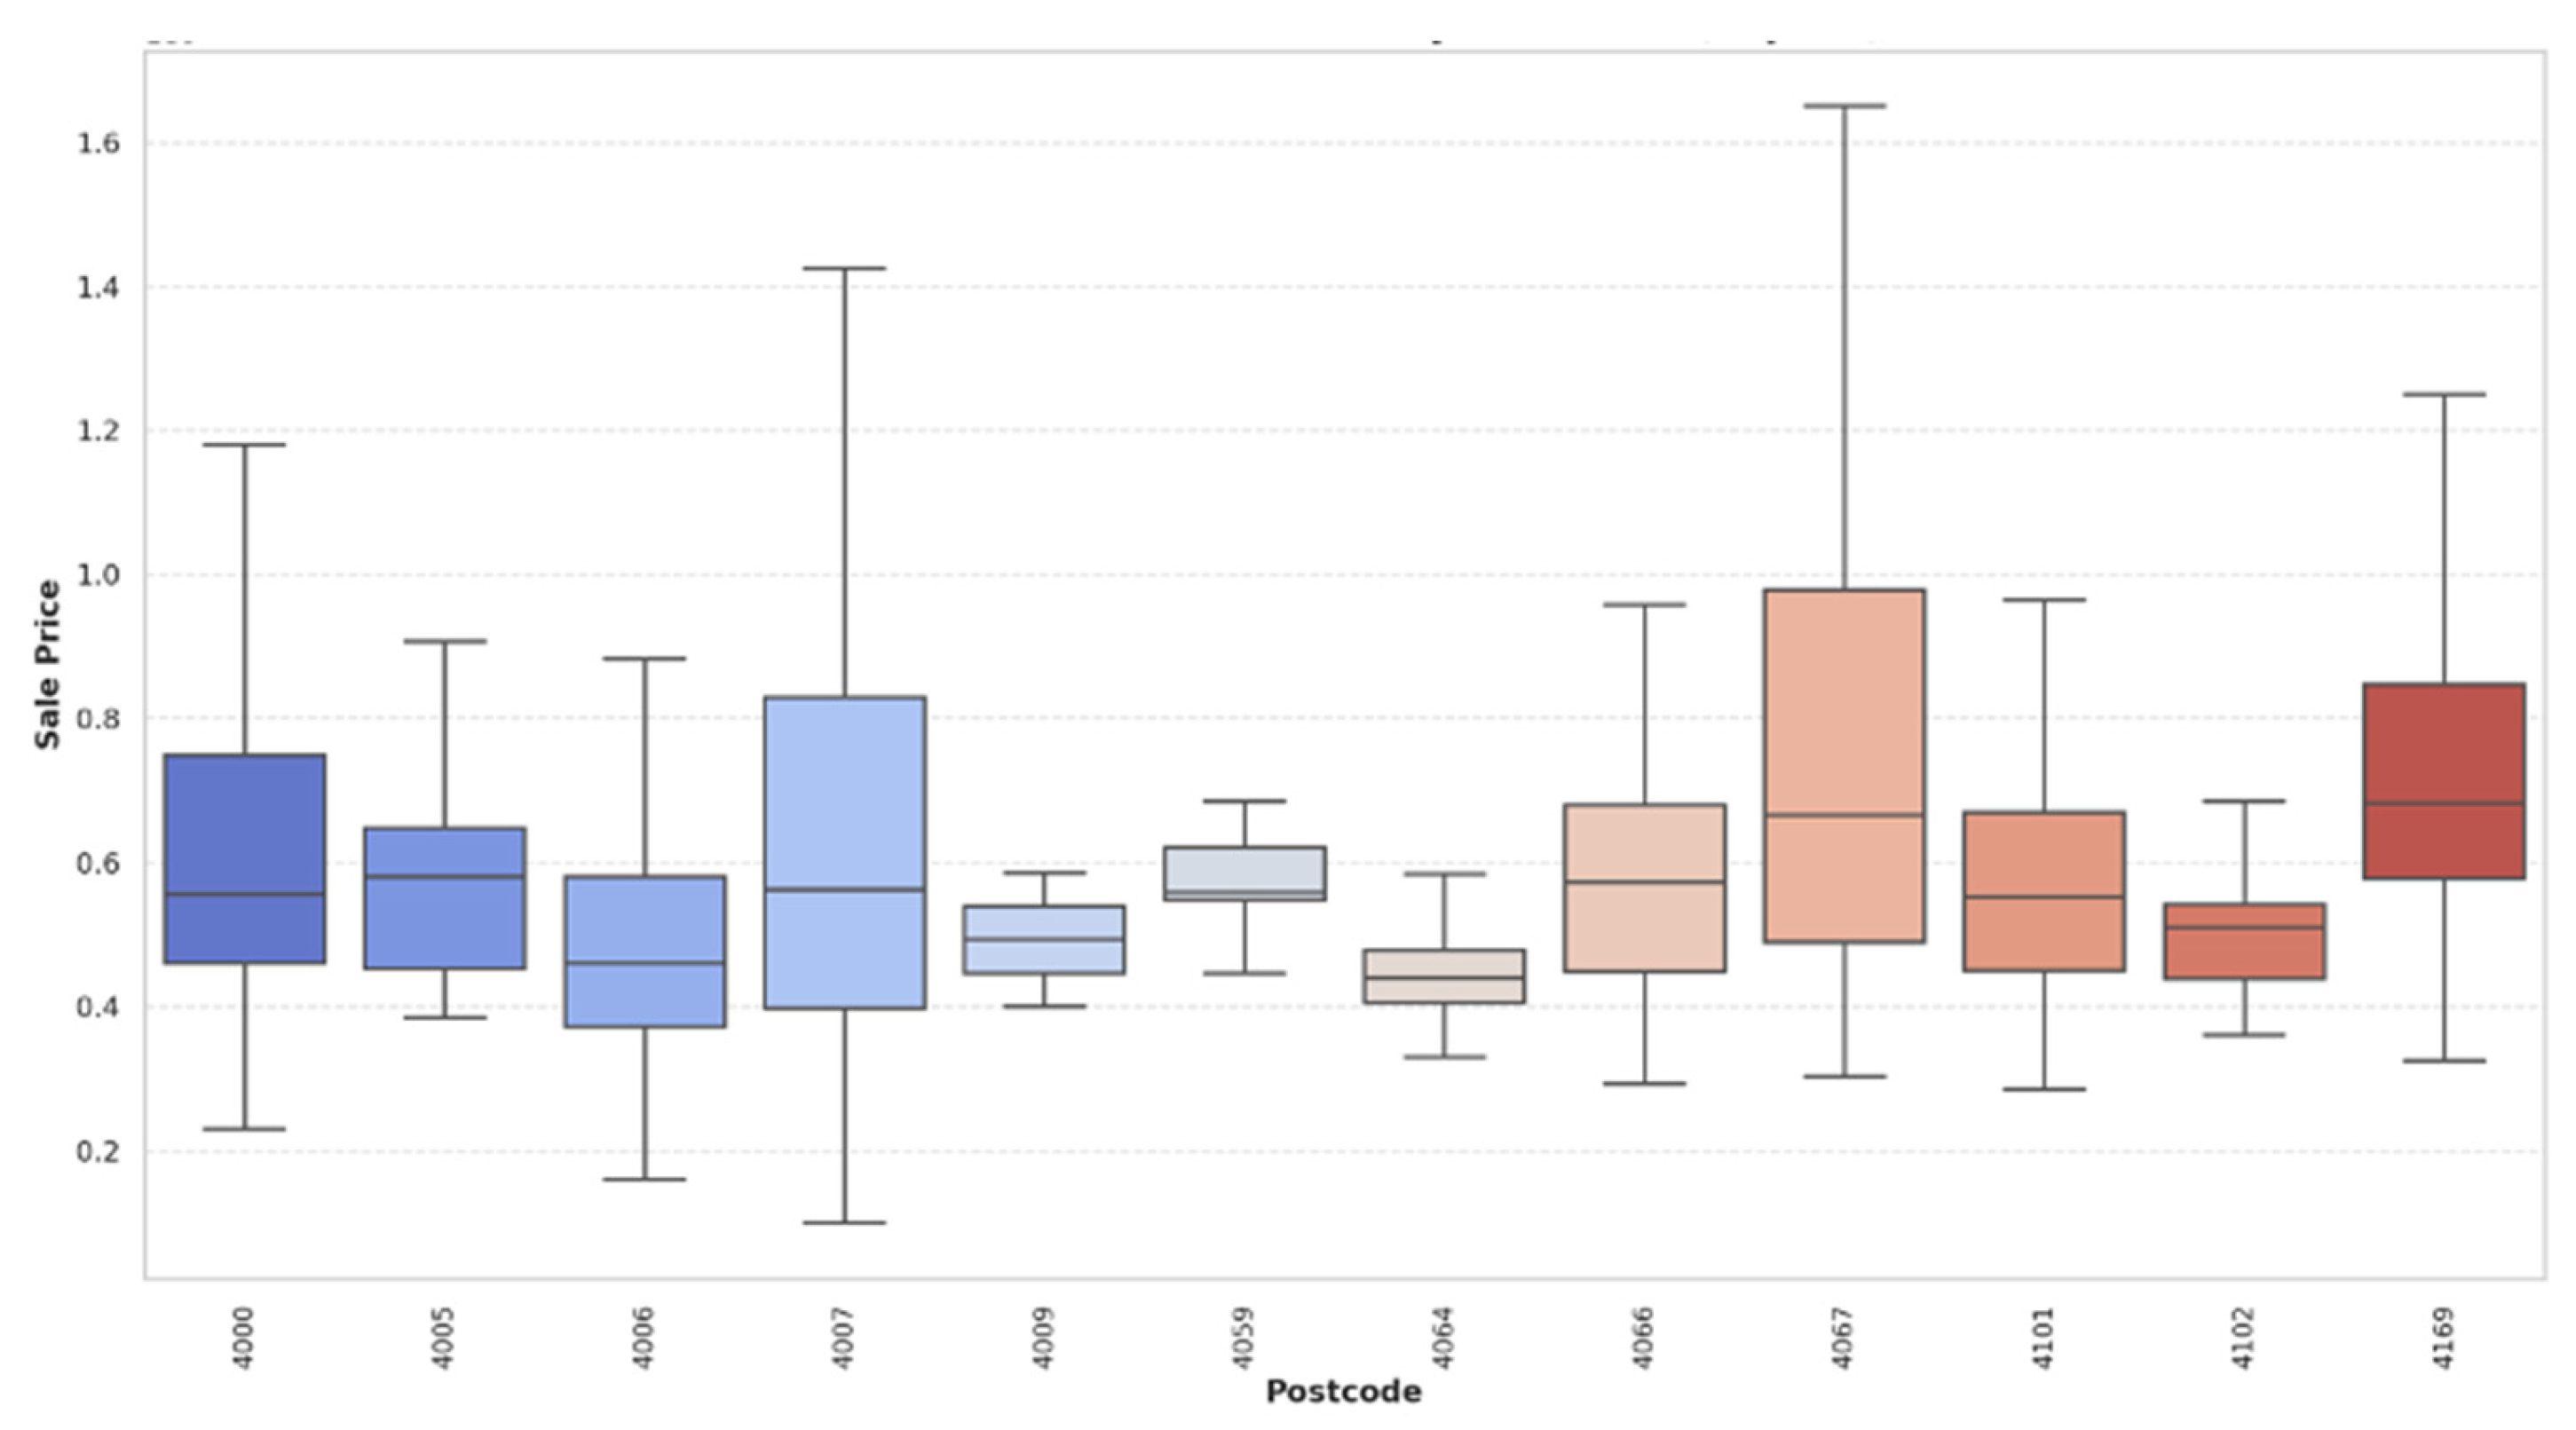
2.5. Descriptive Statistics

Table 3 presents the descriptive statistics for residential property transactions in Brisbane from 2016 to 2022. The sample consists of 2859 transactions with an average sale price of AUD 645,527 (standard deviation = AUD 361,989). The median sale price of AUD 555,000 indicates a slight positive skew in the price distribution.
Regarding property characteristics, the sample properties have a median of 2 bedrooms and 2 bathrooms, with most including at least one car park. The standard deviations for these structural attributes are relatively small (0.66 for bedrooms, 0.53 for bathrooms, and 0.57 for car parks), suggesting consistency in the housing stock across the sample. Annual transaction volumes remained relatively stable throughout the study period, with slight variations ranging from 395 transactions in 2020 to 668 in 2021.
From the descriptive statistics table, the need for a natural logarithm transformation of multiple variables becomes apparent because they differ substantially with regard to their absolute values. These include the target variable. The Box–Cox test for the functional form of the distance variables was completed. While the Box–Cox test supported a log transformation for the distance variables, no transformation was applied, partly due to the more intuitive interpretability of distance using metrics, but also due to the necessity to standardize these variables as evident in the correlation matrix (see Table 4). Cook’s distance was used to handle outliers in the dataset. The correlation matrix is reported below.
From the correlation matrix, various insights can be drawn. The matrix displays Pearson correlations below the diagonal and their corresponding p-values above the diagonal. Values below the diagonal represent correlation coefficients. Positive correlation values above 0.25 (in line with [68]) are defined as the threshold for econometric issues among the independent controlling covariates to monitor multicollinearity. The correlation matrix reveals the expected relationships between structural attributes and sale prices, with correlation coefficients ranging from 0.52 to 0.72. This is expected, as these features contribute significantly to property prices. Distance variables show weaker correlations with price (coefficients < 0.25), though several exhibit strong correlations with each other, necessitating careful treatment in the model specification. Distance to megaprojects generally shows weak to moderate negative correlations with sale price, consistent with the hypothesis that proximity enhances property value. However, distance variables are highly correlated with each other, indicating the potential for further multicollinearity when creating the interaction terms. While multicollinearity among distance variables is expected due to the spatial proximity of megaprojects, solutions had to be applied to improve the model fit. The standardization of these distance measures (mean = 0, standard deviation = 1) facilitates interpretation of the interaction terms in the hedonic model. Distance variables were standardized and re-estimated for further exploration. Further, it was decided to remove the Distance to Northshore Hamilton and Brisbane Waterfront to retain the predictability of the model.

2.6. Model Specification and Estimation

We specify an ordinary least squares (OLS) regression model. We find OLS appropriate for the analysis, given the large sample size and the assumptions of the hedonic price model, in line with Malpezzi [37], noting that OLS is a commonly employed method for estimating hedonic price functions. The specification of an ordinary least squares (OLS) regression model as a preferred econometric tool over alternative models, namely a GAM, GWR, and SAR, follows a rationale for substantive and practical reasons. Besides its computational advantages, the transparency and interpretability of OLS are particularly suited for clearly capturing and explaining individual and combined effects of structural attributes and spatial interaction terms, which in turn directly aligns with the central research objective of explicitly quantifying megaproject synergy effects.
This study includes an interaction term in the standard hedonic price model that captures the potential synergy effects between megaprojects. The analysis proceeds in three stages. First, a baseline hedonic model establishes the relationship between structural attributes and property prices. Second, distance variables are introduced to capture individual megaproject effects. Third, interaction terms are incorporated to measure the synergy effects between concurrent projects. As such, the overall model specification can be stated as follows:
ln(P) = α + β × S + γ × L + δ × D + θ I + ε
where
-
ln(P) represents the natural logarithm of property sale price;
-
α is the intercept;
-
S denotes structural characteristics (bedrooms, bathrooms, car parks);
-
L captures temporal effects through yearly time dummies;
-
D is a vector of distance variables for each megaproject;
-
I incorporates interaction terms between projects;
-
β, γ, δ, and θ are vectors of coefficients to be estimated; and
-
ε is the error term.
To capture synergy, we introduce interaction terms between pairs of megaproject distance variables. The interaction terms (I) in the model are created by multiplying the distance variables for pairs of megaprojects. For reference, Equation (2) shows the interaction term between Queen’s Wharf and Cross River Rail
IQWB × CRR = DQWB × DCRR
where DQWB is the distance to Queen’s Wharf Brisbane and DCRR is the distance to Cross River Rail.
These interaction terms allow us to capture the potential synergy effects between the megaprojects. These terms assess whether co-location amplifies or diminishes their individual effects. The logarithmic transformation of the dependent variable addresses the typically right-skewed distribution of property prices and enables coefficient interpretation as percentage effects, in line with Oertel et al. [68], suggesting a transformation of all absolute values into natural logarithm, to dampen the noisy effect variables with substantially large absolute values have on variables. Distance variables are standardized to have zero mean and unit standard deviation before creating interaction terms. This standardization serves two purposes: it reduces the potential multicollinearity between interaction terms and their components, and it facilitates the interpretation of interaction coefficients as standard deviation effects. The model is estimated to use ordinary least squares (OLS) with heteroskedasticity-robust standard errors to address potential variance heterogeneity. While spatial dependence likely exists in the data, computational constraints prevent the implementation of more sophisticated spatial econometric techniques. This limitation is acknowledged and partially addressed through careful interpretation of the results. Several diagnostic tests assess model validity. Variance inflation factors (VIFs) examine multicollinearity, with values above 5 flagged for concern. The Breusch–Pagan test evaluates heteroskedasticity, while Ramsey’s RESET test checks functional form specification. The methodology enables the quantification of both direct project effects and synergistic impacts while controlling property characteristics and temporal trends. However, endogeneity concerns regarding project locations and potential omitted variables suggest caution in the causal interpretation of results. Several versions of the model are estimated, starting with a base model that includes only the structural and locational attributes, and then progressively adding the megaproject distance variables and interaction terms. This approach allows for a detailed assessment of the incremental impact of megaprojects and their synergy effects on residential property prices.
Zurada et al. [69] highlight several limitations of the OLS due to its inherent assumptions. These include the presumption of linearity, a lack of model flexibility, issues of multicollinearity among variables, and spatial autocorrelation. Spatial autocorrelation specifically addresses the tendency for real estate values to cluster within specific geographical areas or submarkets [70]. Regretfully, property data often exhibit spatial dependence and heterogeneity, which may violate the assumptions underlying OLS [71,72]. To address these issues, researchers can draw on an arsenal of alternative model specifications from spatial autoregressive models [70,73,74] as well as geographically weighted regression [75,76] to semi-parametric and non-parametric approaches like gene [55,56,57].

3. Results and Discussion

The empirical analysis reveals significant effects of both individual megaprojects and their interactions on residential property values in Brisbane. We report the results progressively for the two model specifications: a baseline model with only structural attributes and a full model including interaction terms (synergy effects).

3.1. Interpretation of Results

The coefficients estimated in the hedonic price model can be interpreted as the marginal effects of the explanatory variables on the natural logarithm of the sale price. For the structural attributes, the coefficients represent the percentage change in the sale price associated with a one-unit change in the attribute, holding other factors constant. Due to the standardization of distance variables, for the megaproject distance variables, the coefficients represent the percentage change in the sale price associated with a one standard deviation increase in the distance to the respective megaproject, holding all other variables constant. A negative coefficient indicates that properties located closer to the megaproject command higher prices, while a positive coefficient suggests the opposite. This is counterintuitive, as one standard deviation decrease in distance is associated with an increase in sales price. A negative sign on a distance coefficient indicates that proximity to that project increases property value, whereas a positive sign would suggest the opposite. The coefficients of the interaction terms are of particular interest as they capture the synergy effects between the megaprojects. A significant negative coefficient on an interaction term indicates a positive synergy effect, suggesting that the proximity to multiple megaprojects simultaneously has a larger positive impact on property prices than the sum of the individual effects. Conversely, a significant positive coefficient indicates a negative synergy effect, suggesting that the combined effect of proximity to multiple megaprojects is smaller than the sum of the individual effects.

3.2. Hedonic Price Model Estimates

Model 1 presents the estimated coefficients and their standard errors for the hedonic price models. Model 1 is the base model, which includes only the structural. Models 2 to 3 progressively add the megaproject distance variables and interaction terms.

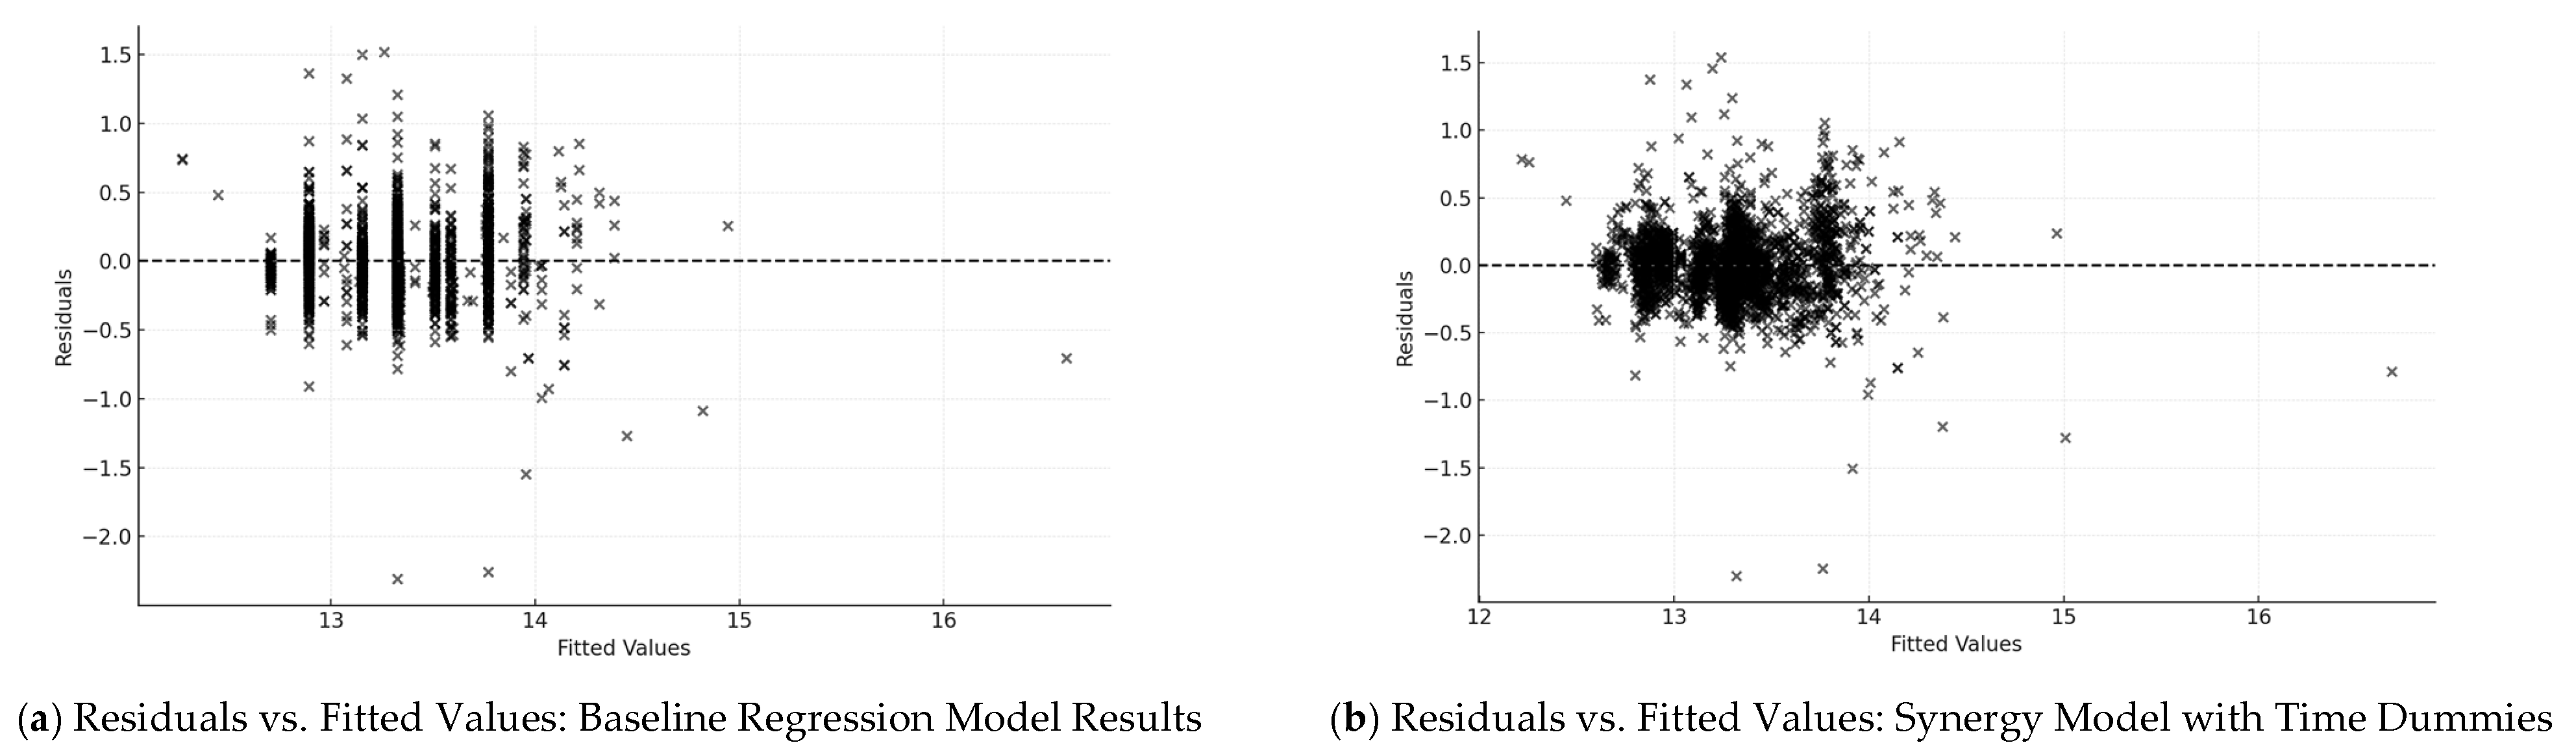
3.2.1. Baseline Model

The baseline model (Table 5) demonstrates strong explanatory power, with an R-squared value of 0.592, indicating that about 59% of the variation in log-transformed property prices is explained by basic structural characteristics. All structural coefficients included are statistically significant at the 1% level. An additional bedroom is associated with a 26.1% increase in property value, while an extra bathroom and car park correspond to 17.2% and 18.5% price premiums, respectively.

3.2.2. Extended Model

Model 2 includes interaction terms and reveals compelling evidence of synergy effects between megaprojects (see Table 6). The introduction of interaction terms further improves the model fit (R2 = 0.616). The interaction between Queen’s Wharf Brisbane and Brisbane Live produces a significant positive coefficient (β = 0.1766, p < 0.01), suggesting complementary effects between these developments. As per our interpretation framework discussed earlier, this suggests a negative synergy (competitive effect) between Queen’s Wharf and Brisbane Live. In other words, while each project individually boosts nearby property values, being close to both does not confer as large a combined benefit as one might expect from adding their separate effects. There may be diminishing returns or competition for attention/economic activity between these two attractions when both are in close proximity to a property.
Conversely, the interaction between QWB and CRR and Brisbane Live and Cross River Rail shows a negative coefficient (β = −0.1106 (p < 0.05) and β = −0.0924 (p < 0.01), respectively). QWB × CRR: The coefficient is a significant negative coefficient. This implies a positive synergy (complementary effect) between Queen’s Wharf and Cross River Rail. Properties that are conveniently near both the waterfront development and the new rail line enjoy a higher premium than the sum of the individual proximity premiums. This could reflect an interaction where improved accessibility (rail) and a new destination (QWB) together enhance the attractiveness of a location more than either would alone.
Brisbane Live × CRR: The coefficient is −0.0924 (p < 0.01), also a significant negative coefficient, indicating a positive synergy between Brisbane Live and Cross River Rail. Similarly, it appears that the combination of the new entertainment precinct and the improved transit infrastructure creates added value for nearby properties beyond their separate contributions.
The synergy model further exposes temporal variations through the annual dummy variables, which capture market dynamics relative to the base year. The coefficients reflect how residential property prices changed, controlling for structural attributes and distance effects. The coefficient for 2019 is specifically negative and significant (β = −0.0725, p < 0.01), indicating that property prices were about 7.3% lower than 2016 after controlling for other factors.
Both models were subjected to diagnostic checks. The Breusch–Pagan test indicates the presence of heteroskedasticity (p < 0.01), addressed through robust standard errors. Figure 2 shows residual vs. fitted values of baseline, extended and synergy.
Variance inflation factors remain below critical thresholds for primary variables, though some interaction terms show elevated values, warranting careful interpretation. Residuals are independent and show no autocorrelation. The Jarque–Bera test rejected the normality of residuals, and the Ramsay RESET showed no evidence of misspecification due to omitted or irrelevant variables.

3.3. Discussion

The empirical findings reveal complex dynamics between concurrent urban megaprojects and residential property values in Brisbane, advancing our understanding of how transformative urban development collectively shapes property markets. Cities consist of a complex web of social factors within the built environment, where price formation arises from individual decisions of buyers and sellers, which are difficult to capture in one model. As expected, the baseline model demonstrated significant influence of structural attributes on property price formation, as supported by [52,53]. Bedrooms, bathrooms, and car parks are foundational determinants of value as they align with buyer preferences and practical needs. We focus our discussion on novel insights regarding megaproject impacts and their interactions. The empirical findings reveal complex dynamics between concurrent urban megaprojects and residential property values in Brisbane, advancing our understanding of how transformative urban development collectively shapes property markets. Several key insights emerge for theory and practice, with important considerations for urban policy. First, the results demonstrate a positive synergy between Queen’s Wharf Brisbane and the Cross River Rail, as well as between Brisbane Live and the Cross River Rail. These complementary effects suggest that mixed-use development and improved transit accessibility can mutually reinforce individual benefits. Previous literature on transportation infrastructure projects has found that proximity to these amenities generally commands higher prices, such as rail transit systems [47,48] and highways [49,50]. This study, however, finds evidence of a synergistic effect beyond individual effects when such projects are developed in concert. This finding extends beyond traditional proximity benefits; it indicates that coordinated planning of land use and transport infrastructure can generate multiplicative benefits for property values. This analysis provides several key insights for theory and practice, while highlighting important considerations for urban policy. Second, the results also indicate a negative synergy between Queen’s Wharf and Brisbane Live. This suggests that when two large-scale flagship projects are located near one another, the incremental benefit of having both is less than what each would contribute independently. This competitive effect may stem from construction-phase disruptions or indicate that transportation infrastructure projects generate different market responses than mixed-use developments. Such findings challenge simplified assumptions about the uniformly positive impacts of urban megaprojects. It might further reflect a saturation effect—there is a limit to how much multiple nearby attractions can keep adding to real estate desirability, perhaps due to competition in changing the spatial gravity of the city or simply diminishing returns, because one major attraction is enough to draw interest to the area. These findings challenge simplified assumptions that all megaprojects invariably and uniformly increase nearby property values. Instead, the impact of one project can depend on what other projects are in its proximity.
Third, the temporal analysis reveals important patterns in market response across project phases. The observed decline in relative property values during peak construction periods, particularly in 2019, suggests that short-term disruptions may temporarily offset long-term benefits. This highlights the importance of considering project timing and sequencing in urban development strategies.
These results have significant implications for urban planning and policy. First, evidence of positive synergies supports the strategic clustering of complementary developments, suggesting that coordinated project timing could maximize property market benefits. Second, the identification of competitive effects indicates the need for careful management of concurrent construction impacts and potential market saturation. For property investors and developers, these findings provide valuable insights into investment timing and location decisions. The varying strength of proximity effects across price segments, particularly in the upper quartile, suggests opportunities for targeted development strategies. However, the temporary negative impacts during the construction phases warrant consideration in investment horizons. We observed that property values relative to the 2016 baseline dipped during the peak construction years around 2018–2020, with the largest decline occurring in 2019. This pattern is consistent with short-term negative externalities from construction activity offsetting longer-term benefits [77]. Moreover, the inclusion of temporal variables mitigates omitted variable bias, ensuring that the results more accurately represent the underlying trends in the housing market.
Methodologically, we found that the integration of interaction terms increased the explanatory power of price formation in residential markets, allowing them to extract a synergy effect among projects. The use of robust standard errors instills confidence that our inferences are not unduly influenced by heteroskedasticity. Standardizing variables proved to be a useful strategy for mitigating multicollinearity, thus preserving the interpretability of interaction term coefficients. Given that interaction terms are essentially products of collinear distance measures, some multicollinearity is inevitable; our approach kept VIFs at acceptable levels for key variables. Future studies might explore alternative specifications to further address this issue, but there is often a trade-off between multicollinearity and the richness of interpretation, which we managed by focusing on standardized terms. Overall, this study’s findings offer insights for a range of stakeholders in the built environment. Policymakers and urban planners should consider the potential synergies. For real estate investors and developers, the findings highlight the potential opportunities and risks associated with investing in residential properties located near concurrent megaprojects. The presence of positive synergy effects suggests that properties located in areas where multiple complementary megaprojects are being developed may offer higher returns than those located near individual megaprojects. However, the evidence of negative synergy effects also warns against the blind pursuit of such opportunities and emphasizes the importance of careful market analysis and due diligence. This explicit quantification directly responds to recent scholarly calls for more sophisticated quantitative methods in analyzing the complex dynamics of large-scale urban interventions [15,19,24].
While our analysis provides valuable insights, it is important to acknowledge limitations that open avenues for further research. First, our focus on Brisbane within a context-specific period means that the findings may not automatically generalize to other urban contexts or timeframes. Constraints in the data collection did not fully capture the post-completion operational phase of the megaprojects; for instance, the Queen’s Wharf opened its doors in August 2024. Future research should examine longer-term data to observe whether the synergy effects persist, intensify, or dissipate once all projects are completed and fully functional. Cross-city comparative studies could also test whether similar synergy or competition patterns occur in different urban settings or in different governance/policy environments. Next, although we included rich controls and a novel interaction structure, the hedonic model could not capture all factors influencing property prices. Our use of year dummies partly controls for macro-trends, but a more granular approach might help isolate project impacts further. Additionally, there may be dynamic effects—for instance, speculation and expectation of megaproject impacts could have caused price changes even before or during the construction ‘announcement effect’ [78], which this model cannot fully disentangle. A difference-in-differences approach or an event study design could be fruitful in future research to more causally pin down the timing of price responses to project announcements and milestones. Moreover, as discussed, spatial autocorrelation is likely present. Spatial econometric models would allow capturing the influence of neighboring observations’ prices on each other. The use of such models, or geographically weighted regression to see if effects vary spatially across the city, could refine the understanding of the spatial extent of megaproject impacts. Finally, multicollinearity among distance variables posed a challenge. We addressed it through variable selection and standardization, but this meant that further projects like Northshore Hamilton or Eagle Street Pier had to be omitted from the model specification. Semi-parametric models like generalized additive models (GAMs) or generalized additive models for location scale and shape (GAMLSS) have been suggested [56,57] to capture such non-linearities and could improve the modeling of price gradients around these projects. Despite these limitations, this study makes a novel contribution by quantifying the synergy effects of concurrent megaprojects in an urban property market. It provides empirical evidence that multiple flagship developments should not be viewed in isolation, as their interactions can significantly alter local economic outcomes.

4. Conclusions

This study investigated the impacts of concurrent urban megaprojects on residential property values using Brisbane’s recent development cycle as a case study and employing a hedonic pricing model with interaction terms to capture synergy effects. Our findings provide strong evidence for the presence of both positive and negative synergy effects among these urban megaprojects, highlighting the complex ways in which these large-scale developments interact in shaping urban property markets. The analysis contributes to the scant literature on megaproject synergies and offers new insights into urban economics in the context of flagship developments. The findings contribute significantly to the broader international discourse on urban development, infrastructure planning, and economic geography.
The empirical results show that coordinated megaprojects can generate added value beyond individual effects (positive synergies), particularly when infrastructure and place-making projects coincide. However, when multiple projects of a similar nature overlap, the incremental benefits can diminish (negative synergies), or temporary negative impacts can arise during simultaneous construction. While we acknowledge several limitations, our research provides empirical support for the idea that multiple flagship projects can produce synergy effects that significantly boost nearby residential property values. We opted for an OLS specification in the present study over alternative econometric methods. Spatial autoregressive (SAR) models, geographically weighted regression (GWR) models, and generalized additive models (GAMs) are becoming increasingly popular for addressing spatial dependencies and nonlinearities; however, they introduce complexity that may obscure the clear and direct interpretation of interaction effects, which is essential in the present course of analysis. Although our large dataset provides adequate statistical power, it also presents computational constraints, in light of the use of more advanced spatial econometric models. On the upside, as discussed, this opens avenues for future research to build upon the findings of this study.
This study has practical and policy implications for a wide array of stakeholders. Policymakers and urban planners should consider the timing, mixture, and spatial arrangement of megaprojects collectively rather than in isolation. Eminently, urban policymakers and planners can draw on these insights to form agglomeration clusters of complementary developments such as pairing transit infrastructure with major mixed-use or entertainment projects to maximize synergy effects. Implementing such strategies in coordination not only ensures immediate benefits through reduced negative externalities but also enhances long-term economic outcomes by effectively leveraging the cumulative attractiveness generated by multiple flagship developments. Consequently, cities worldwide adopting coordinated strategic approaches can better harness megaproject synergies, ensuring sustained socioeconomic value creation for urban communities.
By identifying where synergies are likely, they can aim to design interventions that amplify positive outcomes—for example, aligning a new transit line opening with the launch of a major commercial hub. Conversely, recognizing potential negative interactions can help in devising strategies to mitigate them, such as staggering project timelines or implementing measures to reduce construction nuisances. For investors and the community, the findings highlight that the impacts of urban megaprojects on property markets are multi-dimensional. The true “value” of a megaproject to its surroundings lies not only in its direct benefits but also in how it complements or competes with the city’s other transformative initiatives. While Brisbane provides an empirical context, the results and analytical approach can be transferred to assist strategic decision-making in urban megaproject planning globally. Cities increasingly deploy multiple simultaneous megaprojects as strategic instruments for economic revitalization, urban regeneration, and competitive place-making, extrapolating our findings to have broad applicability beyond Brisbane.
At a universal level, our approach advances theoretical and practical knowledge of megaproject-induced urban dynamics. We demonstrated how interactions among large-scale urban interventions significantly alter property market outcomes. In empirically quantifying synergistic effects, this study offers an analytical framework that can be adapted and applied to diverse urban areas facing simultaneous types of development.

Author Contributions

Conceptualization, M.N. and C.S.; methodology, M.N.; software, M.N.; validation, M.N. and C.S.; formal analysis, M.N. data curation, M.N.; writing—original draft preparation, M.N.; writing—review and editing, C.S.; visualization, M.N.; supervision, C.S.; project administration, C.S.; funding acquisition, C.S. All authors have read and agreed to the published version of the manuscript.

Funding

This research received funding from the Queensland University of Technology PhD Scholarship QUT Centre for Data Science/Queen’s Wharf Brisbane Scholarship.

Data Availability Statement

The property transaction data used in this study were obtained from PriceFinder, a proprietary source, and are not publicly available. Derived data supporting the findings are available from the authors on reasonable request.

Acknowledgments

The authors thank the QUT Centre for Data Science (CDS) for their support and acknowledge the CDS Major Infrastructure Monitoring (MIM) Program.

Conflicts of Interest

The authors declare no conflicts of interest. The funders had no role in the design of the study; in the collection, analyses, or interpretation of data; in the writing of the manuscript; or in the decision to publish the results.

Abbreviations

The following abbreviations are used in this manuscript:
QWBQueen Wharf Brisbane
CRRCross River Rail
CBDCentral Business District
VIFVariance Inflated Factors

Appendix A

Figure A1. Spatial distribution of the number of property transactions in each building in the area.
Buildings 15 01156 g0a1

References

  1. Almeida, R.; Brandão, M.; Torres, R.; Patrício, P.; Amaral, P. An assessment of the impacts of large-scale urban projects on land values: The case of Belo Horizonte, Brazil. Pap. Reg. Sci. 2021, 100, 517–559. [Google Scholar] [CrossRef]
  2. Sankaran, S.; Freeder, D.; Pitsis, A.; Clegg, S.; Drouin, N.; Caron, M.-A. Megaprojects. In Oxford Bibliographies in Urban Studies; Oxford Bibliographies: Oxford, UK, 2021. [Google Scholar] [CrossRef]
  3. Flyvbjerg, B. What you should know about megaprojects and why: An overview. Proj. Manag. J. 2014, 45, 6–19. [Google Scholar] [CrossRef]
  4. Swyngedouw, E.; Moulaert, F.; Rodriguez, A. Neoliberal Urbanization in Europe: Large–Scale Urban Development Projects and the New Urban Policy. Antipode 2002, 34, 542–577. [Google Scholar] [CrossRef]
  5. Hamnett, C.; Shoval, N. Museums as Flagships of Urban Development. In Cities and Visitors; Hoffman, L.M., Fainstein, S.S., Judd, D.R., Eds.; John Wiley & Sons: Oxford, UK, 2003; pp. 219–236. [Google Scholar] [CrossRef]
  6. Shaw, K.; Montana, G. Place-Making in Megaprojects in Melbourne. Urban Policy Res. 2014, 34, 166–189. [Google Scholar] [CrossRef]
  7. Alonso, W. Location and Land Use: Toward a General Theory of Land Rent; Harvard University Press: Cambridge, MA, USA, 1964. [Google Scholar]
  8. Mills, E.S. An aggregative model of resource allocation in a metropolitan area. Am. Econ. Rev. 1967, 57, 197–210. Available online: https://www.jstor.org/stable/1821621 (accessed on 1 March 2024).
  9. Muth, R.F. Cities and Housing: The Spatial Pattern of Urban Residential Land Use; University of Chicago Press: Chicago, IL, USA, 1969. [Google Scholar]
  10. Zegras, C. Metropolitan Governance for Sustainable Mobility. Available online: https://www.researchgate.net/publication/322328623 (accessed on 1 March 2024).
  11. Yuan, H.; Du, W.; Wang, Z.; Song, X. Megaproject Management Research: The Status Quo and Future Directions. Buildings 2021, 11, 567. [Google Scholar] [CrossRef]
  12. Metaxas, T.; Gallego, J.S.; Juarez, L. Sustainable urban development and the role of mega-projects: Experts’ view about Madrid Nuevo Norte Project. J. Infrastruct. Policy Dev. 2003, 7, 2161. [Google Scholar] [CrossRef]
  13. Altshuler, A.; Luberoff, D. Mega-Projects: The Changing Politics of Urban Public Investment; Brookings Institution Press: Washington, DC, USA, 2003; Available online: http://www.jstor.org/stable/10.7864/j.ctvb9384v (accessed on 1 March 2024).
  14. Siemiatycki, M. Riding the wave: Explaining cycles in urban mega-project development. J. Econ. Policy Reform 2013, 16, 160–178. [Google Scholar] [CrossRef]
  15. del Cerro Santamaría, G. Megaprojects, Development and Competitiveness: Building the Infrastructure for Globalization and Neoliberalism. Athens J. Soc. Sci. 2019, 6, 263–290. [Google Scholar] [CrossRef]
  16. Flyvbjerg, B. Introduction—The Iron Law of Megaprojects’. In The Oxford Handbook of Megaproject Management, 1st ed.; Flyvbjerg, B., Ed.; Oxford University Press Inc.: London, UK, 2017; pp. 1–19. [Google Scholar]
  17. Flyvbjerg, B.; Bruzelius, N.; Rothengatter, W. Megaprojects and Risk: An Anatomy of Ambition; Cambridge University Press: Cambridge, UK, 2014; pp. 1–207. [Google Scholar] [CrossRef]
  18. Flyvbjerg, B.; Bester, D.W. The Cost-Benefit Fallacy: Why Cost-Benefit Analysis Is Broken and How to Fix It. J. Benefit-Cost Anal. 2021, 12, 395–419. [Google Scholar] [CrossRef]
  19. Cottafava, D.; Corazza, L.; Shams Esfandabadi, Z.; Torchia, D. Megaprojects from the lens of business and management studies: A systematic literature review. J. Public Aff. 2024, 24, e2937. [Google Scholar] [CrossRef]
  20. Machiels, T.; Compernolle, T.; Coppens, T. Real option applications in megaproject planning: Trends, relevance and research gaps. A literature review. Eur. Plan. Stud. 2020, 29, 446–467. [Google Scholar] [CrossRef]
  21. Platoni, S.; Timpano, F. The Economics of Mega-projects. In Megaproject Management. Springer Briefs in Applied Sciences and Technology; Favari, E., Cantoni, F., Eds.; Springer: Cham, Switzerland, 2020. [Google Scholar] [CrossRef]
  22. Raco, M.; Henderson, S. Flagship Regeneration in a Global City: The Re-making of Paddington Basin. Urban Policy Res. 2009, 27, 301–314. [Google Scholar] [CrossRef]
  23. Senaratne, S.; KC, A.; Rai, S. Stakeholder management challenges and strategies for sustainability issues in megaprojects: Case studies from Australia. Built Environ. Proj. Asset Manag. 2024, 14, 414–431. [Google Scholar] [CrossRef]
  24. Ang, K.C.S.; Sankaran, S.; Drouin, N. Social value from megaprojects and their governance. In Research Handbook on the Governance of Projects; Edward Elgar Publishing: Cheltenham, UK, 2023; Chapter 9; pp. 103–115. [Google Scholar]
  25. Jajamovich, G.; Silvestre, G.; Duque Franco, I. The symbolic dimensions of waterfront regeneration projects: Inter-referencing, legitimating strategies and circulating practices in three Latin American megaprojects. Camb. J. Reg. Econ. Soc. 2025, rsaf001. [Google Scholar] [CrossRef]
  26. Silvestre, G.; Jajamovich, G. The afterlives of urban megaprojects: Grounding policy models and recirculating knowledge through domestic networks. Environ. Plan. C 2022, 40, 1455–1472. [Google Scholar] [CrossRef]
  27. Robinson, J.; Wu, F.; Harrison, P.; Wang, Z.; Todes, A.; Dittgen, R.; Attuyer, K. Beyond variegation: The territorialisation of states, communities and developers in large-scale developments in Johannesburg, Shanghai and London. Urban Stud. 2022, 59, 1715–1740. [Google Scholar] [CrossRef]
  28. Song, Z.; Cao, M.; Han, T.; Hickman, R. Public transport accessibility and housing value uplift: Evidence from the Docklands light railway in London. Case Stud. Transp. Policy 2019, 7, 607–616. [Google Scholar] [CrossRef]
  29. Bozhya-Volya, A.; Tretiakova, E.; Bartov, O. Cities’ sustainable development: Revealing interproject synergies and trade-offs and making them manageable. Public Adm. Issue 2023, 5, 130–146. [Google Scholar]
  30. Klingmann, A. Rescripting Riyadh: How the capital of Saudi Arabia employs urban megaprojects as catalysts to enhance the quality of life within the city’s neighborhoods. J. Place Manag. Dev. 2023, 16, 45–72. [Google Scholar] [CrossRef]
  31. Hübscher, M. Two Megaprojects—One City. Learning between Large-Scale Urban Development Projects on Tenerife, Spain. In Urban Dynamics in the Post-Pandemic Period; Navarro-Jurado, E., Larrubia Vargas, R., Almeida-García, F., Natera Rivas, J.J., Eds.; The Urban Book Series; Springer: Cham, Switzerland, 2023. [Google Scholar] [CrossRef]
  32. Vankova, K.; Nakamura, H.; Witthöft, G. Synergistic Urban Improvement: Case Study of Hikifune Neighbourhood in Tokyo. Environ. Sci. Sustain. Dev. 2018, 3, 75–88. [Google Scholar] [CrossRef]
  33. Chen, Z.; Su, L.; Zhang, C. Research on the Synergy Degree of Aboveground and Underground Space along Urban Rail Transit from the Perspective of Urban Sustainable Development. Sustainability 2016, 8, 934. [Google Scholar] [CrossRef]
  34. Cantarelli, C.C.; Genovese, A. Innovation potential of megaprojects: A systematic literature review. Prod. Plan. Control 2021, 34, 1350–1370. [Google Scholar] [CrossRef]
  35. Ashkanani, S.; Franzoi, R. Gaps in megaproject management system literature: A systematic overview. Eng. Constr. Archit. Manag. 2023, 30, 1300–1318. [Google Scholar] [CrossRef]
  36. Rosen, S. Hedonic prices and implicit markets: Product differentiation in pure competition. J. Political Econ. 1974, 82, 34–55. [Google Scholar]
  37. Malpezzi, S. Hedonic Pricing Models: A Selective and Applied Review. In Housing Economics and Public Policy; O’Sullivan, A., Gibb, K., Eds.; Wiley-Blackwell: Hoboken, NJ, USA, 2002; pp. 67–89. [Google Scholar] [CrossRef]
  38. Sirmans, G.S.; MacDonald, L.; Macpherson, D.A.; Zietz, E.N. The value of housing characteristics: A meta analysis. J. Real Estate Financ. Econ. 2006, 33, 215–240. [Google Scholar] [CrossRef]
  39. Cohen, J.P.; Coughlin, C.C. Spatial Hedonic Models of Airport Noise, Proximity, and Housing Prices. J. Reg. Sci. 2008, 48, 859–878. [Google Scholar] [CrossRef]
  40. Fernández-Avilés, G.; Minguez, R.; Montero, J.-M. Geostatistical air pollution indexes in spatial hedonic models: The case of Madrid, Spain. J. Real Estate Res. 2012, 34, 243–274. [Google Scholar] [CrossRef]
  41. Ridker, R.G.; Henning, J.A. The Determinants of Residential Property Values with Special Reference to Air Pollution. Rev. Econ. Stat. 1967, 49, 246–257. [Google Scholar]
  42. Smith, V.K.; Huang, J.-C. Can Markets Value Air Quality? A Meta-Analysis of Hedonic Property Value Models. J. Polit. Econ. 1995, 103, 209–227. [Google Scholar] [CrossRef]
  43. Haninger, K.; Ma, L.; Timmins, C. The Value of Brownfield Remediation. J. Assoc. Environ. Resour. Econ. 2017, 4, 197–241. [Google Scholar] [CrossRef]
  44. Shehata, W.; Abu Arqoub, M.; Langston, C.; Elkheshien, R.; Sarvimäki, M. From hard bed to luxury home: Impacts of reusing HM Prison Pentridge on property values. J. Hous. Built Environ. 2021, 36, 627–643. [Google Scholar] [CrossRef]
  45. Geniaux, G.; Napoléone, C. Semi-Parametric Tools for Spatial Hedonic Models: An Introduction to Mixed Geographically Weighted Regression and Geoadditive Models. In Hedonic Methods in Housing Markets: Pricing Environmental Amenities and Segregation; Baranzini, A., Ramirez, J., Schaerer, C., Thalmann, P., Eds.; Springer: New York, NY, USA, 2008; pp. 101–127. [Google Scholar] [CrossRef]
  46. Seo, K.; Salon, D.; Kuby, M.; Golub, A. Hedonic modeling of commercial property values: Distance decay from the links and nodes of rail and highway infrastructure. Transportation 2019, 46, 859–882. [Google Scholar] [CrossRef]
  47. Cervero, R.; Duncan, M. Transit’s value-added effects: Light and commuter rail services and commercial land values. Transp. Res. Rec. 2002, 1805, 8–15. [Google Scholar] [CrossRef]
  48. Dubé, J.; Thériault, M.; Des Rosiers, F. Commuter rail accessibility and house values: The case of the Montreal South Shore, Canada, 1992–2009. Transp. Res. Part A Policy Pract. 2013, 54, 49–66. [Google Scholar] [CrossRef]
  49. Chernobai, E.; Reibel, M.; Carney, M. Nonlinear Spatial and Temporal Effects of Highway Construction on House Prices. J. Real Estate Financ. Econ. 2011, 42, 348–370. [Google Scholar] [CrossRef]
  50. Mikelbank, B.A. Spatial analysis of the relationship between housing values and investments in transportation infrastructure. Ann. Reg. Sci. 2004, 38, 705–726. [Google Scholar] [CrossRef]
  51. Cajias, M. Is there room for another hedonic model?: The advantages of the CAMLSS approach in real estate research. J. Eur. Real Estate Res. 2018, 11, 204–245. [Google Scholar] [CrossRef]
  52. Cajias, M.; Ertl, S. Spatial effects and non-linearity in hedonic modeling: Will large data sets change our assumptions? J. Prop. Invest. Financ. 2018, 36, 32–49. [Google Scholar] [CrossRef]
  53. Sirmans, S.; Macpherson, D.; Zietz, E. The Composition of Hedonic Pricing Models. J. Real Estate Lit. 2005, 13, 1–44. [Google Scholar] [CrossRef]
  54. Bourassa, S.; Cantoni, E.; Hoesli, M. Predicting House Prices with Spatial Dependence: A Comparison of Alternative Methods. J. Real Estate Res. 2010, 32, 139–160. [Google Scholar] [CrossRef]
  55. Brunauer, W.A.; Lang, S.; Wechselberger, P.; Bienert, S. Additive hedonic regression models with spatial scaling factors: An application for rents in Vienna. J. Real Estate Financ. Econ. 2010, 41, 390–411. [Google Scholar] [CrossRef]
  56. Mason, C.; Quigley, J.M. Non-parametric hedonic house prices. Hous. Stud. 1996, 11, 373–386. [Google Scholar] [CrossRef]
  57. Pace, K. Appraisal Using Generalized Additive Models. J. Real Estate Res. 1998, 15, 77–99. [Google Scholar] [CrossRef]
  58. DBC. Queens Wharf Brisbane. 2024. Available online: https://queenswharfbrisbane.com.au/ (accessed on 25 February 2024).
  59. Building Queensland. Cross River Rail Business Case. 2017. Available online: https://cabinet.qld.gov.au/documents/2017/Aug/CRRBusCase/Attachments/BusinessCase.pdf (accessed on 25 February 2024).
  60. Cross River Rail Delivery Authority. 2024. Available online: https://crossriverrail.qld.gov.au/ (accessed on 25 February 2024).
  61. GlobalData Plc. Do TMR—Brisbane Cross River Rail—Queensland—Project Profile; GlobalData Plc: London, UK, 2018. [Google Scholar]
  62. GlobalData Plc. AEG—Brisbane Live Entertainment Precint—Queensland—Project Profile; GlobalData Plc: London, UK, 2018. [Google Scholar]
  63. Brisbane Development. 2024. Available online: https://brisbanedevelopment.com/brisbane-live/ (accessed on 25 February 2024).
  64. GlobalData Plc. QG—Queen’s Wharf Redevelopment—Queensland—Construction Project Profile; GlobalData Plc: London, UK, 2016. [Google Scholar]
  65. Infrastructure Partnerships Australia. Brisbane Live. 2020. Available online: https://infrastructurepipeline.org/project/brisbane-live (accessed on 25 February 2024).
  66. Infrastructure Partnerships Australia. Cross River Rail—Tunnel, Stations and Development (TSD) PPP. 2020. Available online: https://infrastructurepipeline.org/project/cross-river-rail-tunnel-stations-and-development-tsd-ppp (accessed on 25 February 2024).
  67. Australian Property Institute (API). Defintions. 2024. Available online: https://www.api.org.au/standards/definitions/ (accessed on 25 February 2024).
  68. Oertel, C.; Willwersch, J.; Cajias, M. Do cross-border investors benchmark commercial real estate markets? J. Eur. Real Estate Res. 2020, 13, 83–103. [Google Scholar] [CrossRef]
  69. Zurada, J.; Levitan, A.; Guan, J. Non-Conventional Approaches to Property Value Assessment. J. Appl. Bus. Res. 2006, 22, 1–14. [Google Scholar] [CrossRef]
  70. Can, A. Specification and estimation of hedonic housing price models. Reg. Sci. Urban Econ. 1992, 22, 453–474. [Google Scholar] [CrossRef]
  71. Anselin, L. Spatial Econometrics: Methods and Models; Springer Science & Business Media: Berlin, Germany, 1998. [Google Scholar] [CrossRef]
  72. Basu, S.; Thibodeau, T.G. Analysis of Spatial Autocorrelation in House Prices. J. Real Estate Financ. Econ. 1998, 17, 61–85. [Google Scholar] [CrossRef]
  73. Bourassa, S.C.; Cantoni, E.; Hoesli, M. Spatial Dependence, Housing Submarkets, and House Price Prediction. J. Real Estate Financ. Econ. 2007, 35, 143–160. [Google Scholar] [CrossRef]
  74. Pace, R.K.; Gilley, O.W. Using the Spatial Configuration of the Data to Improve Estimation. J. Real Estate Financ. Econ. 1997, 14, 333–340. [Google Scholar] [CrossRef]
  75. Brunsdon, C.; Fotheringham, A.S.; Charlton, M. Geographically weighted summary statistics—A framework for localised exploratory data analysis. Comput. Environ. Urban Syst. 2002, 26, 501–524. [Google Scholar] [CrossRef]
  76. Brunsdon, C.; Fotheringham, A.S.; Charlton, M.E. Geographically Weighted Regression: A Method for Exploring Spatial Nonstationarity. Geogr. Anal. 1996, 28, 281–298. [Google Scholar] [CrossRef]
  77. Wilhelmsson, M. Evaluating the price effects of multifamily and single-family housing construction on surrounding single-family homes in Stockholm: A difference-in-difference analysis. Int. J. Hous. Mark. Anal. 2023, 16, 103–126. [Google Scholar] [CrossRef]
  78. Agostini, C.A.; Palmucci, G.A. The anticipated capitalisation effect of a new metro line on housing prices. Fisc. Stud. 2008, 29, 233–256. [Google Scholar] [CrossRef]
Figure 1. Distribution of sales price by postcode.
Buildings 15 01156 g001
Figure 2. Residual vs. fitted values: (a) Baseline regression model results; (b) synergy model with time dummies.
Buildings 15 01156 g002
Table 1. Project timeline and key milestones.
Project StageBrisbane LiveCross River RailQueen’s Wharf Brisbane
ProspectiveMay 2018: Business caseApr 2016: Authority announced2012–2014: Initial
Detailed PlanningJune 2018: USD 5M business caseJune 2016: USD 850M funding, Aug 2017: Business case2015–2016: Design
AnnouncedFeb 2023: USD 2.5B funding, Mar 2024: Site changeSept 2017: EOIs opened2017: Plan approved
Under ProcurementDec 2019: Market soundingApr 2019: Contract, July 2019: Financial close2018–2020: Construction
Under Delivery2027: Construction startJan 2020–2025: Construction2021–2024: Main works
Operational2030: Completion2026: Operations start2024–2030 staged
Sources: Authors adapted from [58,59,61,62,64,65,66].
Table 2. Variable description.
VariableDescriptionData Source
Sales PriceThe transaction price of the residential property in Australian dollars (AUD)PriceFinder
Sales DateDate of when the transaction has occurredPriceFinder
BedroomsThe number of bedrooms in the propertyPriceFinder
BathroomsThe number of bathrooms in the propertyPriceFinder
Car ParksThe number of car spaces associated with the propertyPriceFinder
Longitudinal and Latitudinal CoordinatesThe geographic coordinates of the propertyGoogle Maps API
ScopeKey milestonesWebsite
DistanceEuclidian distance to megaprojectFeature Engineered
Table 3. Descriptive statistics of property transactions in Brisbane, 2016-2022.
VariableNMeanMedianSDMinMAX
ContinuousSales Price [AUD]2859645,527555,000361,98960,8008,000,000
Latitude2859
Longitude2859
DiscreteRooms28591.9320.6607
Bathrooms28591.6620.5307
Carparks28591.210.57010
Dummies
[1 = Yes, 0 = No]
2016 [AUD]529634,111573,740407,031100,0008,000,000
2017 [AUD]403655,768555,000348,839293,0002,750,000
2018 [AUD]443652,726560,000354,976260,0004,000,000
2019 [AUD]421663,527560,000360,477160,0003,500,000
2020 [AUD]395614,021540,000318,676200,0003,000,000
2021 [AUD]668650,898545,000361,44560,8002,900,000
DistancesQWB centroid [km]28591.731.441.230.246.27
Cross River Rail centroid [km]28591.561.131.220.065.58
Brisbane Live [km]28591.691.161.190.205.86
SynergiesQWB centroid [km] × Cross River Rail centroid [km]2859
QWB centroid [km] × Brisbane Live centroid [km]2859
Brisbane Live centroid [km] × Cross River Rail centroid [km]2859
Table 4. Correlation matrix of key variables.
Correlation Matrix 1Ln_Sales PriceBedroomsBathroomsCar ParksStd Distance to QWB kmStd Distance to Brisbane Live kmStd Distance to Cross River Rail
Ln_Sales Price10.0000 ***0.0000 ***0.0000 ***0.11340.17780.0962 *
Bedrooms0.721710.0000 ***0.0000 ***0.0157 **0.0021 ***0.8288
Bathrooms0.61620.714810.0000 ***0.0717 *0.0252 **0.0137 **
Car Parks0.55510.5130.328210.0000 ***0.0000 ***0.0000 ***
Std Distance to QWB km0.02960.04520.03370.153810.0000 ***0.0000 ***
Std Distance to Brisbane Live km−0.0252−0.0575−0.04180.11150.91410.0000 ***
Std Distance to Cross River Rail0.0311−0.004−0.04610.19440.75650.79921
1 Note: This table reports Pearson correlation coefficients. Values below the diagonal represent correlation coefficients, with corresponding p-values above the diagonal; *, **, and *** indicate significance at the 10%, 5%, and 1% levels, respectively.
Table 5. Regression output baseline model.
Dependent VariableLn(Sales Price (AUD))
Independent Variables
Constant12.2724 (0.021)
Bedroom0.2606 ***
Bathrooms0.1723 ***
Carparks0.1853 ***
Observations2859
R20.592
Adjusted R20.592
F Statistic841.7 *** (df = 3; 2855)
Note: *** p < 0.01.
Table 6. Regression output model 2 with interaction terms.
Dependent VariableLn(Sales Price (AUD))
Independent Variables
Constant12.3002(0.019) ***
Bedroom0.2717 (0.012) ***
Bathrooms0.1628 (0.013) ***
Carparks0.1947 (0.010) ***
Distance to QWB−0.0606 (0.018) ***
Distance to Northshore Hamilton0.1463 (0.022) ***
Distance to Brisbane Live−0.0728 (0.016) ***
QWB × Brisbane Live0.1766 (0.021) ***
QWB × Cross River Rail−0.1106 (0.035) **
Brisbane Live × Cross River Rail−0.0924 (0.023) ***
Year 2016--
Year 2017−0.0269 (0.017)
Year 2018−0.0410 (0.016) **
Year 2019−0.0725(0.017) ***
Year 2020−0.0471 (0.017) **
Year 2021−0.0201 (0.015)
Observations2859
R20.616
Adjusted R20.614
F Statistic326.3 *** (df = 14; 2844)
Note: ** p < 0.05; *** p < 0.01.
Disclaimer/Publisher’s Note: The statements, opinions and data contained in all publications are solely those of the individual author(s) and contributor(s) and not of MDPI and/or the editor(s). MDPI and/or the editor(s) disclaim responsibility for any injury to people or property resulting from any ideas, methods, instructions or products referred to in the content.

