Article

An Automatic Registration System Based on Augmented Reality to Enhance Civil Infrastructure Inspections †

Department of Construction, Civil Engineering and Architecture (DICEA), Construction Division, Faculty of Engineering, Università Politecnica delle Marche, 60121 Ancona, Italy
*
Author to whom correspondence should be addressed.
This paper is an extended version of our previous work titled “Enhanced civil infrastructure inspections using Augmented Reality: An automatic registration system”, which was presented at the 24th International Conference on Construction Applications of Virtual Reality (CONVR 2024), Sydney, Australia, 4–6 November 2024.
Buildings 2025, 15(7), 1146; https://doi.org/10.3390/buildings15071146
Submission received: 5 February 2025 / Revised: 28 March 2025 / Accepted: 31 March 2025 / Published: 31 March 2025

Abstract

Manual geometric and semantic alignment of inspection data with existing digital models (field-to-model data registration) and on-site access to relevant information (model-to-field data registration) represent cumbersome procedures that cause significant loss of information and fragmentation, hindering the efficiency of civil infrastructure inspections. To address the bidirectional registration challenge, this study introduces a high-accuracy automatic registration method and system based on Augmented Reality (AR) that streamlines data exchange between the field and a knowledge graph-based Digital Twin (DT) platform for infrastructure management, and vice versa. A centimeter-level 6-DoF pose estimation of the AR device in large-scale, open unprepared environments is achieved by implementing a hybrid approach based on Real-Time Kinematic and Visual Inertial Odometry to cope with urban-canyon scenarios. For this purpose, a low-cost and non-invasive RTK receiver was prototyped and firmly attached to an AR device (i.e., Microsoft HoloLens 2). Multiple filters and latency compensation techniques were implemented to enhance registration accuracy. The system was tested in a real-world scenario involving the inspection of a highway viaduct. Throughout the use case inspection, the system seamlessly and automatically provided field operators with on-field access to existing DT information (i.e., open BIM models) such as georeferenced holograms and facilitated the enrichment of the asset’s DT through the automatic registration of inspection data (i.e., images) with the open BIM models included in the DT. This study contributes to DT-based civil infrastructure management by establishing a bidirectional and seamless integration between virtual and physical entities.

1. Introduction

Road transportation infrastructure, encompassing roads, bridges, and tunnels, is fundamental to the functioning of contemporary societies. In Italy, road networks account for 88% of freight transportation and 94% of passenger mobility [1,2]. However, a significant portion of this infrastructure is aging, requiring urgent and robust maintenance strategies [3]. Recent reports highlight substantial delays in Operation and Maintenance (O&M) activities, emphasizing the need for innovative solutions to improve asset quality and operational performance. Italy faces considerable challenges in this domain, with its road infrastructure ranking 20th in Europe and 53rd worldwide in terms of quality [2,4]. In recent years, 70% of the national infrastructure investment was allocated to road infrastructure maintenance [2]. Despite these investments, inefficiencies in planning, resource allocation, and execution contributed to 30% to 50% of total expenditure losses [5].
To ensure the safety of road infrastructure assets including pavements, bridges, and tunnels, expert visual inspections are still indispensable [6]. These inspections are crucial for identifying damage, deterioration, and other potential hazards, yet they are predominantly manual processes. The reliance on manual methods contributes significantly to the inefficiencies mentioned above. Traditional practices for the geometric and semantic alignment (hereafter referred to as registration) of newly captured data (e.g., damage surveys) with pre-existing records often result in fragmented and inconsistent information. The use of paper-based documentation and manual data entry exacerbates information loss and discrepancies, ultimately impairing the effectiveness of subsequent maintenance and repair efforts. Furthermore, the fragmentation causes difficulties in retrieving and accessing the data required in the field. These inefficiencies become more pronounced in large-scale infrastructures, where reliable and accessible data are vital for effective management and decision making.
Although robotic systems have emerged as potential aids for human inspections [7,8,9,10], they are not yet capable of fully replacing human expertise. Their adoption is limited by regulatory constraints and the low level of maturity and applicability of these technologies in real-world scenarios. While robots excel in repetitive tasks and accessing hazardous areas, they lack the cognitive capabilities required for complex decision making. Studies reveal that although robots enhance data collection, their effectiveness is constrained by their inability to interpret contextual information and to adapt to unforeseen circumstances.
Recent advancements have also focused on the development of Digital Twins (DTs), which are increasingly used for infrastructure inspection, monitoring, and maintenance [11]. By integrating advanced tools, DTs are revolutionizing O&M processes. DTs are typically grounded in Building Information Modeling (BIM) [12]. An open BIM model is a structured representation (data model) of asset data in open format and is therefore one of the foundational components of an infrastructure DT [12,13,14]. BIM data may represent the past state of the asset [15], but can also represent either its current state (when updated with new inspection and monitoring data—also in real time) [16,17] or future states (e.g., design data for maintenance and restoration of existing assets) [18]. The BIM data model can be linked using various methods, among which those based on Semantic Web and Linked Data technologies [19], to other sources of information, data, procedures, AI, etc., also with real-time capabilities (e.g., integrating IoT sensors as real-time data sources) [20,21]. This connection would enable automatic updating of the current status of the asset, real-time analysis, and near-future predictions of likely future states. The integration of these services creates a digital replica of the real asset, which is a DT by definition [22,23]. Moreover, given the need for human-centric processes in the construction industry, DTs can support user engagement by incorporating immersive technologies such as Augmented Reality (AR) [24,25,26]. This would lead to a deeper understanding of asset conditions and facilitates better maintenance decisions.
AR enhances visualization and interaction by overlaying digital information on the physical environment, empowering inspectors with enriched contextual awareness. Numerous studies have explored the potential of AR in the context of civil infrastructures [27,28,29]. Nevertheless, significant challenges remain in developing automatic AR spatial registration systems for large-scale, unprepared outdoor scenarios. AR spatial registration is the process of computing the 6-DoF pose of an AR device to correctly align holograms to their real counterpart [26]. In this paper, the AR spatial registration is also referred to as AR registration. Most existing AR registration methods rely on physical markers, beacons, QR codes, or similar infrastructure, limiting their application in dynamic and extensive environments [30]. While markerless approaches, such as Global Navigation Satellite System (GNSS)-based AR registration, offer greater flexibility, they are hindered by issues like urban-canyon environments, where GNSS signals are obstructed. To overcome these limitations, hybrid approaches have emerged, combining GNSS data with visual and/or inertial data, respectively, acquired from cameras and Inertial Measurement Units (IMUs).
To overcome manual procedures for updating digital models with new geometric and semantic information, and accessing relevant information directly on site, this paper introduces a high-accuracy, automatic registration system based on Augmented Reality. AR registration facilitates seamless on-site DT model enrichment and information access in large-scale, unprepared open scenarios. The system takes into consideration the presence of urban-canyon scenarios. We have therefore followed a hybrid approach based on the combination of Real-Time Kinematic (RTK) GNSS and Visual–Inertial Odometry (VIO) tracking systems for the seamless geographic 6-DoF pose estimation of an AR device. Integrated with a knowledge graph-based DT platform for infrastructure management, the proposed system has a twofold objective:
  • Automatic registration of newly captured data using the AR device (i.e., images) with existing open BIM models within a DT’s georeferenced scene;
  • High-accuracy, on-site AR visualization of existing DT information (i.e., BIM model), without requiring any manual procedures.
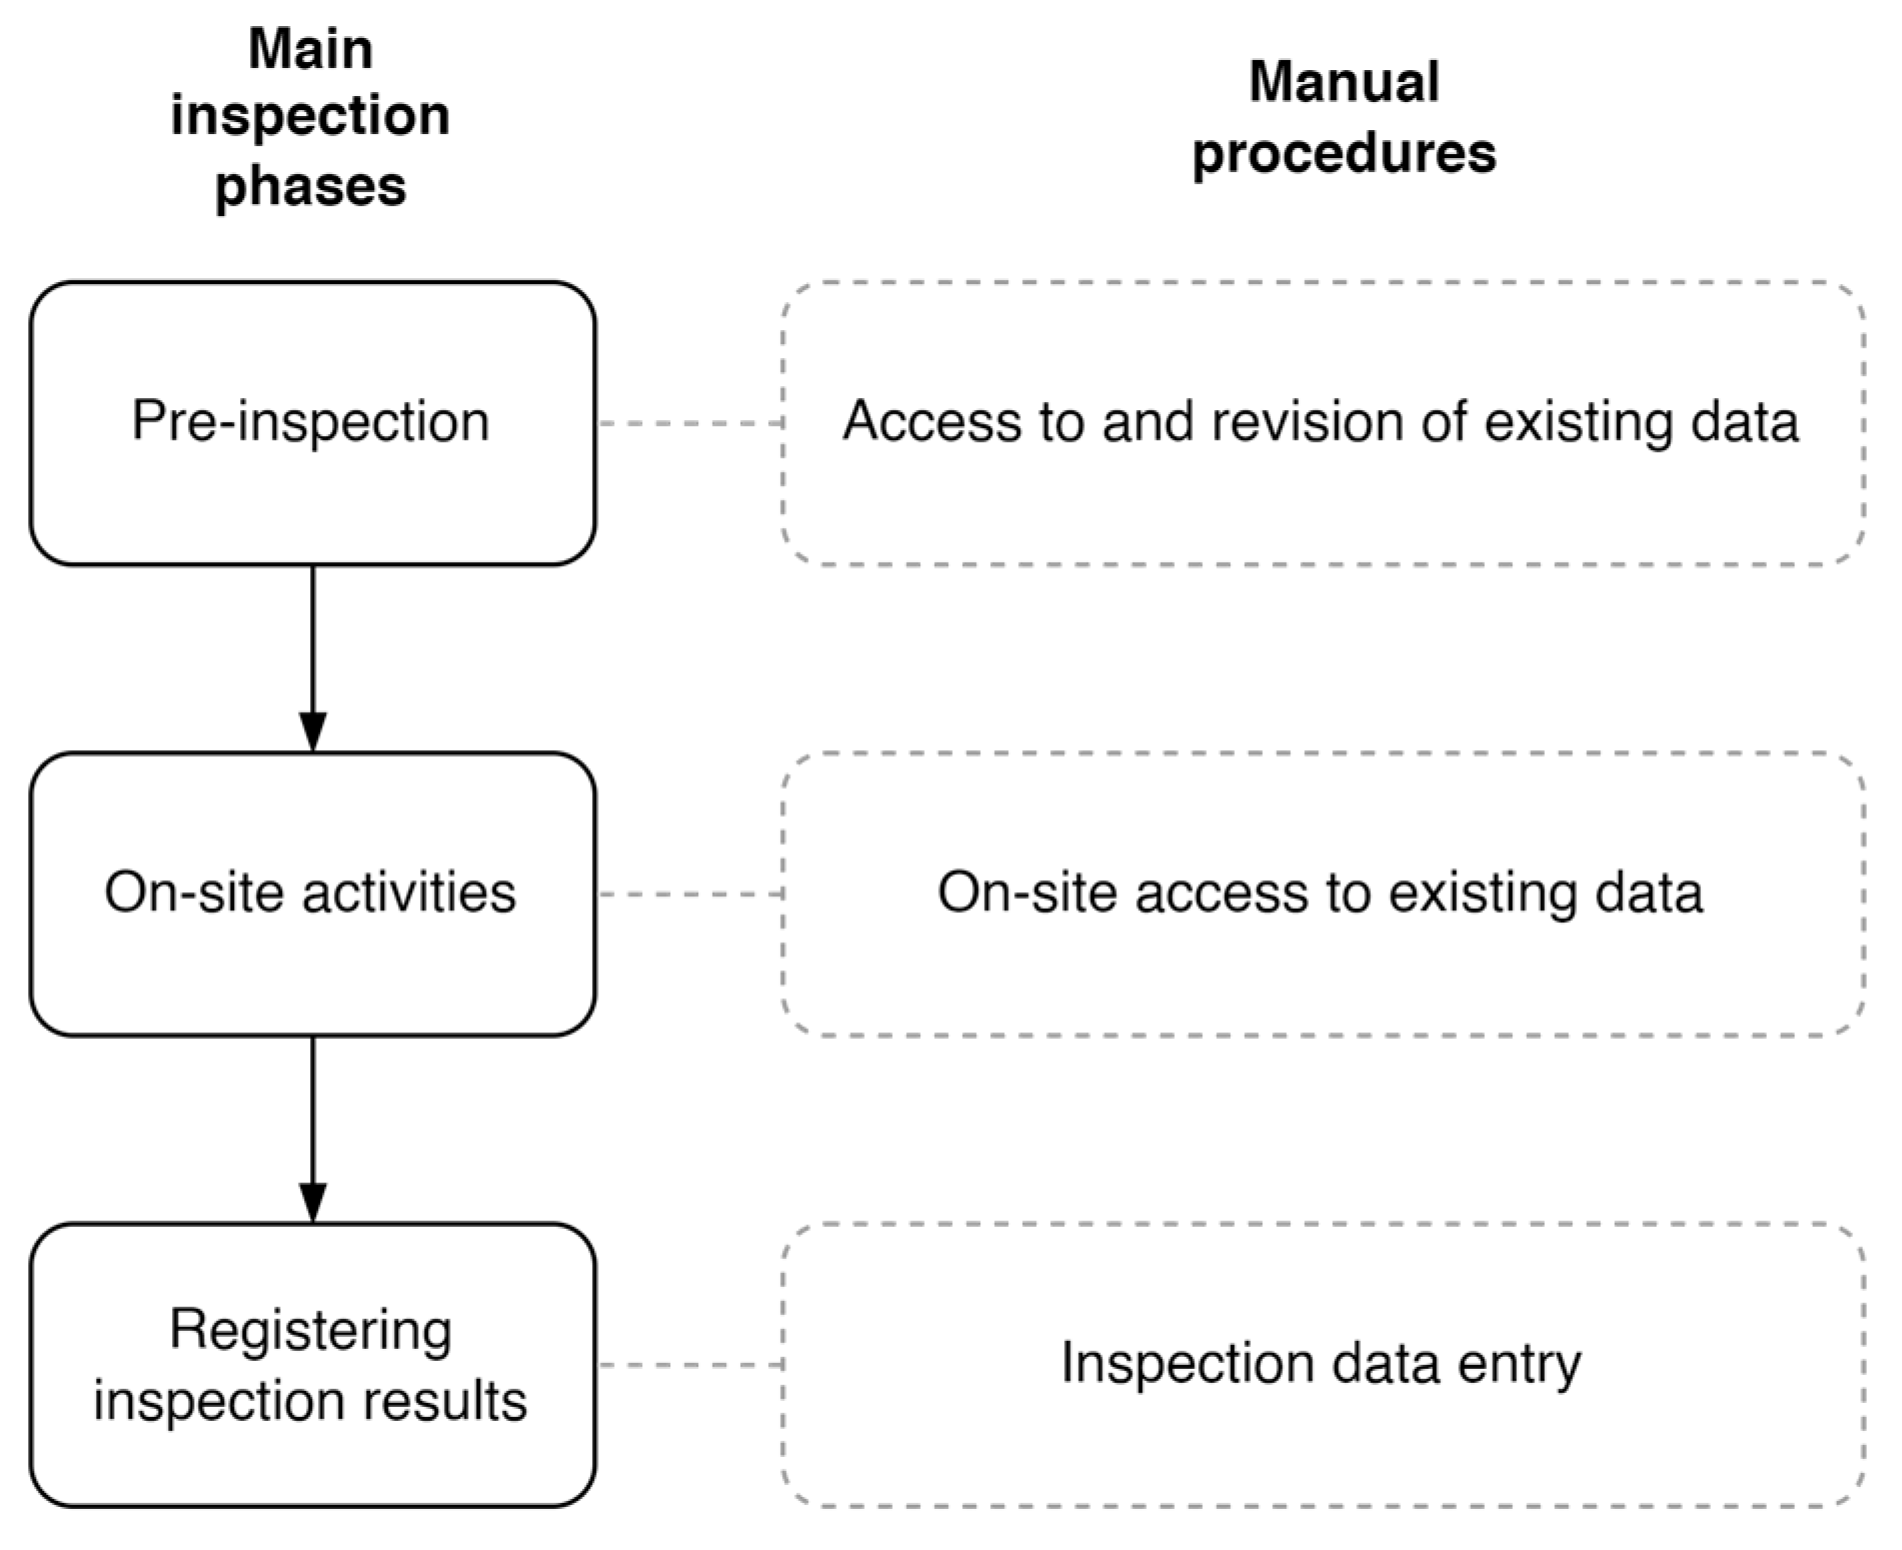
This paper is an extension of the work presented at the 24th International Conference on Construction Applications of Virtual Reality (CONVR 2024) [31].

2. Background

The inspections of road infrastructure predominantly rely on manual procedures. These inspections typically involve the collection of on-site data through three primary types of surveys—geometric, structural, and deterioration surveys—each aimed at assessing specific aspects of the asset and its surrounding environment. Geometric surveys, which are crucial for documenting the dimensions and spatial characteristics of infrastructure, use various technologies depending on availability. Methods range from traditional topographical and photogrammetric surveys to modern techniques such as drone-based and laser-scanner surveys. The latter, often combined with photogrammetry, is the most widely adopted due to its high accuracy, efficiency, and versatility. Furthermore, data collected through these methods frequently serve as a foundation for generating BIM models [32]. Structural surveys focus on assessing the structural condition of an asset. They usually start by identifying the geometry of structural components, evaluating their material properties, and detecting potential health issues through either destructive or non-destructive testing. Deterioration surveys, conducted through visual inspections, aim to document damage and degradation phenomena that develop over time on specific infrastructure elements. Typically, damage information is recorded on standardized forms issued by relevant agencies and authorities, with guidelines tailored to the material and type of infrastructure component being assessed [6]. However, data collection often relies on handwritten reports, with photographic documentation stored in local folders and categorized using spreadsheets. This approach complicates the retrieval and accessibility of data during future inspections, maintenance planning, and decision-making processes (Figure 1).
To facilitate data collection and access, several Asset Management Systems (AMSs) have been introduced to the market. AMSs are systems that hold information about a specific asset, and allow users to analyze data to make maintenance decisions [33,34]. Central to asset management is the comprehensive inventory and documentation of all assets. These systems leverage data collection processes, predictive models, and predefined rules to identify intervention options, evaluate projects, and formulate policies. Each road authority has its own way of defining the data requirement within an AMS to suit their needs. Usually, each asset type has its own AMS and does not allow data integration [35]. The inventory module captures administrative and technical asset data, including asset IDs, geolocation, and types, supplemented by optional elements such as visual documentation through images and/or videos. Subsequently, the inspection module enriches asset data with findings from inspections, based on reports and attached photographic documentation. Condition deterioration forecasting forms the basis for estimating future maintenance needs [36,37]. AMSs therefore consist in several systems which are poorly connected. Furthermore, the semantics of these data is not consistent, thereby limiting data integration. This poses challenges in analyzing all the relevant available data and making decisions. Some research projects tackled this inconsistency by establishing reference databases that import the unchanged source data and then transform them to be used in an AMS [19]. To the best of their ability, AMSs include several manual procedures. With regard to the specific aspect of inspections, AMSs allow the collection of data but with the purpose of creating inspection reports in unstructured and therefore unquestionable formats, limiting information accessibility and hindering a holistic and well-informed view of the state of the assets. This could lead to suboptimal or even flawed decisions resulting in serious inefficiencies and serious safety risks to road users.
Semantic Web technologies, including Linked Data, have emerged as a potential solution to the data consistency and connection challenges by enabling the integration of heterogeneous data through web-based data linking capabilities [38]. These approaches have facilitated the creation of DTs that use knowledge graphs for representing and integrating diverse data sources, datasets and data types [39,40]. In the large set of data types that can be represented as knowledge graphs, the Industry Foundation Classes (IFCs) structure is among the most common in the context of civil infrastructure [41]. Open BIM models (i.e., IFC models) can be converted into knowledge graphs by translating the semantics of the IFC structure into a graph [42]. Ontological structuring within infrastructure DTs allows for the querying, updating, and retrieval of information, overcoming the limitations of AMSs [43]. Nonetheless, there remains a strong need to rely on manual procedures, limiting the full application of such technologies in practice [39,44].
AR technologies have recently gained attention for their potential to enhance civil infrastructure inspections by enabling on-field interaction with digital models [10,27,28,29]. While current AR systems support some level of information updating and interaction, they primarily target single-model or single-project applications, with low scalability and limited integration with DT platforms [45,46,47]. Furthermore, many AR systems rely on markers or supporting infrastructure, such as beacons or QR codes, for AR spatial registration. This dependence significantly restricts their usability in large-scale, open, and dynamic environments [25,48]. Although markerless AR registration approaches offer a potential alternative, they often struggle to perform effectively in open scenarios, with the exception of GNSS-based systems [26]. However, GNSS systems face challenges in urban-canyon environments, where GNSS signal reception is weak or obstructed by surrounding structures—a common scenario during the inspection of bridge substructures To overcome these limitations, hybrid AR registration methods combining GNSS and visual–inertial tracking technologies have been proposed in various fields. These hybrid methods can effectively solve the positioning problem in complex and mixed environments enabling a seamless 6-DoF pose estimation [49,50]. Hybrid methods have been applied for visualizing underground pipelines and subsurface data [51,52,53], urban navigation [54,55], agricultural vehicle guidance [56], aligning smaller maps generated by Simultaneous Localization and Mapping (SLAM) systems [57], and autonomous vehicles [58].
To sum up, the main gap found, which contributes substantially to the O&M inefficiencies, lies in the reliance on manual procedures for two critical activities:
  • Updating digital models with new geometric and semantic information, and
  • Accessing relevant information directly in the field.
Even with the implementation of AMS, data fragmentation and unstructured information persist, leading to further inefficient processes. While DTs and AR technologies offer promising opportunities, existing systems are tailored for specific, indicated scenarios. These ad hoc solutions lack scalability and adaptability for real-world infrastructure management contexts. Commercial solutions such as Trimble Site Vision (v2024) [59], or vGis (v2024) [57] either lack the necessary accuracy, cannot cope with urban-canyon scenarios or are inaccessible to consumers due to their high costs. Moreover, the existing solutions do not enable the collection of multimodal structured open data, which hinders the ability to perform large-scale, multi-model queries.

3. Research Methodology

To address the challenge of automatic data registration procedures for civil infrastructure inspections, in this study we developed a registration system based on AR. The system exploits a hybrid 6-DoF pose estimation methodology that combines RTK GNSS and Visual–Inertial Odometry (VIO) tracking systems. The geographic and seamless AR registration facilitates data exchange between on-site activities and a knowledge graph-based DT platform for infrastructure management, and vice versa. Specifically, the methodology focuses on developing the following data registration procedures suitable for large-scale, unprepared open scenarios (Figure 2):
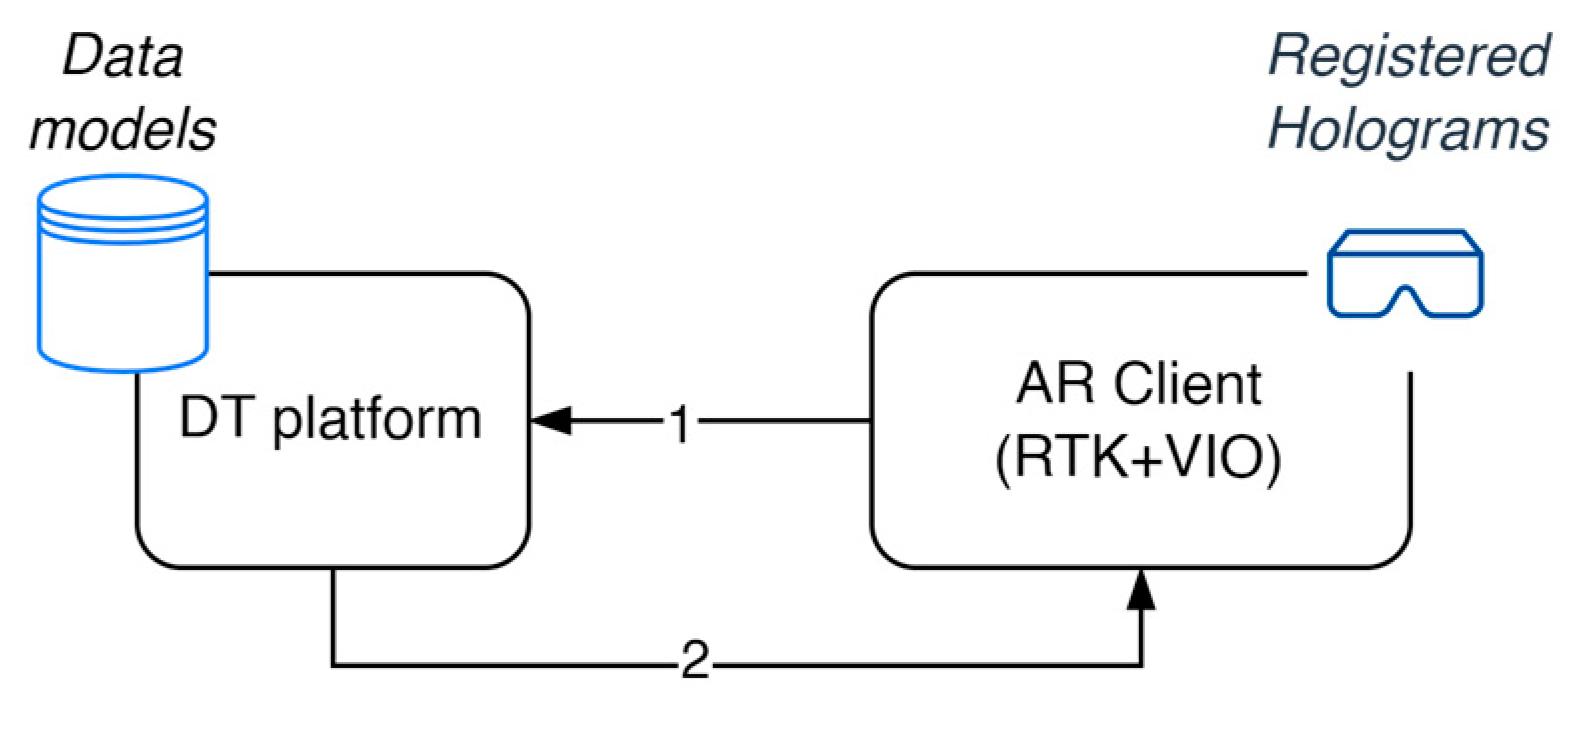
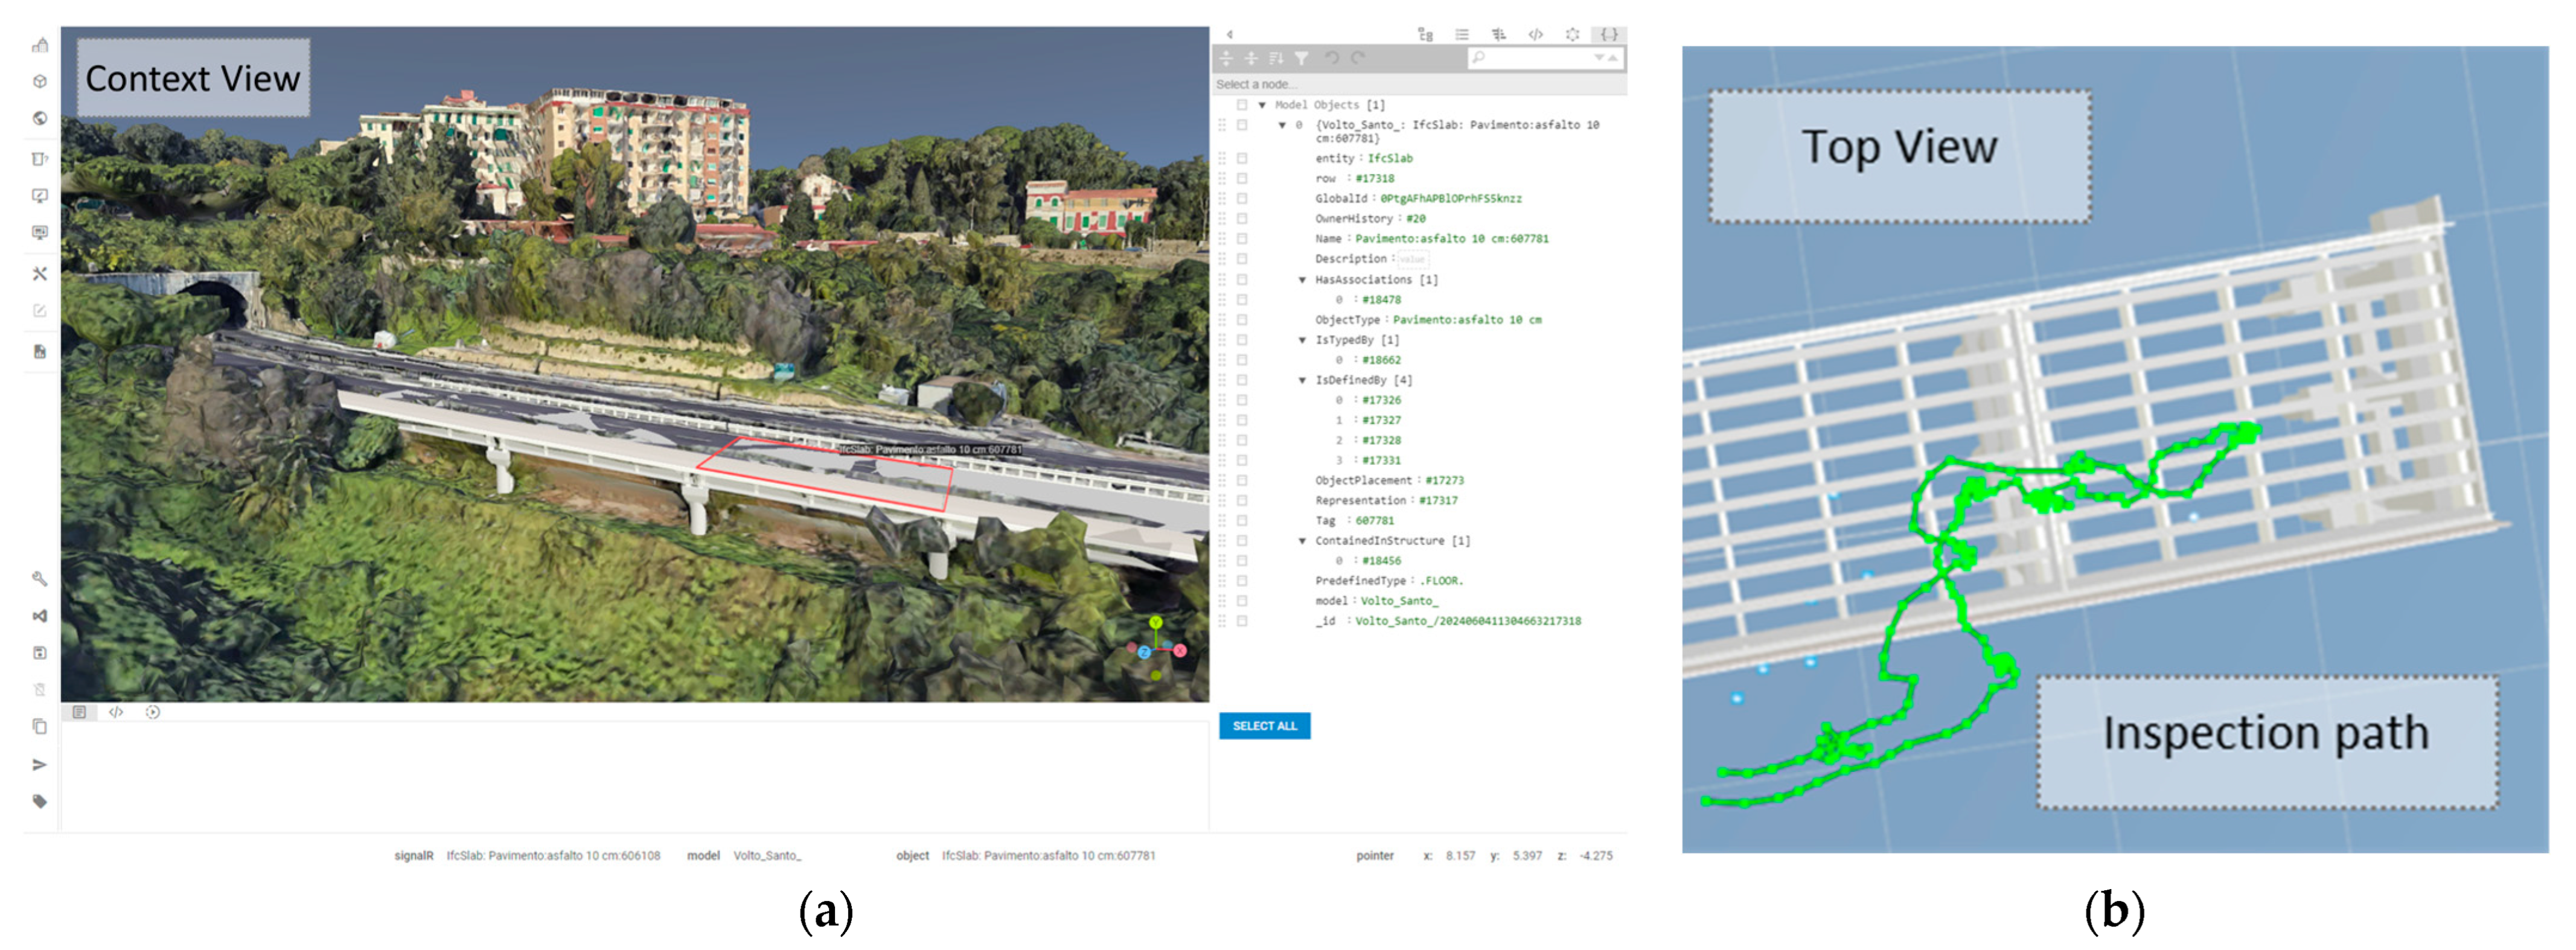
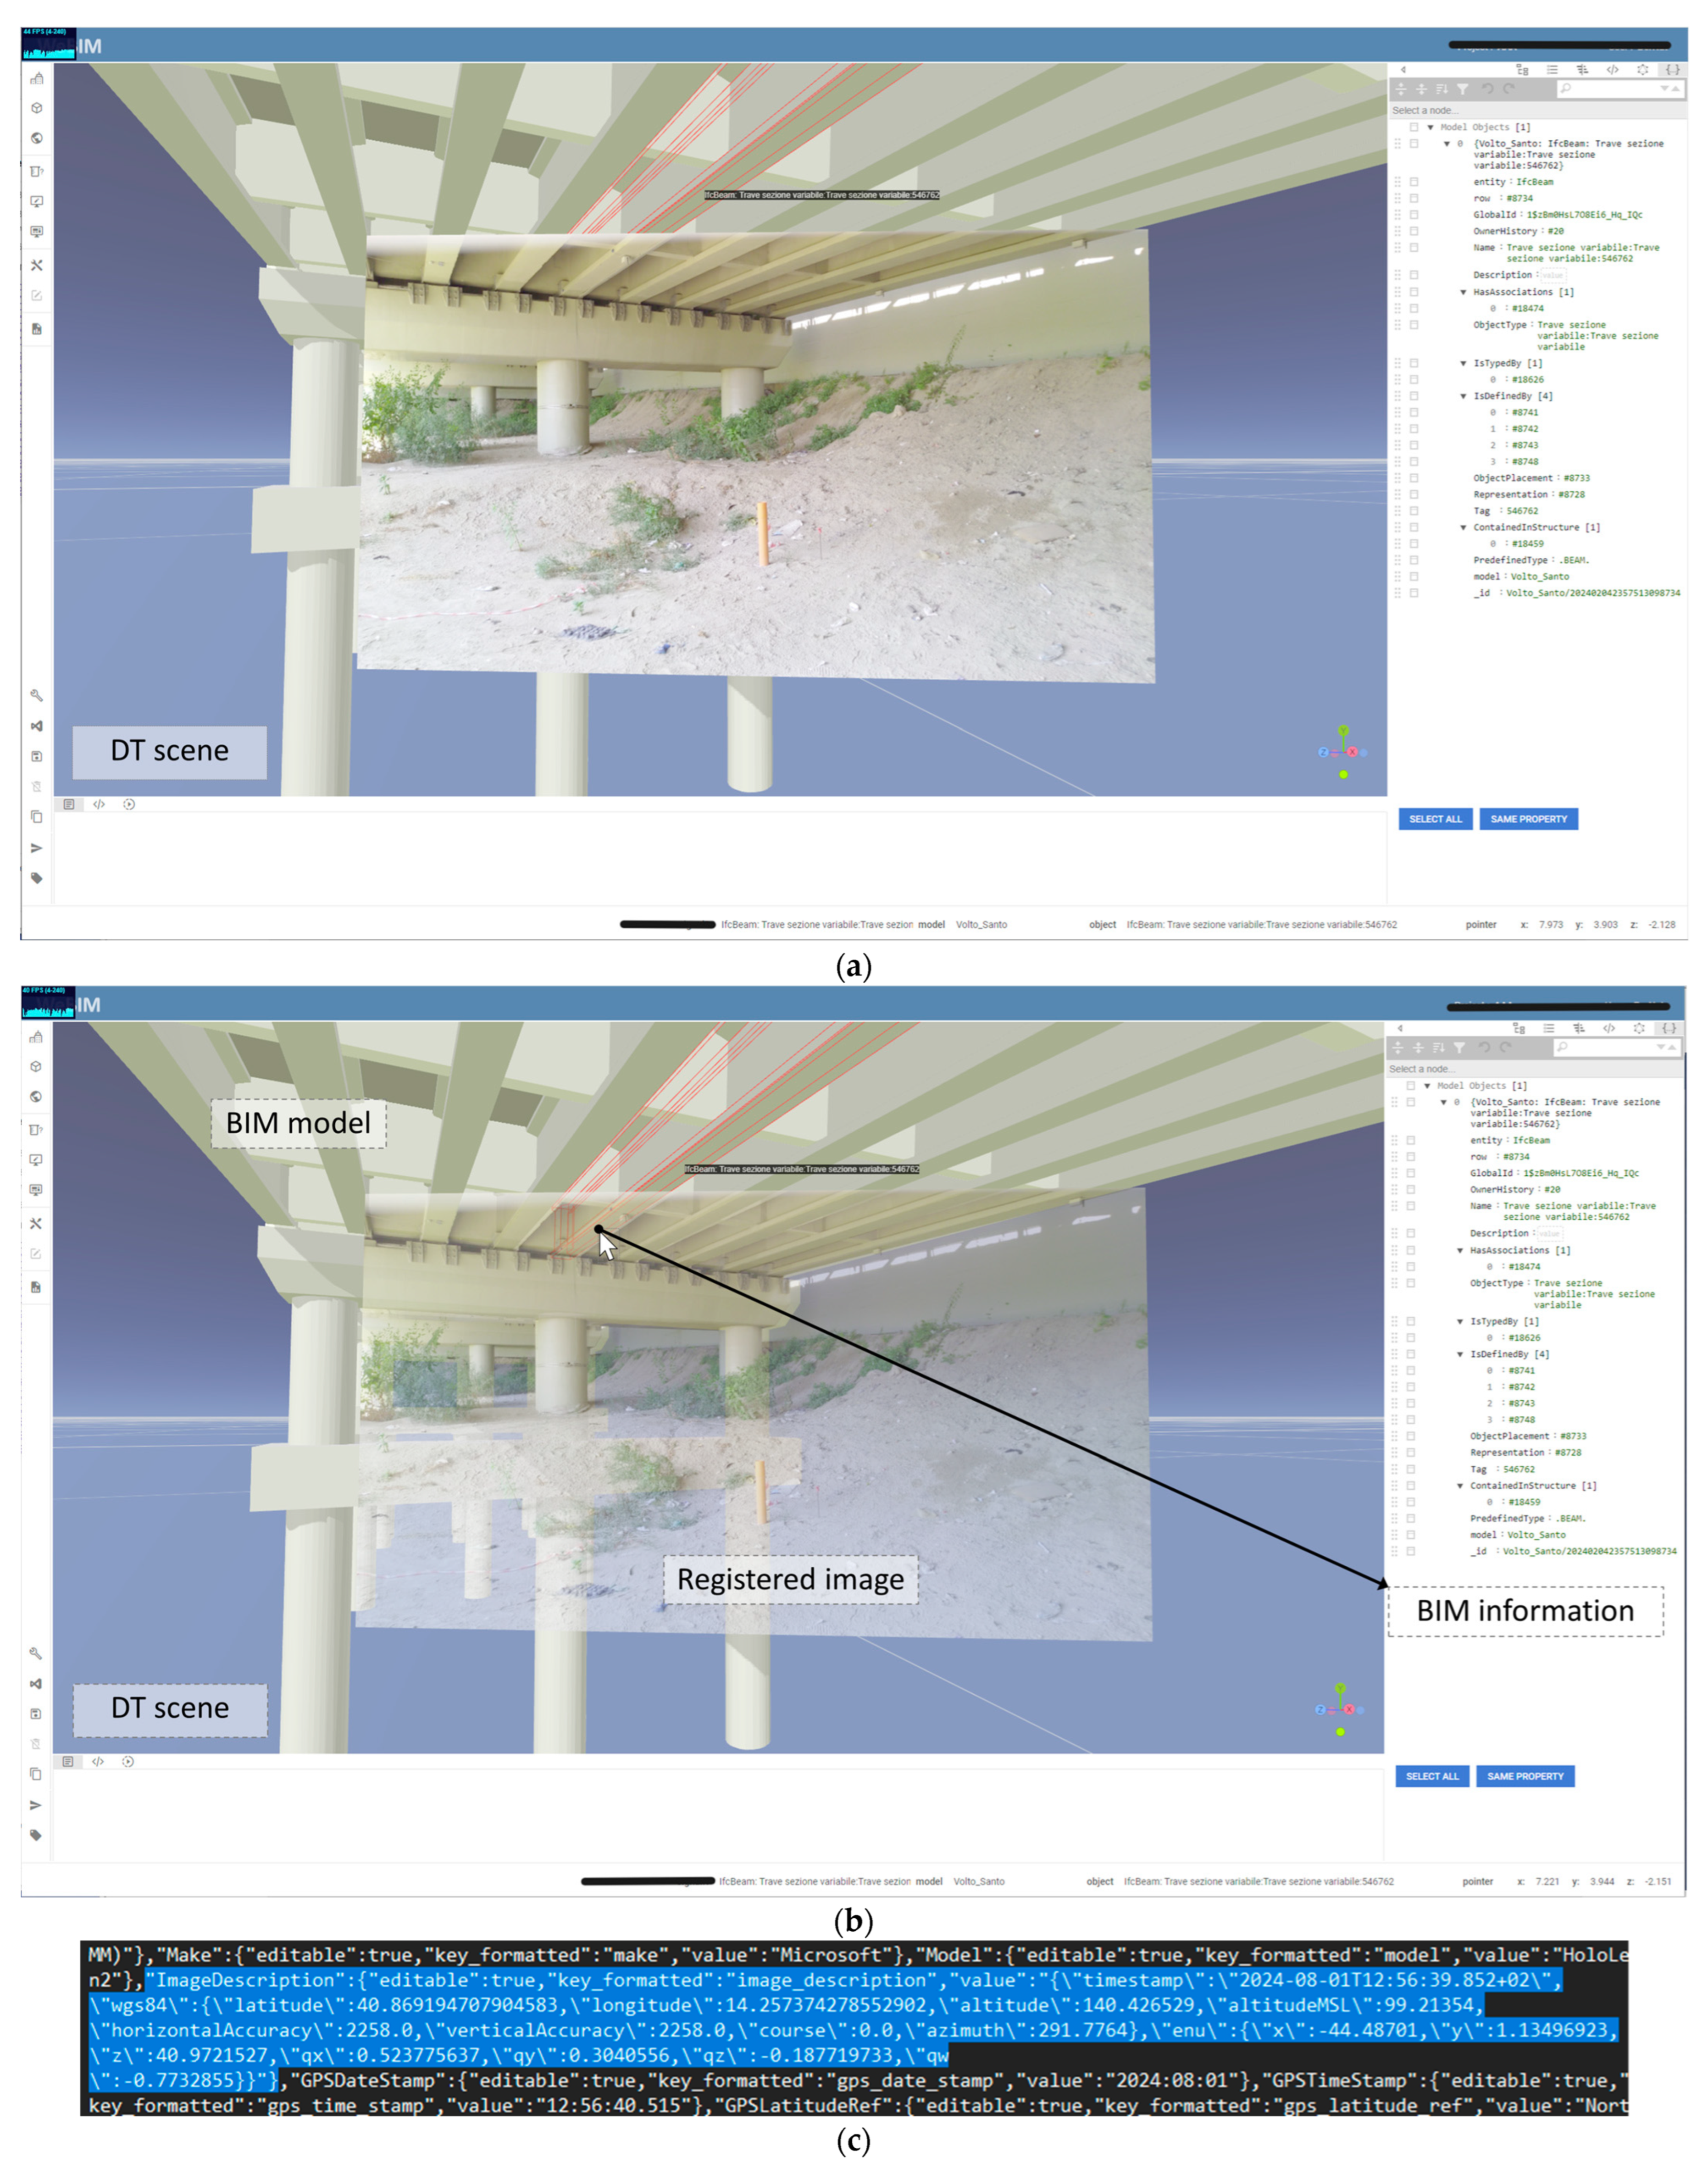
  • Field-to-virtual data registration: the automatic alignment of newly captured inspection data (e.g., images) with open BIM models to enrich the DT database,
  • Virtual-to-field data registration: the high-accuracy alignment of AR holograms of open BIM models with the real asset to provide seamless access to stored information during in-field inspections.
It must be noted that, the solution of the latter, is propaedeutic to the former. This means that the high-accuracy AR registration in large-scale, unprepared open scenarios also enables field-to-virtual data registration. Consequently, the methodology emphasizes the development of an automatic registration system based on AR integrating small-sized, low-cost RTK GNSS technology developed in-house with visual–inertial tracking systems.
Although road infrastructure inspections, as highlighted in Section 2, include different survey methodologies depending on the type of asset (e.g., bridges and pavements), with equally different types of data and information collected, this paper aims to demonstrate the effectiveness of the proposed methodology by specifically considering a bridge as the infrastructure asset. First, the as-built IFC model of the bridge is uploaded on the DT platform. The upload is followed by the translation of the IFC model into graphs using a parser [42] integrated into the DT platform. The graph model of the bridge includes its geographical coordinates and orientation with respect to the North. In this work, the DT of the bridge is composed of the geolocated graph representation of the bridge’s IFC model, and is combined with real-time procedures that enable the bidirectional connection between physical and virtual entities:
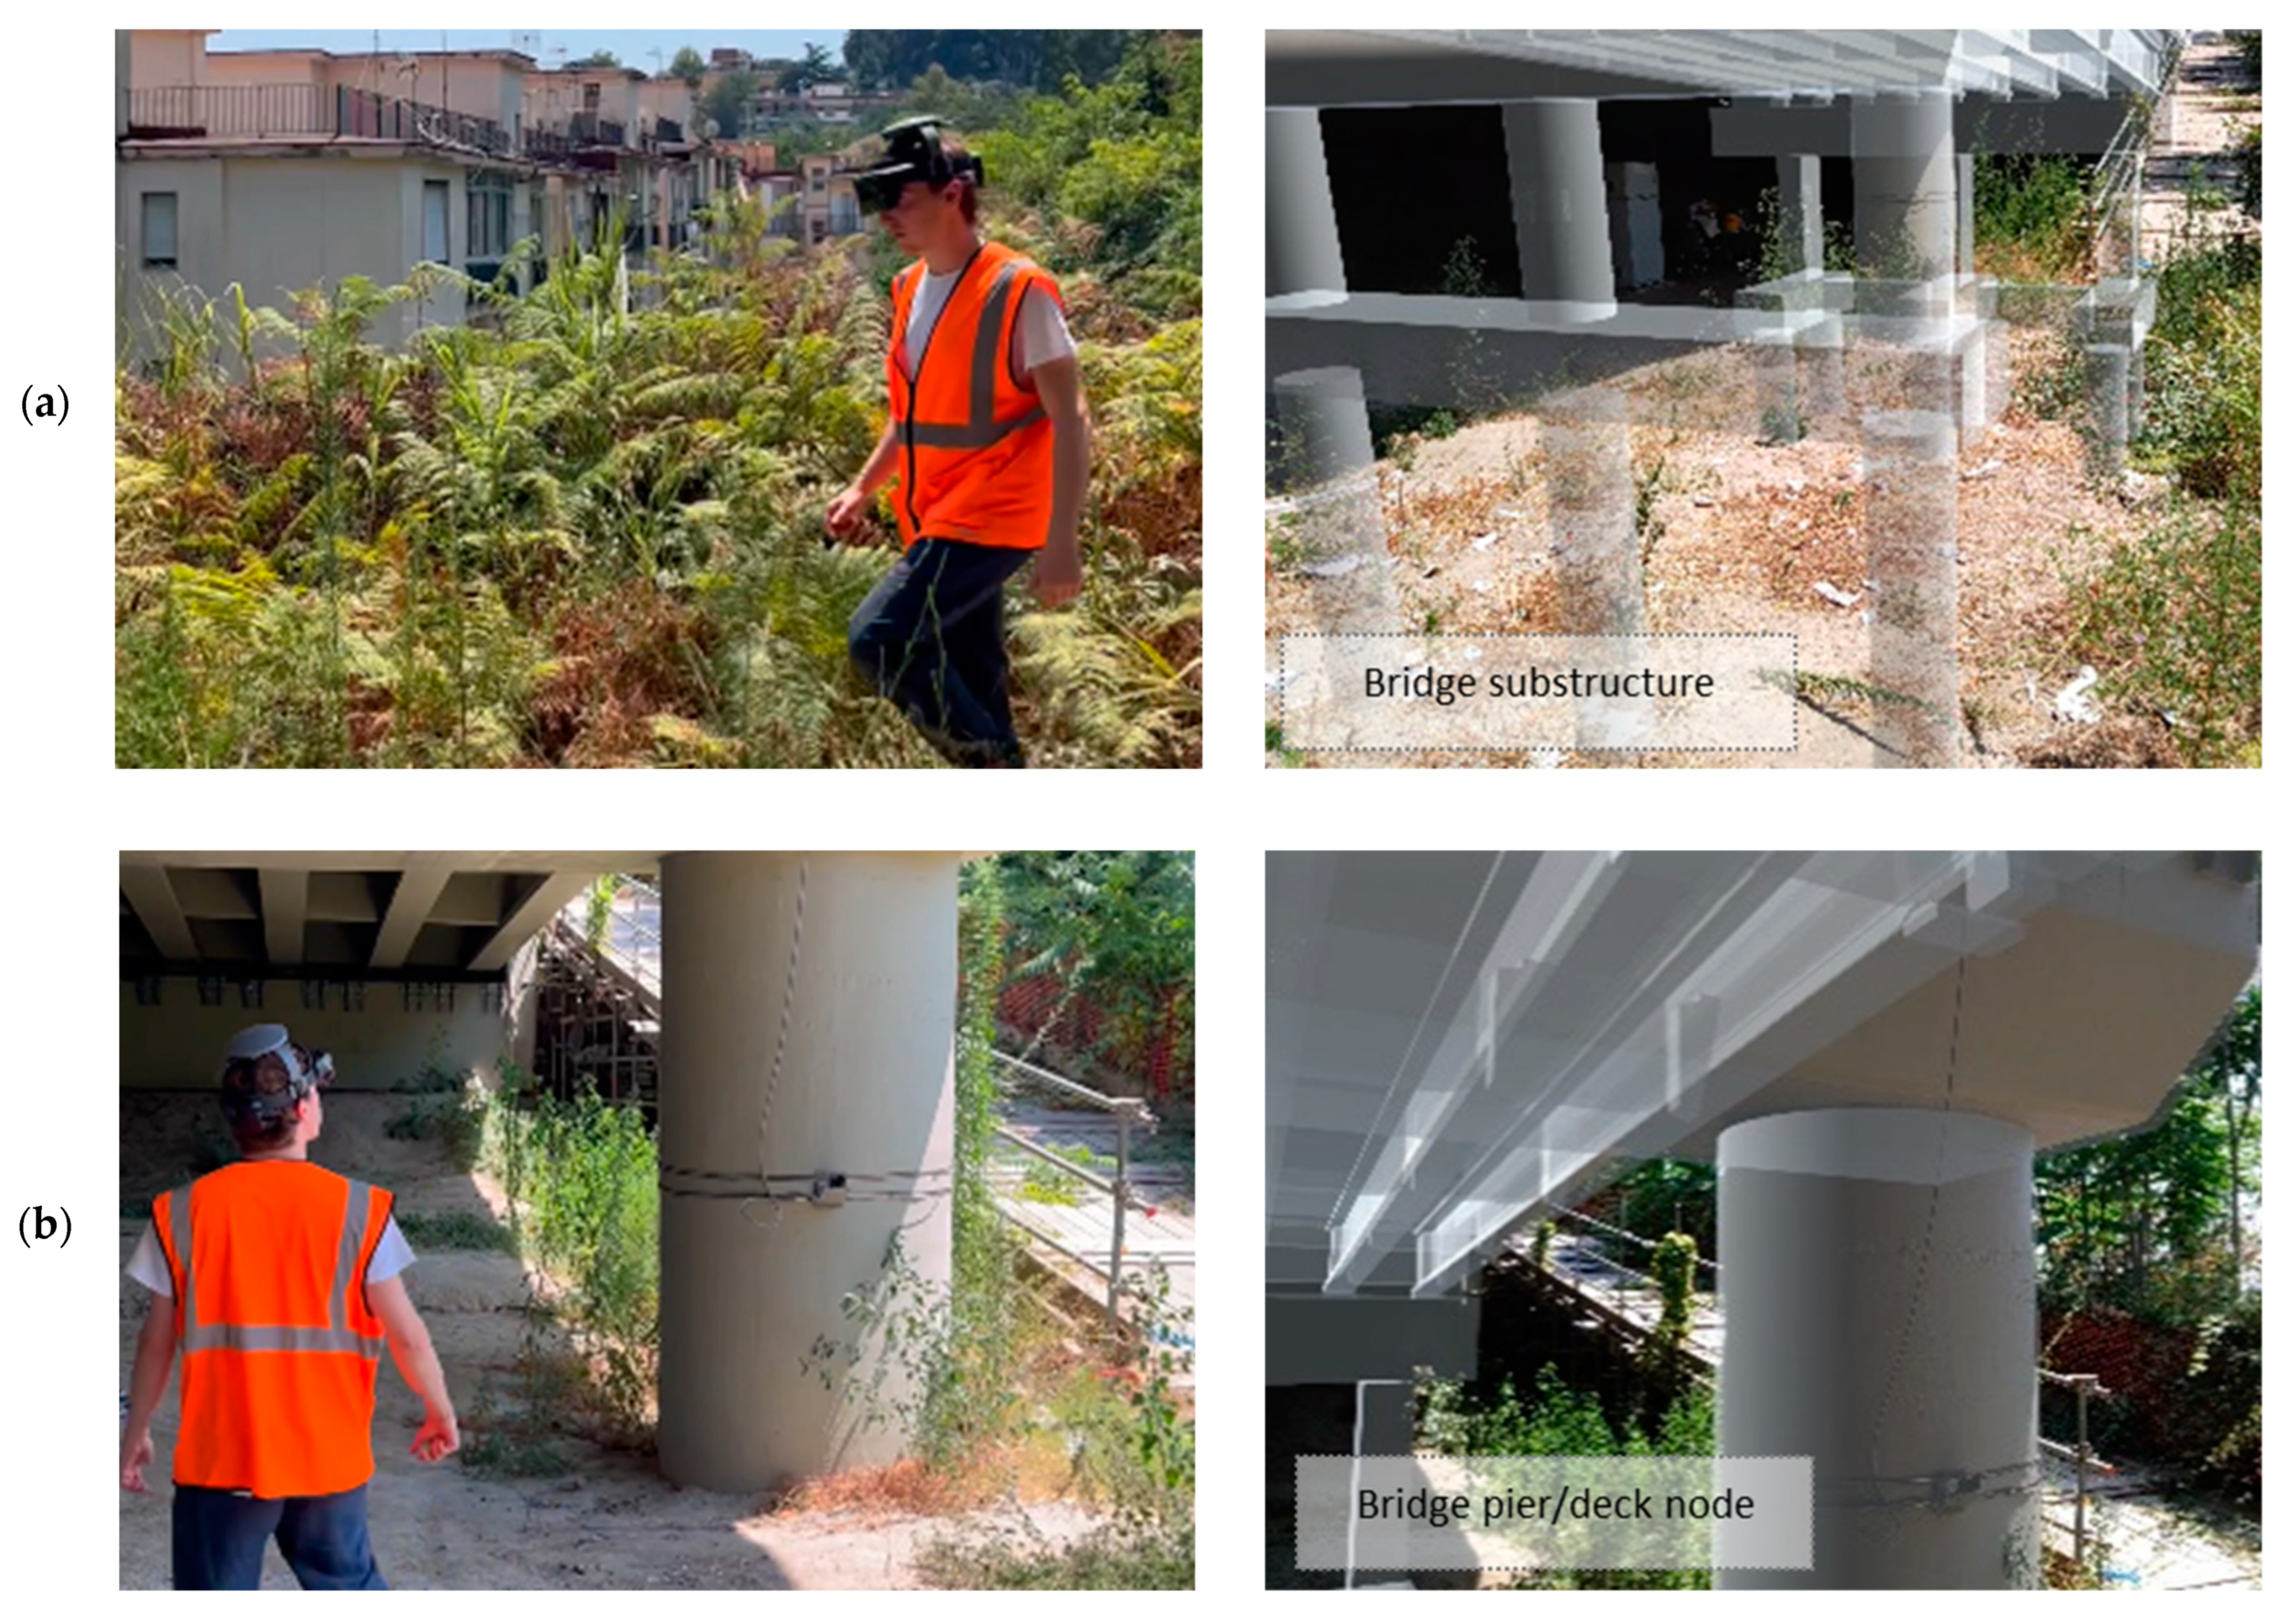
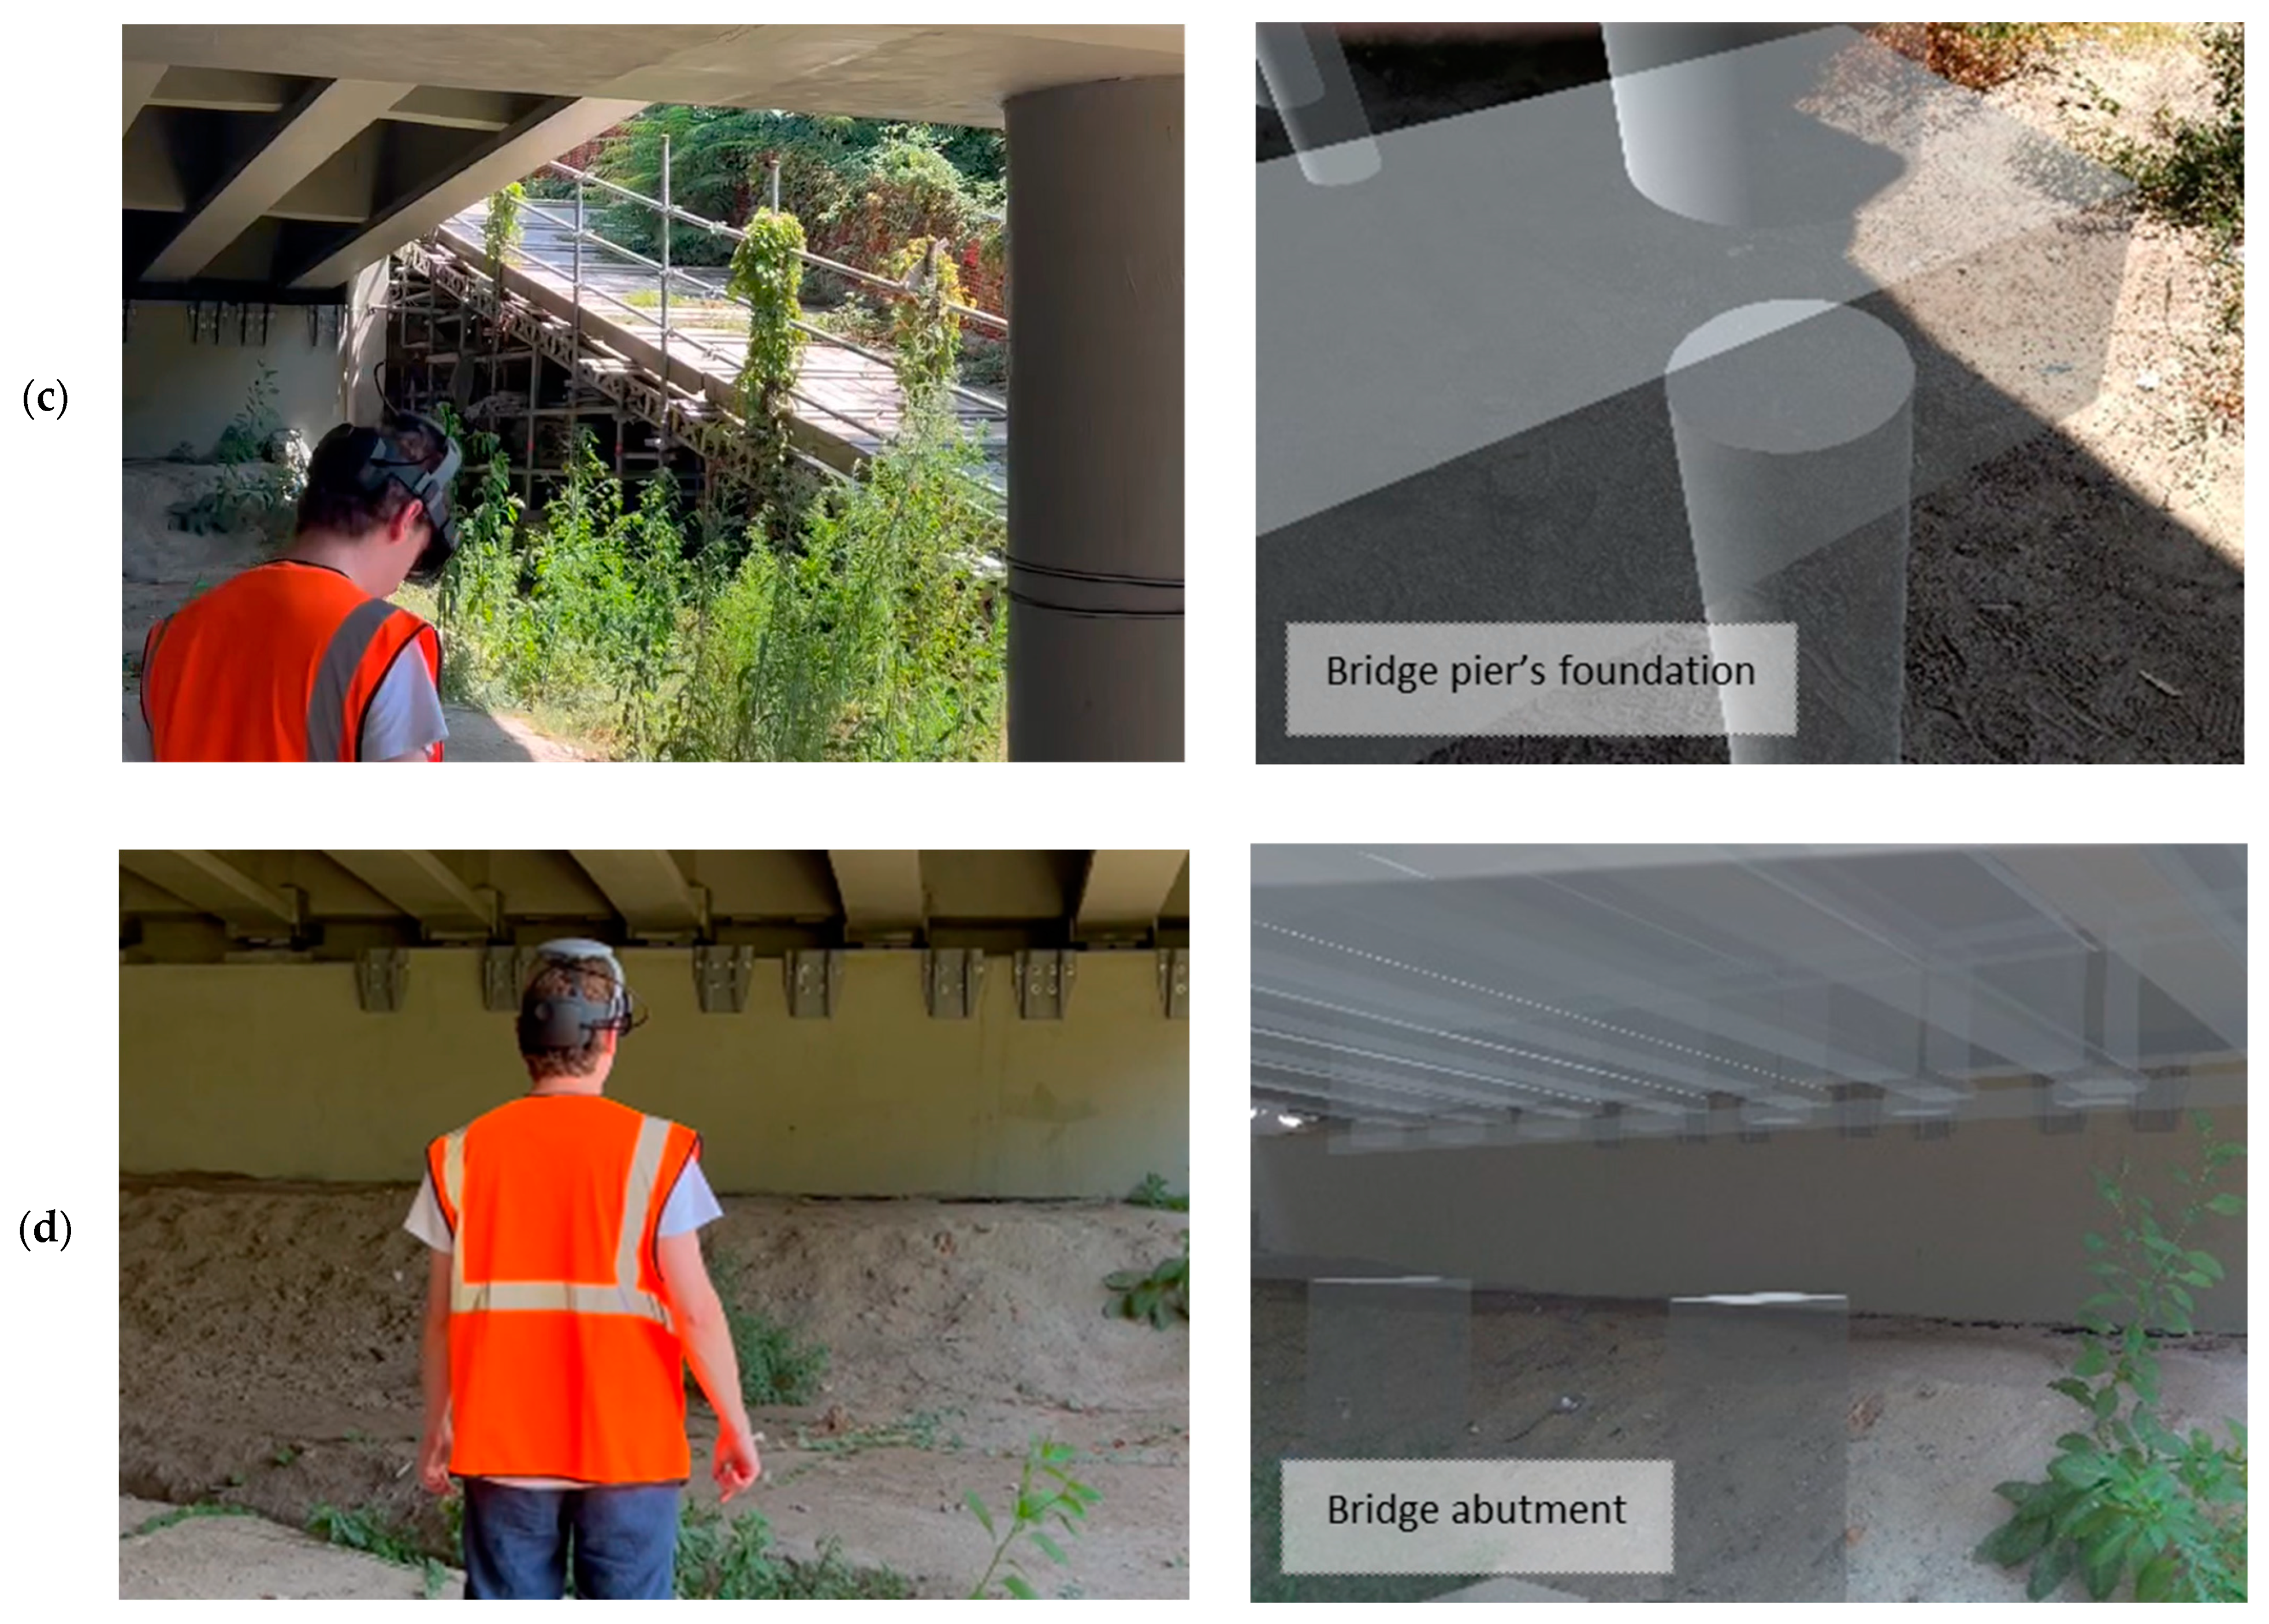
  • The registration with the real asset of AR holograms of the graph representation of the open BIM model. This was deemed valuable by domain experts for accessing and visualizing relevant information such as the geometric information of the hidden structures, in the field during inspection procedures;
  • The registration of newly captured visual information (i.e., images documenting the asset’s conditions) with the graph representation of the open BIM, deemed valuable by domain experts for the evaluation of deterioration trends.
The DT of the bridge will be enhanced in future works by integrating further real-time features such as IoT sensors for bridge monitoring, and AI models for image semantic extraction and model enrichment. To support road infrastructure inspection processes in large-scale, unprepared open environments, the system proposed here must satisfy the following requirements:
  • Operators must not use manual procedures to register the 6-DoF position of the device and holograms during inspection tasks. Any manual action would cause loss of time, interference with activities, and may require expert skills.
  • The system must be usable in unprepared environments. The need to prepare real and virtual environments with markers and/or other infrastructure prior to the system deployment limits the scope of the system, drastically increases deployment time, may require expert knowledge, and ultimately limits scalability.
  • Inspection scenarios may include urban-canyon environments. The system must cope with the eventual temporal absence of GNSS-RTK signals (e.g., eventual lack of GNSS-RTK signals under a bridge). Any interruptions in the service and/or misalignments would lead to a limitation in the use of the system.
  • The solution must not suffer drift issues, especially over medium to long distances, since activities may be spread out in wide areas. Drift is the term used to describe the accumulation of small measurement errors of the inertial system. The visual feature of the VIO system is usually sufficient to compensate the IMU errors in relatively small environments where visual features are available, such as in indoor spaces. However, the visual component fails to compensate IMU errors in completely open environments due to the size of the space and the dynamic nature of the scenarios, and also when travelling “long” distances [60]. Drift issues restrict the system’s area of use and limits scalability.
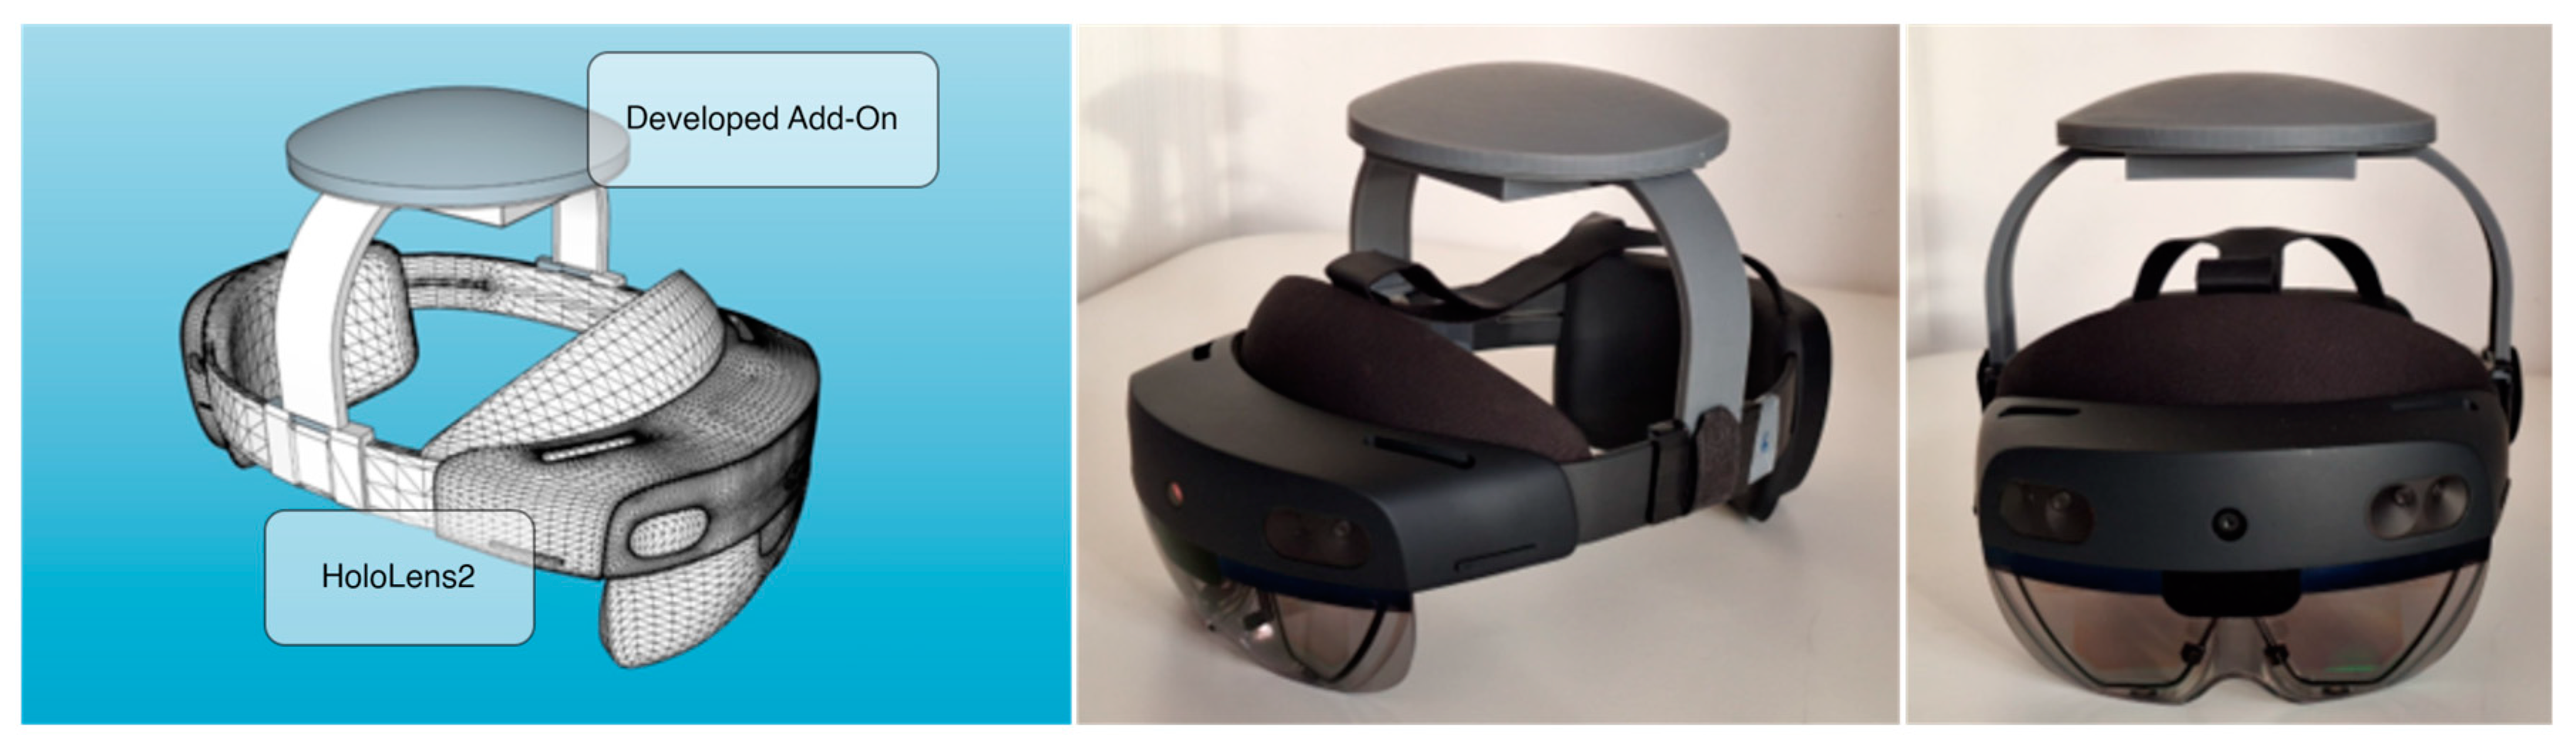
  • The system must be accessible to consumers and must not be invasive.
While the methodology is compatible with both AR Hand-Held Devices (HHD) and Head-Mounted Devices (HMD), this research focuses on HMD. Specifically, the Microsoft HoloLens 2 (Microsoft Corporation, Redmond, WA, USA) was used for testing purposes.
The subsequent sections detail the system architecture, methodology, and implementation processes for achieving automatic AR registration in both virtual-to-field and field-to-virtual directions. This comprehensive approach ensures the development of a scalable, high-accuracy AR registration system tailored for civil infrastructure management.

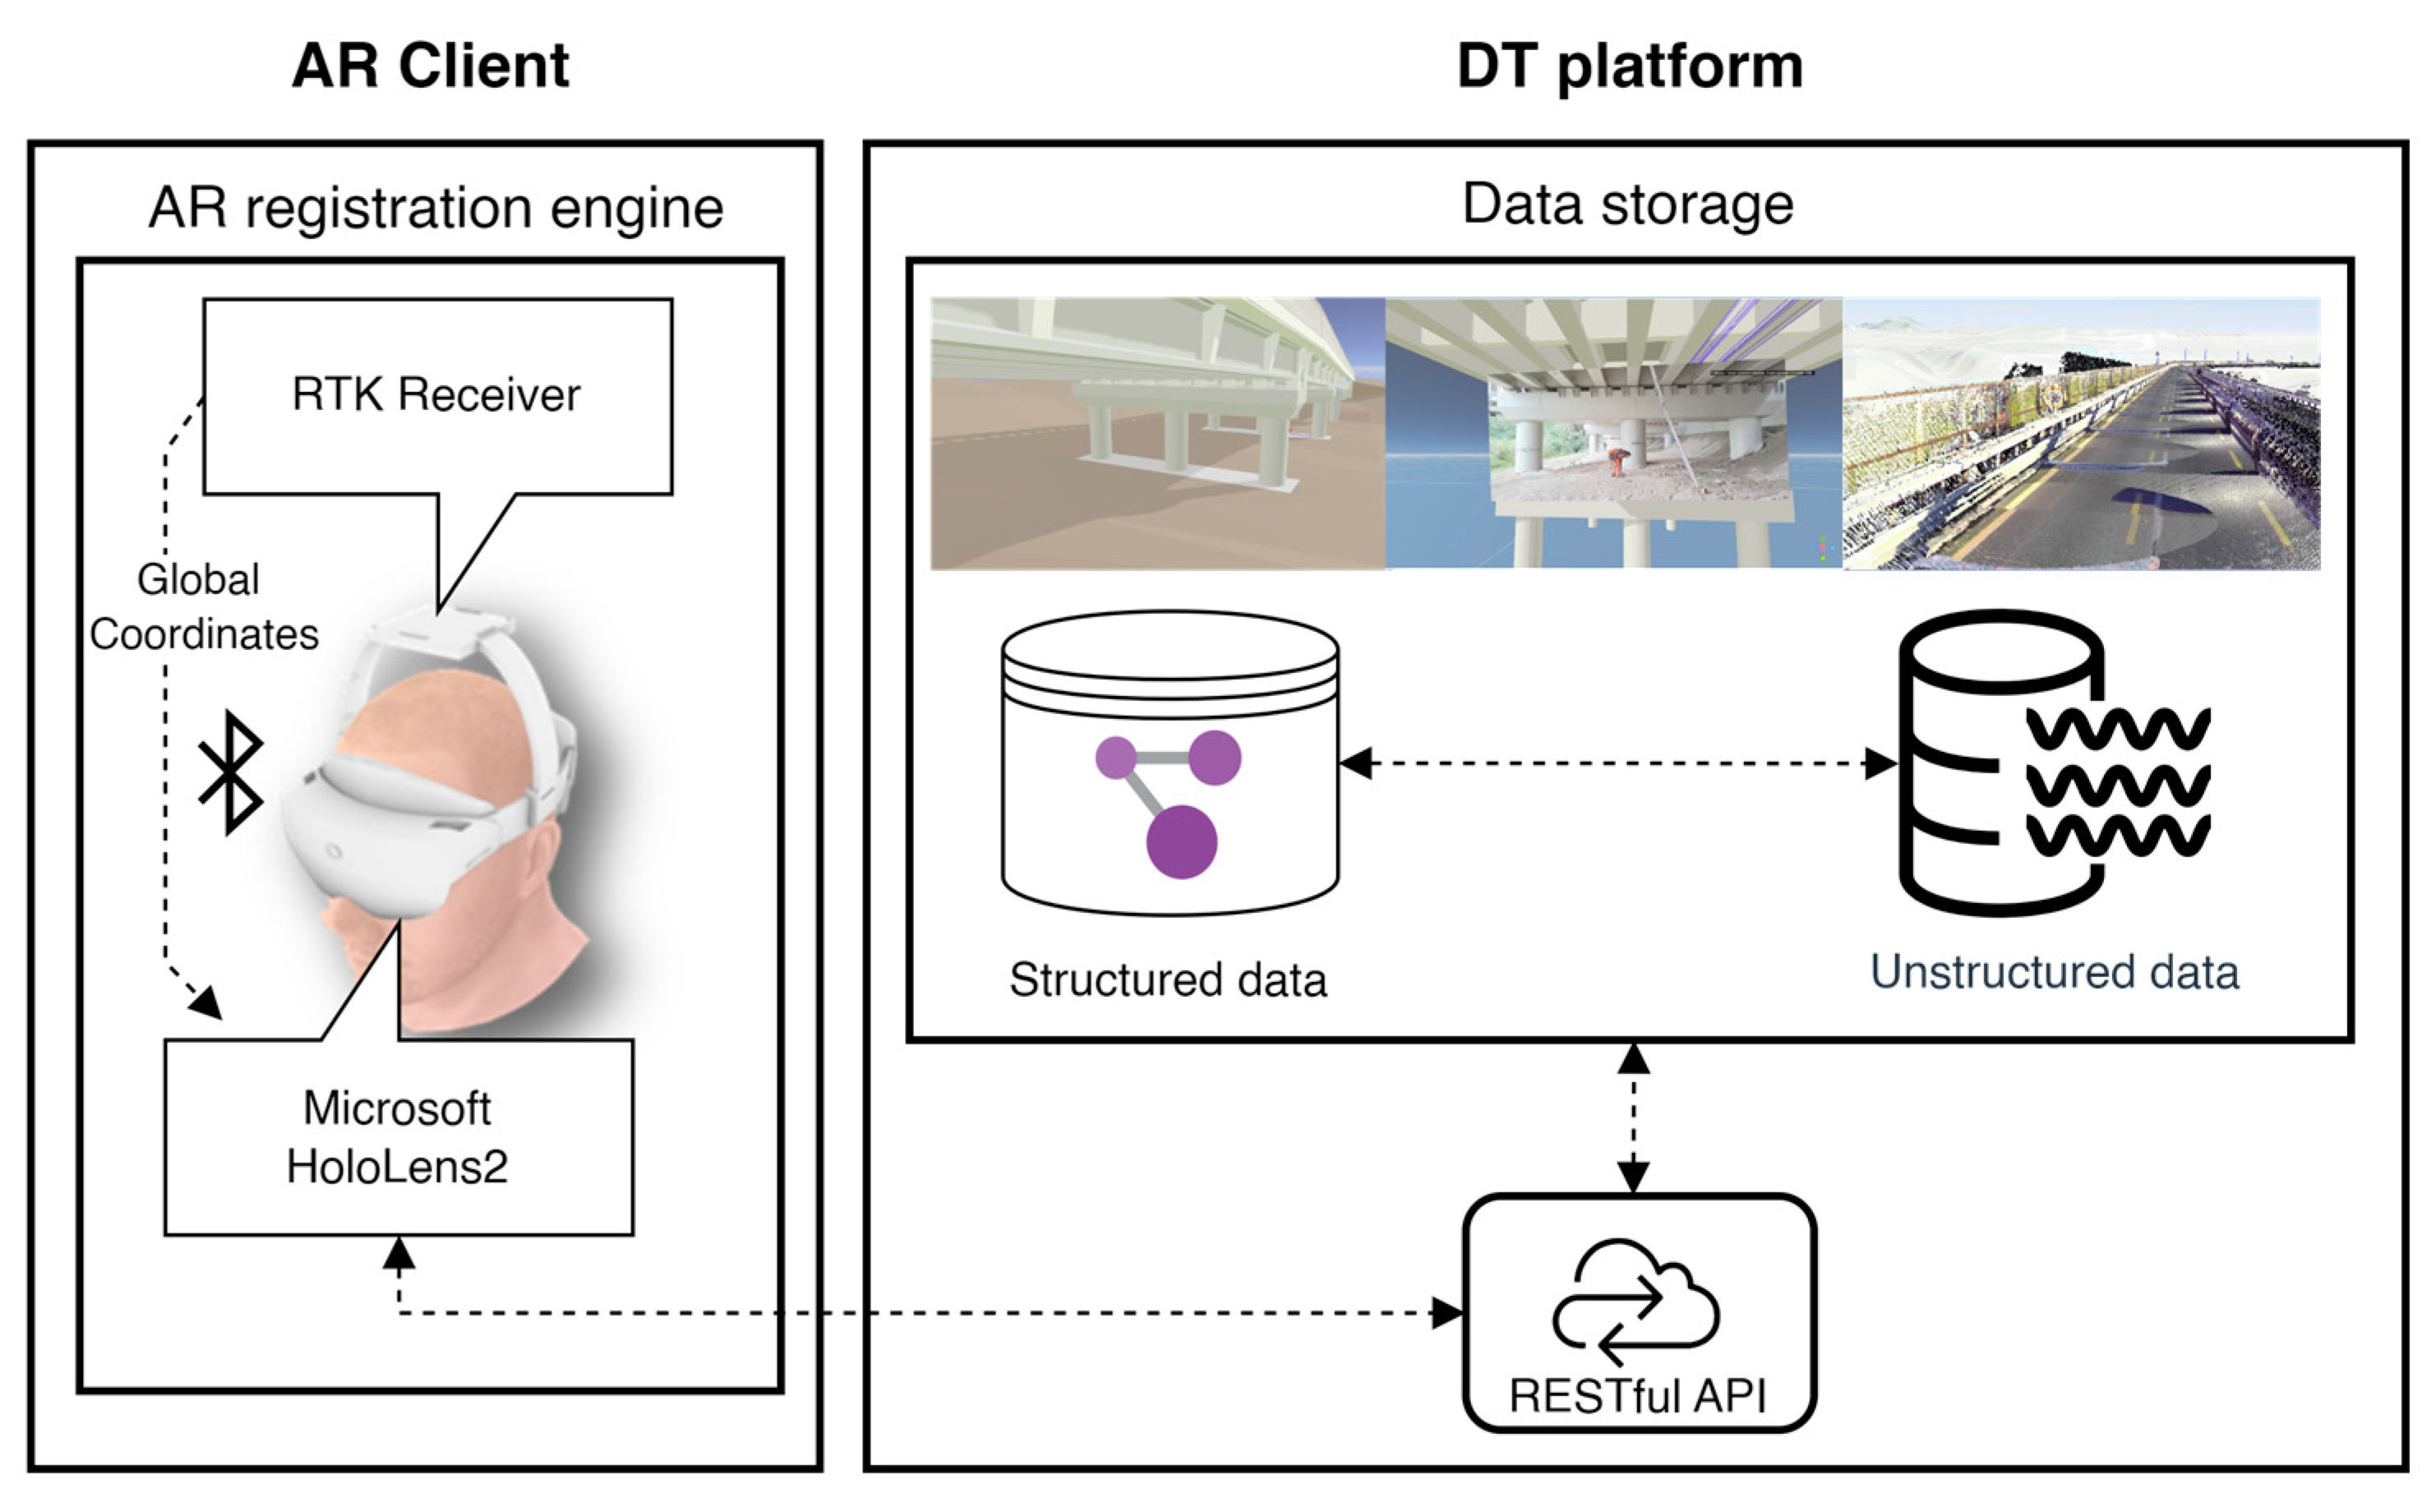
3.1. System Architecture

The proposed system architecture, illustrated in Figure 3, consists of two primary components: the DT Platform and its AR Client deployed on an AR device.
The DT Platform is a web-based platform built upon a microservice-based architecture with backend and frontend services. It serves as a centralized hub for storing, processing, and distributing data through a RESTful API communication layer. One of its key features is the ability to host, localize, and align open data such as open BIM models, images, and other data into a unified geospatial context, referred to as a “DT scene”. This geolocation capability ensures the correct mapping of virtual assets and their features to their corresponding real-world positions, using the WGS-84 standard [61], thereby facilitating seamless integration between the digital and physical environments. Storage and management of structured (e.g., .IFC files) and unstructured (e.g., images) data are addressed using a storage environment: a graph database offers a robust backbone that provides efficient storage and a powerful query language for retrieving and traversing interconnected heterogeneous structured data elements. Specifically, it stores and links together multiple multi-domain knowledge graphs related to civil infrastructure assets. Unstructured data, such as binary large objects (e.g., images and point clouds), are stored in a separate data lake and connected to their respective metadata in the knowledge graphs through URLs in order to be easily accessed and queried.
The system architecture also incorporates an AR registration engine, which is specifically designed to address the challenges posed by open, unprepared environments. These challenges include the absence of reliable reference points and the need to operate effectively in large-scale, dynamic scenarios. The engine underpins the system’s capability to align and localize virtual models within real-world contexts, enabling users to interact accurately with DT models. It is worth noting that, since the microservice architecture of the system, the AR registration engine is a client of the DT platform and is directly deployed on the device with AR capabilities.

Hardware Components

Note that to enable high-accuracy GNSS-RTK data collection, a low-cost, non-invasive RTK rover was developed in this work. As shown in Figure 4, it communicates its measurements via Bluetooth to the AR device. The rover is a GNSS RTK receiver equipped with the necessary modules for communicating with an NTRIP client and the AR device via Bluetooth. Figure 4 illustrates the main blocks of the rover board.
The core of the device is the RTK module that is responsible for the GNSS localization and applications of the RTK corrections. It sends the NMEA messages to the first Bluetooth module (A) and listens for the RTK measurement corrections. The first Bluetooth module (A) is paired with a mobile phone and converts the messages coming from the receiver to an NTRIP client App and vice versa. The RTK module also sends the RTK fixed location every second including the longitude, latitude, height above ellipsoid, height above mean sea level and the horizontal accuracy ( h A c c ) estimate to a second Bluetooth module (B). The second Bluetooth module (B) is an all-in-one Arduino-compatible with Bluetooth Low Energy capabilities. The developed firmware sets up a location service and then a RTK characteristic within that service.
In order to achieve consistent calibration between RTK measurements against VIO measurements, it was also deemed necessary to develop an add-on for HoloLens 2 capable of firmly connecting the RTK rover. The add-on was designed to accommodate the components described of the rover (Figure 5). The 3D printed version was used during the experimental tests as shown in the following sections.

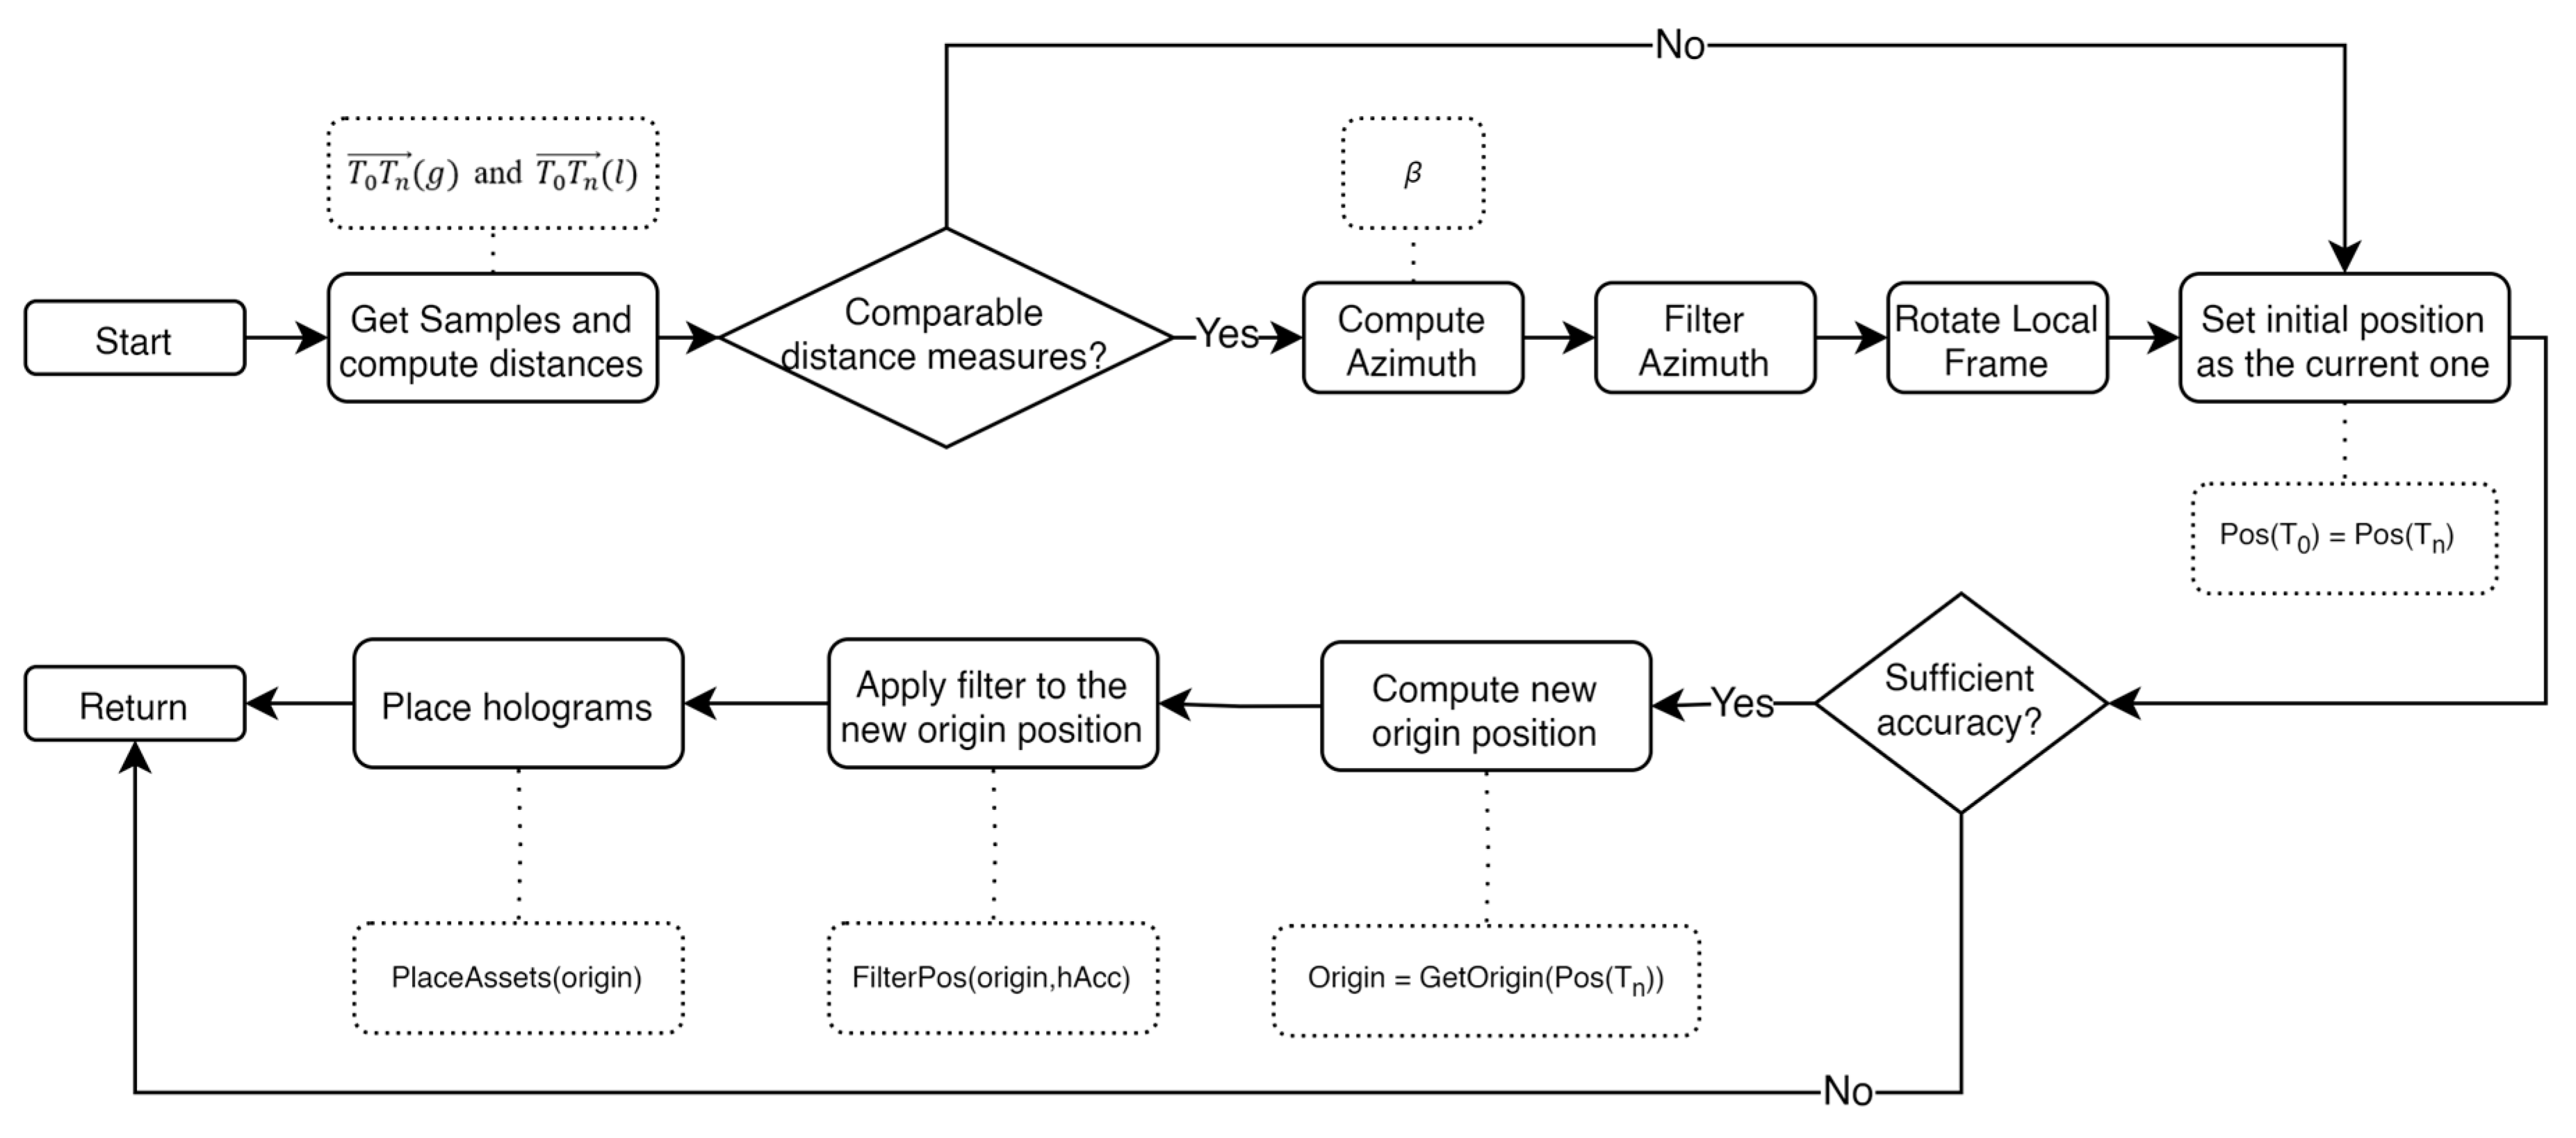
3.2. AR Registration in Large, Unprepared Open Environments

To address the outlined assumptions, this study develops a 6-DoF registration system for the AR interface and holograms by integrating RTK and VIO technologies. Specifically, a state-based navigation system is introduced, as depicted in Figure 6. This system operates in two primary modes:
  • GNSS-RTK navigation mode: uses RTK data to estimate the geographical 6-DoF pose of the AR device, compensating for the drift of the HoloLens 2’s visual–inertial tracking system, and
  • VIO navigation mode: activated when RTK data do not meet the required accuracy.
The availability of the GNSS-RTK mode is determined by evaluating the accuracy of the RTK measurements, using a weighted average of the accuracy values provided by the RTK system. This averaged accuracy is constantly compared to a predefined accuracy threshold. The threshold is set so that only high-accuracy measurements from the satellite system, i.e., those that have been corrected by the RTK system, are considered for the positioning. Accordingly, the threshold value is set to 3 cm [62,63]. If the accuracy value exceeds the threshold (indicating higher positioning errors), the system switches to VIO-based navigation. In this case, the origin of the local reference system defaults to the most recent position calculated from accurate RTK samples.
As partially outlined in ref. [26], the geographical 6-DoF pose of the AR device and holograms is determined through a hybrid approach combining GNSS-RTK and HoloLens 2’s built-in Visual–Inertial (VI) systems. The RTK system provides coordinates based on the WGS-84 standard. Aligning world-referenced 3D BIM objects with the HoloLens 2’s local frame involves several steps: (i) estimating and comparing distances travelled using both tracking systems; (ii) calculating the angle (azimuth) between the North direction and the local frame gaze; (iii) aligning the local frame to the North direction, placing virtual objects accordingly. This process automates the registration of AR devices and holograms, eliminating the need for user intervention. Consequently, it is suitable even for less experienced users, as illustrated in Figure 7.
The tracking process begins with the initialization phase, where both RTK and VIO systems acquire their initial samples. The RTK system measures absolute 3D geographic coordinates of the device (latitude ( φ ), longitude ( λ ), and altitude ( h )), whereas the VIO system supplies the local 3D coordinates ( x , y , z ) and rotations ( ϕ , θ , ψ ) . The AR engine combines the RTK-GNSS and VIO tracking systems to compute the distances travelled in global and local coordinate systems, respectively. The AR engine is initialized at position T 0 and obtains the first measurements. Throughout the travelled path, the position changes to T n . The distance T 0 T n is calculated using both global and local measurement samples. The distance in the local coordinate system T 0 T n ( l ) is computable as the sum of the 3D distances between consecutive samples as shown in Equation (1):
T 0 T n ( l ) = i = 1 n [ x n x n 1 2 + y n y n 1 2 + z n z n 1 2 ]
Furthermore, an additional step must be taken for computing the distances in the geographical coordinate system T 0 T n ( g ) . For global coordinates, the equirectangular projection is employed due to the relatively small area under consideration. Generically, the x axis indicates the longitude λ , and the y axis indicates latitude φ . However, the ratio between those is cos( φ 1 ), where φ 1 denotes a latitude close to the center of the part of the Earth’s surface under consideration. The forward projection is the conversion from spherical coordinates to plane coordinates (Equation (2)). The reverse projection (i.e., Equation (3)) converts the plane coordinates back to the spherical ones:
x = R λ λ 0 cos φ 1 y = R φ φ 0
λ = x R cos φ 1 + λ 0 φ = y R + φ 0
with λ as the longitude of the position to be projected onto the planar surface, φ as the latitude of the position to project onto the planar surface, φ s t as the standard parallel (either South or North of the Equator) where projection is at true scale, φ 0 as the central parallel plane surface l, λ 0 as the central meridian plane surface, x as the horizontal coordinate of the projected position on the map, y as the vertical coordinate of the projected position on the map, R as the radius of the Earth at the position to project.
After projection, distances between RTK samples are computed and compared with those from the VIO system. It is worth noting that due to communication times between the rover and the AR device, the RTK samples are slightly delayed with reference to the VIO ones. To compare corresponding distances, it was necessary to compensate this time offset. A detailed description of the delay compensation method can be found in Section 3.2.4.
If the discrepancy between the two distances T 0 T n ( g ) and T 0 T n ( l ) is below a predefined threshold ( Δ d ) the system proceeds by calculating the azimuth (i.e., the bearing angle β with reference to the North direction, clockwise). Otherwise, the system resets the starting position as the current one and awaits updated samples from the tracking systems.
The azimuth calculation is needed for the alignment of the local frame’s y axis with the North. Initially, the VIO frame orientation is unknown. To compute the azimuth, while moving between two points, the performed line has a direction β with respect to the y axis. The same line forms a bearing angle β with respect to the North as shown in Figure 8.
If P 1 ( φ 1 , λ 1 ) is the position of the first point of a straight line along a great-circle area in global coordinates and P 2 ( φ 2 , λ 2 ) is the position of its second point in global coordinates, the bearing angle can be computed with Equation (4):
β = a t a n 2 sin λ 2 λ 1 cos φ 2 cos φ 1 sin φ 2 sin φ 1 cos φ 2 cos λ 2 λ 1
The bearing angle β is filtered first to improve accuracy as explained in Section 3.2.1. Then, it is used to align the y axis of the local frame to the North direction by rotating the local frame by β β counterclockwise.
Then, when the RTK accuracy h A c c is sufficient (i.e., h A c c value is lower than a predefined tolerance that corresponds to the “RTK Fix” status of the receiver), the system moves the center of the local frame to the last computed position to consequently place the holograms in the space. Further details related to the accuracy assessment are shown in Section 3.2.3 and Section 3.2.4.
To compute a new position of the origin of the local frame, it is necessary to go back to the equirectangular projection. When projecting geographic coordinates into planar ones, it is suggested to use as central point of the equirectangular projection φ 0 , λ 0 the center of the local frame and its corresponding latitude φ 1 as reference, where no distortion is generated. Therefore, in this work we assume that φ 0 = φ s t It is also assumed that the movement is performed in the vicinity of the central point. The origin of the local frame φ 0 , λ 0 must first be determined: if the observer is localized and both its global coordinates ( φ , λ ) and its local coordinates ( x , y ) are known, the geographic position of the reference frame can be found by inverting the reverse projection, as shown by Equations (5) and (6):
λ 0 = λ x R cos φ 1
φ 0 = φ y R
Once the geographic position of the origin of the local frame φ 0 , λ 0 is found, and the geographic coordinates of a virtual object (e.g., a BIM model) are known ( φ , λ ) , the corresponding local coordinates can be found using the forward projection (Equations (7) and (8)):
x = R λ λ 0 cos φ s t
y = R φ φ 0
If the observer moves beyond a threshold distance from the origin of the local frame, the local frame is moved to a new position by repeating the process in loop, so the 3D holograms can be repositioned accordingly.
To view only virtual objects within a certain distance from the user, the distance must be computed by using the forward projection formula (i.e., Equation (2)) where ( φ , λ ) the position of the user is and ( φ , λ ) where the position of the virtual object is both in global coordinates. The corresponding distance is therefore computed as in Equation (9):
d = R λ λ cos φ s t 2 + φ φ 2
To monitor the real observer altitude, whenever a GNSS measurement is sampled for the user’s altitude h , its height in the local frame is recorded for future reference as the height of the local frame. As a result, considering ( h 0 ) and ( h ) as the elevation of the origin of the local frame and the elevation of an object, respectively, and z 0 as the height of the local frame origin in local 3D coordinates, the vertical coordinate of the object ( z ) is computed using Equation (10):
z = h h 0 + z 0
The observer can vertically move the objects. If the object is manually moved to z to match their true height from the ground, the true altitude z is stored. As for the planar local coordinates, if the user moves too far from the origin of the local frame, it is vertically moved to the new elevation and the 3D objects are repositioned accordingly by re-applying the previous equations.

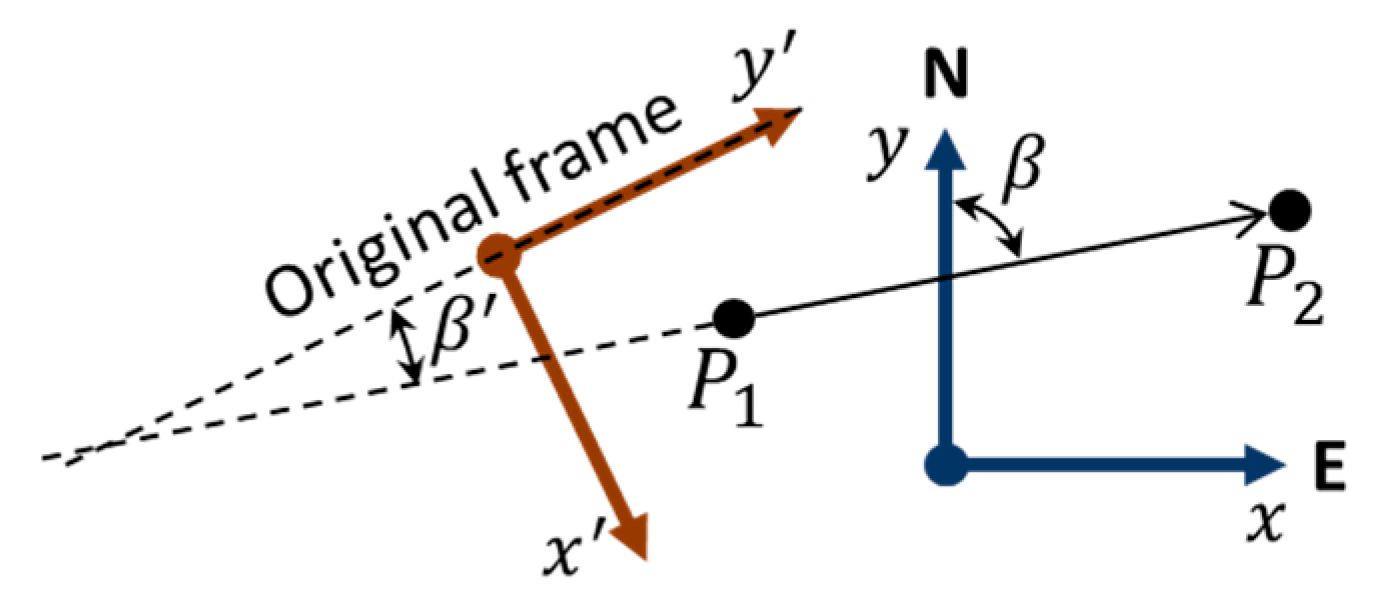
3.2.1. Azimuth Accuracy and Filtering

When computing the bearing angle from two positions affected by uncertainties, the resulting bearing is affected by an uncertainty which depends on the position accuracy (Figure 9).
With reference to the 2drms accuracy measure [64], d is the distance between two alignment points (alignment distance), i.e., the distance between two accurate RTK measurements, a is the accuracy radius at first position and b is the accuracy radius at second position. The angle uncertainty ± α is given by Equation (11):
α = atan d a + b
The angle uncertainty corresponding to an observed alignment uncertainty ± e when an object is at distance D from the observer is such that tan α = e / D ; therefore, the minimum distance between two alignment points to achieve that accuracy is computed through Equation (12):
d g p s = D a + b e = a + b e % / 100
where e % = 100   e / D is e expressed as percentage of D ( e = e % D / 100 ). However, all this considers only GNSS-RTK tracking system uncertainty. VIO localization error when performing long paths (also referred to as drift) was estimated in ref. [60] to be roughly h % = 0.8 % of travelled distance (2.39 m over 287 m). In this work we assume the drift to be constant. Therefore, the drift error is added to the GNSS-RTK measurement error at the end of the path where the alignment is performed ( b = a + d h % / 100 ). Assuming the GNSS-RTK uncertainty a to be constant, Equation (13) is used to compute the alignment distance:
d = 2 a + d h % / 100 e % / 100 d = 2 a ( e % h % ) / 100 , e % = 200 a + d h % d
and the results are reported in Table 1.
Only some uncertainties e are then possible, i.e., ones with e % h % > 0 , that yield positive d ( m ) values. With the parameters assumed above, the alignment distance must be at least 6 m for achieving a tilt error below 0.76 deg (4 cm for objects placed 3 m far from observer). Conversely, given an alignment distance d = 10   m , a = 0.02   m , h = 0.8 % , the resulting confidence is e % = ± 1.2 %   ( ± 12   c m   @ 10   m ) .
In order to improve the accuracy of the azimuth angle estimated via GNSS-RTK, multiple azimuth measures each with confidence interval e are computed and the mean of the last n samples (moving mean) can be used to reduce the uncertainty: the confidence interval of the mean is reduced to e / n . By using the same parameters as reported above, given an alignment distance d = 10   m , a = 0.02   m , h = 0.8 % and filtering with n = 16 samples, the resulting confidence of the mean is e ¯ % = ± 1.2 % / 4 = ± 0.3 %   ( ± 3   c m   @ 10   m ) .
For example, if a person wearing the device walks at v = 0.5   m / s , in a fixed time T = 60   s , they can walk at most v T = 30   m . The number of samples available for computing mean is then n = v T / d . Therefore, the uncertainty of the mean e ¯ % = e % / n is (Equation (14)):
e ¯ % = 200 a + d h % d v T
The optimum value d * that minimizes e ¯ % with respect to d is obtained by using Equations (15) and (16):
d * = arg min d e ¯ % d , a , h % , v , T
e ¯ % * = min d e ¯ % d , a , h % , v , T
The first condition is verified when the derivative of e ¯ % goes to 0 as shown in Equation (17):
e ¯ % d = h % v T d 200 a + d h % v T 2 v T d 3 = 0
An optimal alignment distance can be computed using Equations (18)–(20). The optimal alignment distance for a = 0.02   m , h % = 0.8 % , and v = 0.5   m / s is equal to d * = 5   m .
h % = 200 a + d h % v T 2 v T d 2 h % = 200 a + d h % 2 d 2 h % d = 200 a + d h %
d * = 200 a h %
e ¯ % * = 100 4 a v T d *
To obtain a significant number of samples ( n > 10 or 15), the filter must have a time window of at least T = 2 minutes, which corresponds to an uncertainty lower than e ¯ % * = ±   0.5 % ( e ¯ * = ± 5   c m   @ 10   m ) as highlighted in red in Figure 10.
When measuring relative distances between two points at distance d * , the maximum VIO drift will be lower than h = h % · d * / 100 = 0.8 5 / 100 = 4   c m , which is added to the GNSS-RTK uncertainty a = 2   c m , thus giving an overall uncertainty for the difference between the distance measured by VIO and the distance measured by GNSS-RTK equal to Δ d = 2 a + h = 12   c m . This measure can be used as distance tolerance for comparing the two measures for the alignment purposes: if the difference falls within that tolerance, the measures can be considered reliable, otherwise they must be discarded.
Summarizing, for a = 0.02   m , h % = 0.8 % , and v = 0.5   m / s , e ¯ * = ± 5   c m   @ 10   m , the tuning parameters are shown in Equation (21):
d * = 5   m ,         Δ d = 0.12   m ,         T 120   s
These parameters can be scaled proportionally if one decides to increase the minimum alignment distance.

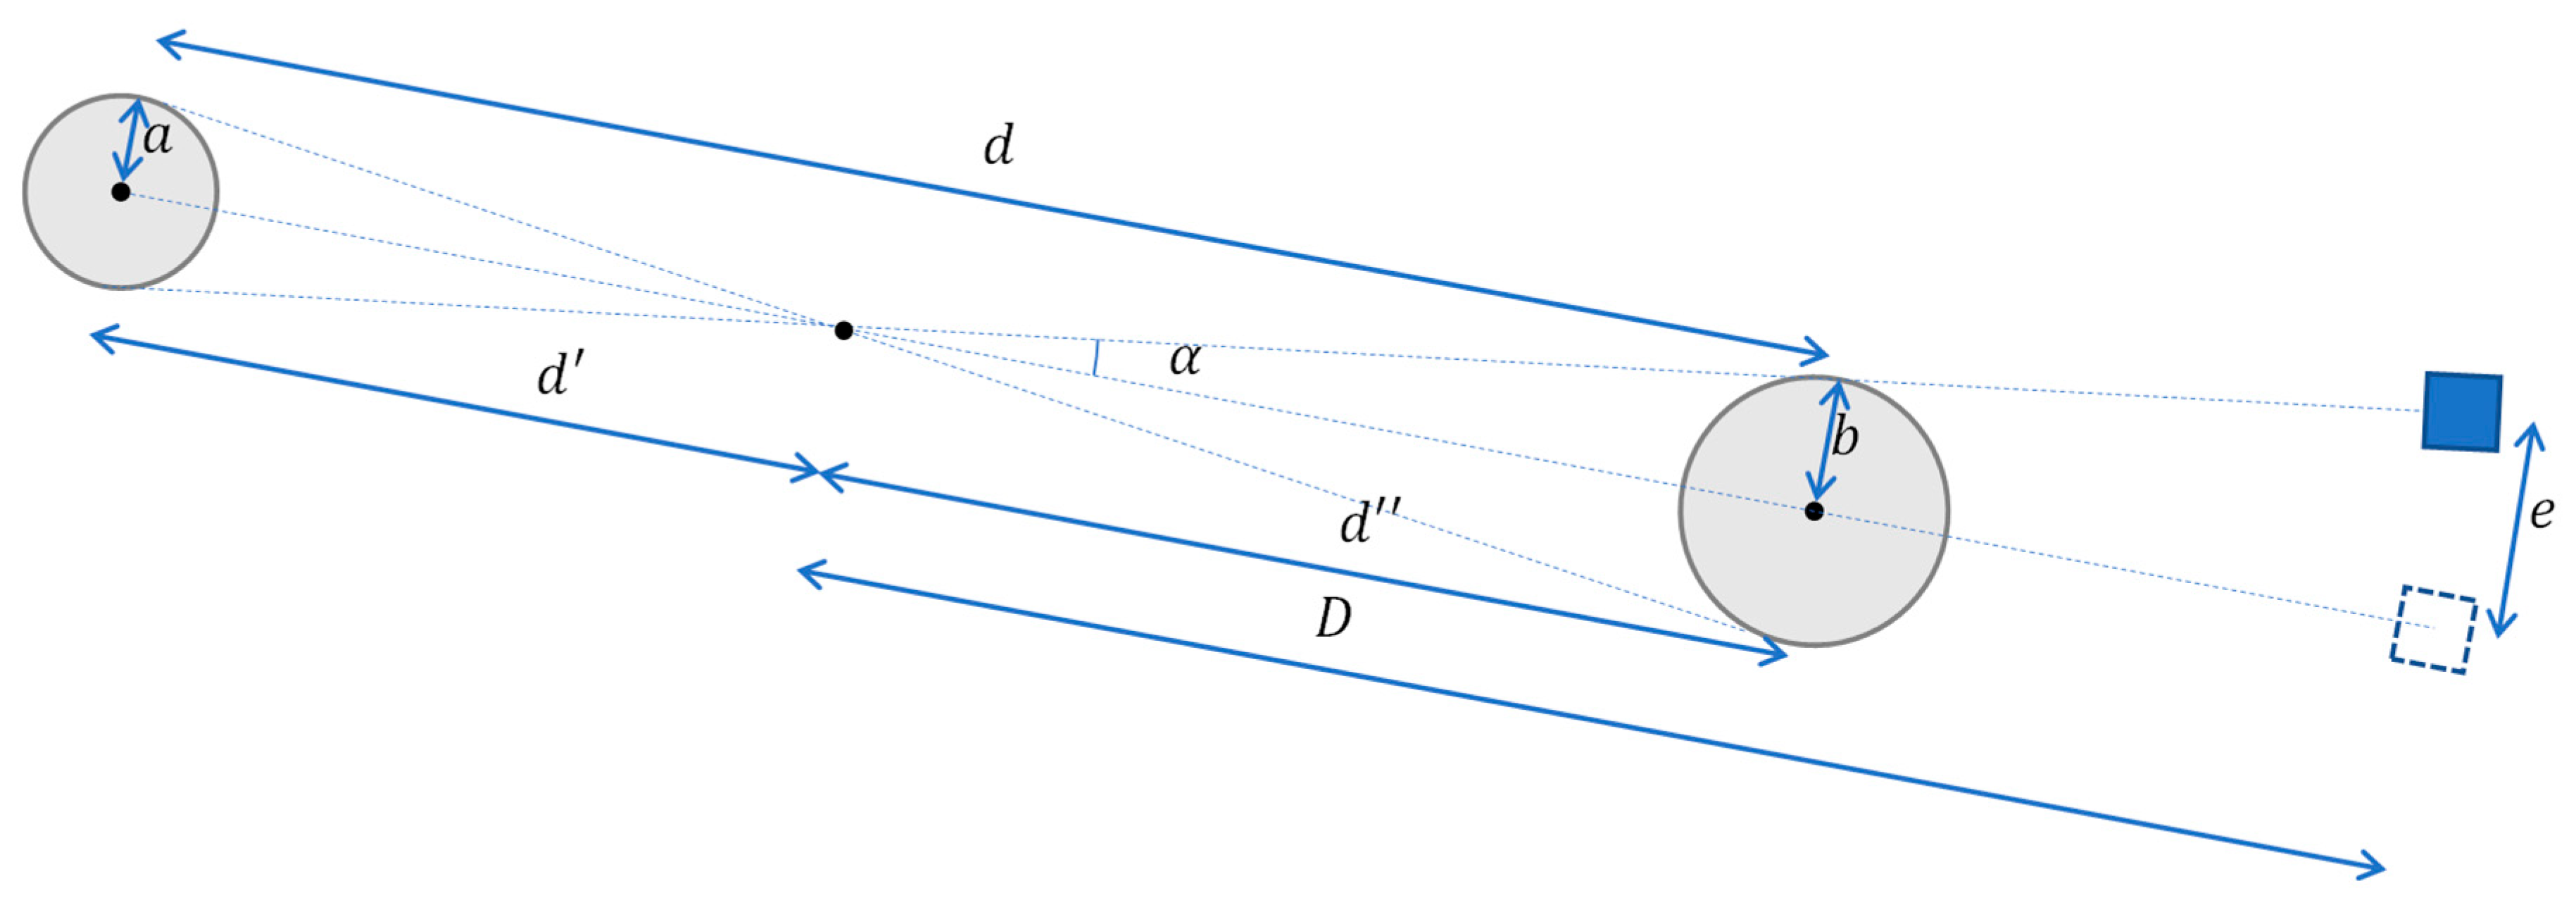
3.2.2. RTK Position Accuracy

Accuracy refers to the radius of the circle of the unknown around a true point. The smaller the radius, the higher the accuracy. A receiver with sub-meter accuracy can plot a position within a sub-meter radius of the true point. Horizontal component (e.g., easting and northing) accuracy is expressed by either the circular error probable (CEP) or twice distance root-mean-square radial error (2drms). CEP means that there is a 50% probability that the actual horizontal position is found within a circle with a radius equal to the CEP value. The associated probability level of the 2drms ranges from 95.4% to 98.2% based on the relative values of the errors in the eastern and northern components. The ratio of the 2drms to the CEP ranges from 2.4 to 3. This indicates that an accuracy of 40 m (CEP) corresponds to 100 m (2drms) for a ratio of 2.5. The nominal accuracy of the currently used GPS device is about a = 0.02   m in the RTK Fix mode. Precision pertains to the consistency of results or how often a receiver can mark a location within the accuracy circle and whether that circle is aligned with the actual point.
The RTK receiver also provides accuracy estimates both horizontal ( h A c c ) and vertical ( v A c c ). The smallest value is achieved when the GNSS module is in the RTK Fix mode ( h A c c = 14   m m ). Given an accuracy measure a i that takes values greater than 14.0 mm, the total weight among multiple values can be taken from Equation (22):
w i = h A c c M i n M a x a i , h A c c M i n 2
The weight approaches 1 when in the RTK Fix mode ( a i = h A c c M i n ), it goes to 1/4 when the accuracy value doubles, rising very rapidly when losing the RTK fix. This weight value is used to assess the accuracy and to filter the RTK positions.

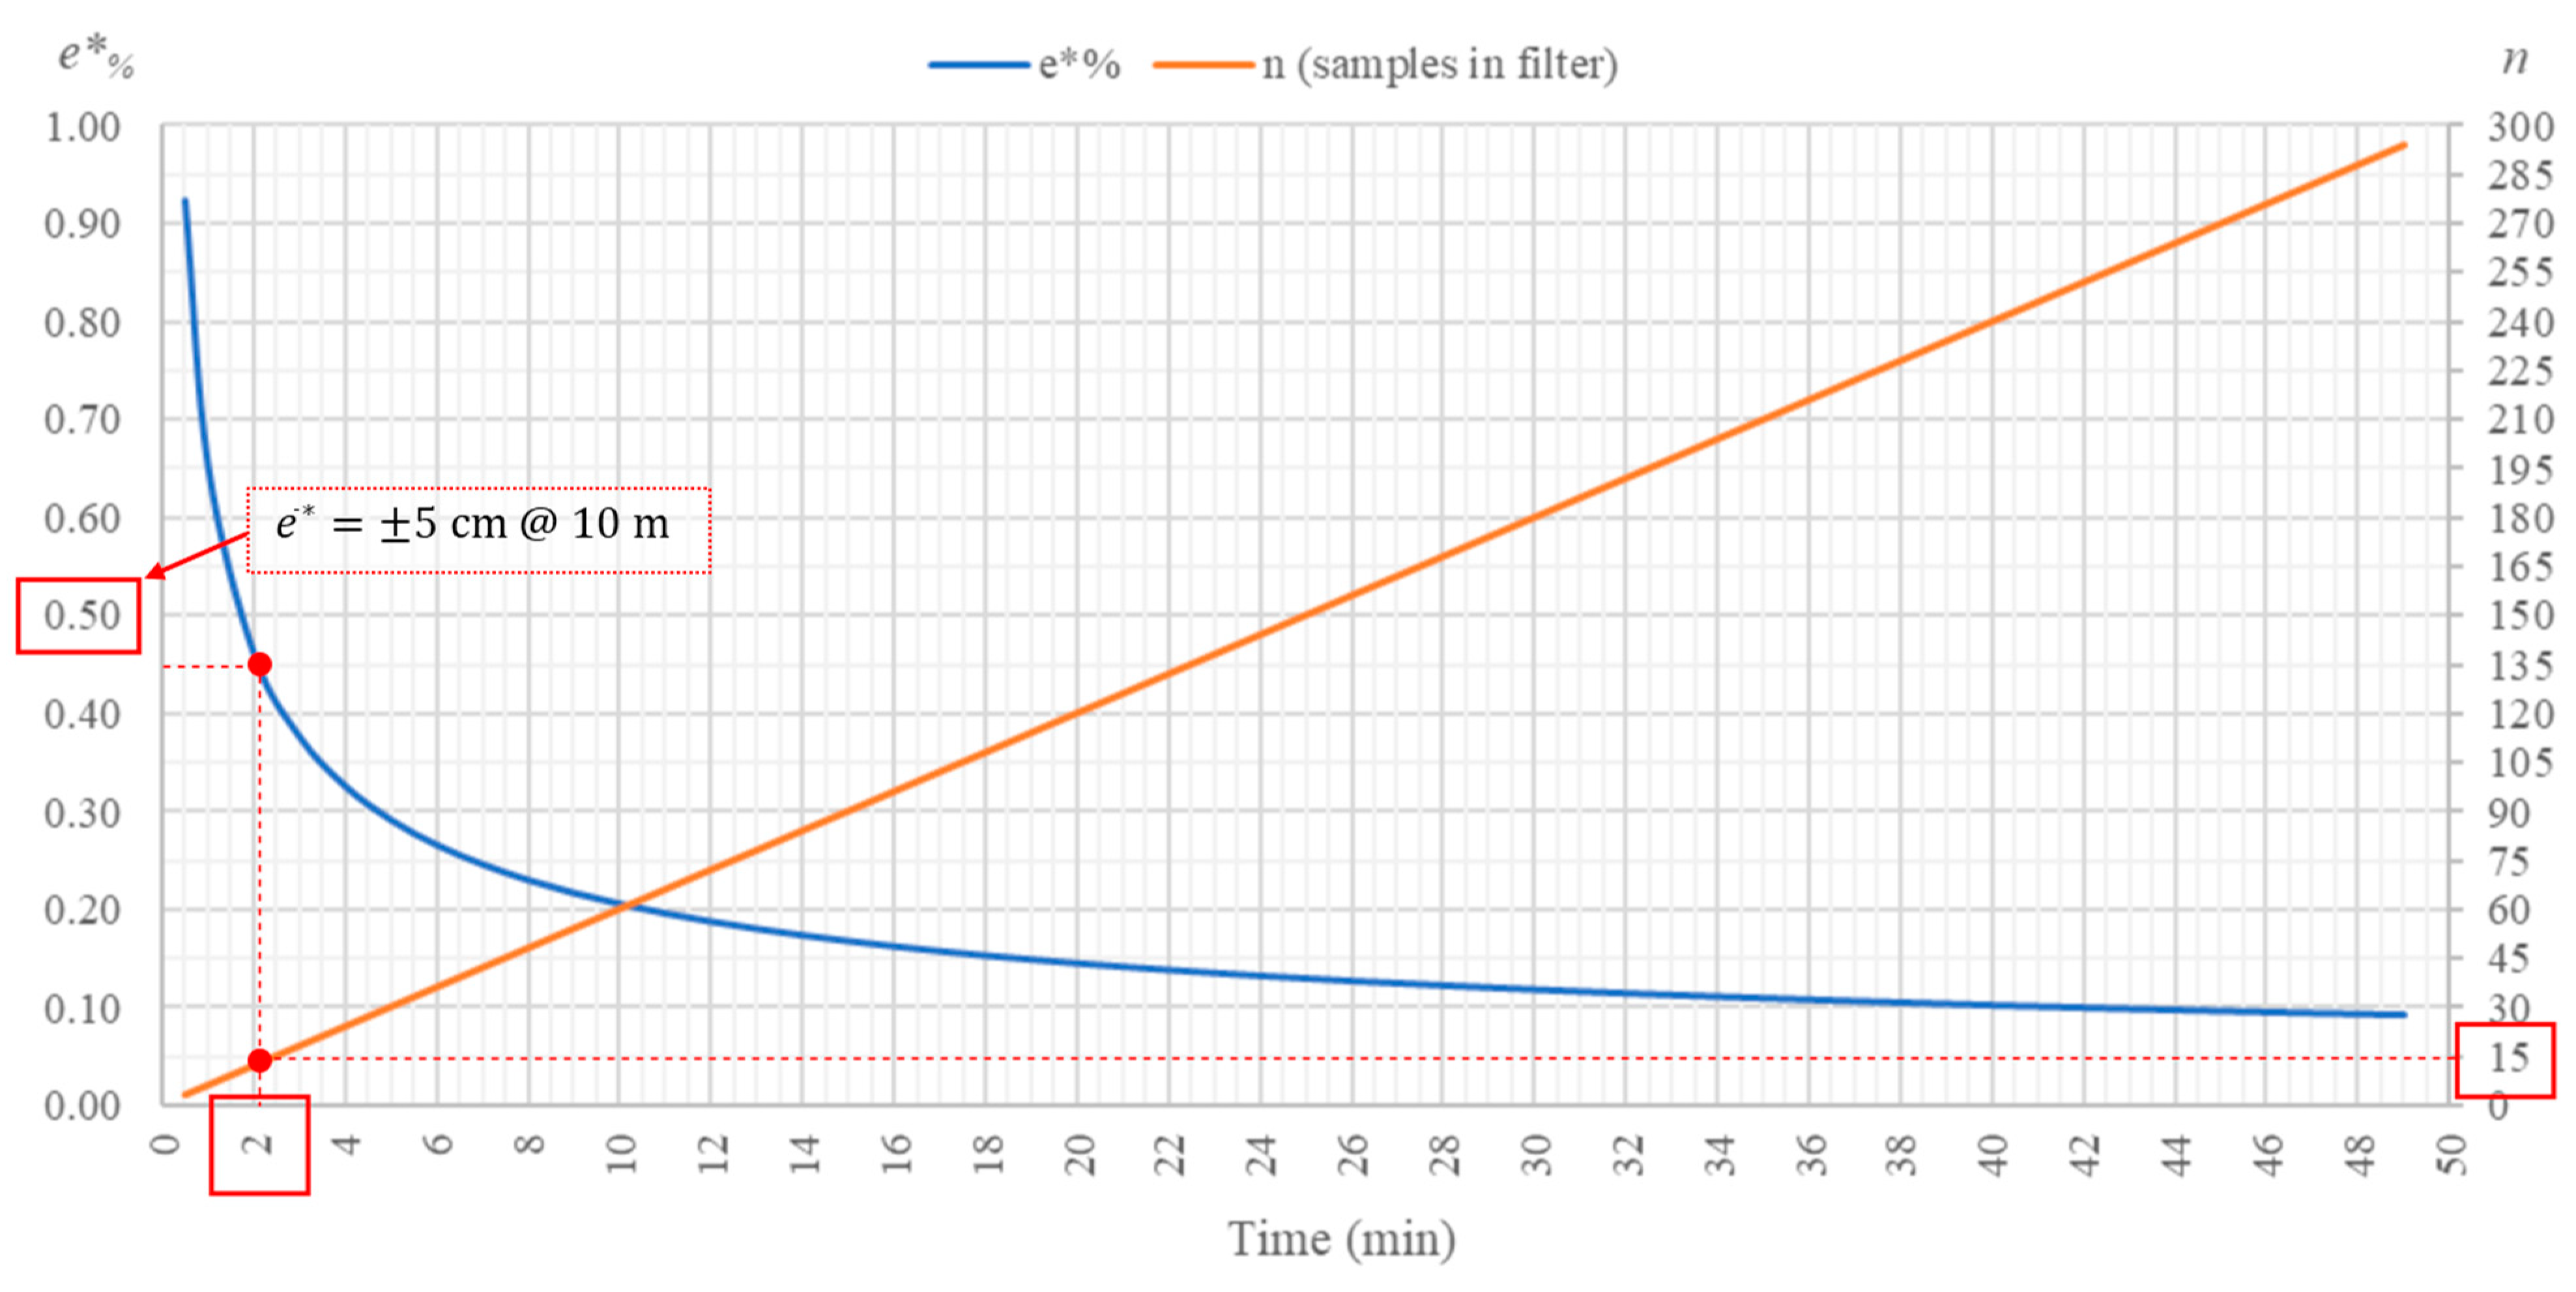
3.2.3. Filtering RTK Position

The latitude of a location on the Earth represents an angle that ranges continuously from −90° and 90°. However, when moving locally its values changes very little and a double precision is needed to appreciate the variation. A vector sum could theoretically be used as in the azimuth case, but numerical errors would significantly degrade the result. In this case it is more appropriate to use a simple mean for implementing the moving mean filter as shown by Equation (23):
φ ¯ = i = 1 n w i φ i i = 1 n w i
The longitude of a location on the Earth represents an angle that ranges from −180° and 180° and is affected by a discontinuity at 180° (in the middle of Pacific Ocean). Therefore, if one wants to compute the mean in each location of the Earth as performed for the latitude, the discontinuity must be avoided. When one is located in the Pacific hemisphere, in order to guarantee that the discontinuity is far from the current location, a shifted longitude must be used instead of the actual one λ = λ + 360   %   360 180 , where the % operator stands for the remainder of division. Therefore, the shifted mean value for longitude λ ¯ is computed by using Equation (24):
λ ¯ = i = 1 n w i λ i i = 1 n w i ,         λ i = λ i , i f λ n < 90 λ i + 360   %   360 180 , i f λ n 90
and the actual mean value for longitude λ ¯ is obtained through Equation (25) applying again the same fix based on hemisphere:
λ ¯ = λ ¯ , i f λ n < 90 λ ¯ + 360   %   360 180 , i f λ n 90
The altitude of a location with respect to the mean sea level is expressed in meters and ranges from −413 m (Mar Morto) to 8.848 m (Everest). A single precision number is sufficient to represent it. A moving mean from a set of altitude measures can be simply computed by a weighted sum as shown by Equation (26):
h ¯ = i = 1 n w i h i i = 1 n w i

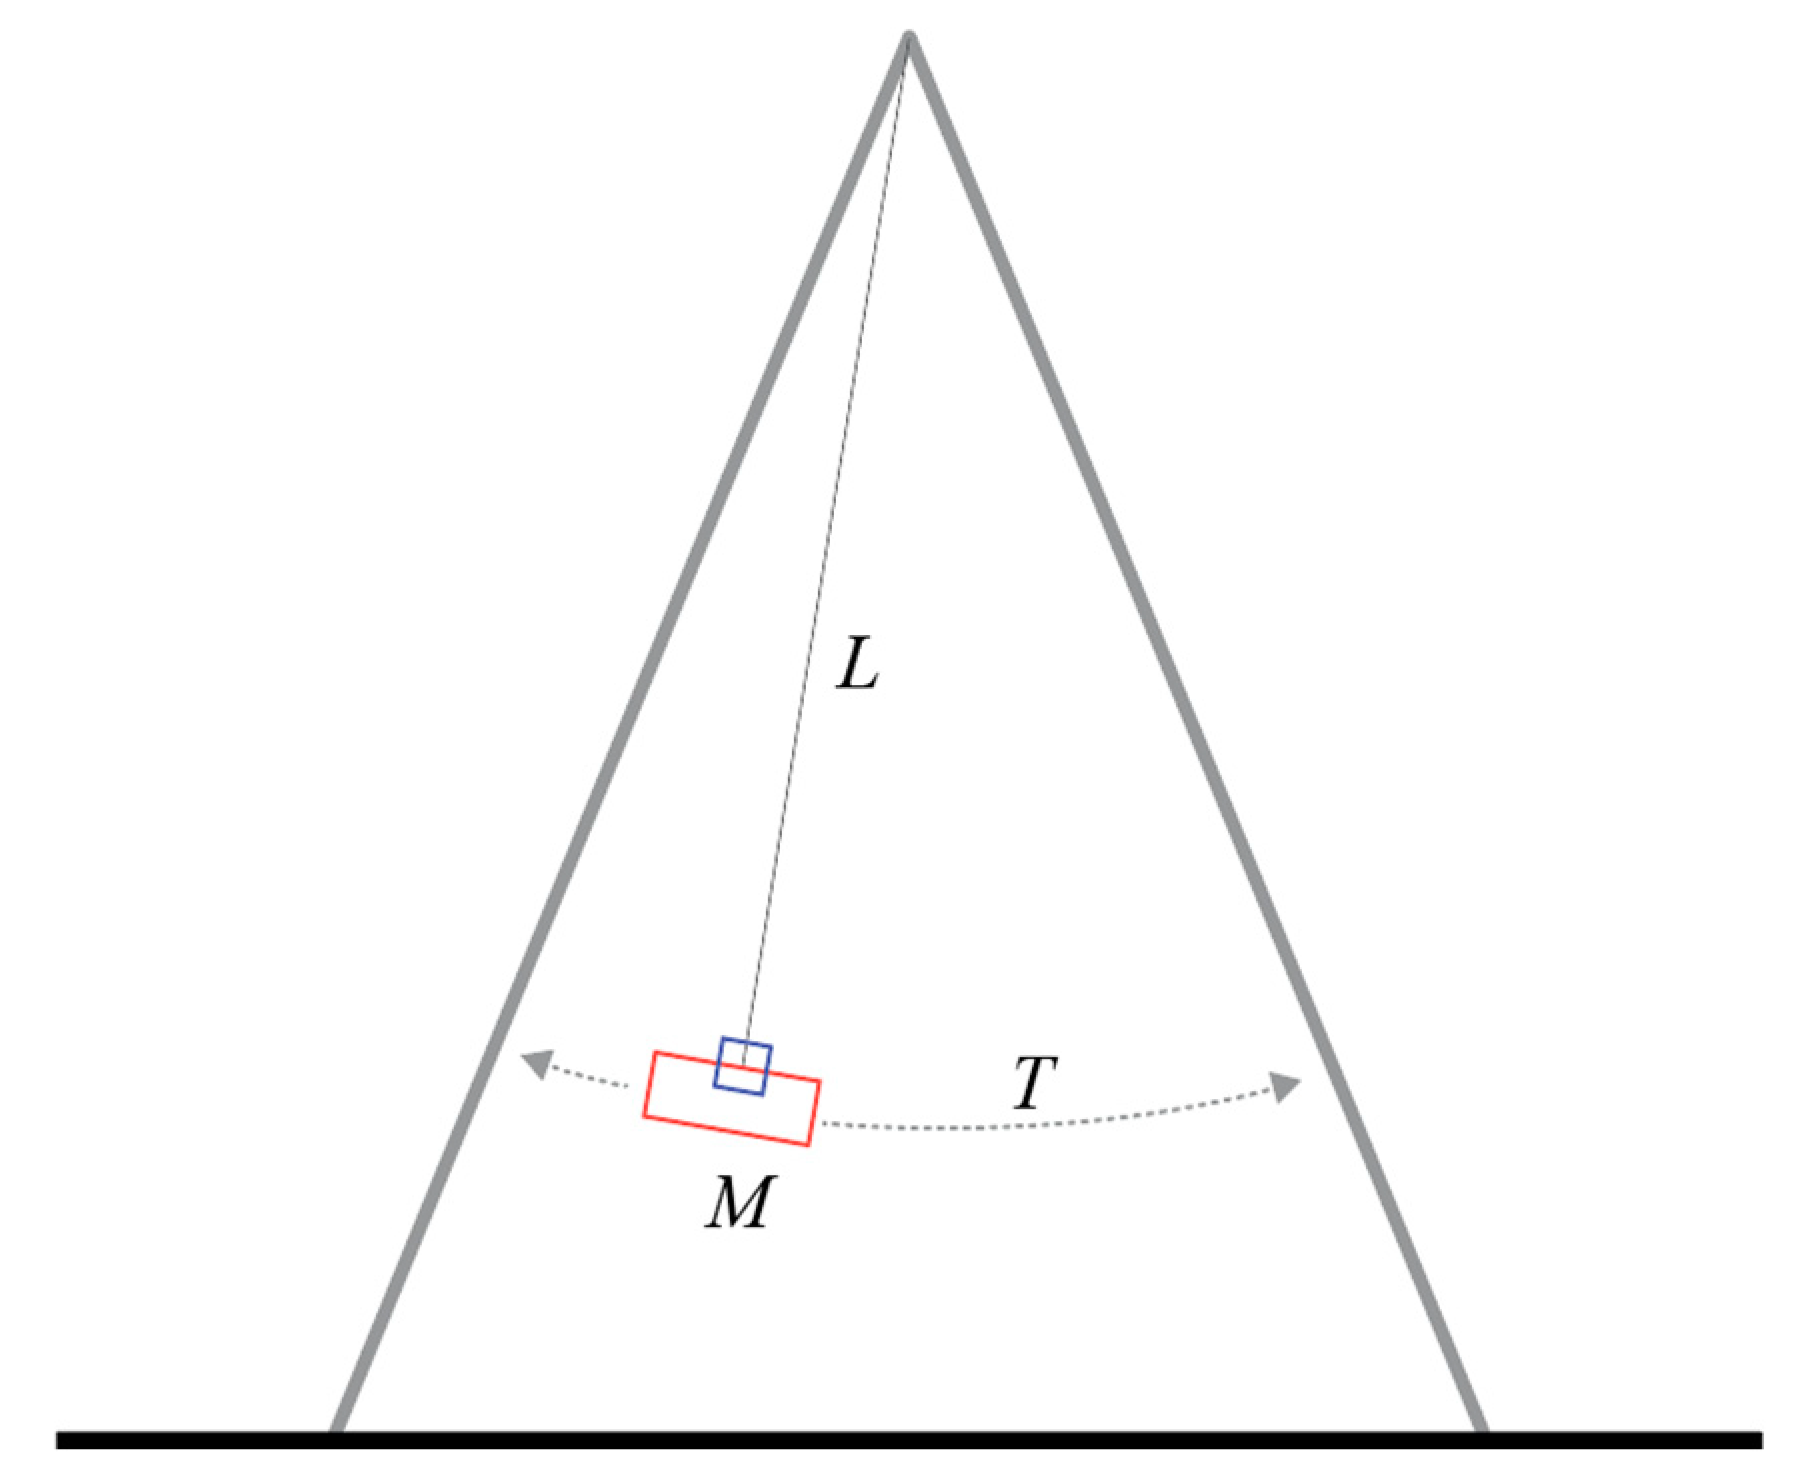
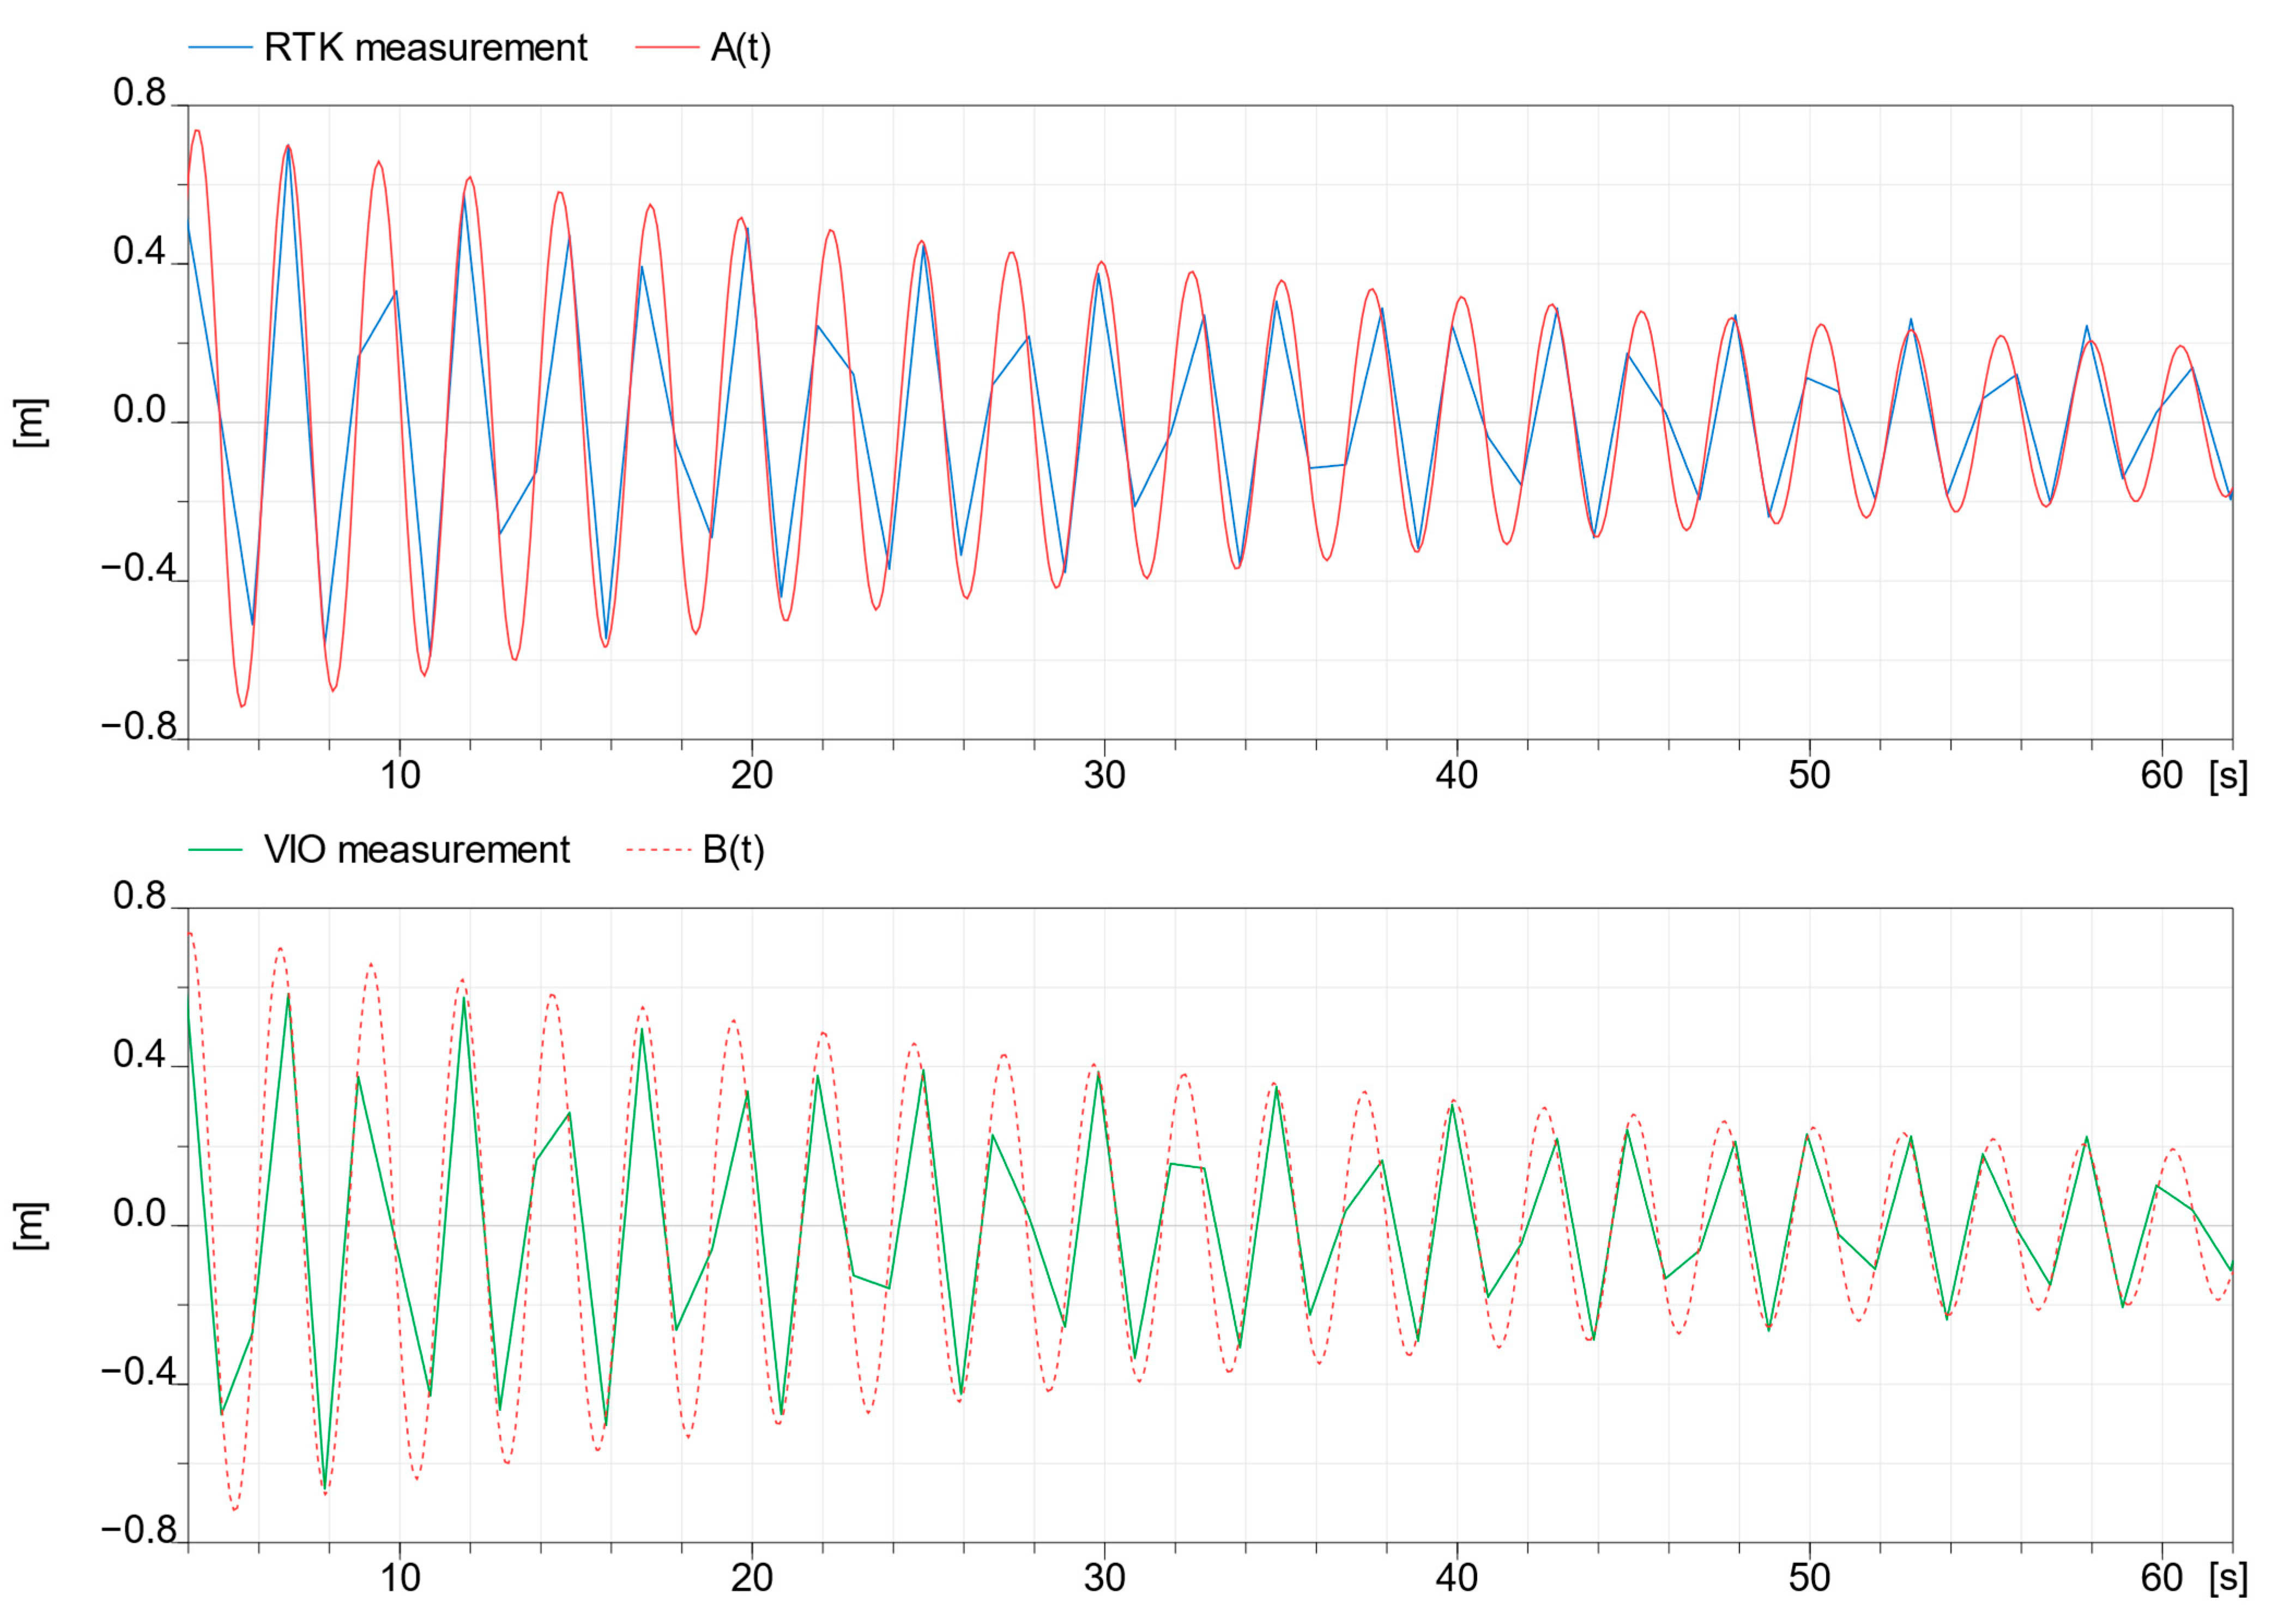
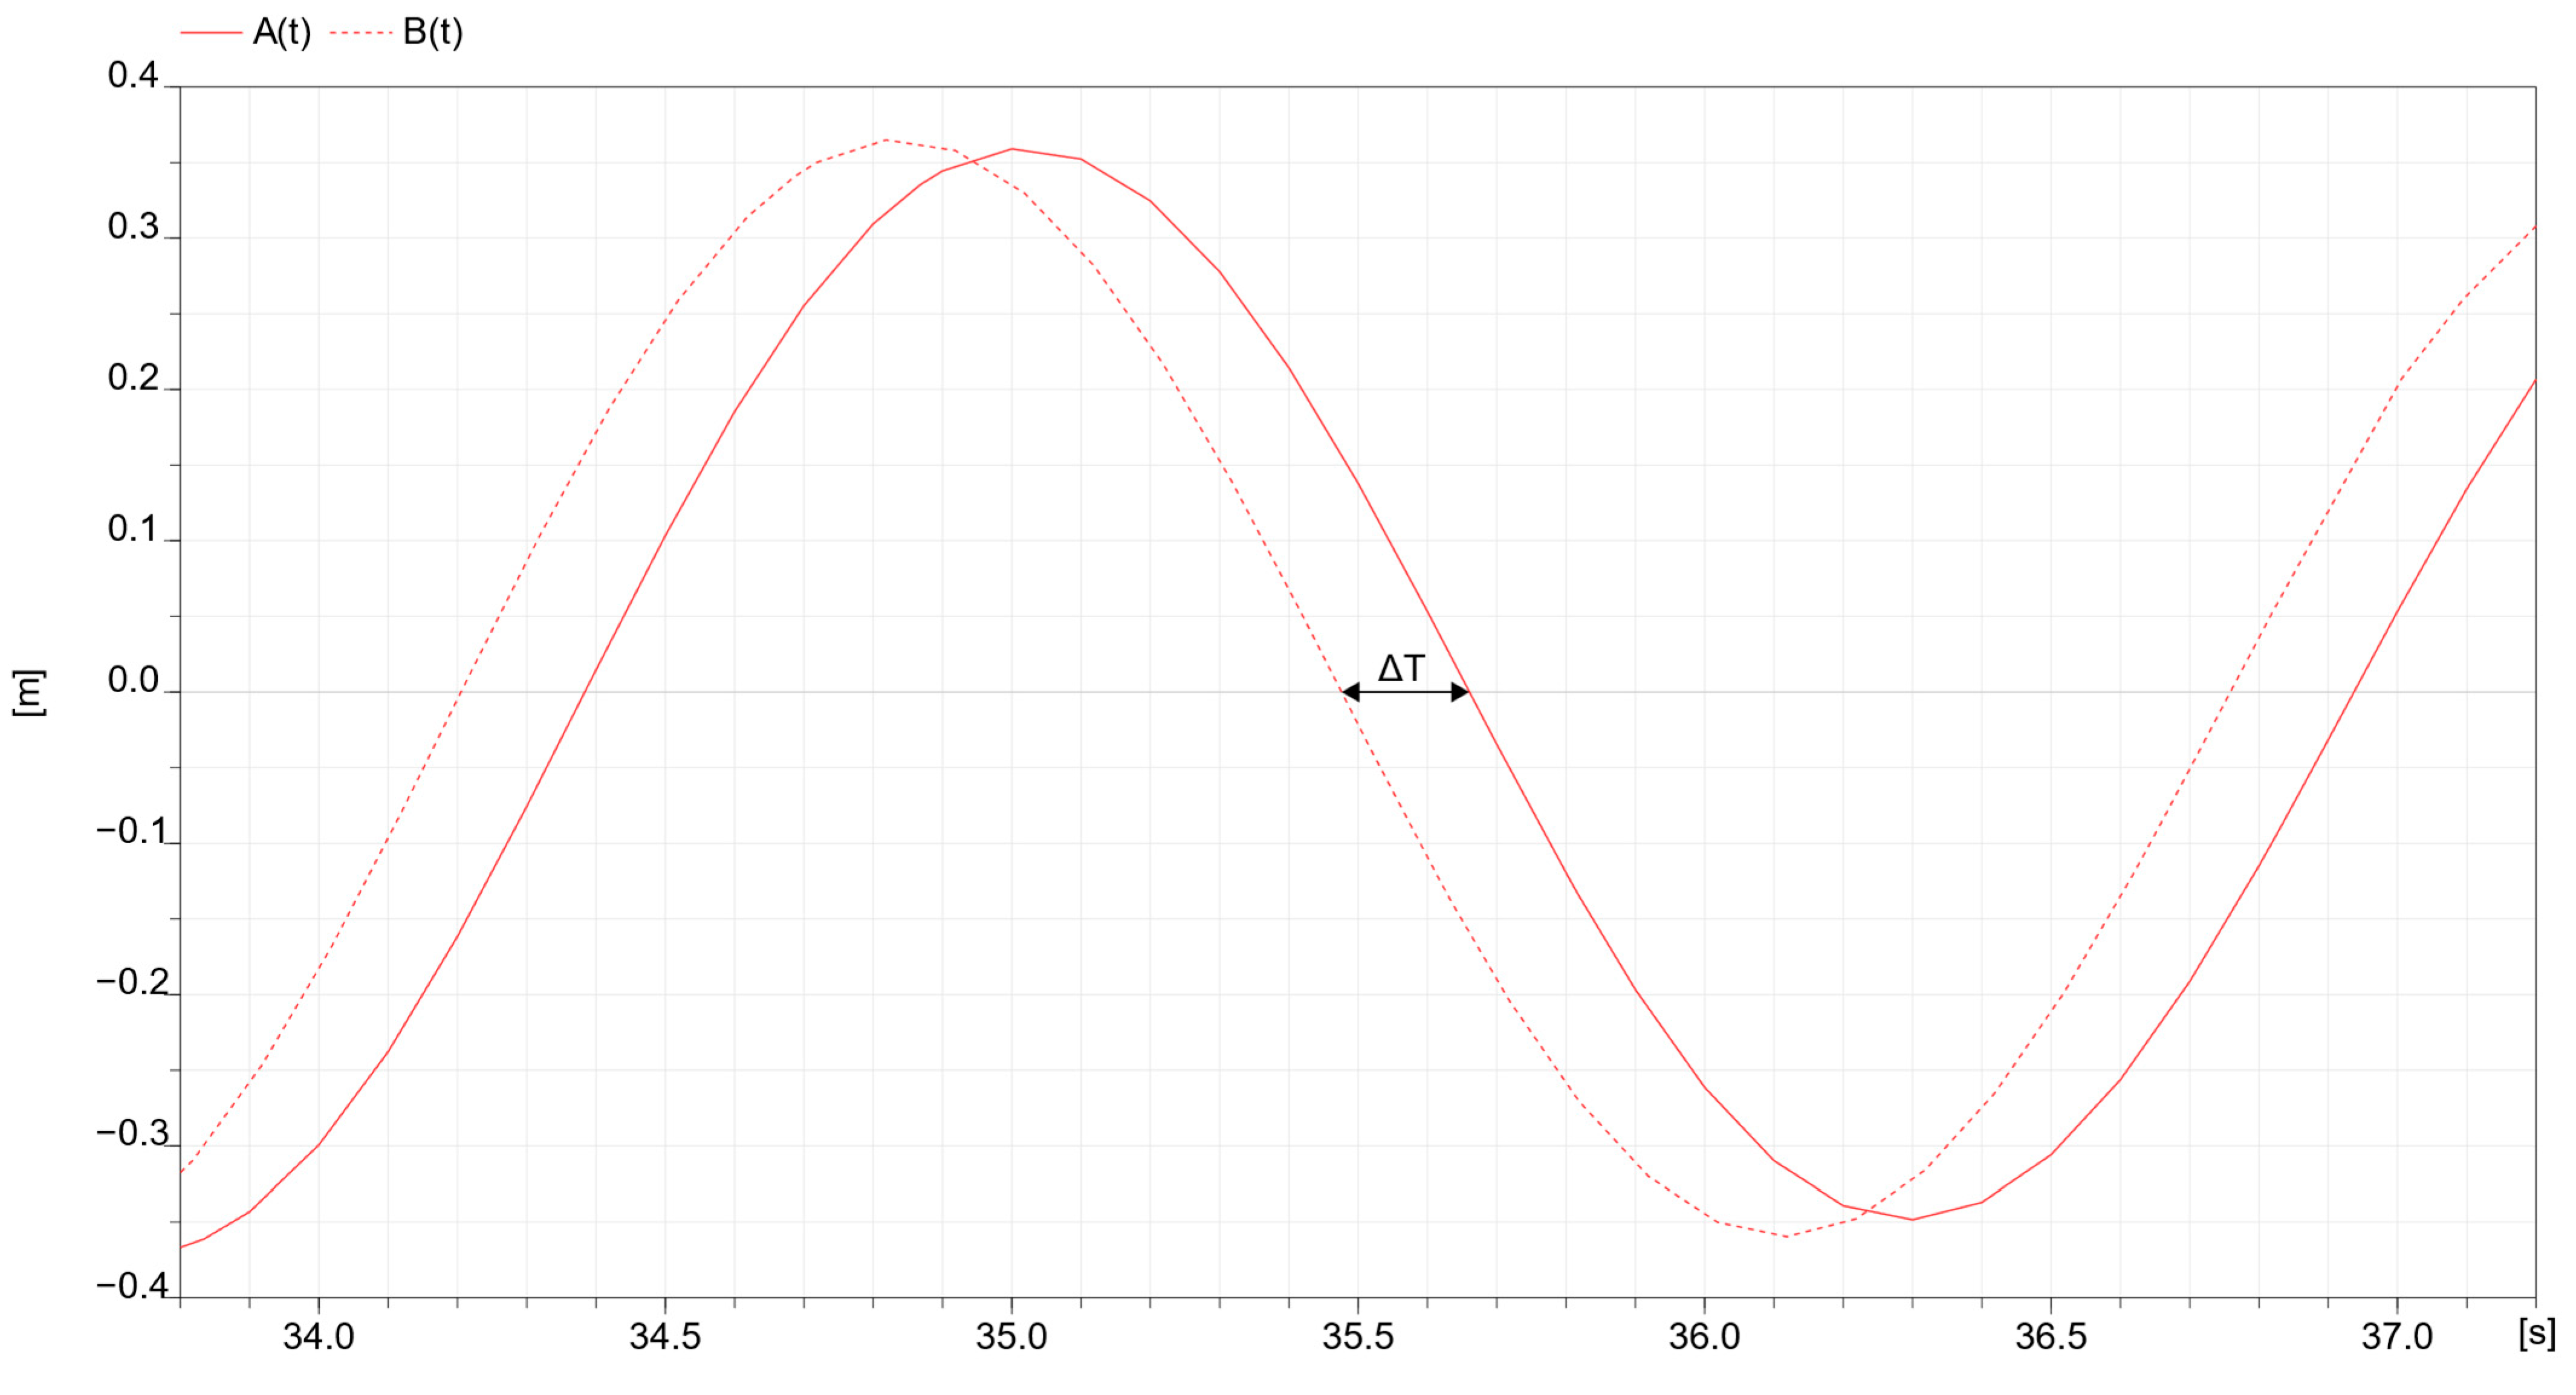
3.2.4. Latency Time Compensation

Whereas local pose estimates from the visual–inertial tracking system occur in real time, with no time latency, the geographical pose measurements experience latency time due to the Bluetooth communication. Latency increases errors in pose estimation because delayed geographical measurements are matched with temporally mismatched local measurements. RTK-VIO latency introduces a constant error. Taking into account the phase difference computation, common in the field of electronics for calculating the phase delay between signals, the method of analysis followed for calculating the temporal offset between the two tracking systems starts by interpolating discrete measurements taken during an oscillation using a simple pendulum model (Figure 11), which are previously projected onto a horizontal plane, to define sinusoidal patterns of both tracking systems.
Once the two functions A ( t ) for the GNSS-RTK tracking system and B ( t ) for the VIO tracking system have been defined, they can be compared and the temporal offset computed from there. Parameters to be considered are the length of the pendulum L = 1.60   m , the mass of the object M = 1.04   k g , and the gravitational acceleration g = 9.81   m / s 2 . It is then possible to derive the period of the pendulum in seconds T = 2 π ( L / g ) , which is estimated in our case to be T = 2.537   s . As visible in Figure 12, the extraction of the sinusoidal functions A ( t ) and B ( t ) is performed by interpolating discrete positional measurements (blue and green lines) taken from both the tracking systems: GNSS-RTK (top chart) and VIO (bottom chart). This is achieved by shifting two damped sine functions A ( t ) and B ( t ) obtained by simulating the pendulum model in a Modelica environment until it overlaps the measured samples. Y-axis represents the horizontally projected displacement of the systems during the oscillations, while X-axis represents the time in seconds. The temporal offset between the GNSS-RTK and VIO tracking systems can be estimated, by evaluating the temporal delay between the two damped sine functions A ( t ) and B ( t ) , as shown in Figure 13. It should be noted that, as expected, the measurements from the GNSS-RTK system show a slight delay compared to those from the VIO system due to computation and communication times. In this specific case, the delay is estimated to be Δ T = 0.18   s . To ensure data synchronization while performing the registration, Δ T is used to compensate for the time offset between the two tracking systems: VIO measurements taken at each update are stored in an 18 ms buffer, then each RTK sample is matched to the last sample in this buffer.

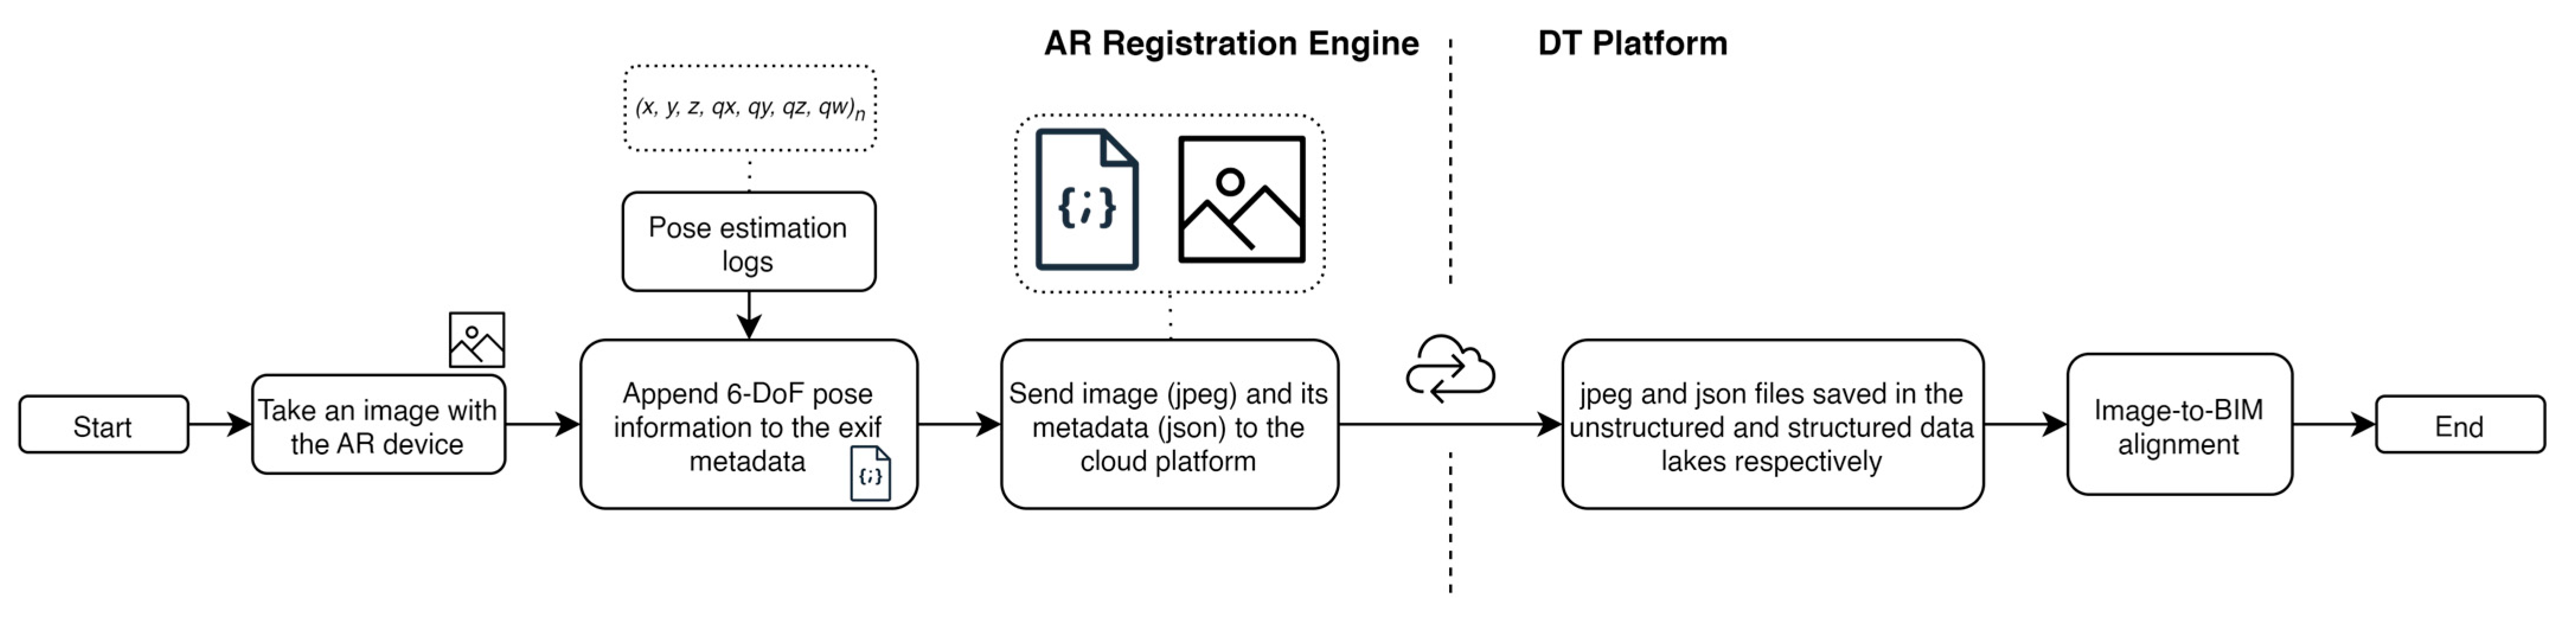
3.3. Image Registration

Every 3D entity in the DT platform has a reference frame anchored to the real world, defined by its geographical coordinates (WGS-84 standard) and orientation relative to the North. These coordinates include latitude (°), longitude (°), altitude (m), and azimuth (°). Simultaneously, the 6-DoF geographic pose of the AR device is continuously computed using the method detailed in the previous sections. Leveraging the seamless computation of the pose of the AR device, captured images can be automatically registered to the corresponding BIM models in the DT platform.
When an image is captured using the AR device, its current 6-DoF geographic pose is embedded into the image’s EXIF metadata. The image and its corresponding metadata are then transmitted to the DT platform through its RESTful API interface. The image file is stored in the unstructured data lake, while its EXIF metadata are stored in the .json format into the graph database. Then, the pose included inside the metadata is used to automatically locate and rotate the image within the DT scene. This process ensures accurate alignment, integration and synchronization of images with the BIM models in the DT scene. A summary of the image registration workflow is presented in Figure 14.

4. Experiments and Results

The system developed in this study was evaluated in a real-world use case, designed to assist an inspector during a routine visual inspection of a highway viaduct. The selected test site was the Volto Santo viaduct, part of the ring road network in Naples, Italy. This particular location was chosen due to its geometric and context characteristics. Indeed, the viaduct features a low span, situating the deck near the foundation level, therefore creating an urban-canyon scenario beneath it. During substructure inspection activities, the bridge’s superstructure partially or fully obstructs GNSS signals.
To validate the hybrid system’s seamless functionality, the inspection followed a route starting from an open area near the viaduct (with RTK coverage), continuing beneath the superstructure for a detailed examination of visible and concealed components of the bridge substructure (e.g., foundations and abutments), and finally returning to the open area (Figure 15). This route was chosen to test the system’s reliability in mixed environments, where GNSS signal accuracy can be significantly reduced, a common challenge in road infrastructure settings. As part of the testing setup, a 3D survey was conducted using mobile mapping technologies capturing point clouds and aligned images across 20 km of the Naples’ ring road and laser scanning for the specific asset. An as-is BIM model of the viaduct was subsequently created, exported in the IFC format, and geographically located within a DT scene of the DT platform by manually inputting its geographic coordinates and orientation into the metadata (Figure 15a).
The system’s operation began by activating the AR application. After the initialization, the Bluetooth modules started sending Bluetooth notifications containing location information at every location message coming from the RTK module. The AR registration engine searches for and connects to the Bluetooth modules, then it starts receiving notifications every 1s and it parses messages in order to reconstruct the location information in the right units. Without requiring manual registration, holograms of virtual models stored in the DT platform that were within proximity to the user were projected through the AR interface. Specifically, BIM models were retrieved based on the geographic coordinates measured by the RTK system, with a defined maximum range of S m a x = 200   m , adjustable according to the size and scope of the assets under inspection.
The system’s logs recorded during the test (summarized in Table 2) indicated noticeable variations in the accuracy of RTK measurements ( h A c c ) along the inspection route. Indeed, as shown in Table 3, h A c c mean value and precision (in the form of standard deviation) both exceed 2 m of positioning error, showing high variability with sample values ranging from 14 mm to 8 m throughout the whole experimentation phase. Despite these fluctuations, the visualization of AR holograms remained stable and uninterrupted (Figure 16), with no drift issues observed. This allowed the inspector to seamlessly access topological and geometrical data related to the bridge’s foundations and abutments while conducting the visual inspection.
During the inspection, images were captured using the AR device. The AR registration engine automatically embedded the 6-DoF pose information into the EXIF metadata of each image. These images, along with their metadata, were transmitted to the DT platform through the automatic procedure described in Section 3.3. The pose data were subsequently used by the DT platform to align the images within a 3D scene alongside the BIM models. The results of this automatic image registration process are illustrated in Figure 17.

5. Discussion

Since manual model-updating procedures (i.e., field-to-model data registrations) and real-time on-site information access procedures (i.e., model-to-field data registration) are costly and time-consuming [3], the developed registration procedures enable the automatic update of a web-based DT scene, that includes a georeferenced open BIM model, by providing up-to-date aligned (registered) information (in this case images). This also enables faster semantic enrichment of the DT by feeding with aligned data further AI, analytics, and other computer vision procedures [46,65]. The implementation of these additional services is left to future developments of this work. Furthermore, the AR registration automatically provided users with on-site access to and visualization of stored existing data and information, i.e., the geometry from the open BIM model.
The proposed system during the on-site experimentation demonstrated the following features:
  • High-accuracy AR registration with centimeter-level positioning error ( h A c c m i n = 14   m m ) and sub-decimal orientation error ( e ¯ * = ± 5   c m   @ 10   m );
  • No dependency on manual registration processes (in both directions, i.e., model-to-field and field-to-model) or necessity to resort to external infrastructures such as markers;
  • Robust and seamless functionality in urban-canyon scenarios;
  • No drift issues in open environments,
Therefore, the developed registration system met conditions that ensure true applicability and scalability in the context of civil infrastructure [33]. The solutions proposed in this work can be easily scaled to all types of large-scale civil infrastructures as a result of the seamless nature of the developed framework. Moreover, affordability at the consumer level is met given the use of low-cost, non-invasive solutions [66].
To the authors’ knowledge, this study is the first to integrate a DT platform based on knowledge graphs technology with a high-accuracy, geographic-scale AR registration system in a real-world application. Limitations of the system include the need for RTK coverage in the area of operation, at least for an initial registration. However, national authorities have already begun work on large-scale deployment of RTK coverage [66]. Ground motions (including plate tectonics, earthquakes, and bradyseisms), can affect the registration of virtual model holograms. In fact, the true geographic position of an object may change significantly over time, resulting in a visual offset that would disrupt inspection activities rather than support them. Tectonic plates shift on average 1.5 cm/year, with peaks of 10 cm/year. The effects of earthquakes and bradyseisms in the most susceptible areas can cause additional displacements that exceed 1.0 cm/month [67,68]. In these scenarios the virtual models need to be georeferenced frequently over time to maintain registration accuracy.
The future developments of this work includes
  • An automatic on-site procedure to update the geographical position of the virtual models on the platform through the AR interface. This would address the ground motion issue that causes misalignment between the real and virtual entities.
  • Semantic extraction (e.g., presence of damages) from the registered images. This would further enrich the models and offer on-field visualization of the damage evolution state through AR.
  • Further enhancement of the pose estimation accuracy and latency compensation by validating the system under varied context conditions.
  • Additional on-site testing to demonstrate the scalability of the system to other types of infrastructure assets (e.g., road pavement) and systems of infrastructures.
  • The implementation of a multi-user AR visualization to foster collaboration during complex infrastructure inspection activities.
  • A direct comparative usability testing with the existing Asset Management System.
  • A comparison with an alternative AR solution in terms of the usability and accuracy of the systems.

6. Conclusions

The reliance on manual procedures for geometric and semantic alignment (registration) with the digital models of new data from inspection activities, as well as for on-field access to the existing information, presents a persistent challenge in civil infrastructure management. The manual registration processes significantly slow down and complicate inspection, maintenance, and decision-making tasks related to road infrastructure [23,33,69].
This paper addresses the registration challenges by presenting a high-accuracy, automatic AR-based registration method and system. The proposed approach seamlessly facilitates the registration, linking, accessing, and querying of data on site, even in large-scale and unprepared open environments. To cope with complex scenarios, including urban-canyon conditions, a hybrid approach combining RTK-GNSS and VIO tracking systems was developed for continuous 6-DoF geographic pose estimation of the AR device. The implementation of the system involved the development of a prototype low-cost RTK receiver and related add-on for secure connection with HoloLens 2 (the AR device used for testing purposes). The system’s accuracy and stability were enhanced through the application of multiple filters on pose estimations, along with compensation for latency issues inherent in hybrid tracking systems. Furthermore, the AR-based registration system was integrated with a web-based DT platform for civil infrastructure management, capable of handling both structured data (e.g., BIM models) and unstructured data (e.g., images) while supporting multi-scale and multi-model queries.
The system was tested in a real-world use case to assist a routine visual inspection of a highway viaduct, i.e., the Volto Santo viaduct in Naples, Italy. During the inspection, the system automatically enabled access via high-accuracy AR visualization to relevant information present in the open BIM models in the DT platform, deemed valuable from domain experts for providing direct access to information related to the structural and geometric topology of buried and hidden structures, including foundations and abutments of the viaduct [24,27,45]. On the other hand, the automatic registration of newly captured visual data (images) with the open BIM models in the DT platform was found to be valuable from domain experts for documenting the deterioration status of the asset [17,33,70]. Additionally, the automatic enrichment of DT scenes with aligned images will enable the integration of further automated agents (e.g., AI and analytics) to further enrich the DT with critical semantic information. For instance, computer vision algorithms can be integrated to detect defects onto the registered images [46,65].
By focusing on consumer accessibility and non-invasiveness, and given the scalability of the proposed system, this work aims to promote widespread adoption of AR technologies in O&M activities of civil infrastructure for boosting their efficiency.

Author Contributions

Conceptualization, L.B., M.V. and B.N.; methodology, L.B., B.N. and M.V.; software, M.V. and F.S.; validation, L.B., L.M. and M.V.; formal analysis, M.V. and L.B.; investigation, L.B. and M.V.; data curation, L.B., L.M. and M.V.; writing—original draft preparation, L.B.; writing—review and editing, L.B., F.S., M.V., L.M. and B.N.; visualization, L.B. and M.V.; supervision, B.N.; project administration, B.N.; funding acquisition, B.N. All authors have read and agreed to the published version of the manuscript.

Funding

This research has received funding from Task n. 4 “Education and Research” of the National Recovery and Resilience Plan (NRRP) and in particular component 2—investment 1.4, “Strengthening research facilities and creating “national R&D champions” on some Key Enabling Technologies” funded by the European Union—NextGenerationEU—research program named “Sustainable Mobility Center (Centro Nazionale per la Mobilità Sostenibile—CNMS)”—application code CN_000023—CUP I33C22001240001.

Data Availability Statement

The raw data supporting the conclusions of this article will be made available by the authors on request.

Acknowledgments

The authors acknowledge the support and feedback from the Chairs and Co-Chairs of CONVR 2024. The authors thank Asprone D., Bilotta A. and Mariniello G. (University of Naples Federico II) for providing access to the Volto Santo viaduct and for developing the BIM model of the use case.

Conflicts of Interest

The authors declare no conflicts of interest. The funders had no role in the design of the study; in the collection, analyses, or interpretation of data; in the writing of the manuscript; or in the decision to publish the results.

References

  1. Eurostat Energy, Transport and Environment Statistics 2019 Edition. Available online: https://ec.europa.eu/eurostat/documents/3217494/10165279/KS-DK-19-001-EN-N.pdf/76651a29-b817-eed4-f9f2-92bf692e1ed9?t=1571144140000 (accessed on 5 October 2023).
  2. Autori, R.F.; Adinolfi, F.; Peleggi, G.; Vecchio, Y.; Pauselli, G. DIVULGA Elaboration on Eurostat and World Economic Forum Data. Available online: https://www.divulgastudi.it/wp-content/uploads/2022/04/Focus_Infrastruttura-Italia.pdf (accessed on 5 October 2023).
  3. Frangopol, D.; Tsompanakis, Y. Maintenance and Safety of Aging Infrastructure; Frangopol, D., Tsompanakis, Y., Eds.; CRC Press: Boca Raton, FL, USA, 2014; ISBN 9780429220586. [Google Scholar]
  4. World Economic Forum the Global Competitiveness Report 2019. Available online: https://www3.weforum.org/docs/WEF_TheGlobalCompetitivenessReport2019.pdf (accessed on 5 October 2023).
  5. World Economic Forum the Global Competitiveness Report Special Edition 2020. Available online: https://www3.weforum.org/docs/WEF_TheGlobalCompetitivenessReport2020.pdf (accessed on 5 October 2023).
  6. Matos, J.C.; Nicoletti, V.; Kralovanec, J.; Sousa, H.S.; Gara, F.; Moravcik, M.; Morais, M.J. Comparison of Condition Rating Systems for Bridges in Three European Countries. Appl. Sci. 2023, 13, 12343. [Google Scholar] [CrossRef]
  7. Lin, J.J.; Ibrahim, A.; Sarwade, S.; Golparvar-Fard, M. Bridge Inspection with Aerial Robots: Automating the Entire Pipeline of Visual Data Capture, 3D Mapping, Defect Detection, Analysis, and Reporting. J. Comput. Civ. Eng. 2021, 35, 4020064. [Google Scholar] [CrossRef]
  8. Zhang, Z.; Zhu, L. A Review on Unmanned Aerial Vehicle Remote Sensing: Platforms, Sensors, Data Processing Methods, and Applications. Drones 2023, 7, 398. [Google Scholar] [CrossRef]
  9. Lapointe, J.-F.; Allili, M.S.; Belliveau, L.; Hebbache, L.; Amirkhani, D.; Sekkati, H. AI-AR for Bridge Inspection by Drone. In Virtual, Augmented and Mixed Reality: Applications in Education, Aviation and Industry, Proceedings of the 14th International Conference, VAMR 2022, Held as Part of the 24th HCI International Conference, HCII 2022, Virtual, 26 June–1 July 2022; Chen, J.Y.C., Fragomeni, G., Eds.; Lecture Notes in Computer Science; Springer: Cham, Switzerland, 2022; Volume 13318, pp. 302–313. [Google Scholar]
  10. Catbas, F.N.; Luleci, F.; Zakaria, M.; Bagci, U.; LaViola, J.J.; Cruz-Neira, C.; Reiners, D. Extended Reality (XR) for Condition Assessment of Civil Engineering Structures: A Literature Review. Sensors 2022, 22, 9560. [Google Scholar] [CrossRef]
  11. Mousavi, V.; Rashidi, M.; Mohammadi, M.; Samali, B. Evolution of Digital Twin Frameworks in Bridge Management: Review and Future Directions. Remote Sens. 2024, 16, 1887. [Google Scholar] [CrossRef]
  12. Lu, Q.; Xie, X.; Heaton, J.; Parlikad, A.K.; Schooling, J. From BIM Towards Digital Twin: Strategy and Future Development for Smart Asset Management. In Service Oriented, Holonic and Multi-Agent Manufacturing Systems for Industry of the Future; Borangiu, T., Trentesaux, D., Leitão, P., Boggino, A.G., Botti, V., Eds.; Springer International Publishing: Cham, Switzerland, 2020; pp. 392–404. [Google Scholar]
  13. Callcut, M.; Cerceau Agliozzo, J.-P.; Varga, L.; McMillan, L. Digital Twins in Civil Infrastructure Systems. Sustainability 2021, 13, 11549. [Google Scholar] [CrossRef]
  14. Naderi, H.; Shojaei, A. Digital Twinning of Civil Infrastructures: Current State of Model Architectures, Interoperability Solutions, and Future Prospects. Autom. Constr. 2023, 149, 104785. [Google Scholar] [CrossRef]
  15. Vignali, V.; Acerra, E.M.; Lantieri, C.; Di Vincenzo, F.; Piacentini, G.; Pancaldi, S. Building Information Modelling (BIM) Application for an Existing Road Infrastructure. Autom. Constr. 2021, 128, 103752. [Google Scholar] [CrossRef]
  16. Sacks, R.; Ma, L.; Yosef, R.; Borrmann, A.; Daum, S.; Kattel, U. Semantic Enrichment for Building Information Modeling: Procedure for Compiling Inference Rules and Operators for Complex Geometry. J. Comput. Civ. Eng. 2017, 31, 04017062. [Google Scholar] [CrossRef]
  17. Chen, J.; Lu, W.; Lou, J. Automatic Concrete Defect Detection and Reconstruction by Aligning Aerial Images onto Semantic-rich Building Information Model. Comput.-Aided Civ. Infrastruct. Eng. 2023, 38, 1079–1098. [Google Scholar] [CrossRef]
  18. Eastman, C.; Teicholz, P.; Sacks, R.; Liston, K. BIM Handbook: A Guide to Building Information Modeling for Owners, Managers, Designers, Engineers and Contractors; Wiley Publishing: Hoboken, NJ, USA, 2008; ISBN 0470185287. [Google Scholar]
  19. Luiten, B.; Bohms, M.; Alsem, D.; O’Keeffe, A. Asset Information Management Using Linked Data for the Life-Cycle of Roads. In Life Cycle Analysis and Assessment in Civil Engineering: Towards an Integrated Vision; CRC Press: London, UK, 2018. [Google Scholar]
  20. Ramonell, C.; Chacón, R.; Posada, H. Knowledge Graph-Based Data Integration System for Digital Twins of Built Assets. Autom. Constr. 2023, 156, 105109. [Google Scholar] [CrossRef]
  21. Tang, S.; Shelden, D.R.; Eastman, C.M.; Pishdad-Bozorgi, P.; Gao, X. A Review of Building Information Modeling (BIM) and the Internet of Things (IoT) Devices Integration: Present Status and Future Trends. Autom. Constr. 2019, 101, 127–139. [Google Scholar] [CrossRef]
  22. Grieves, M.W. Digital Twins: Past, Present, and Future. In The Digital Twin; Crespi, N., Drobot, A.T., Minerva, R., Eds.; Springer International Publishing: Cham, Switzerland, 2023; pp. 97–121. ISBN 978-3-031-21343-4. [Google Scholar]
  23. Broo, D.G.; Schooling, J. Digital Twins in Infrastructure: Definitions, Current Practices, Challenges and Strategies. Int. J. Constr. Manag. 2023, 23, 1254–1263. [Google Scholar] [CrossRef]
  24. Yin, Y.; Zheng, P.; Li, C.; Wang, L. A State-of-the-Art Survey on Augmented Reality-Assisted Digital Twin for Futuristic Human-Centric Industry Transformation. Robot Comput. Integr. Manuf. 2023, 81, 102515. [Google Scholar] [CrossRef]
  25. Bavelos, A.C.; Anastasiou, E.; Dimitropoulos, N.; Oikonomou, G.; Makris, S. Augmented Reality-based Method for Road Maintenance Operators in Human–Robot Collaborative Interventions. Comput.-Aided Civ. Infrastruct. Eng. 2024, 39, 1077–1095. [Google Scholar] [CrossRef]
  26. Messi, L.; Spegni, F.; Vaccarini, M.; Corneli, A.; Binni, L. Seamless Augmented Reality Registration Supporting Facility Management Operations in Unprepared Environments. J. Inf. Technol. Constr. 2024, 29, 1156–1180. [Google Scholar] [CrossRef]
  27. Salman, A.; Ahmad, W. Implementation of Augmented Reality and Mixed Reality Applications for Smart Facilities Management: A Systematic Review. Smart Sustain. Built Environ. 2023, 14, 254–275. [Google Scholar] [CrossRef]
  28. Behzadan, A.H.; Dong, S.; Kamat, V.R. Augmented Reality Visualization: A Review of Civil Infrastructure System Applications. Adv. Eng. Inform. 2015, 29, 252–267. [Google Scholar] [CrossRef]
  29. Xu, J.; Moreu, F. A Review of Augmented Reality Applications in Civil Infrastructure During the 4th Industrial Revolution. Front. Built Environ. 2021, 7, 640732. [Google Scholar] [CrossRef]
  30. Messi, L.; Spegni, F.; Vaccarini, M.; Corneli, A.; Binni, L. Seamless Indoor/Outdoor Marker-Less Augmented Reality Registration Supporting Facility Management Operations. In Proceedings of the 23rd International Conference on Construction Applications of Virtual Reality, Florence, Italy, 13–16 November 2023; Firenze University Press: Florence, Italy, 2023; pp. 109–120, ISBN 9791221502572. [Google Scholar]
  31. Binni, L.; Spegni, F.; Vaccarini, M.; Naticchia, B.; Messi, L. Enhanced Civil Infrastructure Inspections Using Augmented Reality: An Automatic Registration System. In Proceedings of the 24th International Conference on Construction Applications of Virtual Reality (CONVR 2024), Sydney, Australia, 4–6 November 2024. [Google Scholar]
  32. Justo, A.; Soilán, M.; Sánchez-Rodríguez, A.; Riveiro, B. Scan-to-BIM for the Infrastructure Domain: Generation of IFC-Compliant Models of Road Infrastructure Assets and Semantics Using 3D Point Cloud Data. Autom. Constr. 2021, 127, 103703. [Google Scholar] [CrossRef]
  33. Aktan, A.E.; Bartoli, I.; Karaman, S.G. Technology Leveraging for Infrastructure Asset Management: Challenges and Opportunities. Front. Built Environ. 2019, 5, 61. [Google Scholar] [CrossRef]
  34. Stöckner, M.; Brow, I.; Zwernemann, P.; Hajdin, R.; Schiffmann, F.; Blumenfeld, T.; König, M.; Liu, L.; Gavin, K. Exchange and Exploitation of Data from Asset Management Systems Using Vendor Free Format; CEDR Transnational Road Research Programme: Brussels, Belgium, 2022. [Google Scholar]
  35. Biswas, S.; Wright, A.; Kokot, D.; Petrovic, J.; Barateiro, J.; Marecos, V.; Adesiyun, A.; Bhusari, S. CoDEC Final Project Report; CEDR Transnational Road Research Programme: Brussels, Belgium, 2021. [Google Scholar]
  36. Ismail, N.; Ismail, A.; Rahmat, R. An Overview of Expert Systems in Pavement Management. Eur. J. Sci. Res. 2009, 30, 1216–1450. [Google Scholar]
  37. Hagedorn, P.; Liu, L.; König, M.; Hajdin, R.; Blumenfeld, T.; Stöckner, M.; Billmaier, M.; Grossauer, K.; Gavin, K. BIM-Enabled Infrastructure Asset Management Using Information Containers and Semantic Web. J. Comput. Civ. Eng. 2023, 37, 4022041. [Google Scholar] [CrossRef]
  38. Bizer, C.; Heath, T.; Berners-Lee, T. Linked Data—The Story So Far. In Semantic Services, Interoperability and Web Applications: Emerging Concepts; Association for Computing Machinery: New York, NY, USA, 2011; pp. 205–227. [Google Scholar]
  39. Vilgertshofer, S.; Mafipour, M.; Borrmann, A.; Martens, J.; Blut, T.; Becker, R.; Blankenbach, J.; Göbels, A.; Beetz, J.; Celik, F.; et al. TwinGen: Advanced Technologies to Automatically Generate Digital Twins for Operation and Maintenance of Existing Bridges. In ECPPM 2022—eWork and eBusiness in Architecture, Engineering and Construction 2022, Proceedings of the 14th European Conference on Product and Process Modelling (ECPPM 2022), Trondheim, Norway, 14–16 September 2022; CRC Press: London, UK, 2023; pp. 213–220. ISBN 9781003354222. [Google Scholar]
  40. Pfitzner, F.; Braun, A.; Borrmann, A. From Data to Knowledge: Construction Process Analysis through Continuous Image Capturing, Object Detection, and Knowledge Graph Creation. Autom. Constr. 2024, 164, 105451. [Google Scholar] [CrossRef]
  41. Lei, X.; Wu, P.; Zhu, J.; Wang, J. Ontology-Based Information Integration: A State-of-the-Art Review in Road Asset Management. Arch. Comput. Methods Eng. 2022, 29, 2601–2619. [Google Scholar] [CrossRef]
  42. Zhu, J.; Wu, P.; Lei, X. IFC-Graph for Facilitating Building Information Access and Query. Autom. Constr. 2023, 148, 104778. [Google Scholar] [CrossRef]
  43. Liu, L.; Zeng, N.; Liu, Y.; Han, D.; König, M. Multi-Domain Data Integration and Management for Enhancing Service-Oriented Digital Twin for Infrastructure Operation and Maintenance. Dev. Built Environ. 2024, 18, 100475. [Google Scholar] [CrossRef]
  44. Shahzad, M.; Shafiq, M.T.; Douglas, D.; Kassem, M. Digital Twins in Built Environments: An Investigation of the Characteristics, Applications, and Challenges. Buildings 2022, 12, 120. [Google Scholar] [CrossRef]
  45. Mascareñas, D.D.; Ballor, J.P.; McClain, O.L.; Mellor, M.A.; Shen, C.-Y.; Bleck, B.; Morales, J.; Yeong, L.-M.R.; Narushof, B.; Shelton, P.; et al. Augmented Reality for next Generation Infrastructure Inspections. Struct. Health Monit. 2021, 20, 1957–1979. [Google Scholar] [CrossRef]
  46. Çelik, F.; Herbers, P.; König, M. Image Segmentation on Concrete Damage for Augmented Reality Supported Inspection Tasks. In Advances in Information Technology in Civil and Building Engineering, Proceedings of the International Conference on Computing in Civil and Building Engineering (ICCCBE 2022), Cape Town, South Africa, 26–28 October 2022; Skatulla, S., Beushausen, H., Eds.; Lecture Notes in Civil Engineering; Springer: Cham, Switzerland, 2024; Volume 357, pp. 237–252. [Google Scholar]
  47. Nguyen, D.-C.; Nguyen, T.-Q.; Jin, R.; Jeon, C.-H.; Shim, C.-S. BIM-Based Mixed-Reality Application for Bridge Inspection and Maintenance. Constr. Innov. 2022, 22, 487–503. [Google Scholar] [CrossRef]
  48. Riedlinger, U.; Klein, F.; Hill, M.; Neumann, S.; Holst, R.; Oppermann, L.; Bahlau, S. Digital Support for Bridge Inspectors through Mixed Reality BIM Data Visualizations. In Proceedings of the ASCE International Conference on Computing in Civil Engineering 2021, Orlando, FL, USA, 12–14 September 2021; American Society of Civil Engineers: Reston, VA, USA, 2022; pp. 1359–1366. [Google Scholar]
  49. Song, J.; Li, W.; Duan, C.; Zhu, X. R2-GVIO: A Robust, Real-Time GNSS-Visual-Inertial State Estimator in Urban Challenging Environments. IEEE Internet Things J. 2024, 11, 22269–22282. [Google Scholar] [CrossRef]
  50. Song, J.; Li, W.; Duan, C.; Wang, L.; Fan, Y.; Zhu, X. An Optimization-Based Indoor–Outdoor Seamless Positioning Method Integrating GNSS RTK, PS, and VIO. IEEE Trans. Circuits Syst. II Express Briefs 2024, 71, 2889–2893. [Google Scholar] [CrossRef]
  51. Roberts, G.W.; Evans, A.; Dodson, A.H.; Denby, B.; Cooper, S.; Hollands, R. The Use of Augmented Reality, GPS and INS for Subsurface Data Visualisation. In Proceedings of the FIG XXII International Congress, Washington, DC, USA, 19–26 April 2002. [Google Scholar]
  52. He, Z.; Xia, Z.; Chang, Y.; Chen, W.; Hu, J.; Wei, X. Research on Underground Pipeline Augmented Reality System Based on ARToolKit. In Proceedings of the Geoinformatics 2006: Geospatial Information Technology, Wuhan, China, 28–29 October 2006; p. 642112. [Google Scholar]
  53. Hansen, L.H.; Fleck, P.; Stranner, M.; Schmalstieg, D.; Arth, C. Augmented Reality for Subsurface Utility Engineering, Revisited. IEEE Trans. Vis. Comput. Graph. 2021, 27, 4119–4128. [Google Scholar] [CrossRef]
  54. Zhao, S.; Chen, Y.; Farrell, J.A. High-Precision Vehicle Navigation in Urban Environments Using an MEM’s IMU and Single-Frequency GPS Receiver. IEEE Trans. Intell. Transp. Syst. 2016, 17, 2854–2867. [Google Scholar] [CrossRef]
  55. Guarese, R.L.M.; Maciel, A. Development and Usability Analysis of a Mixed Reality GPS Navigation Application for the Microsoft HoloLens. In Advances in Computer Graphics; Springer: Cham, Switzerland, 2019; Volume 11542, pp. 431–437. [Google Scholar]
  56. Kaizu, Y.; Choi, J. Development of a Tractor Navigation System Using Augmented Reality. Eng. Agric. Environ. Food 2012, 5, 96–101. [Google Scholar] [CrossRef]
  57. vGIS Inc. Engineering-Grade AR for AEC. Available online: https://www.vgis.io/augmented-reality-bim-gis-ar-aec-civil-construction-engineering-bentley-autodesk-esri/ (accessed on 20 September 2023).
  58. Liu, T.; Li, B.; Chen, G.; Yang, L.; Qiao, J.; Chen, W. Tightly Coupled Integration of GNSS/UWB/VIO for Reliable and Seamless Positioning. IEEE Trans. Intell. Transp. Syst. 2024, 25, 2116–2128. [Google Scholar] [CrossRef]
  59. Trimble Inc. Site Vision. Available online: https://sitevision.trimble.com/ (accessed on 20 September 2023).
  60. Hübner, P.; Clintworth, K.; Liu, Q.; Weinmann, M.; Wursthorn, S. Evaluation of HoloLens Tracking and Depth Sensing for Indoor Mapping Applications. Sensors 2020, 20, 1021. [Google Scholar] [CrossRef]
  61. Office of Geomatics. World Geodetic System 1984 (WGS 84). Available online: https://earth-info.nga.mil/index.php?dir=wgs84&action=wgs84 (accessed on 30 March 2025).
  62. Wabbena, G.; Schmitz, M.; Bagge, A. PPP-RTK: Precise Point Positioning Using State-Space Representation in RTK Networks. In Proceedings of the 18th International Technical Meeting of the Satellite Division of The Institute of Navigation (ION GNSS 2005), Long Beach, CA, USA, 13–16 September 2005; pp. 2584–2594. [Google Scholar]
  63. Feng, Y.; Wang, J. GPS RTK Performance Characteristics and Analysis. J. Glob. Position. Syst. 2008, 7, 1–8. [Google Scholar]
  64. Kalafus, R.M.; Chin, G.Y. Measures of Accuracy in the Navstar/GPS: 2drms Vs. CEP. In Proceedings of the 1986 National Technical Meeting of The Institute of Navigation, Long Beach, CA, USA, 21–23 January 1986; pp. 49–54. [Google Scholar]
  65. Artus, M.; Koch, C. State of the Art in Damage Information Modeling for RC Bridges—A Literature Review. Adv. Eng. Inform. 2020, 46, 101171. [Google Scholar] [CrossRef]
  66. Park, S.; Ryu, S.; Lim, J.; Lee, Y.-S. A Real-Time High-Speed Autonomous Driving Based on a Low-Cost RTK-GPS. J. Real Time Image Process. 2021, 18, 1321–1330. [Google Scholar] [CrossRef]
  67. Güney, D.; Acar, M.; Özlüdemir, M.T.; Çelik, R.N. Investigation of Post-Earthquake Displacements in Viaducts Using Geodetic and Finite Element Methods. Nat. Hazards Earth Syst. Sci. 2010, 10, 2579–2587. [Google Scholar] [CrossRef]
  68. Kopeć, A. Ground Displacement Caused by Natural Earthquakes, Determining Based on Differential Interferometry SAR and Multiple Aperture Interferometry Techniques. AIP Conf. Proc. 2020, 2209, 040006. [Google Scholar]
  69. Fobiri, G.; Musonda, I.; Muleya, F. Reality Capture in Construction Project Management: A Review of Opportunities and Challenges. Buildings 2022, 12, 1381. [Google Scholar] [CrossRef]
  70. Assaad, R.; El-Adaway, I.H. Bridge Infrastructure Asset Management System: Comparative Computational Machine Learning Approach for Evaluating and Predicting Deck Deterioration Conditions. J. Infrastruct. Syst. 2020, 26, 4020032. [Google Scholar] [CrossRef]
Figure 1. Manual procedures required in each of the main phases of road infrastructure inspections.
Buildings 15 01146 g001
Figure 2. Schematization of the bidirectional registration: (1) field-to-virtual data registration including the alignment of new images with open BIM models to enrich DT scenes contained in the DT platform; (2) virtual-to-field data registration including the high-accuracy alignment of BIM model holograms to seamlessly access the stored information during on-field activities.
Buildings 15 01146 g002
Figure 3. Architecture of the proposed system.
Buildings 15 01146 g003
Figure 4. Block diagram of the prototype RTK rover.
Buildings 15 01146 g004
Figure 5. In-house 3D printed prototype of the RTK receiver. The add-on is rigidly attached to the HoloLens 2 device for testing purposes.
Buildings 15 01146 g005
Figure 6. Navigation state chart.
Buildings 15 01146 g006
Figure 7. Hybrid GNSS-RTK and VIO automatic registration process.
Buildings 15 01146 g007
Figure 8. Parameters involved in the computation of the azimuth.
Buildings 15 01146 g008
Figure 9. Bearing uncertainty schematization.
Buildings 15 01146 g009
Figure 10. Trend of the alignment uncertainty as a function of the time window of the filter.
Buildings 15 01146 g010
Figure 11. Schematization of the simple pendulum model used.
Buildings 15 01146 g011
Figure 12. Extraction of the sinusoidal functions A ( t ) and B ( t ) by interpolating discrete position measurements (blue and green lines), respectively, from RTK and VIO measurements.
Buildings 15 01146 g012
Figure 13. Time difference between the two functions A ( t ) and B ( t ) showing a constant time offset T = 0.18   s between the RTK and VIO tracking systems.
Buildings 15 01146 g013
Figure 14. Image registration workflow.
Buildings 15 01146 g014
Figure 15. (a) Volto Santo viaduct context and top views in the DT platform. BIM model’s metadata are shown in the right window; (b) the inspection route is outlined in green in the top view.
Buildings 15 01146 g015
Figure 16. Stages of visual inspection of structural elements of the viaduct, including hidden bridge pier foundations: (a) visualization of the bridge from the open area; (b) visualization of the node between the bridge pier and the deck; (c) visualization of the foundation of the bridge pier; (d) visualization of the bridge abutment, its foundation, and the connection between the abutment and the deck.
Buildings 15 01146 g016aBuildings 15 01146 g016b
Figure 17. (a) Image automatically registered with the BIM model within a DT scene in the cloud platform; (b) transparency is applied for the visual evaluation of the alignment; (c) part of the image’s EXIF metadata related to its geographic 6-DoF pose (c).
Buildings 15 01146 g017
Table 1. Alignment uncertainties using different alignment distances.
D   ( m ) e   ( m ) e % α ( d e g ) a   ( m ) h % d g p s   ( m ) d   ( m )
3.000.041.33%0.760.020.80%3.008.00
3.000.041.33%0.760.0150.80%2.006.00
3.000.031.00%0.570.020.80%4.0020.00
3.000.031.00%0.570.0150.80%3.0015.00
3.000.020.67%0.380.020.80%6.00−30.00
3.000.020.67%0.380.0150.80%5.00−23.00
5.000.020.40%0.230.020.80%10.00−10.00
5.000.020.40%0.230.0150.80%8.00−8.00
3.000.010.33%0.190.020.80%12.00−9.00
3.000.010.33%0.190.0150.80%9.00−6.00
5.000.010.20%0.110.020.80%20.00−7.00
5.000.010.20%0.110.0150.80%15.00−5.00
Table 2. Data extracted from the application record. Only a few significant measurements are shown for conciseness.
RTK DataENU Coords. (m)Orientation w.r.t. North (Quaternions)
TimeLat (wgs84)Lon (wgs84)altMSLhAccxyzqwqxqyqz
11:50:40.46840.8691901514.25740723103.9442251−0.086391.59419−0.00975−0.98229−0.081680.15519−0.06601
11:50:41.51940.8691899514.25740724103.90212330−0.08888521.59303−0.0139342−0.98668−0.087620.117132−0.0712
11:50:42.48140.8691904014.25740673103.67882140−0.12674831.590430.0672287−0.99566−0.070390.02852−0.05378
11:51:47.51340.8691707514.25763883110.125515−8.9883995.804564−17.64563−0.39670.66831−0.04746−0.62749
11:51:48.54940.8691706114.25763865110.104114−9.0070085.803912−17.622540.81001−0.058090.5803420.060939
11:51:49.61640.8691704314.25763830110.05114−9.0116335.773602−17.590910.91234−0.078210.3559930.186499
11:52:55.56840.8691554814.25757002108.744114−7.6730614.313261−11.755470.94355−0.079550.3076770.09341
11:52:56.58340.8691545514.25756949108.682814−7.7652614.277766−11.702060.95806−0.120310.191060.176465
11:52:57.53340.8691550314.25756585108.599314−7.5722744.1696−11.404050.97855−0.102470.061820.16771
11:52:58.61740.8691573814.25755746108.7232899−7.3088294.013108−10.750150.86403−0.098610.4608260.17711
11:52:59.51740.8691578114.25754956108.48872530−7.0575933.886707−10.220610.96341−0.118220.1712010.169002
11:53:00.53240.8691592014.25753970108.32842134−6.9766243.655525−9.40127−0.967920.157540.022771−0.19442
11:54:24.54140.8691061914.25717587106.503614−0.05577242.65606121.712170.96567−0.031430.2382170.09872
11:54:25.50240.8691079114.25716441106.3261160.25839082.67860922.429150.97779−0.111980.0610380.166302
11:54:26.51940.8691061414.25715727106.2735140.33536662.77476923.08263−0.974130.114860.151111−0.12267
Table 3. Analysis of hAcc values during the inspection.
hAcc
N° of SamplesMean [mm]StDev [mm]Min [mm]Max [mm]
428927802057148154
Disclaimer/Publisher’s Note: The statements, opinions and data contained in all publications are solely those of the individual author(s) and contributor(s) and not of MDPI and/or the editor(s). MDPI and/or the editor(s) disclaim responsibility for any injury to people or property resulting from any ideas, methods, instructions or products referred to in the content.

